Submitted:
14 June 2025
Posted:
17 June 2025
You are already at the latest version
Abstract
Background: Poly(ADP-ribose) polymerase-1 (PARP-1) is a protein involved in multiple physiological processes. Elevated PARP-1 expression has been found in several tumors, being associated with stemness and tumorigenesis. Despite dysregulated PARP1 promoting the onset and progression of some kinds of tumors, its expression profile, prognostic value, and function in oral squamous cell carcinoma (OSCC) still remain unknown. Methods: Immunohistochemistry (IHC) was utilized to analyze the PARP1 expression profile in OSCC, and its prognostic value was evaluated. qRT-PCR and Western blot were used to compare the expression of PARP1 in OSCC cell lines. PARP1 expression was knocked down by lentiviral transduction, and functional experiments were conducted to investigate the impact of PARP1 on the proliferation and migration capabilities of OSCC cell lines. Gene set enrichment analysis (GSEA) of high-throughput transcriptome sequencing data was performed to explore potential mechanisms underlying PARP1's effect on OSCC invasion. Results: PARP1 was highly expressed in tumor cells (TCs), fibroblast-like cells (FLCs), and tumor infiltrating lymphocytes (TILs) in OSCC tissue. However, its expression was significantly upregulated in TCs (P < 0.05), particularly at the invasive tumor front compared to the tumor center (P < 0.05). Higher expression of PARP1 in TCs at the invasive tumor front was significantly associated with higher lymph node metastasis (P < 0.05), worse invasion pattern (P < 0.05), and more advanced T grade (P < 0.05). Additionally, higher expression of PARP1 in TCs at the invasive tumor front was also linked to higher recurrence rate (P < 0.05) and shorter disease-free survival (DFS) as well as relapse-free survival (RFS) (P < 0.05). PARP1 mRNA and protein were generally expressed in OSCC cell lines. Functionally, silencing PARP1 significantly inhibited the proliferation, migration, and invasive capabilities of OSCC tumor cells in vitro. Finally, RNA-seq GSEA revealed that PARP1 may promote OSCC progression through the Epithelial-Mesenchymal Transition (EMT) pathway. Conclusions: PARP1 expression at the invasive front is associated with poor prognosis and could be a potential prognostic biomarker for OSCC.
Keywords:
Poly (ADP-ribose) polymerase-1
; oral squamous cell carcinoma
; prognosis
; epithelialmesenchymal transition
1. Introduction
Head and neck squamous cell carcinoma (HNSCC), originating from the mucosal epithelium of the oral cavity, pharynx, and larynx, is the most common malignancy in the head and neck region and the sixth most common cancer type globally. Oral squamous cell carcinoma (OSCC) is its primary subtype, accounting for approximately 90% of oral and maxillofacial malignancies [1,2,3]. The etiology of HNSCC varies by region and country, typically involving exposure to tobacco-derived carcinogens, excessive alcohol consumption, or both [4]. According to global cancer statistics 2022, oral squamous cell carcinoma (OSCC) originating in the lip and oral cavity accounted for approximately 389,485 new cases and 120,726 deaths in 2022 [4].
Beyond early-stage oral cancer treated solely with surgery or radiotherapy, most OSCC cases require comprehensive treatment involving surgery combined with radiotherapy, chemotherapy, immunotherapy, or combinations thereof. Local recurrence, regional lymph node metastasis, and distant metastasis are the primary factors affecting patient prognosis. The current main treatments for metastatic OSCC patients are postoperative chemoradiotherapy or combined chemoradiotherapy [5]. Although surgery combined with chemoradiotherapy can control local lesions and improve patients' quality of life and survival, due to the high invasiveness and early lymph node metastasis characteristics of OSCC, approximately 40% of patients with locally advanced disease still experience distant metastasis after standard treatment. The 5-year survival rate remains around 60%, showing no significant improvement, posing severe challenges for clinical management [6].
Tumor heterogeneity is a crucial biological characteristic of malignant tumors, encompassing spatial heterogeneity, cellular heterogeneity, genetic heterogeneity, and functional heterogeneity. Tumor cells undergo continuous clonal evolution influenced by both external and internal environments, leading to tumor heterogeneity. This heterogeneity is closely associated with tumor progression and prognosis [7,8]. Tumor heterogeneity is a significant contributor to treatment resistance and prognostic variability. Therefore, an accurate assessment of tumor heterogeneity is essential for obtaining accurate diagnostic markers and effective treatment strategies. Clinical pathological parameters and molecular biomarkers are important indicators for auxiliary prognostic assessment. Focusing solely on tumor homogeneity while ignoring intratumoral heterogeneity may adversely affect the accuracy of prognostic evaluations. In our previous research, we have found that higher ITGB2 expression in CAFs correlates with poor clinical characteristics and outcomes of OSCC patients [9]. OSCC tumor heterogeneity manifests as gene expression differences between different cells within the same region and the same cell type across different spatial regions. This spatial distribution disparity can lead to functional differentiation of cells and impact patient prognosis, particularly evident in the tumor center and invasive front regions. Within the same tumor, different regions harbor molecular signatures promoting or inhibiting tumor progression simultaneously within the same cell type.
PARP1, a member of the poly(ADP-ribose) polymerase (PARP) protein family, is a DNA repair enzyme playing a vital role in DNA damage repair through ADP-ribosylation (PARylation) [10,11]. Recent studies have revealed the dynamic expression pattern of PARP1 during oral carcinogenesis, suggesting its potential role as a key influencer in malignant transformation. In healthy oral mucosa, PARP1 expression is strictly confined to the epithelial basal layer, primarily involved in DNA damage repair and homeostasis maintenance in stem cells (IHC positive area <5%). As tissue progresses to precancerous lesions (mild/moderate dysplasia), the PARP1 expression zone expands to the middle epithelial layer, with the positive area increasing to 15-30%, showing a significant positive correlation with the degree of cellular atypia (r=0.72, P<0.001). In severe dysplasia (carcinoma in situ) and invasive carcinoma, PARP1 exhibits full-thickness diffuse strong expression (positive area >60%), and its expression intensity closely correlates with tumor invasion depth (r=0.81, P<0.001) [12]. This gradient expression pattern indicates that abnormal activation of PARP1 may be a key molecule promoting benign-to-malignant transformation and driving the invasive phenotype.
Poly(ADP-ribose) polymerases (PARPs) have emerged as novel targets for cancer therapy. PARP inhibitors based on PARP1/2, including olaparib, rucaparib, niraparib, fluzoparib, pamiparib, and talazoparib, have been approved by the US Food and Drug Administration (FDA) and the European Medicines Agency (EMA) [13]. Numerous clinical trials indicate that PARP inhibitors are effective against BRCA-mutated ovarian and breast cancers, as well as prostate, pancreatic, and small cell lung cancers, showing high efficacy and reduced adverse reactions in cases with BRCA1/2 mutations [14,15,16]. PARP inhibitors have become an effective anti-tumor therapeutic approach, demonstrating promising prospects in preclinical HNSCC studies [17,18]. Clinical trials of PARP inhibitors alone or combined with other DNA damage-dependent therapies for HNSCC are ongoing. To reduce postoperative recurrence, induction therapy with olaparib prior to surgical resection was used, resulting in a reduction of Ki-67 by at least 25% in a subset of patients, indicating its potential as an effective treatment for HNSCC [17].
The expression differences of the PARP1 protein within different regions of OSCC tumors and their clinical significance remain unclear. To confirm the expression pattern of PARP1 in different cell types of OSCC tissues, reveal its role in the occurrence, development, and invasion of OSCC, and evaluate its diagnostic and prognostic value, it is necessary to explore the expression profile, prognostic significance, and functional role of PARP1 in OSCC.
Therefore, this study focuses on PARP1 as the research subject, investigates its expression pattern in different cell types within OSCC tissues, elucidates its biological role in OSCC, reveals the mechanism by which PARP1 regulates OSCC invasion and metastasis at the molecular level, identifies novel targets for OSCC invasion and metastasis, and explores the underlying molecular mechanisms, providing a theoretical basis for developing precise therapeutic strategies and drug development targeting PARP1.
2. Materials and Methods
2.1. Bioinformatics Analysis
TIMER (https://cistrome.shinyapps.io/timer/) is a user-friendly website for cancer researchers to evaluate the comprehensive correlation analysis between tumor-infiltrating immune cell markers and selected genes. We used TIMER to assess the difference in PARP1 expression between tumors and adjacent normal tissues.
2.2. Patients and Samples
All methodologies employed in this study received approval from the Ethics Committee of Nanjing Stomatology Hospital (2020NL-009(KS)) and are in accordance with the Declaration of Helsinki. Informed consent was obtained from all 87 patients enrolled between 2012 and 2020. Patients who provided OSCC tissue samples for this research were monitored over a period ranging from 11 to 60 months. Clinical data included age, gender, TNM stage, histological differentiation, worst pattern of invasion (WPOI), depth of invasion (DOI), perineural invasion, metastasis, recurrence, etc. Follow-up time was 5 years (up to January 2025). Tumor diagnosis was confirmed by postoperative routine pathology by two pathologists from our hospital. The inclusion and exclusion criteria of patients were the same as those of our previous studies [7]. Finally, 87 patients were enrolled.
2.3. Immunohistochemistry (IHC) and Quantification
Sections of formalin-fixed, paraffin-embedded tissues were deparaffinized with xylene and rehydrated through an ethanol series. Antigen retrieval was performed using 10 mM citrate buffer in a pressure cooker (92°C for 30 minutes). Endogenous peroxidase activity was blocked with 5% BSA, followed by incubation with the primary antibody against PARP1 (rabbit polyclonal antibody, A0942 (1:10,000), Abclonal, China) overnight at 4°C. The Polink-2 plus HRP Detection Kit was used as the secondary antibody, and sections were incubated at 37°C for 40 minutes. Finally, slides were developed in diaminobenzidine (DAB). Gene expression was evaluated according to stain intensity and the percentage of positive cells. The staining intensity was evaluated using the following scoring system: 0 for negative; 1 for weak; 2 for moderate; and 3 for high intensity. The positive percentage was assessed as follows: 0 indicating no positive staining; 1 representing between 1% and 25% of cells; 2 denoting between 26% and 50% of cells; 3 corresponding to between 51% and 75% of cells; and finally, a score of 4 signifying more than 75% of cells exhibiting positivity. The final score was derived by multiplying the two individual scores. All evaluations were performed by two pathologists who were blinded to the patients' clinical characteristics or outcomes. PARP1 expression was classified as "low" if it fell below the average value, while it was deemed "high" if it met or exceeded the average.
2.4. Cell Culture
The human OSCC cell lines CAL-33, CAL-27, HSC-3, SCC-9, OSCC-3 and immortalized human oral keratinocyte (HOK) were maintained in Dulbecco's Modified Eagle Medium (DMEM) supplemented with 10% fetal bovine serum and 1% penicillin-streptomycin. All cell lines were authenticated using Short Tandem Repeat (STR) analysis and cultured at 37 °C in a standard humidified atmosphere of 5% CO2.
2.5. Construction of Stable shPARP1 Cell Lines
PARP1 shRNA sequences:
shPARP1#1: 5’-CGACCTGGATCTGGAACATCAA-3’
shPARP1#2: 5’-GCAGCTTCAATAACCGAGAGATT-3’
Cells were seeded at 1×10^6 cells per well in 6-well plates under a cell culture hood. After cell attachment, when confluence reached approximately 80%, lentiviruses were diluted in DMEM without FBS to achieve a Multiplicity of Infection (MOI) of 10, and 5 μg/mL polybrene was added to each well. Stable PARP1 knockdown cell lines were generated using recombinant lentivirus. To identify stable PARP1 knockdown cells, transfected cells were cultured with 2 μg/mL puromycin for 7 days. Green fluorescence at 488 nm excitation under a fluorescence microscope indicated successful lentiviral-GFP transduction. Transfection efficiency was confirmed by PCR and Western blot.
2.6. RNA Extraction and Real-Time PCR Analysis
RNA was obtained using Trizol reagent following the manufacturer's procedure. RNA concentration and purity were determined by measuring absorbance at 260 and 280 nm using a NanoDrop One (Thermo Fisher Scientific, Waltham, MA, USA). Total RNA was reversed into cDNA using HiScript III RT SuperMix (Vazyme Biotech Co., Ltd., Nanjing, China). The relative expression of genes was determined via AceQ® qPCR SYBR® Green Master Mix (Vazyme Biotech Co., Ltd., Nanjing, China).
Primer sequences used were as follows:
Human PARP1: Forward 5’-AGGGCAAGCACAGTGTCAAA-3’, Reverse 5’-TACCCATCAGCAACTTAGCG-3’
Human GAPDH: Forward 5’-GGAGCGAGATCCCTCCAAAAT-3’, Reverse 5’-GGCTGTTGTCATACTTCTCATGG-3’
All primer sequences were purchased from Invitrogen (USA). Gene expression was normalized to GAPDH and calculated using the 2−ΔΔCT method.
2.7. Western Blot
After cells in six-well plates reached a confluency of 80% to 90%, cell lysates acquired by scraping the cultured cells were lysed in Radio-Immunoprecipitation Assay (RIPA) lysis buffer with a mixture of protease and phosphatase inhibitors on ice. Equal quantities of proteins were resolved via sodium dodecyl sulfate polyacrylamide gel electrophoresis (SDS-PAGE) and subsequently blocked with 3% bovine serum albumin (BSA) for one hour at room temperature. After incubation overnight with primary antibody at 4 °C with gentle shaking, followed by incubation with horseradish peroxidase (HRP) conjugated secondary antibody for 1 h, the protein bands were visualized using the Tanon-5200 Chemiluminescent Imaging System (Tanon5200).
2.8. CCK8 Assay
The constructed stable-transformation cell lines and control cells were seeded in 96-well plates at an initial seeding density of 8000 cells per well. The proliferation rate was determined after 0, 24, 48, 72 and 96 h of incubation. It was calculated according to the following formula: [(As−Ab)/(Ac−Ab)] × 100%, where Ab is the absorbance of the blank wells, Ac is the absorbance of the control wells, and As is the absorbance of the test wells.
2.9. Wound Healing Assay
The stable-transformation cell lines and control cells were cultured in 6-well plates until achieving 100% confluence. Following an overnight starvation period with serum-free DMEM medium, the wounds were created using a micropipette tip, and the cells were subsequently washed to eliminate dislodged cells and debris. The same area of the wound was imaged at 0, 12, and 24 hours to assess cellular wound closure.
2.10. Cell Transwell Invasion Assay
After thawing Matrigel overnight at 4°C from -20°C, a Matrigel working solution was prepared by mixing serum-free medium and Matrigel at an 8:1 ratio and evenly coated onto the surface of the upper chamber of Transwell inserts, allowing it to solidify at room temperature. 100 μL of cell suspension containing 5×10^4 cells in serum-free high-glucose DMEM was added to the upper chamber (triplicate wells per sample). The lower chamber was filled with 100 μL of complete medium containing 10% fetal bovine serum. After incubation at 37°C for 24 hours, cells in the upper chamber were removed with a cotton swab. Cells on the lower surface were fixed with 10% formaldehyde for 30 minutes, washed with PBS, stained with 0.1% crystal violet for 10 minutes, air-dried after washing with PBS, and then photographed.
2.11. Statistical Analysis
Statistical analyses and graphical processing were conducted using GraphPad Prism software 8.0 and SPSS software (Version 22.0). Paired t-tests were used to compare PARP1 mRNA and protein expression between tumor tissues and adjacent normal tissues. Independent sample t-tests were used to analyze differences between two groups. Pearson's chi-square test was used to assess the correlation between PARP1 expression and clinicopathological characteristics of OSCC patients. The Mann-Whitney U test was further used to analyze whether increased PARP1 expression was associated with postoperative recurrence. Kaplan-Meier (KM) survival analysis and log-rank tests were used to evaluate the prognostic significance of PARP1 for overall survival (OS), metastasis-free survival (MFS), recurrence-free survival (RFS), and disease-free survival (DFS) in recruited patients. Univariate Cox proportional hazards regression models were first used to estimate risk factors for OSCC. Multivariate Cox models were then constructed to estimate the adjusted hazard ratio (HR) and 95% confidence interval (CI) for PARP1 expression. All analyses were two-sided, and P < 0.05 was considered statistically significant.
2.12. RNA-Seq
- After cell culture completion, PBS (prepared with nuclease-free water, room temperature) equal in volume to the medium was gently added. The plate was placed flat for 1 min to wash the cells. PBS was discarded, and the washing step was repeated once. After discarding PBS, TRIzol reagent was added, and cells were repeatedly pipetted until fully lysed and the solution was no longer viscous but transparent.
- After extracting total RNA from samples, mRNA was enriched. Enriched mRNA was reverse-transcribed to form double-stranded cDNA. Libraries were prepared using the TruSeq Stranded mRNA LT Sample Prep Kit (Illumina, USA) and sequenced on an Illumina platform according to the manufacturer's instructions. Genes showing a 2-fold change and P < 0.05 were identified as significantly differentially expressed.
- Differential Expression Analysis: DESeq2 (for samples with biological replicates) or edgeR (for samples without biological replicates) was used for differential expression analysis. Finally, related pathways (HALLMARK) were identified through enrichment analysis.
3. Results
3.1. Expression of PARP1
We first analyzed the differential expression of PARP1 between tumor and normal tissues using the TIMER database. Results revealed significantly higher PARP1 expression in HNSCC tumor tissues (n = 491) compared to normal tissues (n = 44) (P < 0.001; Figure 1a). To further validate PARP1 expression in OSCC, we examined 87 paired OSCC tissue samples. Representative IHC images of PARP1 in tumor and adjacent normal tissues are shown in Figure 1b. Quantitative analysis confirmed that PARP1 expression was significantly upregulated in OSCC tissues (P < 0.001; Figure 1c).
3.2. Spatial Distribution of PARP1 in OSCC
To investigate the spatial distribution of PARP1 in OSCC, IHC analysis was performed on 87 OSCC samples. PARP1 was widely expressed across the tumor microenvironment (TME), including tumor cells (TCs), fibroblast-like cells (FLCs), and tumor-infiltrating lymphocytes (TILs). Representative IHC staining of low and high PARP1 expression in TCs, FLCs, and TILs is presented in Figure 2a. PARP1 was ubiquitously expressed in all three cell types, with significantly higher levels in TCs (P < 0.05; Figure 2b). Moreover, spatial heterogeneity was observed: PARP1 expression was markedly elevated in TCs at the invasive tumor front compared to the tumor center (P < 0.05; Figure 2c, d).
3.3. Association Between PARP1 Expression and Clinicopathological Characteristics
We evaluated the diagnostic value of PARP1 expression in TCs, FLCs, and TILs by analyzing clinicopathological parameters (gender, age, smoking history, TNM stage, lymph node metastasis (LNM), differentiation, depth of invasion (DOI), and worst pattern of invasion(WPOI). High PARP1 expression in FLCs and TILs showed no significant correlation with clinicopathological features (all P > 0.05; Table 1 and Table 2). In contrast, high PARP1 expression in TCs was associated with advanced WPOI, higher TNM stage, and increased LNM risk (all P < 0.05; Table 3). No significant associations were found with gender, age, smoking, DOI, or differentiation (all P > 0.05).
Further spatial analysis of TCs revealed that high PARP1 expression at the invasive front correlated significantly with advanced TNM stage (P < 0.05), worse WPOI (P < 0.05), and higher LNM risk (P < 0.05) (Figure 3a–c; Table 4). Patients with high PARP1 expression in TCs at the invasive front also exhibited increased postoperative recurrence risk (Figure 3d), but no significant association with metastasis was observed (Figure 3e).
3.4. Prognostic Value of PARP1 Expression in Spatial Subregions.
Kaplan-Meier survival analysis demonstrated that high PARP1 expression in TCs at the invasive front predicted shorter overall survival (OS), recurrence-free survival (RFS), and disease-free survival (DFS) (all P < 0.05), while metastasis-free survival (MFS) showed no significant difference (P > 0.05). In the tumor center, high PARP1 expression only predicted worse OS and DFS (P < 0.05), with no impact on RFS or MFS (P > 0.05).
3.5. Prognostic Impact of PARP1 Expression and Clinicopathological Parameters
Univariate Cox regression confirmed that TNM stage, LNM, and high PARP1 expression in TCs at the invasive front significantly predicted OS, RFS, and DFS (all P < 0.05). Multivariate analysis indicated that PARP1 expression was not an independent prognostic factor, whereas LNM independently predicted OS (Table 5, Table 6, Table 7 and Table 8).
3.6. Knockdown of PARP1 Inhibits OSCC Proliferation and Migration
PARP1 mRNA and protein were broadly expressed in OSCC cell lines, with highest levels in HSC-3 cells (Figure 5a, b; HOK as control). Lentiviral knockdown of PARP1 in HSC-3 cells significantly reduced its expression (Figure 5c). Functional assays revealed that PARP1 knockdown suppressed cell proliferation (Figure 5f), migration, and invasion (Figure 5d, e).
3.7. PARP1 Promotes OSCC Invasion and Metastasis via EMT
RNA sequencing of PARP1-knockdown cells identified differentially expressed genes (Figure 6a, b). Hallmark pathway enrichment analysis highlighted epithelial-mesenchymal transition (EMT) as the most significantly enriched pathway (Figure 6c, d). Downregulation of mesenchymal markers (N-cadherin, Vimentin) after PARP1 knockdown (Figure 6e) further supported its role in driving EMT-mediated metastasis.
4. Discussion
PARP1, a nuclear enzyme primarily involved in base excision repair (BER) [19], regulates critical processes including inflammation, hypoxia response, DNA repair, and cell death [20,21,22]. At DNA damage sites, PARP1 stabilizes chromatin and recruits repair factors [23]. Dysregulated PARP1 activity disrupts cellular homeostasis, leading to PARP trapping and impaired DNA repair [22].
PARP1 is upregulated in multiple cancers [24,25] and is a promising therapeutic target. In breast cancer, >70% of primary tumors exhibit ≥2-fold PARP1 gene upregulation [26], correlating with protein overexpression. Hyperactivated PARP1 promotes a proinflammatory feedback loop via NF-κB, upregulating cytokines (e.g., TNFα, IL6) [27] that drive chronic inflammation and immune evasion.
Tumor heterogeneity—encompassing spatial, genetic, and functional dimensions—is crucial for understanding cancer progression and therapy resistance [28]. Spatial heterogeneity within the TME (e.g., tumor center vs. invasive front) contributes to divergent molecular profiles and clinical outcomes [29,30]. Biopsy sampling from different regions may yield conflicting results [31], underscoring the need for spatially resolved biomarker analysis.
While some studies suggest PARP1 acts as a tumor suppressor in OSCC [32], our data demonstrate its pro-tumorigenic role. High PARP1 expression correlated with aggressive clinicopathological features (advanced TNM, WPOI, LNM) and increased recurrence risk. In vitro, PARP1 knockdown inhibited proliferation, migration, and invasion. Mechanistically, PARP1 promotes EMT—a key process in metastasis [33,34]—as evidenced by EMT pathway enrichment and downregulation of mesenchymal markers upon PARP1 silencing.
In summary, PARP1 is a poor prognostic biomarker in OSCC and promotes recurrence by regulating EMT. Targeting PARP1 expression or activity may offer novel therapeutic strategies
References
- MIRANDA-FILHO A, BRAY F. Global patterns and trends in cancers of the lip, tongue and mouth [J]. Oral Oncol, 2020, 102: 104551.
- CHOW L Q M. Head and Neck Cancer [J]. N Engl J Med, 2020, 382(1): 60-72.
- SIEGEL R L, GIAQUINTO A N, JEMAL A. Cancer statistics, 2024 [J]. CA Cancer J Clin, 2024, 74(1): 12-49.
- JOHNSON D E, BURTNESS B, LEEMANS C R, et al. Head and neck squamous cell carcinoma [J]. Nat Rev Dis Primers, 2020, 6(1): 92.
- CAUDELL J J, GILLISON M L, MAGHAMI E, et al. NCCN Guidelines® Insights: Head and Neck Cancers, Version 1.2022 [J]. J Natl Compr Canc Netw, 2022, 20(3): 224-34.
- CHEN Y, ZHONG N N, CAO L M, et al. Surgical margins in head and neck squamous cell carcinoma: A narrative review [J]. Int J Surg, 2024, 110(6): 3680-700.
- NI Y H, DING L, ZHANG D Y, et al. Distinct expression patterns of Toll-like receptor 7 in tumour cells and fibroblast-like cells in oral squamous cell carcinoma [J]. Histopathology, 2015, 67(5): 730-9.
- SALTZ J, GUPTA R, HOU L, et al. Spatial Organization and Molecular Correlation of Tumor-Infiltrating Lymphocytes Using Deep Learning on Pathology Images [J]. Cell Rep, 2018, 23(1): 181-93.e7.
- ZHANG X, DONG Y, ZHAO M, et al. ITGB2-mediated metabolic switch in CAFs promotes OSCC proliferation by oxidation of NADH in mitochondrial oxidative phosphorylation system [J]. Theranostics, 2020, 10(26): 12044-59.
- SRIVASTAVA R, LODHI N. DNA Methylation Malleability and Dysregulation in Cancer Progression: Understanding the Role of PARP1 [J]. Biomolecules, 2022, 12(3).
- KUMAR V, KUMAR A, MIR K U I, et al. Pleiotropic role of PARP1: an overview [J]. 3 Biotech, 2022, 12(1): 3.
- KOSSATZ S, PIROVANO G, DEMéTRIO DE SOUZA FRANçA P, et al. Validation of the use of a fluorescent PARP1 inhibitor for the detection of oral, oropharyngeal and oesophageal epithelial cancers [J]. Nat Biomed Eng, 2020, 4(3): 272-85.
- SLADE D. PARP and PARG inhibitors in cancer treatment [J]. Genes Dev, 2020, 34(5-6): 360-94.
- RAY-COQUARD I, LEARY A, PIGNATA S, et al. Olaparib plus bevacizumab first-line maintenance in ovarian cancer: final overall survival results from the PAOLA-1/ENGOT-ov25 trial [J]. Ann Oncol, 2023, 34(8): 681-92.
- EIKESDAL H P, YNDESTAD S, ELZAWAHRY A, et al. Olaparib monotherapy as primary treatment in unselected triple negative breast cancer [J]. Ann Oncol, 2021, 32(2): 240-9.
- DROR C M, WYATT A W, CHI K N. Olaparib for the treatment of metastatic prostate cancer [J]. Future Oncol, 2021, 17(19): 2413-29.
- MOUTAFI M, KOLIOU G A, PAPAXOINIS G, et al. Phase II Window Study of Olaparib Alone or with Cisplatin or Durvalumab in Operable Head and Neck Cancer [J]. Cancer Res Commun, 2023, 3(8): 1514-23.
- HERNANDEZ A L, YOUNG C D, BIAN L, et al. PARP Inhibition Enhances Radiotherapy of SMAD4-Deficient Human Head and Neck Squamous Cell Carcinomas in Experimental Models [J]. Clin Cancer Res, 2020, 26(12): 3058-70.
- VYAS S, CHESARONE-CATALDO M, TODOROVA T, et al. A systematic analysis of the PARP protein family identifies new functions critical for cell physiology [J]. Nat Commun, 2013, 4: 2240.
- FERRARIS D V. Evolution of poly(ADP-ribose) polymerase-1 (PARP-1) inhibitors. From concept to clinic [J]. J Med Chem, 2010, 53(12): 4561-84.
- VAN BEEK L, MCCLAY É, PATEL S, et al. PARP Power: A Structural Perspective on PARP1, PARP2, and PARP3 in DNA Damage Repair and Nucleosome Remodelling [J]. Int J Mol Sci, 2021, 22(10).
- STEFFEN J D, MCCAULEY M M, PASCAL J M. Fluorescent sensors of PARP-1 structural dynamics and allosteric regulation in response to DNA damage [J]. Nucleic Acids Res, 2016, 44(20): 9771-83.
- DE SOUZA FRANçA P D, GURU N, KOSTOLANSKY A R, et al. PARP1: A Potential Molecular Marker to Identify Cancer During Colposcopy Procedures [J]. J Nucl Med, 2021, 62(7): 941-8.
- WANG L, LIANG C, LI F, et al. PARP1 in Carcinomas and PARP1 Inhibitors as Antineoplastic Drugs [J]. Int J Mol Sci, 2017, 18(10).
- BYERS L A, WANG J, NILSSON M B, et al. Proteomic profiling identifies dysregulated pathways in small cell lung cancer and novel therapeutic targets including PARP1 [J]. Cancer Discov, 2012, 2(9): 798-811.
- OSSOVSKAYA V, KOO I C, KALDJIAN E P, et al. Upregulation of Poly (ADP-Ribose) Polymerase-1 (PARP1) in Triple-Negative Breast Cancer and Other Primary Human Tumor Types [J]. Genes Cancer, 2010, 1(8): 812-21.
- DEMéNY M A, VIRáG L. The PARP Enzyme Family and the Hallmarks of Cancer Part 2: Hallmarks Related to Cancer Host Interactions [J]. Cancers (Basel), 2021, 13(9).
- LUGANO R, RAMACHANDRAN M, DIMBERG A. Tumor angiogenesis: causes, consequences, challenges and opportunities [J]. Cell Mol Life Sci, 2020, 77(9): 1745-70.
- JUNTTILA M R, DE SAUVAGE F J. Influence of tumour micro-environment heterogeneity on therapeutic response [J]. Nature, 2013, 501(7467): 346-54.
- BRISAM M, RAUTHE S, HARTMANN S, et al. Expression of MAGE-A1-A12 subgroups in the invasive tumor front and tumor center in oral squamous cell carcinoma [J]. Oncol Rep, 2016, 35(4): 1979-86.
- SEYSTAHL K, PAPACHRISTODOULOU A, BURGHARDT I, et al. Biological Role and Therapeutic Targeting of TGF-β(3) in Glioblastoma [J]. Mol Cancer Ther, 2017, 16(6): 1177-86.
- MA L, QIN N, WAN W, et al. TLR9 activation induces immunosuppression and tumorigenesis via PARP1/PD-L1 signaling pathway in oral squamous cell carcinoma [J]. Am J Physiol Cell Physiol, 2024, 326(2): C362-c81.
- CHEN Y, LIANG W, LIU K, et al. FOXD1 promotes EMT and cell stemness of oral squamous cell carcinoma by transcriptional activation of SNAI2 [J]. Cell Biosci, 2021, 11(1): 154.
- THIERY J P, ACLOQUE H, HUANG R Y, et al. Epithelial-mesenchymal transitions in development and disease [J]. Cell, 2009, 139(5): 871-90.
Figure 1.
The expression level of PARP1 in tumor and normal tissues of HNSCC and OSCC. (a) The PARP1 expression in different tumor types with or without normal tissues with TIMER. (b)Representative IHC images of PARP1 in adjacent normal tissues and tumor tissues were shown. (c) Graphical summary of PARP1 at adjacent normal tissues and tumor tissues, P = Wilcoxon test. ***, and **** indicate statistically significant differences with p values < 0.001, and <0.0001, respectively.
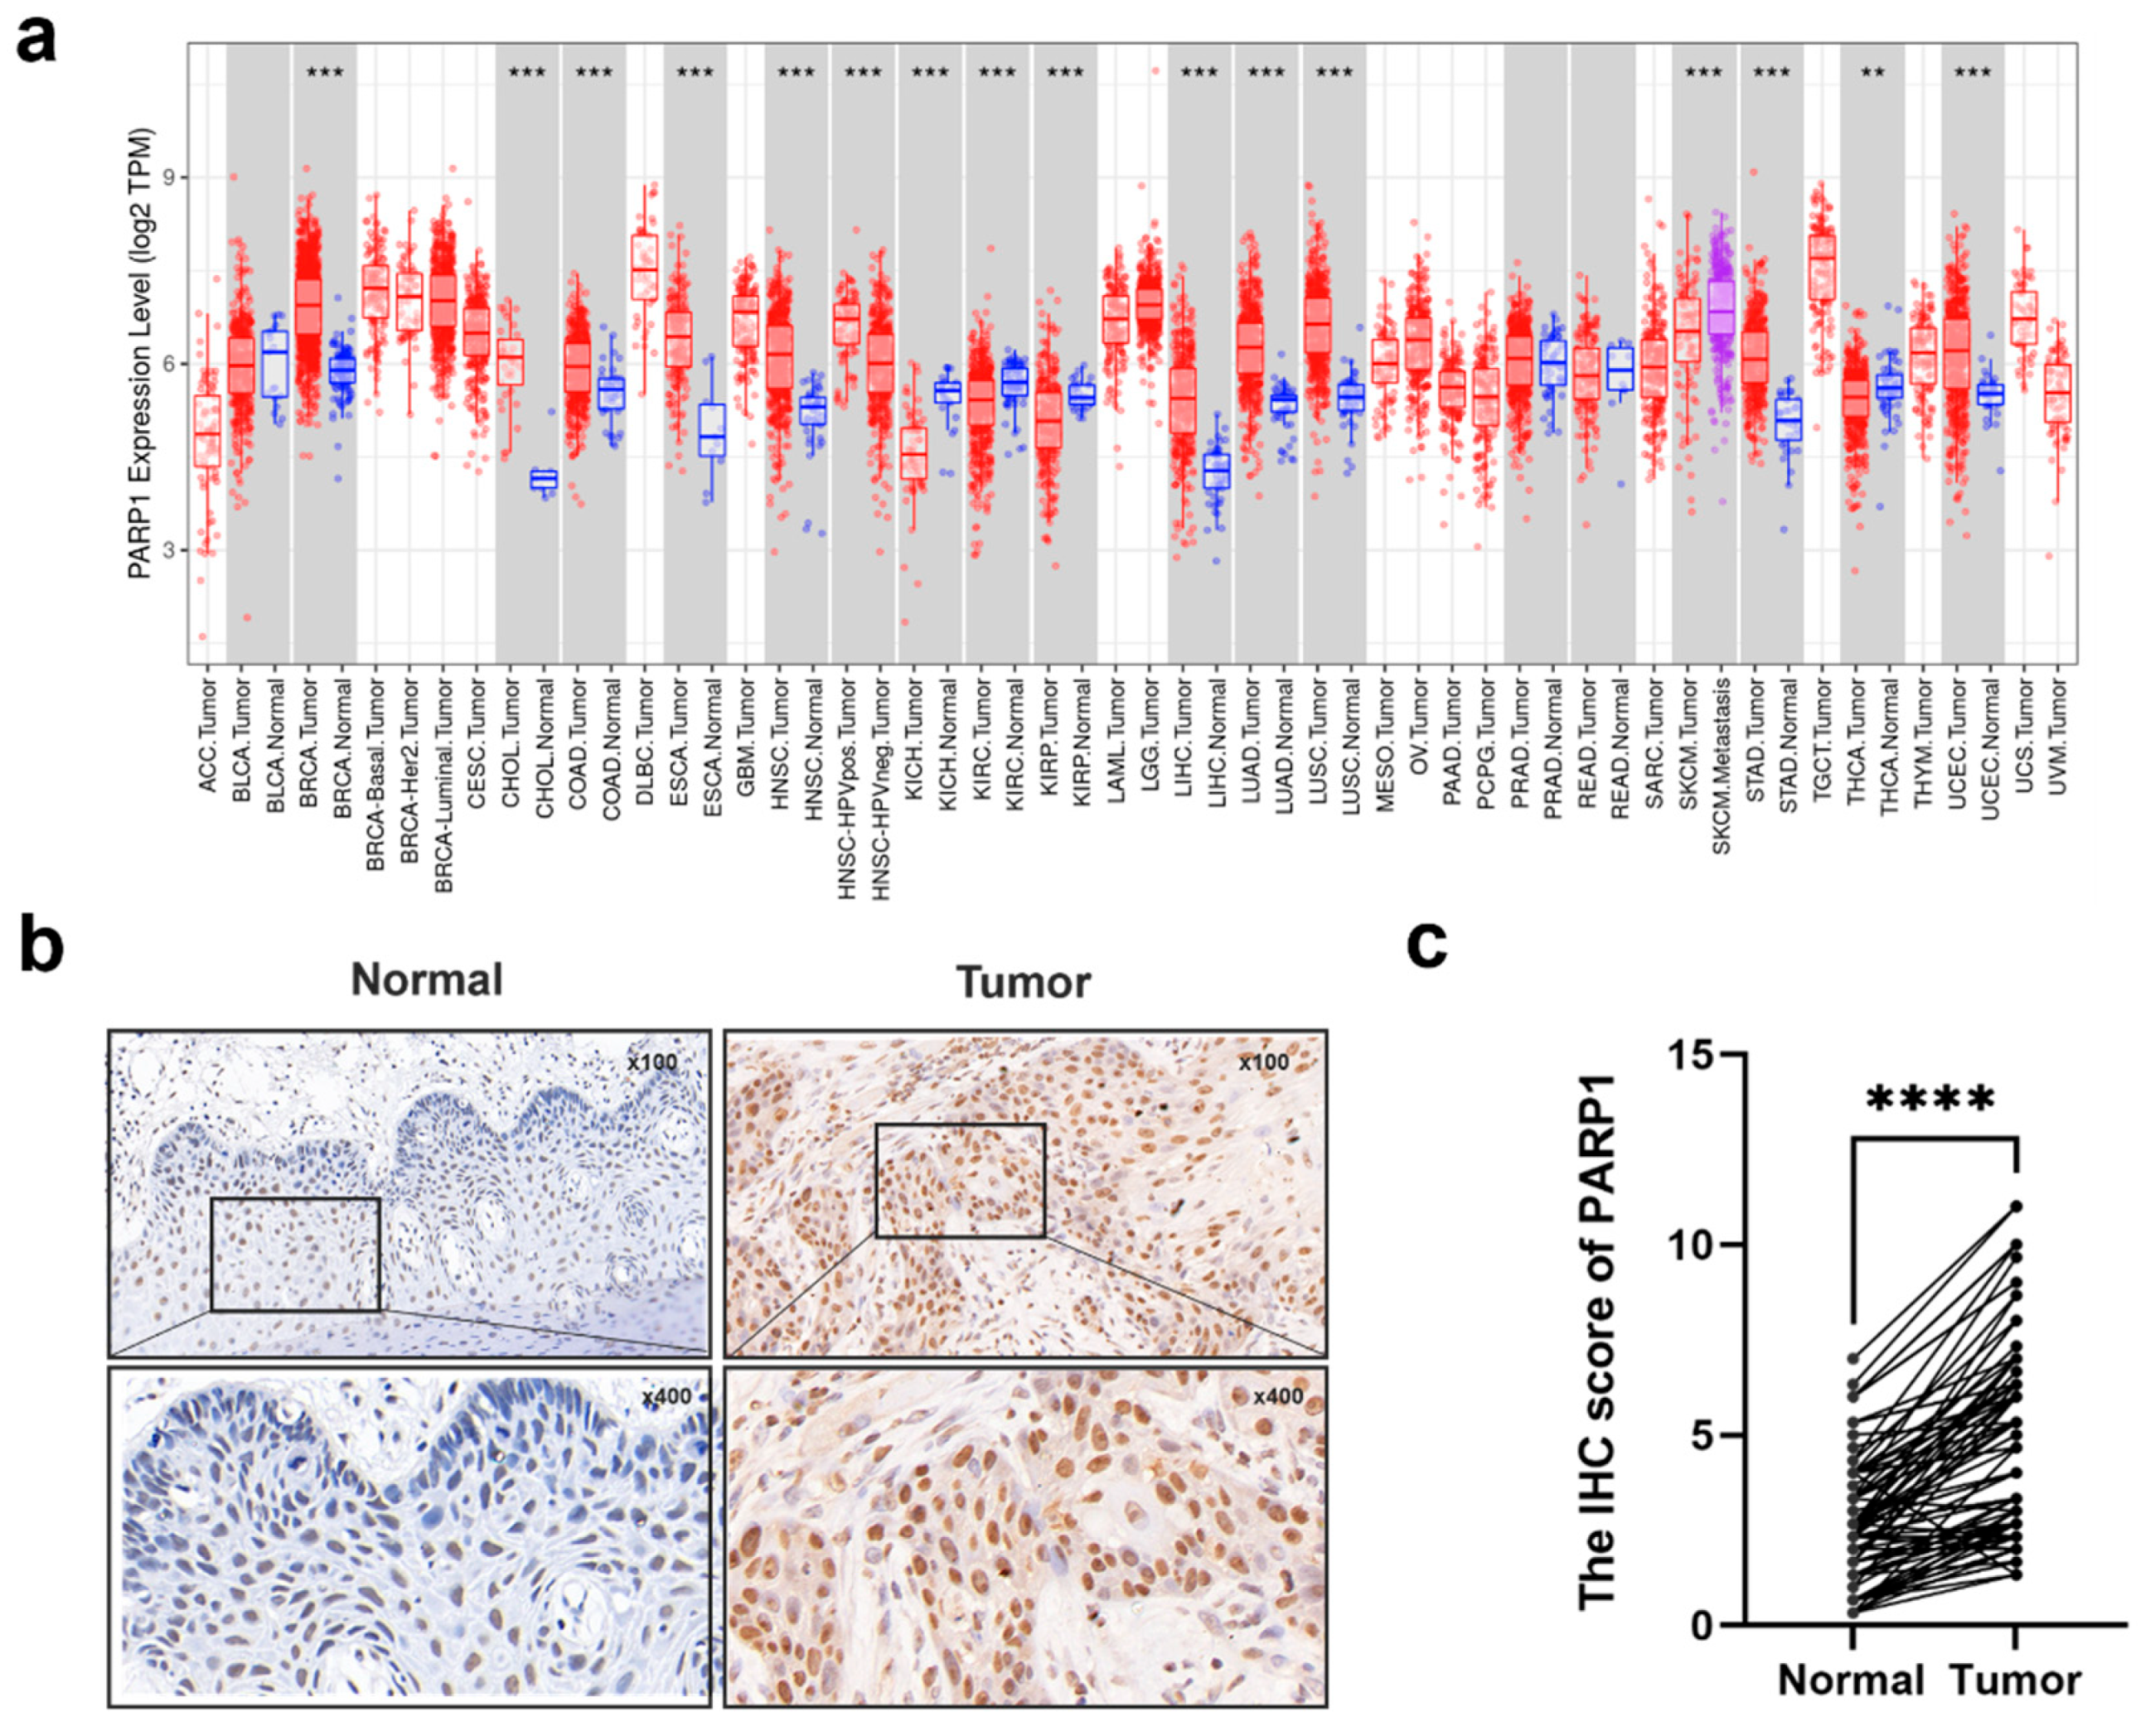
Figure 2.
Spatial expression of PARP1 in OSCC. (a) Typical IHC staining of PARP1 high and low expression in TCs, FLCs and TILs, n = 87. (b) The IHC score of PARP1 in TCs, FLCs and TILs from OSCC patients, n = 87. TCs, tumor cells; FLCs, fibroblast-like cells; TILs, tumor-infiltrating lymphocytes. (c) Representative IHC images of invasive tumor front and tumor center were shown. (d) Graphical summary of PARP1 in TCs at the invasive tumor front and in the tumor center from OSCC patients. *, and**indicate statistically significant differences with p values < 0.05 and <0.01,, respectively.
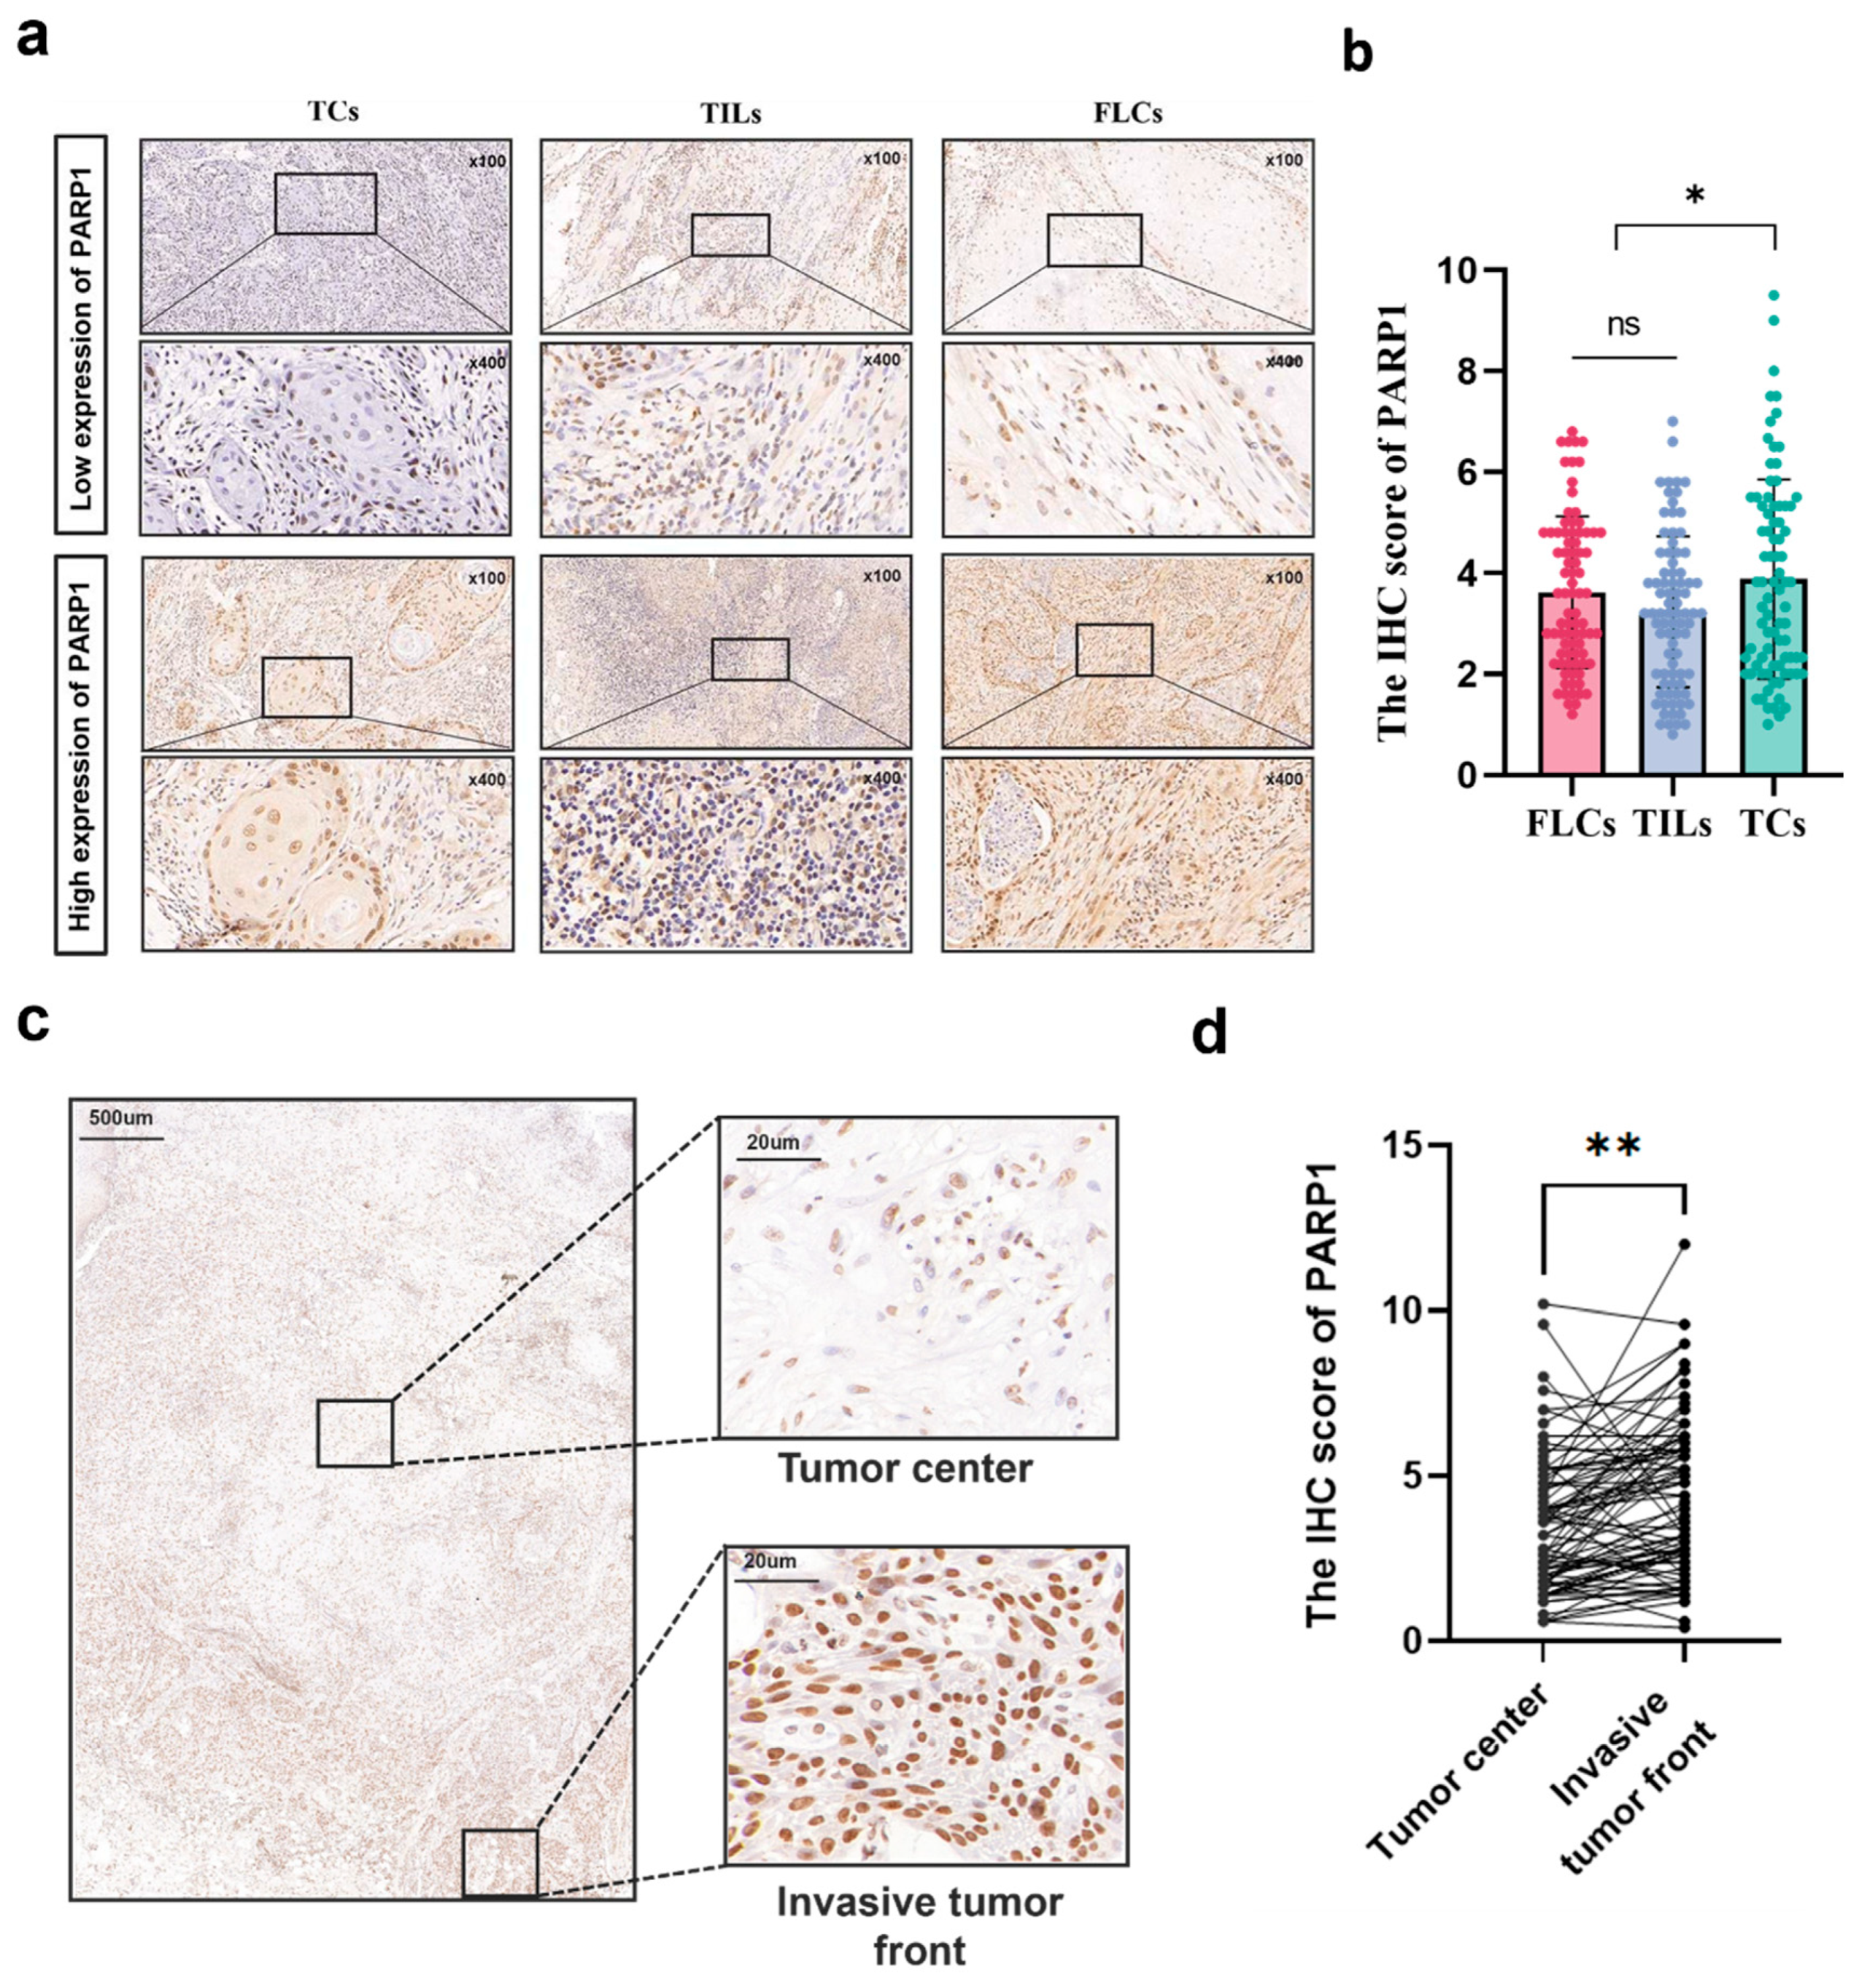
Figure 3.
Correlation between the expression of PARP1 and different clinical characteristics. (a-c) PARP1 expression in TCs at invasive tumor front correlated with (a) distinct WPOI, (b) various TNM stages, and (c) lymph node metastasis. (d-e) Correlation between PARP1 expression and the recurrence and metastasis status in TCs. *, and *** indicate statistically significant differences with p values <0.05, < 0.05, and <0.001, respectively.
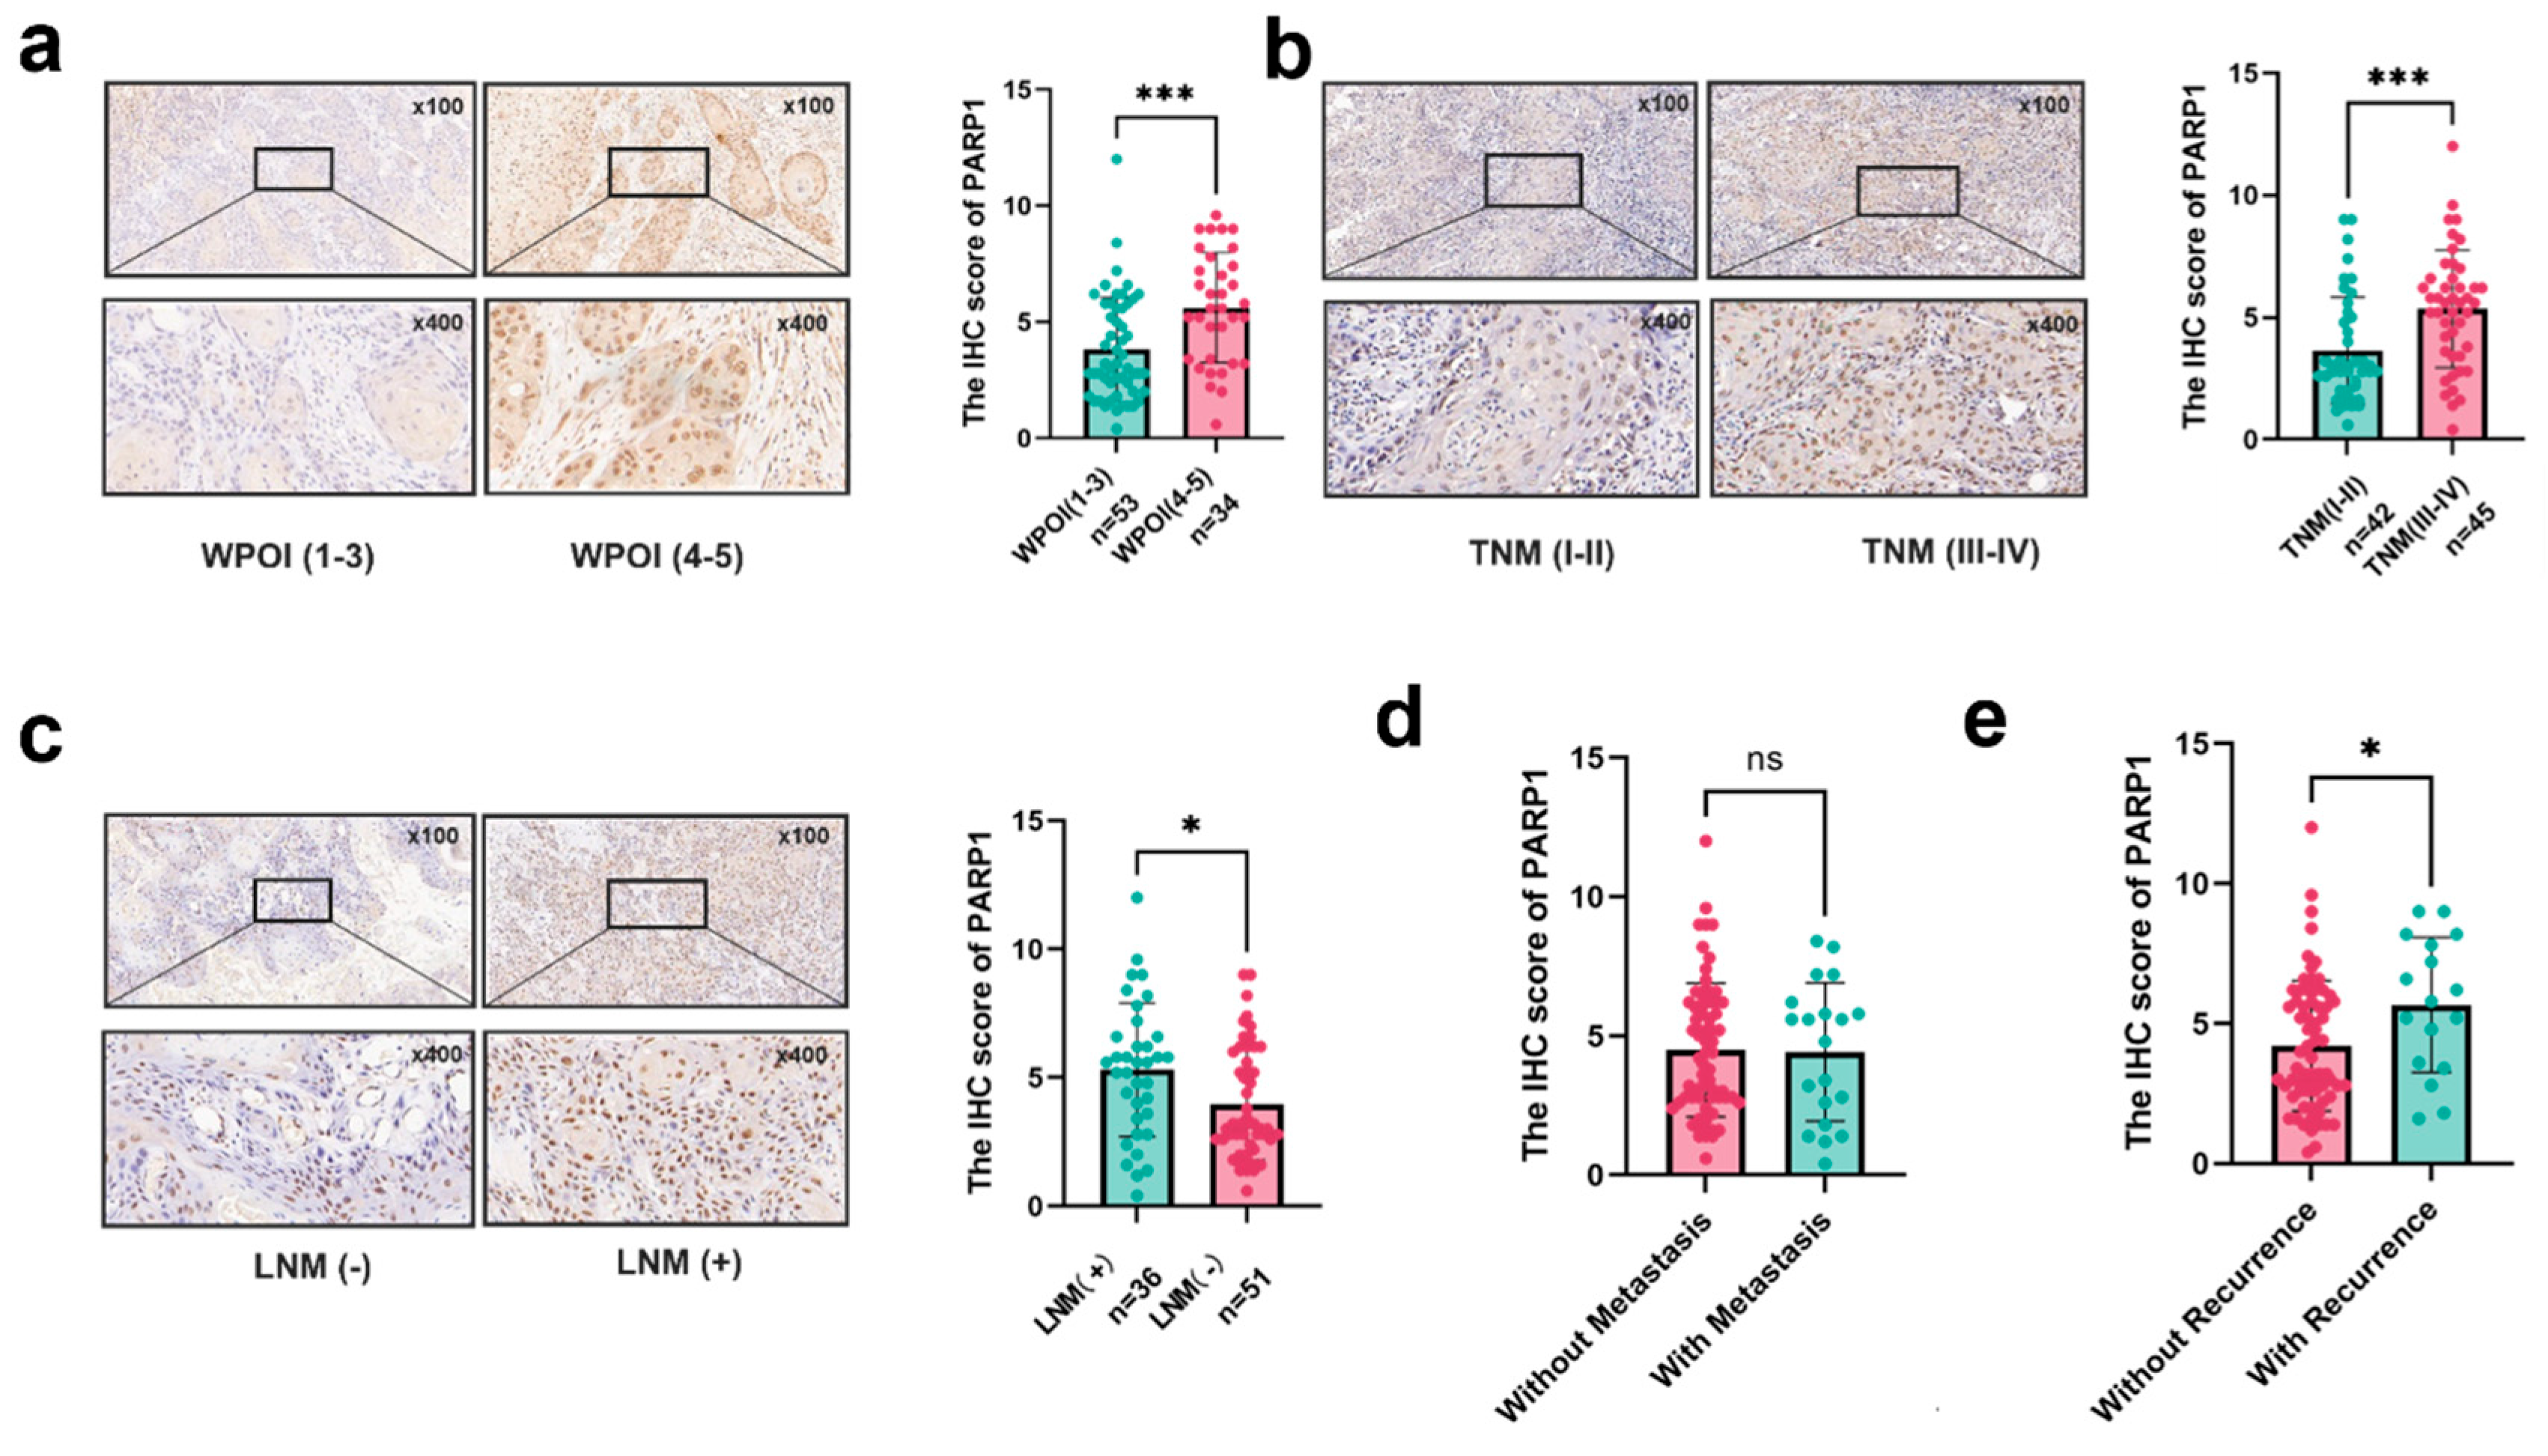
Figure 4.
Kaplan–Meier survival curves for RFS (a, e), OS (b, f), DFS (c, g) and MFS (d, h) of OSCC patients according to the expression of NELFE in TCs at the invasive tumor front and tumor center. OS, overall survival; RFS, recurrence-free survival; MFS, metastasis-free survival; DFS, disease-free survival.
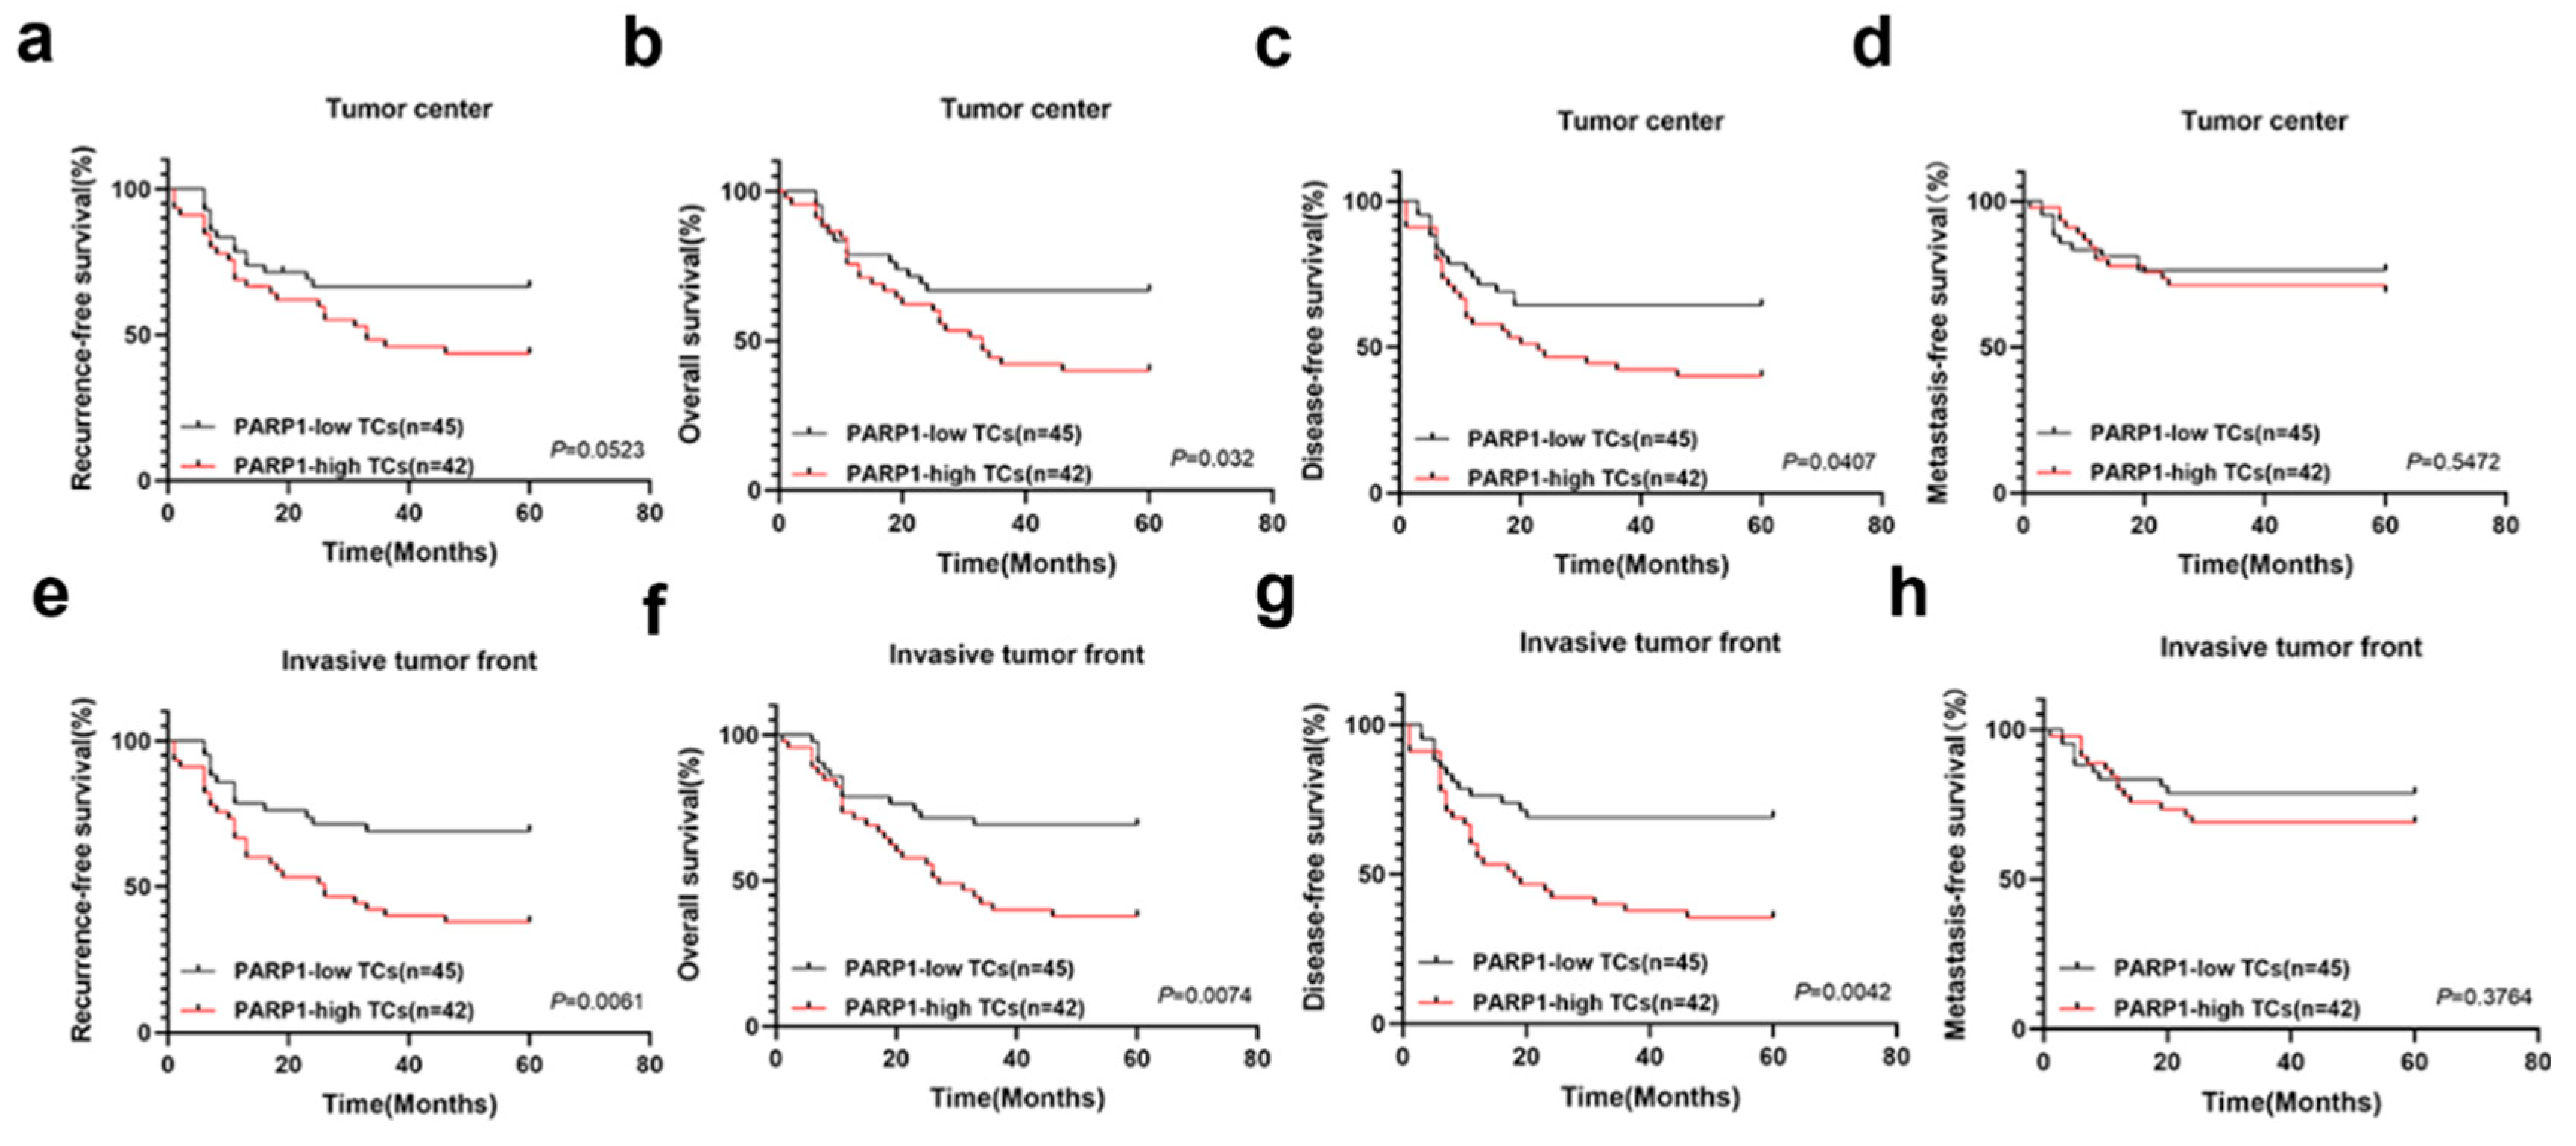
Figure 5.
PARP1 promoted the cell proliferation and migration of OSCC cells. (a, b) PARP1 mRNA and protein expression in five OSCC cell lines. (c) Knockdown expression of PARP1 in HSC3 cells, confirmed using qPCR and Western blot. (d, e, f) Knockdown expression of PARP1 significantly inhibited proliferation and migration ability. *, **, ***, **** indicate statistically significant differences with p values < 0.05, p <001, p < 0.001 and p < 0.0001, respectively.
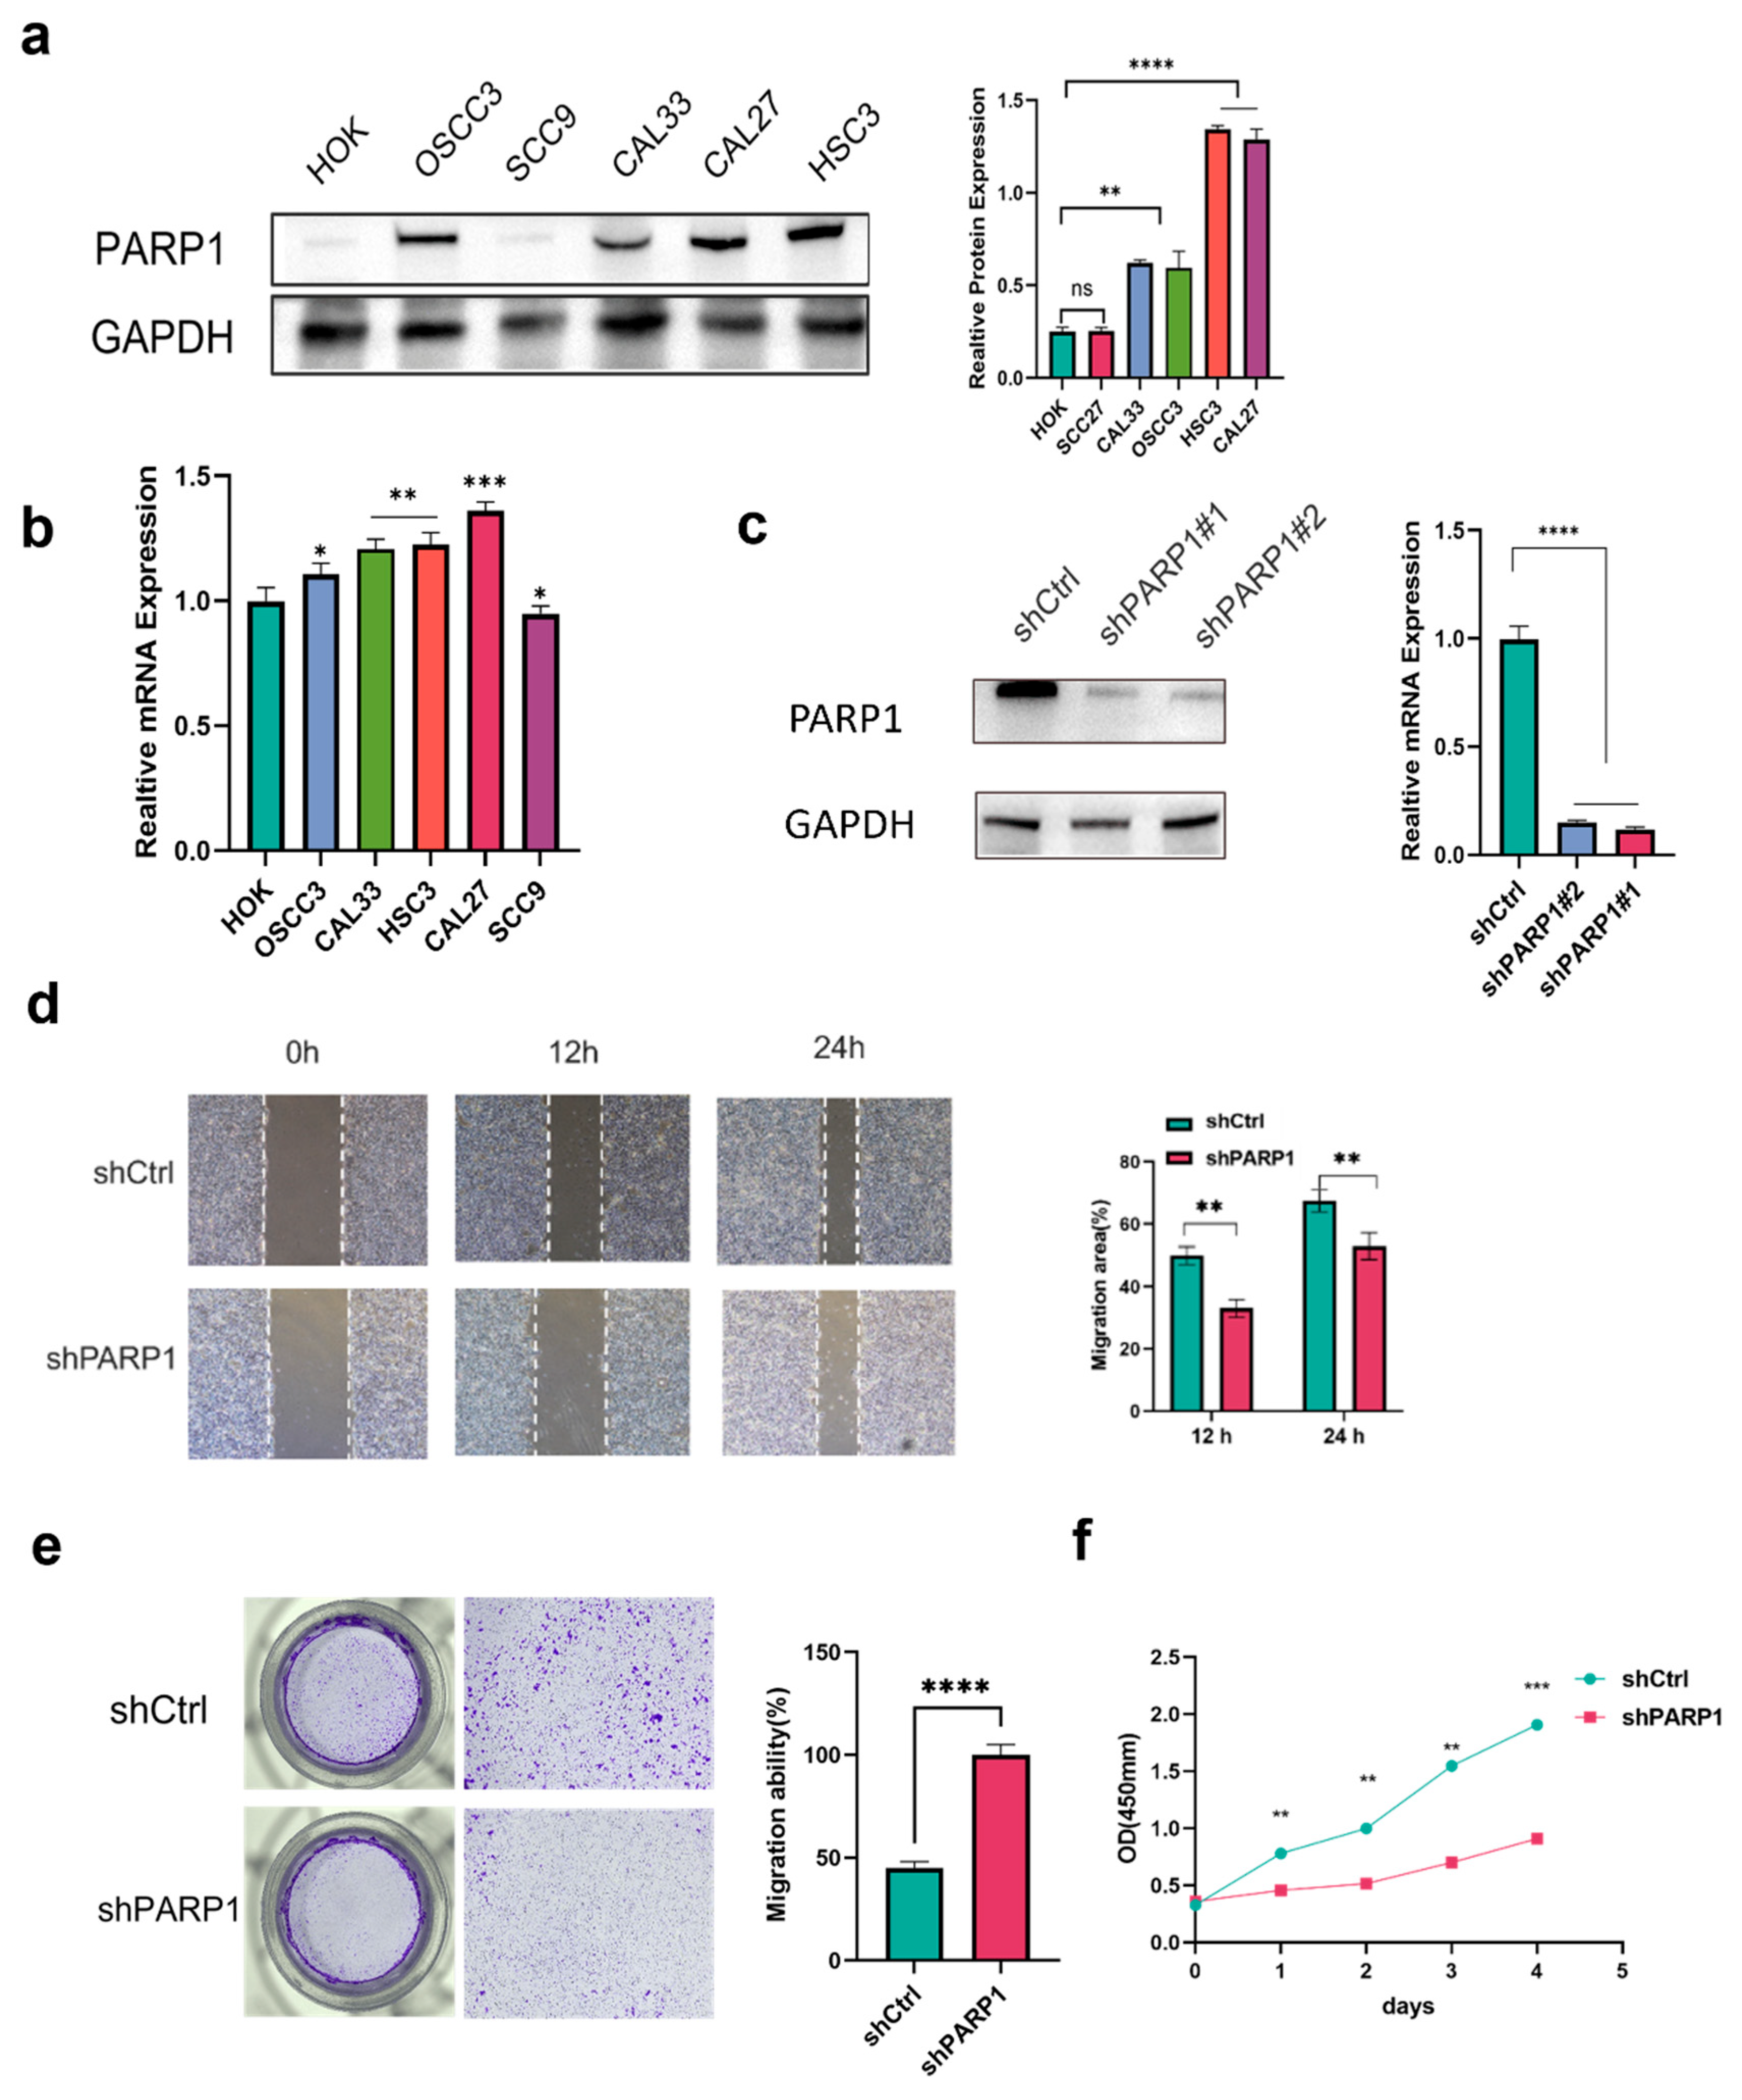
Figure 6.
(a, b) Differentially expressed genes (DEGs) between PARP1 knockdown groups and control groups in cells. (c) Bubble plot of Hallmark pathway enrichment analysis for RNA-seq differential genes. (d) GSEA plots of PARP1 in Hallmark gene sets. (e) Heatmap of EMT-related gene expression from RNA-seq differential genes.
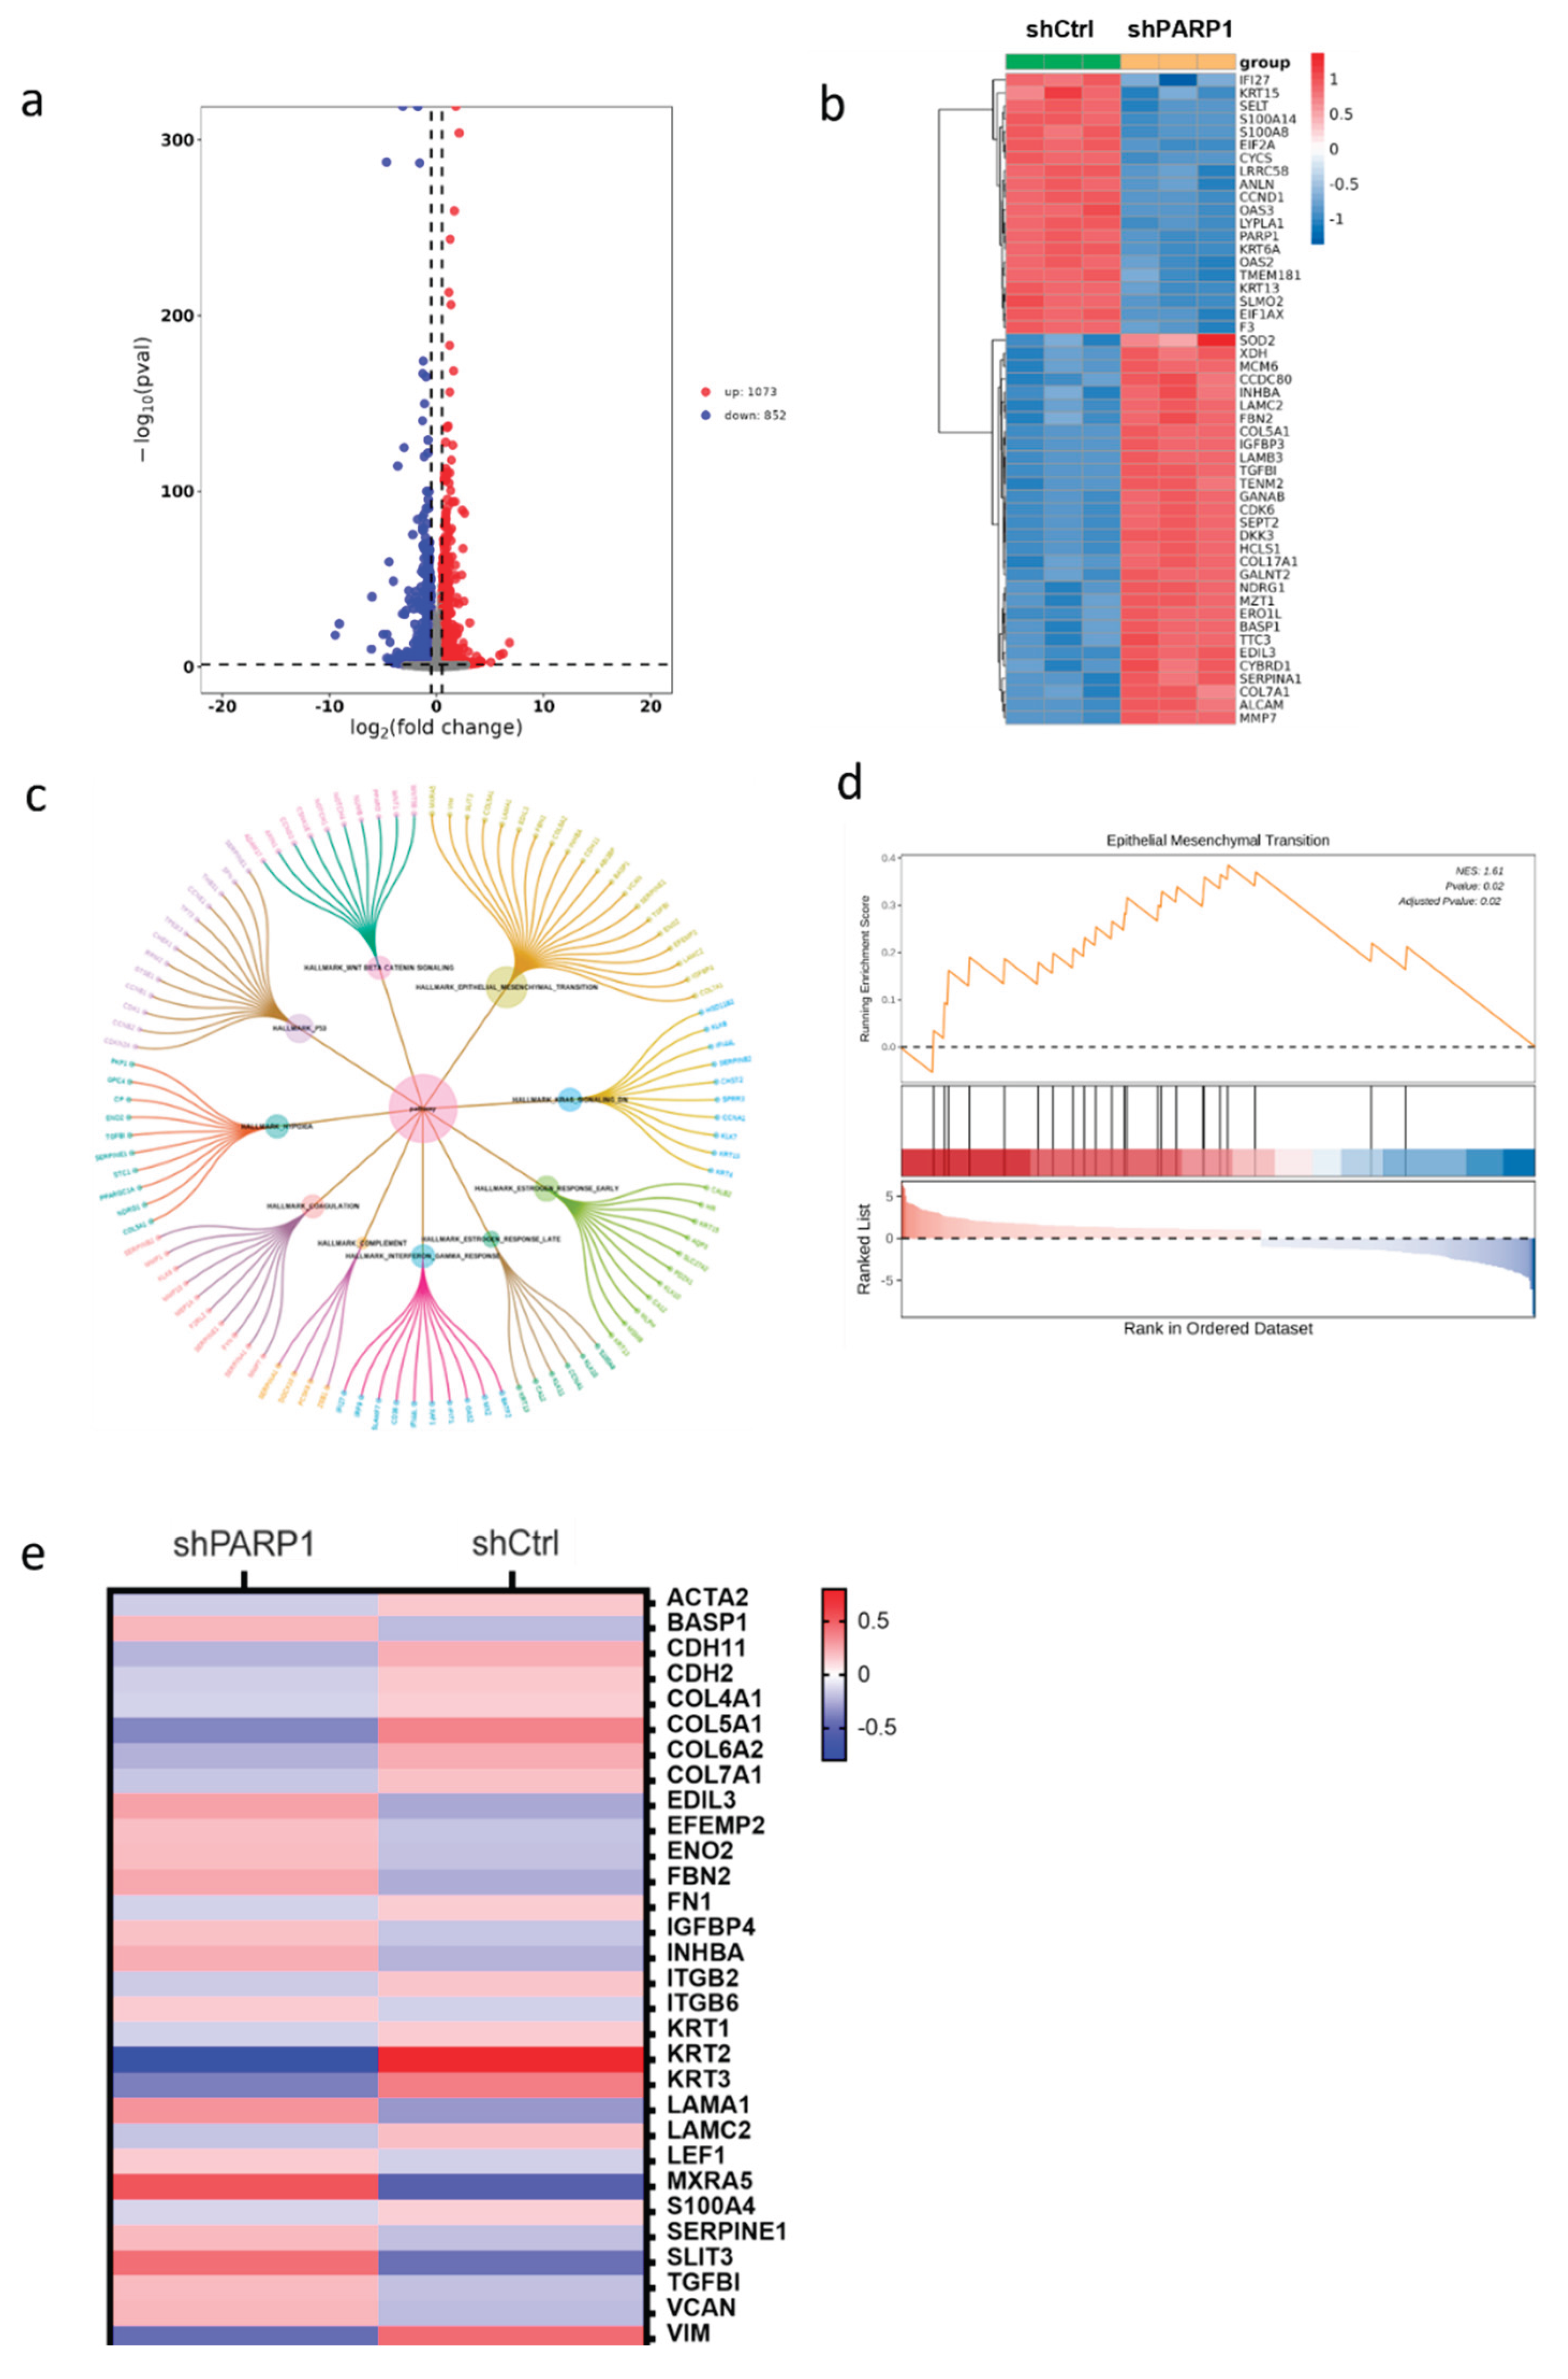

Table 1.
Association between clinicopathology of OSCC patients and PARP1 expression in FLCs.
| Characteristics | Total n |
PARP1 in FLCs | χ 2 | p Value | ||
|---|---|---|---|---|---|---|
| Low n | High n | |||||
| Age(years) | 2.286 | 0.132 | ||||
| <60 | 36 | 20 | 16 | |||
| ≥60 | 51 | 20 | 31 | |||
| Gender | 2.631 | 0.105 | ||||
| Male | 43 | 16 | 27 | |||
| Female | 44 | 24 | 20 | |||
| Smoking | 1.464 | 0.226 | ||||
| Yes | 32 | 12 | 20 | |||
| No | 55 | 28 | 27 | |||
| TNM | 1.341 | 0.247 | ||||
| I-II | 42 | 22 | 20 | |||
| III-V | 45 | 18 | 27 | |||
| LNM | 0.194 | 0.66 | ||||
| + | 36 | 16 | 21 | |||
| - | 51 | 24 | 26 | |||
| WPOI | 6.166 | 0.13 | ||||
| 1-3 | 53 | 30 | 23 | |||
| 4-5 | 34 | 10 | 24 | |||
| DOI | 0.364 | 0.546 | ||||
| <5mm | 34 | 17 | 17 | |||
| ≥5mm | 53 | 23 | 30 | |||
| Differentiation | 0.44 | 0.507 | ||||
| Well | 38 | 19 | 19 | |||
| Moderate to poor | 49 | 21 | 28 | |||
| Total | 87 | |||||
Table 2.
Association between clinicopathology of OSCC patients and PARP1 expression in TILs.
| Characteristics | Total n |
PARP1 in TILs | χ 2 | p Value | ||
|---|---|---|---|---|---|---|
| Low n | High n | |||||
| Age(years) | 1.429 | 0.232 | ||||
| <60 | 36 | 23 | 13 | |||
| ≥60 | 51 | 26 | 25 | |||
| Gender | 0.277 | 0.598 | ||||
| Male | 43 | 23 | 20 | |||
| Female | 44 | 26 | 18 | |||
| Smoking | 0.21 | 0.647 | ||||
| Yes | 32 | 17 | 15 | |||
| No | 55 | 32 | 23 | |||
| TNM | 0.338 | 0.561 | ||||
| I-II | 42 | 25 | 17 | |||
| III-V | 45 | 24 | 21 | |||
| LNM | 3.522 | 0.061 | ||||
| + | 36 | 16 | 20 | |||
| - | 51 | 33 | 18 | |||
| WPOI | 3.379 | 0.066 | ||||
| 1-3 | 53 | 34 | 19 | |||
| 4-5 | 34 | 15 | 19 | |||
| DOI | 0.672 | 0.412 | ||||
| <5mm | 34 | 21 | 13 | |||
| ≥5mm | 53 | 28 | 25 | |||
| Differentiation | 0.485 | 0.486 | ||||
| Well | 38 | 23 | 15 | |||
| Moderate to poor | 49 | 26 | 23 | |||
| Total | 87 | |||||
Table 3.
Association between clinicopathology of OSCC patients and PARP1 expression in TCs.
| Characteristics | Total n |
PARP1 in TILs | χ 2 | p Value | ||
|---|---|---|---|---|---|---|
| Low n | High n | |||||
| Age(years) | 0.61 | 0.435 | ||||
| <60 | 36 | 20 | 16 | |||
| ≥60 | 51 | 24 | 30 | |||
| Gender | 1.388 | 0.239 | ||||
| Male | 43 | 19 | 24 | |||
| Female | 44 | 25 | 19 | |||
| Smoking | 0.277 | 0.599 | ||||
| Yes | 32 | 15 | 17 | |||
| No | 55 | 29 | 26 | |||
| TNM | 14.127 | 0.001 | ||||
| I-II | 42 | 30 | 12 | |||
| III-V | 45 | 14 | 31 | |||
| LNM | 5.14 | 0.023 | ||||
| + | 36 | 13 | 23 | |||
| - | 51 | 31 | 20 | |||
| WPOI | 12.972 | 0.001 | ||||
| 1-3 | 53 | 35 | 18 | |||
| 4-5 | 34 | 9 | 25 | |||
| DOI | 2.796 | 0.095 | ||||
| <5mm | 34 | 21 | 13 | |||
| ≥5mm | 53 | 23 | 30 | |||
| Differentiation | 2.673 | 0.102 | ||||
| Well | 38 | 23 | 15 | |||
| Moderate to poor | 49 | 21 | 28 | |||
| Total | 87 | |||||
Table 4.
Association between clinicopathology of OSCC patients and PARP1 expression in TCs at the tumor center and invasion tumor front.
Table 4.
Association between clinicopathology of OSCC patients and PARP1 expression in TCs at the tumor center and invasion tumor front.
| Characteristics | Total n |
Tumor center | χ 2 | p Value | Invasion tumor front | χ 2 | p Value | |||
|---|---|---|---|---|---|---|---|---|---|---|
| Low n | High n | Low n | High n | |||||||
| Age(years) | 0.896 | 0.344 | 2.167 | 0.141 | ||||||
| <60 | 36 | 21 | 15 | 22 | 14 | |||||
| ≥60 | 51 | 24 | 27 | 23 | 28 | |||||
| Gender | 0.011 | 0.918 | 1.935 | 0.164 | ||||||
| Male | 43 | 22 | 21 | 19 | 24 | |||||
| Female | 44 | 23 | 21 | 26 | 18 | |||||
| Smoking | 0.04 | 0.842 | 0.477 | 0.49 | ||||||
| Yes | 32 | 17 | 15 | 15 | 17 | |||||
| No | 55 | 28 | 27 | 30 | 25 | |||||
| TNM | 6.673 | 0.01 | 12.626 | 0.001 | ||||||
| I-II | 42 | 28 | 14 | 30 | 12 | |||||
| III-V | 45 | 17 | 28 | 15 | 30 | |||||
| LNM | 4.052 | 0.44 | 5.995 | 0.014 | ||||||
| + | 36 | 14 | 22 | 13 | 23 | |||||
| - | 51 | 31 | 20 | 32 | 19 | |||||
| WPOI | 11.127 | 0.001 | 11.127 | 0.001 | ||||||
| 1-3 | 53 | 35 | 18 | 35 | 18 | |||||
| 4-5 | 34 | 10 | 24 | 10 | 24 | |||||
| DOI | 0.386 | 0.534 | 2.253 | 0.133 | ||||||
| <5mm | 34 | 19 | 15 | 21 | 13 | |||||
| ≥5mm | 53 | 26 | 27 | 24 | 29 | |||||
| Differentiation | 3.532 | 0.06 | 2.093 | 0.148 | ||||||
| Well | 38 | 24 | 14 | 23 | 15 | |||||
| Moderate to poor | 49 | 21 | 28 | 22 | 27 | |||||
| Total | 87 | |||||||||
Table 5.
Cox-regression analysis of OS in OSCC patients.
| Variables | Univariate Analysis | Multivariate Analysis | ||||
|---|---|---|---|---|---|---|
| HR | 95%CI | P value | HR | 95%CI | P value | |
| Gender | 0.915 | 0.496-1.690 | 0.777 | |||
| Age | 1.455 | 0.762-2.778 | 0.255 | |||
| Smoking | 1.473 | 0.794-2.732 | 0.219 | |||
| TNM stage | 2.276 | 1.191-4.349 | 0.013* | 1.063 | 0.445-2.625 | 0.863 |
| Differentiation | 0.809 | 0.438-1.493 | 0.498 | |||
| WPOI | 1.231 | 0.664-1.231 | 0.509 | |||
| Lymph node metastasis | 2.762 | 1.478-5.161 | 0.001* | 2.251 | 0.999-5.093 | 0.05* |
| DOI | 1.1 | 0.583-2.078 | 0.769 | |||
| PARP1 in TCs at ITF | 2.196 | 1.150-4.192 | 0.017* | 1.967 | 0.820-3.396 | 0.157 |
Table 6.
Cox-regression analysis of RFS in OSCC patients.
| Variables | Univariate Analysis | Multivariate Analysis | ||||
|---|---|---|---|---|---|---|
| HR | 95%CI | P | HR | 95%CI | P | |
| Gender | 1.025 | 0.559-1.877 | 0.937 | |||
| Age | 1.495 | 0.786-2.842 | 0.220 | |||
| Smoking | 1.714 | 0.933-3.151 | 0.083 | |||
| TNM stage | 2.248 | 1.181-4.279 | 0.014* | 1.012 | 0.423-2.419 | 0.979 |
| Differentiation | 0.847 | 0.462-1.553 | 0.592 | |||
| WPOI | 1.455 | 0.792-2.672 | 0.227 | |||
| Lymph node metastasis | 2.753 | 1.481-5.118 | 0.001* | 2.248 | 1.016-4.972 | 0.046* |
| DOI | 1.218 | 0.648-2.289 | 0.541 | |||
| PARP1 in TCs at ITF | 2.418 | 1.272-4.600 | 0.007* | 1.869 | 0.915-3.816 | 0.086 |
Table 7.
Cox-regression analysis of DFS in OSCC patients.
| Variables | Univariate Analysis | Multivariate Analysis | ||||
|---|---|---|---|---|---|---|
| HR | 95%CI | P | HR | 95%CI | P | |
| Gender | 1.007 | 0.550-1.845 | 0.982 | |||
| Age | 1.476 | 0.776-2.807 | 0.235 | |||
| Smoking | 1.707 | 0.929-3.136 | 0.085 | |||
| TNM stage | 2.285 | 1.200-4.348 | 0.012* | 1.081 | 0.449-2.603 | 0.863 |
| Differentiation | 0.860 | 0.469-1.576 | 0.626 | |||
| WPOI | 1.346 | 0.733-2.473 | 0.338 | |||
| Lymph node metastasis | 2.682 | 1.444-4.984 | 0.002* | 2.131 | 0.958-4.742 | 0.064 |
| DOI | 1.132 | 0.602-2.130 | 0.700 | |||
| PARP1 in TCs at ITF | 2.437 | 1.233-4.466 | 0.009* | 1.788 | 0.875-3.652 | 0.111 |
Table 8.
Cox-regression analysis of MFS in OSCC patients.
| Variables | Univariate Analysis | Multivariate Analysis | ||||
|---|---|---|---|---|---|---|
| HR | 95%CI | P | HR | 95%CI | P | |
| Gender | 1.382 | 0.582-3.280 | 0.464 | |||
| Age | 0.896 | 0.377-2.172 | 0.803 | |||
| Smoking | 1.679 | 0.713-3.954 | 0.236 | |||
| TNM stage | 3.459 | 1.266-9.450 | 0.015* | 2.141 | 0.569-8.058 | 0.260 |
| Differentiation | 1.046 | 0.441-2.482 | 0.919 | |||
| WPOI | 0.689 | 0.278-1.708 | 0.421 | |||
| Lymph node metastasis | 3.266 | 1.317-8.098 | 0.01* | 1.989 | 0.602-6.588 | 0.239 |
| DOI | 0.620 | 0.263-1.461 | 0.274 | |||
| PARP1 in TCs at ITF | 1.289 | 0.543-3.060 | 0.565 | |||
Disclaimer/Publisher’s Note: The statements, opinions and data contained in all publications are solely those of the individual author(s) and contributor(s) and not of MDPI and/or the editor(s). MDPI and/or the editor(s) disclaim responsibility for any injury to people or property resulting from any ideas, methods, instructions or products referred to in the content. |
© 2025 by the authors. Licensee MDPI, Basel, Switzerland. This article is an open access article distributed under the terms and conditions of the Creative Commons Attribution (CC BY) license (http://creativecommons.org/licenses/by/4.0/).
Copyright: This open access article is published under a Creative Commons CC BY 4.0 license, which permit the free download, distribution, and reuse, provided that the author and preprint are cited in any reuse.


