Submitted:
16 June 2025
Posted:
17 June 2025
You are already at the latest version
Abstract
Bi6Fe2Ti3O18 (BFTO) were synthesized via a solid-state reaction route using stoichiometric amounts of Bi₂O₃, TiO₂, and Fe₂O₃ powders. Thermal analysis of the powder mixture was conducted to optimize the heat treatment parameters. Energy-dispersive X-ray spectroscopy (EDS) confirmed the conservation of chemical composition following calcination. Final densification was achieved through hot pressing. The crystal structure of the sintered samples, examined via X-ray diffraction at room temperature, revealed a tetragonal symmetry for BFTO ceramics sintered at 850°C. Electron backscatter diffraction (EBSD) provided detailed insight into the crystallographic orientation and microstructure. Broadband dielectric spectroscopy (BBDS) was employed to investigate the dielectric response of BFTO ceramics over a frequency range of 10mHz to 10MHz and a temperature range of –30°C to +200°C. Impedance data obtained from BBDS measurements were validated using the Kramers–Kronig test and modeled using the Kohlrausch–Williams–Watts (KWW) function. The stretching parameter (β) ranged from ~0.72 to 0.82 in the impedance formalism within the temperature range from 200°C to 20°C.
Keywords:
Electron Backscatter Diffraction (EBSD)
; X-ray diffraction method
; dielectric spectroscopy
; layer-structured electroceramics
1. Introduction
Bismuth titanate (Bi4Ti3O12), a bismuth-layered structured ferroelectric material first discovered by B. Aurivillius [1], has found extensive use in electronics, particularly in capacitors, transducers, non-volatile memory devices, and high-temperature piezoelectric sensors. Enhancing its properties through modification with bismuth ferrite (BiFeO3) offers promising new functionalities. By combining these two compounds—each with distinct physical properties—novel materials with enhanced multifunctionality can be developed. As reported in previous (now classical) studies [2,3] materials in the Bi4Ti3O12–BiFeO3 system exhibit ferroelectric, semiconducting, and ferromagnetic behaviors, making them attractive candidates for next-generation information processing and storage technologies. These Bi-containing Aurivillius-type oxides typically adopt a layered perovskite-related structure and conform to a general formula: Bim+1Fem−3Ti3O3m+3. Their unique structure, composed of alternating bismuth oxide and perovskite-like layers, has garnered increasing interest in recent years.
Aurivillius [1] identified this family of oxides, characterized by alternating layers of (Bi2O2)2+ and (Am−1BmO3m−1)2− stacked along the pseudotetragonal c-axis. The A-site can accommodate mono-, di-, or trivalent ions, or their mixtures, while the B-site includes Ti4+, Nb5+, Mo6+, W6+, and Fe3+. In the perovskite blocks, B-site ions are surrounded by oxygen octahedra that form linear O–B–O chains, with A-site ions fitting into the framework created by the BO6 octahedra. These perovskite slabs consist of m octahedral layers, where m can be an integer or fractional value. Adjacent layers are offset by a0/√2 in the [110] direction (where a0 is the lattice constant of the ideal perovskite cell).
Structural symmetry imposes constraints on polarization behavior depending on m [4,5]. When m is even, polarization is confined to the a–b plane; however, with an odd number of layers, a component of polarization can develop along the c-axis, nearly perpendicular to the layering. This has significant implications for device applications, as fewer allowed directions for spontaneous polarization often result in lower remanent polarization in many film orientations. Nevertheless, Aurivillius-type bismuth-based titanium oxide (Bi4Ti3O12) remains of great interest for integrated circuit memory and high-temperature piezoelectric sensor applications, exhibiting excellent electrical and electro-optic properties [6]. The compositional and structural tunability of bismuth oxide layered perovskites —through ionic substitution and octahedral distortions—allows fine control over their electrical behavior [7]. Ferroelectricity in these structures is closely linked to distortions in the coordination polyhedra of one or more cations.
This study focuses on the promising Aurivillius-phase material Bi6Fe2Ti3O18 (BFTO), chosen for its high dielectric transition temperature (Curie temperature T=805°C) and its second-order magnetoelectric effect [8,9,10]. The aim is to synthesize BFTO ceramics via the mixed oxide method and conduct detailed structural and spectroscopic characterization. The compound fits the general formula Bim+1Fem−3Ti3O3m+3 with m=5, corresponding to five perovskite-like layers per slab. The main investigative tools employed were electron backscatter diffraction (EBSD) and broadband dielectric spectroscopy (BBDS) [11].
Due to their high structural flexibility and the ability to exhibit both electric dipole and magnetic ordering at room temperature, Aurivillius-phase materials are compelling candidates for single-phase, room-temperature multiferroics. Recent reviews [e.g., [12]] have explored the characteristics of these layered structures and advances in their synthesis, yet BFTO has received comparatively little attention. To our knowledge, no EBSD investigations of BFTO have been reported.
EBSD enables detailed analysis of crystalline orientation and structure. A stationary electron beam interacts with a tilted crystal sample, producing a diffraction pattern characteristic of the local crystal structure [13]. These patterns can reveal phase distributions, grain boundaries, and crystal quality. Proper sample preparation—particularly a deformation-free surface—is essential for obtaining high-quality EBSD patterns. By scanning the beam over a grid across a polycrystalline sample, orientation maps can be constructed, providing insight into grain morphology and texture. This enables a comprehensive, quantitative description of the material's microstructure.
2. Materials and Methods
Ceramic samples of Bi6Fe2Ti3O18 were synthesized via the conventional solid-state reaction method. Stoichiometric amounts of high-purity (99.9%, Aldrich Chemicals Co.) reagent-grade oxides—Bi2O3, Fe2O3, and TiO2—were accurately weighed and thoroughly mixed using an agate mortar and pestle to ensure homogeneous blending. The solid-state reaction proceeded according to the following reaction: 3Bi2O3+Fe2O3+3TiO2 → 2Bi6Fe2Ti3O18.
Thermal analysis of the powder mixture was conducted to optimize the heat treatment parameters. It was found from experimental data that layer-structured Aurivillius phases in the BFTO system appear at 600°C [19] and they form within the temperature range 650°C - 700°C [11].
The powder mixture was compacted into pellets at a uniaxial pressure of 300 MPa using a stainless steel die (10 mm in diameter), yielding disc-shaped green bodies approximately 10 mm in diameter and 1 mm thick. These compacts were placed in an alumina crucible and calcined in air at 750°C for 10 hours to promote the formation of the desired phase. Final densification was achieved via hot pressing at 850°C for 3 hours under a pressure of 20 MPa.
The crystalline structure of the sintered ceramics was analyzed at room temperature using X-ray diffraction (XRD) with a PANalytical X’Pert Pro diffractometer operating in θ–2θ geometry and employing Cu Kα radiation. Data were collected over a 2θ range of 8.0042°–89.9962° with a continuous scan and a step size of Δ2θ = 0.008°. Diffraction patterns were evaluated using the X’Pert HighScore Plus (PANalytical B.V.) [20]. and Match! (Crystal Impact) software packages [21,22]. Structural identification was supported by the latest entries from the COD/AMCSD [23], ICSD [24], and ICDD [25] crystallographic databases.
Microstructural and compositional analyses were carried out using a Thermo Scientific Apreo 2S field emission scanning electron microscope (SEM) equipped with EDAX Octane Elect energy-disspersive X-ray spectroscopy detector (EDS, EDAX, Ametek) on carbon coated surface. The sample was mechanically polished (finished with colloidal silica) to achieve a scratch- and deformation-free surface suitable for EBSD measurements.
Electron backscatter diffraction (EBSD) was employed to examine the microstructural and crystallographic orientation of the samples. In EBSD, a stationary electron beam interacts with a tilted crystalline surface, generating Kikuchi patterns that are characteristic of the local crystal structure and orientation. These patterns are used to determine grain orientation, differentiate between phases, assess grain boundaries, and evaluate local crystalline quality. EBSD measurements were performed using a Apreo 2S (Thermo Scientific) scanning electron microscope (SEM) equipped with an EDAX Velocity EBSD camera. Data were collected at an accelerating voltage of (15 kV) and a step size of (0.03 μm) using APEX EBSD software. The acquired EBSD data were processed using EDAX OIM Analysis™ software. providing advanced interpretation and visualization.
For dielectric measurements, the sintered BFTO ceramic discs were polished on both sides and coated with silver paste to form parallel-plate metal–insulator–metal (MIM) capacitor structures. Impedance spectroscopy (IS) measurements [17,26] were carried out over a frequency range from 100 mHz to 10 MHz and a temperature range from –120°C to +200°C. The measurements were conducted using the Alpha-A High Performance Frequency Analyzer (Novocontrol Technologies GmbH & Co. KG, Montabaur, Germany) coupled with a Quatro Cryosystem for precise temperature control. Prior to measurement, the system was cooled using liquid nitrogen. An AC perturbation voltage of 10 mV was applied, and impedance spectra were recorded during the heating cycle. To ensure thermal equilibrium, data were acquired 15 minutes after each target temperature was reached. The temperature increment between measurements was ΔT=5°C. The WinDATA software (Novocontrol) was used for data acquisition, visualization, and processing. To verify the reliability of the impedance data, the Kramers–Kronig test was applied using the B. Boukamp software [27]. This served as a consistency check between the real and imaginary components of the spectra.
Modeling of the experimental impedance data was conducted using both mathematical functions [15] and equivalent circuit models. A key objective was to achieve close agreement between measured and modeled data with a minimal number of fitting parameters, acknowledging that some parameters may lack direct physicochemical meaning. The analysis was performed in the complex impedance formalisms. Nyquist plots (complex impedance diagrams) were fitted using the circular fitting method, while the imaginary components of impedance were modeled using the modified Kohlrausch–Williams–Watts (KWW) function [28,29]. Furthermore, impedance behavior was interpreted using electrical equivalent circuits.
3. Results and Discussion
3.1. X-Ray Phase and Structural Analysis
The crystal structure of powdered ceramics of Bi6Fe2Ti3O18 composition were studied by X-ray diffraction method at room temperature. X-ray diffraction pattern is shown in Figure 1.
Line profile of X ray diffraction pattern was analysed with assumption of the Pseudo Voigt profile function. The following parameters of fitting were achieved: Rexpected = 4.44%; Rprofile= 3.25%, Rweighted profile = 4.20%, and GOF=0.947. It was found that average crystallite size was 150 Å and average crystallite (rms) strain was 0.1%.
The phase analysis showed that X-ray diffraction pattern of Bi6Fe2Ti3O18 ceramics contained, apart from the major (parent) Bi6Fe2Ti3O18 phase, diffraction peaks of bismuth-based layer-structured Aurivillius phases with the number of layers m in the slab other than m=5. The Aurivillius phases retrieved from the X-ray data bases exhibited the orthorhombic structure with space group numbers: 35, 36 and 42.
It Is worth noting that the parent structure for m=5 layers described by Aurivillius [30] was found to adopt the tetragonal structure (I4/mmm, Space Group No 139). Therefore, this structure was adopted to search for the unit cell. The following lattice parameters were obtained: a0=b0=3.8625Å, c0=49.585Å. The refined average crystallite size was 156Å and average crystallite (rms) strain was 0.41%. Parameters of the Rietveld refinement were as follows: Rexpected = 4.47%; Rprofile= 9.45%, Rweighted profile = 12.02%, and GOF=8.49.
3.2. EBSD Sudies of
Electron backscatter diffraction (EBSD), the primary tool for lattice orientation determinations, was utilized in the present studies to understand the complex microstructures in the Aurivillius type layer-structured bismuth titanium oxides. Data obtained in EBSD mapping were analyzed using EDAX OIM Analysis™ software and the results are shown in Figure 2, Figure 3, Figure 4 and Figure 5.
All the EBSD data analysis was performed using the EDAX OIM Analysis™.
Figure 2(a) presents an inverse pole figure map obtained using the electron backscatter diffraction (EBSD), which reveals crystallographic orientation in Aurivillius type layer-structured bismuth titanium oxides. The orientation of the grains is represented by a color-coded legend (as shown in Figure 2(c)), which corresponds to specific crystallographic directions according to the standard inverse pole figure key. The black regions, visible in the map, correspond to non-indexed areas, indicating voids within the microstructure (e.g. pores) or regions with insufficient diffraction data due to the surface quality or geometrical factors.
Figure 2(b) shows the orientation distribution with respect to the sample normal direction [001]. The presented distribution does not exhibit significant clustering, suggesting the absence of a strong preferred crystallographic orientation along this direction.
Further insight into the material texture is provided by the pole figures shown in Figure 3, which correspond to the {001} and {100} crystallographic planes. The color intensity represents the multiple of uniform distribution (m.u.d.), a quantitative measure indicating how much the observed orientation distribution deviates from a random texture. While there is some variation in intensity, the multiple of uniform distribution value is ~2.67, it indicates the presence of a weak texture.
Image quality (IQ) maps are a grayscale representation, where pixel intensities correspond to the quality of Kikuchi diffraction patterns. Bright regions indicate high quality patterns, usually obtained from well-crystallized and correctly prepared (well-polished and strain-free) surface, while darker regions suggest poor diffraction quality caused by strain occurrence, crystallographic disorder or porosity. Figure 4(a) presents IQ map for Bi6Fe2Ti3O18 ceramics. The grain boundaries are clearly visible and black regions, in this case, correspond to pores. The microstructure shows a relatively fine grains of polycrystalline ceramic material, some with elongated shape. It correlates with the grain size distribution plot (Figure 4(b)), where grain diameter is shown in relation to the number of grains. The peaks around the 0.3 to 0.4 µm indicate that most of the grains are about the size of this range. For sizes above 0.6 µm number of grains significantly decreases.
In order to complement the microstructural observations, SEM (scanning electron microscope) image of a bigger area was introduced as Figure 5(a). Observations were made using secondary electron (SE) mode in high vacuum mode. Presented image reveals a relatively high porosity of Bi6Fe2Ti3O18 material. Energy-dispersive X-ray spectroscopy (EDS) confirmed the chemical composition stability. The presence of the silicon in the spectrum can be explained by residues of silica in pores after the polishing process. The carbon presence is explained by sample’s surface coating.
3.3. Dielectric Spectroscopy Measurements of Ceramics
Impedance spectroscopy (IS) is a specific technique that can be considered a subset of Broadband dielectric spectroscopy (BBDS). While broadband dielectric spectroscopy covers a wide frequency range from 10−6 to 1012 Hz and includes various methods for studying the dielectric properties of materials [31], impedance spectroscopy specifically focuses on measuring the impedance of a material as a function of frequency [17,25].
Knowing the quality of the measured impedance data is essential for a proper analysis. The Kramers – Kronig (K-K) relations are very useful for data validation. The calculations necessary for performing the K-K test were accomplished with a computer program [26] according to the methodology described in scientific publications [e.g., [32]]. This confirmed the high quality of the experimental measurements performed, which fully justified the need for further mathematical analysis of the impedance data.
In an ideal case, the results of impedance spectroscopy measurements over a wide range of frequencies can be presented by semicircles in a complex Z”-Z’ plane (Nyquist plot). Each semicircle represents the contribution of a particular process (electrodes and contacts, grain boundaries, grains interior) to the total impedance of the sample.
Nyquist plots for Bi6Fe2Ti3O18 ceramics within the temperature range from – 30°C to +200°C are shown in Figure 6.
One can see from Figure 6 that the measured values of two components of complex impedance: resistance (real part, Z’) and reactance (imaginary part, Z”) presented in the form of Nyquist plots rarely take the shape of perfect semicircles (while the isotropic scale is preserved on both axes). They are often described as depressed or deformed semicircles, with their centre lying below the x-axis (Figure 6a,b). At low temperatures, the deviation from the semicircular shape is substantial (Figure 6c). This phenomenon, called non-Debye relaxation, is attributed to the distribution of Debye relaxations with different time constants.
The Debye response is given by:
where Zs and Z∞ stand for the static and high frequency limiting values of the impedance, respectively. Equation 1 can be generalized to obtain the Cole–Cole equation [33]:
which is identical to the Debye case when α=1 and broader the lower the exponent α is. The Cole-Cole equation mathematically expressed distribution of relaxations with different time constants.
Spectroscopic plots of the imaginary part of complex impedance (Z”) are depicted in Figure 7. This representation is characterized by a peak, signifying the presence of a dielectric relaxation in the sample. The observed peak provides insights into the dynamics and behaviour of the relaxation mechanism, allowing for a more detailed analysis of the dielectric response within the material.
Figure 7 shows the variation of imaginary part of impedance with angular frequency at different temperatures. The peaks are broader than the ideal Debye curve and asymmetric. As temperature increases, the peak frequency shifts to higher values. The asymmetric Z” plot is suggestive of stretched exponential character of relaxation times of the material.
A number of empirical relaxation functions have been used to describe imaginary part of general response function Z”(ω). Common for the functions mentioned above, is that they are characterized by power laws far away from intermediate frequencies around the peak frequency ωp . When viewed versus a logarithmic frequency scale as abscissa (like in Figure 7) the slopes at high and low frequency limits of Debye plot is 1 and -1 at low ω and at high ω, respectively. For the Cole–Cole equation the slopes are α and -α at low and high angular frequency, respectively.
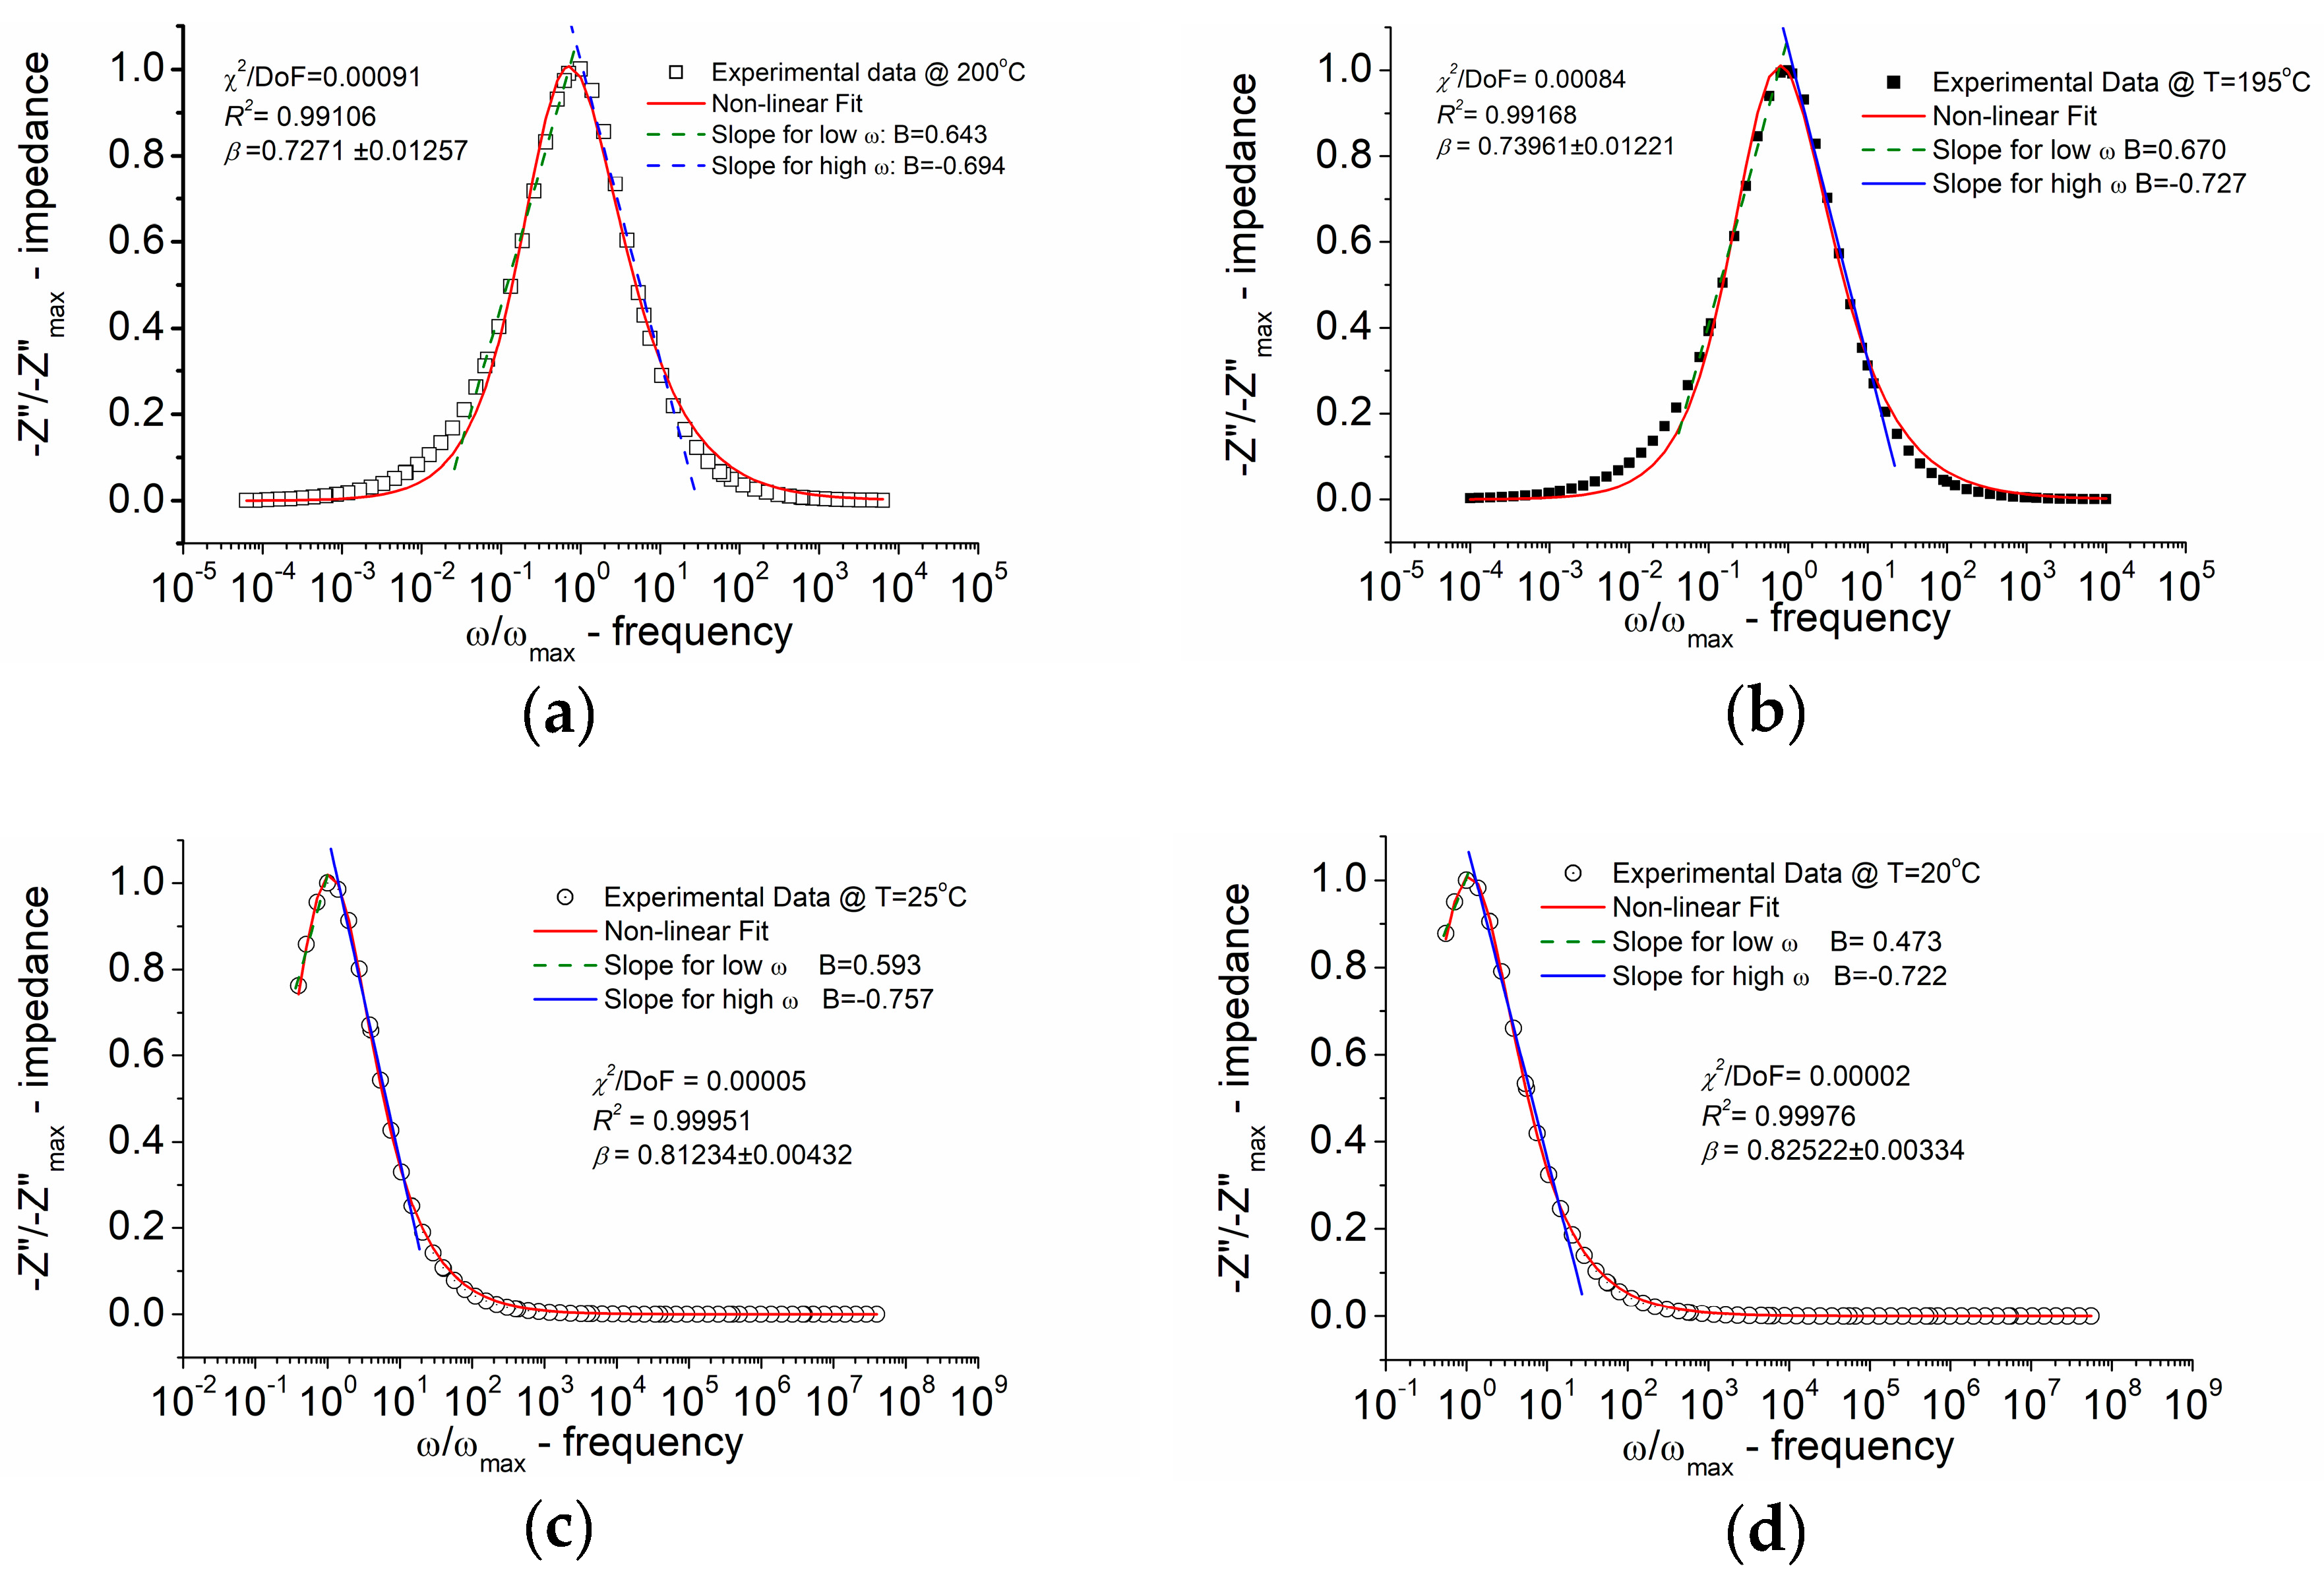
To model the behaviour of the imaginary component of the impedance the alternative equation for the susceptibility functions was used [15]. A three-parameter formula for relaxation in the frequency domain given by equation:
was applied to the analysis of the normalized amplitude (scaled) imaginary part of the impedance Z''/Z”max(ω). In Equation 3 Z” represents the current value of the imaginary part of the complex impedance, Z”max and ωmax define the height and position of the peak, and "b" is an internally independent shape parameter for high frequencies.
The KWW equation describing the relaxation function φ(t) [27,28] is expressed as follows:
where β is the stretching parameter, τ is the relaxation time, and f is a measure of the fraction of the experimental quantity being investigated (the amplitude parameter) that is relaxed via the α-relaxation.
The relationships providing a bridge between the parameters used in the analysis of the frequency domain representation (Equation 3) and the parameters characterizing the time-domain relaxation function (Equation 4) are given by:
where Γ is the gamma function [34]. These relationships facilitate the translation of findings between time and frequency domains, aiding in understanding of the relaxation behaviour within the material [35].
The outcomes of modelling the normalized (in amplitude) imaginary part of impedance (Z”/Z”max) with normalized frequency (ω/ωmax) for Bi6Fe2Ti3O18 ceramics at different temperatures, carried out according to the function exhibiting the skewed shape given by Equation 3 (modified KWW formula), are depicted in Figure 8.
The visual examination of Figure 8 reveals that the experimental data align well with the model. Quality factor R2 is 0.991-0.999.
5. Conclusions
By means of the mixed oxide method Bi6Fe2Ti3O18 (BFTO) compound was synthesized from stoichiometric amounts of Bi2O3, TiO2, and Fe2O3 powders. The heat treatment parameters were deduced from the thermal analysis. Uniaxial hot-pressing was utilized for final densification and sintering of BFTO ceramic. X-ray diffraction at room temperature, revealed a tetragonal symmetry (I4/mmm, Space Group No 139) for BFTO ceramics sintered at 850°C. The following lattice parameters were obtained: a0=b0=3.8625Å, c0=49.585Å. The refined average crystallite size was 156Å and average crystallite (rms) strain was 0.41%.
Electron backscatter diffraction provided detailed insight into the crystallographic orientation and microstructure. The orientation map showed a random distribution of grain orientations and also in the pole figure there was no significant clustering in the orientation distribution relative to the sample normal direction [001]. Pole figures for the {001} and {100} planes confirmed this observation, showing low value of intensity maxima. This proves the absence of a strong texturization. Microstructure observations (SEM) made on a relatively big area, showed the presence of porosity. Image quality maps revealed a fine-grained microstructure and black areas, which in this case, were the result of porosity. The EDS analysis confirmed the occurrence of the expected chemical composition. Carbon and silicon presence in the spectrum was an effect of preparation process – silica residues in pores after polishing and carbon coating for SEM observations.
Broadband dielectric spectroscopy was employed to study the dielectric response of BFTO ceramics over a frequency range of 10 mHz to 10 MHz and a temperature range of –30°C to +200°C. Impedance data obtained from BBDS measurements in a form of the normalized (in amplitude) imaginary part of impedance (Z”/Z”max) with normalized frequency (ω/ωmax) for Bi6Fe2Ti3O18 ceramics were modeled using the Kohlrausch–Williams–Watts (KWW) function. The three-parameter alternative equation for the susceptibility functions was used together with the relationships providing a bridge between the frequency domain representation and the time-domain relaxation function. It was found that the quality factor for the fittings R2 was 0.991-0.999.
The identification of non-Debye-type relaxation phenomena was possible, as evidenced by the analysis of the stretching parameter β of the KWW function, within temperatures from 20°C to 200°C. Despite the BBDS measurements were performed for temperatures lower than 20°C it was found that the relaxation peak on spectroscopic dependence of imaginary part of impedance shifted to the lower frequency and “disappeared” from the measuring frequency window. It was found that the β parameter of the KWW function ranged from ~0.72 to 0.82 within the temperature range from 200°C to 20°C (in the impedance formalism). A lower β value indicates a more stretched relaxation function.
Author Contributions
Conceptualization, ZP, DC ALC; methodology, DC, ALC, AW and BGG; software, DC, AW; validation, ZP, ALC; formal analysis, ALC ,DC, AW; investigation, DC, ALC, AW, BGG; resources, ZP, AW, ALC, DC; data curation, AW, ALC; writing—original draft preparation, DC, ALC and AW; writing—review and editing ALC and AW; visualization, ZP, AW, and ALC; supervision, DC and ZP; project administration, ZP, ALC; funding acquisition, ZP, ALC. All authors have read and agreed to the published version of the manuscript.
Funding
This research was funded by POLISH NATIONAL SCIENCE CENTRE (NCN), grant number N N507 446934.
Data Availability Statement
All experimental data are presented in this paper.
Acknowledgments
The SEM: EDS and EBSD investigations were performed at the Faculty of Materials Science and Ceramics in the Laboratory of Scanning Electron Microscopy and Microanalysis. The purchase of the SEM equipment was supported by the project “Excellence Initiative—Research University” for the AGH University of Krakow, Grant ID 1449.
Conflicts of Interest
The authors declare no conflict of interest.
References
- B.Aurivillius: Mixed bismuth oxides with layer lattices. The structure type of CaNb2Bi2O9. Arkh.Khemi., 1, No.54, 463-480 (1949), B.Aurivillius: Mixed bismuth oxides with layer lattices. Structure of Bi4Ti3O12. Arkh.Khemi, 1, No.58, 499-512 (1949), B.Aurivillius: Mixed oxides with layer lattices. Structure of BaBi4Ti4O15, Arkh.Khemi, 2, No.37, 519-527 (1950).
- M.Krzhizhanovskaya, S.Filatov, V.Gusarov, P.Paufler, R.Bubnova, M.Morozov and D.Meyer, Aurivillius phases in Bi4Ti3O12/BiFeO3 system: thermal behaviour and crystal structure, Anorg. Allg. Chem. 631, (2005) 1603 – 1608.
- N.A.Lomanova, M.I.Morozov, V.L.Ugolkov and V.V.Gusarov, Properties of Aurivillius phases in the Bi4Ti3O12 - BiFeO3 system, Inorg. Mater., 42, (2006) 189 – 195.
- R.Waser (Ed): Nanoelectronics and informatiom technology, Wiley-VCH, Weinheim, 2005.
- R.E.Newnham, R.W.Wolfe, J.F.Dorian, Structural Basis of Ferroelectricity in the Bismuth Titanate Family. Mat. Res. Bull. 6, (1971) 1029-1040.
- C.Paz de Araujo, J.F.Scott, G.W.Taylor (Ed): Ferroelectric thin films: synthesis and basic properties.(Gordon and Breach Publishers, Amsterdam, 1996).
- B.Jaffe, W.R.Cook, H.Jaffe: Piezoelectric ceramics, Academic Press, London, 1971.
- Bućko, M.; Polnar, J.; Przewożnik, J.; Żukrowski, J.; Kapusta, C. Magnetic properties of the Bi6Fe2Ti3O18 Aurivillius phase prepared by hydrothermal method. Adv. Sci. Technol. 2010, 67, 170–175.
- Jartych, E.; Mazurek, M.; Lisińska-Czekaj, A.; Czekaj, D. Hyperfine interactions in some Aurivillius Bim+1Ti3Fem-3O3m+3 compounds. J. Magn. Magn. Mater. 2010, 322, 51–55.
- M.Garcia-Guaderrama, L.Fuentes-Montero, A.Rodriguez, L.Fuentes, Structural characterization of Bi6Ti3Fe2O18 obtained by molten salt synthesis, Integrated ferroelectrics, 83, (2006) 41-47.
- Lisińska-Czekaj, A.; Czekaj, D.; Garbarz-Glos, B.; Bąk, W. Immittance Studies of Bi6Fe2Ti3O18 Ceramics. Materials 2020, 13, 5286. [CrossRef]
- Sun, S.; Yin, X. Progress and Perspectives on Aurivillius-Type Layered Ferroelectric Oxides in Binary Bi4Ti3O12-BiFeO3 System for Multifunctional Applications. Crystals 2021, 11, 23. [CrossRef]
- Maitland, T.; Sitzman, S., Backscattering detector and EBSD in nanomaterial characterization, Springer, New York, 2007. [CrossRef]
- Kohlrausch, R. Theorie des elektrischen Ruckstandes in der Leidener Flasche. Ann. Phys. 1854, 167 (2), 179–214.
- Williams, G.; Watts, D. C. Non-symmetrical dielectric relaxation behaviour arising from a simple empirical decay function. Trans. Faraday Soc. 1970, 66, 80–85.
- Bergman, R. General susceptibility functions for relaxations in disordered systems, J. Appl. Phys. 2000, 88, 1356. [CrossRef]
- Sinclair, D.C.; West, A.R. Impedance and modulus spectroscopy of semiconducting BaTiO3 showing positive temperature coefficient of resistance, J. Appl. Phys. 1989, 66, 3850.
- Lasia, A. Electrochemical Impedance Spectroscopy and its Applications. In: Conway, B. E.; Bockris, J.; White, R.E. (Eds) Modern Aspects of Electrochemistry, Vol 32. Springer, Boston, MA. 2002. [CrossRef]
- Morozov, M.I., Gusarov, V.V. Synthesis of Am – 1Bi2MmO3m + 3 Compounds in the Bi4Ti3O12–BiFeO3 System. Inorganic Materials 38, 723–729 (2002). [CrossRef]
- Degen, T.; Sadki, M.; Bron, E.; König, U.; Nénert, G. The HighScore suite, Powder Diffraction, 2014, 29, S2, S13-S18. [CrossRef]
- Match! - Phase Analysis using Powder Diffraction, Crystal Impact - Dr. H. Putz & Dr. K. Brandenburg GbR, Kreuzherrenstr. 102, 53227 Bonn, Germany. https://www.crystalimpact.de/match. (accessed on 02.0.6.2025).
- MATCH! Version 2.0.11, CRYSTAL IMPACT, Postfach 1251, 53002 Bonn, Germany. Available online. URL: http://www.crystalimpact.com/match (accessed on 02.06.2025).
- COD/AMCSD Database Available online. URL.: http://www.crystalimpact.com/match/download.htm#refdb (accessed on 02.06.2025).
- ISCD Database, FIZ Karlsruhe, Available online. URL. https://www.fiz-karlsruhe.de/en/produkte-und-dienstleistungen/inorganic-crystal-structure-database-icsd (accessed on 14 05 2024).
- International Centre for Diffraction Data, 12 Campus Boulevard, Newton Square, PA 19073-3273 U.S.A.; URL: http://www.icdd.com (accessed on 02.06.2025).
- Barsoukov, E.; Macdonald J. R. (Eds) Impedance Spectroscopy, Theory, Experiment, and Applications, Third Edition, John Wiley & Sons, Inc., 2018.
- Boukamp, B.A. A linear Kronig-Kramers transform test for immitance data validation. J. Electrochem. Soc. 1995, 142, 1885–1894;. [CrossRef]
- Kohlrausch, R., Theorie des elektrischen Ruckstandes in der Leidener Flasche. Ann. Phys. 1854, 167 (2), 179–214.
- Williams, G.; Watts, D. C., Non-symmetrical dielectric relaxation behaviour arising from a simple empirical decay function. Trans. Faraday Soc. 1970, 66, 80–85.
- Aurivillius B., Fang P.H., Ferroelectricity in the compound Ba2Bi4Ti5O18", Physical Review, Section A 126, 893-896 (1962);. [CrossRef]
- Woodward, W. H. H. Broadband Dielectric Spectroscopy—A Practical Guide, In: W. H. Hunter Woodward (Editor), Broadband Dielectric Spectroscopy: A Modern Analytical Technique, ACS Symposium Series; vol.1375, American Chemical Society: Washington, DC, 2021. [CrossRef]
- Boukamp, B.A. Electrochemical impedance spectroscopy in solid state ionics: recent advances, Solid State Ionics 2004, 169, 65–73; [CrossRef]
- Cole, K.S., Cole, R.H. Dispersion and Absorption in Dielectrics I. Alternating Current Characteristics. The Journal of Chemical Physics, 1941, 9, 341;. [CrossRef]
- Abramowitz, Milton; Stegun, Irene A., eds. (1972). "Chapter 6". Handbook of Mathematical Functions with Formulas, Graphs, and Mathematical Tables. New York: Dover.
- Czekaj, D.; Lisińska-Czekaj, A. Enhanced Spectroscopic Insight into Acceptor-Modified Barium Strontium Titanate Thin Films Deposited via the Sol–Gel Method. Materials, 2024, 17, 2491. [CrossRef]
Figure 1.
X-ray diffraction pattern for Bi6Fe2Ti3O18 ceramics. (a) Results of the line profile analysis; (b) Williamson-Hall plot; (c) Results of qualitative phase analysis; (d) Refined structural analysis. The minimum intensity of the diffraction line, which was indexed with Miller indices, was 3%.
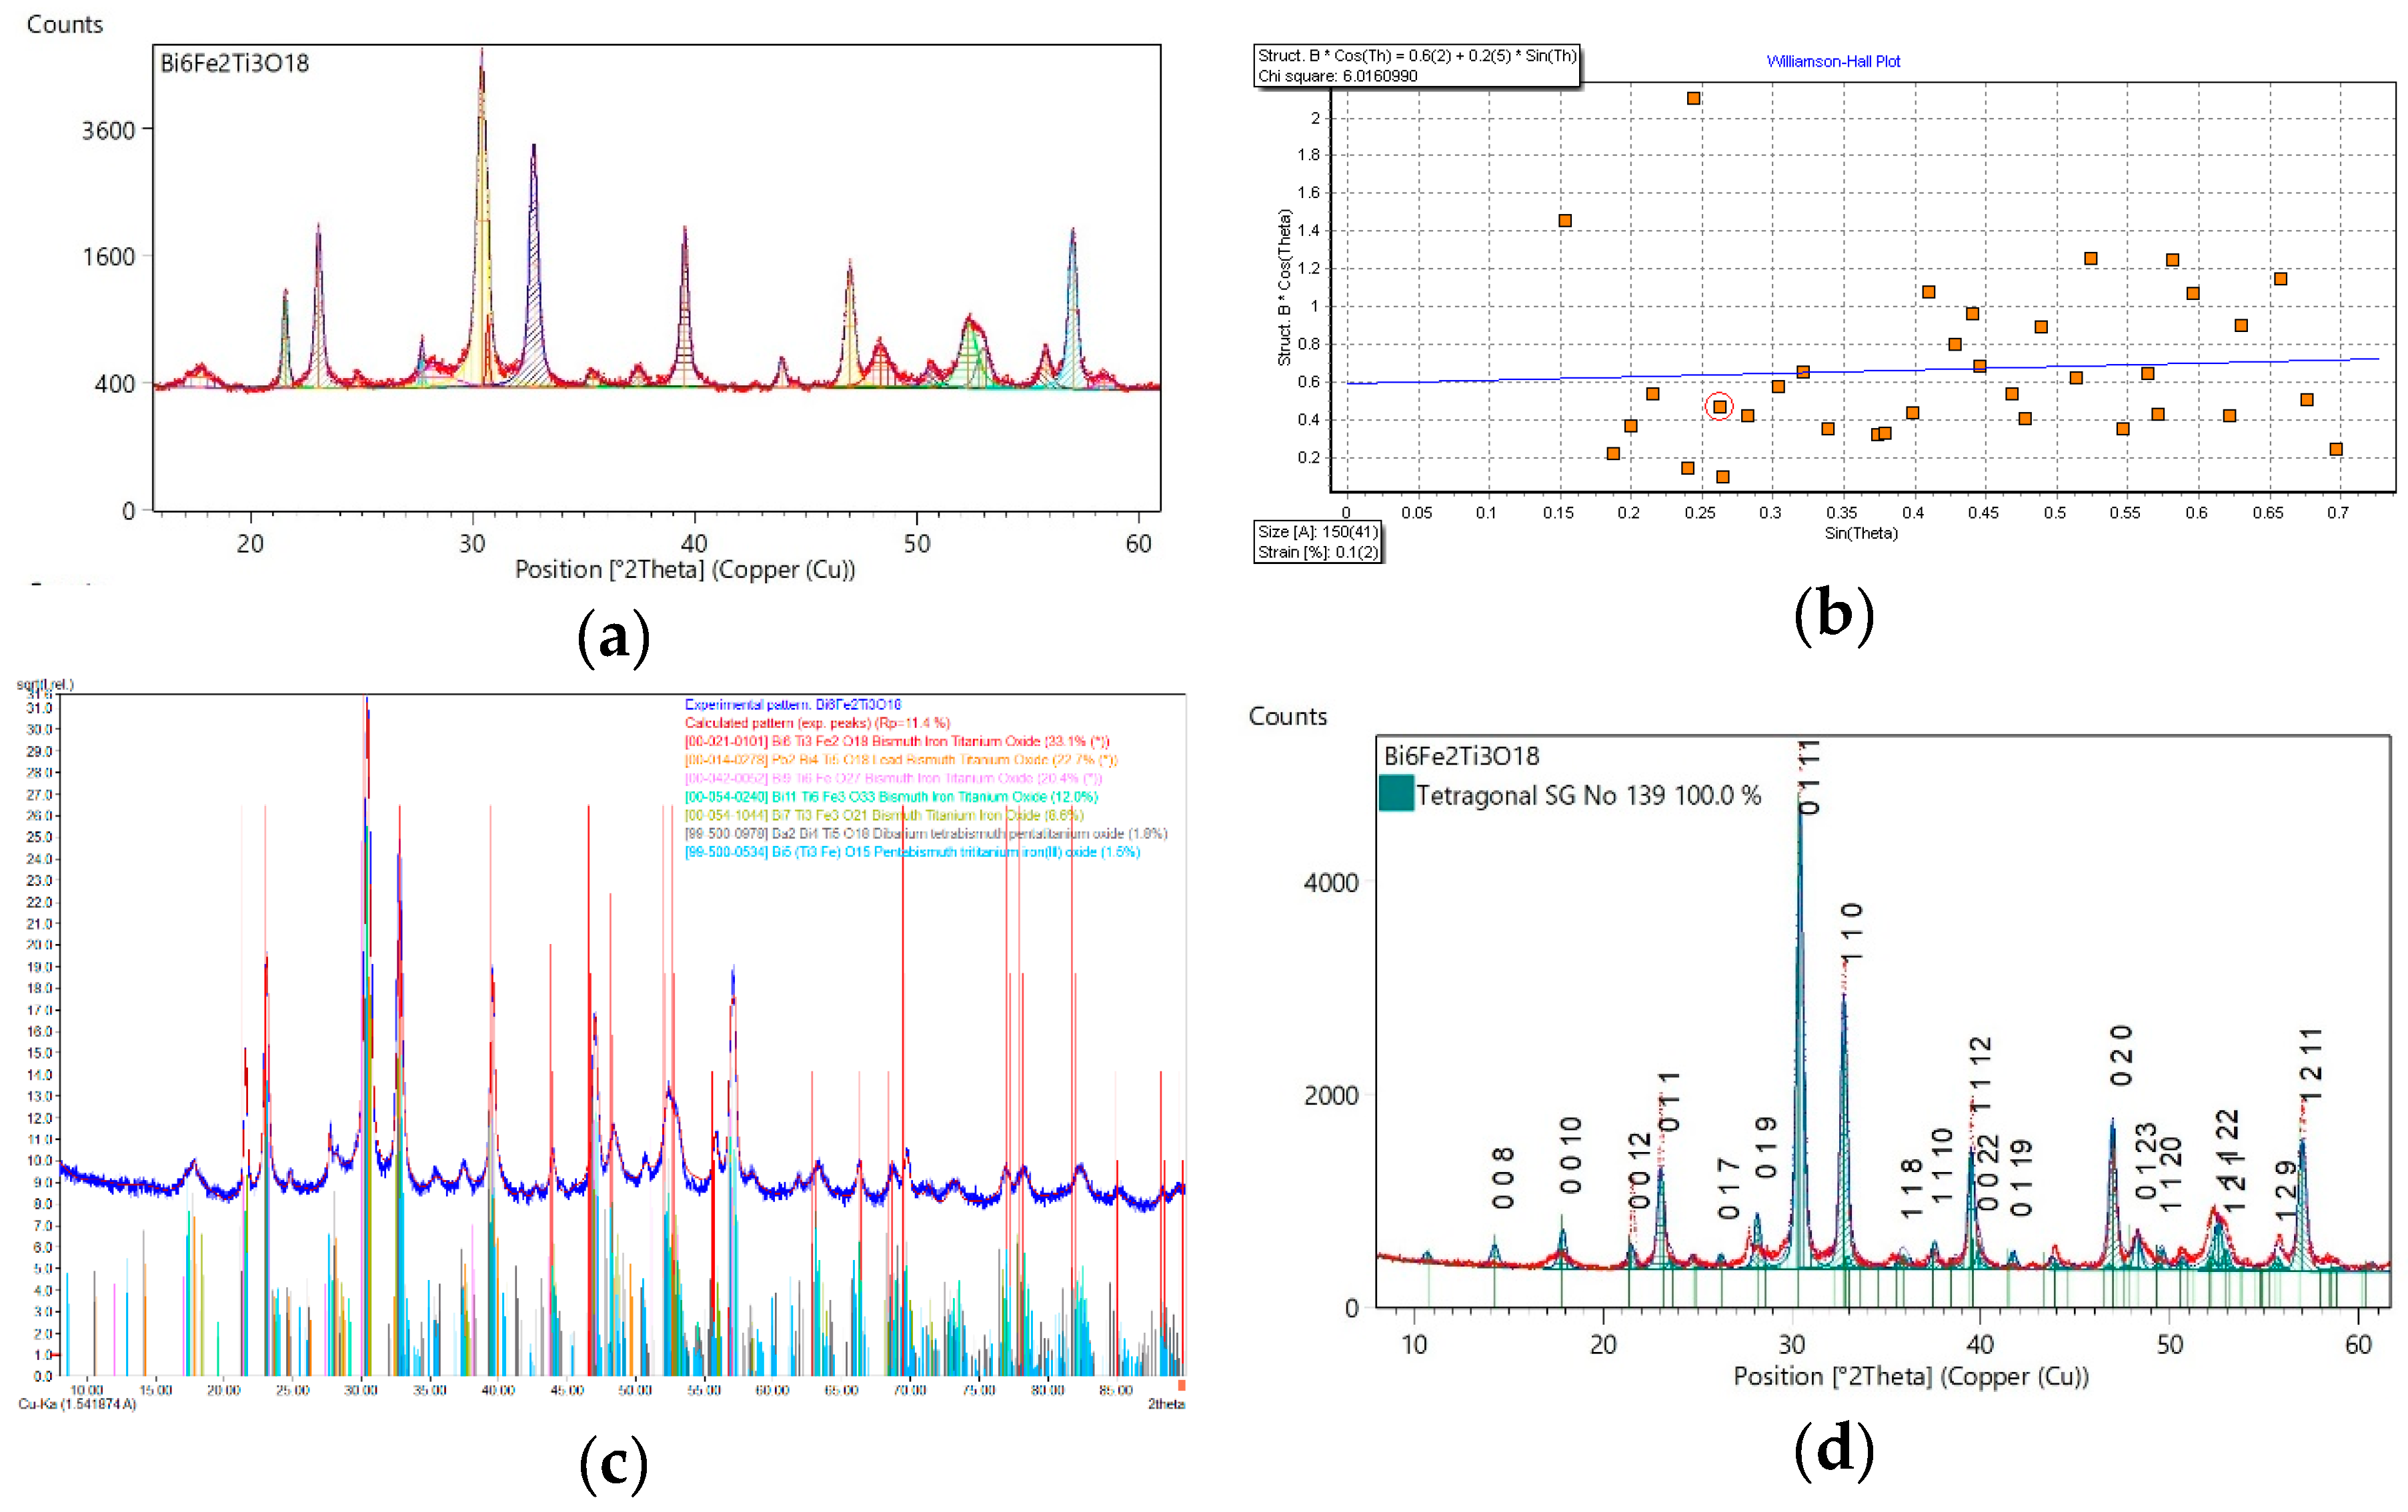
Figure 2.
Inverse pole figure for Bi6Fe2Ti3O18 ceramics (a) crystallographic orientation map; (b) inverse pole figure (IPF) showing the crystallographic orientation distribution of grains relative to the sample normal direction [001]; (c) color-coded legend for IPF map.
Figure 2.
Inverse pole figure for Bi6Fe2Ti3O18 ceramics (a) crystallographic orientation map; (b) inverse pole figure (IPF) showing the crystallographic orientation distribution of grains relative to the sample normal direction [001]; (c) color-coded legend for IPF map.
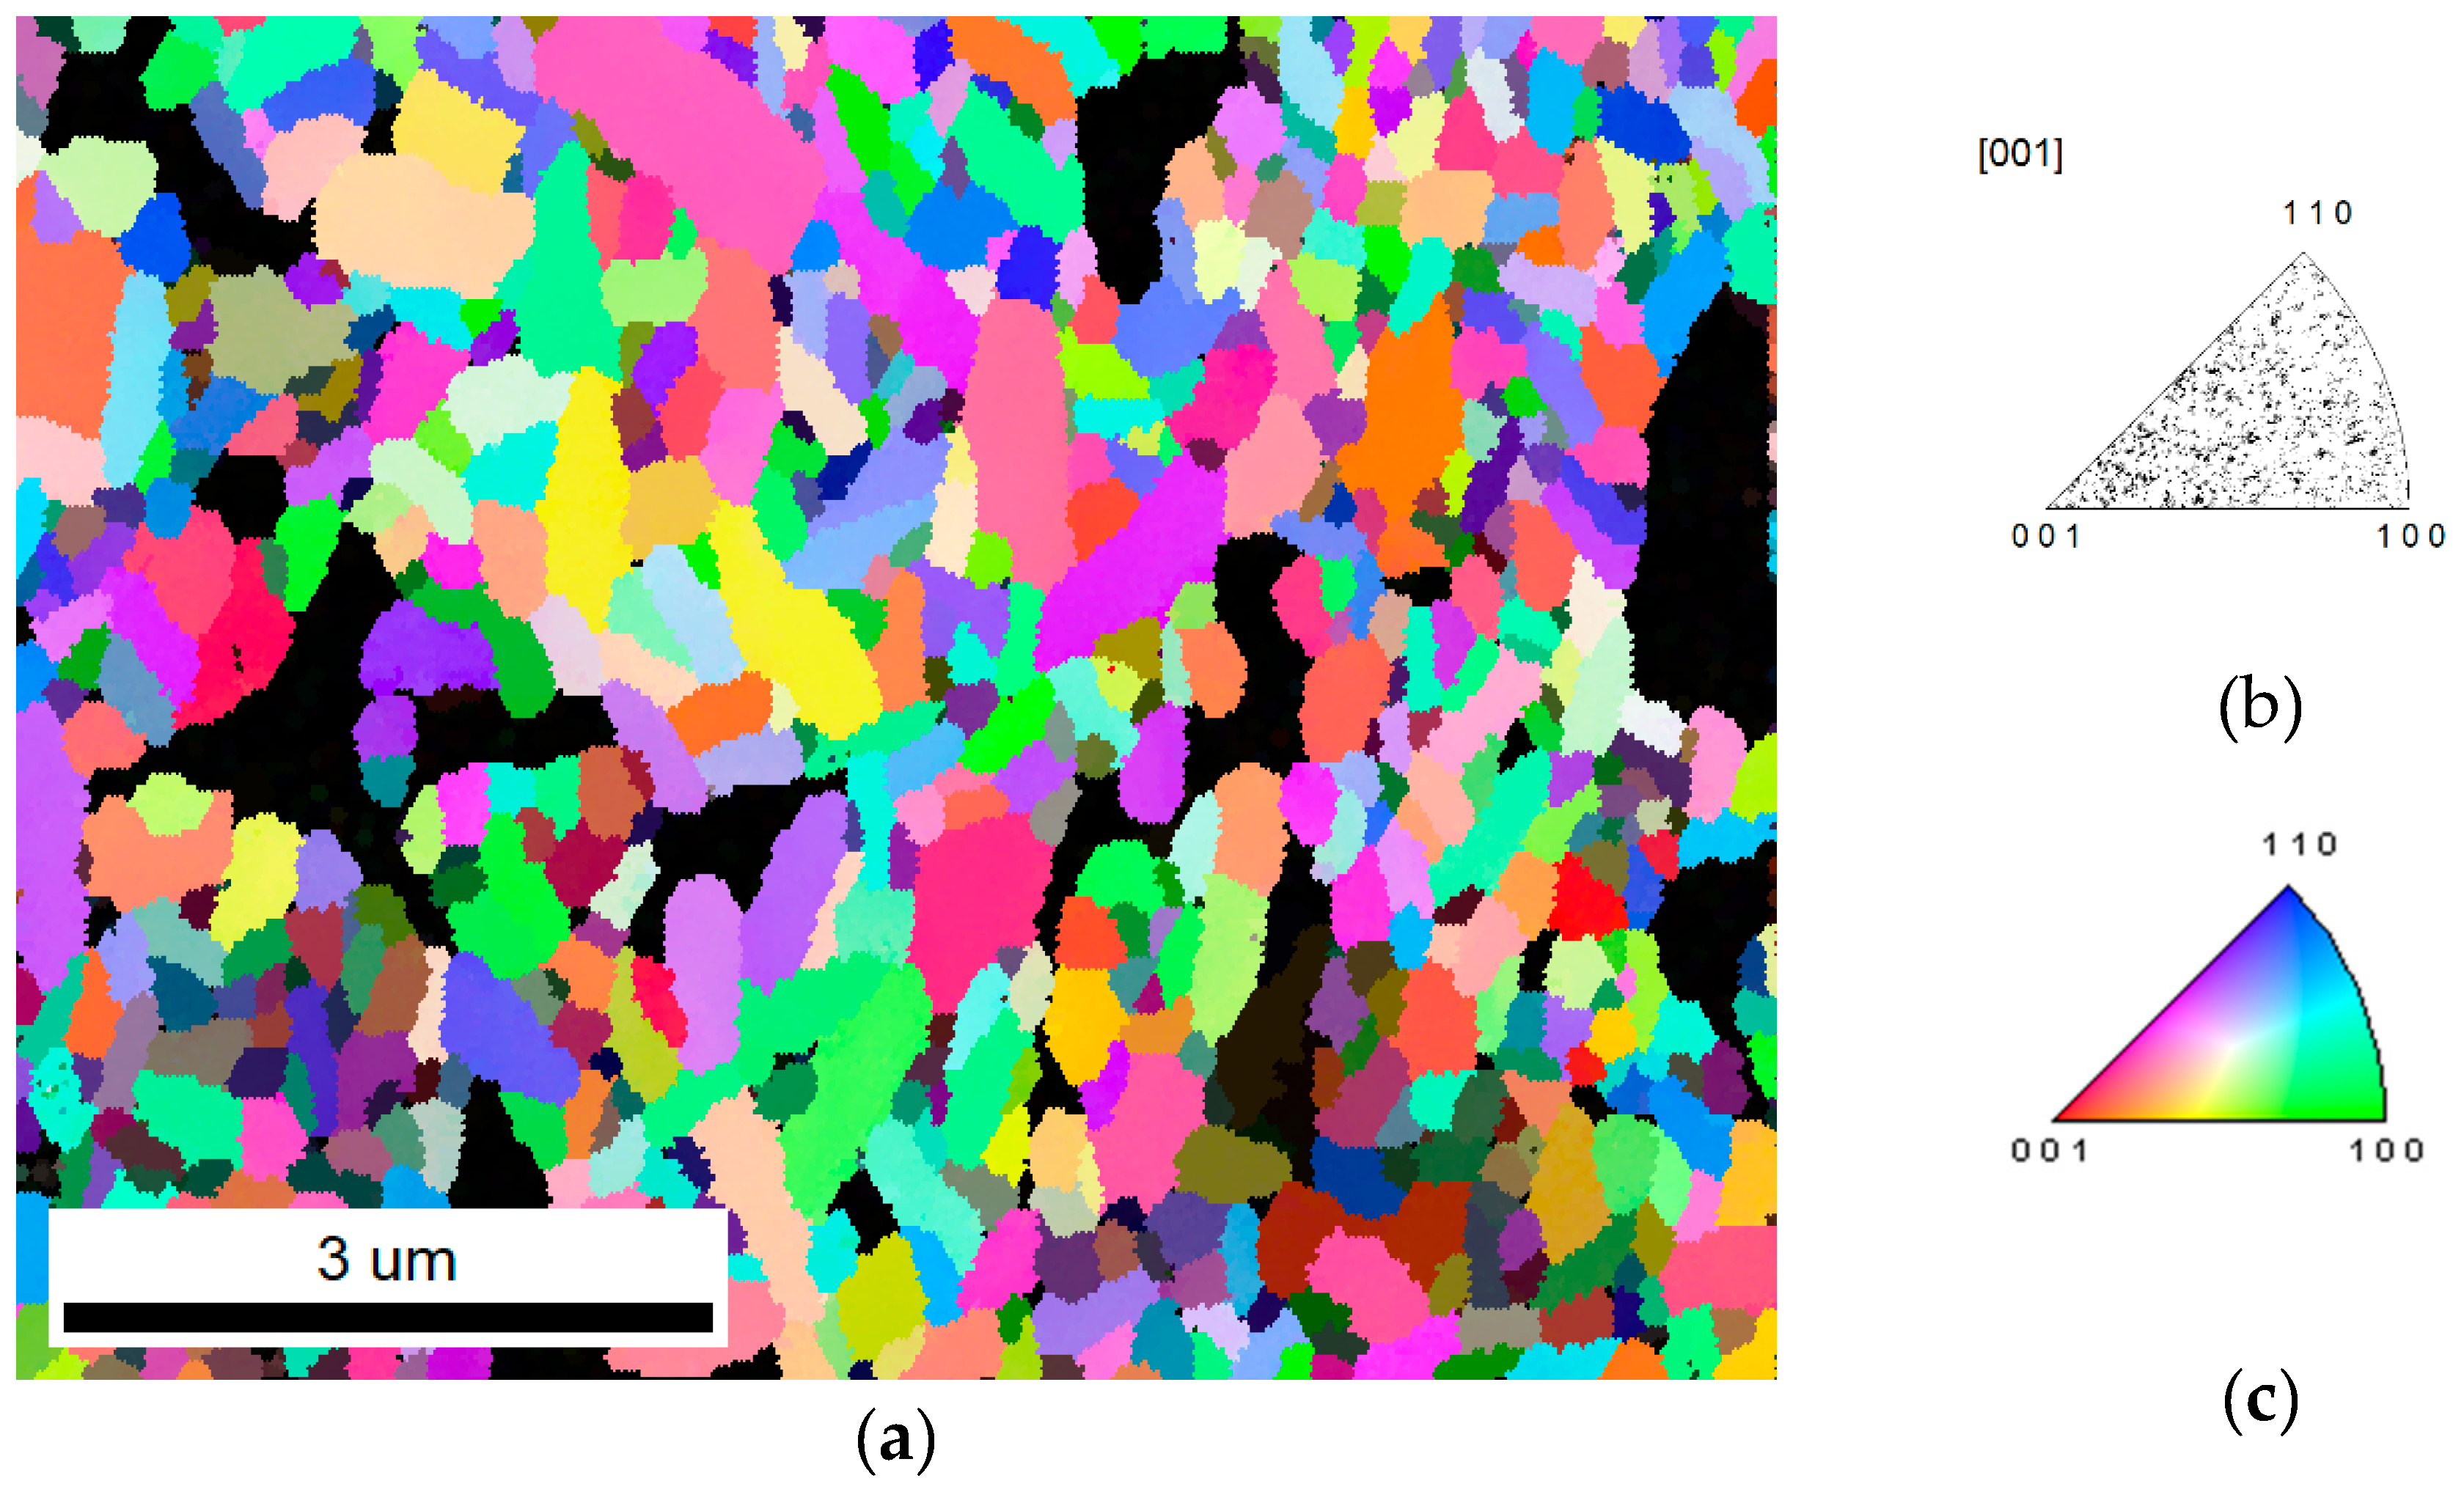
Figure 3.
PF (pole figure) for Bi6Fe2Ti3O18 ceramics for the {001} and {100} planes obtained from EBSD.
Figure 3.
PF (pole figure) for Bi6Fe2Ti3O18 ceramics for the {001} and {100} planes obtained from EBSD.
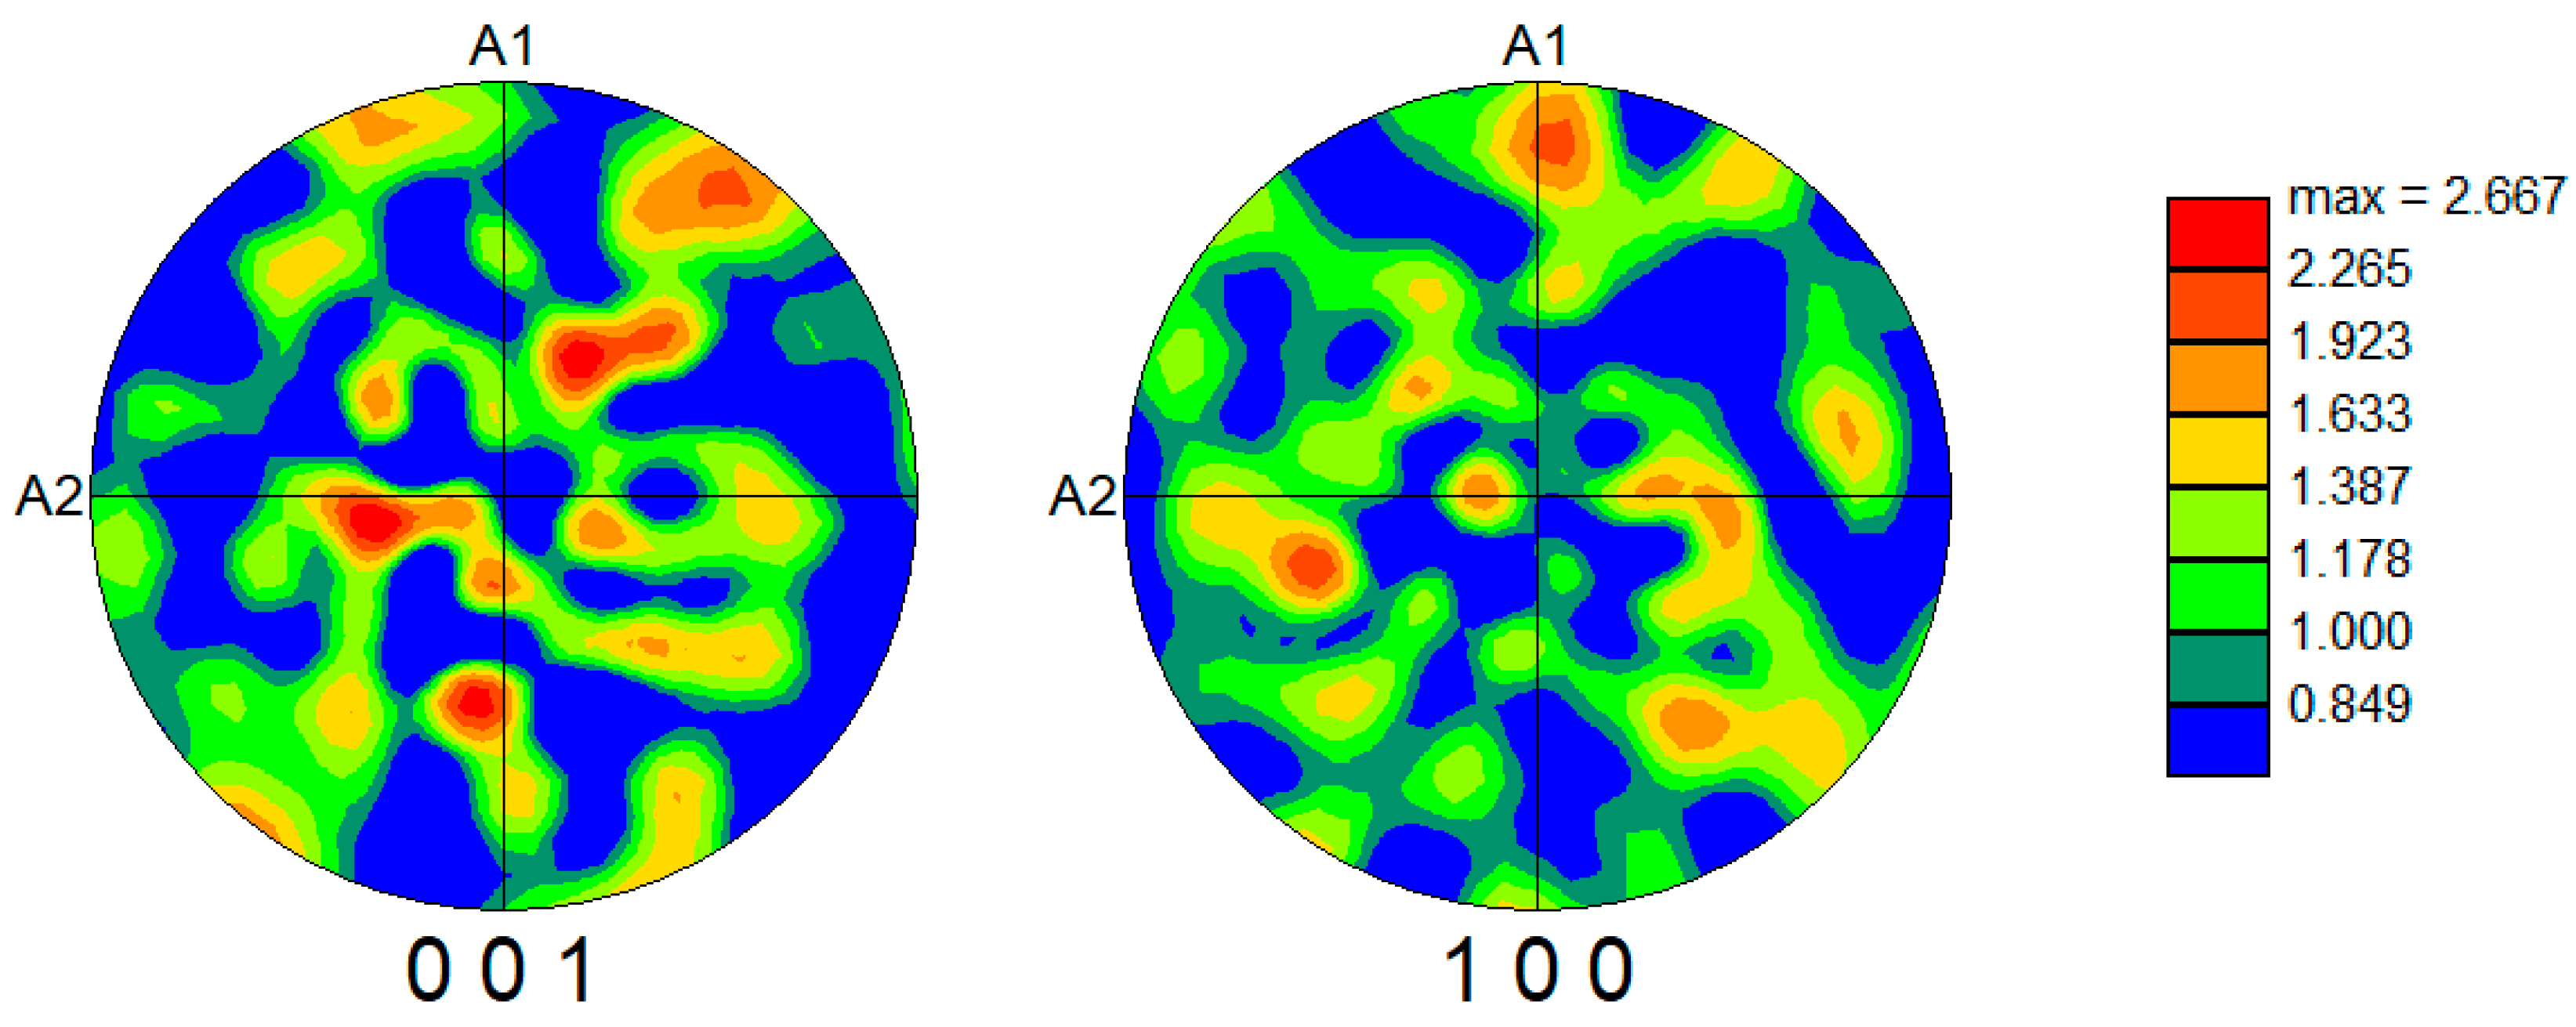
Figure 4.
(a) IQ map (image quality) for Bi6Fe2Ti3O18 ceramics; (b) grain size distribution plot.
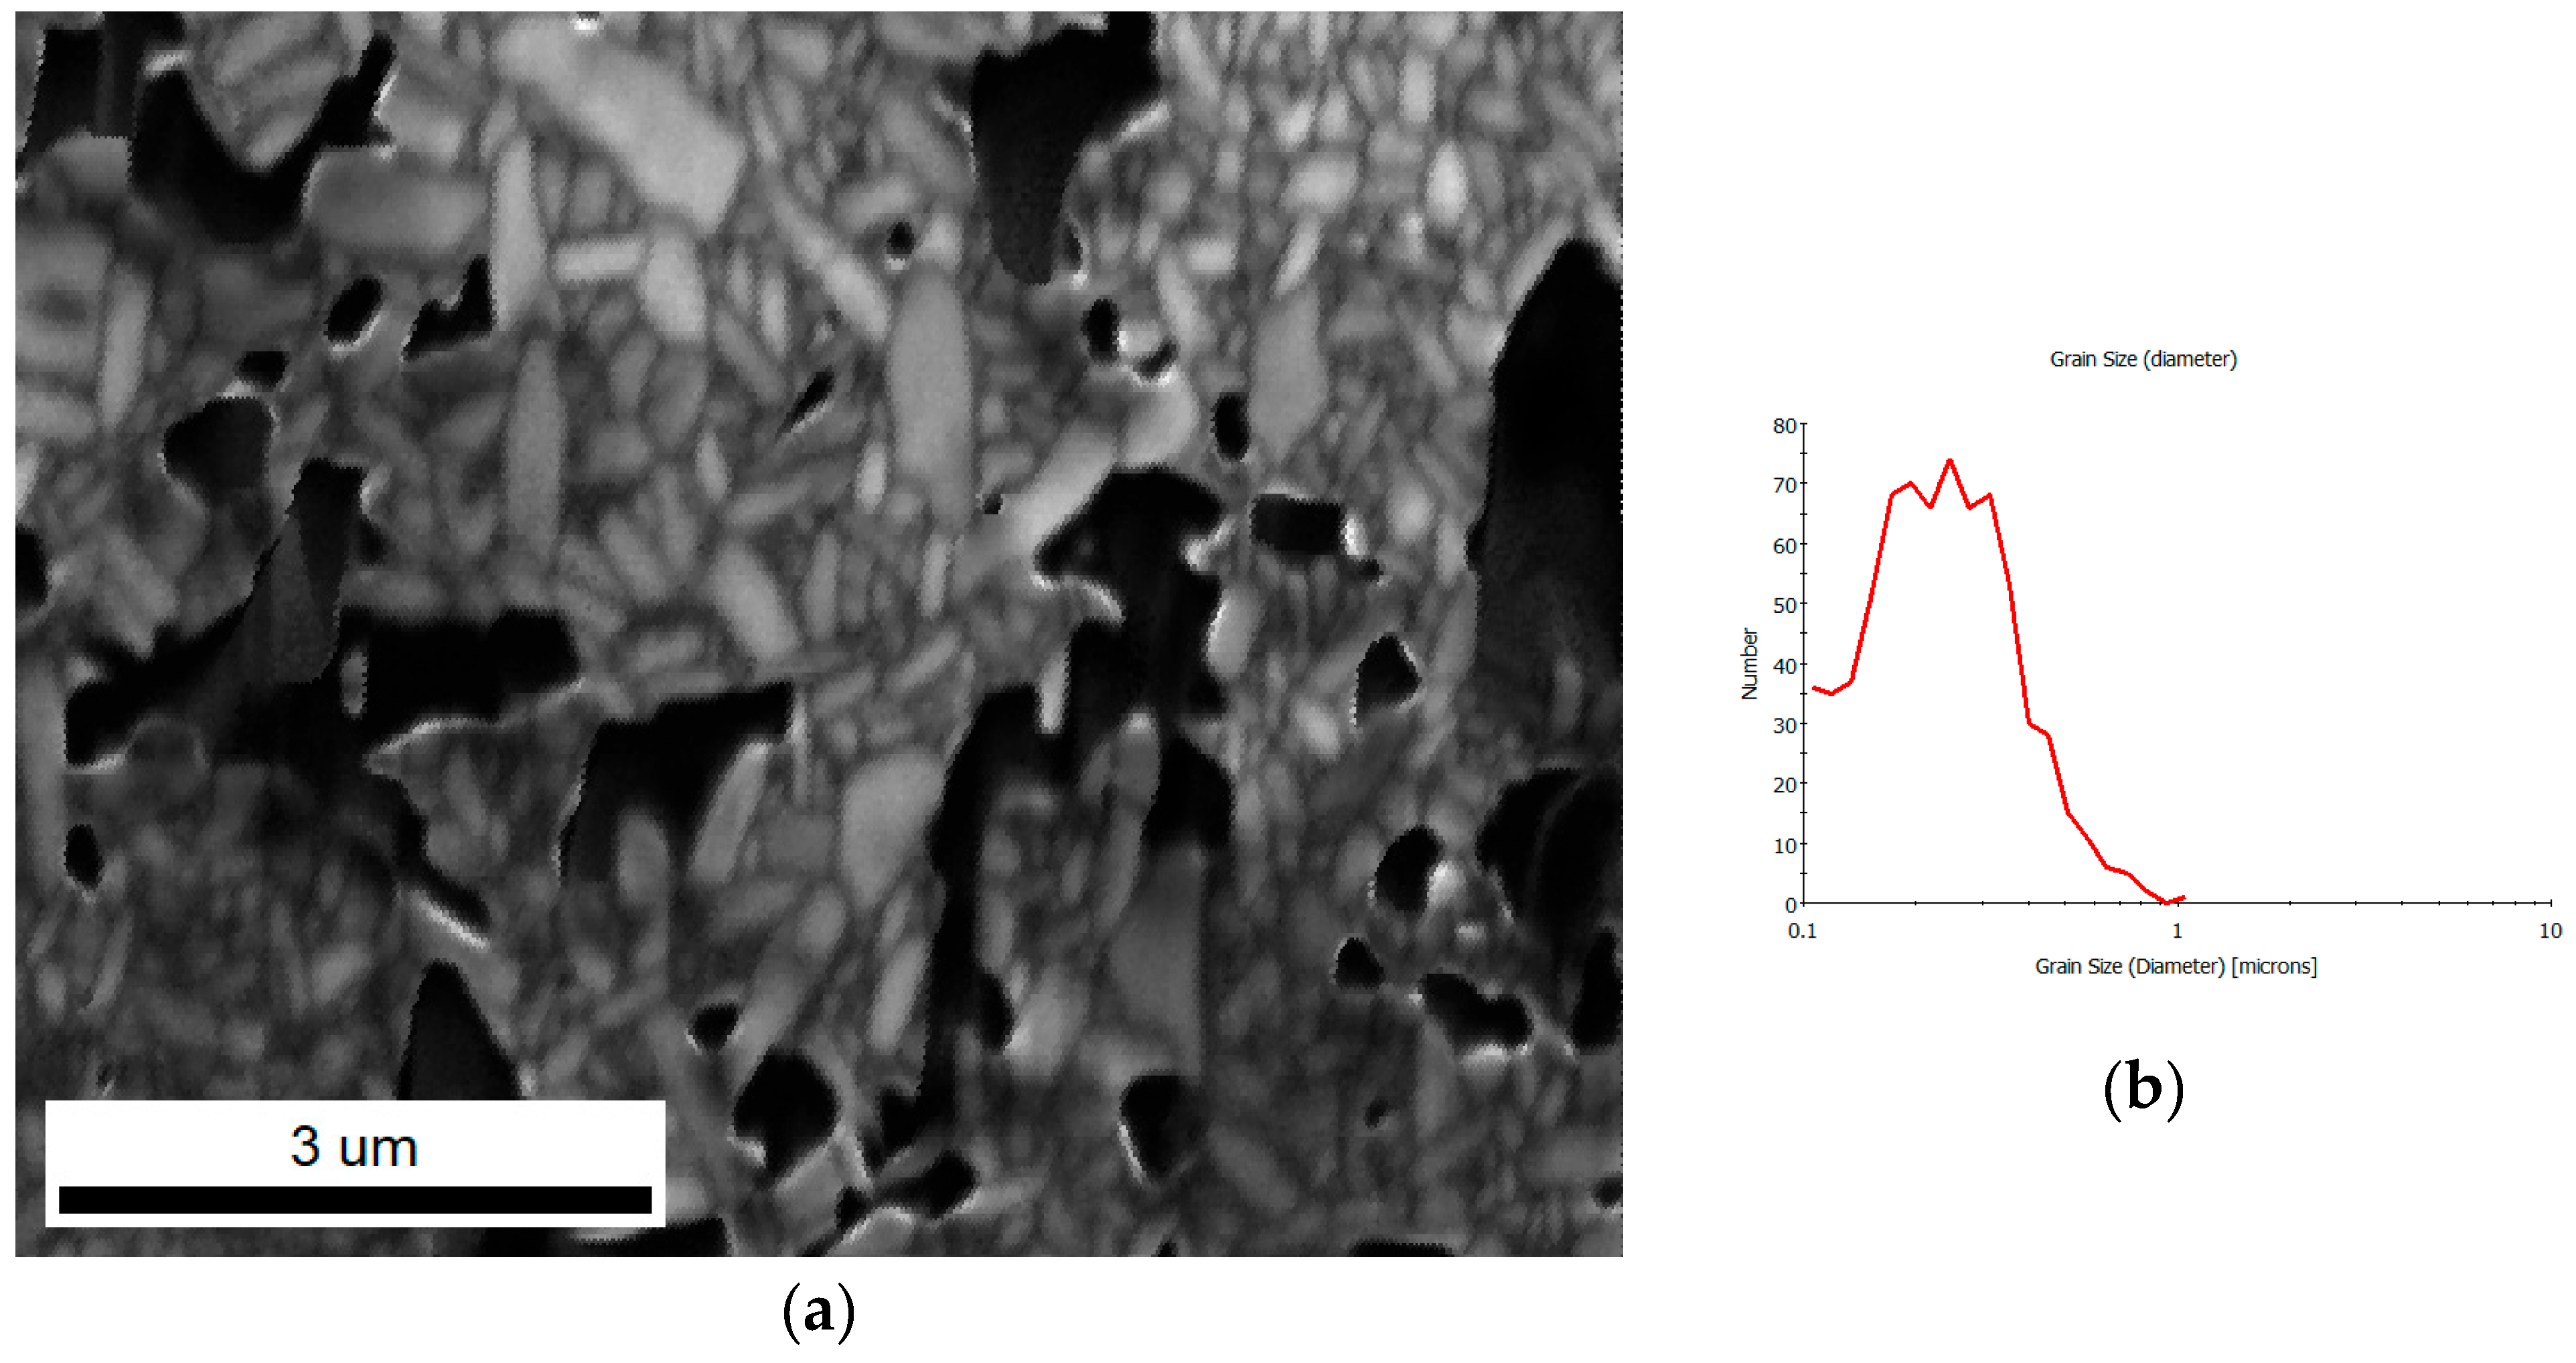
Figure 5.
Microstructure and chemical composition of Bi6Fe2Ti3O18 ceramics obtained by using (a) scanning electron microscope (secondary electron mode) , (b) energy-dispersive X-ray spectroscopy (EDS).
Figure 5.
Microstructure and chemical composition of Bi6Fe2Ti3O18 ceramics obtained by using (a) scanning electron microscope (secondary electron mode) , (b) energy-dispersive X-ray spectroscopy (EDS).
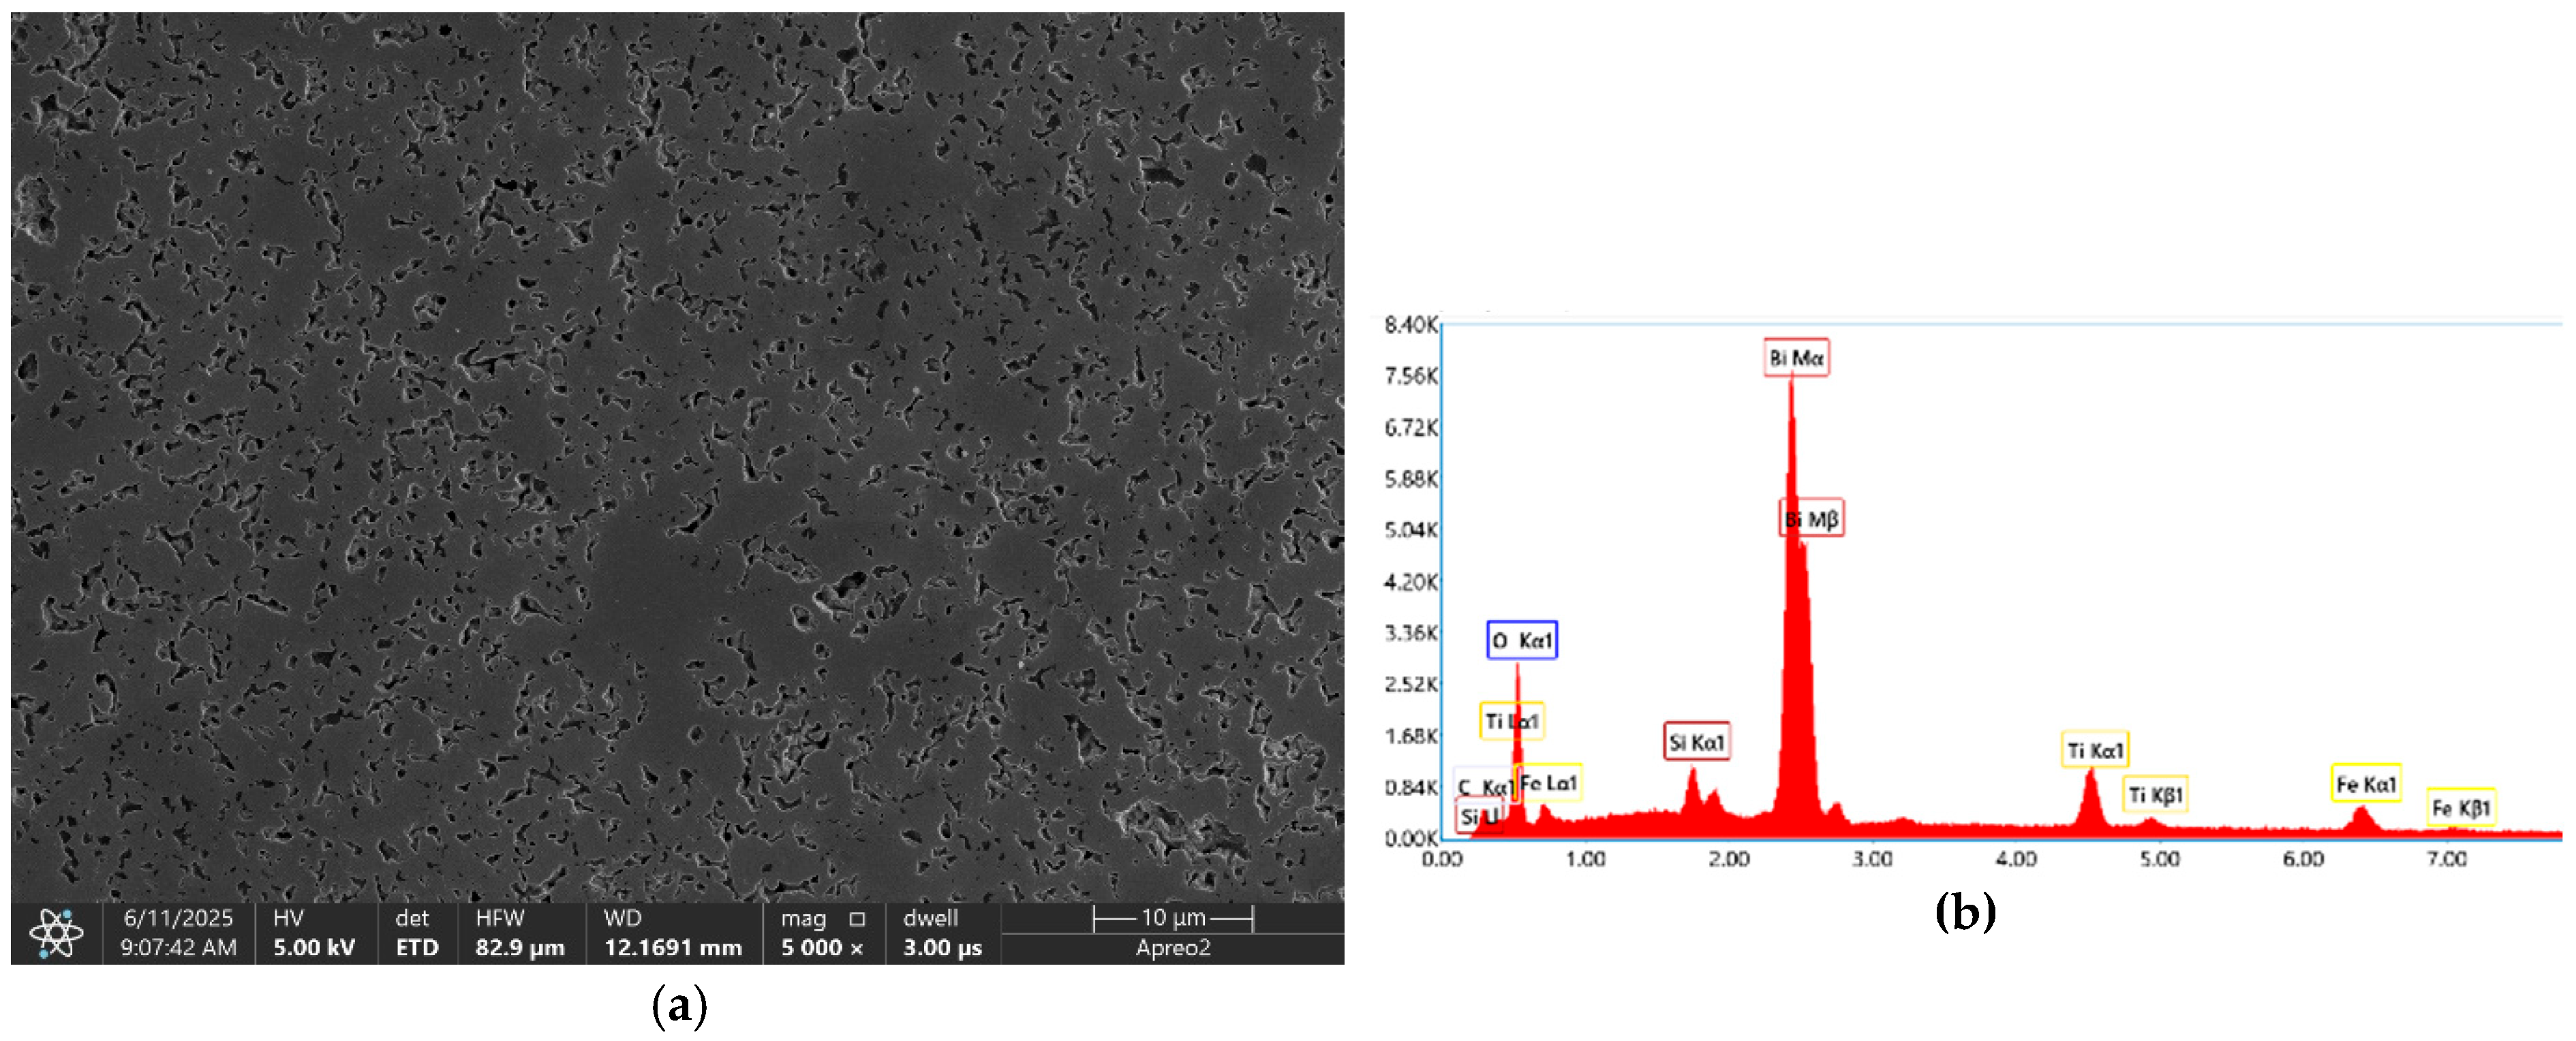
Figure 6.
Nyquist plots for complex impedance response for Bi6Fe2Ti3O18 ceramics. (a) Temperature range from 135°C to 200°C; (b) Temperature range from 55°C to 135°C; (c) Temperature range from -30°C to 55°C (linear isotropic scale).
Figure 6.
Nyquist plots for complex impedance response for Bi6Fe2Ti3O18 ceramics. (a) Temperature range from 135°C to 200°C; (b) Temperature range from 55°C to 135°C; (c) Temperature range from -30°C to 55°C (linear isotropic scale).
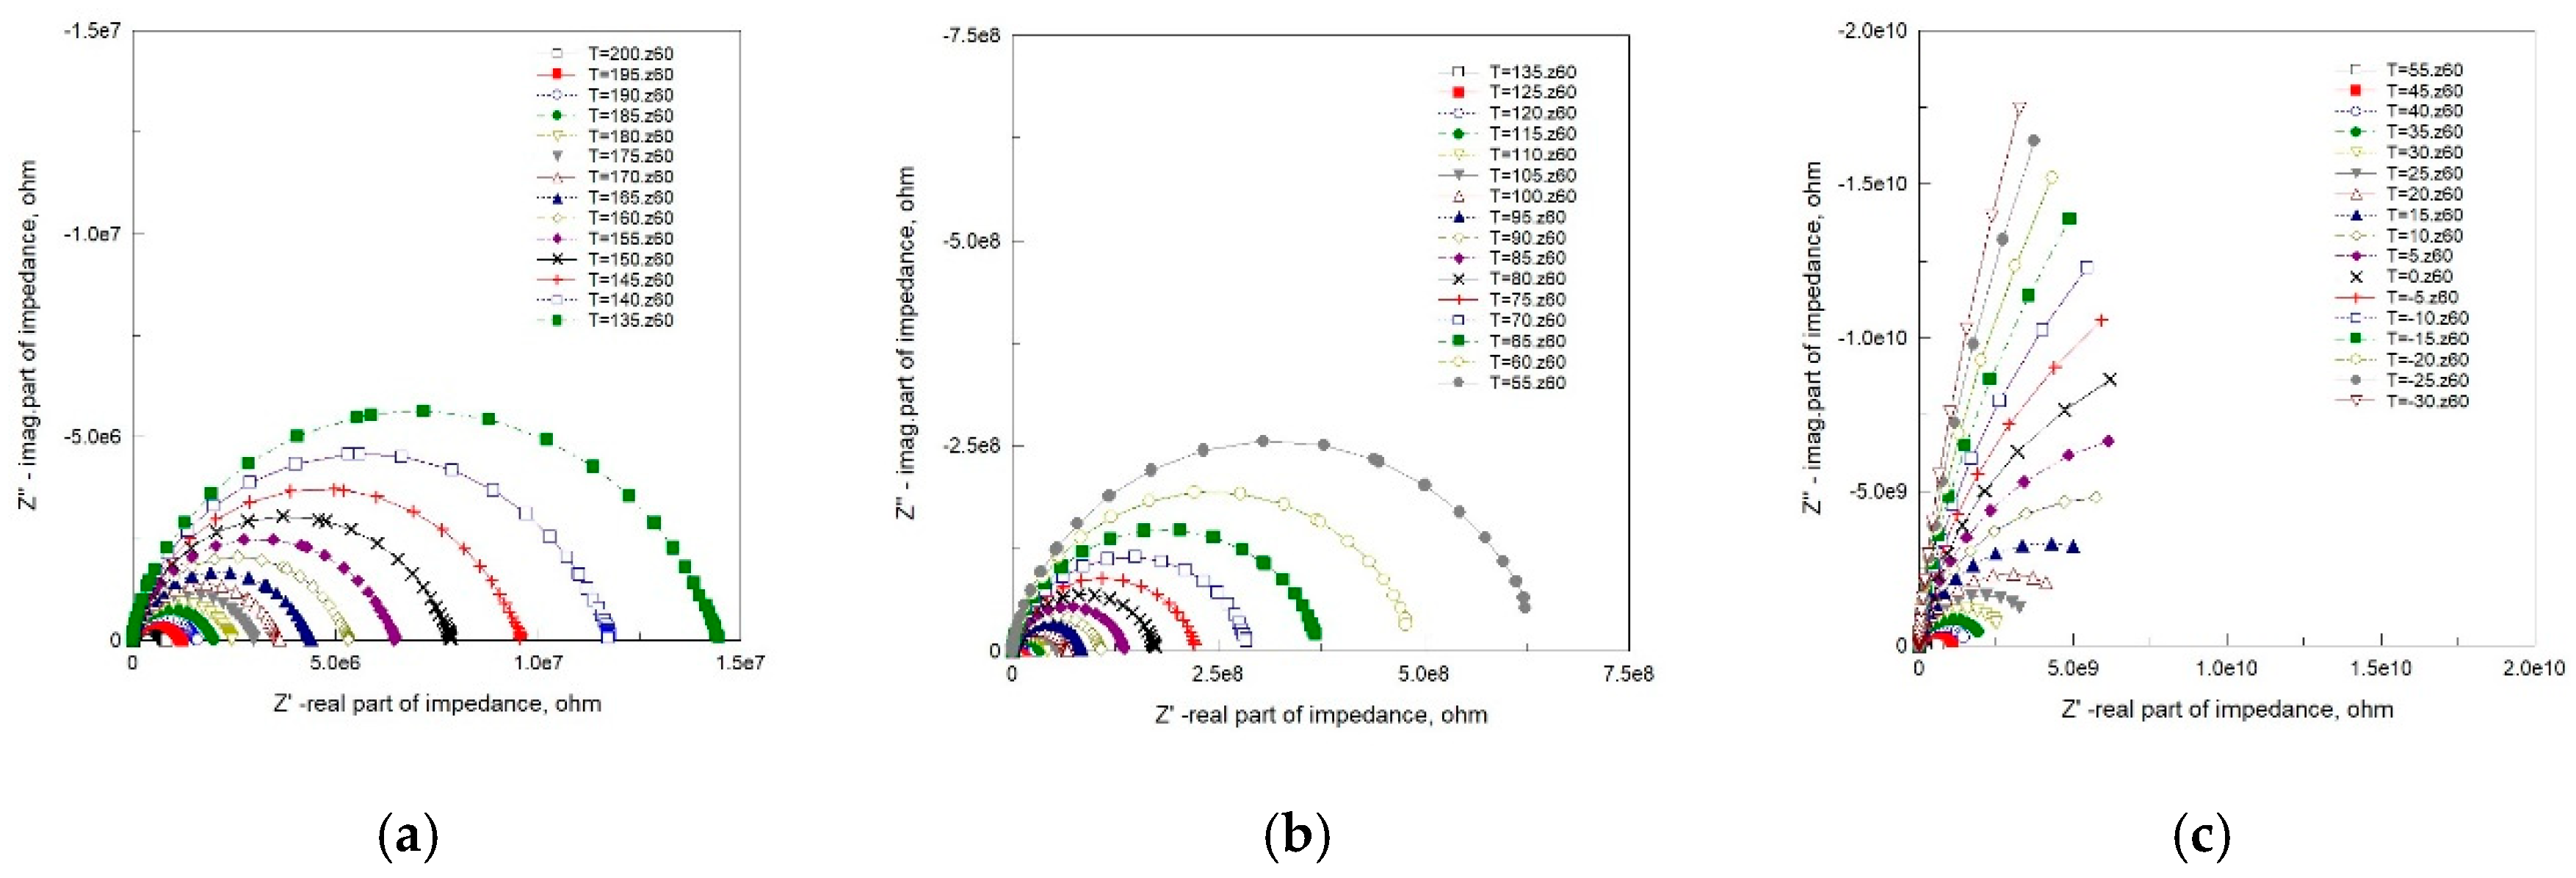
Figure 7.
Spectroscopic plots for imaginary component of complex impedance for Bi6Fe2Ti3O18 ceramics. (a) Temperature range from 135°C to 200°C; (b) Temperature range from 55°C to 135°C; (c) Temperature range from -30°C to 55°C.
Figure 7.
Spectroscopic plots for imaginary component of complex impedance for Bi6Fe2Ti3O18 ceramics. (a) Temperature range from 135°C to 200°C; (b) Temperature range from 55°C to 135°C; (c) Temperature range from -30°C to 55°C.
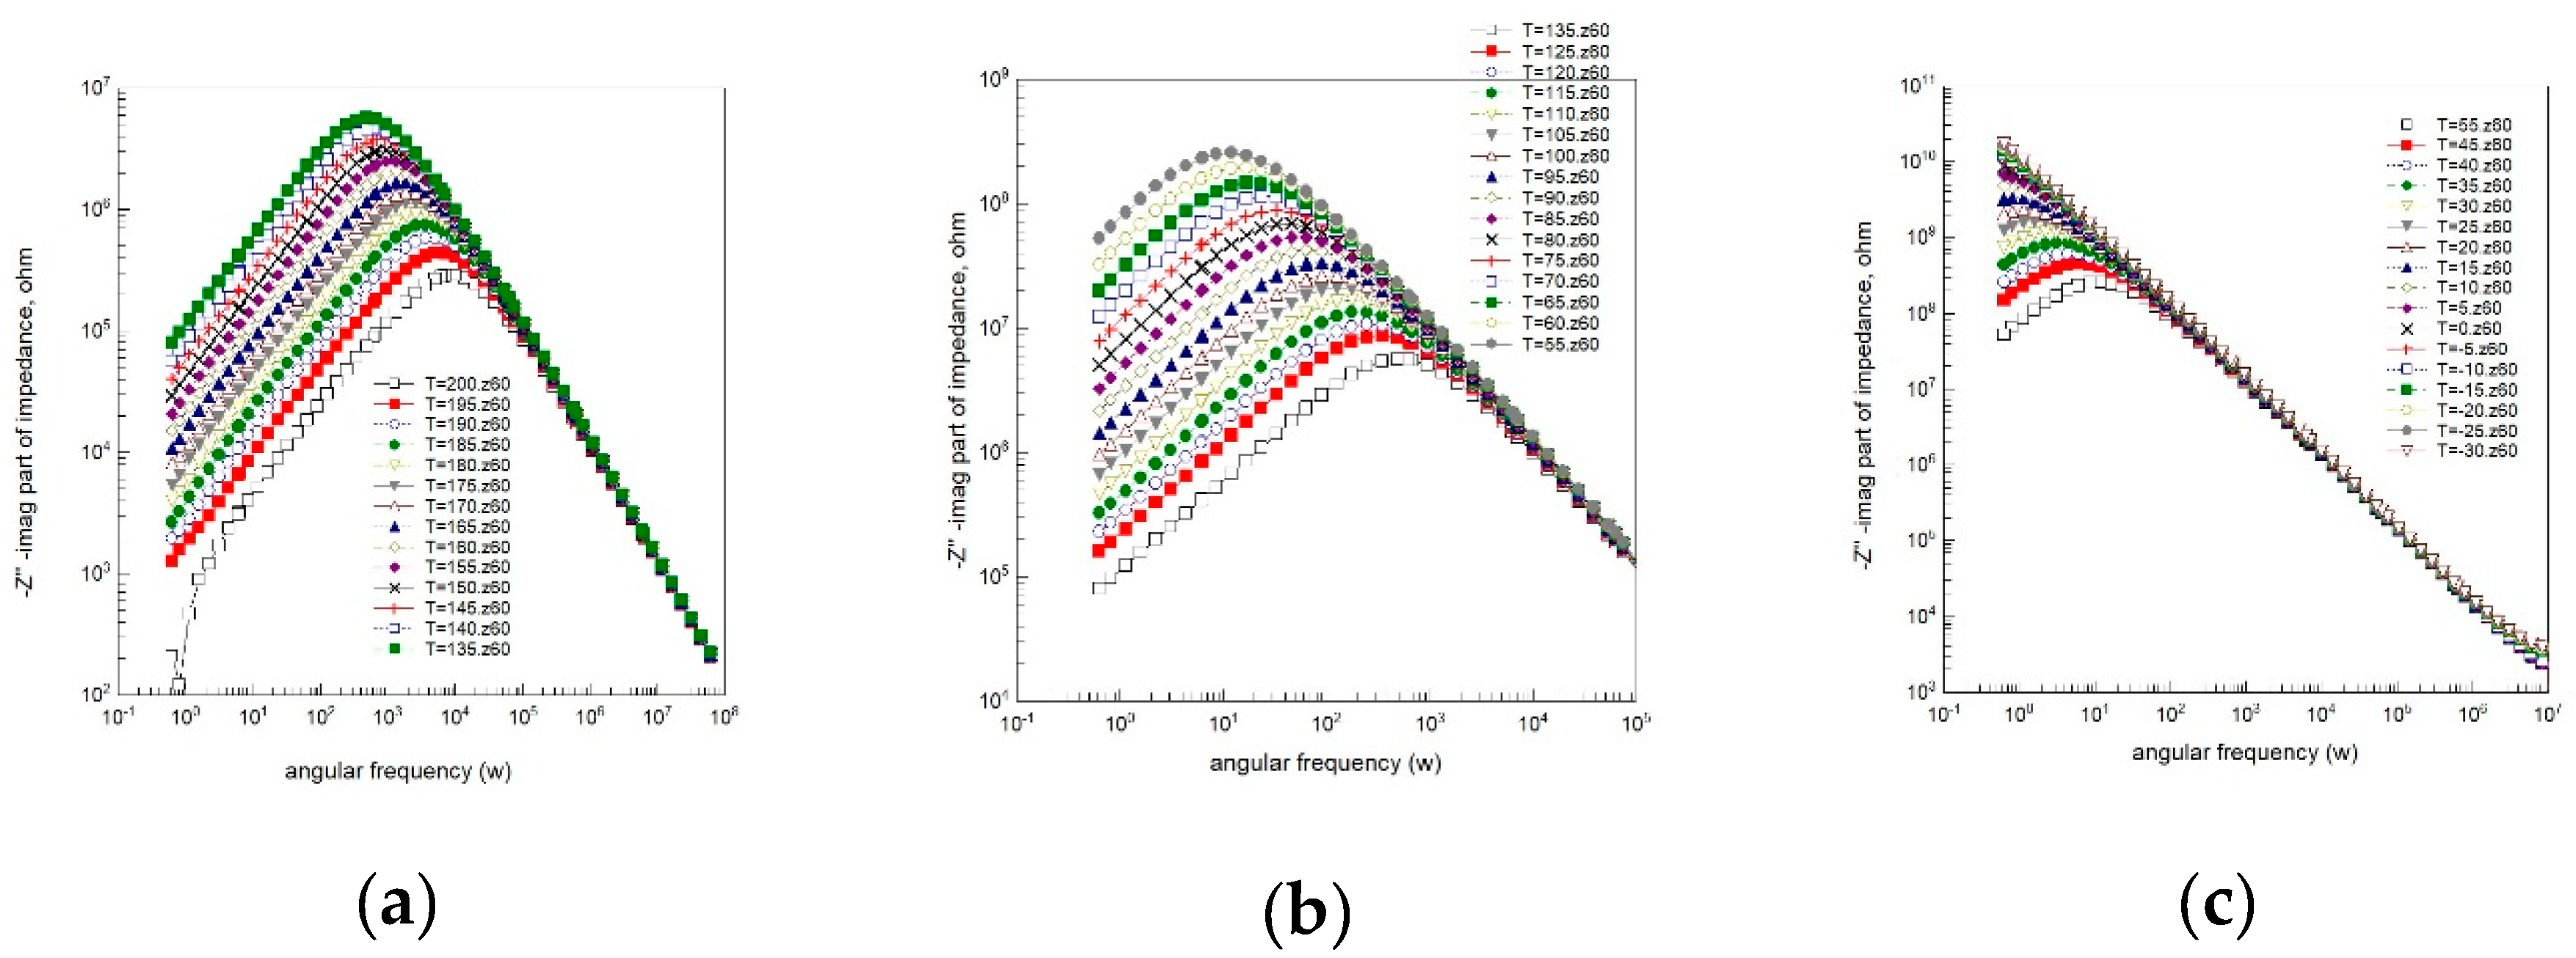
Figure 8.
Normalized imaginary part of impedance (Z”/Z”max) versus normalized frequency (ω/ωmax). (a) Temperature T=200°C; (b) Temperature T=195°C; (c) Temperature T=25°C; (d) Temperature T=20°C; Values of quality parameters (χ2 and R2) and stretching parameter β from KWW equation are given in the legend.
Disclaimer/Publisher’s Note: The statements, opinions and data contained in all publications are solely those of the individual author(s) and contributor(s) and not of MDPI and/or the editor(s). MDPI and/or the editor(s) disclaim responsibility for any injury to people or property resulting from any ideas, methods, instructions or products referred to in the content. |
© 2025 by the authors. Licensee MDPI, Basel, Switzerland. This article is an open access article distributed under the terms and conditions of the Creative Commons Attribution (CC BY) license (http://creativecommons.org/licenses/by/4.0/).
Copyright: This open access article is published under a Creative Commons CC BY 4.0 license, which permit the free download, distribution, and reuse, provided that the author and preprint are cited in any reuse.


