
Submitted:
16 June 2025
Posted:
17 June 2025
You are already at the latest version
Abstract
Cytogenetics field is evolving rapidly due to advancement in next generation sequencing technologies. It has progressed significantly in recent years from traditional to modern cytogenetics, popularly known as cytogenomics. The tools for data analysis and visualization had been developed for decades but due to continuous advancement in the field, they became obsolete or could not be updated. Therefore, it is challenging for a biologist or geneticist to follow the latest tools available and understand its applications. In the current review, we compiled both traditional as well as latest up-to-date tools for the analysis and visualization of cytogenomics data so that it would be beneficial for a biologist or even bioinformatician interested in cytogenomics field.
Keywords:
cytogenomics
; bioinformatics
; cytogenetics tools
Traditional Cytogenetics Meets Bioinformatics/ Genomics
In 1882, Walther Flemming, an Austrian cytologist, visualized portion of nucleus and was the first research demonstrated human chromosomes in mitotic cells. A few years later, in 1888, Wilhelm Waldeyer, proposed the term of ‘’chromosomes’’ originating from Greek words for ‘’colored body’’. In 1902-1903, Walter Sutton and Theodor Boveri formally introduced the “chromosome theory of inheritance”. Around the same time, Sutton combined the cytology and genetics and referred to study of chromosomes as ‘’ cytogenetics’’ [1,2].
Advances in cytological preparation and microscopy were established by the end of 19th century, which helped the cytogenetic to determine the accurate number of human chromosomes in males and females [1,2]. Subsequently, Theophilus Painter introduced the X and Y sex chromosome mechanism in males and females. Karyotype referred to ordered arrangement of chromosome was proposed by Grigory Levinsky. In H.C. Hus’s laboratory, an error reagent preparation, which unexpectedly led to utilization of ‘’hypotonic solution’’ then Joe Hin Tjio and Alberta Levan resolved the number of human chromosomes to be 46. The optimizing chromosomes preparation was the key to establish the clinical cytogenetics field [1,2].
Jerome Lejeune and colleagues found the clinical cytogenetics by experimentally demonstrating that the phenotypic effect was a result from chromosomal abnormalities, as they cultured the fibroblast from a patient of Down syndrome and found additional copy of acrocentric chromosome in all cells. A few years later, Peter Nowell and David Hungerford established the association between the chromosomal abnormalities and cancer by demonstrating Philadelphia chromosome in chronic myelogenous leukemia [1,2].
Nowadays, chromosomal analysis in both quantitative and qualitative effectively assist the diagnosis of chromosomal aberrations and understand the mechanism of tumor development and other diseases. The field of cytogenetics continues to evolve from banding to whole genome sequencing, the study of chromosomal abnormities and its relation with human disease remain a priority of genomic medicine [3].
Classical Cytogenetics
The structure of a chromosome consists of two arms separated by centromere: a short arm, designated as p (“petite”), and long arm, designated as q. Each chromosome is subdivided into distinct regions, expanding from the centromere into the telomere. These regions are further divided into bands (e.g., 8p11) and at higher resolution, into sub- bands (e.g., 8q11.1) [4].
The ability of distinguish individual chromosomes in clinical cytogenetics was limited until Tobjorn Caspersson’s work in 1979, when he introduced quinacrine mustard staining for human chromosome. This technique revealed unique banding pattern for each chromosome pair paving the way for significant advancements in conventional and molecular cytogenetics [5]. These discoveries facilitated the identification and characterization of various chromosomal abnormities including an aneuploidy, deletions, duplications, inversions, translocations and insertions in constitutional genetics and cancer research. The classification of the chromosomal abnormalities based on the size and the location of centromere prior to the development of advanced banding technique [5]. Comparing abnormal chromosomes with their normal counterparts is essential for detecting chromosome aberrations using banding technique.
Various chromosome banding methods were developed including Q, C- banding (C for centromere), G- banding (G for Giemsa), R- banding (R for reverse) and high-resolution banding, each providing distinct structural insights [5]. Q- banding, specific fluorochrome staining called Quinacrine mustard is used to distinguish the human Y chromosome and X-Y and Y-autosome translocation. The major limitation of this method is that due to quick fluorescence quenching, timely photo is required to be taken for karyotyping. C- banding, developed by Pardue and Gall, was historically employed to identify regions of heterochromatin localized at centromeres. This method involves treatment with an alkaline solution followed by Giemsa staining. However, its application in clinical settings has largely been discontinued. Despite this, C-banding remains useful for detecting pericentric inversions in chromosomes 1, 9 and 16 as well as for identifying Y chromosome. Prior to the advent of G-banding, chromosomes were classified into groups A through G based on their size and centromere position [5].
The International System for Human Cytogenomic Nomenclature (ISCN) [6] was established to standardize the designation of chromosomal abnormalities and ensure global consistency. This system is based on the recognized banding patterns of each chromosome, as identified through G-banding [7]. Currently, G-banding is the most widely utilized technique in clinical cytogenetics. It plays a crucial role in detecting aneuploidy and structural chromosomal abnormalities, including deletions, insertions and translocations. In this method, cells obtained from fresh tissues are cultured and chromosomes are pretreated with trypsin before being stained with Giemsa. Under a brightfeild microscope, chromosomes exhibit characteristic dark and light banding patterns. Regions with a high GC content (euchromatin) remain intact and appear light, whereas regions with a high AT content (heterochromatin) undergo denaturation by trypsin and appear dark [7].
R- banding produces a banding pattern inverse of G-banding, where dark regions are GC-rich, and light regions are AT-rich [4]. AT- rich regions have a lower melting point than GC-rich regions and undergo denaturation during incubation in a heated buffer prior to Giemsa staining, resulting in lighter bands in AT-rich areas [7]. R-banding is particularly useful for detecting chromosomal abnormalities located at the telomeres, including Jacobsen syndrome, which is characterized by a terminal deletion of chromosome 11q [8]. Furthermore, high- resolution banding techniques imply specific staining methods, such as Wright stain, which preferentially marks less supercoiled chromosomes in late prophase and promatphase [9]. High-resolution banding allows for the identification of a greater number of bands compared to conventional banding techniques, making it particularly useful for detecting chromosomal structural aberrations such as Prader-Willi syndrome, which involves submicroscopic deletions in the 15q11-q13 region [10].
The technical standards and guidelines established by the American College of Medical Genetics and Genomics (ACMG) delineate the procedures for processing and analyzing various types of clinical samples. Bone marrow, neoplastic blood, and solid tumor specimens can be examined using cytogenetic banding techniques [11,12]. Routine cytogenetics analysis typically requires approximately twenty metaphase cells; however, in cases where mosaicism is suspected, additional cells must be counted to enhance the sensitivity for detecting low- levels clones [13]. Advancements in cytogenetic methodologies, including the use of chemical agents to induce chromosome breakage, have significantly expanded our understanding of disease mechanisms [14]. The gold standard for the clinical diagnosis of Fanconi anaemia involves treating cells with diepoxybutane or mitomycin C to induce chromosomal breakage [15]. The diagnosis of Roberts syndrome can be established using G- or C-banding, which reveals centromere separation and heterochromatin abnormalities [16]. Furthermore, fragile sites within chromosomes can be induced using folic acid – deficient culture media and chemical agents such as aphidicolin and 5’-bromo-2’-deoxyuridine. These fragile sites, characterized by non-staining chromatin gaps, are named according to their chromosomal band location. The most clinically significant fragile sites associated with human disorders include FRAXA (fragile X syndrome) and FRAXE (fragile XE syndrome) [16].
Banding analysis provides critical information regarding chromosome number and structural integrity, enabling the study of single cells, detecting of mosaicism and assessment of clonal evolution. Additionally, this technique facilitates the identification of balanced and unbalanced chromosomal aberrations, including translocations, invasions, duplications and deletions [17,18]. However, complex chromosomal rearrangements, such as cryptic translocations, chained fusion events, chromothripsis, and chromoanasynthesis, cannot be accurately detected through banding analysis. Moreover, the technique relies on culturing fresh cells, which may introduce limitations, as abnormal cells often exhibit reduced proliferation rates, leading to their potential underrepresentation or undetectability. Furthermore, factors such as samples type, quality and preparation significantly influence the accuracy and reliability of abnormality detection [19].
Due to limited resolution of classical banding cytogenetics techniques in diagnosing chromosomal aberrations, Pardue and Gall 1969 developed a precise technique called in situ hybridization [20]. This technique enables the detection and localization of specific DNA or RNA sequences within cells or tissues using fluorescently labeled nucleic acid probes. Initially, radioactive isotopes were employed as markers; however, there were later replaced with fluorescence probes to enhance safety and efficiency in chromosomal labeling [21,22]. Today, fluorescence in situ hybridization (FISH) plays a pivotal role in cytogenetics diagnostic due to its numerous advantages, including high sensitivity and specificity, spatial resolution, multiplexing capabilities, applicability to a wide range of biological specimens (e.g., prenatal amniotic fluid, chorionic villi, peripheral blood, bone marrow and frozen or formalin-fixed paraffin- embedded tissues) and rapid turnaround time [23].
The FISH technique is performed through a series of steps, including sample preparation, labeling with fluorescent probes, washing, counterstaining with 4’,6-diamidino-2-phenylindole (DAPI), visualization using fluorescence microscopy and subsequent analysis, either manually or through software- based signal quantification. This analysis allows for precise measurement of signal intensity, localization and distribution within the nucleus [23,24].
FISH encompasses various techniques, each with specific clinical applications, including the detection of chromosomal abnormalities, gene rearrangements, and copy number variations. Interphase FISH is employed for the identification of chromosomal abnormalities and mosaicism. This technique provides rapid results as it does not require cell culture preparation, allowing for the analysis of a large number of cells within a single experiment [25]. Additionally, metaphase FISH is utilized for detecting balanced and unbalanced chromosomal aberrations. It can be combined with other cytogenetic techniques to facilitate a more comprehensive analysis of chromosomal abnormalities [25].
Locus- specific FISH is used to identify specific chromosomal aberrations within a targeted genomic region and is particularly useful for detecting deletions and duplications that are not identified through conventional banding techniques. This method is instrumental in diagnosing recurrent microdeletion and micro duplication syndromes, as well as in detecting cryptic rearrangements within telomere regions [25]. Another variant, whole chromosome painting (WCP), employs probes that hybridize along the entire length of a chromosome enabling the visualization of individual chromosomes and the identification of numerical and structural aberrations [26]. The integration of WPC with spectral karyotyping has enhanced the detection of complex chromosomal rearrangements; however, it has largely been superseded by advanced genomic technologies, including chromosomal microarray analysis (CMA), optical genome mapping (OGM) and next- generation sequencing (NGS) [27].
Copy number alterations (CNAs) in genomic DNA is associated with multiple human diseases specially cancer. Therefore, the identification of CNAs in cancer is primary objective of elucidating the mechanism of disease. Comparative genomic hybridization (CGH) is another cytogenetic technique that utilize two different fluorescently labeled genomic DNA samples to detect genome- wide copy number alterations. CGH was developed to overcome the limitations of spectral karyotyping, which requires metaphase cell cultivation. Several advance array platforms have been developed, including array CGH, single nucleotide polymorphism (SNP) arrays and a hybrid approach combining array CGH and SNP arrays. CMA is widely applied to various biological samples, including DNA extracted from blood, bone marrow, tissues, amniotic fluid, chorionic villi, embryonic cells, stored cell fractions and cultured samples. It is commonly used for diagnosis microdeletion and micro duplication syndromes. However, CMA is limited in that it can only detect copy number gains and losses without providing structural information about chromosomal rearrangements [28,29].
Optical genome mapping (OGM) is an emerging technique that enables the genome-wide detection of structural variants (SVs) using labeled ultra- high molecular weight (UHMW) DNA. This method preserves DNA integrity, minimizes fragmentation and facilitates the identification of SVs across large genomic regions. OGM relies on specific repetitive sequence motifs (CTTAAG), which occur approximately 15 times per 100 kb of genomic sequence, to label UHMW DNA [30]. Images captured from single- labeled DNA strands are utilized to generate denovo genome assemblies, which are then compared to a reference genome for the detection of SVs, including balanced and unbalanced translocations and inversions and insertions. Furthermore, OGM provides insights into gene disruption and altered long-range regulatory interactions, offering a valuable tool for comprehensive structural variant analysis [31].
In the rapidly evolving cytogenomics era, WGS is a revolutionary tool by enabling decoding of genetic life [32]. Combination of classical cytogenetics and modern genomics, it is the sequencing of an individual’s entire genome, including both protein-coding and non-protein coding regions detecting chromosomal abnormalities underlying genetic disorders, cancers, congenital conditions and even pathogenic diseases [32,33]. WGS offers an unparalleled resolution, enabling the detection of single-nucleotide variations, copy number changes, and complex structural rearrangements at a genome-wide scale.
Advanced Cytogenomics in Specific Diseases Like Brain and Cancer
Chromosomal abnormalities and clonal dysregulation can be detected through molecular cytogenetic analysis at the cellular level, whereas mutations and copy number alterations (CNAs) of cancer-related genes can be identified at the genomic level using cytogenomic techniques, such as array-based comparative genomic hybridization (array-CGH), single nucleotide polymorphism (SNP) arrays, and next-generation sequencing (NGS). Due to the increased availability, improved resolution, and cost-effectiveness of cytogenomic technologies, the detection of novel mutations and gene fusions associated with human cancer has become more efficient, thereby contributing to precision medicine and personalized cancer therapy. Key oncogenic mutations, such as BRAF and NRAS, have been identified as molecular targets in cutaneous melanoma [34], facilitating the development of targeted therapeutic strategies. Additionally, NGS technology enables the simultaneous detection of multiple genetic mutations and the analysis of circulating tumor cells (CTCs) and circulating tumor DNA (ctDNA) [2], providing a comprehensive genomic landscape of tumors. This approach offers several advantages, including non-invasiveness, early cancer detection, and real-time monitoring of tumor evolution and treatment response. Among molecular cytogenetics techniques, fluorescence in situ hybridization (FISH) remains a widely utilized diagnostic tool in oncology. It is routinely employed for the detection of HER2 gene amplification in breast cancer, BCR-ABL gene rearrangements in leukemias, and ALK-EML4 translocations in non-small cell lung carcinoma (NSCLC) [35]. Additionally, the UroVysion FISH assay has proven to be a clinically relevant tool for the detection and monitoring of bladder carcinoma [36].
The integration of cytogenomics and molecular cytogenetics has revolutionized cancer diagnostics by providing a comprehensive understanding of chromosomal abnormalities, gene mutations, and structural variations that drive tumorigenesis. While FISH-based techniques remain a gold standard for detecting specific gene rearrangements and amplifications, the advent of high-throughput cytogenomic technologies, such as array-CGH, SNP arrays, and NGS, has expanded the ability to identify novel oncogenic drivers, complex rearrangements, and tumor heterogeneity with unprecedented resolution. These advancements have been particularly impactful in brain and hematologic malignancies, where chromosomal instability and gene fusions play a pivotal role in disease progression. In glioblastoma (GBM), for example, cytogenomic profiling routinely identifies EGFR amplifications, PTEN deletions, and chromosome 7/10 aneuploidy, which are critical for tumor classification and targeted therapy selection. Similarly, in hematologic cancers, recurrent chromosomal translocations such as t(9;22) in chronic myeloid leukemia (CML) and t(15;17) in acute promyelocytic leukemia (APL) guide precision medicine approaches, including the use of tyrosine kinase inhibitors (TKIs) and retinoic acid-based therapies, significantly improving patient outcomes [37]. Beyond tumor tissue-based diagnostics, liquid biopsy-based cytogenomics is emerging as a powerful tool for real-time cancer monitoring and minimal residual disease (MRD) detection. The ability to analyze circulating tumor DNA (ctDNA) and circulating tumor cells (CTCs) using NGS, digital PCR, and epigenomic assays enables non-invasive tumor profiling, early relapse detection, and adaptive treatment strategies [38]. This approach is particularly relevant in highly aggressive cancers such as glioblastoma and triple-negative breast cancer, where genomic evolution under therapeutic pressure often leads to drug resistance and disease recurrence. Moreover, advancements in long-read sequencing, OGM, and artificial intelligence-driven cytogenomic analysis are refining mutation detection, structural variant analysis, and therapy response predictions. As these innovations continue to evolve, the synergy between molecular cytogenetics and cytogenomics will play a crucial role in enhancing cancer diagnostics, improving precision medicine strategies, and ultimately advancing personalized oncology.
Databases and Tools for the Visualization and Analysis of Cytogenomics Dataset
Cytogenomic data is sensitive, large and rapidly growing, where its efficient storage and quick retrieval is essential in carrying out further research. Databases serve the very purpose by keeping vast amounts of quality data in an organized manner and often with very specific purpose or type. Here we discuss popular databases categorized based on their focus areas.
Chromosomal Aberration and Karyotyping Databases
This category focuses on databases serving for chromosomal disorders, structural variations and karyotyping. DECIPHER (Database of Chromosomal Imbalance and Phenotype in Humans Using Ensembl Resources) [39] is a well-known database for chromosomal imbalance, CNVs and phenotype. It also has tools for the interpretation of submicroscopic chromosomal imbalance, inversions, and translocations. The database is fully integrated into Ensemble Genome browser and covers more than 50000 patients. The database cab be accessed at https://www.deciphergenomics.org/. Mitelman Database [40] is a repository of chromosomal aberrations and gene fusions in cancer. The database has been manually curated from the literature by Felix Mitelman in collaboration with Bertil Johansson and Fredrik Mertens. The database contains features like BigQuey and data analysis tools and visually interactive data browser. The database The database is supported by National Cancer Institute and the Swedish Cancer Society. The database is available at https://mitelmandatabase.isb-cgc.org/.
Copy Number Variation (CNV) & Structural Variant Databases
The primary focus area of these databases are copy number variations (CNVs), structural variants (SVs), and genomic rearrangements. dbVar [41] (https://www.ncbi.nlm.nih.gov/dbvar) is NCBI’s database known for housing clinical/common structural variations, CNVs and large deletions. DGV (Database of Genomic Variants) [42], it is a curated catalogue of human genomic variants focusing mainly on normal CNVs and SVs in the human population. The database has got its own genome browser and can be accessed at http://dgv.tcag.ca/. Currently DGV has over 75 studies covering more than 7 million CNVs at sample-level. The Genome Aggregation Database (GnomAD) [43], developed with the goal of aggregating and harmonizing both exome and genome sequencing data from a wide variety of large-scale sequencing projects. The current v4 version of database (GRCh38) provided spans 730,947 exomes, 1,199,117 SVs, 807,162 individuals and 76,215 whole-genome sequences. Gnomad database can be accessed at https://gnomad.broadinstitute.org/.
Cytogenomic Mutation and Specific Disease Databases
Databases under this category focus mainly on genomic information involved in genetic disorders, chromosomal syndromes and inherited mutations. OMIM (Online Mendelian Inheritance in Man) database is most popular and authoritative freely accessible database of human genes and phenotype. It covers over 16000 human genes. OMIM database can be accessed at https://www.omim.org. COSMIC database [44] from Welcome Sanger institute, UK, is a primary source for somatic mutations in cancer. The database has been expert curated from more than 29000 scientific literatures and has integrated tools for the interpretation and analysis of impact of somatic mutations on disease. COSMIC database can be accessed at https://www.cosmickb.org. TCGA (The Cancer Genome Atlas) database [45] is a revolutionary cancer genomics program which has molecularly characterized over 20000 primary cancer and matched normal samples covering 33 different cancer types. TCGA database has many useful tools and resources for cancer genomic data interpretation and analysis. Most popular tools are cBioPortal [46], which provides visualization, analysis and download of processed TCGA datasets. TCGA database can be accessed at https://www.cancer.gov/tcga. ClinVar [47] database is from NCBI, which harbors clinically relevant variants and their pathogenicity. ClinVar database has detailed reports of human variations classified for Mendelian diseases, cancer or drug responses. ClinVar can be accessed at https://www.ncbi.nlm.nih.gov/clinvar. Orphanet (https://www.orpha.net/) [48] is a unique resource for improving knowledge on rare diseases. Currently the database covers 4462 genes and 6417 diseases. The database was established by INSERM (French National Institute for Health and Medical Research), France in 1997.
Popular Variant Calling Tools
GATK (Genome Analysis Toolkit)
GATK [49] is a popular open source software suite developed by Broad Institute for analyzing high-throughput sequencing data (HTS), specifically optimized for variant discovery and genotyping in RNA-Seq, Whole Exome Sequencing (WES), and Whole Genome Sequencing (WGS) datasets. GATK pipeline performs quality control on raw FASTQ sequencing reads through FASTQC and uses BWA-MEM algorithm for read alignment to the reference genome. HaplotypeCaller from GATK detects SNVs and small indels from the aligned BAM files. For identifying tumor specific mutations, GATK uses Mutect2 and GATK-SV for analyzing structural variants or large chromosomal rearrangements. GATK does Variant Quality Score Recalibration (VSQR) and employs ML based variant ranking. GATK uses GenotypeGVCFs and GenomicsDBImport tools for multi-sample variant calling. GATK can be accessed at https://gatk.broadinstitute.org/.
DeepVariant
DeepVariant [50] is another popular open-source deep learning-based variant caller developed by Google DeepMind. It uses convolutional neural network (CNN) to accurately detect SNVs and Insertions/Deletions (Indels) from high-throughput sequencing (HTS) data. It uses GATK to generate potential variant positions, then converting candidate regions into image tensors. DeepVariant prediction model is trained on high-confidence variant calls from the Genome in a Bottle (GIAB) project, which classifies each pileup image tensor into variants. DeepVariant achieved higher accuracy than traditional tools like HaplotypeCaller or FreeBayes. DeepVariant pipeline is automatic, which eliminates need for manual thresholding/tuning (like in GATK) and is optimized for GPU acceleration for large WGS datasets. Further details of the DeepVariant can be accessed at https://google.github.io/deepvariant/.
Samtools
Samtools [51] is a must have tool for genomics, where generated aligned raw read (SAM/CRAM/BAM) file is analyzed for alignment statistics, calling variants or manipulating HTS files. Samtools has programs for sorting according to genomic coordinates before variant calling as well as produces index file for rapid access to reads. Samtools has a pileup-based variant calling algorithm along with quality control methods such as filtering unmapped reads, extracting high quality reads and even retrieving only reads mapping to specific chromosomes.
Open sourced Samtools can be accessed at https://www.htslib.org/.
Genome Browsers and Popular Visualization Tools
Beside useful databases there are very popular genome browsers (Table 1), which help in base-level visualization and analysis of human chromosomes as well as genes. Unlike traditional databases that store raw genomic sequences, genome browsers integrate sequencing data with functional annotations, enabling efficient navigation through large-scale genomic datasets. These are mainly UCSC (https://genome.ucsc.edu) [52], which provides visualization and annotation for not only human assemblies but also viral genomes like SARS-CoV2; Ensembl [53] and NCBI Genome browsers (https://www.ncbi.nlm.nih.gov/gdv), which covers mostly eukaryotic genome assemblies, which provides interactive platform for cytogeneticists to study genomic variations, gene location and chromosomal architecture.

Table 1.
A comparative summary of discussed genomic browsers and visualization tools.
| Tool | Applications | Limitations |
|---|---|---|
| UCSC Genome Browser | Comparative genomics and GWAS | Limited support for private datasets |
| Ensemble genome browser | Functional genomics and variant annotation and prioritization | Computationally expensive, some features also require scripting |
| NCBI Genome Data Viewer | Clinical cytogenetics, Human reference genome analysis and gene expression studies | Limited visualization compared to UCSC and Ensembl |
| CytoScape | Chromosomal interaction studies and structural variation visualization | More suited for network analysis than full genome visualization |
| IGV | SV, CNV and chromosomal aberration visualization | High memory usage, not ideal for comparative genomics |
| Circos | Cancer genomics and chromosome mapping | Limited automation(no inbuilt GUI) and less interactivity |
| ChromoPainter | Population genetics and evolutionary studies | Requires preprocessed data and parameter tuning is challenging |
Apart from popular genome browsers, other open source web-app based genomic browsers enable targeted cytogenomic studies leading to more specialized research opportunities. Tools like CytoScape [54] which is developed for visualizing complex molecular interactions networks and cytogenetic data. Integrative Genomic Viewer (IGV) [55] is a high-performance tool supporting large scale WGS and transcriptomic datasets. Circos [56], a circular-layout visualization tool for representing structural variants, CNVs and interaction between chromosomal regions. ChromoPainter [57], used for visualizing ancestral chromosomal segments and haplotype sharing across populations.
Cytogenomics Data Analysis Tools
Cytogenomics has evolved significantly with the integration of computational tools, improving analysis of chromosomal structural changes and base level genomic variations. Advanced cytogenomic tools also termed as systems cytogenomics certainly help in development and applicability of chromosome research [58], through identification of structural variants, chromosomal abnormalities, and pathway-based analysis. This section reviews key platforms and softwares used in cytogenomics data analysis, categorized by their primary functions in Karyotyping, FISH or array based.
Karyotyping is visual representation of a chromosome by producing images of it after a series of processes. Chromosomal anomalies like the length of the chromosomes, position of centromeres, banding patterns, and the difference in sex chromosomes are the underlying cause of numerous diseases in humans like Down’s Syndrome, Cystic Fibrosis and even Cancer. With advancing soft technologies various platforms are built to enhance analysis of chromosome images. Conventional measurement of metaphase chromosomal spread and transforming data into table was a very slow and complex process, requiring multiple photographic steps, manual statistical analysis and drawing of images. There had been multiple attempts since several decades ago to automate this process through computer programs or tools to facilitate accurate karyotype analysis [59,60,61,62,63,64,65,66,67]. However, these tools became outdated due to technological advances and computer infrastructure or did not update for many years. Here we describe in details tools which are actively updated and currently usable (Figure 1, Table 2).
Figure 1.
Current popular tools for Cytogenomic data analysis.
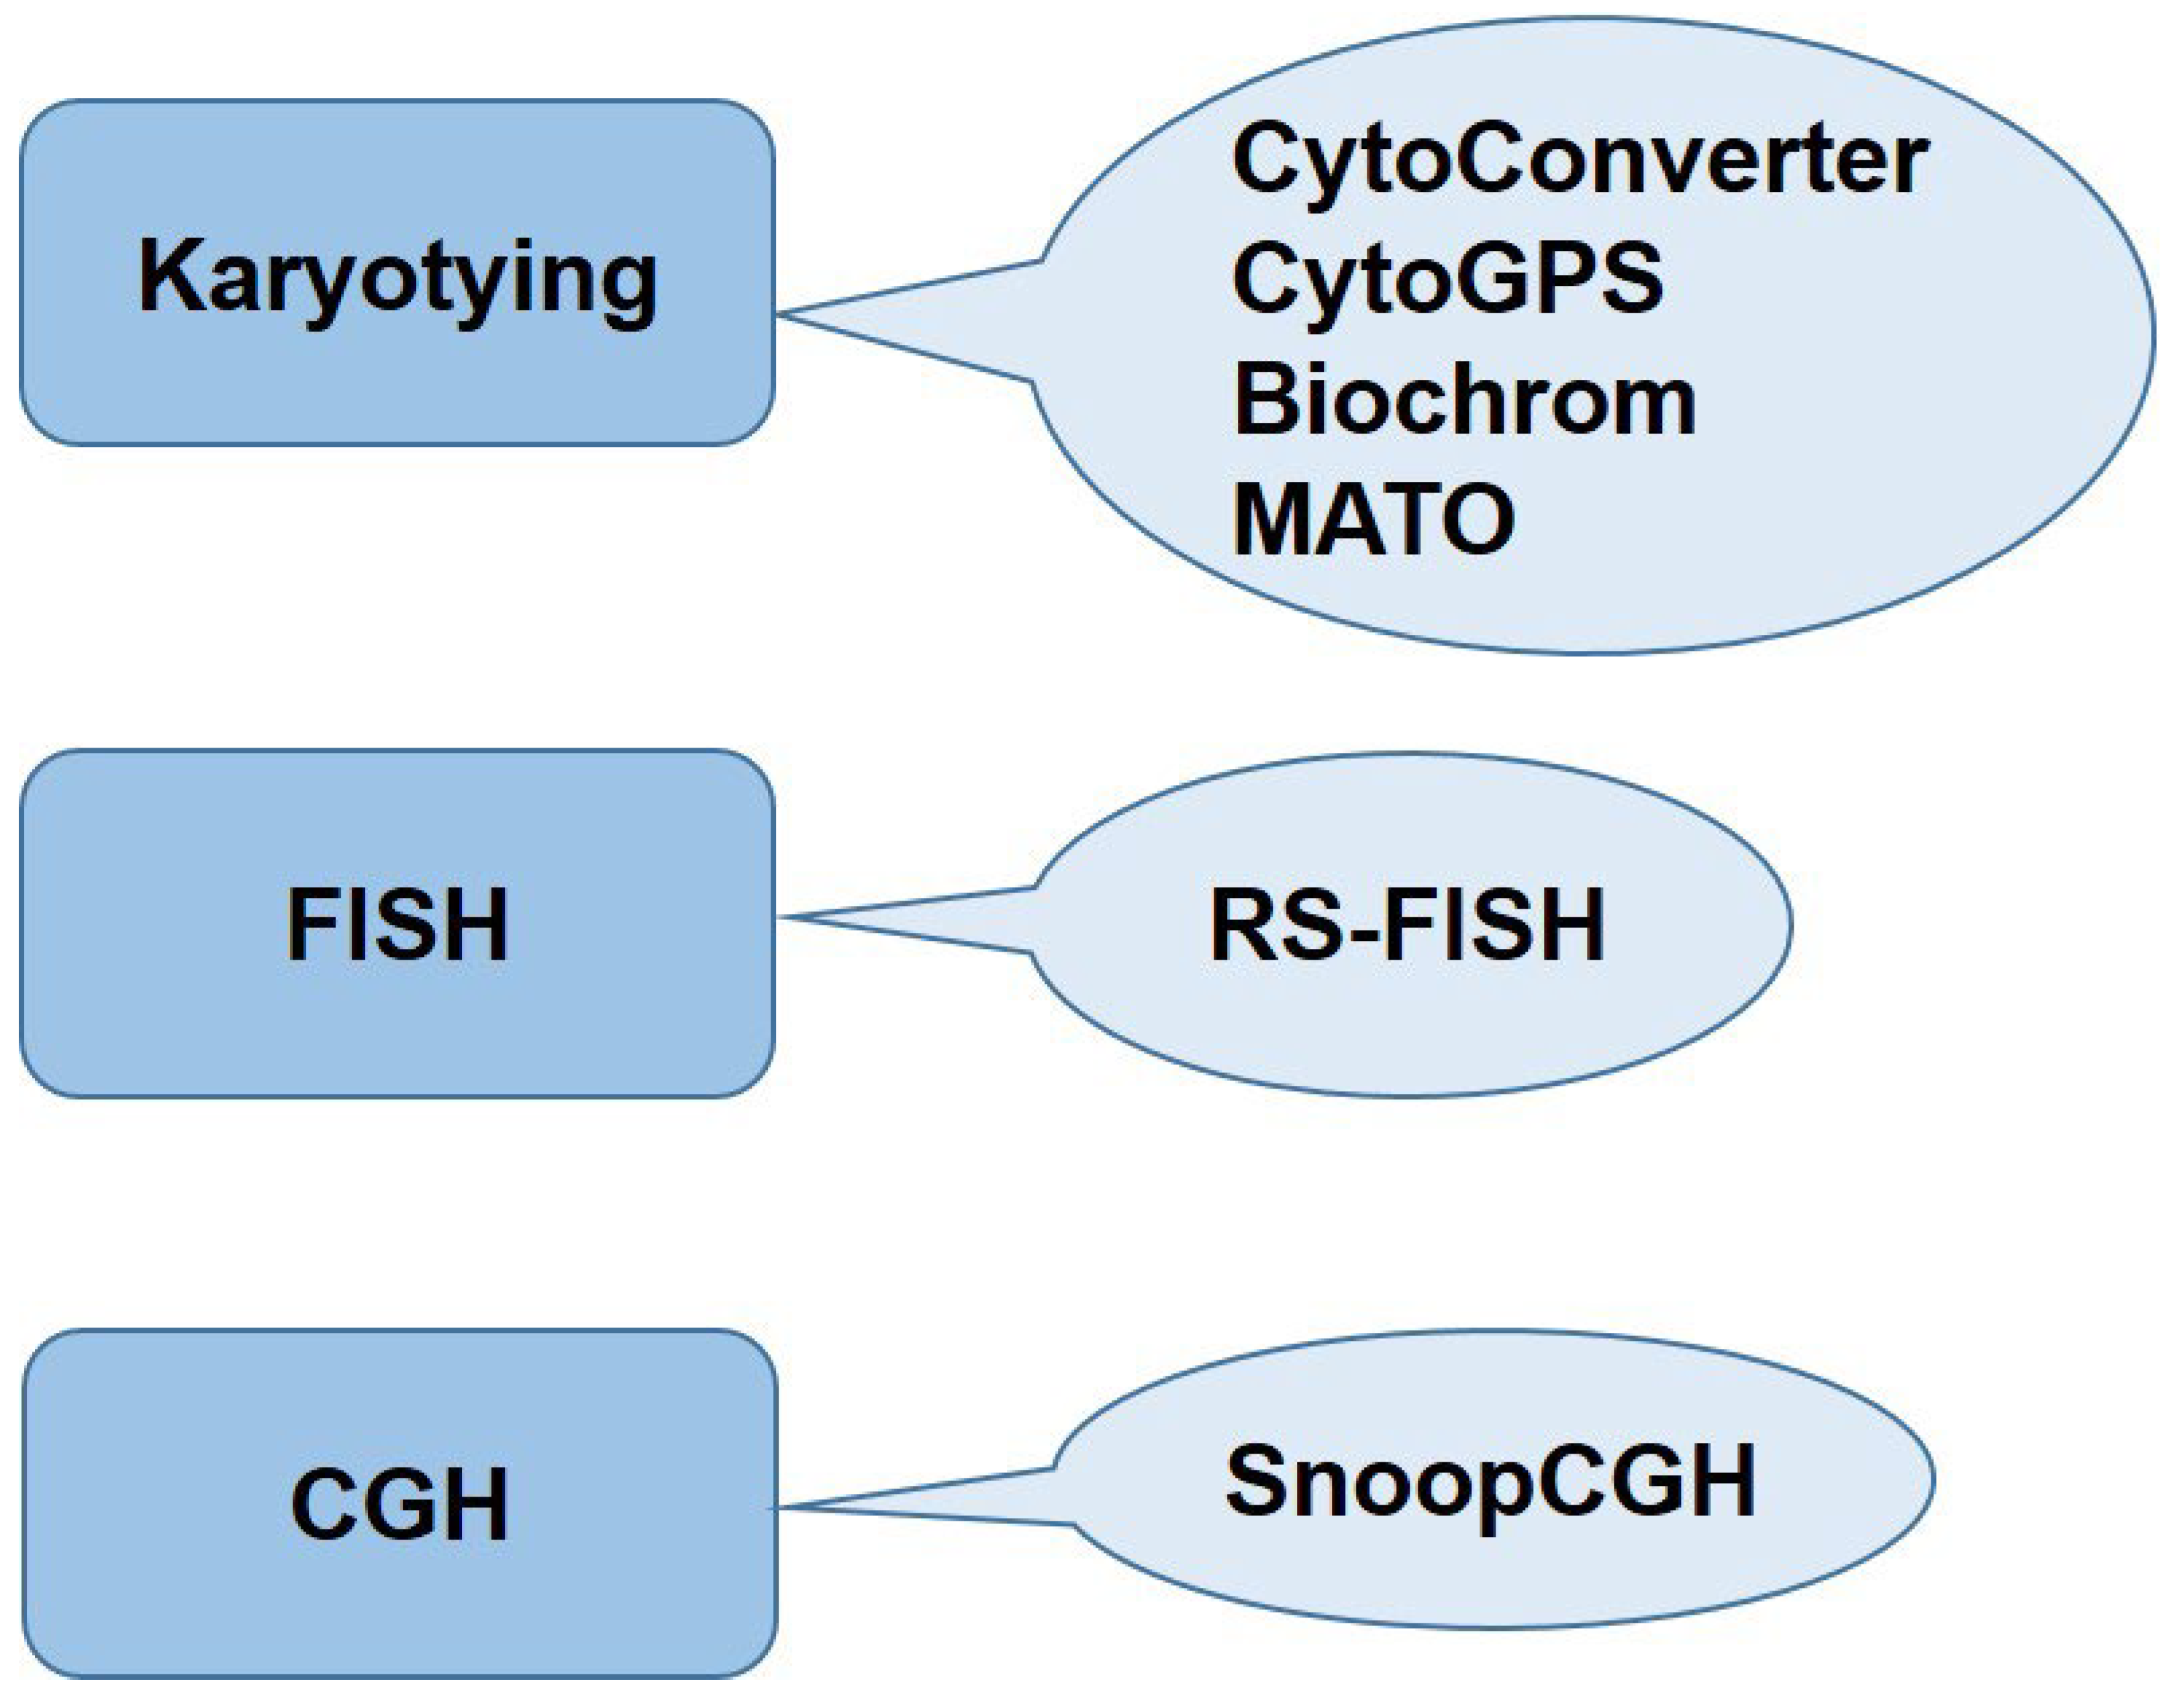
Table 2.
Comparative summary of selected tools for Karyotyping.
| Tool | Language/ Implementation |
Features | Applications |
|---|---|---|---|
| MATO/KaryoType | VB .NET framework Windows and MAC as well as Github source code |
Karyotype characterization and chromosome measurement | Plant and animal cytogenetics for measuring chromosome lengths, ideogram construction, evolutionary studies. |
| CytoConverter | Web based and R-package | Karyotype conversion into genomic coordinates, reporting net gain and loss of genetic material | Clinical genetics, Cancer research and Precise mapping of chromosomal aberrations |
| CytoGPS | Grammar Parser with Antlr. Web based, RCytoGPS (R version) |
Parses ISCN-based karyotype into machine readable text | Detection of complex structural variations, Personalized medication |
| Biochrom | Javascript, Web based, Image Processing and Deep Learning |
Downstream chromosome segmentation and classification | Prenatal diagnostics, automated detection of chromosomal abnormalities in fetal screening, rare genetic syndromes, and tumor cytogenetics. |
CytoConverter
Whole Chromosome or segment gain or loss leads to multiple human disease (syndrome) or cancer. Karyotyping based on banding pattern, identifies locations of microscopic level changes such as translocation, larger deletion and duplication events. However, since early 2000 with the completion of human genome sequence, researchers are able to identify chromosomal aberrations in terms of genomic coordinates. A similar tool, CyDAS [68] characterizes the chromosomal aberration from cytogenetic nomenclature, but the tool is not updated since 2004. More updated tool, CytoConverter [69] is developed on the existing challenges of cytogenetic nomenclature which are used to describe chromosomal aberration in a collection of cells. This tool bridges this very gap by converting karyotypes into genomic coordinates supplemented by the number of cells involved in each aberration if demanded. CytoConverter also produces graphical representation, detailing areas of gains and losses of chromosomes and chromosomal segments.
CytoConverter is programmed in R accepting karyotype strings or tab-delimited tables (first column must have sample names while second column as karyotype) and follows the cytogenetic nomenclature of ISCN 2016. CytoConverter outputs losses and gains, labelled by sample name, in hg19, GRCh38 and also hg18 coordinates. If cell count is provided in the input karyotype, CytoConverter reports the cell wise distribution for each aberration along with the total number of cells in the sample. Although this tool analyzes the samples where higher-resolution copy number data is not available, but this tool does not report balanced translocations or inversion events. Cytoconverter is available as web-based application at https://jxw773.shinyapps.io/Cytogenetic__software.
CytoGPS
ISCN coded karyotype data is a text based standard format which is mostly human readable but not machine readable. Karyotype stores the information or events regrading cytogenetic abnormalities located on specific chromosomal band. The CytoGPS [70] tool translates this even-location pair using a grammar set designing systems knowns as Antlr into a binary model, which represents losses, gains and fusion (LGF) events. Each LGF event is represented separately for each band. CytoGPS is web based tool where each chromosome is represented horizontally while each cytogenetic band is shown vertically. Recently a R version, RCytoGPS [71] developed, which is more adaptable to downstream computational pipelines. RcytoGPS takes JSON output generated by CytoGPS and convert this into a R object, which facilitate further downstream analysis and visualization. CytoGPS is available at http://cytogps.org/.
Biochrom
Biochrom [72] is another web-based tool, which has both manual and automated functions for chromosomal segmentation and classification. It is based on deep learning technique, which takes less computational time during image processing. The deep learning model is trained on 612 metaphase images with 48 having chromosomal aberration. Biochrom is an upgrade to conventional method like MetaSel [73] in terms of manual interactions and processing time. MetaSel was originally developed to select suitable metaphase chromosome spreads, which was considered a major bottleneck in traditional cytogenetics. MetaSel had major chromosomal editing functions like split, merge and fix with a karyotyping editor.
MATO
An updated and renamed tool MATO (Measurement and Analysis Tool) [74], previously known as KaryoType [75], originally developed to study plant chromosomes. It allows efficient chromosome measurements and karyotype analysis from microphotographs. Chromosomal characterization is performed based on the number, size, arm ratio, centromeric index, relative lengths, angle, count and color. The tool offers automatic chromosome grouping based on quantitative traits. MATO is user friendly to run on Windows and Mac OSX with free source distribution at github https://github.com/sculab/MATO.
RS-FISH
RS-FISH (Radial Symmetry FISH) [76] is a user-friendly software to address the challenging task of detecting fluorescent spots in two- and three-dimensional microscopy images. It offers interactive parameter tuning and capable of processing large datasets of multiple samples using distributed parallelization on workstations, clusters, or the cloud. RS-FISH maintains lower localization error and high detection accuracy across a wide range of signal-to-noise ratios, a primary feature for spatial genomics applications and single-molecule FISH.
The RS-FISH software is written in Java, which supports wide range of parameters allowing the user to adjust it to the microscope settings. RS-FISH accepts all image data formats supported by another popular biological image processing tool, Fiji [77] and BioFormats (https://github.com/ome/bioformats). Large images should be stored in the N5/Zarr format if doing parallelization with Spark. RS-FISH is able to detect spots more precisely because it allows careful, interactive parameter selection, however its accuracy drops if there is high noise in images.
SnoopCGH
SnoopCGH [78] is a java-based standalone application that accepts CGH data in tab, space or comma separated format. The columns should have chromosome number, probe name, probe starting and end positions, and a series of log intensity values corresponding to one or more comparisons or samples. Its functionality includes assessment of data quality, normalization, detection of SVs and integration of useful annotation of features. It has implemented SV breakpoint analysis methods and enable the rapid visualization and dissection of putative SV regions. SnoopCGH can be accessed at https://snoopcgh.sourceforge.net/.
Beside these there are commercial products for karyotype and advanced cytogenomic analysis which are often sold together with the laboratory’s genetic imaging and analysis systems [79]. These commercial softwares are built for PC desktop platform connected with microscope, which requires a technologist or cytogeneticist to stay in the laboratory during the experiment. Few examples of these commercial products are CytoGenomics Software by Agilent, MetaClass by Microptic, ArgusSoft, HiBand by Applied Spectral Imaging, GenASIs FISHview by DSS and Ikaros, Metafer, ISIS by Metasystems.
Conclusions
Although current cytogenomics tools and databases provide robust platforms for visualization, and analyzing chromosomal abnormalities, yet they lack in interoperability and standardization. Another key challenge lies in integrating multi-model data (e.g., WGS, karyotyping, CNV arrays) into unified, clinically actionable framework, which can prove valuable in real time genetic problems of the world. Furthermore, tools for variant identification are still very complex and require high technical skills where many tools still lack intuitive interfaces and automated variant interpretation. This should be fulfilled with more optimized development and better use of modern technology. Future advancements in this field should focus on real-time data sharing, enhanced user-centric platforms and AI-driven harmonization for precision cytogenomics.
References
- Akkari, Y.M.N.; Baughn, L.B.; Dubuc, A.M.; Smith, A.C.; Mallo, M.; Dal Cin, P.; Diez Campelo, M.; Gallego, M.S.; Granada Font, I.; Haase, D.T.; et al. Guiding the global evolution of cytogenetic testing for hematologic malignancies. Blood 2022, 139, 2273–2284. [Google Scholar] [CrossRef] [PubMed]
- Ribeiro, I.P.; Melo, J.B.; Carreira, I.M. Cytogenetics and Cytogenomics Evaluation in Cancer. Int J Mol Sci 2019, 20. [Google Scholar] [CrossRef] [PubMed]
- Ferguson-Smith, M.A. History and evolution of cytogenetics. Mol Cytogenet 2015, 8, 19. [Google Scholar] [CrossRef] [PubMed]
- Richer, C.L.; Murer-Orlando, M.; Drouin, R. R-banding of human chromosomes by heat denaturation and Giemsa staining after amethopterin-synchronization. Can J Genet Cytol 1983, 25, 261–269. [Google Scholar] [CrossRef]
- Huang, H.; Chen, J. Chromosome Bandings. Methods Mol Biol 2017, 1541, 59–66. [Google Scholar] [CrossRef]
- Liehr, T. International System for Human Cytogenetic or Cytogenomic Nomenclature (ISCN): Some Thoughts. Cytogenet Genome Res 2021, 161, 223–224. [Google Scholar] [CrossRef]
- Robinson, A. Proposed standard system of nomenclature of human mitotic chromosomes. N Engl J Med 1960, 262, 1245–1246. [Google Scholar] [CrossRef]
- Wegner, R.-D. Diagnostic cytogenetics; Springer Science & Business Media: 2013.
- Yunis, J.J. High resolution of human chromosomes. Science 1976, 191, 1268–1270. [Google Scholar] [CrossRef]
- Hassan, M.; Butler, M.G. Prader-Willi syndrome and atypical submicroscopic 15q11-q13 deletions with or without imprinting defects. Eur J Med Genet 2016, 59, 584–589. [Google Scholar] [CrossRef]
- Cooley, L.D.; Morton, C.C.; Sanger, W.G.; Saxe, D.F.; Mikhail, F.M. Section E6.5-6.8 of the ACMG technical standards and guidelines: chromosome studies of lymph node and solid tumor-acquired chromosomal abnormalities. Genet Med 2016, 18, 643–648. [Google Scholar] [CrossRef]
- Mikhail, F.M.; Heerema, N.A.; Rao, K.W.; Burnside, R.D.; Cherry, A.M.; Cooley, L.D. Section E6.1-6.4 of the ACMG technical standards and guidelines: chromosome studies of neoplastic blood and bone marrow-acquired chromosomal abnormalities. Genet Med 2016, 18, 635–642. [Google Scholar] [CrossRef] [PubMed]
- Cherry, A.M.; Akkari, Y.M.; Barr, K.M.; Kearney, H.M.; Rose, N.C.; South, S.T.; Tepperberg, J.H.; Meck, J.M. Diagnostic cytogenetic testing following positive noninvasive prenatal screening results: a clinical laboratory practice resource of the American College of Medical Genetics and Genomics (ACMG). Genet Med 2017, 19, 845–850. [Google Scholar] [CrossRef] [PubMed]
- Varon R, D.I., Chrzanowska KH. Nijmegen Breakage Syndrome. 1999 May 17 [Updated 2023 Nov 30]. In: Adam MP, Feldman J, Mirzaa GM, et al., editors. GeneReviews. GeneReviews [Internet]. Seattle (WA): University of Washington, Seattle 1993.
- Taylor, A.M. Chromosome instability syndromes. Best Pract Res Clin Haematol 2001, 14, 631–644. [Google Scholar] [CrossRef] [PubMed]
- Sutherland, G.R.; Baker, E. The clinical significance of fragile sites on human chromosomes. Clin Genet 2000, 58, 157–161. [Google Scholar] [CrossRef]
- Bridge, J.A. Advantages and limitations of cytogenetic, molecular cytogenetic, and molecular diagnostic testing in mesenchymal neoplasms. J Orthop Sci 2008, 13, 273–282. [Google Scholar] [CrossRef]
- Vajen, B.; Hanselmann, S.; Lutterloh, F.; Kafer, S.; Espenkotter, J.; Beening, A.; Bogin, J.; Schlegelberger, B.; Gohring, G. Classification of fluorescent R-Band metaphase chromosomes using a convolutional neural network is precise and fast in generating karyograms of hematologic neoplastic cells. Cancer Genet 2022, 260-261, 23–29. [Google Scholar] [CrossRef]
- Walter, W.; Haferlach, C.; Nadarajah, N.; Schmidts, I.; Kuhn, C.; Kern, W.; Haferlach, T. How artificial intelligence might disrupt diagnostics in hematology in the near future. Oncogene 2021, 40, 4271–4280. [Google Scholar] [CrossRef]
- Pardue, M.L.; Gall, J.G. Molecular hybridization of radioactive DNA to the DNA of cytological preparations. Proc Natl Acad Sci U S A 1969, 64, 600–604. [Google Scholar] [CrossRef]
- Pinkel, D.; Straume, T.; Gray, J.W. Cytogenetic analysis using quantitative, high-sensitivity, fluorescence hybridization. Proc Natl Acad Sci U S A 1986, 83, 2934–2938. [Google Scholar] [CrossRef]
- Riegel, M. Human molecular cytogenetics: From cells to nucleotides. Genet Mol Biol 2014, 37 (Suppl. 1), 194–209. [Google Scholar] [CrossRef]
- Shakoori, A.R. Fluorescence In Situ Hybridization (FISH) and Its Applications. Chromosome Structure and Aberrations 2017, 343–367. [Google Scholar] [CrossRef]
- Jensen, E. Technical review: In situ hybridization. Anat Rec (Hoboken) 2014, 297, 1349–1353. [Google Scholar] [CrossRef] [PubMed]
- Yi Ning, A.R. , Smith, A. C. M., Macha, M., Precht, K., Riethman, H., Ledbetter, D. H., Flint, J., Horsley, S., Regan, R., Kearney, L., Knight, S., Kvaloy, K., & Brown, W. R. A. A complete set of human telomeric probes and their clinical application. National Institutes of Health and Institute of Molecular Medicine collaboration. Nat Genet 1996, 14, 86–89. [Google Scholar] [CrossRef]
- Ried, T.; Schrock, E.; Ning, Y.; Wienberg, J. Chromosome painting: a useful art. Hum Mol Genet 1998, 7, 1619–1626. [Google Scholar] [CrossRef]
- Bayani, J.; Squire, J.A. Advances in the detection of chromosomal aberrations using spectral karyotyping. Clin Genet 2001, 59, 65–73. [Google Scholar] [CrossRef]
- Bejjani, B.A.; Shaffer, L.G. Clinical utility of contemporary molecular cytogenetics. Annu Rev Genomics Hum Genet 2008, 9, 71–86. [Google Scholar] [CrossRef]
- Nazaryan-Petersen, L.; Eisfeldt, J.; Pettersson, M.; Lundin, J.; Nilsson, D.; Wincent, J.; Lieden, A.; Lovmar, L.; Ottosson, J.; Gacic, J.; et al. Replicative and non-replicative mechanisms in the formation of clustered CNVs are indicated by whole genome characterization. PLoS Genet 2018, 14, e1007780. [Google Scholar] [CrossRef]
- Suttorp, J.; Luhmann, J.L.; Behrens, Y.L.; Gohring, G.; Steinemann, D.; Reinhardt, D.; Neuhoff, N.V.; Schneider, M. Optical Genome Mapping as a Diagnostic Tool in Pediatric Acute Myeloid Leukemia. Cancers (Basel) 2022, 14. [Google Scholar] [CrossRef]
- Sahajpal, N.S.; Mondal, A.K.; Fee, T.; Hilton, B.; Layman, L.; Hastie, A.R.; Chaubey, A.; DuPont, B.R.; Kolhe, R. Clinical Validation and Diagnostic Utility of Optical Genome Mapping in Prenatal Diagnostic Testing. J Mol Diagn 2023, 25, 234–246. [Google Scholar] [CrossRef]
- Forde, B.M.; Bergh, H.; Cuddihy, T.; Hajkowicz, K.; Hurst, T.; Playford, E.G.; Henderson, B.C.; Runnegar, N.; Clark, J.; Jennison, A.V.; et al. Clinical Implementation of Routine Whole-genome Sequencing for Hospital Infection Control of Multi-drug Resistant Pathogens. Clin Infect Dis 2023, 76, e1277–e1284. [Google Scholar] [CrossRef]
- Kim, R.; Kim, S.; Oh, B.B.; Yu, W.S.; Kim, C.W.; Hur, H.; Son, S.Y.; Yang, M.J.; Cho, D.S.; Ha, T.; et al. Clinical application of whole-genome sequencing of solid tumors for precision oncology. Exp Mol Med 2024, 56, 1856–1868. [Google Scholar] [CrossRef] [PubMed]
- Mody, R.J.; Wu, Y.M.; Lonigro, R.J.; Cao, X.; Roychowdhury, S.; Vats, P.; Frank, K.M.; Prensner, J.R.; Asangani, I.; Palanisamy, N.; et al. Integrative Clinical Sequencing in the Management of Refractory or Relapsed Cancer in Youth. JAMA 2015, 314, 913–925. [Google Scholar] [CrossRef] [PubMed]
- Das, K.; Tan, P. Molecular cytogenetics: recent developments and applications in cancer. Clin Genet 2013, 84, 315–325. [Google Scholar] [CrossRef] [PubMed]
- Dimashkieh, H.; Wolff, D.J.; Smith, T.M.; Houser, P.M.; Nietert, P.J.; Yang, J. Evaluation of urovysion and cytology for bladder cancer detection: a study of 1835 paired urine samples with clinical and histologic correlation. Cancer Cytopathol 2013, 121, 591–597. [Google Scholar] [CrossRef]
- Balciuniene, J.; Ning, Y.; Lazarus, H.M.; Aikawa, V.; Sherpa, S.; Zhang, Y.; Morrissette, J.J.D. Cancer cytogenetics in a genomics world: Wedding the old with the new. Blood Rev 2024, 66, 101209. [Google Scholar] [CrossRef]
- Honore, N.; Galot, R.; van Marcke, C.; Limaye, N.; Machiels, J.P. Liquid Biopsy to Detect Minimal Residual Disease: Methodology and Impact. Cancers (Basel) 2021, 13. [Google Scholar] [CrossRef]
- Firth, H.V.; Richards, S.M.; Bevan, A.P.; Clayton, S.; Corpas, M.; Rajan, D.; Van Vooren, S.; Moreau, Y.; Pettett, R.M.; Carter, N.P. DECIPHER: Database of Chromosomal Imbalance and Phenotype in Humans Using Ensembl Resources. Am J Hum Genet 2009, 84, 524–533. [Google Scholar] [CrossRef]
- Mitelman F, J.B.a.M.F.E. Mitelman Database of Chromosome Aberrations and Gene Fusions in Cancer. 2025.
- Sayers, E.W.; Beck, J.; Bolton, E.E.; Bourexis, D.; Brister, J.R.; Canese, K.; Comeau, D.C.; Funk, K.; Kim, S.; Klimke, W.; et al. Database resources of the National Center for Biotechnology Information. Nucleic Acids Res 2021, 49, D10–D17. [Google Scholar] [CrossRef]
- MacDonald, J.R.; Ziman, R.; Yuen, R.K.; Feuk, L.; Scherer, S.W. The Database of Genomic Variants: a curated collection of structural variation in the human genome. Nucleic Acids Res 2014, 42, D986–992. [Google Scholar] [CrossRef]
- Karczewski, K.J.; Francioli, L.C.; Tiao, G.; Cummings, B.B.; Alfoldi, J.; Wang, Q.; Collins, R.L.; Laricchia, K.M.; Ganna, A.; Birnbaum, D.P.; et al. The mutational constraint spectrum quantified from variation in 141,456 humans. Nature 2020, 581, 434–443. [Google Scholar] [CrossRef]
- Sondka, Z.; Dhir, N.B.; Carvalho-Silva, D.; Jupe, S.; Madhumita; McLaren, K.; Starkey, M.; Ward, S.; Wilding, J.; Ahmed, M.; et al. COSMIC: a curated database of somatic variants and clinical data for cancer. Nucleic Acids Res 2024, 52, D1210–D1217. [CrossRef]
- Tomczak, K.; Czerwinska, P.; Wiznerowicz, M. The Cancer Genome Atlas (TCGA): an immeasurable source of knowledge. Contemp Oncol (Pozn) 2015, 19, A68–77. [Google Scholar] [CrossRef] [PubMed]
- Gao, J.; Aksoy, B.A.; Dogrusoz, U.; Dresdner, G.; Gross, B.; Sumer, S.O.; Sun, Y.; Jacobsen, A.; Sinha, R.; Larsson, E.; et al. Integrative analysis of complex cancer genomics and clinical profiles using the cBioPortal. Sci Signal 2013, 6, pl1. [Google Scholar] [CrossRef] [PubMed]
- Landrum, M.J.; Chitipiralla, S.; Brown, G.R.; Chen, C.; Gu, B.; Hart, J.; Hoffman, D.; Jang, W.; Kaur, K.; Liu, C.; et al. ClinVar: improvements to accessing data. Nucleic Acids Res 2020, 48, D835–D844. [Google Scholar] [CrossRef]
- Weinreich, S.S.; Mangon, R.; Sikkens, J.J.; Teeuw, M.E.; Cornel, M.C. [Orphanet: a European database for rare diseases]. Ned Tijdschr Geneeskd 2008, 152, 518–519. [Google Scholar]
- DePristo, M.A.; Banks, E.; Poplin, R.; Garimella, K.V.; Maguire, J.R.; Hartl, C.; Philippakis, A.A.; del Angel, G.; Rivas, M.A.; Hanna, M.; et al. A framework for variation discovery and genotyping using next-generation DNA sequencing data. Nat Genet 2011, 43, 491–498. [Google Scholar] [CrossRef]
- Poplin, R.; Chang, P.C.; Alexander, D.; Schwartz, S.; Colthurst, T.; Ku, A.; Newburger, D.; Dijamco, J.; Nguyen, N.; Afshar, P.T.; et al. A universal SNP and small-indel variant caller using deep neural networks. Nat Biotechnol 2018, 36, 983–987. [Google Scholar] [CrossRef]
- Danecek, P.; Bonfield, J.K.; Liddle, J.; Marshall, J.; Ohan, V.; Pollard, M.O.; Whitwham, A.; Keane, T.; McCarthy, S.A.; Davies, R.M.; et al. Twelve years of SAMtools and BCFtools. Gigascience 2021, 10. [Google Scholar] [CrossRef]
- Raney, B.J.; Barber, G.P.; Benet-Pages, A.; Casper, J.; Clawson, H.; Cline, M.S.; Diekhans, M.; Fischer, C.; Navarro Gonzalez, J.; Hickey, G.; et al. The UCSC Genome Browser database: 2024 update. Nucleic Acids Res 2024, 52, D1082–D1088. [Google Scholar] [CrossRef]
- Newman, V.; Moore, B.; Sparrow, H.; Perry, E. The Ensembl Genome Browser: Strategies for Accessing Eukaryotic Genome Data. Methods Mol Biol 2018, 1757, 115–139. [Google Scholar] [CrossRef]
- Ono, K.; Fong, D.; Gao, C.; Churas, C.; Pillich, R.; Lenkiewicz, J.; Pratt, D.; Pico, A.R.; Hanspers, K.; Xin, Y.; et al. Cytoscape Web: bringing network biology to the browser. Nucleic Acids Res 2025. [Google Scholar] [CrossRef]
- Thorvaldsdottir, H.; Robinson, J.T.; Mesirov, J.P. Integrative Genomics Viewer (IGV): high-performance genomics data visualization and exploration. Brief Bioinform 2013, 14, 178–192. [Google Scholar] [CrossRef] [PubMed]
- Krzywinski, M.; Schein, J.; Birol, I.; Connors, J.; Gascoyne, R.; Horsman, D.; Jones, S.J.; Marra, M.A. Circos: an information aesthetic for comparative genomics. Genome Res 2009, 19, 1639–1645. [Google Scholar] [CrossRef] [PubMed]
- Lawson, D.J.; Hellenthal, G.; Myers, S.; Falush, D. Inference of population structure using dense haplotype data. PLoS Genet 2012, 8, e1002453. [Google Scholar] [CrossRef] [PubMed]
- Iourov, I.Y.; Vorsanova, S.G.; Yurov, Y.B. Systems Cytogenomics: Are We Ready Yet? Curr Genomics 2021, 22, 75–78. [Google Scholar] [CrossRef]
- Mirzaghaderi, G.; and Marzangi, K. IdeoKar: an ideogram constructing and karyotype analyzing software. Caryologia 2015, 68, 31–35. [Google Scholar] [CrossRef]
- Armstrong, K.C.; Craig, I.L.; Merritt, C. Hordeum chilense (2n = 14) computer-assisted Giemsa karyotypes. Genome 1987, 29, 683–688. [Google Scholar] [CrossRef]
- Green, D.M.; Myers, P.Z.; Reyna, D.L. CHROMPAC III: an improved package for microcomputer-assisted analysis of karyotypes. J Hered 1984, 75, 143. [Google Scholar] [CrossRef]
- McGurk, J.; Rivlin, K. A BASIC computer program for chromosome measurement and analysis. Journal of Heredity 1983, 74, 304–304. [Google Scholar] [CrossRef]
- Gilbert, C.W. A computer programme for the analysis of human chromosomes. Nature 1966, 212, 1437–1440. [Google Scholar] [CrossRef]
- Oud, J.L.; Kakes, P.; De Jong, J.H. Computerized analysis of chromosomal parameters in karyotype studies. Theor Appl Genet 1987, 73, 630–634. [Google Scholar] [CrossRef]
- Fukui, K. Standardization of karyotyping plant chromosomes by a newly developed chromosome image analyzing system (CHIAS). Theor Appl Genet 1986, 72, 27–32. [Google Scholar] [CrossRef] [PubMed]
- Reeves, A. MicroMeasure: a new computer program for the collection and analysis of cytogenetic data. Genome 2001, 44, 439–443. [Google Scholar] [CrossRef] [PubMed]
- König, C.; and Ebert, I. Computer-aided quantitative analysis of banded karyotypes, exemplified in C-banded Hyacinthoides italica s.l. (Hyacinthaceae). Caryologia 1997, 50, 105–116. [Google Scholar] [CrossRef]
- Hiller, B.; Bradtke, J.; Balz, H.; Rieder, H. CyDAS: a cytogenetic data analysis system. Bioinformatics 2005, 21, 1282–1283. [Google Scholar] [CrossRef]
- Wang, J.; LaFramboise, T. CytoConverter: a web-based tool to convert karyotypes to genomic coordinates. BMC Bioinformatics 2019, 20, 467. [Google Scholar] [CrossRef]
- Abrams, Z.B.; Zhang, L.; Abruzzo, L.V.; Heerema, N.A.; Li, S.; Dillon, T.; Rodriguez, R.; Coombes, K.R.; Payne, P.R.O. CytoGPS: a web-enabled karyotype analysis tool for cytogenetics. Bioinformatics 2019, 35, 5365–5366. [Google Scholar] [CrossRef]
- Abrams, Z.B.; Tally, D.G.; Abruzzo, L.V.; Coombes, K.R. RCytoGPS: an R package for reading and visualizing cytogenetics data. Bioinformatics 2021, 37, 4589–4590. [Google Scholar] [CrossRef]
- Thinh, N.H.; Son, N.H.H.; Huong, P.T.V.; Nhung, N.T.C.; Ram, D.T.; Minh, N.T.B.; Ha, L.M. A Web-based Tool for Semi-interactively Karyotyping the Chromosome Images for Analyzing Chromosome Abnormalities. Proceedings of 2020 7th NAFOSTED Conference on Information and Computer Science (NICS), 26-27 Nov. 2020; pp. 433–437. [Google Scholar]
- Uttamatanin, R.; Yuvapoositanon, P.; Intarapanich, A.; Kaewkamnerd, S.; Phuksaritanon, R.; Assawamakin, A.; Tongsima, S. MetaSel: a metaphase selection tool using a Gaussian-based classification technique. BMC Bioinformatics 2013, 14 Suppl 16, S13. [Google Scholar] [CrossRef]
- Liu, L.; Wang, Q.; Zhang, Z.; He, X.; Yu, Y. MATO: An updated tool for capturing and analyzing cytotaxonomic and morphological data. The Innovation Life 2023, 1, 100010. [Google Scholar] [CrossRef]
- Altınordu, F.; Peruzzi, L.; Yu, Y.; He, X. A tool for the analysis of chromosomes: KaryoType. TAXON 2016, 65, 586–592. [Google Scholar] [CrossRef]
- Bahry, E.; Breimann, L.; Zouinkhi, M.; Epstein, L.; Kolyvanov, K.; Mamrak, N.; King, B.; Long, X.; Harrington, K.I.S.; Lionnet, T.; et al. RS-FISH: precise, interactive, fast, and scalable FISH spot detection. Nat Methods 2022, 19, 1563–1567. [Google Scholar] [CrossRef] [PubMed]
- Schindelin, J.; Arganda-Carreras, I.; Frise, E.; Kaynig, V.; Longair, M.; Pietzsch, T.; Preibisch, S.; Rueden, C.; Saalfeld, S.; Schmid, B.; et al. Fiji: an open-source platform for biological-image analysis. Nat Methods 2012, 9, 676–682. [Google Scholar] [CrossRef] [PubMed]
- Almagro-Garcia, J.; Manske, M.; Carret, C.; Campino, S.; Auburn, S.; Macinnis, B.L.; Maslen, G.; Pain, A.; Newbold, C.I.; Kwiatkowski, D.P.; et al. SnoopCGH: software for visualizing comparative genomic hybridization data. Bioinformatics 2009, 25, 2732–2733. [Google Scholar] [CrossRef]
- Milan, S. Karyotyping Software: 5 Best to map your Chromosomes. 2023.
Disclaimer/Publisher’s Note: The statements, opinions and data contained in all publications are solely those of the individual author(s) and contributor(s) and not of MDPI and/or the editor(s). MDPI and/or the editor(s) disclaim responsibility for any injury to people or property resulting from any ideas, methods, instructions or products referred to in the content. |
© 2025 by the authors. Licensee MDPI, Basel, Switzerland. This article is an open access article distributed under the terms and conditions of the Creative Commons Attribution (CC BY) license (https://creativecommons.org/licenses/by/4.0/).
Copyright: This open access article is published under a Creative Commons CC BY 4.0 license, which permit the free download, distribution, and reuse, provided that the author and preprint are cited in any reuse.


