Submitted:
13 June 2025
Posted:
16 June 2025
You are already at the latest version
Abstract
This study systematically investigates the effect of steel fiber content on the fractal evolution characteristics of bending cracks in alkali-activated slag concrete (AASC) beams. A four-point bending test on simply supported beams, combined with digital image correlation (DIC) technology, was employed to quantitatively analyze the fractal dimension of crack propagation paths in AASC beams with steel fiber contents ranging from 0% to 1.4%, using the box-counting method. The relationship between fracture energy and fractal dimension was examined, along with the fractal control mechanisms of mid-span deflection, crack width, and the fractal evolution of fracture toughness parameters. The results revealed that as the steel fiber content increased, the crack fractal dimension decreased from 1.287 to 1.155, while the critical fracture energy of AASC beams increased by approximately 75%. Both mid-span deflection and maximum crack width were positively correlated with the crack fractal dimension, whereas the fractal dimension showed a negative correlation with critical cracking stress and fracture toughness, and a positive correlation with the energy release rate. When the steel fiber content exceeded 1.2%, the performance gains began to diminish due to fiber agglomeration effects. Overall, the findings suggest that an optimal steel fiber content range of 1.0% to 1.2% provides the best crack control and mechanical performance, offering a theoretical basis for the design of AASC structures.
Keywords:
Steel fiber content
; alkali-activated slag concrete
; fractal dimension
; Crack evolution
; Fracture toughness
1. Introduction
Alkali-activated slag concrete (AASC), a novel green and low-carbon building material, has gained significant attention in recent years. Zhang et al.1 explored the bonding mechanisms of polyvinyl alcohol (PVA) fibers in alkali-activated slag/coal ash concrete through molecular dynamics simulations and experimental studies. Their results indicate that, compared to traditional Ordinary Portland Cement (OPC) concrete, AASC can reduce greenhouse gas emissions by as much as 73% and decrease energy consumption by approximately 43%. These advantages position AASC as a promising material for addressing global climate change and advancing the "dual carbon" strategy. Furthermore, research by Luga et al.2 highlights the superior durability of AASC in seawater environments. After multiple wetting-drying cycles, its compressive and flexural strengths remain high, suggesting substantial potential for its application in coastal and marine engineering. However, challenges remain in the practical implementation of AASC in engineering projects. Salami et al. 3 highlighted that AASC faces issues such as rapid setting time and insufficient carbonation resistance. The rapid setting time may reduce the working time, thus increasing the difficulty of construction. In addition, poor carbonation resistance may lead to the formation of microcracks on the concrete surface during carbonation, ultimately compromising its durability. Provis et al. 4 further demonstrated that the long-term durability of AASC is limited by shrinkage-induced micro-cracks. These microcracks not only weaken the concrete's strength but may also create pathways for the ingress of harmful substances, accelerating the material's deterioration. Additionally, Mundra et al.5 identified that rebar corrosion significantly affects the durability of concrete. Corrosion of the reinforcement leads to spalling of the concrete cover, thereby reducing structural safety and service life. Although AASC offers excellent environmental benefits and specific durability, issues such as rapid setting time, carbonation resistance, shrinkage-induced microcracking, and rebar corrosion remain critical factors limiting its widespread application.
To address the mechanical performance limitations of alkali-activated slag concrete (AASC), such as brittleness and susceptibility to cracking, researchers have introduced steel fiber reinforcement. Xu et al. 6 conducted an in-depth study on the fracture characteristics of high-performance fiber-reinforced cement composites using acoustic emission (AE) and digital image correlation (DIC) techniques. The study found that steel fibers effectively control crack propagation, reduce the main crack width by 30%-50%, and promote the formation of multiple secondary microcracks. However, there is currently a lack of systematic research on the influence of different fiber contents (0.5%-2.0%) on the three-dimensional morphological characteristics and branching mechanisms of crack evolution. Specifically, there is an absence of mathematical models that quantitatively characterize the relationship between fiber content and crack network complexity. Rossi et al.7 investigated the impact of single-hooked end and multi-hooked end steel fibers on the flexural and cracking resistance of alkali-activated slag concrete and ordinary portland cement concrete. Three-point and four-point bending tests were conducted to evaluate the flexural strength and cracking resistance of the concrete, respectively. The results showed that the incorporation of steel fibers significantly enhanced both the flexural strength and cracking resistance of the concrete. Both single-hooked end and multi-hooked end steel fibers effectively improved the peak stress and strain of the concrete. Due to their unique geometry, multi-hooked end steel fibers can more effectively enhance the mechanical properties of concrete. Yuan et al.8 investigated the flexural performance of concrete specimens reinforced with steel fibers of varying lengths, analyzing the effects of fiber type and content on peak load, fiber quantity in the section, load-displacement curves, section characteristics, and strain properties. The results showed that the addition of steel fibers significantly increased the peak load of the concrete specimens, with different fiber types exhibiting varying effects on the peak load. As the height of the specimens increased, the number of fibers in the section increased linearly. Furthermore, different types of steel fibers exhibited distinct characteristics in the residual stage of the load-displacement curves. The study showed that steel fibers effectively improved the fracture characteristics of the concrete, transforming its failure mode from brittle to a more ductile one. Hashmi et al.9 studied the fractal characteristics of fatigue crack growth in complex geometries and proposed a new method to quantify the fatigue crack growth rate using fractal analysis. The study showed that the fractal characteristics of fatigue cracks effectively reflect the driving force at the crack tip, and the multifractal fatigue crack growth model can accurately predict the crack growth rate in complex geometries. The results were consistent with those predicted by the traditional Paris equation within a 99% confidence interval. Studies have shown that as the crack length increases, the fractal dimension also increases, reflecting the growing complexity and roughness of the crack surface. However, for the single steel fiber-reinforced AASC system, key scientific issues, such as the dynamic evolution of the fractal dimension with load and its relationship to macroscopic mechanical parameters, remain underexplored. This limitation hinders the engineering application of fractal theory in this material system.
This study utilizes digital image correlation (DIC) technology combined with a four-point bending test to systematically investigate the impact of steel fiber volume fraction (0%-1.4%) on the fractal characteristics of crack propagation in AASC beams. Fractal analysis is employed to quantify the fractal dimensions of the load-displacement curve at various stages, focusing on revealing: the relationship between fracture energy and fractal dimension; the fractal control mechanism of mid-span deflection and crack width; and the fractal evolution patterns of fracture toughness parameters, such as critical cracking stress and energy release rate. The findings provide a fracture control method that combines theoretical insight with engineering practicality for AASC structural design.
2. Experiment
2.1. Materials
The apparent density of granulated blast furnace slag (GGBS) is 3.27 g/cm³, with a specific surface area of 854.6 m²/kg. A scanning electron microscope (SEM) image of GGBS is shown in Figure 1. The apparent density of fly ash is 2.187 g/cm³, with its SEM image displayed in Figure 2. The coarse aggregate has a particle size range of 5 mm to 20 mm, as shown in Figure 3. The fineness modulus of the fine aggregate is 2.99, as depicted in Figure 4. The length of the corrugated steel fibers is 36 mm, with an equivalent diameter of 1.08 mm. The alkali activator is composed of a mixture of water glass, sodium hydroxide, and water, with the composition ratio presented in Table 1. The mix proportions for the alkali-activated slag concrete are provided in Table 2.
2.2. Test Beam Design
A total of eight steel fiber reinforced alkali-activated slag concrete beams (SFRASC1 to SFRASC8) were designed, corresponding to steel fiber volume fractions of 0.0%, 0.5%, 0.9%, 1.0%, 1.1%, 1.2%, 1.3%, and 1.4%, respectively. The design parameters of the specimens are as follows: the beam cross-sectional dimensions are 120 mm × 200 mm, with a beam length of 2000 mm, and a concrete cover thickness of 25 mm. The reinforcement system consists of HRB400-grade tensile longitudinal bars 2C16 and frame bars 2C10, with HPB300-grade stirrups arranged as A8@100 mm. The details of the beam cross-section and reinforcement are shown in Figure 5.
2.3. Loading and Testing
According to the "Standard for Concrete Structure Test Methods" (GB/T 50152-2012)10, a three-point concentrated loading method was employed, with fixed and roller hinge supports at both ends, respectively. To prevent localized stress concentration, steel shims were placed at the supports and loading points. The test load was applied to the specimen through a distribution beam. A schematic diagram of the loading device is shown in Figure 6.
A comprehensive monitoring scheme was implemented to quantify the deformation characteristics and crack development patterns of the test beams. Precision dial gauges were installed at the lower surface of the mid-span and at the upper surface of the support centers to monitor the vertical deformation data of the test beams. Five concrete surface strain gauges, spaced 45 mm apart, were uniformly arranged along the mid-span side surface of the beam to monitor the strain gradient distribution across the cross-section. Additionally, two steel surface strain gauges were positioned on the longitudinal reinforcement at the bottom of the mid-span to enable synchronous collection of strain data from the reinforcement. To accurately locate the initiation and propagation paths of cracks, a reference grid system with a 50 mm × 50 mm spacing was established on the side and bottom surfaces of the beam using the grid coordinate method. During the test, cracks were monitored in real-time through visual inspection. Once initial cracks were detected, marking lines were immediately drawn at the corresponding positions, and the load level and crack propagation length were recorded synchronously. The crack width was measured using an MG10085-1 type reading microscope, with a magnification of 100× and a minimum graduation value of 0.02 mm. A schematic diagram of the reading microscope is shown in Figure 7.
2.4. Analysis of Test Results
2.4.1. Load Result Analysis
The key load characteristics of the test beams at different steel fiber dosages are presented in Table 3. As shown in Table 3, with an increase in steel fiber content from 0.0% to 1.4%, the cracking load at the positive section, the cracking load at the inclined section, and the ultimate load increased by 60.1%, 49.3%, and 23.6%, respectively, demonstrating a significant positive correlation. This trend aligns with the findings in literature 11, confirming the beneficial effect of steel fibers on the cracking performance of alkali-activated slag concrete. It is noteworthy that when the steel fiber volume content reaches 1.0%, the cracking load at the positive section exhibits an anomalous fluctuation of approximately 8.7% compared to the 0.8% fiber content group. Observations of the failure surface revealed that fiber agglomeration was the direct cause of this fluctuation. When the steel fiber volume fraction in a localized region exceeds the critical value of approximately 1.2%, stress concentration points are formed, which in turn reduce the cracking threshold 13. Furthermore, when the steel fiber content exceeds 1.0%, the probability of agglomeration increases significantly to 15-20%. The bridging effect of steel fibers has a dual impact on the structural load-bearing performance: On one hand, the ultimate load increases approximately linearly with fiber content, and a point of ductile failure transition is observed at a 1.2% fiber content. On the other hand, when the fiber content exceeds 1.0%, the efficiency of the incremental gain per unit of fiber decreases. This is primarily due to the reduced workability of the fresh concrete, which leads to a deterioration in molding density.
2.4.2. Deflection Results and Analysis
The mid-span deflection of the test beam was measured using five dial gauges. During loading, settlement occurred at both supports of the test beam; therefore, the measured mid-span deflection was adjusted by subtracting the average settlement of the supports. Figure 8 presents the load-mid-span deflection curves for eight test beams. From Figure 8, it can be observed that, before cracking, the mid-span deflection of the test beam increased gradually in a linear fashion as the load increased. Although the steel fiber content varies among the test beams, the load-midspan deflection curves demonstrate substantial overlap during this phase. Throughout this stage, the beams remain within the elastic range. After cracking, the load-deflection curve displays its first inflection point, where the slope decreases, beam stiffness reduces, and the midspan deflection rate accelerates. Under the same load, beams composed of steel fiber-reinforced alkali-activated slag concrete exhibit smaller deflections, and as the steel fiber content increases, the midspan deflection further diminishes. After the yielding of the longitudinal reinforcement, the rate of load increase slowed, and the mid-span deflection increased significantly. Notably, the incorporation of steel fibers led to a more gradual decline in the load-mid-span deflection curve, indicating that steel fibers significantly improved the toughness of the alkali-activated slag concrete and the ductility of the beams.
2.4.3. Crack Results and Analysis
The process of crack propagation and its distribution under various load levels for the test beams are shown in Figure 9. From the figure, it can be observed that all eight test beams exhibited appropriate reinforcement failure, and their load-bearing process can be divided into three stages: Elastic Stage (Load ≤ 0.3Pu). In this stage, the influence of steel fibers on the beam's stiffness was relatively limited, but they significantly improved the cracking load. When the fiber content was greater than or equal to 0.8%, the position of the first crack shifted 15-20 mm from the mid-span toward the loading point, indicating that the steel fibers altered the distribution pattern of internal stresses within the beam; Crack Propagation Stage (0.3Pu ≤ Load ≤ 0.8Pu). When the steel fiber content reached 1.4%, the number of primary cracks decreased by approximately 10%. This result is highly consistent with the "fiber-crack space interlocking mechanism" revealed by Zhang et al.11 through X-ray tomography, indicating that steel fibers can effectively suppress the further propagation of cracks; Failure Stage (Load > 0.8Pu), in this stage, steel fibers effectively inhibit the through-cracking of the beam and reduce the spalling area on the concrete surface. Microstructural analysis by Rossi et al.15 indicated that this performance enhancement is primarily attributed to the densification effect of hydration products at the interface between the fibers and the matrix.
Table 4 presents the crack width and distribution characteristics of the eight test beams subjected to an 80 kN load. It can be observed that, under identical loading conditions, the crack width of steel fiber-reinforced alkali-activated slag concrete beams is significantly smaller compared with that of beams without steel fibers. Moreover, within a certain range, increasing the steel fiber content further reduces the crack width, demonstrating that steel fibers play a crucial role in effectively inhibiting crack propagation. As the fiber content rises, this inhibitory effect becomes more evident.
3. Quantification and Analysis of Fractal Characteristics
3.1. Types of Fractal Dimensions
Fractal dimension is a fundamental quantitative measure in fractal geometry that characterizes the self-similarity and scale invariance of geometric structures using non-integer dimensional values. It provides a precise means of quantifying the complexity and disorder of these structures' topologies. The interpretation and calculation methods for fractal dimensions vary across different fields.The most commonly employed types of fractal dimensions are as follows.
Capacity Dimension16:
Here, Dcap represents the capacity dimension, and N(ε) denotes the minimum number of boxes (or grids) having a side length of ε that are required to cover the fractal set.
Information Dimension17:
Here, DI represents the information dimension; ε denotes the side length of the grid cells used to cover the fractal set; Pi(ε) represents the probability of the fractal set within the i-th grid cell (such as mass ratio, density, etc.); logPi refers to the logarithmic average weighted by probability, essentially reflecting the scaling behavior of Shannon entropy.
Correlation Dimension18:
DC represents the correlation dimension; C(ε) denotes the probability that the distance between point pairs in the phase space is less than ε ; Θ is the Heaviside step function, defined as Θ(x) = 1 for x ≥ 0, and 0 otherwise; ε is the distance threshold.
Generalized Dimension 19:
Dq represents the generalized dimension; q is the order parameter, which adjusts the weight of different probability regions; Pi(ε) is the probability of the fractal in the i-th grid at scale ε. When q takes values of 0, 1, and 2, the corresponding dimensions are the capacity dimension Dcap, information dimension DI, and correlation dimension DC.
Self-similar Dimension 20:
Here, DS represents the self-similar dimension, and N is the number of substructures similar to the original structure, scaled by a factor of r.
A comparative analysis of the five types of fractal dimensions is presented in Table 5. The damage or surface morphology of the beam in this study is a non-strictly self-similar natural fractal, requiring a universal approach. This method directly quantifies the spatial complexity of the damaged area, utilizing the box-counting method for calculation.
3.2. Fractal Expansion Model of Stress-Induced Cracks
In fracture mechanics, cracks are classified into three basic types based on the applied stresses and fracture characteristics of the structure or component: Type I, Type II, and Type III 21. Type I cracks, known as opening-mode cracks, involve normal stress applied perpendicular to the crack surface. Type II cracks are shear-mode cracks, where shear stress is applied parallel to the crack surface and perpendicular to the crack tip line. Type III cracks, or tearing-mode cracks, involve shear stress applied parallel to both the crack surface and the crack tip line. A detailed illustration is provided in Figure 10.
This study, based on observations from four-point bending tests, found that crack propagation in steel fiber-reinforced alkali slag concrete beams predominantly exhibits Type I characteristics. The fractal evolution of these cracks can be characterized by the critical stress, fracture toughness, and critical energy release rate. Wnuk and Yavari 22 extended Griffith's criterion23 to fractal cracks and provided a modified expression for critical stress σc:
Where E is the elastic modulus of the concrete material; γeff represents the effective surface energy, incorporating the influence of fractal geometry; and a is the characteristic length of the crack, with the projection length considered for fractal cracks.
γmatrix is the fracture surface energy per unit area of the matrix material without fibers; ρf is the volume fraction of steel fibers; and Jb is the work of single fiber pullout.
Fracture toughness KIC refers to the material’s resistance to crack propagation. The relationship between fracture toughness, critical crack stress σc , and crack size a is described by Griffith's theory:
Y is the dimensionless geometric factor, which depends on the crack shape and loading mode (typically, Y≈1 for a central crack).
Taking into account the fractal dimension D, the fracture toughness can be modified as follows:
where l represents the microscopic scale, typically taken as 0.0001 m.
The critical energy release rate for crack propagation is an inherent property of the material, reflecting the concrete's ability to resist unstable crack growth. Under external loading, the energy release rate at the crack tip increases monotonically with the applied load. When this rate exceeds the critical value, the system enters an energy instability state, leading to dynamic crack propagation and ultimately causing brittle fracture of the concrete component. During Type I crack propagation in concrete, once the cracking stress reaches the tensile strength of the concrete, the fractal growth force reaches its maximum Gmax.
Here, μ represents the shape parameter of the crack zone, which is approximately taken as 2π.
4. Fractal Analysis of the Mechanical Properties of Steel Fiber Alkali-Activated Slag Concrete Beams
4.1. Calculation Results of the Crack Fractal Dimension
The Box-counting Method is a classical technique used in fractal geometry to calculate the fractal dimension D. The procedure is as follows: First, the crack image is binarized, with pixel values set to 1 for the crack region and 0 for the background, resulting in a clear binary image representing the crack distribution. Next, square grids of varying sizes r are applied to systematically cover the crack distribution map, and the minimum number of boxes N(r) required to cover the crack area at each scale is counted. Then, a double logarithmic transformation is performed on the obtained r and N(r) data, and the log-log relationship curve of N(r) vs. r is plotted using MATLAB software. If the data exhibit a strong linear correlation, the fractal dimension D is determined as the slope of the fitted line, which quantitatively describes the complexity and spatial expansion characteristics of the crack distribution.
Wang et al.24 highlighted in their research on the fractal characteristics of cracks in concrete members that, when applying the Box-counting Method, the selection of box sizes must meet specific conditions: the lower limit should not be smaller than the maximum particle size of the coarse aggregate, and the upper limit should not exceed the maximum crack spacing. If the selected range falls outside these limits, the calculation results may be biased, potentially yielding values lower than the topological dimension, which could lead to misjudgment of the fractal characteristics. Based on this conclusion, and considering the concrete material characteristics used in this experiment (with coarse aggregate sizes ranging from 5 to 20 mm) and the observed crack distribution (with a maximum crack spacing of 100 mm), this study selected box sizes in increments of 20 mm, ranging from 20 mm to 100 mm. This selection range ensures an accurate representation of fractal characteristics while aligning with the material's microscopic structural features.
Figure 11 shows the logN(r)-logr relationship curves for each test beam under failure conditions and various load levels. Figure 12 demonstrates that, during the staged loading process, the crack distribution of the steel fiber-reinforced slag concrete beams in each test group exhibits clear fractal scaling characteristics. Specifically, the logN(r)-logr double logarithmic curve obtained using the box-counting method shows a high degree of linearity (correlation coefficient R² > 0.95) within the statistical scale range, from the maximum coarse aggregate particle size (20 mm) to the maximum crack spacing (100 mm). This scale invariance further supports the conclusion that the crack propagation path follows a statistically self-similar fractal structure.
Table 6 presents the test data for the fractal dimension D of cracks in each test beam under different load levels. Analyzing Table 6 reveals that as the load increases, the fractal dimension D of the test beams from SFRASC1 to SFRASC8 shows an upward trend. In the initial cracking stage, due to the low load, crack development is limited, resulting in a lower fractal dimension D. As the load gradually increases, the fractal dimension D remains between 1 and 2. For the same load, the fractal dimension D decreases as steel fiber content increases, indicating that the addition of steel fibers effectively suppresses the formation of microcracks and the propagation of macroscopic cracks in the concrete. This leads to a slower crack propagation rate and a more uniform crack distribution. In the failure stage, the fractal dimension D of the SFRASC1 test beam is 1.287, with a maximum load of 89.4 kN, while the fractal dimension D of the SFRASC8 test beam is 1.155, with a maximum load of 111.5 kN. Therefore, it can be concluded that as steel fiber content increases, the fractal dimension D decreases, the maximum load increases significantly, crack propagation is effectively delayed, and the fracture resistance of the test beam is enhanced.
4.2. Relationship Between Fracture Energy and Fractal Dimension
Considering the complexity of crack propagation paths in steel fiber-reinforced alkali slag concrete beams, fractal theory is used to analyze their crack propagation behavior under load. By establishing a quantitative relationship between the fractal dimension D and the energy dissipation per unit area of the crack band Gf , the influence of steel fiber content on the crack propagation path is further investigated. The fracture energy Gf , is calculated based on the CEF-FIP Model Code 1990 specification 25.
In this study, GFO represents the baseline fracture energy, which is determined based on the maximum aggregate diameter. Since the maximum aggregate diameter used in this experiment is 20 mm, GFO is set to 0.037 N/m, fcmo is 10 MPa, and fcm corresponds to the cubic compressive strength of the steel fiber alkali slag concrete material, as determined from experimental testing.
Table 7 presents the data for the critical fracture energy Gf and fractal dimension D of each experimental beam group. The analysis reveals an inverse correlation between the critical fracture energy and the fractal dimension of the crack propagation path in steel fiber alkali slag concrete beams. Specifically, as the fractal dimension decreases, the critical fracture energy increases. However, for the SFRASC5 beam with a steel fiber content of 1.1% and the SFRASC6 beam with 1.2% steel fiber content, an abnormal distribution of fracture energy was observed. It is hypothesized that insufficient mixing caused localized aggregation of steel fibers, thereby reducing the strengthening effect of the fibers on the concrete.
From the overall data trend, it is observed that as the steel fiber content increases, the fractal dimension of the experimental beams gradually decreases. This suggests that steel fibers, as an effective reinforcing material, can significantly reduce the formation of microcracks within the concrete structure or component, as well as the propagation of macrocracks. As a result, the energy required for crack fracture in the experimental beams increases, thereby enhancing the fracture resistance of the beams.
4.3. Relationship Between Mid-Span Deflection and Fractal Dimension
Mid-span deflection is a critical parameter for assessing the performance of structural components. In this experiment, the mid-span deflections of the SFRASC1 to SFRASC8 test beams were precisely measured under various loading conditions, while the corresponding fractal dimension D values of the crack propagation paths were simultaneously recorded. Using these data, the relationship between mid-span deflection and fractal dimension D for each test beam group was plotted. A fitting analysis was then performed, revealing the relationship curve between mid-span deflection and fractal dimension D for each beam group, with a correlation coefficient R2 greater than 0.93, as shown in Figure 12.
As shown in Figure 12, a significant positive correlation is observed between the mid-span deflection of the experimental beams and the fractal dimension as the steel fiber content increases. As the mid-span deflection increases, the fractal dimension also rises, suggesting that the steel fibers effectively suppress crack propagation. The regression equation relating the mid-span deflection to the fractal dimension can be expressed as:
The values of a and b are shown in Table 8.
4.4. Relationship Between Maximum Crack Width and Fractal Dimension
The fractal dimension D is a critical parameter for characterizing the morphology, distribution, and propagation characteristics of cracks in concrete, providing a quantitative reflection of the extent of damage. In concrete beams, crack formation and propagation are the primary indicators of damage, which significantly affect the structural load-bearing capacity. The fractal dimension D aids in assessing the complexity and irregularity of cracks by quantifying crack width. As existing cracks in concrete structures or components continue to propagate under load, new cracks form, and the crack widths progressively increase. Figure 13 illustrates the fitting curve between the maximum crack width at mid-span of the experimental beams and the fractal dimension D under various loading conditions, with a correlation coefficient R2 exceeding 0.95.
As shown in Figure 13, a significant positive correlation is observed between the maximum crack width and the fractal dimension across various load levels as the steel fiber content increases in the experimental beams. When the crack width reaches the same level in different beam groups, those with higher steel fiber content exhibit smaller fractal dimensions, suggesting that steel fibers effectively suppress crack propagation. The regression relationship between the maximum crack width at mid-span and the fractal dimension can be expressed by the following equation:
The values of g and h are shown in Table 9.
5. Relationship Between the Fracture Toughness and Fractal Dimension of Steel Fiber Alkali-activated Slag Concrete Beam
For corrugated steel fibers, the pullout work Jb ranges from 1000 J/m² to 2000 J/m², with a value of 1500 J/m² used in this study. In the case of concrete without fibers, the unit area fracture surface energy γmatrix of steel fiber alkali-activated slag concrete ranges from 40 J/m² to 100 J/m². According to the study in reference Error! Reference source not found., the value of γmatrix for steel fiber alkali-activated slag concrete with a 1.5 modulus water glass activator is 65 J/m². The crack characteristic length a is taken as the projected length of the cracks observed on the surface of the beam. According to the results shown in Figure 9, the values of a under the ultimate load are listed in Table 10. Finally, the calculation results for the critical cracking stress, fracture toughness, and maximum energy release rate for the steel fiber alkali-activated slag concrete beams are presented in Table 10.
5.1. The Relationship Between Critical Crack Stress and Fractal Dimension
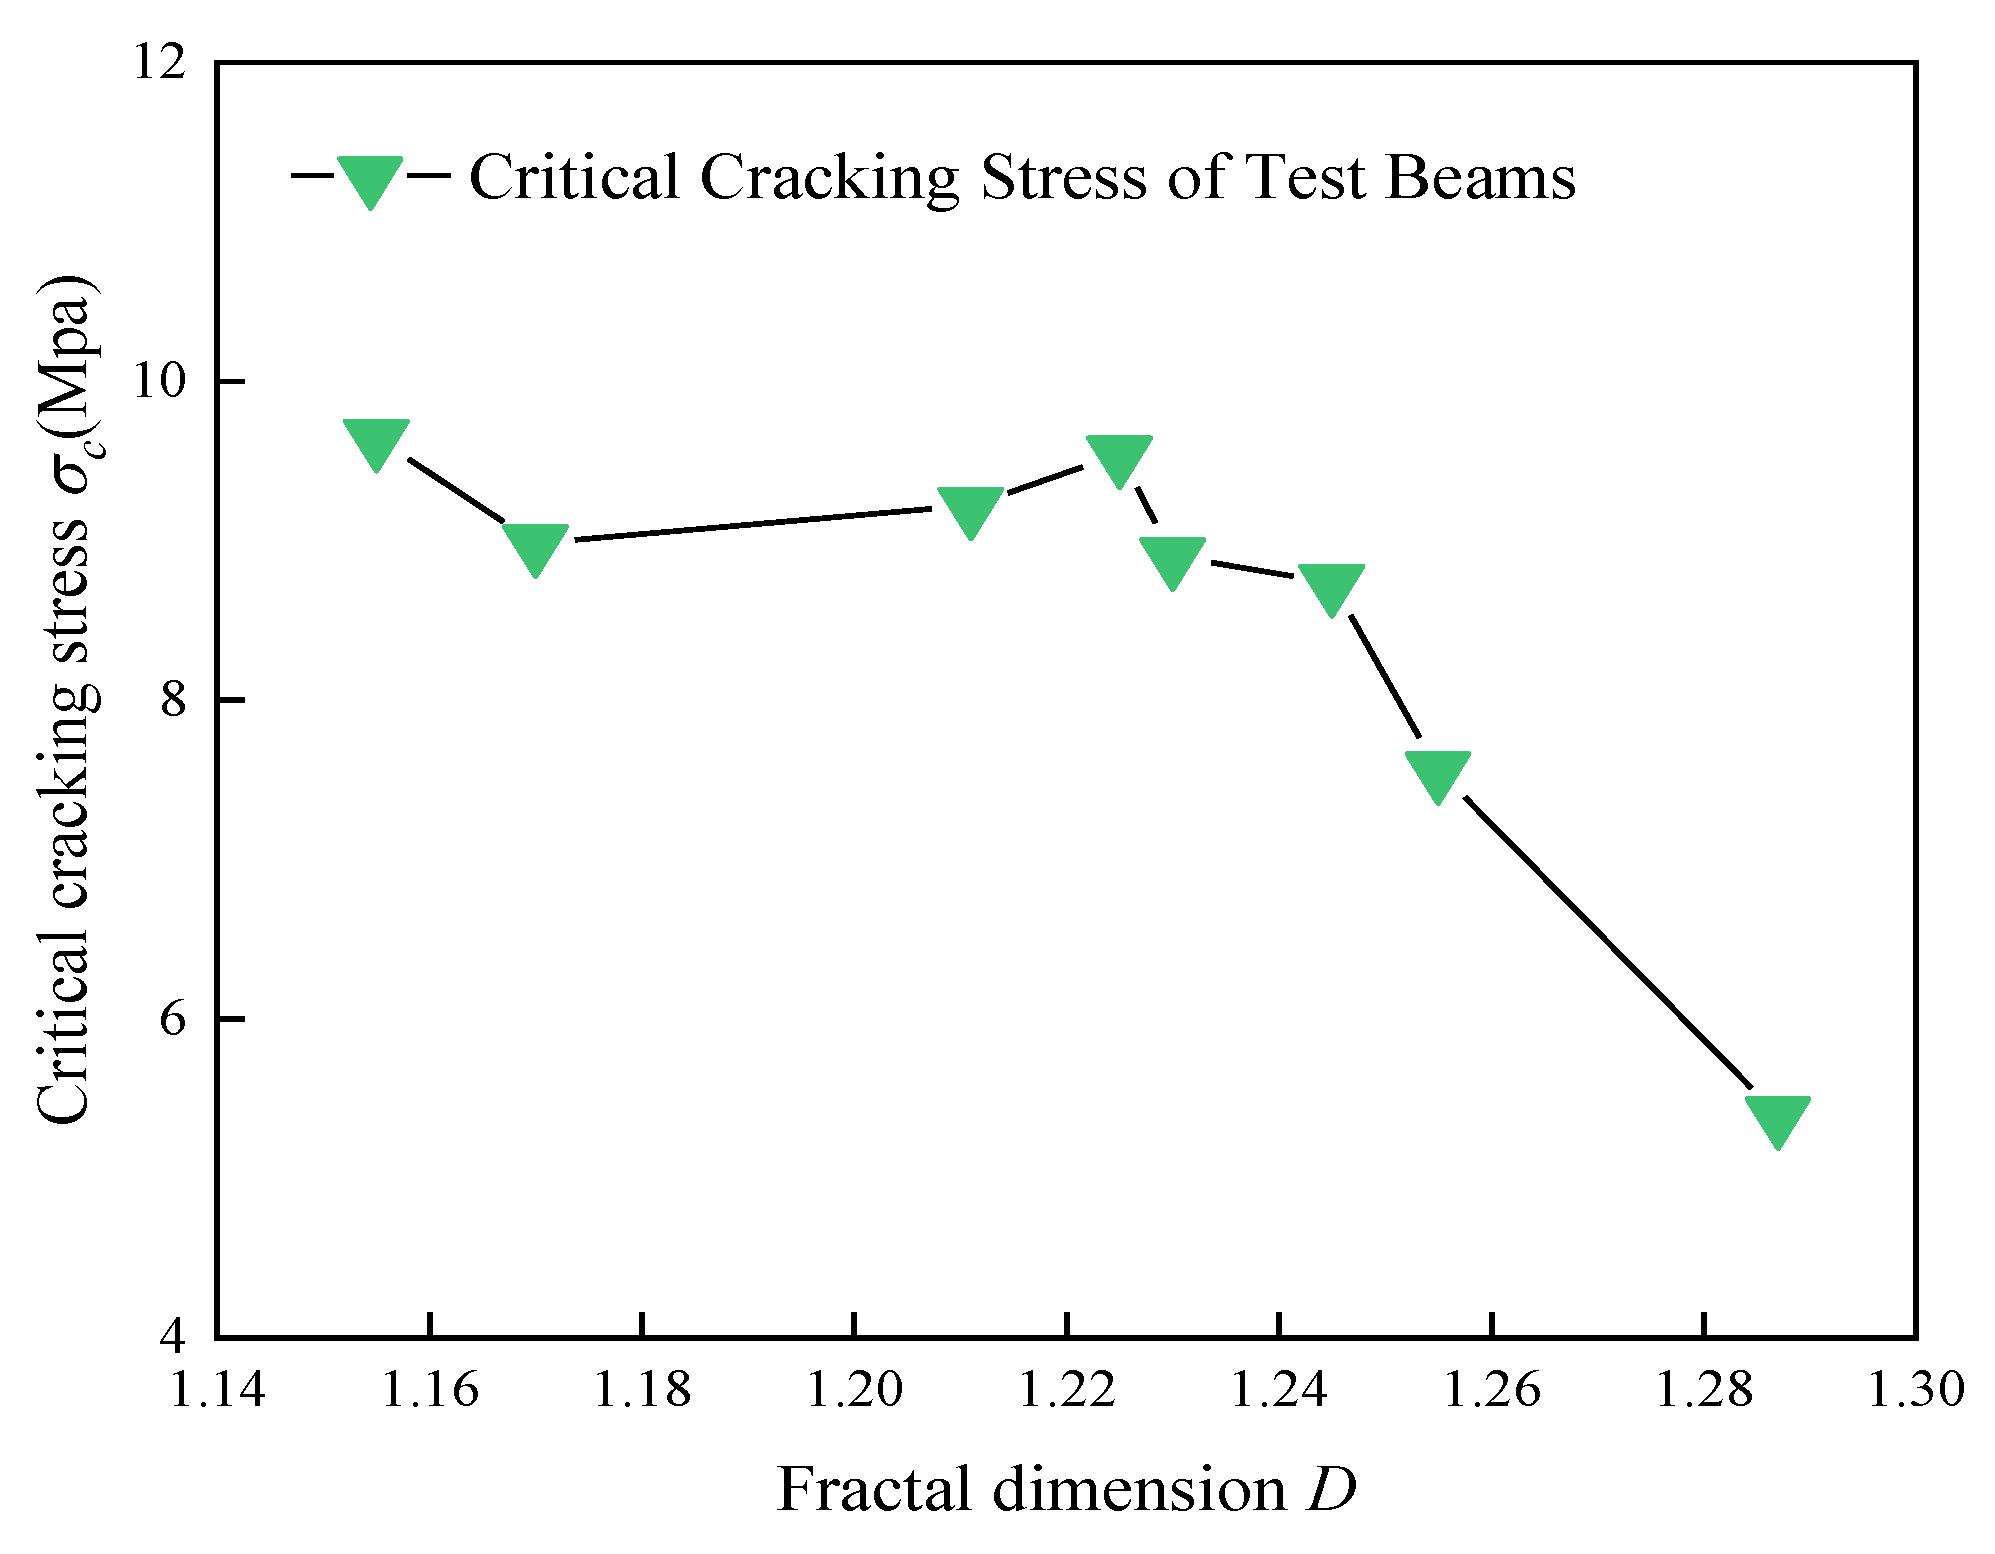
The experimental results show that as the steel fiber volume fraction ρf increases from 0% to 1.4%, the critical cracking stress σcr exhibits a nonlinear variation, initially increasing and then gradually stabilizing. When ρf was 1.1%, σcr reaches a peak value of 9.542 MPa, which is 76.8% higher than that of plain concrete. Simultaneously, the fractal dimension D of the cracks monotonically decreases from 1.287 to 1.155, representing a reduction of 10.3%. This change is attributed to the competitive mechanism between the bridging effect of the steel fibers and their distribution characteristics. When the fiber volume fraction ρf is less than or equal to 1.1%, the fibers are evenly distributed, forming a three-dimensional stress transfer network. The interface bonding strength and pullout work reduce the energy consumed during crack propagation, which lowers the fractal dimension D and increases the critical cracking stress σcr. However, when ρf exceeds 1.1%, the local agglomeration of fibers leads to stress concentration, which weakens the enhancement effect. This is reflected in the fluctuations of σcr and the slower decrease in D. The strong negative correlation between σcr and D indicates that the fractal dimension can serve as a quantitative indicator of crack suppression effectiveness. The threshold effect of ρf (critical value of 1.1%) highlights the role of the dispersion of the reinforcing phase in controlling the mechanical properties of the composite material, providing a theoretical basis for optimizing fiber content.
Figure 14.
The relationship between the critical cracking stress of the test beam and the fractal dimension D.
Figure 14.
The relationship between the critical cracking stress of the test beam and the fractal dimension D.
5.2. The Relationship Between Fracture Toughness and Fractal Dimension
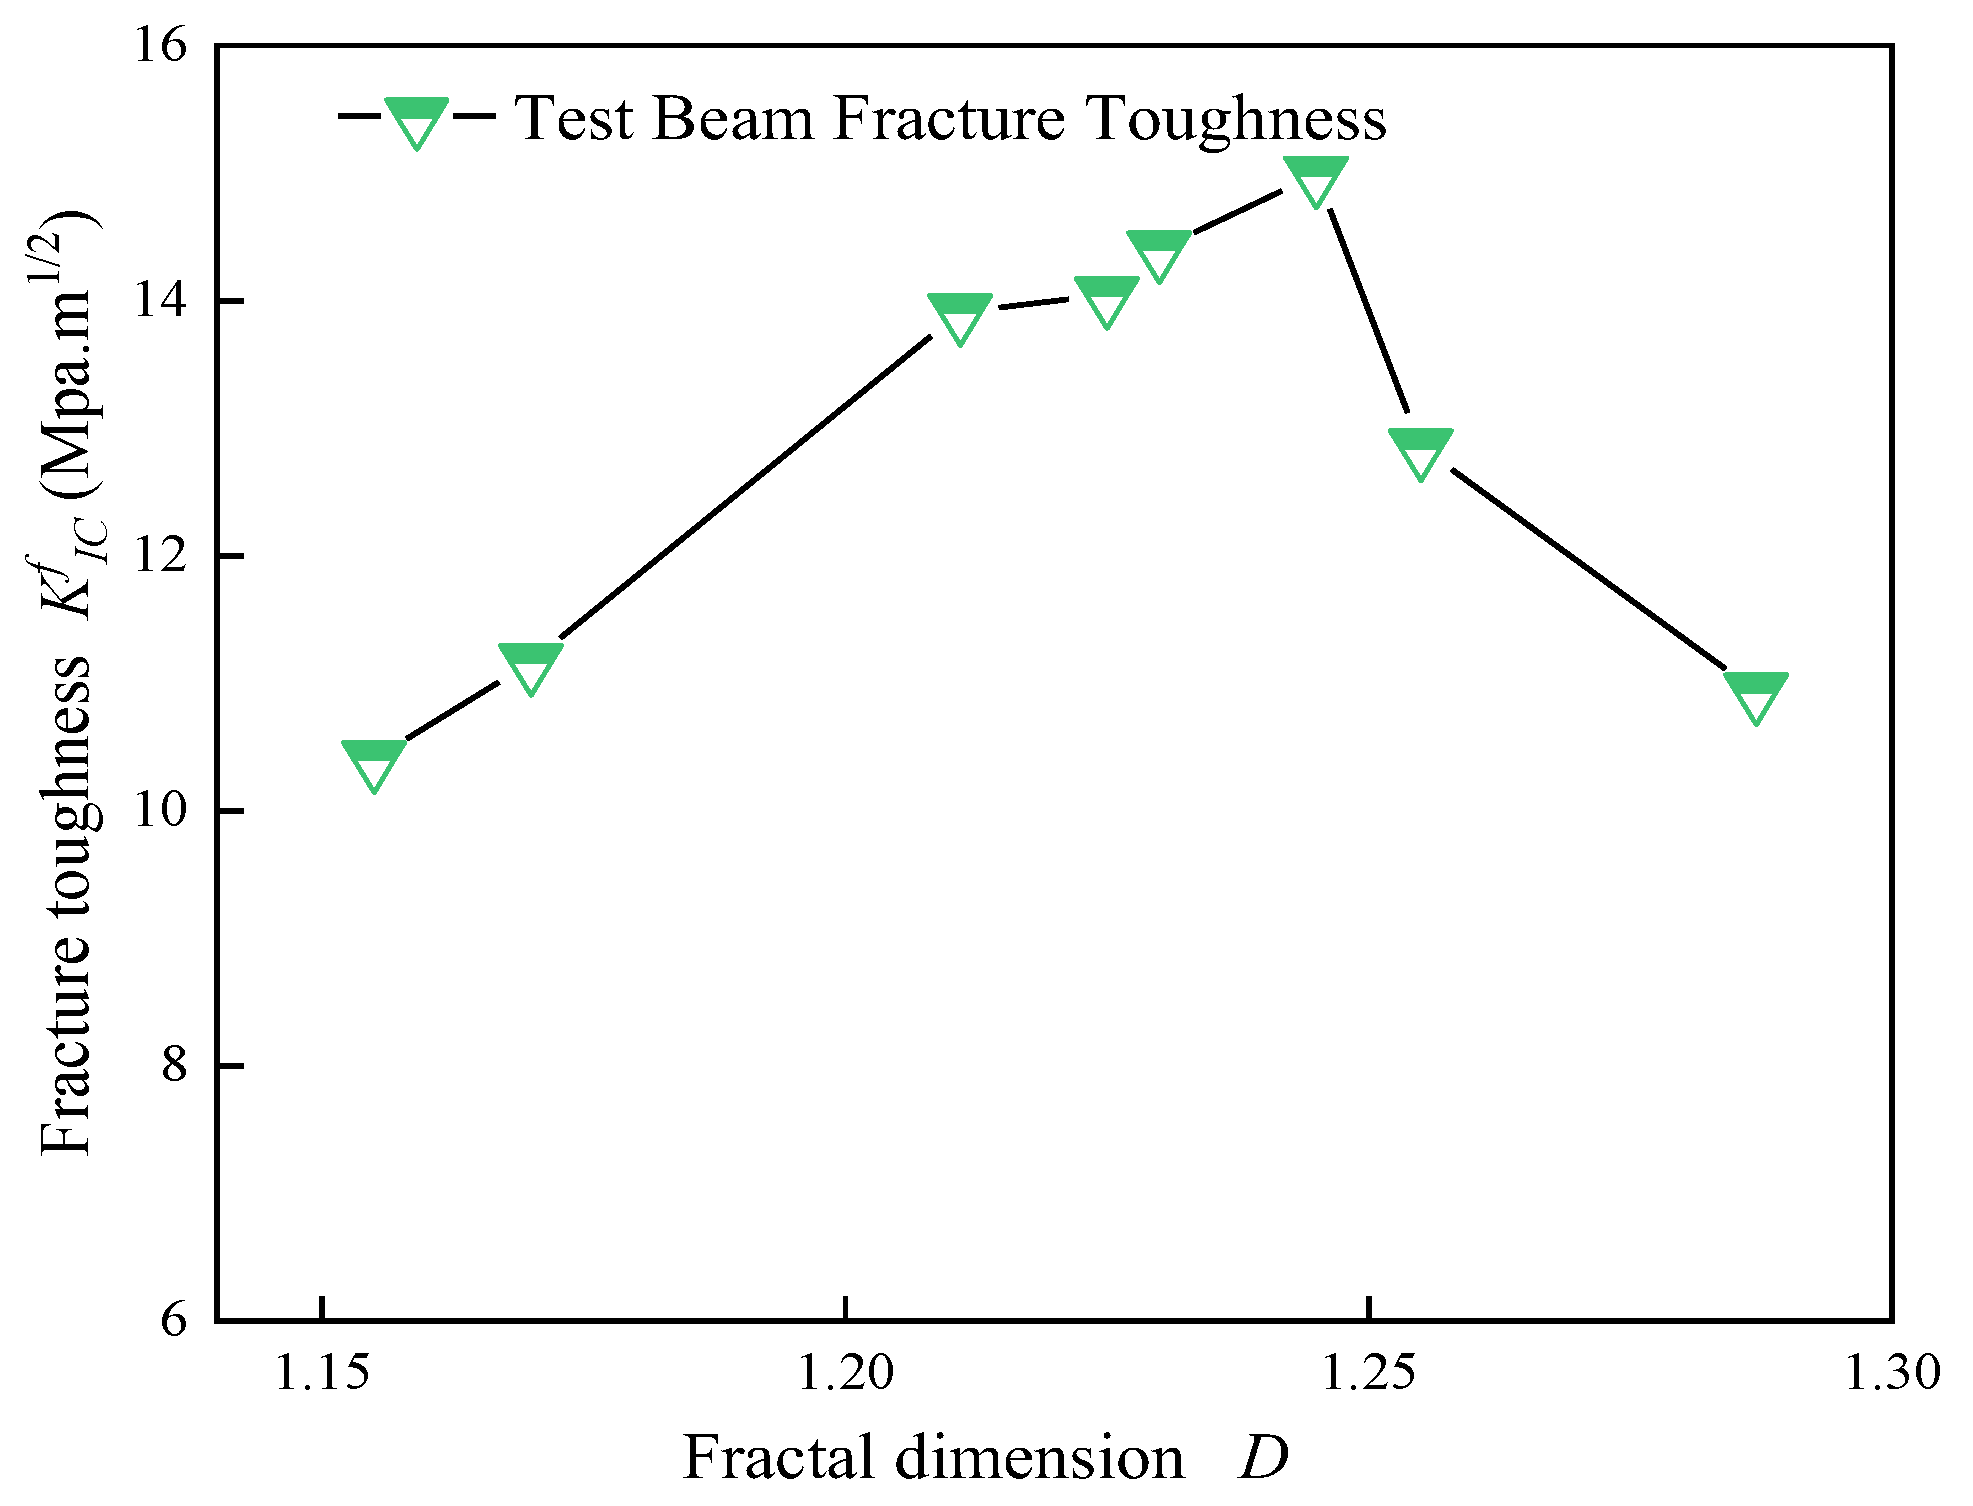
The test results demonstrate that the volume fraction of steel fibers ρf has a significant impact on both the fracture toughness KIC and the fractal dimension D of crack evolution in concrete. As ρf increases from 0% to 1.4%, KIC shows a non-monotonic trend, initially increasing and then decreasing, peaking at 14.991 MPa·m¹/² when ρf equals 0.9%, which is 37.0% higher than the value of plain concrete at 10.939 MPa·m¹/². However, once ρf exceeds 0.9%, KIC gradually decreases, dropping to 10.406 MPa·m¹/² when ρf reaches 1.4%, a reduction of 31.5%. At the same time, the fractal dimension D monotonically decreases from 1.287 (at ρf =0%) to 1.155 (at ρf =1.4%), suggesting that the incorporation of steel fibers significantly modifies the complexity of crack propagation paths.
From a micro-mechanical perspective, at lower fiber content levels ( ρf ≤0.9%), steel fibers effectively delay crack propagation through bridging effects, thereby enhancing fracture toughness. During this stage, based on fiber spacing theory, the fiber distribution becomes more uniform, forming a continuous energy dissipation network that optimizes the fracture performance of the composite material. However, when ρf exceeds the critical threshold (approximately 0.9%), fiber agglomeration intensifies, leading to localized stress concentration and an increase in interface defects. This weakens the synergistic effect between the fibers and the matrix. Notably, when ρf > 1.2%, the fractal dimension D sharply decreases from 1.211 to 1.155, while KIC significantly drops from 13.911 MPa·m¹/² to 11.168 MPa·m¹/², indicating that the uniformity of fiber distribution plays a critical role in fracture toughness. When the fiber content exceeds 1.2%, the deterioration of the microstructure leads to a decrease in the fracture toughness of the material.
Figure 15.
The relationship between fracture toughness and the fractal dimension D of the test beam.
Figure 15.
The relationship between fracture toughness and the fractal dimension D of the test beam.
5.3. The Relationship Between the Maximum Energy Release Rate and the Fractal Dimension
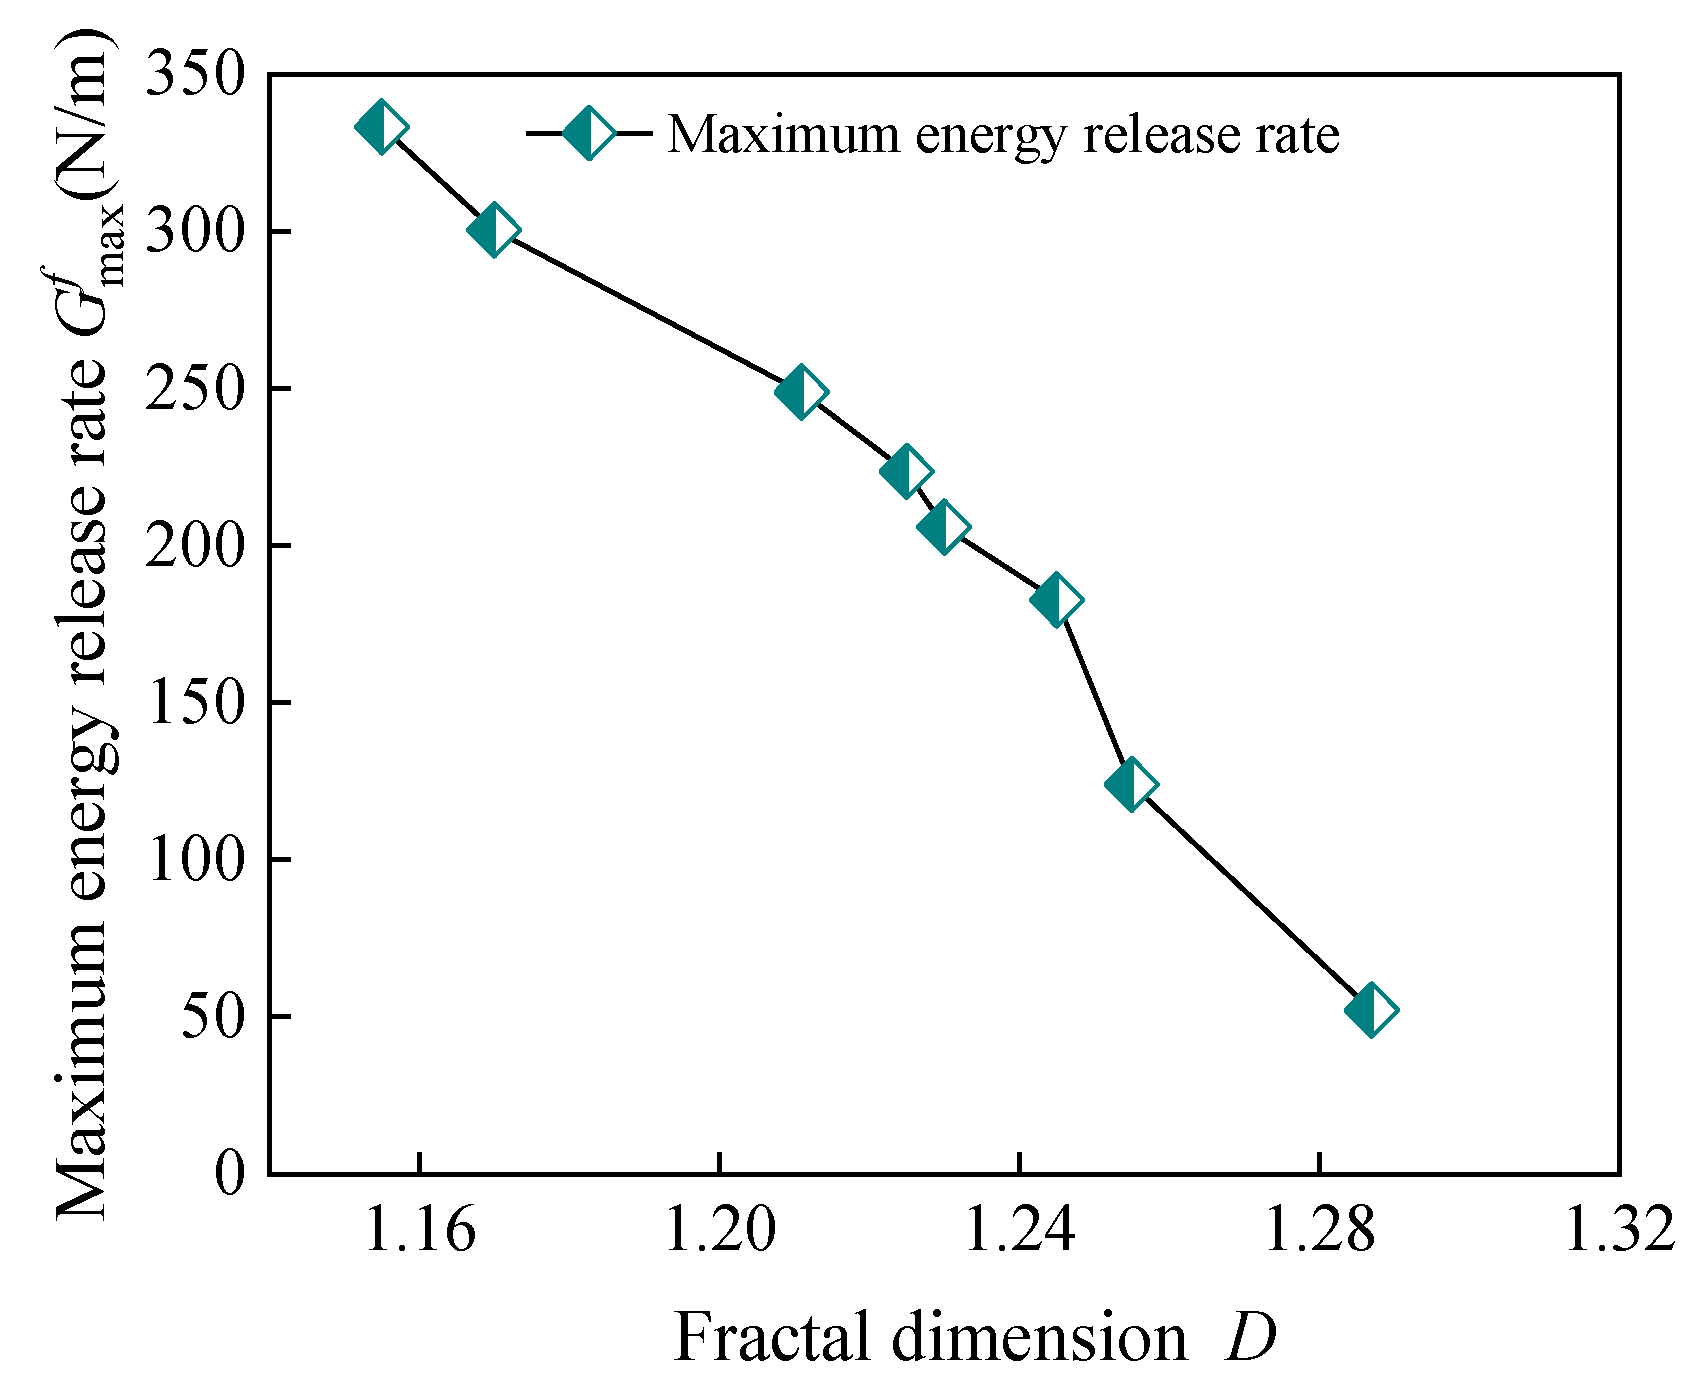
Experimental studies have demonstrated that the fiber volume fraction ρf of steel fibers significantly impacts the fracture performance of concrete, exhibiting a typical dose-response relationship. As ρf increases from 0.0% to 1.4%, the maximum energy release rate grows exponentially, from 52.163 N/m to 333.258 N/m, an increase of 538.7%. In contrast, the fractal dimension D monotonically decreases from 1.287 to 1.155, a reduction of 10.3%. This apparent contradiction highlights the transition in the fracture mechanism of steel fiber-reinforced concrete: at lower fiber content levels (ρf ≤ 1.2%), steel fibers primarily enhance fracture resistance through discrete bridging effects. When ρf exceeds 1.2%, the fiber network density reaches a critical value, optimizing the crack propagation path (resulting in a more significant decrease in D), while the group bridging effect substantially improves energy dissipation efficiency (accelerating crack growth). This suggests the existence of a "crack path simplification-fracture resistance enhancement" synergistic mechanism in steel fiber-reinforced concrete.
Figure 16.
Relationship between the maximum energy release rate and fractal dimension D for the test beams.
Figure 16.
Relationship between the maximum energy release rate and fractal dimension D for the test beams.
5. Conclusions
The addition of steel fibers significantly influences the crack propagation behavior in alkali-activated slag concrete. As the fiber content increases from 0% to 1.4%, the fractal dimension of cracks decreases from 1.287 to 1.155, indicating that steel fibers effectively reduce the complexity of crack propagation paths. In the range of 1.0% to 1.2% fiber content, the fiber bridging effect is most pronounced, simultaneously enhancing both the critical cracking stress and fracture toughness. However, when the fiber content exceeds 1.2%, the performance improvement begins to plateau due to the agglomeration of fibers.
A clear quantitative relationship exists between the fractal dimension and mechanical properties. The fractal dimension is negatively correlated with critical cracking stress and fracture toughness, while it shows a positive correlation with the energy release rate. The fractal model, established using the box-counting method, effectively characterizes the crack propagation behavior. Additionally, the modified Griffith criterion keeps the prediction error of critical stress within 5%, offering reliable theoretical support for engineering applications.
The comprehensive test results show that the optimal fiber content range for steel fiber alkali-activated slag concrete is between 1.0% and 1.2%. Within this range, the material exhibits the best crack control and mechanical properties while maintaining excellent workability. In practical engineering applications, special attention should be given to the fiber dispersion process to prevent fiber agglomeration, which can occur with excessively high fiber content.
Author Contributions
Conceptualization, Yuan X. H.; Methodology, Yuan X. H.; Validation, Yuan X. H.; Investigation, Cui Z. Y. ,Chen G. G.; Data curation, Cui Z. Y. Chen G. G.; Writing—original draft preparation, Cui Z. Y. , Chen G. G.; Writing—review and editing, Yuan X. H.; Visualization, Yuan X. H.; Supervision, Cui Z. Y..
Funding
This work was supported by the 2025 Henan Provincial Science and Technology Research Project (Grant No. 252102230150) and the Postgraduate Education Reform and Quality Improvement Project of Henan Province (Grant No. YJS2025GZZ31).
Conflicts of Interest
The authors declare no conflict of interest.
References
- Zhang S, Duque-Redondo E, Kostiuchenko A, et al. Molecular dynamics and experimental study on the adhesion mechanism of polyvinyl alcohol (PVA) fiber in alkali-activated slag/fly ash[J]. Cement and Concrete Research, 2021, 145, 106452. [Google Scholar] [CrossRef]
- Luga E, Mustafaraj E, Corradi M, et al. Alkali-Activated Binders as Sustainable Alternatives to Portland Cement and Their Resistance to Saline Water[J]. Materials, 2024, 17, 4408. [Google Scholar] [CrossRef]
- Salami B A, Ibrahim M, Algaifi H A, et al. A review on the durability performance of alkali-activated binders subjected to chloride-bearing environment[J]. Construction and Building Materials, 2022, 317, 125947. [Google Scholar] [CrossRef]
- Provis J L, Palomo A, Shi C. Advances in understanding alkali-activated materials[J]. Cement and Concrete Research, 2015, 78, 110–125. [Google Scholar] [CrossRef]
- Mundra S, Criado M, Bernal S A, et al. Chloride-induced corrosion of steel rebars in simulated pore solutions of alkali-activated concretes[J]. Cement and Concrete Research, 2017, 100, 385–397. [Google Scholar] [CrossRef]
- Xu W, Chen Y, Miao H, et al. An experimental study on fracture characteristics of high-performance fiber-reinforced cement composites through combined acoustic emission and digital image correlation[J]. Journal of Building Engineering, 2025, 103, 112110. [Google Scholar] [CrossRef]
- Rossi L, Zappitelli M P, Patel R A, et al. Flexural tensile behaviour of alkali-activated slag-based concrete and Portland cement-based concrete incorporating single and multiple hooked-end steel fibres[J]. Journal of Building Engineering, 2024, 98, 111090. [Google Scholar] [CrossRef]
- Yuan P, Ren X, Xie Y. Experimental Study on the Flexural Properties of Steel-Fibre-Reinforced Concrete Specimens with Different Heights[J]. Sustainability, 2024, 16, 1900. [Google Scholar] [CrossRef]
- Hashmi M H, Koloor S S R, Abdul-Hamid M F, et al. Fractal Analysis for Fatigue Crack Growth Rate Response of Engineering Structures with Complex Geometry[J]. Fractal and Fractional, 2022, 6, 635. [Google Scholar] [CrossRef]
- Ministry of Housing and Urban-Rural Development of the People's Republic of China. GB/T 50152-2012, Standard for Testing Methods of Concrete Structures [S]. Beijing: China Architecture and Building Press, 2012: 23-24.
- Zhang M, Jing J, Zhang S. Effect of steel fiber content on fatigue performance of high-strength concrete beams[J]. Scientific Reports, 2025, 15, 11815. [Google Scholar] [CrossRef]
- Chai H, Wu H, Zhang Y, et al. Research on the shear behavior of PBL connectors in steel fiber reinforced concrete composite beam[J]. Scientific Reports, 2025, 15, 5824. [Google Scholar] [CrossRef] [PubMed]
- Zheng Y, Lv X, Hu S, et al. Mechanical properties and durability of steel fiber reinforced concrete: A review[J]. Journal of Building Engineering 2024, 82, 108025. [CrossRef]
- Akbulut Z F, Tawfik T A, Smarzewski P, et al. Advancing Hybrid Fiber-Reinforced Concrete: Performance, Crack Resistance Mechanism, and Future Innovations[J]. Buildings, 2025, 15, 1247. [Google Scholar] [CrossRef]
- Rossi L, Patel R A, Dehn F. New analytical models to predict the mechanical performance of steel fiber-reinforced alkali-activated concrete[J]. Structural Concrete, 2025, 26, 236–247. [Google Scholar] [CrossRef]
- Hentschel H G E, Procaccia I. The infinite number of generalized dimensions of fractals and strange attractors[J]. Physica D: Nonlinear Phenomena, 1983, 8, 435–444. [Google Scholar] [CrossRef]
- Mandelbrot B B, Passoja D E, Paullay A J. Fractal character of fracture surfaces of metals[J]. Nature, 1984, 308, 721–722. [Google Scholar] [CrossRef]
- Grassberger, P. , & Procaccia. Measuring the strangeness of strange attractors. Physica D: Nonlinear Phenomena, 1983, 9, 189–208. [Google Scholar] [CrossRef]
- Halsey T C, Jensen M H, Kadanoff L P, et al. Fractal measures and their singularities: The characterization of strange sets[J]. Physical review A, 1986, 33, 1141. [Google Scholar] [CrossRef]
- Song C, Havlin S, Makse H A. Self-similarity of complex networks[J]. Nature, 2005, 433, 392–395. [Google Scholar] [CrossRef]
- Kaplan M, F. Crack propagation and the fracture of concrete[J]. Journal Proceedings. 1961, 58, 591–610. [Google Scholar] [CrossRef]
- Wnuk M P, Yavari A. On estimating stress intensity factors and modulus of cohesion for fractal cracks[J]. Engineering Fracture Mechanics, 2003, 70, 1659–1674. [Google Scholar] [CrossRef]
- Griffith A A., VI. The phenomena of rupture and flow in solids[J]. Philosophical transactions of the royal society of london. Series A, containing papers of a mathematical or physical character, 1921, 221(582-593): 163-198. http://www.jstor.org/stable/91192.
- Wang, T. , Yang, J. Fractal geometric analysis of crack state and its propagation in concrete structures[J]. Journal of Dalian University of Technology, 1997, 37, 79–83. [Google Scholar]
- Euro-International Concrete Committee. CEB-FIP Model Code 1990 [s]. [s.1]: [n.1], Lausanne, 1993.
- Ding Z Y, Zhou J H Su Q, et al. Influence of sodium silicate module on size effect of geopolymer recycled aggregate concrete[J]. Chinese journal of applied mechanics 2024, 41. [CrossRef]
Figure 1.
SEM image of slag.
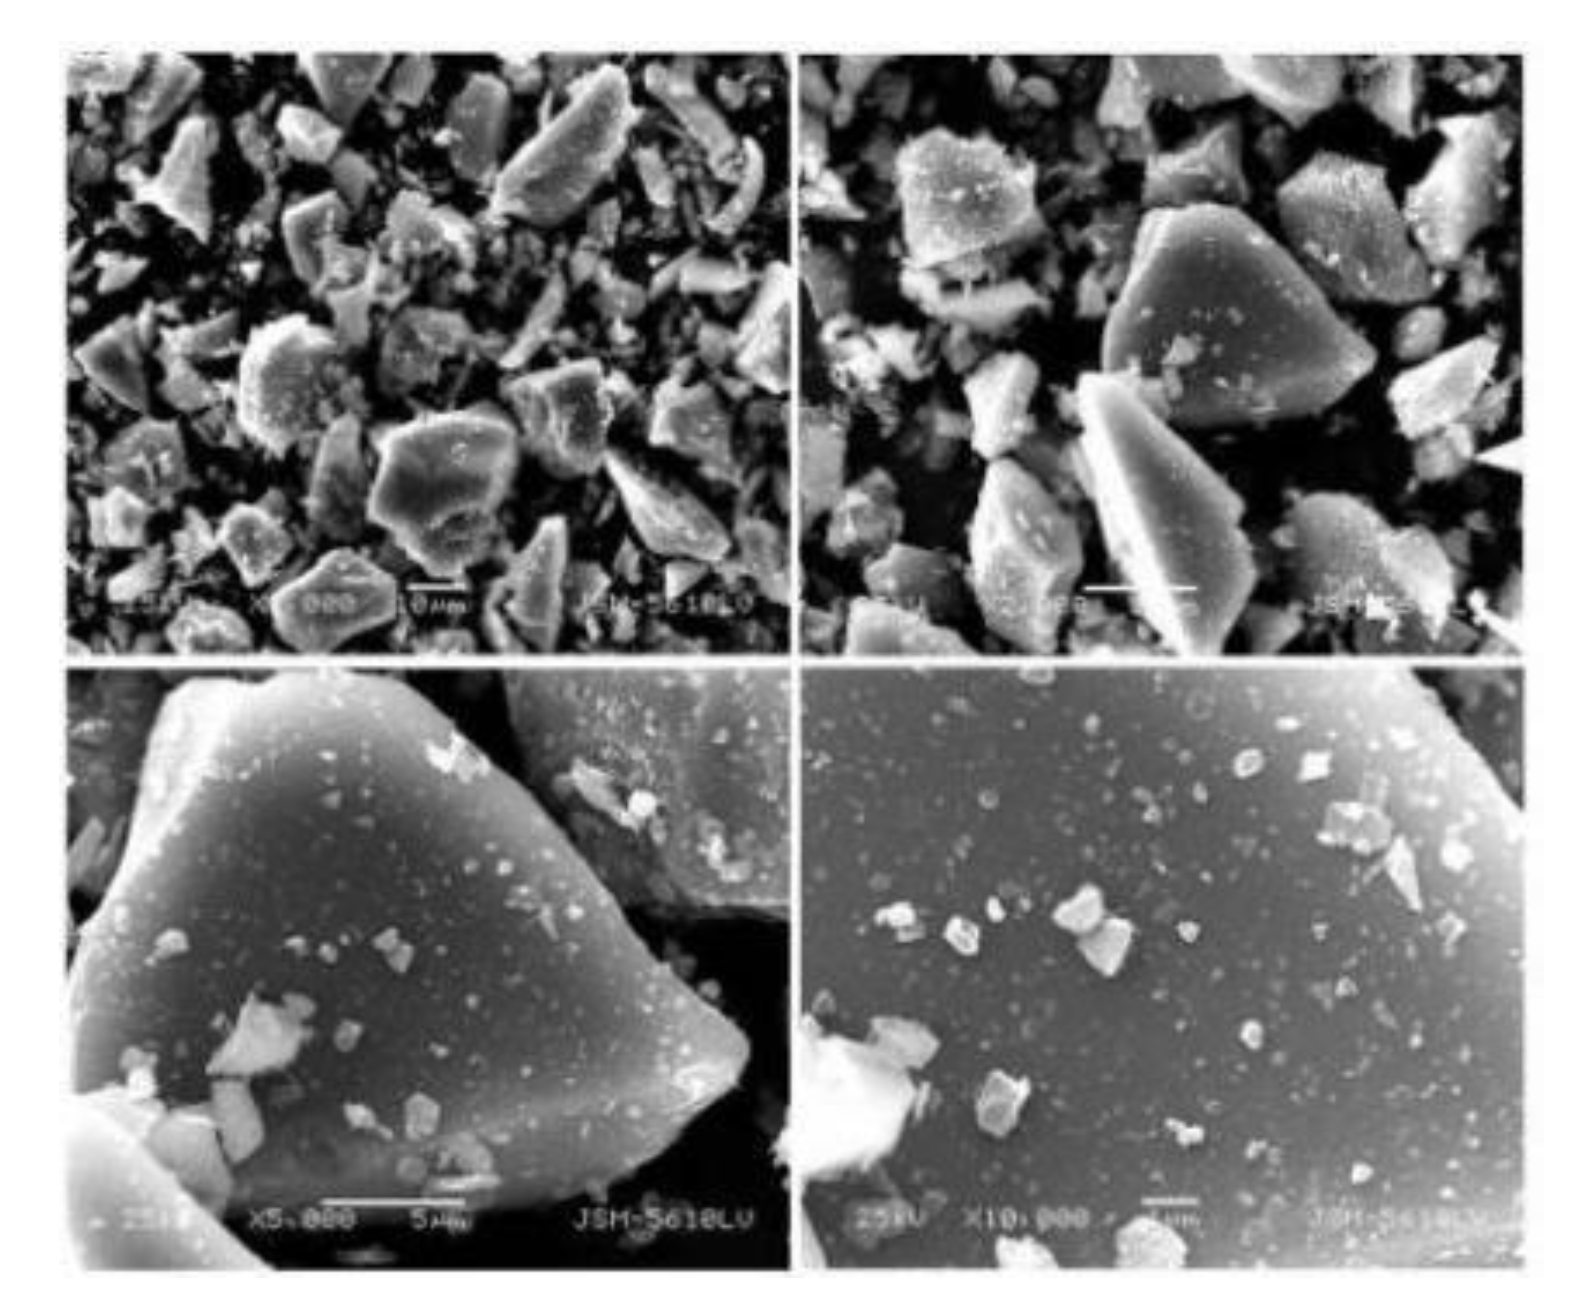
Figure 2.
SEM image of fly ash.
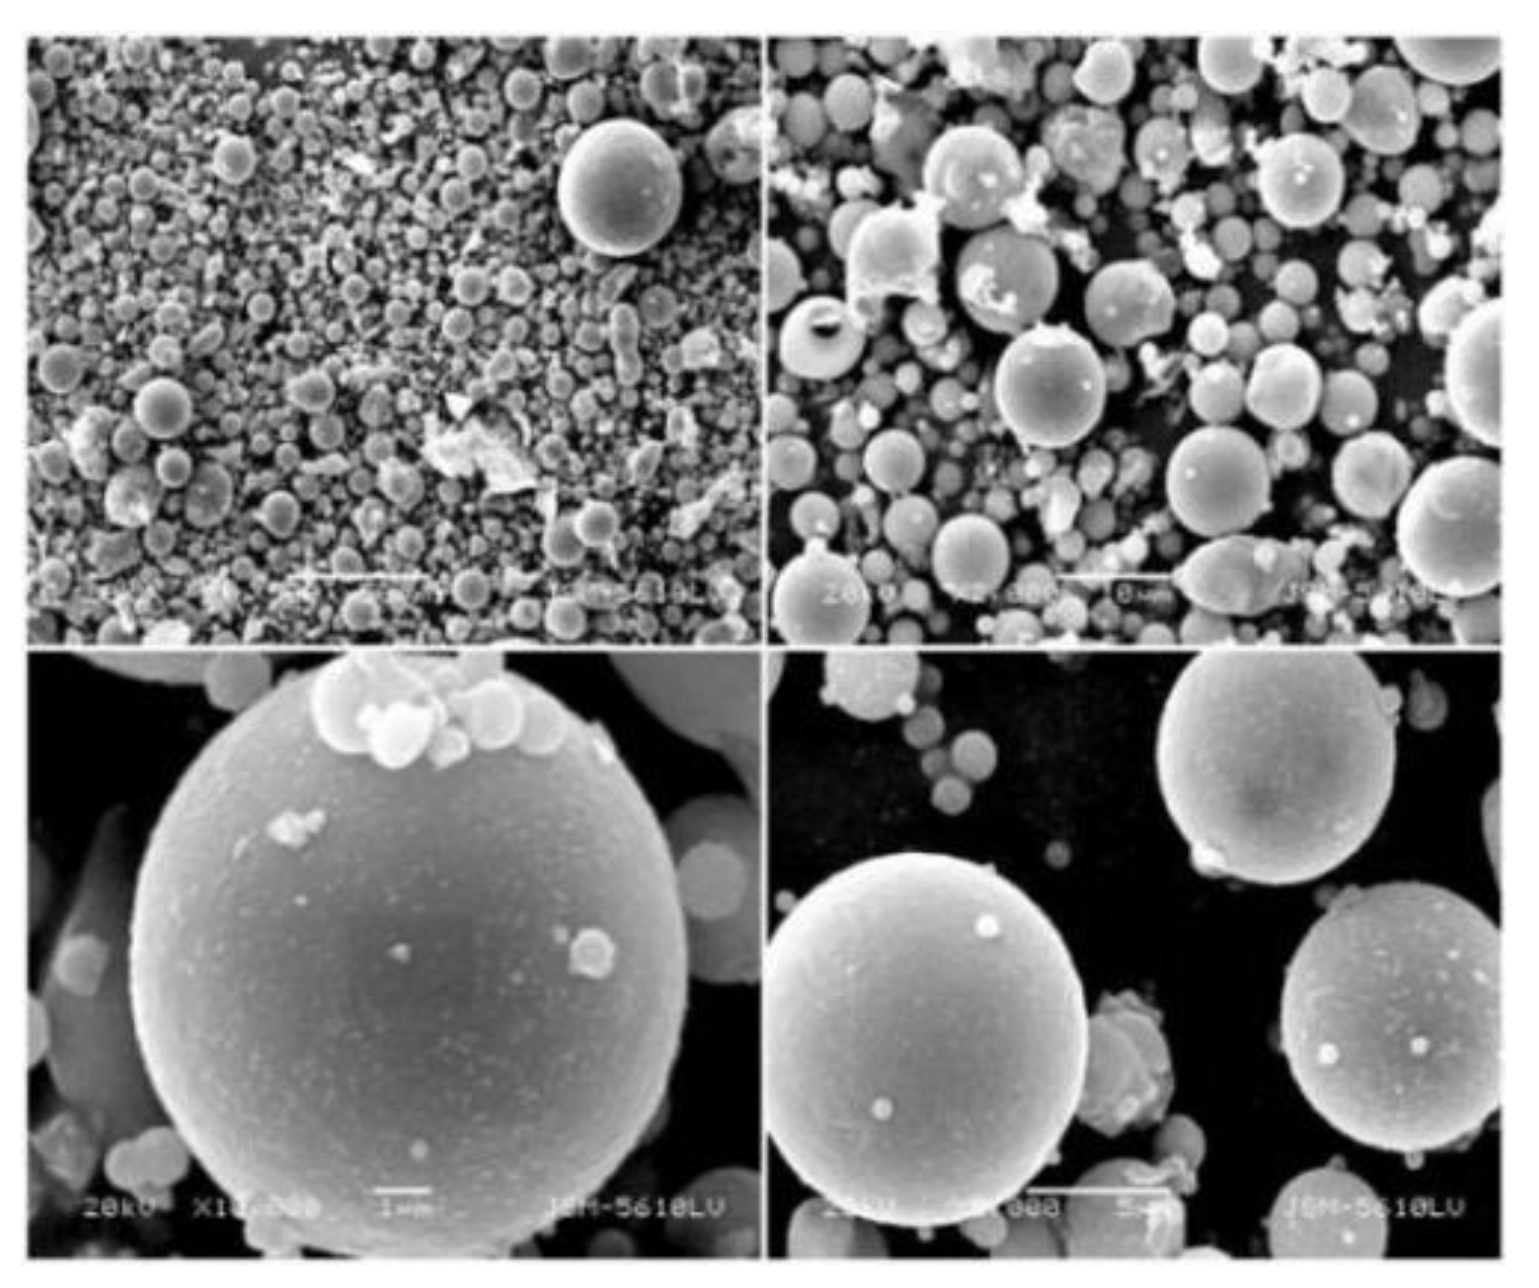
Figure 3.
Coarse aggregate.
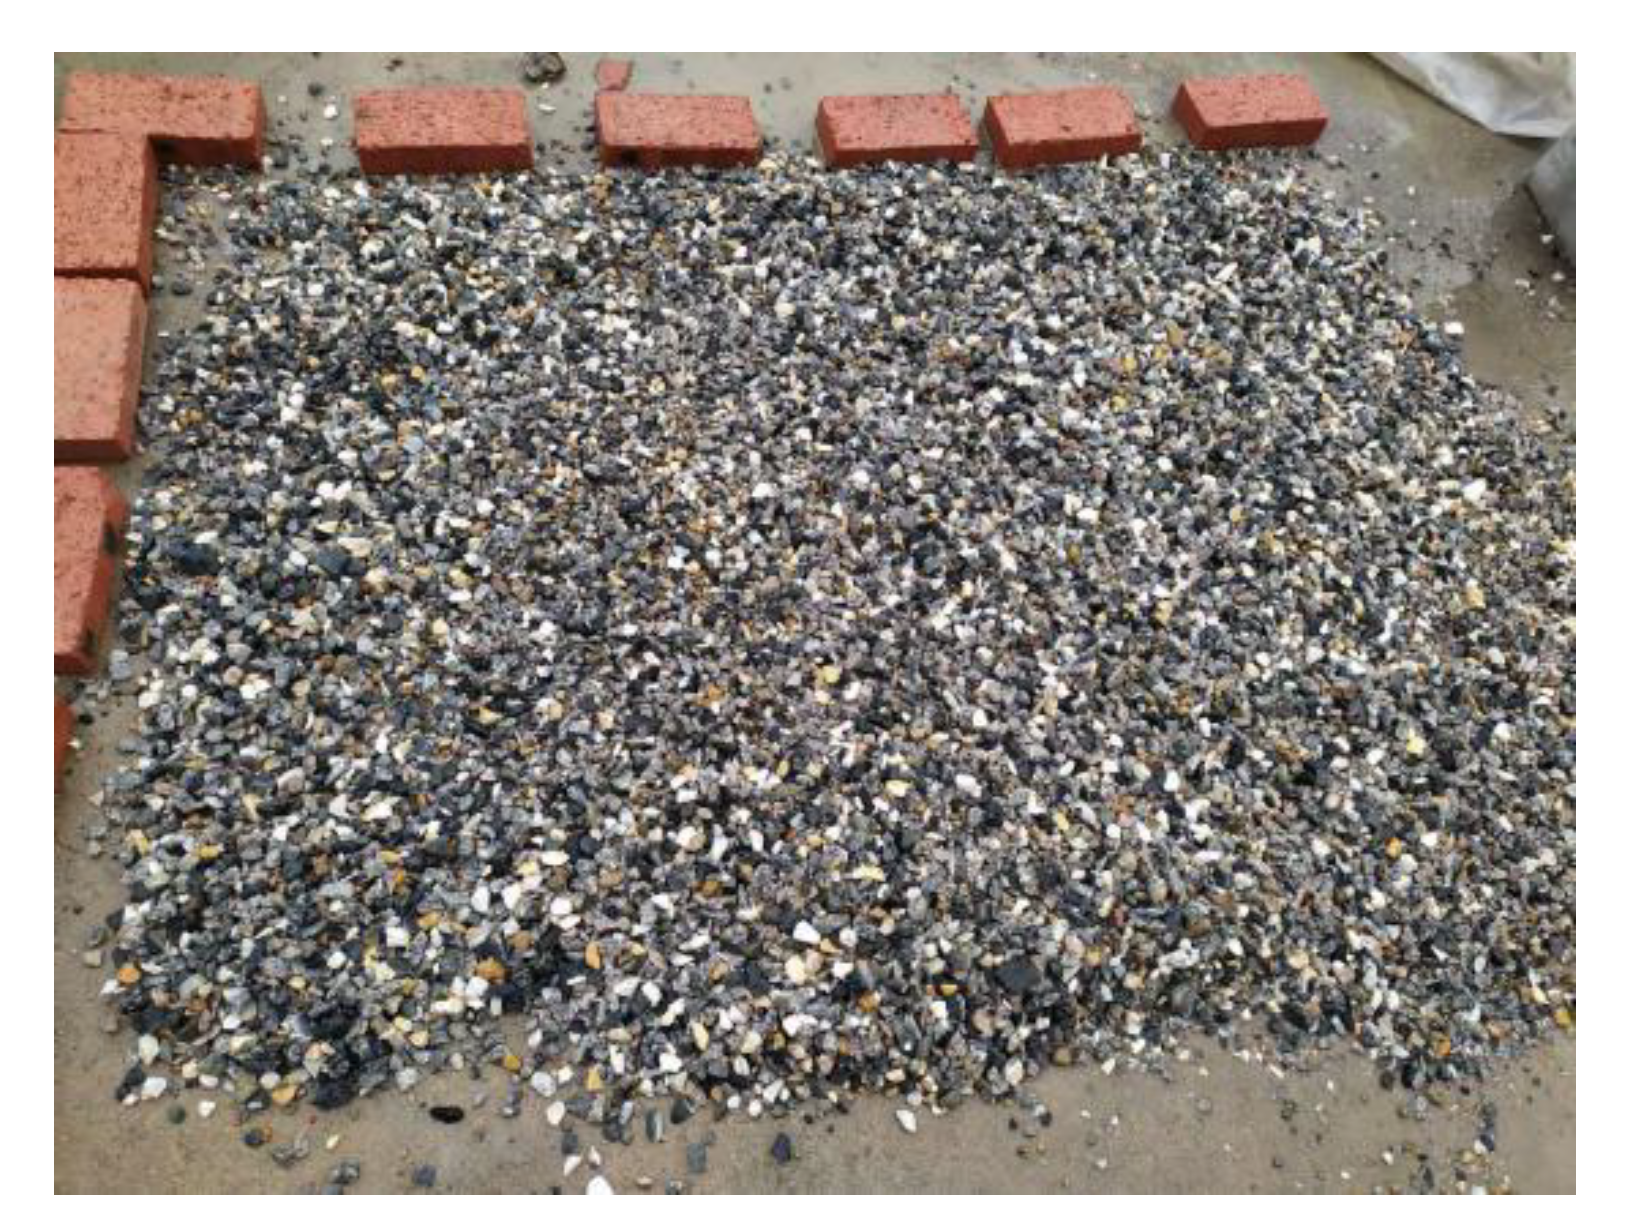
Figure 4.
Fine aggregates.
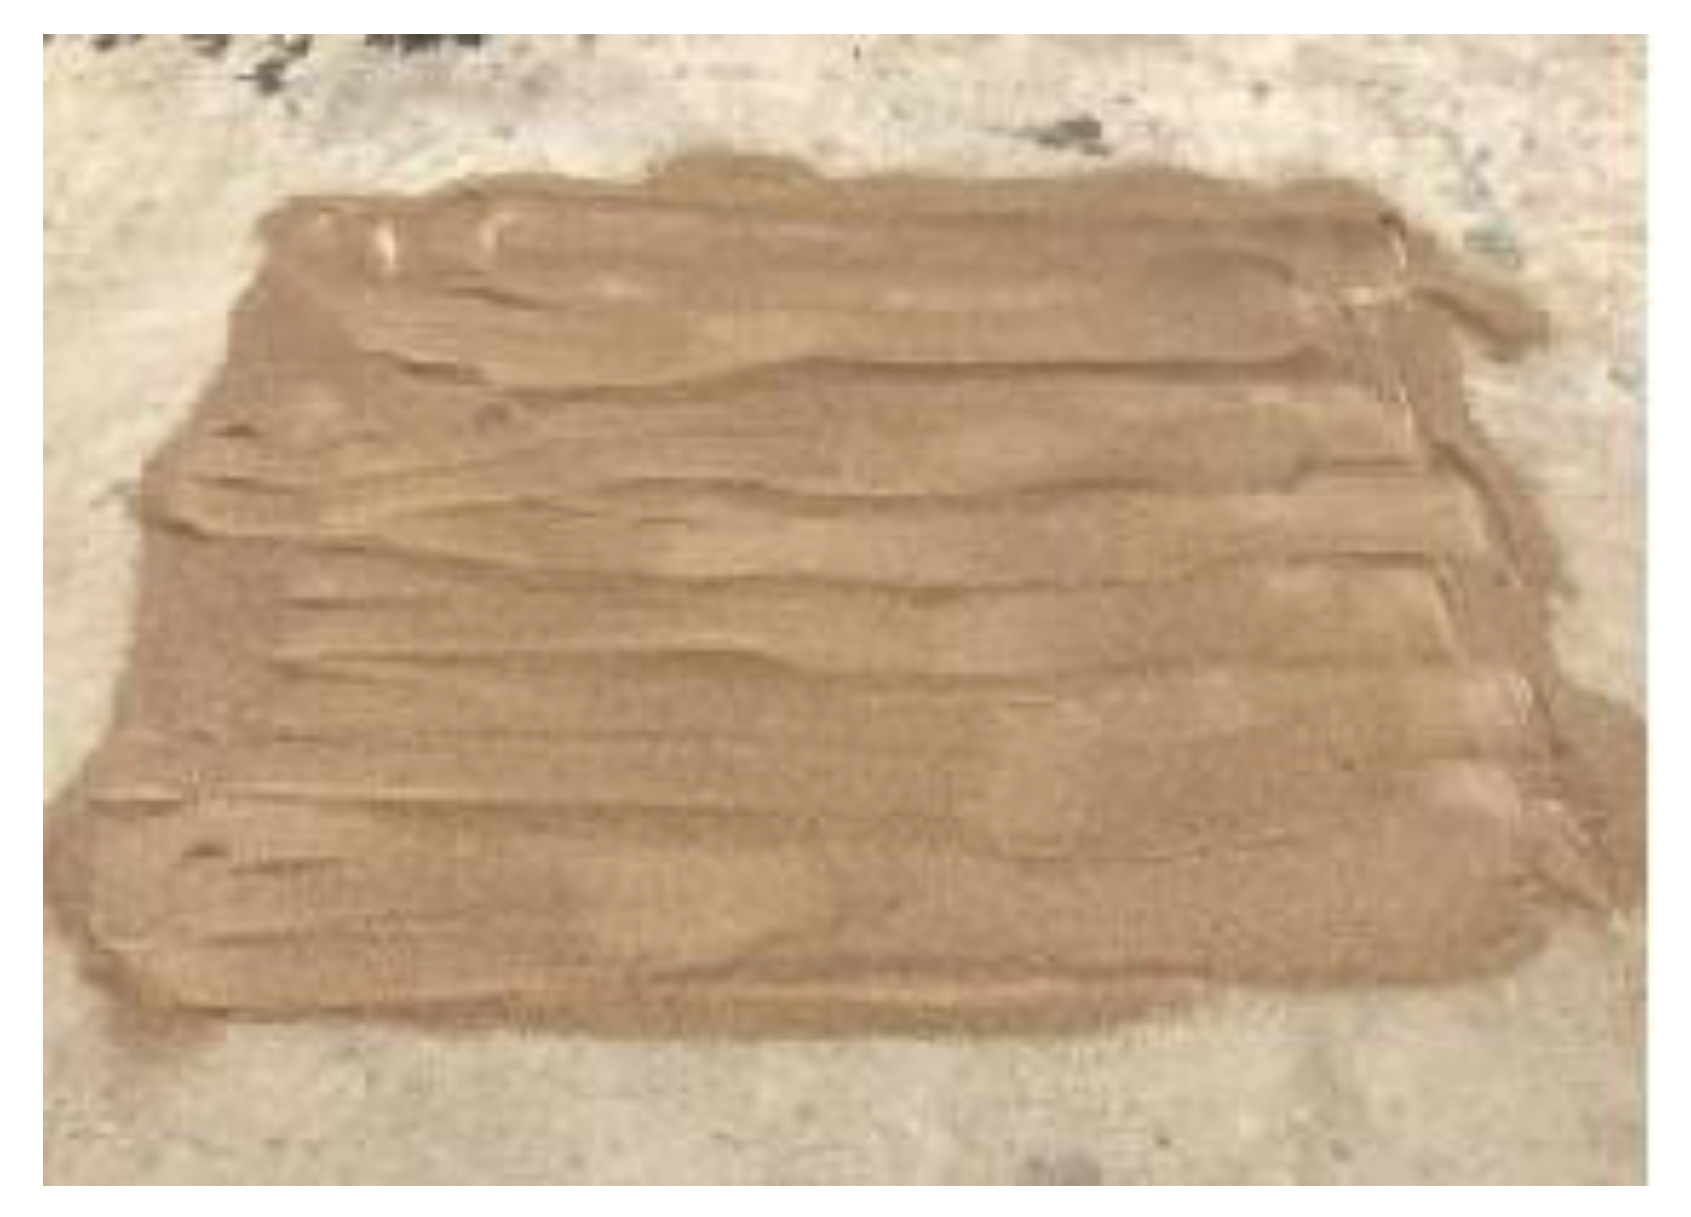
Figure 5.
Dimensions and reinforcement illustration of the test beam (Unit: mm).
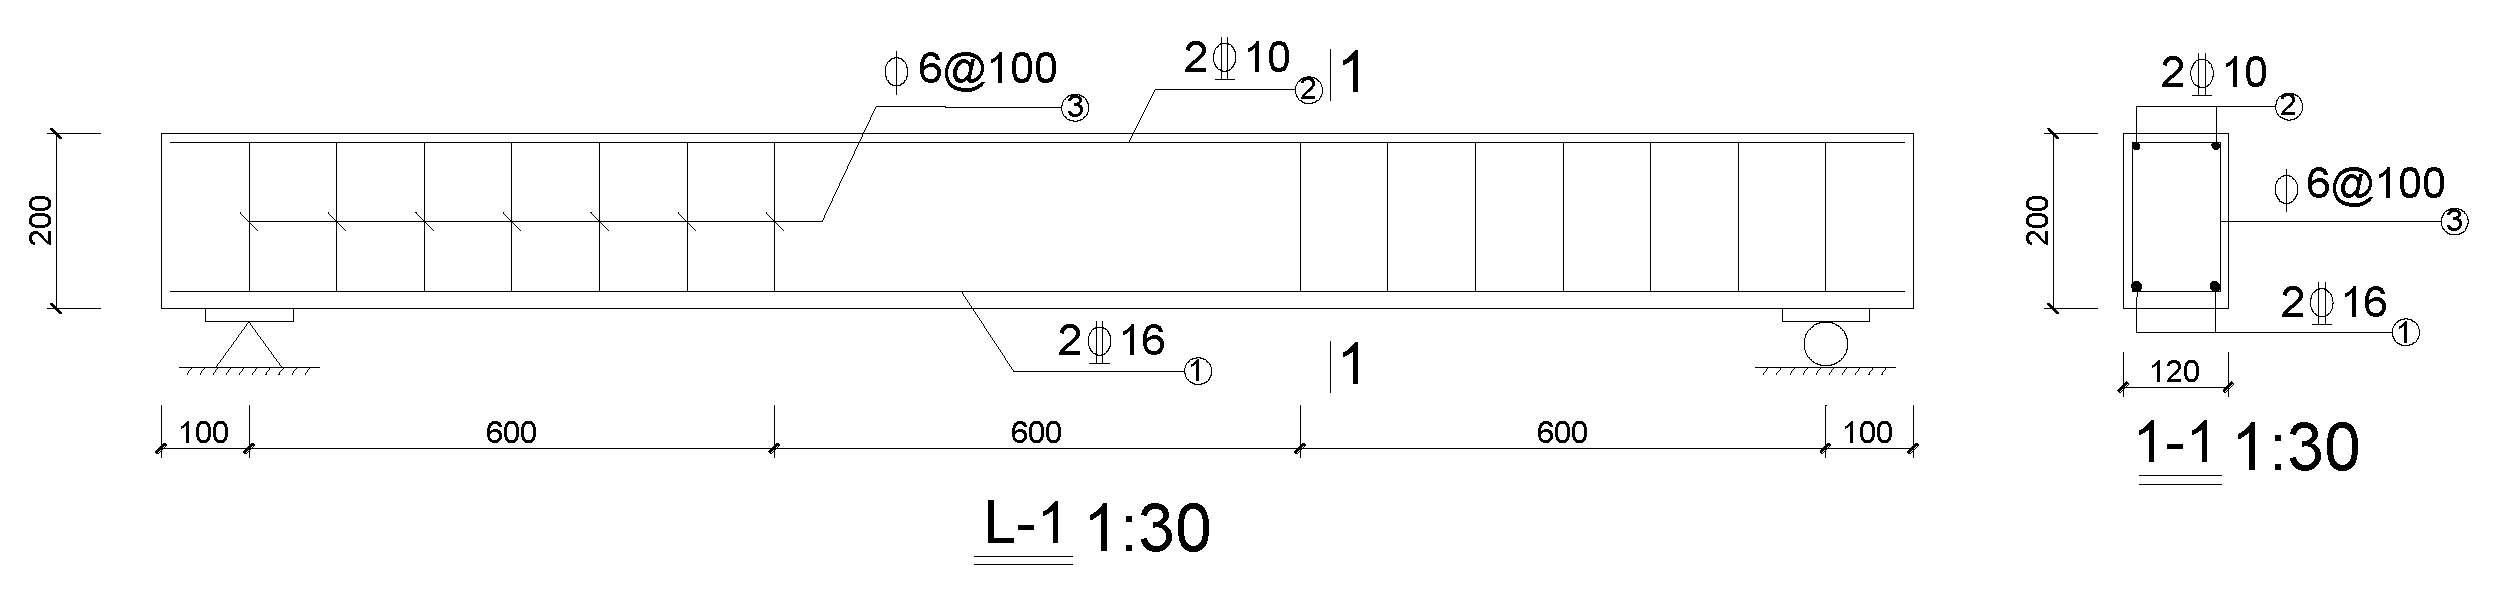
Figure 6.
Loading device diagram.
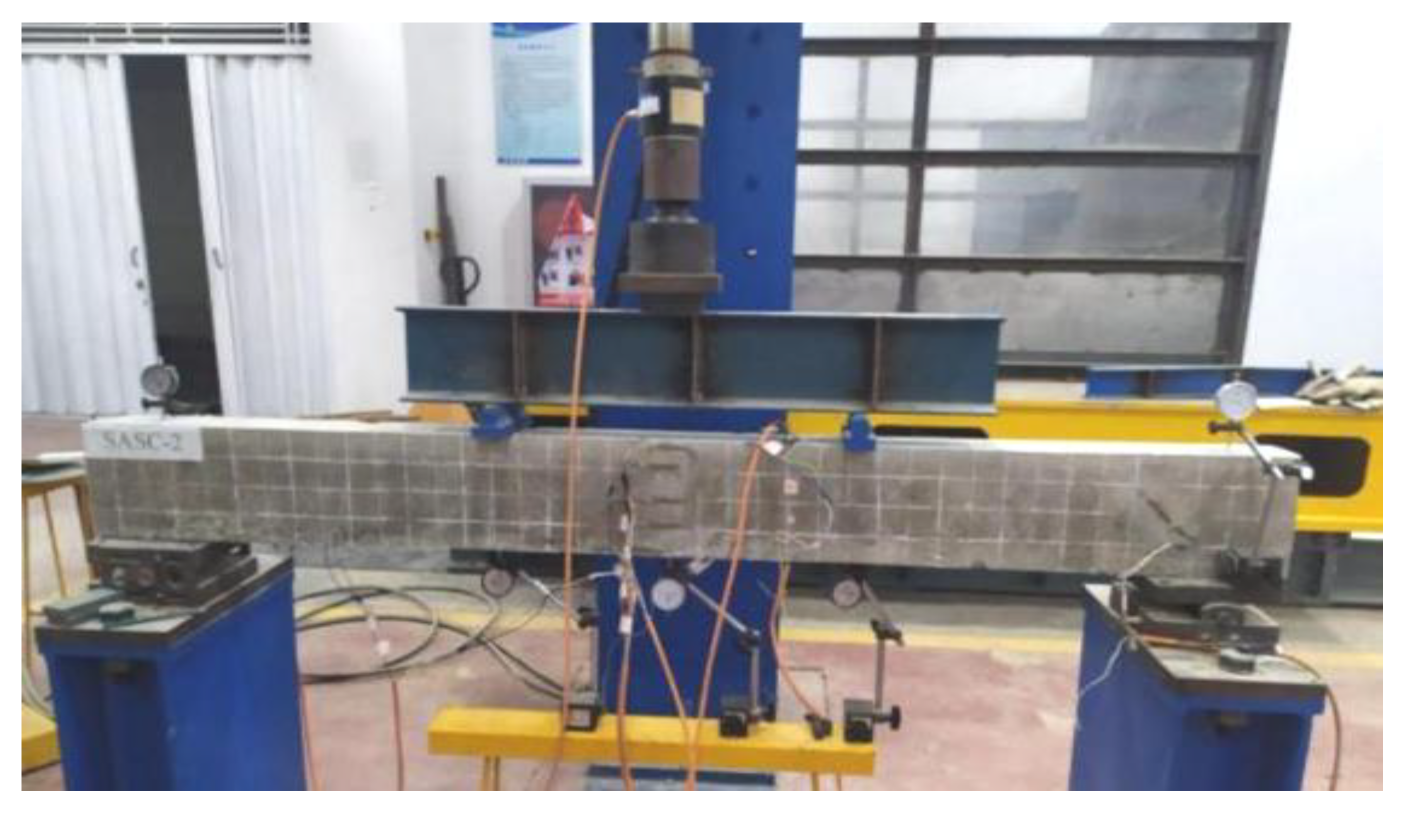
Figure 7.
MG10085-1 reading microscope.
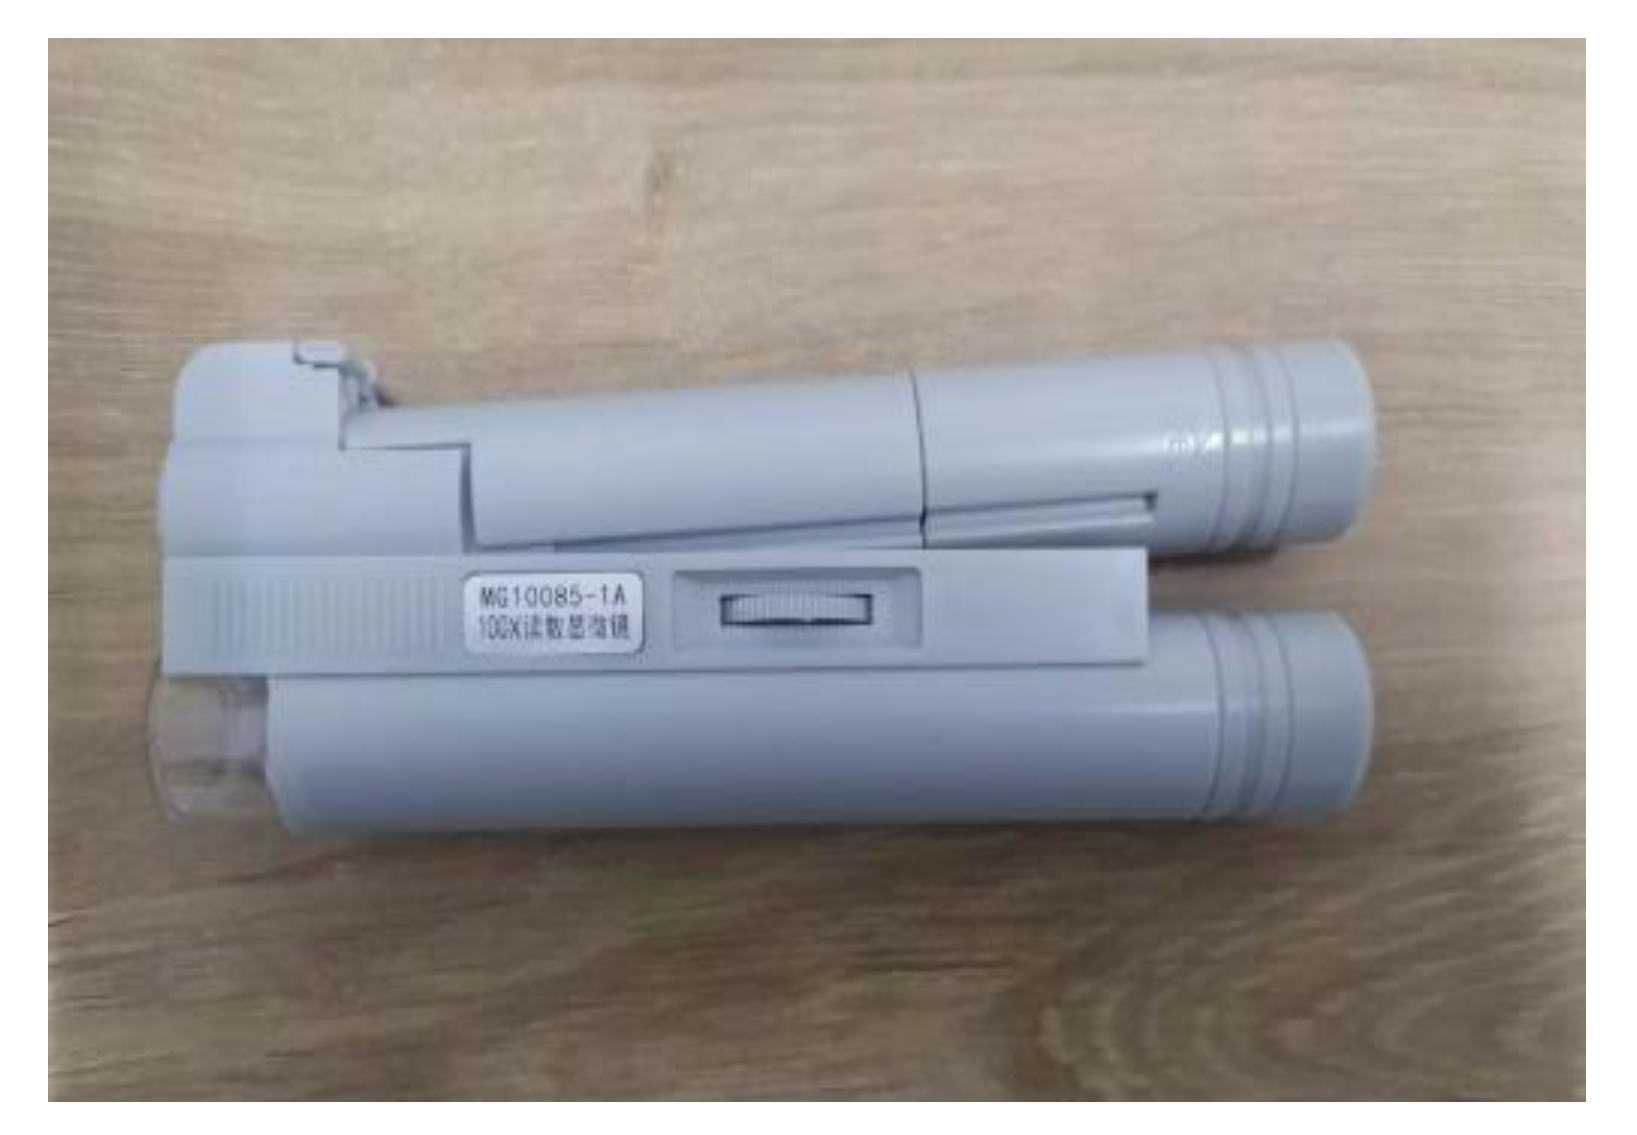
Figure 8.
Load-deflection curves at midspan for eight test beams.
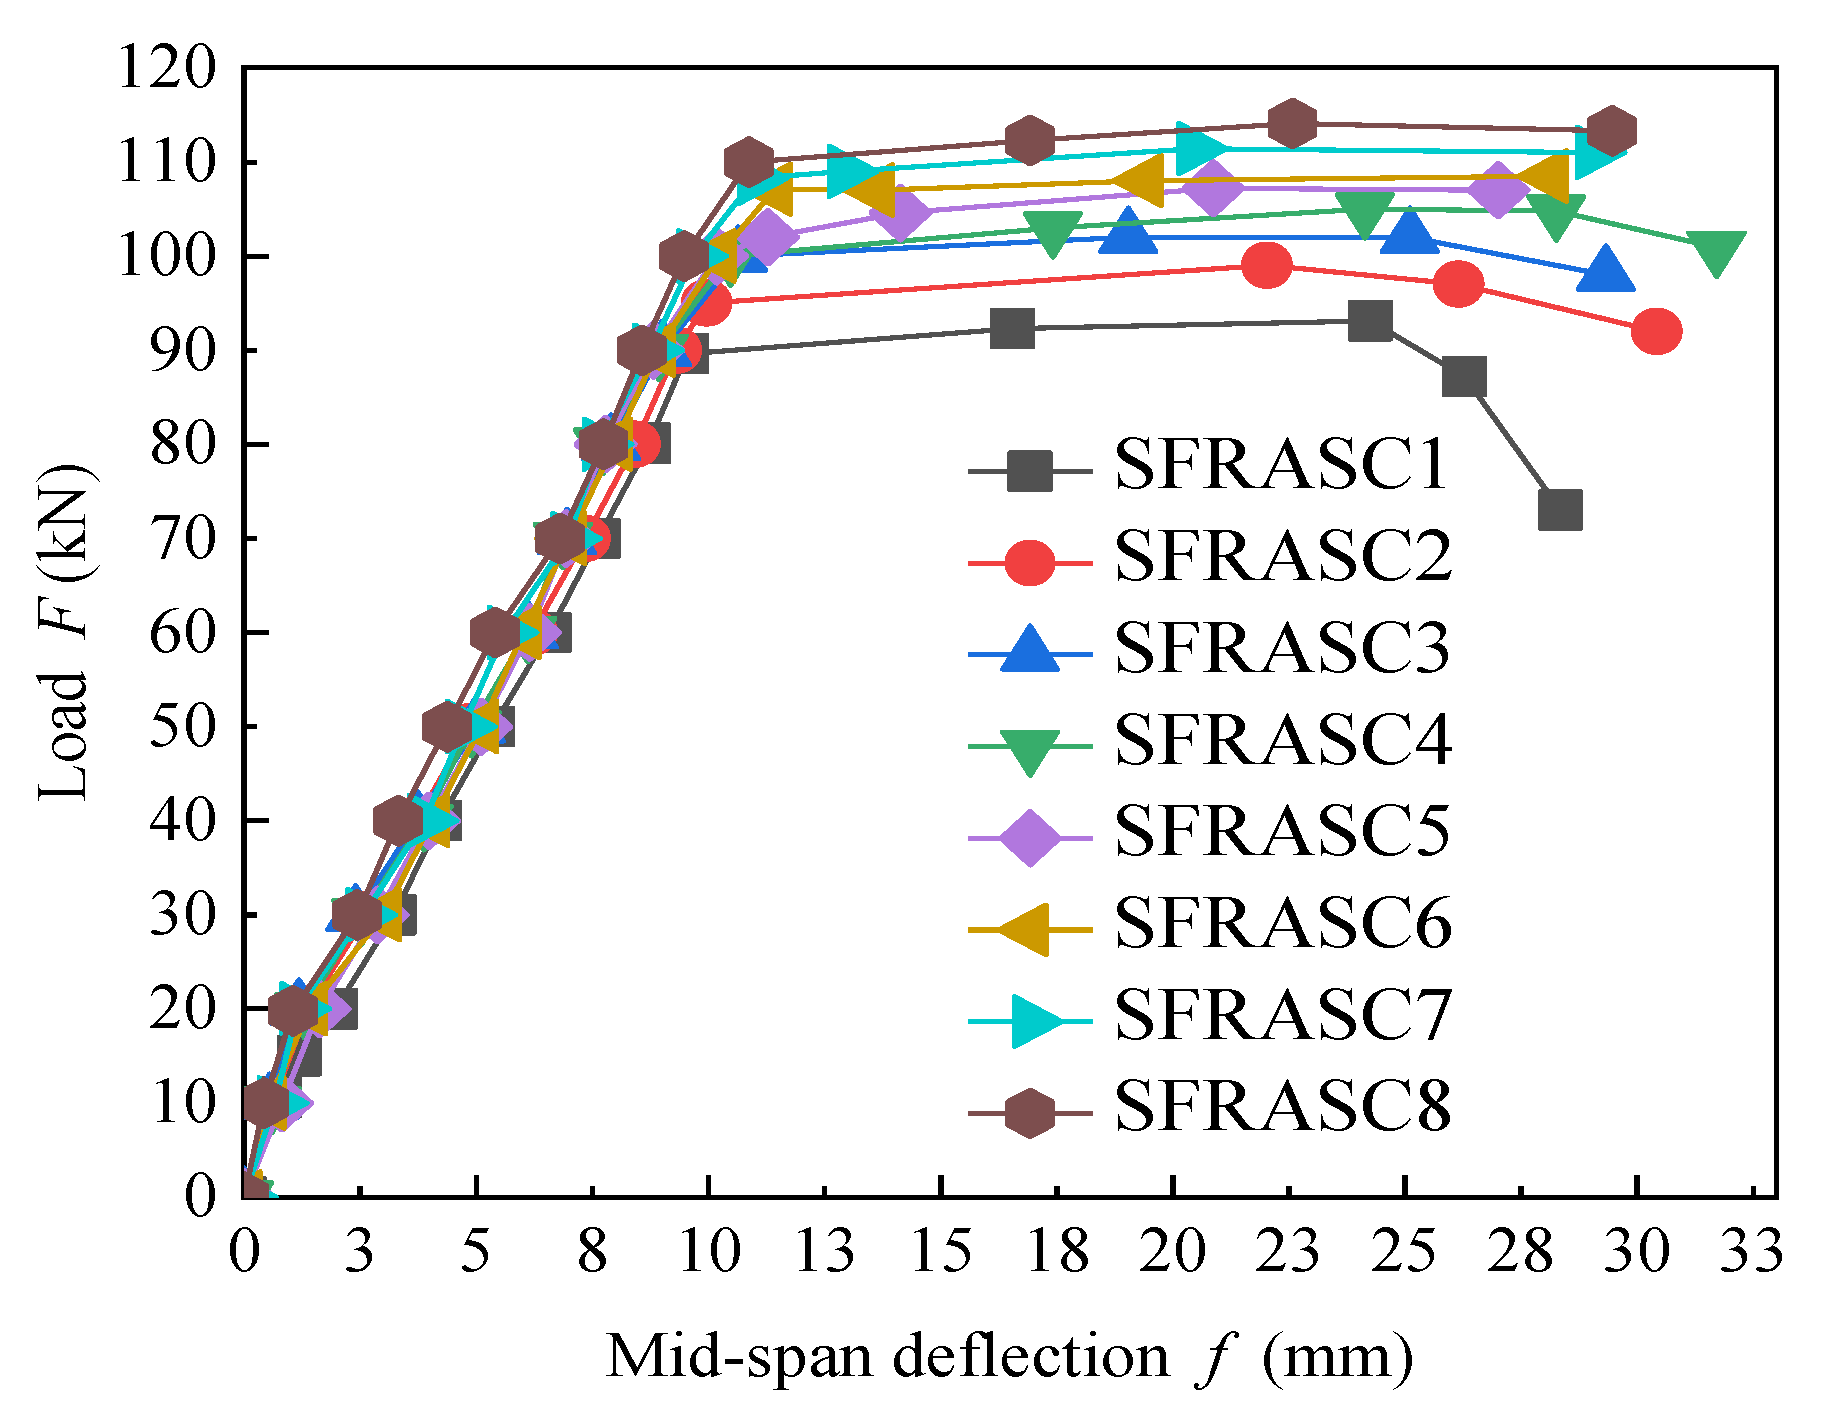
Figure 9.
Crack propagation and distribution patterns of test beams across different groups under load.
Figure 9.
Crack propagation and distribution patterns of test beams across different groups under load.
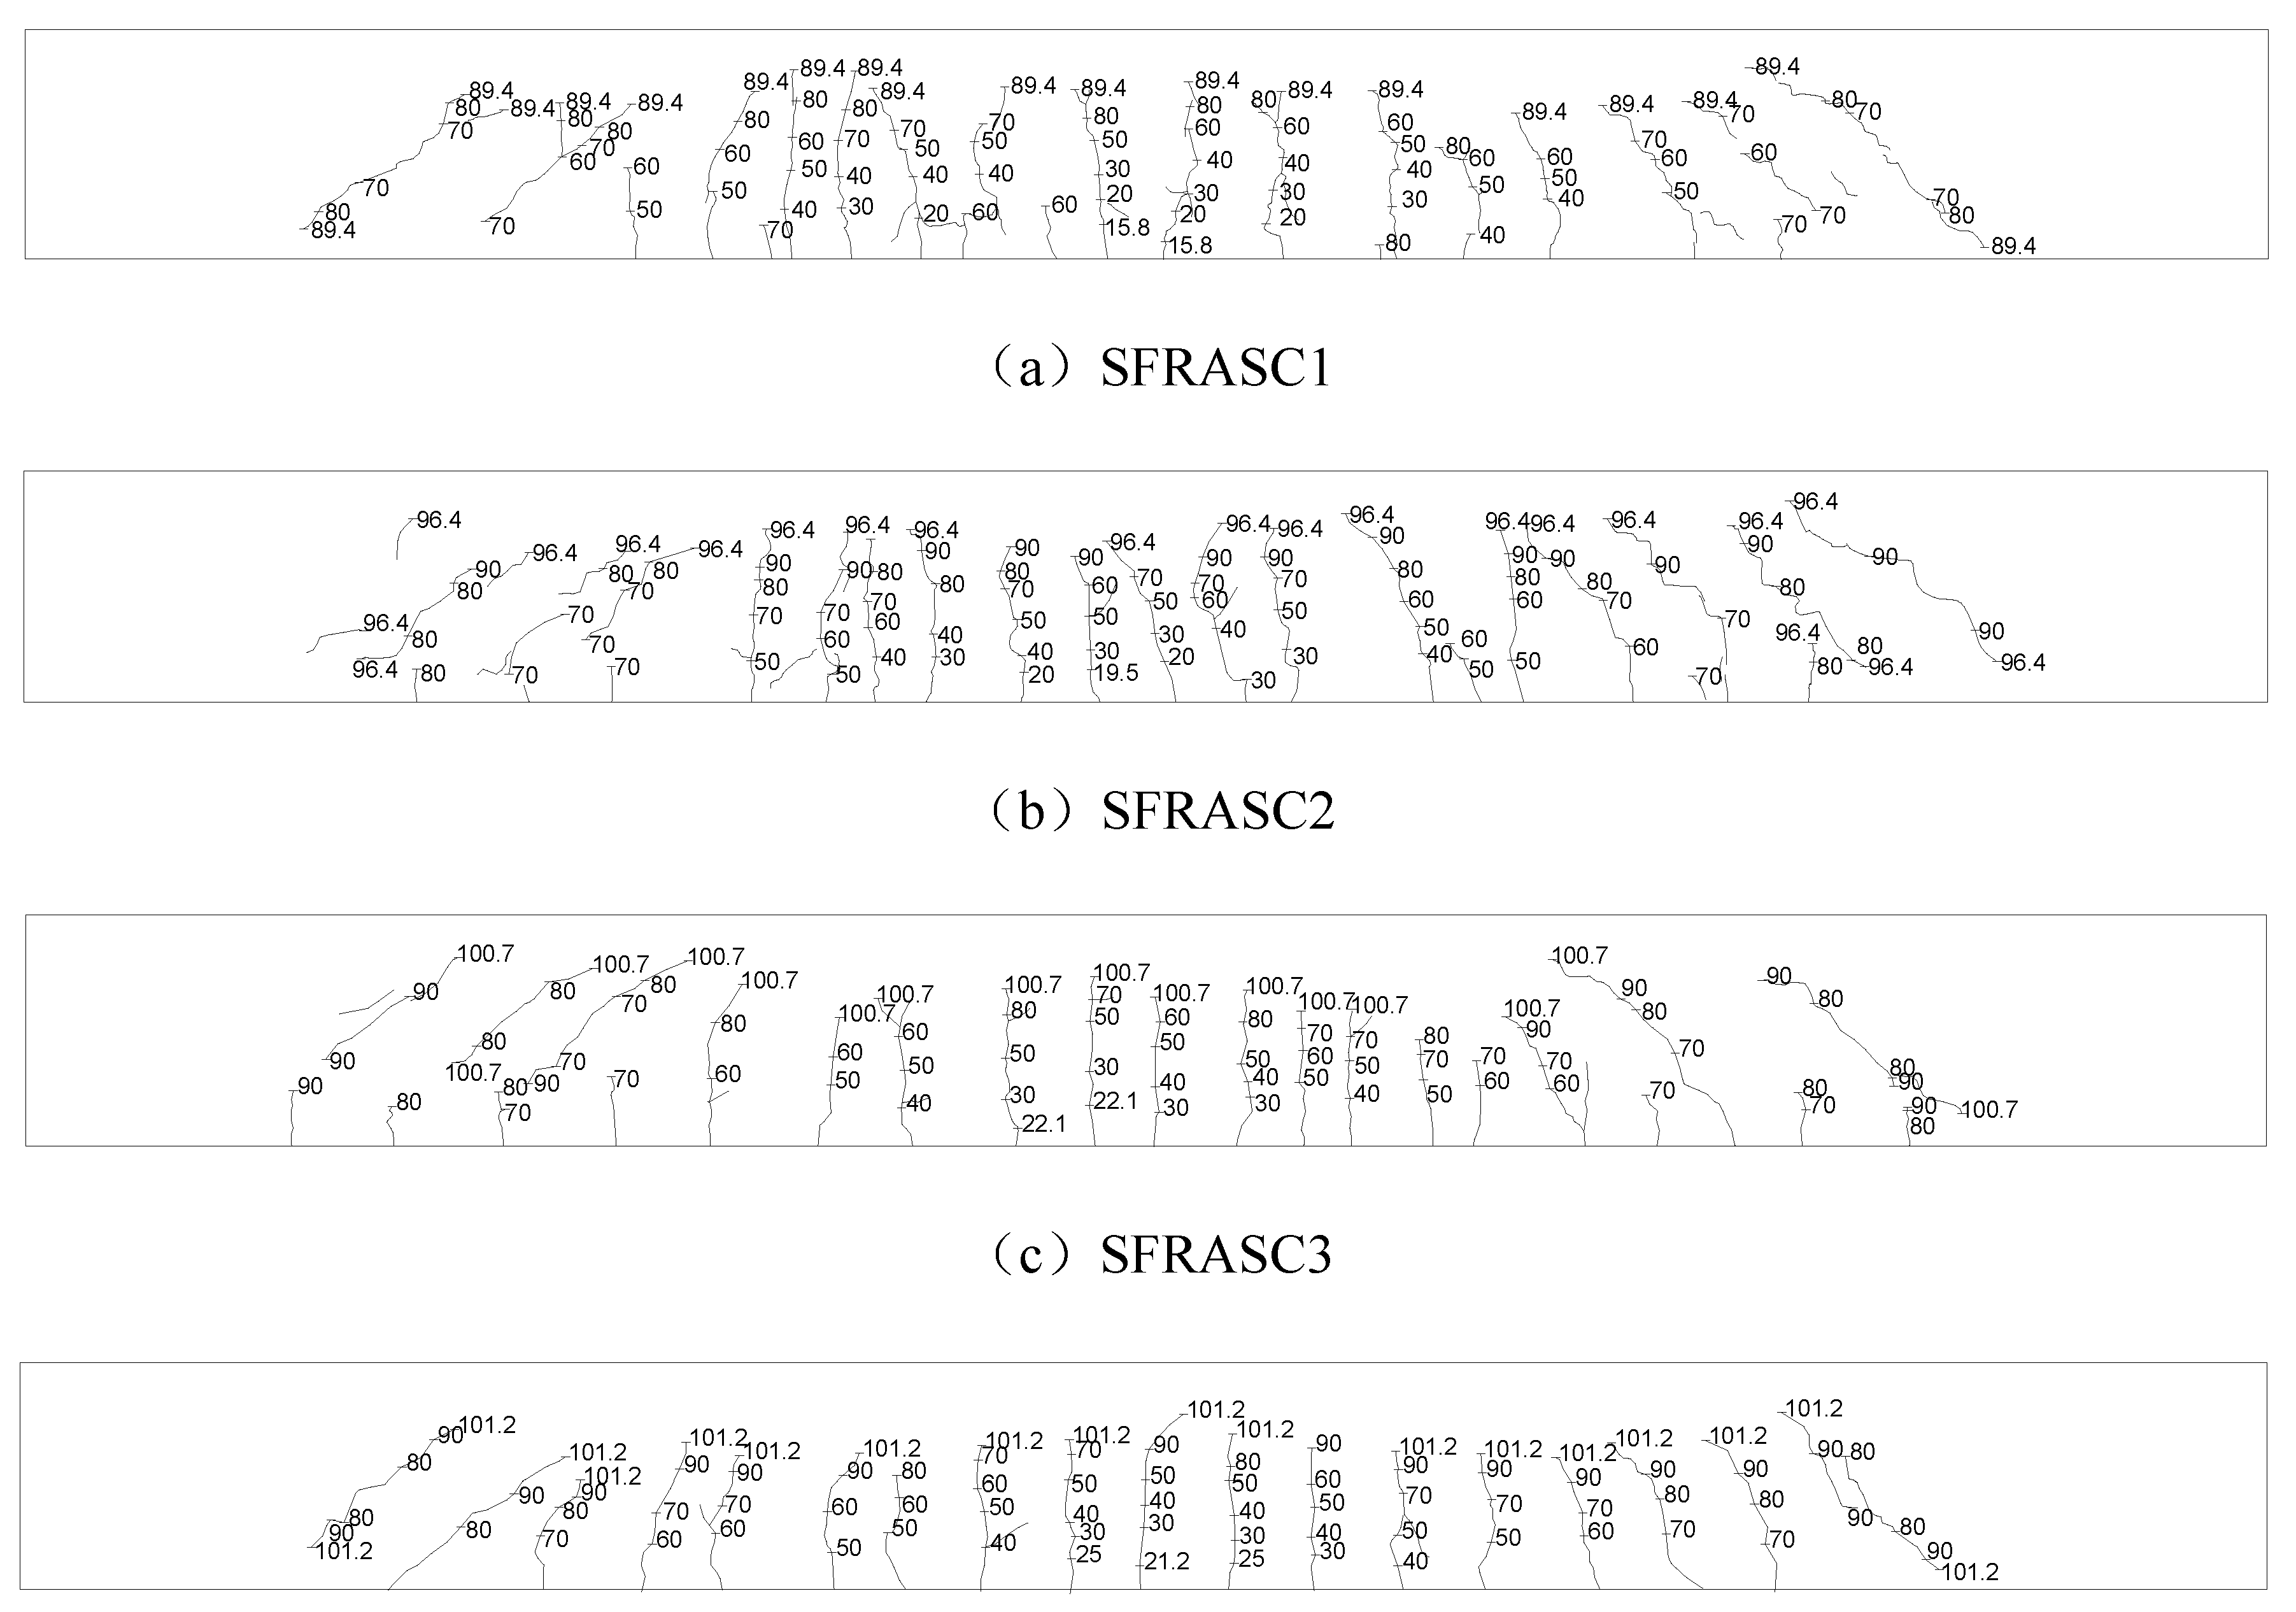
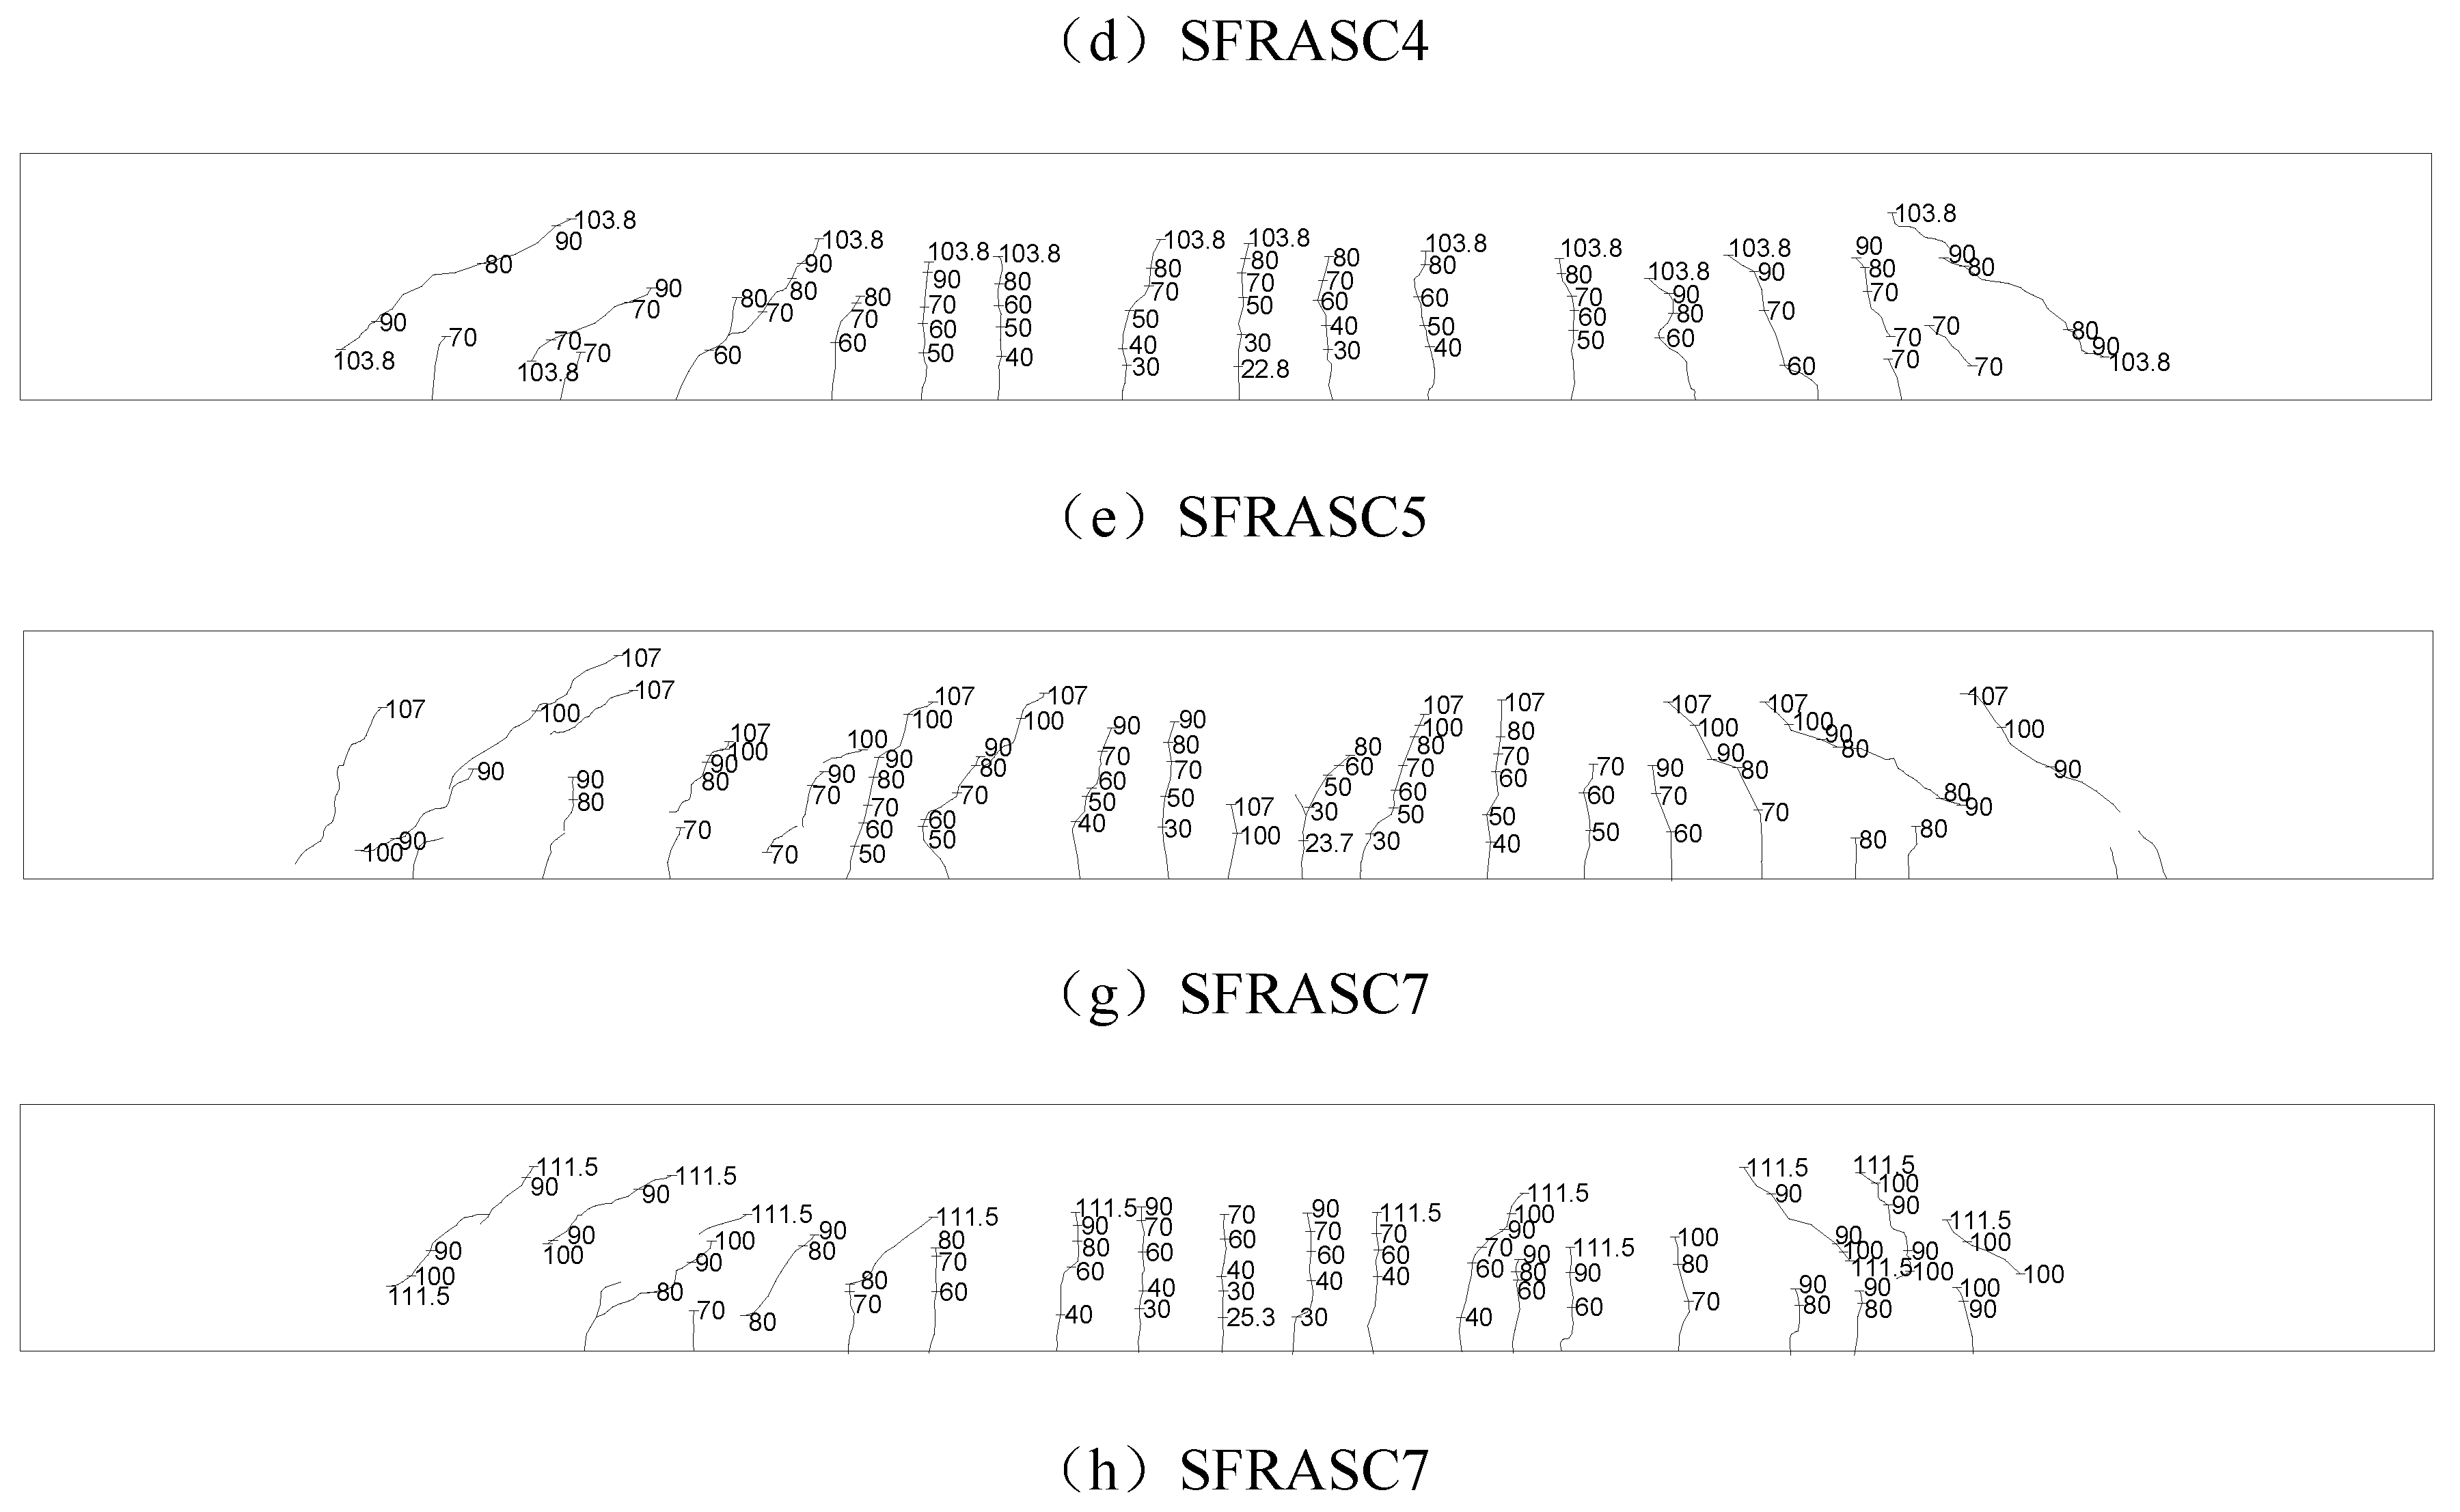
Figure 10.
Basic types of concrete cracks.
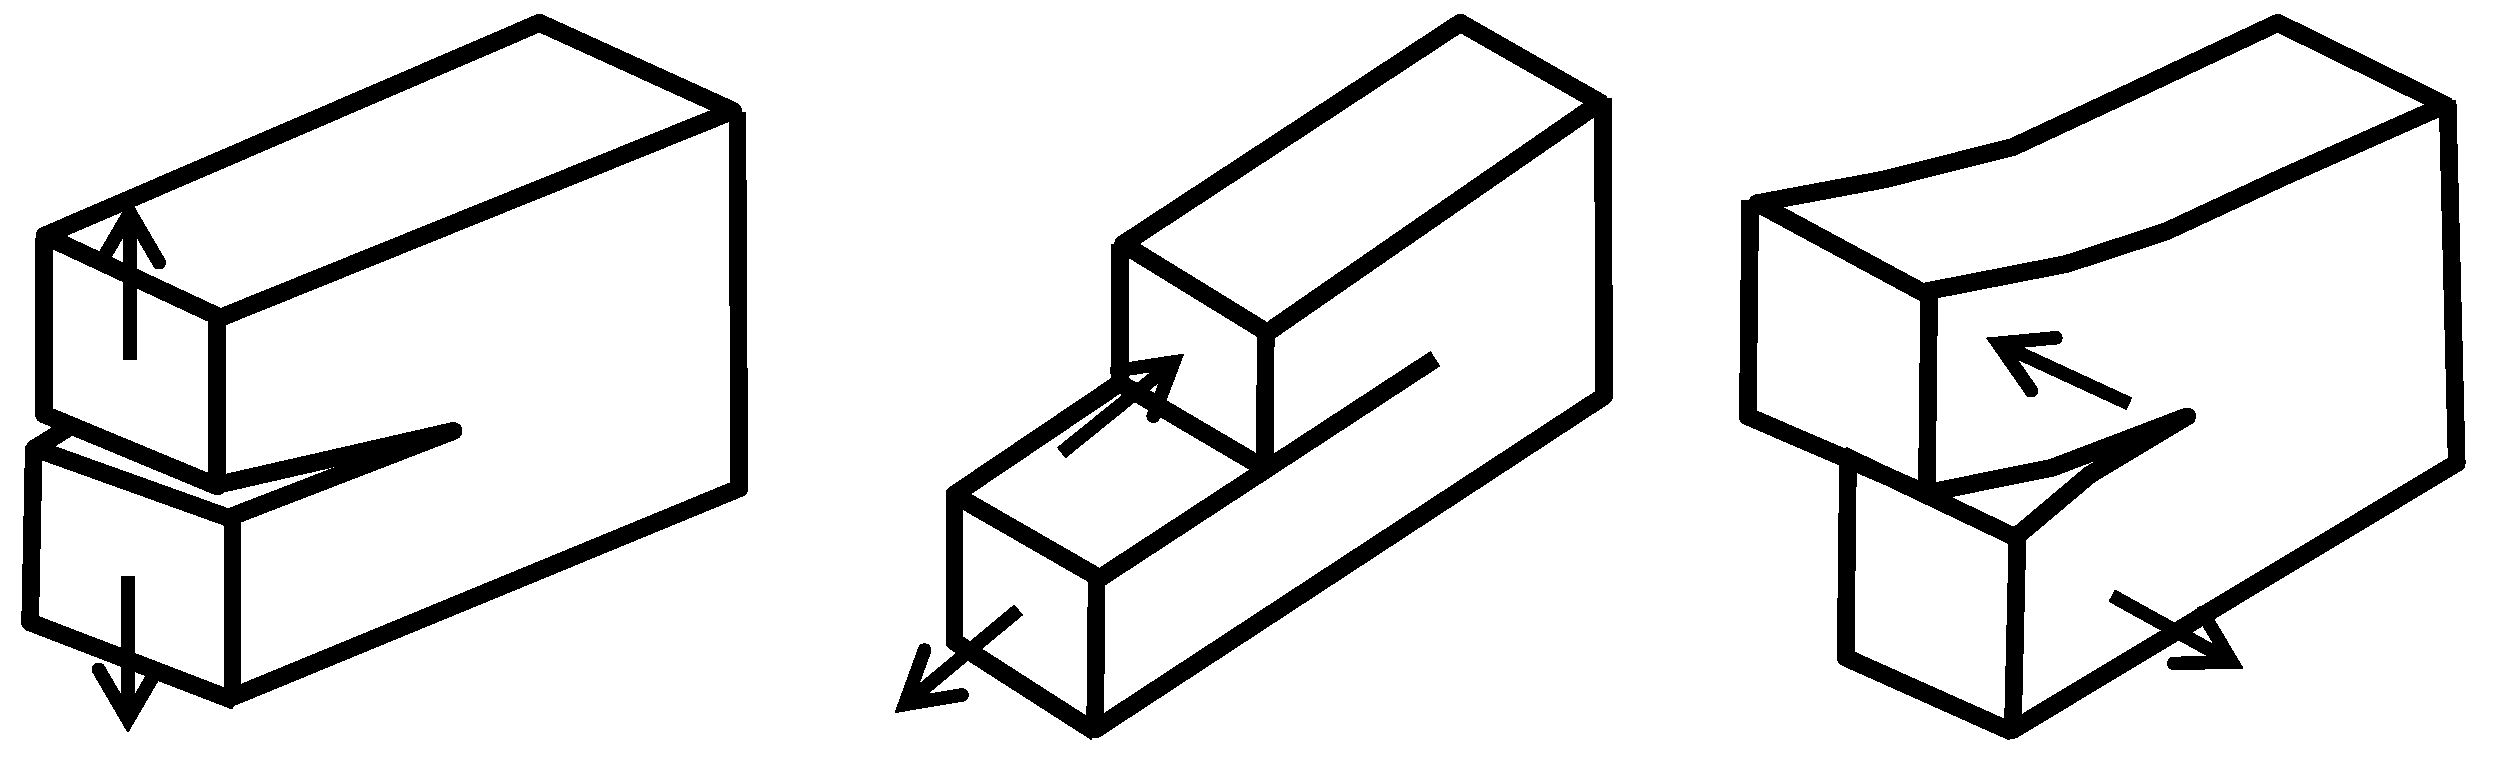
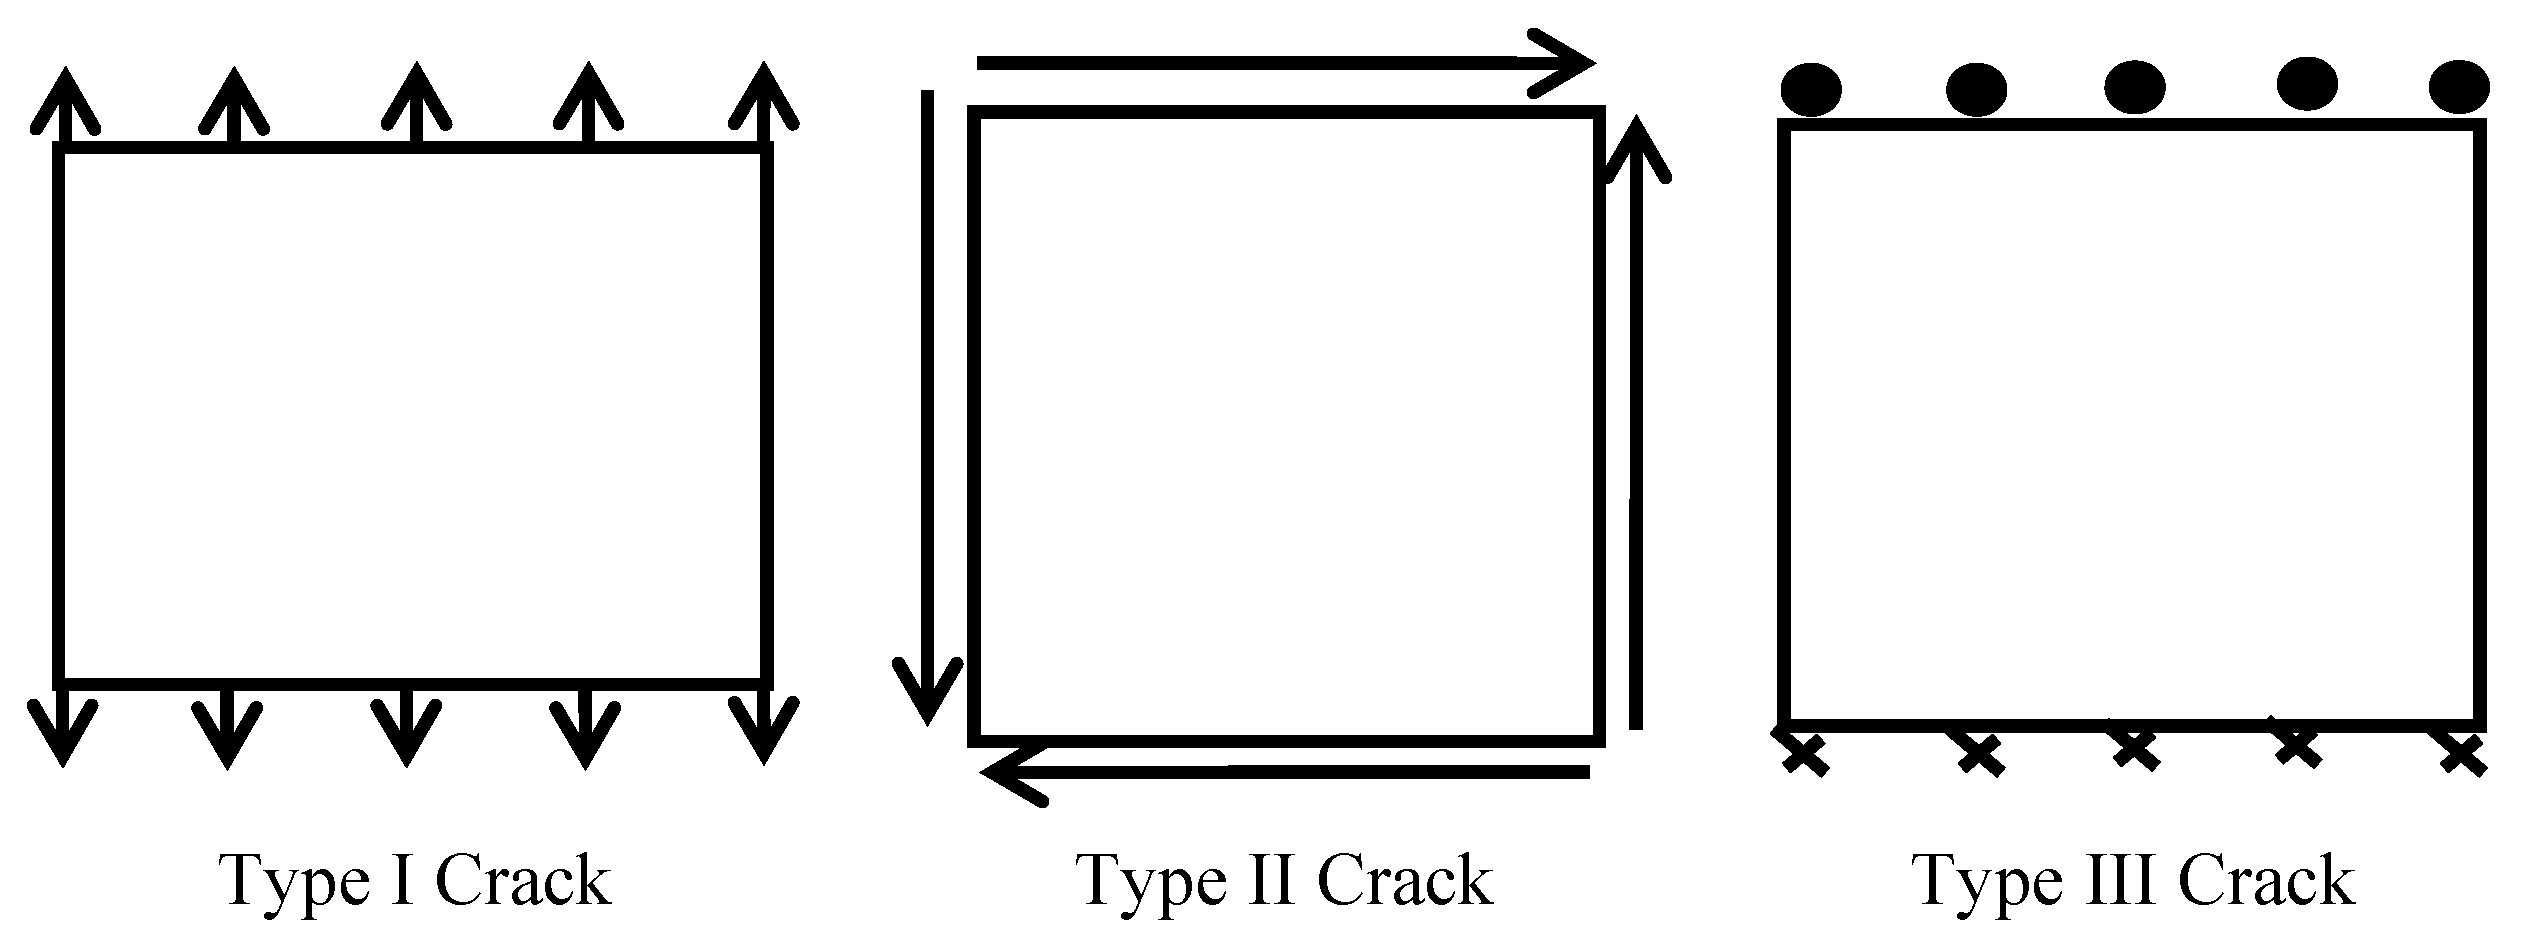
Figure 11.
Relationship curves of crack propagation path and failure states of test beams under different loadings.
Figure 11.
Relationship curves of crack propagation path and failure states of test beams under different loadings.
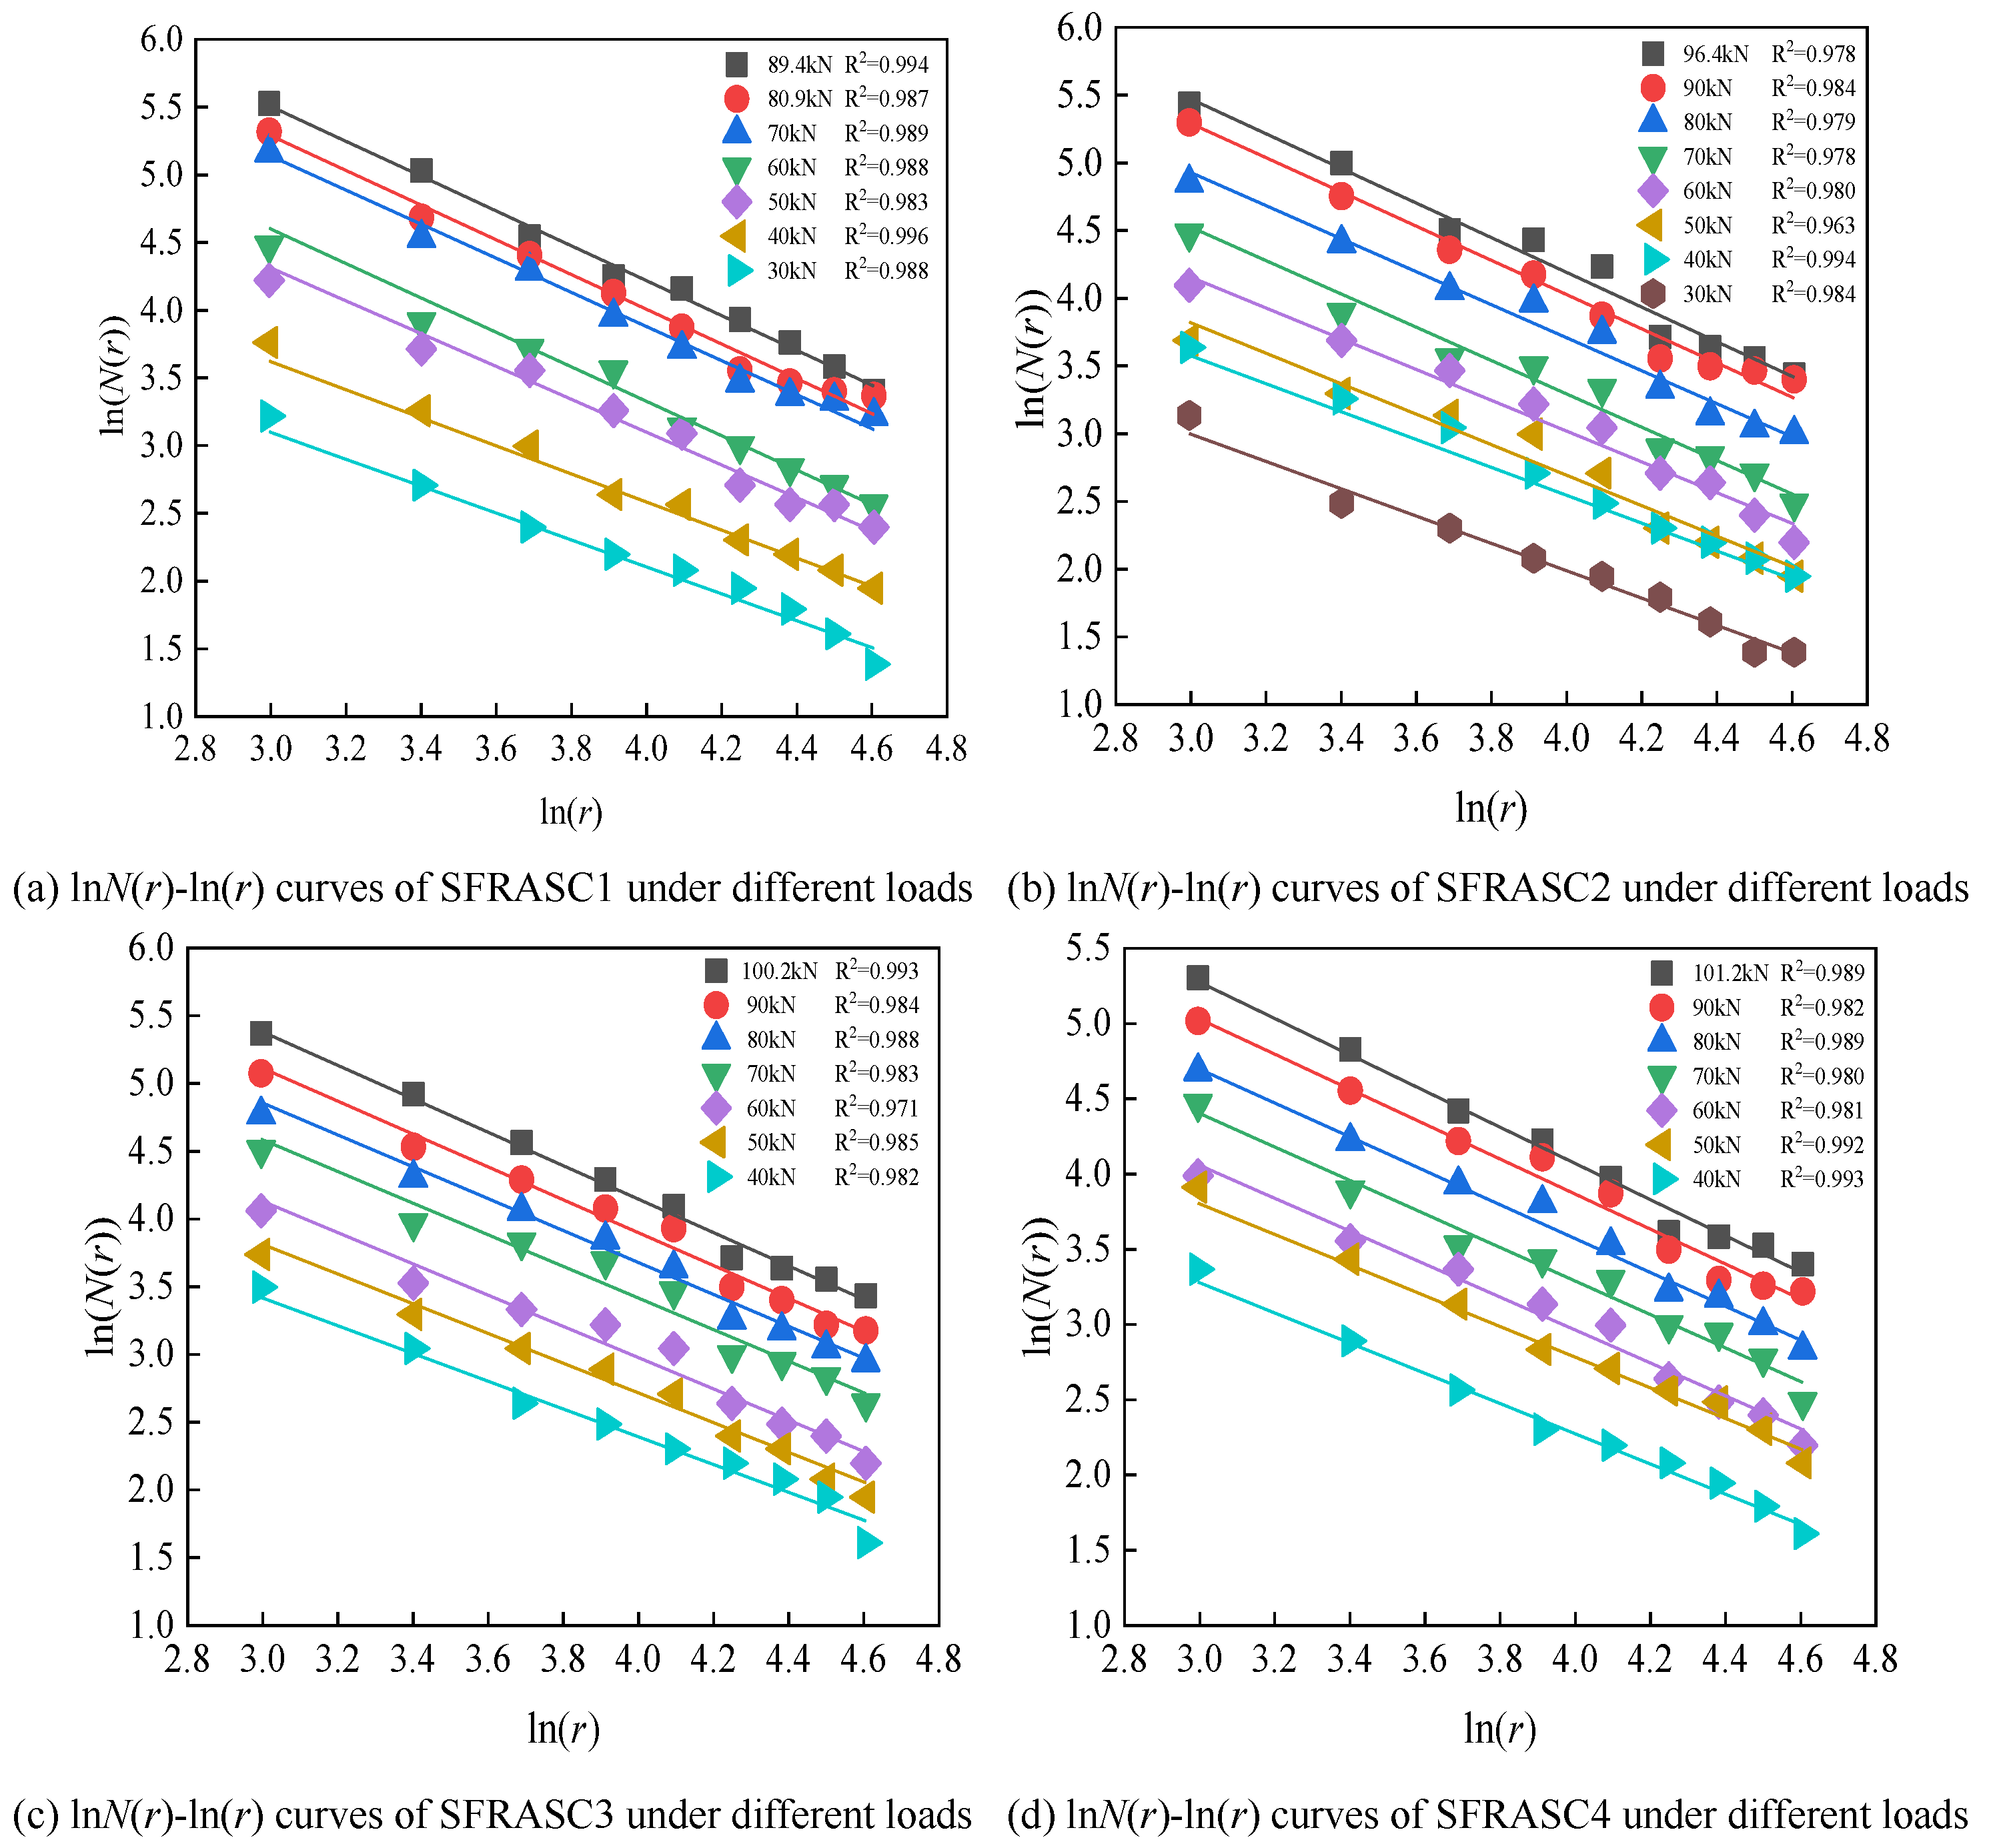
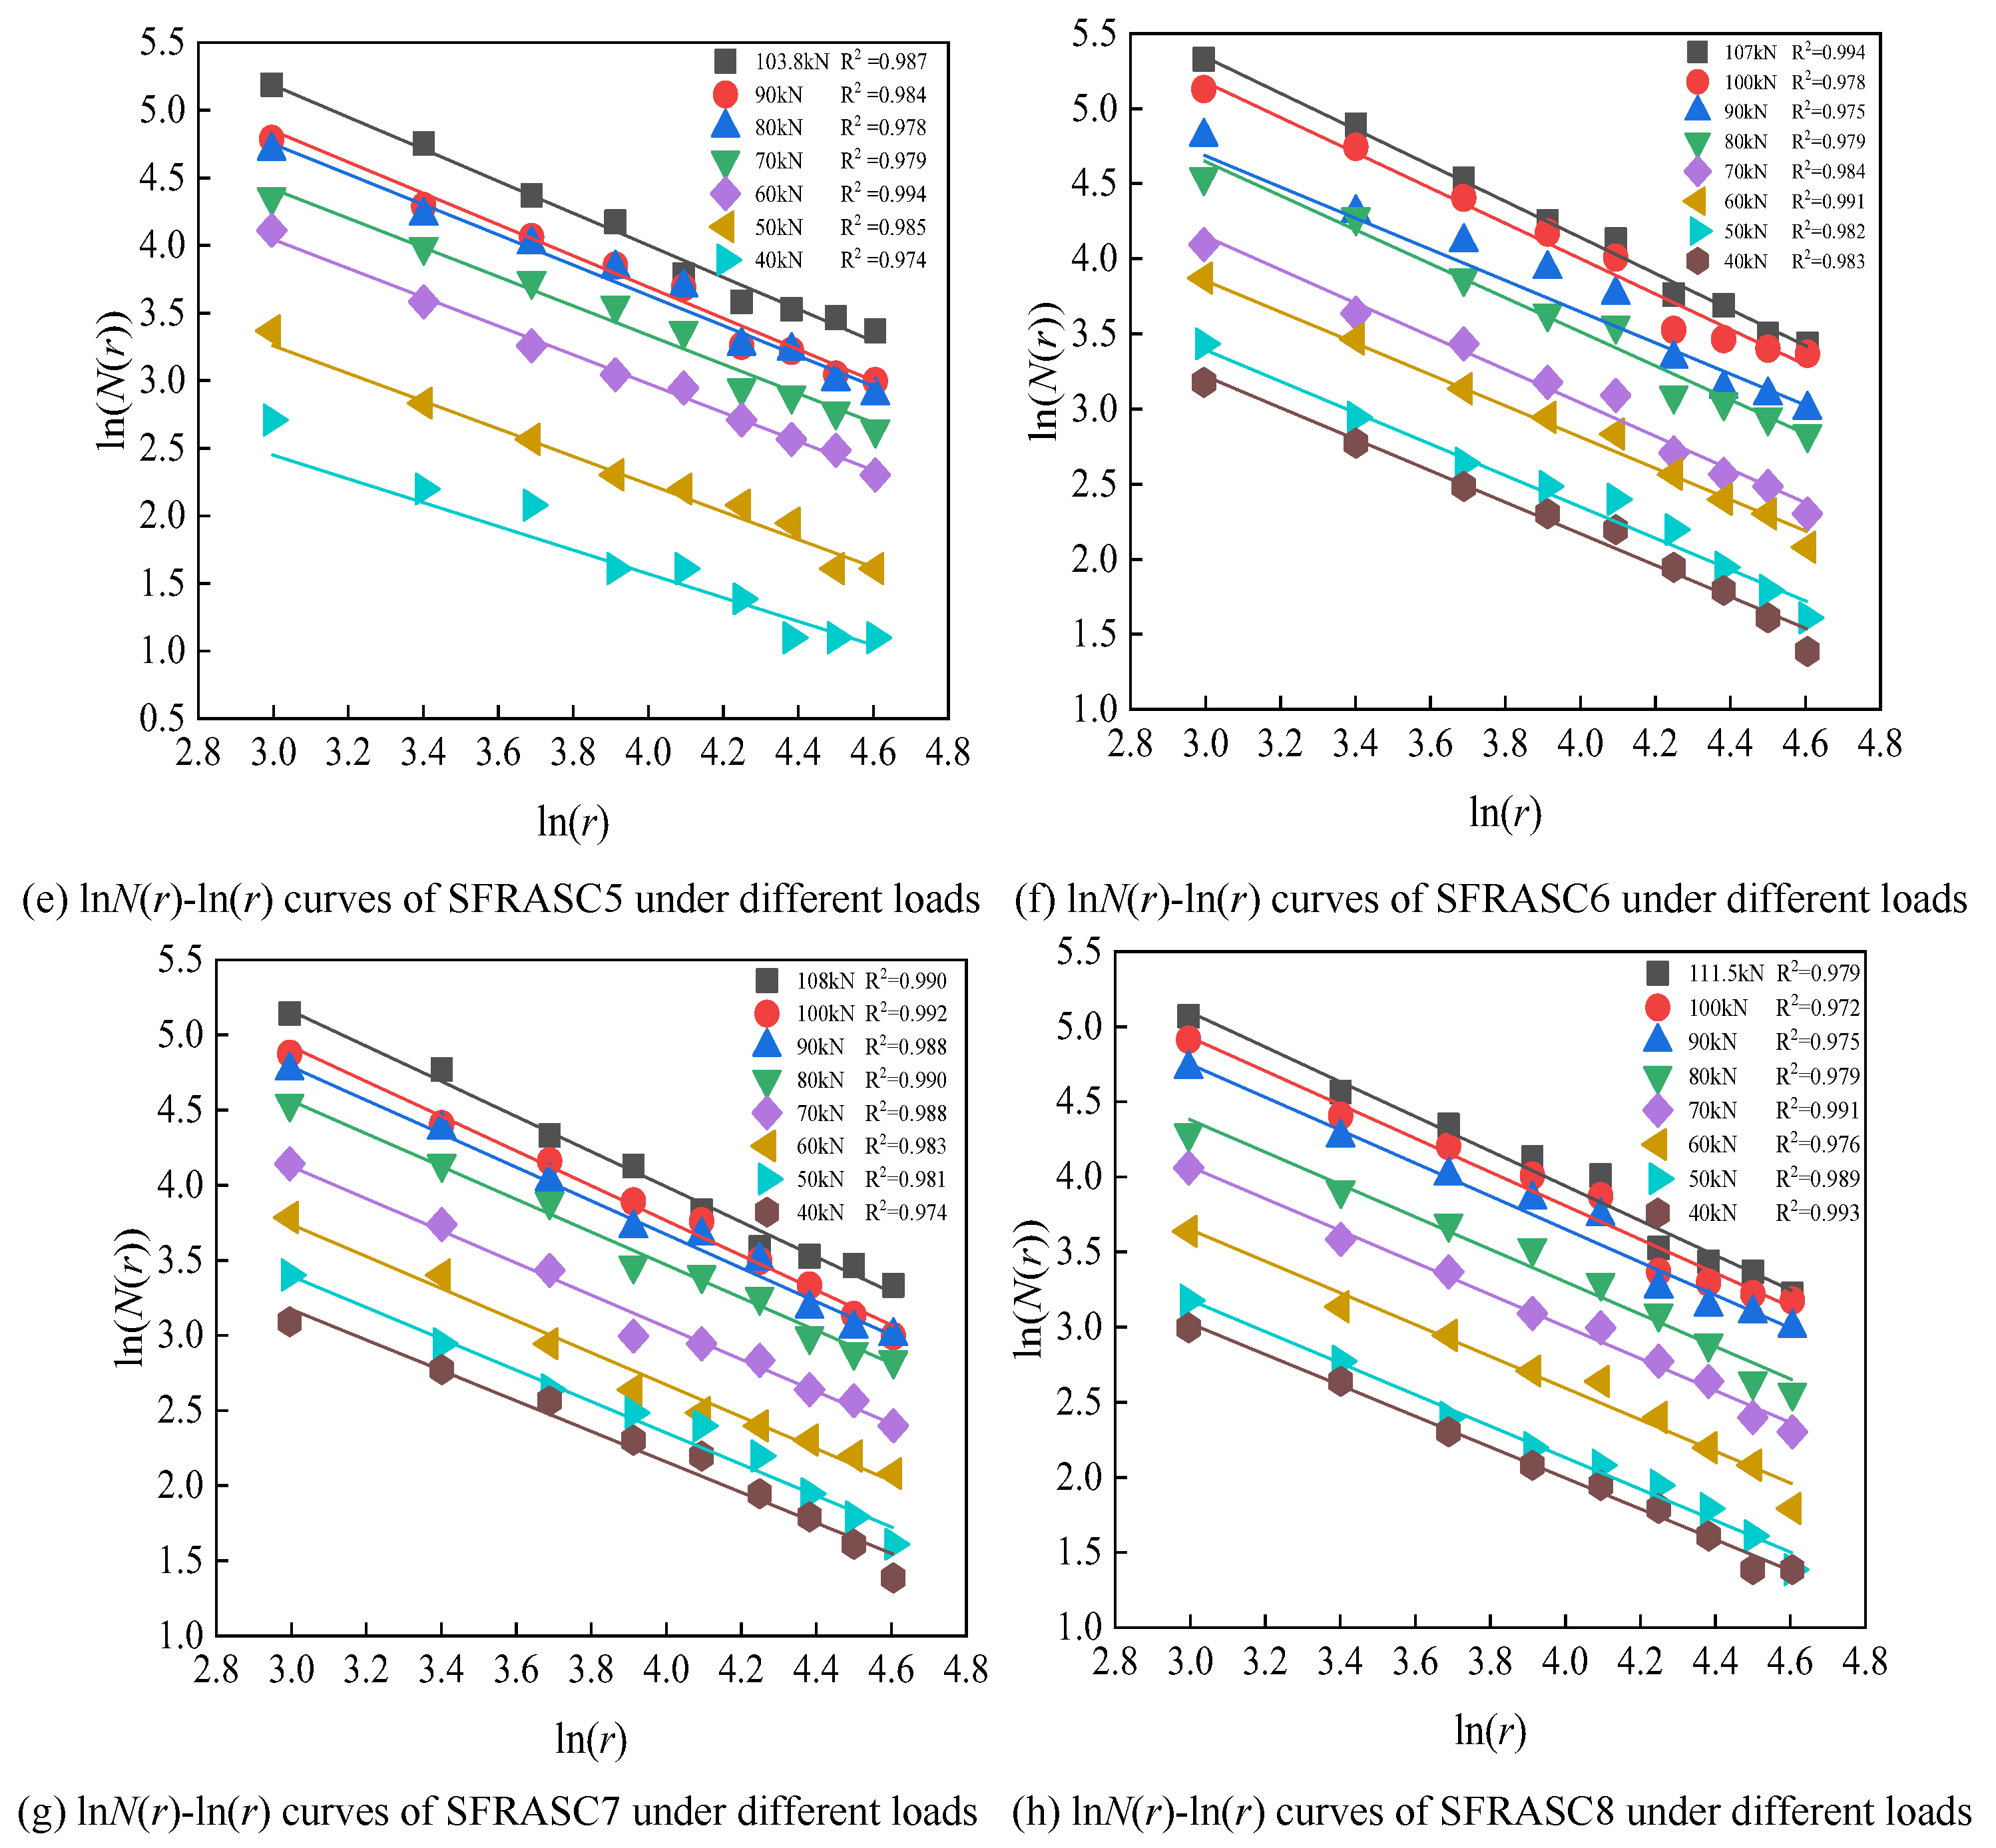
Figure 12.
The relationship between the mid-span deflection and the fractal dimension for each group of test beams.
Figure 12.
The relationship between the mid-span deflection and the fractal dimension for each group of test beams.
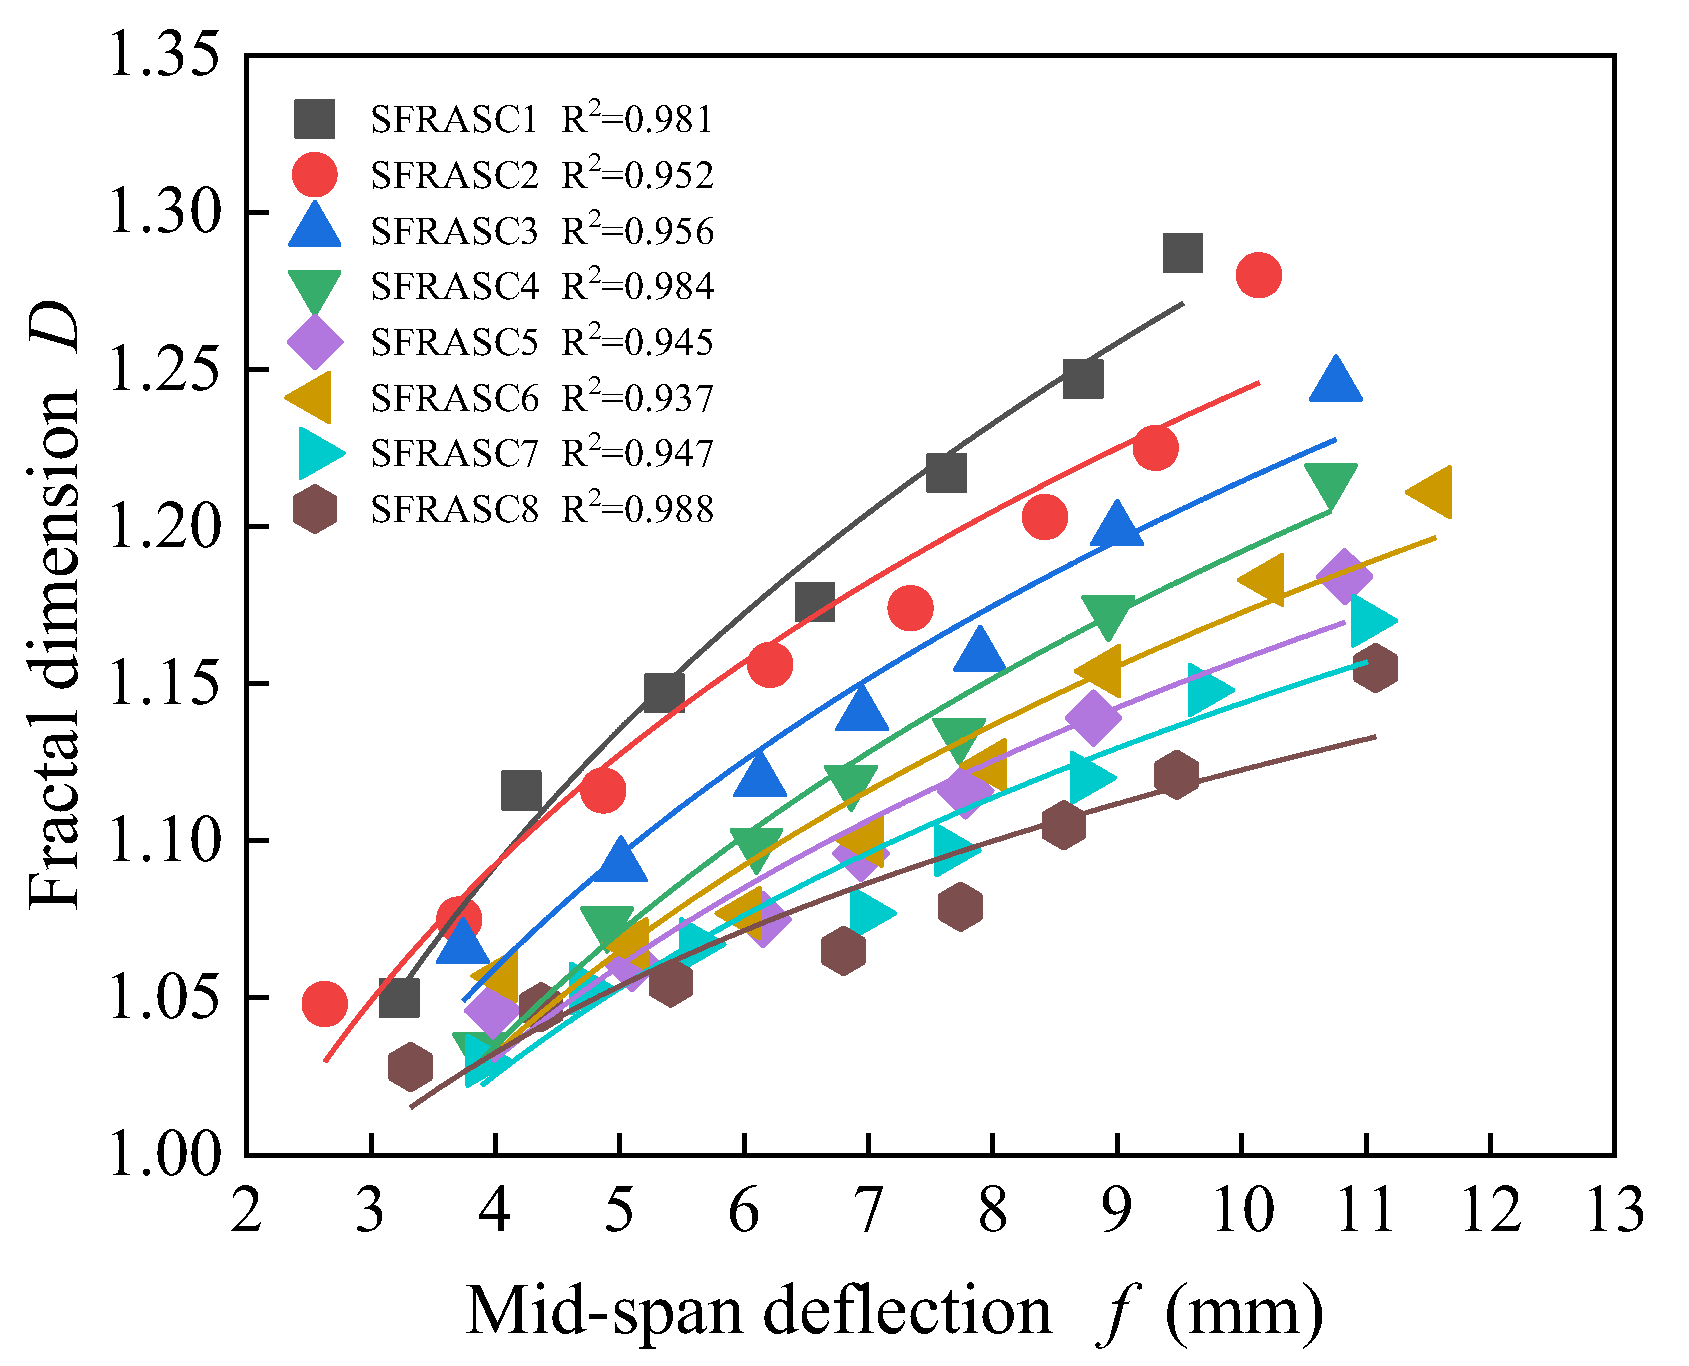
Figure 13.
Relationship between the maximum crack width and fractal dimension for each group of test beams.
Figure 13.
Relationship between the maximum crack width and fractal dimension for each group of test beams.
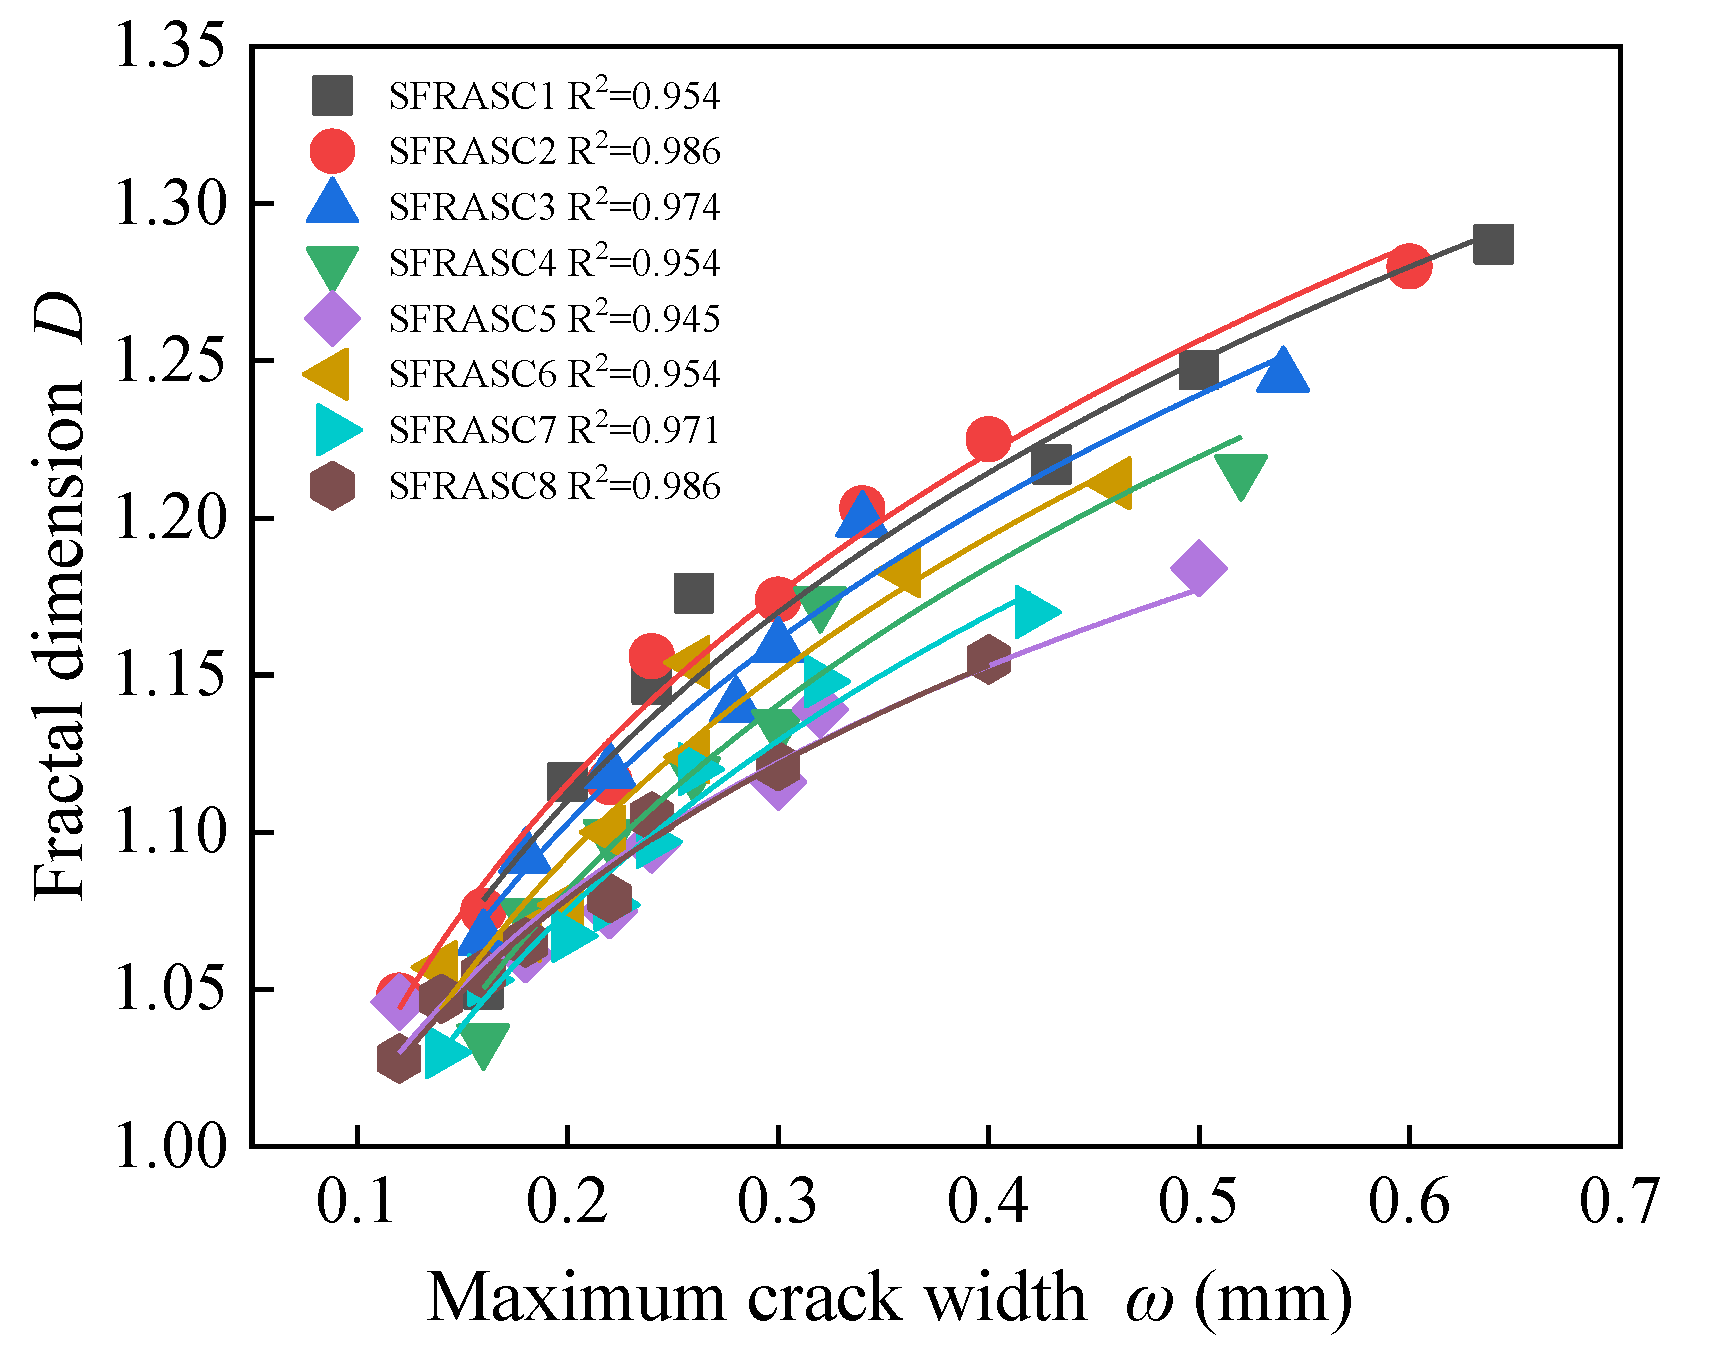

Table 1.
Composition of the alkali activator solution for the AASC.
| Water glass solution(%) | NaOH(%) | Water(%) | Moisture content (%) |
| 100 | 10.36 | 90.35 | 73.5 |
Table 2.
Mix proportion design of steel fiber reinforced AASC.
| Mix proportion of the concrete (kg/m3) | Solution to powder ratio |
Water to solid ratio |
Steel fiber content |
||||
| GGBS | Fly ash |
Fine aggregate |
Coarse aggregate |
Activator solution |
|||
| 280 | 120 | 615 | 1260 | 298.5 | 0.75 | 0.55 | 0.0% |
Table 3.
Test load conditions of 8 test beams.
| Number | Steel fiber content (%) | Cracking load on the cross section Pcr(kN) | Cracking load of inclined section Vcr(kN) | Ultimate load Pu(kN) |
| SFRASC1 | 0.0 | 15.8 | 45.2 | 89.4 |
| SFRASC2 | 0.5 | 19.5 | 50.0 | 96.4 |
| SFRASC3 | 0.9 | 22.1 | 55.2 | 100.2 |
| SFRASC4 | 1.0 | 21.2 | 57.4 | 101.2 |
| SFRASC5 | 1.1 | 22.8 | 60.7 | 103.8 |
| SFRASC6 | 1.2 | 23.7 | 63.1 | 107.0 |
| SFRASC7 | 1.3 | 24.4 | 65.7 | 108.0 |
| SFRASC8 | 1.4 | 25.3 | 67.5 | 110.5 |
Table 4.
Crack width and distribution characteristics of test beams subjected to an 80 kN load.
| Number | Steel fiber content (%) | Width of crack (mm) | Crack distribution characteristics |
| SFRASC1 | 0.0 | 0.50 | Concentration and vertical development |
| SFRASC2 | 0.5 | 0.34 | The main crack is clearly visible at mid-span, with only a few horizontal cracks observed. |
| SFRASC3 | 0.9 | 0.31 | Cracks are interconnected, but their width increases at a slow rate. |
| SFRASC4 | 1.0 | 0.29 | Diagonal cracks propagate in the bending-shear region. |
| SFRASC5 | 1.1 | 0.28 | Crack intersections are observed, exhibiting complex propagation directions. |
| SFRASC6 | 1.2 | 0.26 | The crack height is restricted, and the distribution is irregular. |
| SFRASC7 | 1.3 | 0.24 | Cracks are tortuous, accompanied by numerous fine secondary cracks. |
| SFRASC8 | 1.4 | 0.23 | Crack development remains limited, with relatively few secondary cracks. |
Table 5.
Comparative analysis of five fractal dimensions.
| Type | Calculation Method | Applicable Scenarios | Advantages | Limitations |
| Capacity Dimension (Dcap) | The box-counting method is used to compute the number of covering boxes, denoted as N(ε) | General fractals, such as cracks, surface roughness, or damage zones of beams | Strong versatility, straightforward calculation | Sensitive to image resolution; requires multi-scale fitting |
| Information Dimension (DI) | Based on probability distribution Pi | Non-uniform fractals, such as mass distribution or energy dissipation | Quantifies distribution heterogeneity | Complex to calculate; requires large datasets |
| Correlation Dimension (DC) | Correlation integral C(ε) to analyze point pair distance distribution | Dynamical system attractors, time series, such as vibration signals | Suitable for analyzing chaotic systems | Requires phase space reconstruction; parameter sensitive |
| Generalized Dimension (Dq) | Multifractal spectrum | Multi-scale complex systems, such as turbulence or financial fluctuations | Provides a comprehensive characterization of multi-scale features | High computational cost; complex interpretation |
| Self-similarity Dimension (DS) | Based on the number of subparts N and ratio r, derived from the generation rule | Strictly self-similar fractals, such as the Koch curve or Sierpinski carpet | Simple theoretical computation | Applicable only to ideal fractals, lacks universality |
Table 6.
Fractal dimension D of cracks in test beams under different loadings.
| Different load Levels (kN) | Fractal dimensions of test beams in each group | |||||||
| SFRASC1 | SFRASC2 | SFRASC3 | SFRASC4 | SFRASC5 | SFRASC6 | SFRASC7 | SFRASC8 | |
| 30 | 1.050 | 1.048 | ||||||
| 40 | 1.116 | 1.075 | 1.066 | 1.034 | 1.046 | 1.057 | 1.030 | 1.028 |
| 50 | 1.147 | 1.116 | 1.092 | 1.074 | 1.061 | 1.067 | 1.053 | 1.047 |
| 60 | 1.176 | 1.156 | 1.119 | 1.099 | 1.075 | 1.077 | 1.067 | 1.055 |
| 70 | 1.217 | 1.174 | 1.140 | 1.119 | 1.096 | 1.100 | 1.077 | 1.065 |
| 80 | 1.247 | 1.203 | 1.159 | 1.134 | 1.116 | 1.124 | 1.097 | 1.079 |
| 90 | 1.287 | 1.225 | 1.199 | 1.173 | 1.139 | 1.154 | 1.120 | 1.105 |
| 100 | 1.280 | 1.245 | 1.215 | 1.184 | 1.183 | 1.148 | 1.121 | |
| 110 | 1.211 | 1.170 | 1.155 | |||||
Table 7.
Gf and D values of test beams in each group.
| Value | SFRASC1 | SFRASC2 | SFRASC3 | SFRASC4 | SFRASC5 | SFRASC6 | SFRASC7 | SFRASC8 |
| fcm (N/mm2) | 30.5 | 38.5 | 46.6 | 47.5 | 53.8 | 55.1 | 59.2 | 67.6 |
| Gf (N/m) | 80.76 | 95.07 | 108.66 | 110.13 | 120.16 | 122.18 | 128.48 | 140.98 |
| D | 1.287 | 1.280 | 1.245 | 1.215 | 1.184 | 1.211 | 1.170 | 1.155 |
Table 8.
Values of a and b.
| Coefficient | SFRASC1 | SFRASC2 | SFRASC3 | SFRASC4 | SFRASC5 | SFRASC6 | SFRASC7 | SFRASC8 |
| a | 0.00857 | 0.00868 | 0.00862 | 0.00835 | 0.00864 | 0.00851 | 0.00869 | 0.00910 |
| b | 0.175 | 0.141 | 0.149 | 0.155 | 0.127 | 0.139 | 0.119 | 0.091 |
Table 9.
Values of g and h.
| Fit coefficient | SFRASC1 | SFRASC2 | SFRASC3 | SFRASC4 | SFRASC5 | SFRASC6 | SFRASC7 | SFRASC8 |
| g | 1.368 | 1.175 | 1.353 | 1.335 | 1.256 | 1.343 | 1.306 | 1.259 |
| h | 0.130 | 0.130 | 0.127 | 0.131 | 0.094 | 0.128 | 0.121 | 0.096 |
Table 10.
Calculation results of fracture toughness for steel fiber alkali-activated slag concrete beams.
Table 10.
Calculation results of fracture toughness for steel fiber alkali-activated slag concrete beams.
| Volume ratio of steel fiber ρf | Modulus of elasticity (MPa) | Load (kN) | Characteristic length of the crack a (mm) | Fractal Dimension D |
Critical cracking Stress σc(Mpa) |
Fracture toughness KfIC (Mpa⋅m1/2) |
Maximum energy release rate Gfmax (N/m) |
| 0.0 | 26000 | 89.40 | 158 | 1.287 | 5.396 | 10.939 | 52.163 |
| 0.005 | 26000 | 96.40 | 144 | 1.255 | 7.560 | 12.851 | 124.026 |
| 0.009 | 27000 | 100.20 | 155 | 1.245 | 8.735 | 14.991 | 182.764 |
| 0.01 | 28000 | 101.20 | 154 | 1.230 | 8.903 | 14.403 | 205.856 |
| 0.011 | 28000 | 103.80 | 136 | 1.225 | 9.542 | 14.044 | 223.677 |
| 0.012 | 29000 | 107.00 | 154 | 1.211 | 9.220 | 13.911 | 248.916 |
| 0.013 | 30000 | 108.00 | 143 | 1.170 | 8.985 | 11.168 | 300.481 |
| 0.014 | 31000 | 110.50 | 123 | 1.155 | 9.645 | 10.406 | 333.258 |
Disclaimer/Publisher’s Note: The statements, opinions and data contained in all publications are solely those of the individual author(s) and contributor(s) and not of MDPI and/or the editor(s). MDPI and/or the editor(s) disclaim responsibility for any injury to people or property resulting from any ideas, methods, instructions or products referred to in the content. |
© 2025 by the authors. Licensee MDPI, Basel, Switzerland. This article is an open access article distributed under the terms and conditions of the Creative Commons Attribution (CC BY) license (http://creativecommons.org/licenses/by/4.0/).
Copyright: This open access article is published under a Creative Commons CC BY 4.0 license, which permit the free download, distribution, and reuse, provided that the author and preprint are cited in any reuse.


