Submitted:
14 June 2025
Posted:
16 June 2025
You are already at the latest version
Abstract
Effective management of Type 1 Diabetes requires anticipating fluctuations in blood glucose levels and evaluating potential outcomes of clinical decisions. This project introduces an interactive decision-support tool that simulates future glucose trajectories using a rolling ARIMA forecasting model applied to synthetically generated data. While ARIMA provides a transparent statistical basis for short-term predictions, the primary innovation lies in the tool’s visual interface. Using Plotly, glucose forecasts are rendered as branching scenario trees, where each path represents a distinct clinical intervention (e.g., meals, exercise). Nodes are color-coded by risk category and annotated with intuitive icons and hoverable metrics, enabling clinicians to rapidly assess hypothetical outcomes. Designed with interpretability and usability in mind, the tool transforms raw time-series predictions into an interactive, clinician-friendly format. Although it does not use real CGM data, the visualization framework supports patient-specific modeling and may serve as a prototype for future clinical decision-support systems.
Keywords:
Interactive Visualization
; Decision Support
; Simulation
; Diabetes
1. Introduction
Type 1 Diabetes is a chronic and increasingly prevalent condition that demands continuous monitoring and management of rapid fluctuations in blood glucose levels. These fluctuations are influenced by a variety of factors, including meals, physical activity, stress, and insulin administration [1]. While considerable research has focused on improving the accuracy of glucose forecasting models, traditional approaches often deliver raw predictions without translating them into actionable insights for clinicians or patients.
This project addresses that gap by shifting the focus from pure predictive accuracy to interactive and interpretable clinical decision support. It introduces a simulation-based tool that combines a rolling ARIMA forecasting model with dynamic, scenario-based visualizations. Using Plotly [2], the system renders glucose predictions as an interactive, color-coded tree structure, where each branch represents a potential intervention pathway such as meal intake or exercise allowing users to intuitively explore future glucose trajectories.
By transforming synthetic time-series data into an engaging and clinician-friendly format, the tool enhances the interpretability of glucose dynamics. It serves not only as a proof-of-concept for visual scenario modeling in diabetes care, but also as a foundation for future patient-specific decision support systems that prioritize usability, clarity, and real-world clinical relevance.
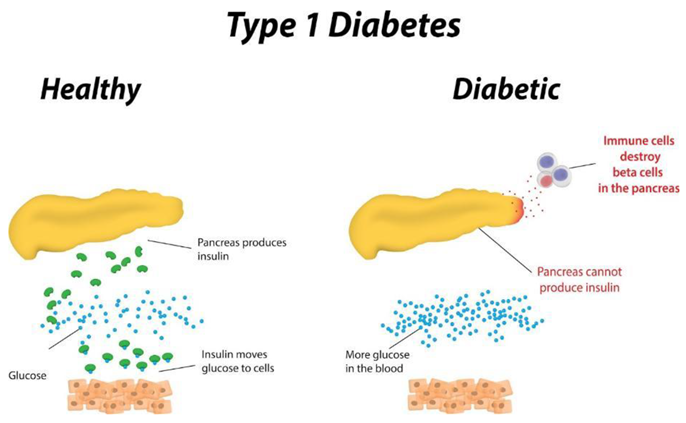
Image [3] explaining basic and general description of the chronic condition via comparison to a healthy individual without this condition.
1.1. Brief Overview of the Project
This project is an interactive Python-based tool designed to help users visualize how glucose levels might change over time under different possible scenarios. Rather than predicting a single future, the tool simulates multiple branching outcomes, offering a more intuitive and flexible view of glucose dynamics.
How Does It Work?
1. Generating Synthetic Data: To begin with, the system creates simulated glucose data that resembles real human blood sugar trends. Occasional spikes or dips are introduced to mimic real-world influences such as stress, meals, or exercise.
2. Forecasting with ARIMA: The ARIMA (AutoRegressive Integrated Moving Average) model analyzes recent synthetic glucose values and predicts future levels based on detected trends. Although the visualization could function without this model, ARIMA adds value by producing smoother, more realistic forecasts, especially helpful for filtering out extreme noise from the synthetic data. ARIMA is also widely used in academic studies for glucose prediction.
3. Branching Into Possibilities: From the ARIMA-predicted starting value, the system constructs separate glucose trajectories, each corresponding to a distinct simulated intervention: a meal, exercise, or no intervention. These represent clinically relevant pathways rather than probabilistic variations. Each scenario progresses linearly over time at 5-minute intervals to mimic the resolution of modern CGM devices. The number of time steps in each path depends on the user’s simulation duration (e.g., 15 minutes results in 3 future points). This design emphasizes how different actions might affect future glucose values, rather than simulating uncertainty within a single scenario. From that ARIMA starting point, the system creates three paths:
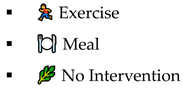
These are not random guesses, but fixed scenarios — each one changes the glucose differently based on the event.
In the Exercise path, the simulated glucose level decreases steadily over time. This reflects how physical activity, such as walking or light aerobic movement, typically causes a gradual drop in blood glucose as the body uses it for energy. The decrease is applied in fixed increments at each time step, simulating the physiological response to activity.
In the Meal scenario, the glucose level rises incrementally with each time step. This mimics the effect of carbohydrate intake after eating, where glucose is absorbed into the bloodstream, leading to a spike. The increase is also applied in fixed amounts, representing a simplified but realistic model of post-meal glucose elevation.
Finally, the No Intervention path assumes the individual takes no action. The glucose trend in this scenario continues based on the ARIMA model’s original forecast, with minimal adjustments. This serves as the baseline or control, showing what would likely happen if glucose levels were left to progress naturally without external influences.
By comparing these three clearly defined paths, the tool allows users to explore and contrast the short-term impacts of common lifestyle decisions in a visually intuitive way.
4. Color-Coded Risk Zones: Each node in the tree is color-coded based on its glucose value to make health risks instantly visible:
- ▪
- 🔵 Blue: Low glucose (<70 mg/dL) - Hypoglycemia
- ▪
- 🟢 Green: Normal range (70–190 mg/dL) - Normoglycemia
- ▪
- 🔴 Red: High glucose (>190 mg/dL) - Hyperglycemia
5. Interactive Visualization: Finally, using the Plotly library, the entire scenario tree is rendered as an interactive graph. Users, including clinicians, researchers, or students can hover over any node to view the predicted glucose value and exact timestamp.
The truly novel aspect of this project is the interactive, scenario-based visualization that simulates multiple futures from a single starting point. It applies the core principles of Ben Shneiderman’s Visual Information-Seeking Mantra - overview first, zoom and filter, then details-on-demand to a clinical context. While built using synthetic data, the system lays the foundation for more advanced applications in patient-specific simulation, education, and clinical decision-making.
1.2. Problem Statement
Existing approaches to glucose prediction in Type 1 Diabetes often emphasize static, purely numerical forecasts without considering the need for user engagement and intuitive interpretation. While statistical models like ARIMA offer a transparent framework for prediction, their conventional implementations lack interactive visualization, which is crucial for enabling clinicians and patients to explore and understand glucose dynamics in real time.
This project addresses this gap by shifting the focus from mere prediction to creating an engaging, interactive tool. By integrating a rolling ARIMA forecasting model with a dynamic, Plotly-based visualization presented as a color-coded tree the system transforms raw forecast data into an accessible and interpretable format. This approach not only enhances the clarity of the predictions but also empowers users to derive actionable insights, ultimately supporting more informed decision-making in diabetes management aiding one of the leading objectives in the field, to create an autonomous artificial pancreas.
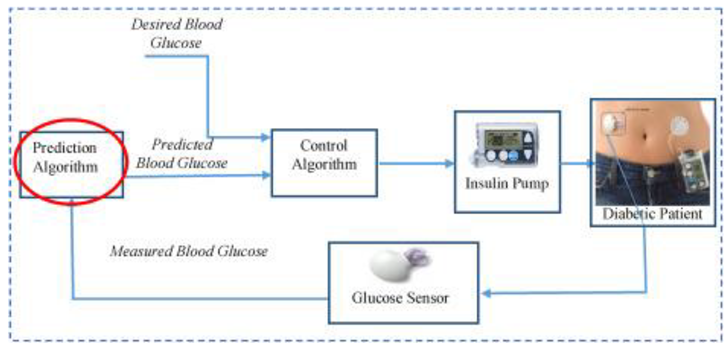
Image [5] showcasing uses of prediction algorithms and end use in flowchart format.
1.4. Structure of the Overall Paper
1. Introduction
2. Introduction to Glucose Prediction Visualization Problem in Type 1 Diabetes
3. Introduction to Glucose Prediction Models
4. Project Logic & Structure
5. Final Thoughts
6. References
2. Introduction to Glucose Prediction Visualization Problem in Type 1 Diabetes
Predicting blood glucose levels ahead of time has been a long-standing challenge in the management of Type 1 Diabetes. This difficulty arises from the complex interplay of factors such as meal composition, physical activity, stress, and individual metabolic variations that affect blood glucose dynamics. Traditionally, models for glucose prediction have been grouped into three broad categories: Physiological-based models, Data-driven models and hybrid models. However, while considerable research has focused on improving numerical accuracy, there is an increasing need to enhance the clinical interpretability of these predictions as logic would concur the more data the more advanced tools required, which my project aims to address.
Interactive visualizations have emerged as a critical tool to bridge this gap. By transforming raw forecasting outputs into intuitive visual formats, these tools enable both clinicians and patients to explore trends and identify potential risk zones easily. By conducting this project methods were in place to avoid bias as much as possible and therefore analysed critically from others views and were can understand some may argue that this literature comparison below should compare tools such as line graphs, pie charts, bar charts and so on, however this project is a solution a functional system that brings together data generations, forecasting for visual interpretation and interactivity. This is not a decorative way of numerical data but a functional visualization to support patient care, which the platforms mentioned further share more in common.
2.1. Dexcom Clarity, Tidepool, and Nightscout Interactive Dashboard
First a brief introduction to the following platforms from the following research as of date paper completion:
- ▪
- Dexcom Clarity is a proprietary system developed by Dexcom Inc., designed to work exclusively with Dexcom CGM devices . It provides users and healthcare providers with detailed trend analysis, daily patterns, and retrospective reports through a sleek and clinically validated interface [8].
- ▪
- Tidepool is a non-profit, open-source platform that supports data integration from multiple diabetes devices. It emphasizes accessibility, multi-device compatibility, and visual clarity, offering users various chart types (e.g., stacked bar, pie, and line graphs) to support personalized diabetes management [9].
- ▪
- Nightscout is an open-source, community-driven project that enables real-time remote access to CGM data. Unlike commercial systems, it prioritizes customizability and autonomy but lacks built-in predictive analytics and requires technical setup by the user [10].
Dexcom Clarity, Tidepool and Nightscout are all established platforms that provide interactive dashboards for visualizing continuous glucose monitoring (CGM) data. Here below are extracted key points in regard to:
- ▪
- Data Source Compatibility
- ▪
- Visualization and Interactivity
- ▪
- Clinical Interpretability
- ▪
- System Flexibility and Scalability
Then compress the research, discuss aspects of each platform and my proposed project all into an easy-to-understand table:
| Aspect | Dexcom Clarity | Tidepool | Nightscout | Proposed Project Differences |
|---|---|---|---|---|
| Data Source Compatibility | Limited to Dexcom only devices | Supports multiple device data, but integration can be challenging due to lack of access to the public of the United Kingdom as of 26/03/2025 | Provides real-time access from connected CGM devices. However, data is not always available due to the fact it depends on real users using the system consistently. Also, Nightscout does not predict glucose data. | Uses synthetic data to simulate realistic glucose patterns available 24/7. |
| Visualization and Interactivity | Sleek interface with detailed reports and trend graphs | Provides interactive features with professional visualization yet presenting necessary information effectively. | Colour coded graphs with “just enough design” inspired architecture. However not visually appealing. | Features an interactive tree visualization and not just limited to the generic dashboard. |
| Clinical Interpretability | Presents trend analysis, and data can be shared to caregivers, clinicians, researchers and so on | Offers deep analysis of data and presents them in multiple visual formats such as line, graphs, pie charts, stacked bar charts and so on. | Visualizes raw data with little to no integrated clinical context | Enhances interpretability containing colour coded risk indicators to showcase risk zones. Suitable for all devices that have access to open html files. |
| System Flexibility and Scalability | Constrained as a proprietary ecosystem | Moderately flexible integration from Tidepool official documentation, however challenges include accessibility to certain regions. | Open-sources and flexible to adapt, however has a complicated codebase and lacks predictive glucose element. | Designed with a modular architecture, allowing future enhancements, scalability and with the potential for implementation of real-world patient data. |
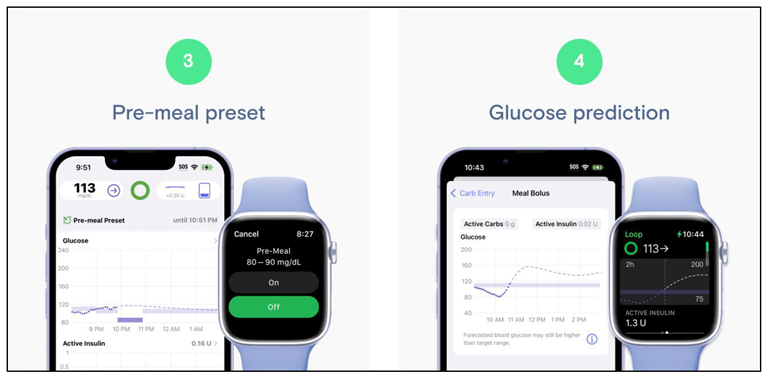
Image [11] showcasing Tidepool Mobile Application with glucose monitoring and prediction implementation.
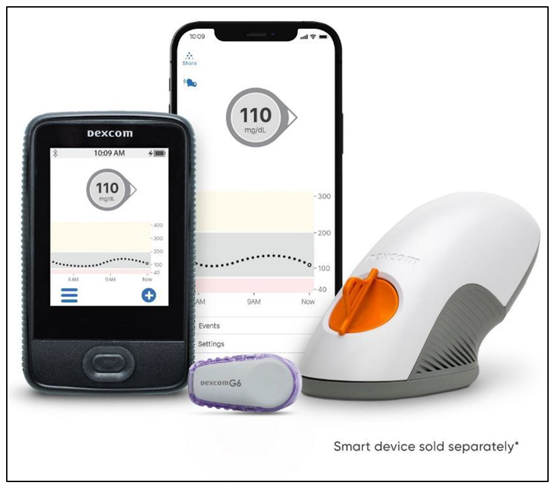
Image [12] Dexcom Clarity Mobile Application with glucose monitoring sensor.
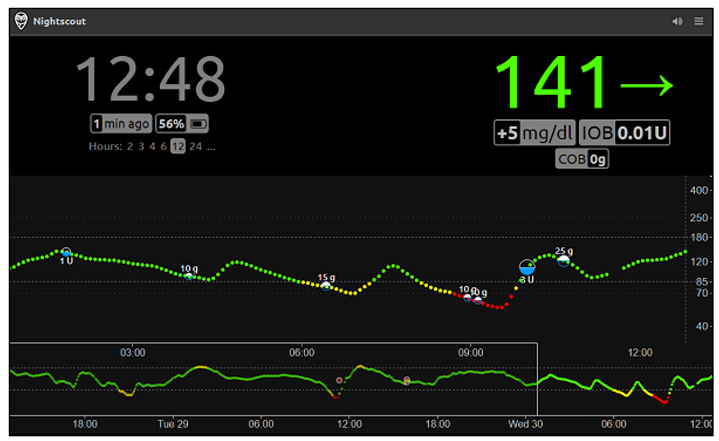
Image [13] showcasing uses of prediction algorithms and end use in flowchart format.
In summary, the literature review shows that established platforms like Dexcom Clarity, Tidepool, and Nightscout focus primarily on real-time data dashboards and integration of patient data, with a strong emphasis on trend analysis and raw data visualization. In contrast, this project adopts a fundamentally different approach by using synthetically generated glucose data, ensuring both reproducibility and ethical compliance. Key distinctions include:
- ▪
- Data Source and Implementation – Whereas existing solutions rely on real patient data, our project exclusively employs synthetic data. This not only solves ethical issues in regard to privacy concerns but also allows for controlled experimentation. Furthermore, the project is developed in Python, a language not commonly used in commercial CGM applications - demonstrating the versatility and accessibility of open-source tools.
- ▪
- Visualization Approach – Unlike traditional dashboards, the project introduces an innovative interactive tree visualization. By generating an HTML Plotly file, the tool provides a dynamic, offline-accessible visual that is suitable for multiple devices. This method bridges the gap between complex statistical forecasting and clinical interpretability, offering an intuitive means to explore glucose dynamics.
- ▪
- Methodological Focus – The project leverages a statistical-based ARIMA model for prediction, moving away from the predominant reliance on machine learning models. This choice addresses the "black box" issue common in AI approaches, thereby enhancing the transparency and interpretability of the forecasting process. This focus is especially crucial in clinical settings where understanding the underlying data patterns is essential.
Overall, this project fills a gap by providing a novel visualization method tailored to a broad audience- including clinicians, students, patients, and researchers as mentioned in my project specification. As discussed later in the paper, future enhancements could further extend their functionality and impact, potentially broadening its applicability to real-world scenarios with this project laying the fundamental groundwork.
2.2. Decision Choice on Dataset Reliability
Initially the first thought was to find a suitable dataset to showcase interactive simulation, which was the OhioT1DM dataset [14]. However, upon entering the website there was a list of requirements to fulfil to request the dataset with every criterion being met. As can be seen below:
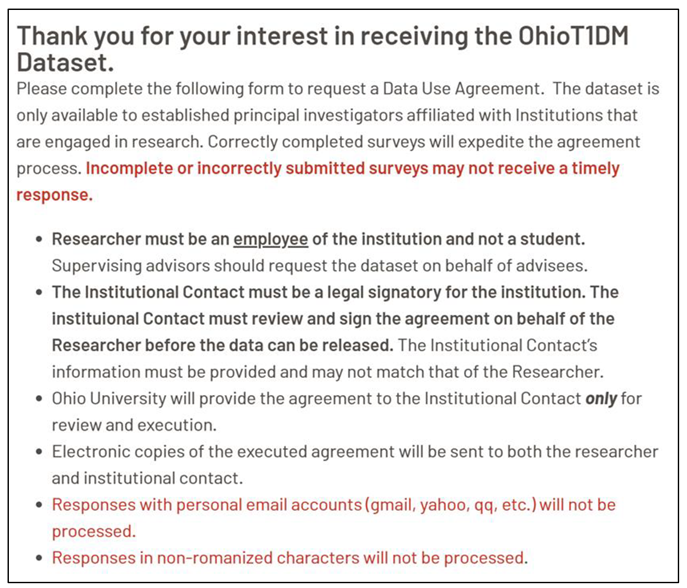
Image [14] showcasing forum requirements to access the OhioT1DM Dataset.
After further research it was discovered that the OhiotT1DM has missing values and is sited in multiple studies, screenshots can be seen below:
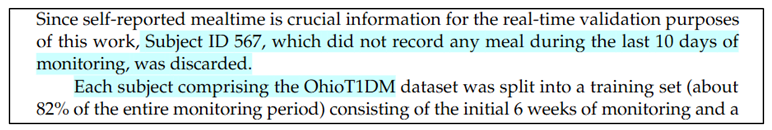
Image [15] showcasing Subject ID 567 with no record of any meal during the last 10 days of monitoring.
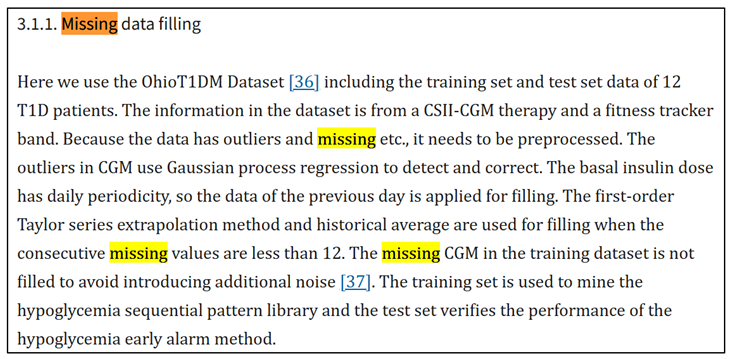
Image [16] verifying the data has outliers and missing values and needs to be preprocessed before use.
Because of the reasons stated above, the thoughted decision to use continuous synthetic glucose data instead was opted. It kept the project ethical, reliable, and fully within control. The advantage of opting for this alternate approach also means that there would not be a need to clean up the data by using preprocessing/data manipulation techniques to force the data to fit for the model.
In summary, while the current implementation of this project using synthetic data minimizes many legal and ethical risks, future developments and potential real-world applications will necessitate careful consideration of data protection, transparency, and the broader societal impact of automated health prediction tools to make this framework clinically accepted.
3. Introduction to Glucose Prediction Models
As previously stated, – “Traditionally, models for glucose prediction have been grouped into three broad categories: Physiological-based models, Data-driven models and hybrid models. All have been talked extensively down below:
3.1. Physiological-Based Models also Sometimes Referred to as Mathematical-Based Models
These models use explicit mathematical representations of human glucose–insulin dynamics, typically based on differential equations derived from physiology. Notable examples include the Bergman minimal model and more complex simulations like the UVA/Padova metabolic simulator [6]. Physiological models that are used in Type 1 Diabetes typically aim to capture how insulin is absorbed, how it acts on lowering glucose, and how glucose is produced or used by the body’s tissues. For instance, they may include compartments to represent glucose absorption from meals and insulin kinetics. The advantage of physiological models is that they are grounded in medical knowledge and often interpretable in terms of biological processes. However, they require many parameters to be specified (such as insulin sensitivity, carbohydrate absorption rates, etc.) [6].
These parameters vary from person to person and can be hard to estimate accurately. Consequently, pure physiological models sometimes struggle to be personalized unless extensive individual calibration is done. Moreover, due to the complexity of human metabolism, purely equation-based models might not account for all factors (stress, illness, hormone fluctuations) affecting glucose, limiting their predictive accuracy when used alone.
3.2. Data-Driven Models
In contrast to physiological approaches, data-driven models learn patterns directly from historical data. They do not require explicit knowledge of the biological system, instead inferring the relationships empirically and thus are not limited to the medical field and are implemented in stock markets, sales, business planning etc. Data-driven methods can be further divided into statistical (shallow) models and machine learning (deep) models. [6]
Statistical Models: These include classical time-series forecasting techniques such as linear regression, Autoregressive Moving Average (ARMA), and Autoregressive Integrated Moving Average (ARIMA) models. They rely on past glucose values (and potentially other exogenous inputs) to forecast future values. For example, an ARIMA model might extrapolate the recent trend and seasonality in a patient’s glucose readings to predict the next value. Such models are usually simpler and more interpretable – one can often examine model coefficients to understand the influence of past observations on the forecast. ARIMA has been used in glucose prediction research as a baseline algorithm . However, statistical models generally assume linear relationships. They may perform adequately for short-term predictions during steady glucose trends but can miss nonlinear patterns during rapid changes. In fact, earlier studies showed that purely autoregressive models (assuming linear dynamics) have limited accuracy when glucose levels change sharply due to meals, exercise, or other factors.
In one study, title “Neural Network Incorporating Meal Information Improves Accuracy of Short-Time Prediction of Glucose Concentration” noted that a linear AR model’s accuracy drops when glucose dynamics become highly nonlinear (e.g., after food intake or insulin dosing), motivating the use of more complex models that can capture such effects such as Machine Learning approaches.
Machine Learning Models: These include more advanced data-driven approaches, particularly those using modern ML and deep learning. Researchers have applied neural networks including recurrent neural networks like LSTM, Transformers and other techniques to glucose forecasting [18]. Such models can automatically learn complex nonlinear relationships from data. For instance, neural networks can potentially recognize patterns in glucose changes corresponding to mealtimes, exercise, or insulin injections if given enough data. Over the last decade, numerous studies have reported that ML models often outperform traditional statistical models in predictive accuracy.[18]
For example, in one comparative study all tested neural network models yielded lower prediction error metrics than even the best conventional machine learning models (like Random Forests or Support Vector Regression). Additionally, data-driven models, especially deep learning, typically require large amounts of training data and careful tuning to generalize well without overfitting. Each patient’s glucose response is unique, so a model trained on population data might not capture an individual’s patterns unless it is personalized or fine-tuned, which can be resource intensive.
3.3. Hybrid Models
To leverage the strengths of both approaches, some researchers have developed hybrid models that combine physiological and data-driven components. A hybrid model might use a physiological model to simulate the general trend or provide synthetic data and then use a machine learning model to adjust or refine the prediction. For example, one could use a physiological model to estimate the effect of a meal on glucose, and feed that as an input feature into a neural network that also considers recent CGM readings.
A study released in 2012 followed this strategy by integrating a meal absorption model with a neural network predictor, achieving better accuracy than the neural network alone when meal information was considered. The challenge with hybrid models is that they may become quite complex and still require tuning of physiological parameters, which could reduce interpretability (the model’s logic may not be as straightforward as a standalone statistical model). In addition, developing and validating such models can be time-consuming since they combine two modelling paradigms.
3.4. ARIMA-Based Rolling Prediction Framework
For our predictive modelling, ARIMA (Autoregressive Integrated Moving Average) model was employed. ARIMA is a classical statistical model for analyzing and forecasting time series data and stands for:
- ▪
- Auto Regressive (AR) → Uses past values to predict the future.
- ▪
- Integrated (I) → Makes the data stable (stationary).
- ▪
- Moving Average (MA) → Uses past prediction errors to improve future predictions.
To do this it has three parameters where:
- ▪
- p is how many past values to use (memory of past readings).
- ▪
- d is how many times subtract past values to make the data stable.
- ▪
- q is How much past error to consider (to correct mistakes).
Model specification: In this study, after some preliminary experimentation, it was decided to fix the ARIMA model with parameters (p=1, d=1, q=0) for all patients.
The selected configuration was for several reasons:
- ▪
- it is a model less prone to overfitting,
- ▪
- It captures the intuition that the change in glucose from one time step to the next
- ▪
- it requires a minimal amount of data to train (only a few past points to estimate the next prediction)
Keeping the model identical for each patient also ensures consistency in evaluation.
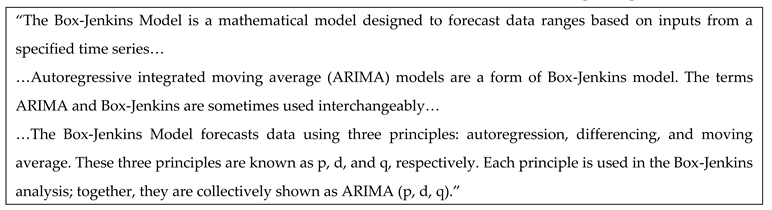
Text snippet here is necessary to understand references as Box-Jenkins Model is mentioned and may cause some confusion. [24]
4. Project Logic & Structure
This section goes into a brief discussion with the actual codebase that leads to the creation of the visual example described.
4.1. Codebase
Assuming that dependencies and IDE are installed correctly and knowledge to some degree is present in programming and this can run on your local machine with the following commands:
- ▪
- ▪
- cd glucose-visual-scenario-tree
Once the code has been successfully added, run main.py and you should see an input to add your initial glucose level currently. Then once entered you should be prompted to receive a final input requesting the numbers to simulate.
In the example below a glucose level of 70 mg/dL and 30 minutes duration for the simulations have been inputted.
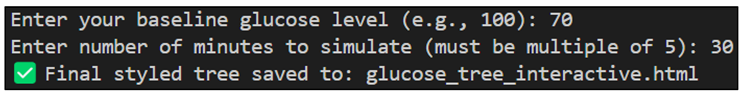
Once both inputs have been filled with appropriate data a .html file will be generated in the same directory and the code is executed and can be opened. The complete final output can be seen below:
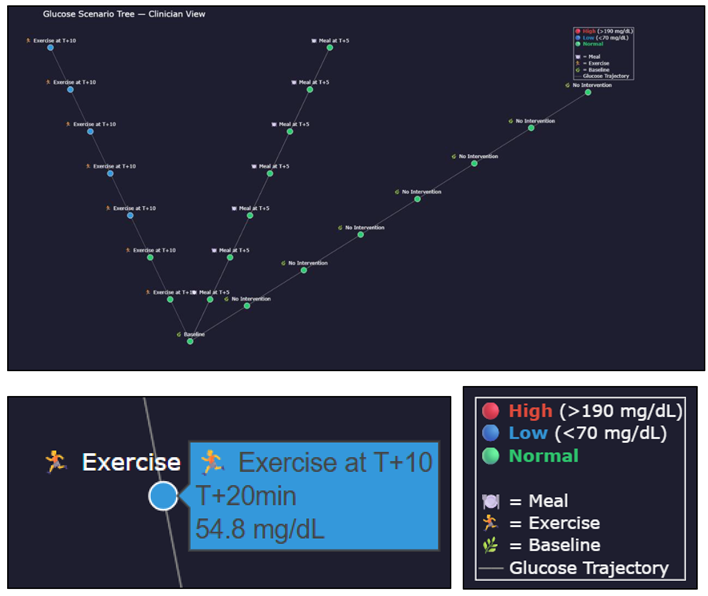
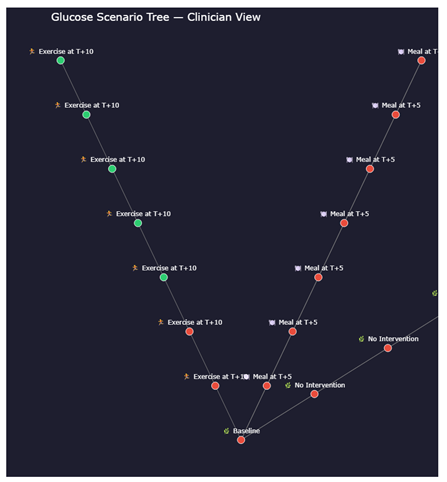
Hoverable elements can be seen notifying the user of the system glucose level and time from potential action if chosen. Also, a legend (also referred to as a key) can be seen with key information for the user to understand what is being viewed.
The rule-based algorithms implemented mimic real life scenario trends, for example exercising leading to lower glucose whereas eating a meal increases glucose levels.
So, what is understood from these graphs?
- ▪
- Which intervention keeps glucose within target the longest
- ▪
- How quickly glucose may rise post-meal
- ▪
- Which scenarios require caution (red-heavy branches)
- ▪
- The urgency of glucose correction or insulin dosing
However, as this is synthetic data and not actual patient data the validity of this for clinical reliability cannot be outright proven without further work as discussed later on in the paper. However, the possibilities that have now been introduced increases clinical understanding of trends and medical futures from a singular visualization are boundless to the creativity of experts as further discussed later.
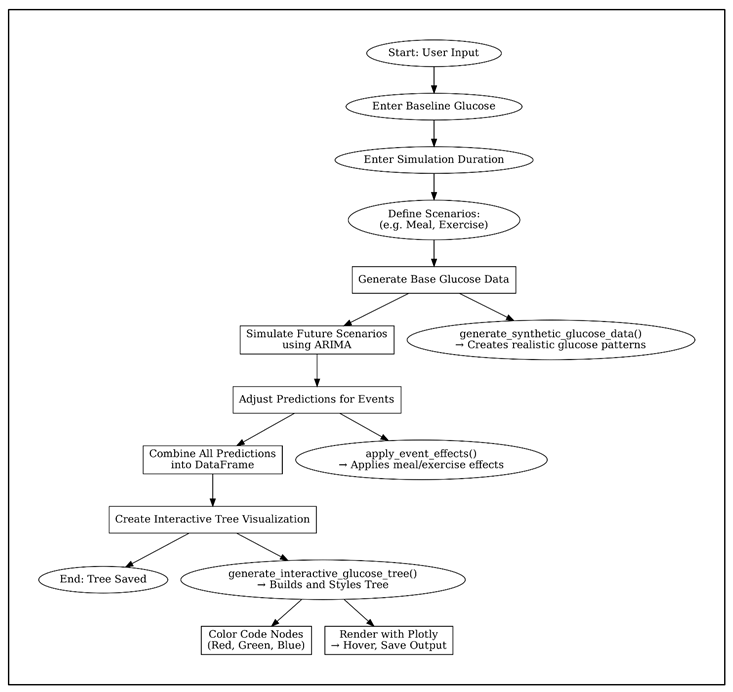
4.2. Pseudocode Diagram
Detailed pseudocode diagram of the entire codebase functionality
5. Final Thoughts
Here in this section describes possible future work building from this paper and the overall conclusion in terms of the novelty and clinical applications of this paper.
5.1. Possible Future Work
While the current system offers a novel and accessible framework for visualizing glucose trajectories using synthetic data and ARIMA-based forecasting, several future directions can enhance its clinical impact and usability. First, integrating real continuous glucose monitoring (CGM) data would enable personalized, patient-specific simulations and move the tool closer to real-world deployment. Visualization could be further improved by incorporating a probability estimation system, where each branching path is weighted based on likelihood, offering clinicians not just possible futures but probable ones. Additionally, replacing or augmenting ARIMA with more advanced models such as LSTM or ensemble learning could improve prediction accuracy, especially for nonlinear glucose behavior. Enhancing the user interface to support manual event logging-such as meals, insulin doses, or physical activity-would make the system more interactive and reflective of real-life use. Expanding the tree to support chained or compound interventions would allow users to simulate more complex scenarios over longer timelines. Finally, packaging the system into a clinician-facing dashboard with report generation features, customizable risk thresholds, and annotation tools would help position it as a viable tool for diabetes education, monitoring, or decision support. A future clinical validation study could assess its effectiveness in supporting real-time interpretation and planning in diabetes care.
5.2. Conclusions
This project presents a novel approach to glucose forecasting by shifting the focus from purely predictive accuracy to clinical interpretability through interactive visualization. By integrating a rolling ARIMA model with a custom-built scenario tree rendered using Plotly, the tool allows users to simulate multiple glucose trajectories stemming from common interventions such as meals or exercise. Each branch of the tree represents a distinct possibility, empowering clinicians and users to intuitively explore potential futures rather than relying on a single deterministic outcome.
Unlike traditional platforms that prioritize raw CGM data presentation, this tool demonstrates how synthetic time-series data can be transformed into a dynamic and informative structure. The visualization’s color-coded, hover-enabled interface highlights risk zones and reflects real-time decision-making processes. While the tool is currently powered by synthetic data, its modular design allows for future integration of real CGM streams, enabling personalized simulations tailored to individual patients.
In summary, the system not only provides an accessible prototype for clinical education and decision support but also lays the groundwork for future applications in personalized medicine. Its transparent forecasting method, combined with engaging user experience, positions it as a meaningful contribution to the advancement of interpretable AI in healthcare.
6. Additional Information
Additional content that is not linked to the main manuscript of the papers, however, provides additional insights.
6.1. Glossary
Here is a Glossary section containing essential terms to understand the project.
ARIMA (Autoregressive Integrated Moving Average): A statistical time-series forecasting model that combines autoregression (AR), differencing (I), and moving average (MA) components. Used in this project to predict future glucose levels based on past data trends.
CGM (Continuous Glucose Monitoring): Technology used to automatically track glucose levels throughout the day and night.
Time Series Data: A sequence of data points indexed in time order. In this project, it refers to continuous glucose monitoring (CGM) values over time and are used synchronously.
Synthetic Data: Artificially generated data that simulates real-world glucose trends without using actual patient data. Ensures privacy and ethical compliance.
Plotly: An open-source graphing library used to create interactive, browser-based data visualizations.
Type 1 Diabetes (T1D): A chronic autoimmune condition where the pancreas produces little or no insulin, leading to high blood glucose levels.
Glucose Forecasting: The process of predicting future blood glucose levels using past data, statistical models, or machine learning techniques.
Rolling Forecast: A forecasting method where predictions are continuously updated as new data becomes available. Used in this project to simulate real-time prediction adjustments.
LSTM (Long Short-Term Memory):A type of recurrent neural network capable of learning order dependence in sequence prediction problems. However, understanding that this is a type of neural network is the minimal information to understand the following report.
Ben Shneiderman's Visual Information-Seeking Mantra [25]: This is designed to be a guiding principle for designing effective information visualizations. His guide to achieve this was to ensure the visualization had an:
- First,
- Zoom and filter,
- Then details on demand
Funding
No external funding was received for this research.
Acknowledgments
This research project is deeply personal, inspired by my grandmother, who has passed away who has lived with Type 1 Diabetes. Witnessing their resilience and the challenges they faced has been a driving force behind my determination to make a meaningful contribution to this field. I would also like to extend my heartfelt thanks to my supervisor, Dr Mehmet Bülent Özcan and Dr Martyn Prigmore, Senior Lecturers in the Department of Computing at Sheffield Hallam University. Their expertise, guidance, and mentorship have been pivotal in my personal and professional growth. Dr Mehmet Bülent Özcan and Dr Martyn Prigmore constructive feedback, encouragement, and dedication to my development have enabled me to perform at my best and strive for excellence. Finally, I acknowledge the broader academic and research community whose pioneering work in diabetes, computational biology, and algorithmic design has laid the foundation for this project. Their contributions have been a source of inspiration and knowledge, guiding me in creating a novel and impactful solution. This project is a testament to the power of perseverance, collaboration, and the belief that even the most complex challenges can be overcome with dedication and innovation and most importantly faith.
Conflicts of Interest
The author declares no conflicts of interest as there were no co-authors associated with this work.
References
- World Health Organization (2024). Diabetes. [online] World Health Organization. Available online: https://www.who.int/news-room/fact-sheets/detail/diabetes.
- Plotly (2023). Plotly Python Graphing Library. [online] plotly.com. Available online: https://plotly.com/python/.
- Figure 1. (n.d.). Available at: Type 1 Diabetes Image Explanation. (n.d.). Available online: https://www.myhealthexplained.com/diabetes-information/diabetes-articles/type-1-diabetes-prevention.
- Dexcom. (2024). Dexcom G7 Sensor. [online]. Available online: https://www.dexcom.com/en-GB/dexcom-shop/g7/stp-gt-001 (accessed on 23 April 2025).
- Figure 2. (n.d.). Available online: https://www.sciencedirect.com/science/article/abs/pii/S020852161830127X.
- Arxiv.org. (2021). GlucoBench: Curated List of Continuous Glucose Monitoring Datasets with Prediction Benchmarks. [online]. Available online: https://arxiv.org/html/2410.05780v1 (accessed on 7 April 2025).
- srunyon (2016). Dexcom CLARITY | Diabetes Management Software. [online] Dexcom. Available online: https://www.dexcom.com/clarity.
- Dexcom (2018). Dexcom. [online] Dexcom. Available online: https://www.dexcom.com/en-GB.
- www.tidepool.org. (n.d.). Tidepool. [online]. Available online: https://www.tidepool.org/.
- nightscout.github.io. (n.d.). What is Nightscout? - Nightscout. [online]. Available online: https://nightscout.github.io/.
- Figure 3. (n.d.). Available online: https://www.tidepool.org/blog/tidepool-loop-what-makes-us-different.
- Figure 4. (n.d.). Available online: https://www.nice.org.uk/advice/mib233/chapter/The-technology#:~:text=This%20alert%20notifies%20the%20user,alert%20can%20be%20turned%20off.
- Figure 5. (n.d.). Available at: https://nightscout.github.io. European Union (2018). General Data Protection Regulation (GDPR). [online] General Data Protection Regulation (GDPR). Available online: https://gdpr-info.eu/.
- smarthealth.cs.ohio.edu. (n.d.). OhioT1DM Dataset. [online]. Available online: http://smarthealth.cs.ohio.edu/OhioT1DM-dataset.html.
- Prendin, F.; Díez, J.-L.; Del Favero, S.; Sparacino, G.; Facchinetti, A.; Bondia, J. Assessment of Seasonal Stochastic Local Models for Glucose Prediction without Meal Size Information under Free-Living Conditions. Sensors 2022, 22, 8682. [Google Scholar] [CrossRef] [PubMed]
- Ma, N.; Yu, X.; Yang, T.; Zhao, Y.; Li, H. A hypoglycemia early alarm method for patients with type 1 diabetes based on multi-dimensional sequential pattern mining. Heliyon 2022, 8, e11372. [Google Scholar] [CrossRef] [PubMed]
- Zecchin, C.; Facchinetti, A.; Sparacino, G.; De Nicolao, G.; Cobelli, C. Neural Network Incorporating Meal Information Improves Accuracy of Short-Time Prediction of Glucose Concentration. IEEE Transactions on Biomedical Engineering 2012, 59, 1550–1560. [Google Scholar] [CrossRef] [PubMed]
- Tang, B.; Yuan, Y.; Yang, J.; Qiu, L.; Zhang, S.; Shi, J. Predicting Blood Glucose Concentration after Short-Acting Insulin Injection Using Discontinuous Injection Records. 2022, 22, 8454–8454. [Google Scholar] [CrossRef] [PubMed]
- Gzar, D.A.; Mahmood, A.M.; Abbas, M.K. A Comparative Study of Regression Machine Learning Algorithms: Tradeoff Between Accuracy and Computational Complexity. Mathematical Modelling of Engineering Problems 2022, 9, 1217–1224. [Google Scholar] [CrossRef]
- Gültekin, H. Time Series Analysis and Forecasting with ARIMA - Hazal Gültekin - Medium. [online] Medium. 2024. Available online: https://medium.com/@hazallgultekin/time-series-analysis-and-forecasting-with-arima-8be02ba2665a (accessed on 7 April 2025).
- Yang, J.; Li, L.; Shi, Y.; Xie, X. An ARIMA Model With Adaptive Orders for Predicting Blood Glucose Concentrations and Hypoglycemia. IEEE Journal of Biomedical and Health Informatics 2019, 23, 1251–1260. [Google Scholar] [CrossRef] [PubMed]
- Krishnamoorthy, U.; VKarthika Mathumitha, M.K.; Panchal, H.; Vijay Kumar, A. Learned prediction of cholesterol and glucose using ARIMA and LSTM models – A comparison. Results in Control and Optimization 2023, 14, 100362–100362. [Google Scholar] [CrossRef]
- Rancati, S.; Bosoni, P.; Schiaffini, R.; Deodati, A.; Mongini, P.A.; Sacchi, L.; Toffanin, C.; Bellazzi, R. Exploration of Foundational Models for Blood Glucose Forecasting in Type-1 Diabetes Pediatric Patients. Diabetology 2024, 5, 584–599. [Google Scholar] [CrossRef]
- Scott, G. Box-Jenkins Model. [online] Investopedia. 2019. Available online: https://www.investopedia.com/terms/b/box-jenkins-model.asp.
- Chapter 44 Ben Shneiderman’s Visualization Mantra | Spring 2021 EDAV Community Contributions. (n.d.). [online] jtr13.github.io. Available online: https://jtr13.github.io/cc21/ben-shneidermans-visualization-mantra.html.
Disclaimer/Publisher’s Note: The statements, opinions and data contained in all publications are solely those of the individual author(s) and contributor(s) and not of MDPI and/or the editor(s). MDPI and/or the editor(s) disclaim responsibility for any injury to people or property resulting from any ideas, methods, instructions or products referred to in the content. |
© 2025 by the authors. Licensee MDPI, Basel, Switzerland. This article is an open access article distributed under the terms and conditions of the Creative Commons Attribution (CC BY) license (http://creativecommons.org/licenses/by/4.0/).
Copyright: This open access article is published under a Creative Commons CC BY 4.0 license, which permit the free download, distribution, and reuse, provided that the author and preprint are cited in any reuse.


