
Submitted:
28 October 2024
Posted:
29 October 2024
You are already at the latest version
Abstract
Cardiovascular surgeries, though lifesaving, can lead to complications requiring further interventions, including amputations. This study uses Sankey diagrams, Sunburst plots, and Icicle plots to analyze treatment pathways in patients with peripheral artery disease (PAD), focusing on those that lead to amputation versus those that do not. We found that non-amputation outcomes commonly involve anti-platelet and lipid-lowering medications, while amputation pathways, although less frequent, often share similar initial treatments but diverge later, suggesting areas for early intervention. These visualizations highlight patterns in patient care and emphasize the importance of tailored treatment strategies to reduce amputations, offering insights to predict likely outcomes based on treatment sequences.
Keywords:
Data Visualization
; Treatment Pathways
; Cardiovascular surgery
; Sankey diagram
; Sunburst Plot
; Icicle Plot
; visualization of treatment sequences
; Peripheral Arterial Disease (PAD)
1. Introduction
Peripheral Arterial Disease (PAD) is a serious medical condition characterized by the narrowing of arteries, most commonly affecting the lower extremities. This condition results from atherosclerosis, a disease in which plaque builds up in the arteries, leading to reduced and impaired blood flow. According to the National Institute of Health (NIH) [12], more than 8 million people in the United States are affected by PAD. The condition can lead to severe adverse health effects, including stroke, heart attack, and, most relevant to this study, amputation of affected limbs due to ischemia—a state where blood flow is insufficient to meet the oxygen needs of tissues [1]
Risk factors for PAD include age, genetic disposition, and major lifestyle factors such as smoking, insufficient physical activity, stress, and diets high in saturated fats. Medical conditions such as diabetes, obesity, kidney disease, high blood pressure, blood clotting disorders, and Fibromuscular Dysplasia also contribute to the risk of developing PAD [9]. Treatment options for PAD vary from lifestyle changes and pharmacological therapies to surgical procedures. Lifestyle-based treatments focus on smoking cessation, achieving a healthy weight, increasing physical activity, managing stress, and adopting a heart-healthy diet. Pharmacological treatments include antiplatelet medicines, lipid-lowering medicines, and ACE inhibitors. Surgical options encompass endovascular revascularization procedures like angioplasty and revascularization surgeries such as bypass surgery [10]
Visualizing the treatment pathways for PAD is crucial for identifying common sequences and differentiating between patients who undergo amputation and those who do not. This study leverages data from electronic health records (EHR) to visualize these pathways. Using data visualization techniques, including Sankey diagrams, Sunburst plots, and Icicle plots, we aim to map and analyze the sequences and frequencies of treatments that lead to amputation versus those that do not. These visualizations provide insights into patient management, potentially aiding healthcare providers to optimize treatment strategies and reduce the incidence of amputation.
Visualizing clinical pathways from EHR data has been shown to significantly improve evidence-based care delivery. Zhang, Padman, and Patel (2015) [2] highlighted the benefits of data-driven methods to extract and visualize clinical pathways, enhancing care for chronic conditions like kidney disease by reflecting day-to-day clinical decisions. Our study extends this approach to PAD, offering a comprehensive visualization of treatment sequences specific to this condition, this is the first study focusing on such visualizations in PAD.
Visualizing treatment pathways has been a significant focus in recent research, emphasizing its potential to reveal underlying patterns in clinical and biological processes. Chen et al. (2018) [3] developed the PathCORE-T framework, highlighting the importance of visualizing globally co-occurring pathways to uncover relationships between biological processes across various conditions, suggesting new hypotheses for further exploration. Similarly, Yan et al. (2019) [4] demonstrated the dynamic visualization of human cancer cell behavior and therapy responses, providing critical insights into treatment effects by observing single-cell behavior over time. These studies underscore the value of visualization techniques in understanding complex interactions, which our study adapts to the context of PAD treatment pathways.
In the specific domain of PAD treatment, Golledge and Drovandi (2021) [5] provided evidence-based recommendations focusing on reducing major adverse cardiovascular and limb events through various treatments. Parvar et al. (2018) [6] also examined non-invasive treatments for PAD, drawing clinical recommendations based on treatment efficacy. Both studies emphasize the effectiveness of certain treatments but do so primarily through textual summaries and tabular data. Our work builds on these findings by visually mapping treatment pathways, thus offering a more intuitive understanding of effective treatment sequences.
Moreover, Torun and Bildirici (2024) [7] evaluated the efficacy of specific revascularization treatments in preventing amputations among PAD patients with lower extremity wounds. Smolderen et al. (2018) [8], in their PORTRAIT study, provided a high-level overview of treatment flows, distinguishing between primary and specialty care. While these studies provide valuable insights into specific interventions and overall care flows, they do not delve deeply into the detailed sequences of treatment events that lead to different outcomes. Our research integrates these specific findings into broader treatment pathways and visualizes how these interventions interact to impact patient outcomes.
The motivation behind our research stems from the need to enhance clinical decision-making through the visualization of treatment pathways that lead to amputation or non-amputation outcomes in PAD patients. By employing advanced visualization techniques such as Sankey diagrams, Sunburst plots, and Icicle plots, we aim to provide a comprehensive framework that not only maps out the treatment sequences but also enables healthcare providers to dynamically explore these pathways. This approach seeks to bridge the gap left by previous studies by offering actionable insights that could potentially reduce the incidence of amputations by identifying and modifying treatment strategies earlier in the patient care process.
2. Methods
2.1. Data Source
The data used in this study was collected from two different sources, the first one being from the Stanford Medicine Research Data Repository (STARR) [13]. Data include de-identified EHR clinical practice data from STARR comprising records of approximately 5,620 unique patients with PAD. The dataset includes detailed information on patient demographics, treatment pathways, and outcomes. To focus our analysis on the outcomes of interest, we used specific amputation codes to segregate the patients into two groups: those who underwent amputations and those who did not. Out of the total patient population, 110 patients experienced at least one treatment before amputation, while the remaining patients did not undergo amputations. The second source of the data is from the All of Us [11] research program’s Registered Tier Dataset V7 available to authorized users, available to authorized users on the Researcher Workbench. It comprises of 4386 patients with PAD, with 280 patients having amputations and 4106 patients having no amputations. This segregation allowed us to visually analyze and compare the treatment pathways distinctly for both groups, providing insights into the sequences of treatments that lead to different outcomes.
2.2. Cohort
The cohort for this study was defined to identify patients who have undergone amputations as mentioned in Table 1 below:
2.3. Data Preprocessing
We filtered our dataset to include only the data of patients who experienced at least one treatment before amputation. For each patient, we noted the first occurrence of each treatment until an amputation occurred, if at all. We then created a sequence of treatments for each patient, which we used to visualize and analyze the pathways leading to amputation or non-amputation outcomes. By structuring the data in this manner, we were able to gain insights into the sequences of treatments that lead to different outcomes. The treatments we considered include Anti-platelet, Lipid Lowering, Smoking Cessation, Exercise Therapy, Revasc_endo (Endovascular Revascularization) and Revasc_surgery (Revascularization Surgery). As the amputations are very low in count, the data has first been normalized at the outcome cohort level, as, the counts of individual sequences is divided by the total number of sequences in that outcome cohort. The normalization has also been applied at the node level, node level normalization ensures that the flow values entering and exiting a node sums to 1, making it easier to compare different pathways that pass through the same node. The node level normalization applied, ensures that the visual thickness of the pathways reflects the proportion of cases following the path.
2.4. Data Visualization
To effectively convey the complexity and nuances of treatment pathways leading to amputation, we employed three data visualization techniques: Sankey diagrams, Sunburst plots, and Icicle plots. All the plots have been made on the data that has been normalized at both the node level and the cohort level. Each of these visualizations provides unique insights into the sequences and frequencies of treatments, helping to identify patterns and critical junctures in patient management.
The Sankey Diagram excels at visualizing the movement and distribution of resources across different stages, providing a clear and intuitive understanding of how entities transition through various phases. Sunburst plots are radial charts that display hierarchical data through a series of concentric rings. Each ring represents a level in the hierarchy of treatment stages, with the innermost ring showing the outcome cohorts and subsequent rings representing series of treatment nodes from the beginning to leading to the outcome. Branches extend outward from each ring, depicting different treatment options. Sunburst plots provide a visually appealing way to explore the distribution and frequency of various treatment paths, making it easy to see the progression and common sequences of treatments leading to different outcomes. Icicle plots present hierarchical data in a linear, left to right format. Like sunburst plots, icicle plots display each level of the treatment pathway hierarchy, but in a stacked manner. Each block in the plot represents a treatment stage, and the width of the blocks corresponds to the log normalized counts of patients at each stage. This visualization method allows for straightforward comparison of treatment sequences and is useful for identifying patterns in the progression of treatments across different patient groups. If a sequence is followed by an empty block, it represents the end of the sequence.
2.4.1. STARR Data Visualizations
Figure 1 is a Sankey diagram of treatment sequences in our STAnford medicine Research data Repository (STARR) dataset. Out of all the pathways that start with endovascular revascularization, approximately 56% directly lead to amputations, while about 31% lead to non-amputation outcomes. A smaller percentage, roughly 0.2%, of non-amputation pathways also pass through exercise therapy as the second level of treatment. For pathways that begin with anti-platelet treatment, about 15% directly lead to amputations, while 29% proceed through lipid lowering. Among pathways that pass-through lipid lowering, approximately 33% directly lead to amputations. About 8% of pathways enter endovascular revascularization following lipid lowering, with 63% of these pathways ultimately leading to amputations. Conversely, 35% of pathways leading to non-amputation outcomes pass through lipid lowering.
Pathways that start with lipid lowering directly lead to amputations in about 24% of cases, while 22% lead to anti-platelet treatment. Among pathways entering anti-platelet treatment at level 2, 36% result in amputations. Approximately 19% of pathways beginning with lipid lowering lead to non-amputation outcomes, with about 31% of non-amputation pathways passing through additional treatments such as anti-platelet or exercise therapy. When pathways begin with revascularization surgery, 58% of those leading to amputation proceed through lipid lowering. Of the pathways entering lipid lowering at level 2, 33% directly lead to amputations, and about 8% lead to endovascular revascularization before resulting in amputation. Although most pathways beginning with revascularization surgery led to amputations, about 20% led to non-amputation outcomes after passing through lipid lowering or anti-platelet treatment.
Pathways starting with exercise therapy or smoking cessation are generally not associated with amputations, this might also be because they are done at healthier or less at risk patients. About 41% of pathways beginning with exercise therapy proceed to lipid lowering before resulting in non-amputation, while about 38% proceed through anti-platelet treatment. Of those that pass through anti-platelet treatment, 48% also pass through exercise therapy before leading to non-amputation. Among pathways that begin with smoking cessation, about 66% proceed to lipid lowering, and 33% to endovascular revascularization, with all eventually leading to non-amputation outcomes after further treatment.
We have plotted the sunburst diagram in the Figure 2 and icicle plot in Figure 3 to identify further insights. Given that the data is already normalized, in the sunburst, we obtain perfect semicircular outcome cohorts with the red part indicating the sequences for the amputations cohort while the green part indicating the non-amputation cohort. the amputation or non-amputation cohorts are at the center of the plot and the subsequent layers have got the treatment sequences, from the beginning to the end of the sequence that led to an outcome, the empty blocks indicate the end of sequence. The most dominant sequences that leads to an outcome can be clearly noticed from the sunburst plot in Figure 2 and the icicle plot in the Figure 3. In both the plots, the last layer has got a lighter shade and when there is no value in any layer, its an indication that the treatments pathway ends there.
In the amputation cohort, approximately 44% of pathways begin with revascularization surgery, 37% with anti-platelet treatment, and 15% with lipid lowering. Most pathways that begin with revascularization surgery proceed through lipid lowering, followed by anti-platelet treatment, and then endovascular revascularization before resulting in amputation. Similarly, pathways starting with anti-platelet treatment often proceed through lipid lowering and endovascular revascularization before leading to amputation. Pathways beginning with lipid lowering generally follow anti-platelet treatment and revascularization surgery before leading to amputation.
In the non-amputation cohort, about 76% of pathways begin with anti-platelet treatment, and 15% with lipid lowering. Among pathways that begin with anti-platelet treatment, 43% proceed to lipid lowering, and 28% to revascularization surgery. Most pathways leading to lipid lowering are followed by endovascular revascularization, revascularization surgery, and exercise therapy. Pathways starting with anti-platelet treatment and proceeding to revascularization surgery often include exercise therapy, lipid lowering, and endovascular revascularization.
2.4.2. All of Us Data Visualizations
Approximately 59% of pathways that begin with endovascular revascularization end in amputation, with about 21% passing through revascularization surgery before leading to amputation. Around 15% of these pathways lead directly to non-amputation outcomes. For pathways starting with revascularization surgery, approximately 73% directly result in amputation, while 26% lead to non-amputation outcomes. About 37% of non-amputation pathways beginning with anti-platelet treatment proceed through lipid lowering. However, about 36% of pathways beginning with anti-platelet treatment and followed by lipid lowering, endovascular revascularization, and revascularization surgery ultimately result in amputation. Among pathways that begin with lipid lowering, about 24% end directly in amputation, while 66% end directly in non-amputation. Nearly all pathways beginning with exercise therapy or smoking cessation result in non-amputation outcomes.
Figure 5 and Figure 6 denotes the sunburst and the icicle plots, from these plots, it can be found that, in the amputation cohort, 88% of pathways begin with anti-platelet treatment, typically followed by lipid lowering, endovascular revascularization, and revascularization surgery. About 7% of the cohort begins with endovascular revascularization, followed by revascularization surgery.
In the non-amputation cohort, 90% of pathways begin with anti-platelet treatment, and 7% with exercise therapy. Pathways starting with anti-platelet treatment often proceed through exercise therapy, lipid lowering, endovascular revascularization, and revascularization surgery. Pathways beginning with exercise therapy typically proceed to endovascular revascularization and then to revascularization surgery. In both the plots, the terminal layer has got a lighter shade and when there is no value in any layer, its an indication that the treatments pathway ends there.
3. Analysis
The comparative analysis of treatment pathways between the STARR and All of Us datasets reveals significant variations in the sequences leading to amputation or non-amputation outcomes. These differences provide insights into how treatment strategies and clinical decisions vary across different patient populations and data sources. In both datasets, the administration of anti-platelet and lipid-lowering medications is a prominent feature of the most common treatment pathways, particularly those leading to non-amputation outcomes. In the STARR data, the sequence beginning with anti-platelet therapy followed by lipid-lowering medication is the most frequent, accounting for 32.12% of non-amputation cases. This pattern is echoed in the All of Us data, where the same sequence is also the most prevalent, albeit at a slightly higher 34.14%. This consistency across datasets underscores the effectiveness of these initial treatments in preventing severe outcomes.
However, when examining pathways leading to amputation, the patterns diverge more noticeably between the two datasets. In the STARR data, simpler treatment sequences, such as those involving only anti-platelet or lipid-lowering therapies, are relatively common. For example, the sequence starting with anti-platelet therapy followed by lipid-lowering medication leads to amputation in 22.73% of cases, while starting with lipid-lowering medication alone accounts for 21.82%. These findings suggest that in the STARR cohort, there may be a higher incidence of cases where initial medical management fails to prevent amputation, potentially due to the complexity or progression of the underlying conditions.
In contrast, the All of Us data shows a broader and more complex range of treatment sequences leading to amputation, particularly those involving revascularization procedures. Notably, the pathway involving revasc_endo alone accounts for 18.21% of amputations, highlighting its significant role in this cohort. Additionally, more complex sequences, such as those combining anti-platelet, lipid-lowering, and revasc_endo, are more common in the All of Us data, suggesting a more aggressive or multifaceted approach to treatment. The presence of these complex pathways indicates that patients in the All of Us dataset may present with more advanced disease or that clinicians are more likely to pursue multiple interventions before resorting to amputation.
Moreover, the All of Us data includes sequences where revascularization, both endovascular and surgical, is more frequently associated with amputation outcomes. For instance, the sequence endovascular revascularization, revascularization surgery appears in 6.43% of amputation cases, which is relatively high compared to its lower frequency in the STARR data. This difference could reflect a variation in the timing or criteria for surgical interventions between the two cohorts. Additionally, the STARR dataset exhibits more straightforward pathways with fewer sequential interventions, particularly in cases leading to non-amputation, where simpler combinations of anti-platelet and lipid-lowering therapies are more common. In contrast, the All of Us data demonstrates a higher incidence of pathways involving multiple, complex treatments, particularly in the sequences leading to amputation, where revascularization procedures play a prominent role.
In summary, while both datasets highlight the importance of anti-platelet and lipid-lowering therapies in managing patients at risk of amputation, the All of Us data shows a higher incidence of complex, multi-treatment sequences leading to amputation, particularly involving revascularization. These differences may reflect variations in patient populations, disease severity, or treatment practices, with the STARR data indicating a higher reliance on simpler treatment sequences and the All of Us data showcasing more aggressive or comprehensive interventions. Understanding these variations can inform tailored treatment strategies aimed at improving patient outcomes and reducing the incidence of amputation.
3.1. Odds Ratio Analysis of Treatment Pathways
To further explore the relationship between treatment pathways and outcomes, an odds ratio analysis was performed. The odds ratio provides a measure of the association between a particular treatment pathway and the likelihood of amputation or non-amputation outcomes. An odds ratio greater than 1 indicates a higher likelihood of the amputation outcome, while an odds ratio less than 1 indicates a lower likelihood of amputation outcome. Table 2 shows few treatment pathways from the odds ratio analysis from the STARR data, that likely lower the risk of amputations.
The pathway consisting of lipid-lowering therapy, anti-platelet therapy, and surgical revascularization has an odds ratio of 0.83, indicating a lower likelihood of amputation. This suggests that this treatment sequence is effective in reducing severe outcomes in patients with peripheral artery disease (PAD). Similarly, the combination of anti-platelet therapy, lipid-lowering medication, and surgical revascularization has an odds ratio of 0.81, highlighting its effectiveness in lowering the risk of amputation.
The use of lipid-lowering therapy combined with anti-platelet therapy alone results in an odds ratio of 0.70, further supporting the benefits of combining these treatments in reducing the risk of amputation. In another case, anti-platelet therapy followed by lipid-lowering medication has an odds ratio of 0.62, emphasizing the positive impact of these treatments on non-amputation outcomes. The sequence involving lipid-lowering therapy, anti-platelet therapy, and endovascular revascularization shows an odds ratio of 0.60, reinforcing the idea that these pathways play a critical role in lowering the risk of amputation in patients with PAD.
The odds ratio analysis of the “All of Us” data reveals some notable contrasts and similarities when compared with the STARR data. The “All of Us” data presents an odds ratio of 0.35 for anti-platelet therapy, i.e. a probability of 0.26, indicating a lower likelihood of amputation. The top few rows of the analysis upon All of Us data are as follows in the Table 3.
The combination of anti-platelet therapy and lipid-lowering medication is highlighted in both datasets as an effective treatment sequence. In the STARR data, this combination yielded an odds ratio of 0.62, i.e. probability of 0.38, indicating a lower likelihood of amputation. The “All of Us” data reinforces this finding with an odds ratio of 0.53, i.e. probability of 0.35, indicating lower likelihood of amputations, further underscoring the effectiveness of this treatment combination in mitigating the risk of severe outcomes.
The pathway consisting of Lipid-lowering treatment alone has an odds ratio of 0.34, i.e. a probability of 0.25, highlighting the effectiveness of the treatment in reducing the risk of amputation.
In the STARR data, the combination of anti-platelet therapy, lipid-lowering medication, and endovascular revascularization showed an odds ratio of 3.216828, i.e. probability of 0.76, indicating a higher likelihood of amputation. This suggested that this sequence was associated with more severe cases, where multiple interventions were necessary. The “All of Us” data similarly shows a significant association with an odds ratio of 3.551786, i.e. probability of 0.78, reflecting the use of this combination in complex cases that require aggressive treatment strategies.
Another noteworthy comparison is the pathway involving revascularization, both endovascular and surgical. In the STARR data, the pathway starting with anti-platelet therapy followed by surgical revascularization showed a significant odds ratio of 6.408879, i.e. probability of 0.87, indicating a higher likelihood of amputation. This result highlighted the critical need for effective blood flow restoration in severe cases. The “All of Us” data presents a similar trend, with an even higher odds ratio of 6.691267, i.e. probability of 0.87, for the combination of anti-platelet therapy and endovascular revascularization. This suggests that the association between these treatment sequences and the likelihood of amputation is consistent across different populations.
The analysis also reveals that in both datasets, more complex pathways involving multiple interventions tend to be associated with a higher likelihood of amputation. For instance, the combination of surgical revascularization and lipid-lowering medication in the STARR data showed an odds ratio of 10.185185, i.e. probability of 0.91, further increased when anti-platelet therapy and endovascular revascularization were added. The “All of Us” data similarly shows high odds ratios for these complex pathways, reflecting the necessity for a robust, multi-pronged approach in treating patients with severe cardiovascular disease.
These findings from the “All of Us” data complement and extend the results from the STARR analysis. While there are some differences in the specific odds ratios and significance levels, the overall trends are consistent. Both datasets underscore the importance of certain treatment sequences in managing cardiovascular conditions and highlight their significant associations with either preventing or leading to amputation. The odds ratio analysis provides a deeper understanding of the relative risks associated with different pathways, aiding clinicians in making informed decisions about the most effective treatment strategies for their patients.
7. Conclusions and Future Work
The dominant pathways for amputations in both the datasets used, include sequences with anti-platelet therapy alone or followed by lipid-lowering medication. Additionally, pathways involving surgical revascularization, either alone or in combination with lipid-lowering medications, showed a high association with amputation outcomes. These findings suggest that more aggressive or immediate surgical interventions are often necessary in cases where initial medical management is insufficient.
Building on the findings of this study, future work could explore the development of predictive models using advanced machine learning techniques. One promising avenue is the application of natural language processing (NLP) models to treatment sequences. By leveraging the power of NLP, we can create models that predict the next likely treatment or outcome based on historical sequences.
Such an NLP model would analyze the treatment pathways as sequences of events, learning the patterns and associations within the data. This approach could enable more accurate predictions of patient outcomes and provide valuable decision support for clinicians. For instance, by inputting a patient’s current treatment sequence, the model could predict the likelihood of various future outcomes, allowing for more proactive and personalized treatment planning.
Additionally, future research may focus on integrating more comprehensive datasets, including patient demographics, comorbidities, and lifestyle factors, to enhance the predictive accuracy of these models. By considering a broader range of variables, we can develop more robust models that better reflect the complexity of real-world clinical scenarios.
Further statistical analysis and validation of the identified significant pathways across diverse patient populations and settings would also be beneficial. This could help to generalize the findings and ensure their applicability in different clinical contexts. Moreover, investigating the cost-effectiveness and long-term outcomes of these treatment pathways could provide valuable insights into optimizing healthcare resources and improving patient care.
In conclusion, while this study has provided critical insights into treatment pathways and their associations with amputation and non-amputation outcomes, there is ample opportunity for future work to build on these findings. By developing predictive models and conducting further research, we can continue to advance our understanding of cardiovascular treatment strategies and enhance patient outcomes.
Supplementary Materials
The following supporting information can be downloaded at:.Preprints.org, Table S1: Unique Sequences in the STARR Data, Table S2: Unique Sequences in the All of Us Data, Table S3: STARR Data – Odds Ratio Analysis, Table S4: All of Us Data – Odds Ratio Analysis.
Author Contributions
Conceptualization, S.A; methodology, S.A; software, R.K, D.T, K.B, S.A; validation, S.A; formal analysis, R.K, S.A, M.M; investigation, S.A, R.K; resources, S.A; data curation, S.A, R.C; writing—original draft preparation, R.K, S.A; writing—review and editing, S.A, N.S (Shehadeh), C.L, M.C, E.R, N.S (Shara); visualization, S.A, M.C; supervision, S.A; project administration, S.A. All authors have read and agreed to the published version of the manuscript.
Funding
None.
Conflicts of Interest
None
References
- Centers for Disease Control and Prevention (2024). Peripheral Artery Disease Fact Sheet. CDC.
- National Institute of Health – National Heart, Lung, and Blood Institute. (2022, March 24). What Is Peripheral Artery Disease? https://www.nhlbi.nih.gov/health/peripheral-artery-disease.
- Hardman, R. L., Jazaeri, O., Yi, J., Smith, M., & Gupta, R. (2014). Overview of classification systems in peripheral artery disease. Seminars in Interventional Radiology, 31(4), 378–388. [CrossRef]
- Golledge, J. , & Drovandi, A. (2021). Evidence-Based Recommendations for Medical Management of Peripheral Artery Disease. Journal of Atherosclerosis and Thrombosis, 28(6), 573–583. [CrossRef]
- Zhang, X. , Padman, R., & Patel, N. (2015). Paving the COWpath: Data-Driven Approach to Clinical Pathway Analysis Using Electronic Health Record Data. Journal of Biomedical Informatics, 58, 174-186. [CrossRef]
- Chen, Y. , Nambiar, R., Rubinstein, A., & Zaslavsky, E. (2018). PathCORE-T: Global Feature Selection for Pathway-Based Genomic Data Integration. Bioinformatics, 34(15), 2583-2591. [CrossRef]
- Yan, C. , Yang, H., Huang, Q., Tang, Y., Guo, Y., Liu, J., & Song, X. (2019). Dynamic Visualization of Single-Cell Behavior and Therapy Responses in Optically Clear Zebrafish. Cell, 179(3), 680-693. [CrossRef]
- Parvar, S. L., Fitridge, R., Dawson, J., & Nicholls, S. J. (2018). Medical and lifestyle management of peripheral arterial disease. Journal of Vascular Surgery, 68(6), 1595-1606. [CrossRef]
- Smolderen, K. , Gosch, K., Patel, M., Jones, W., Hirsch, A., Beltrame, J., Fitridge, R., Shishehbor, M., Denollet, J., Vriens, P., Heyligers, J., Stone, N., Aronow, H., Abbott, J., Labrosciano, C., Tutein Nolthenius, R., & Spertus, J. (2018). PORTRAIT (Patient-Centered Outcomes Related to Treatment Practices in Peripheral Arterial Disease: Investigating Trajectories): Overview of Design and Rationale of an International Prospective Peripheral Arterial Disease Study. Circulation Cardiovascular Quality and Outcomes, 11(2). [CrossRef]
- Torun, A., & Bildirici, U. (2024). Interventional Treatment Options for the Prevention of Amputation in Patients with Lower Extremity Wounds from Peripheral Arterial Disease. Texas Heart Institute Journal, 51(1), e238240. [CrossRef]
- All of Us Research Program. (2024). National Institutes of Health. https://support.researchallofus.org/hc/en-us/search?utf8=%E2%9C%93&query=publish.
- National Institutes of Health. About NIH. U.S. Department of Health and Human Services. Retrieved August 14, 2024, from https://www.nih.gov/about-nih.
- STARR Medicine. (2024). STARR Tools: STARR Medicine Research Data Repository. Retrieved [September 20, 2024], from https://med.STARR.edu/starr-tools.html.
Figure 1.
Sankey plot for the STARR data, depicting the flow of treatments between the patients that experienced amputation and those who did not experience any amputation, thickness of the pathway indicates the number of patients experiencing the treatment, a detailed interactive HTML version can be downloaded here.
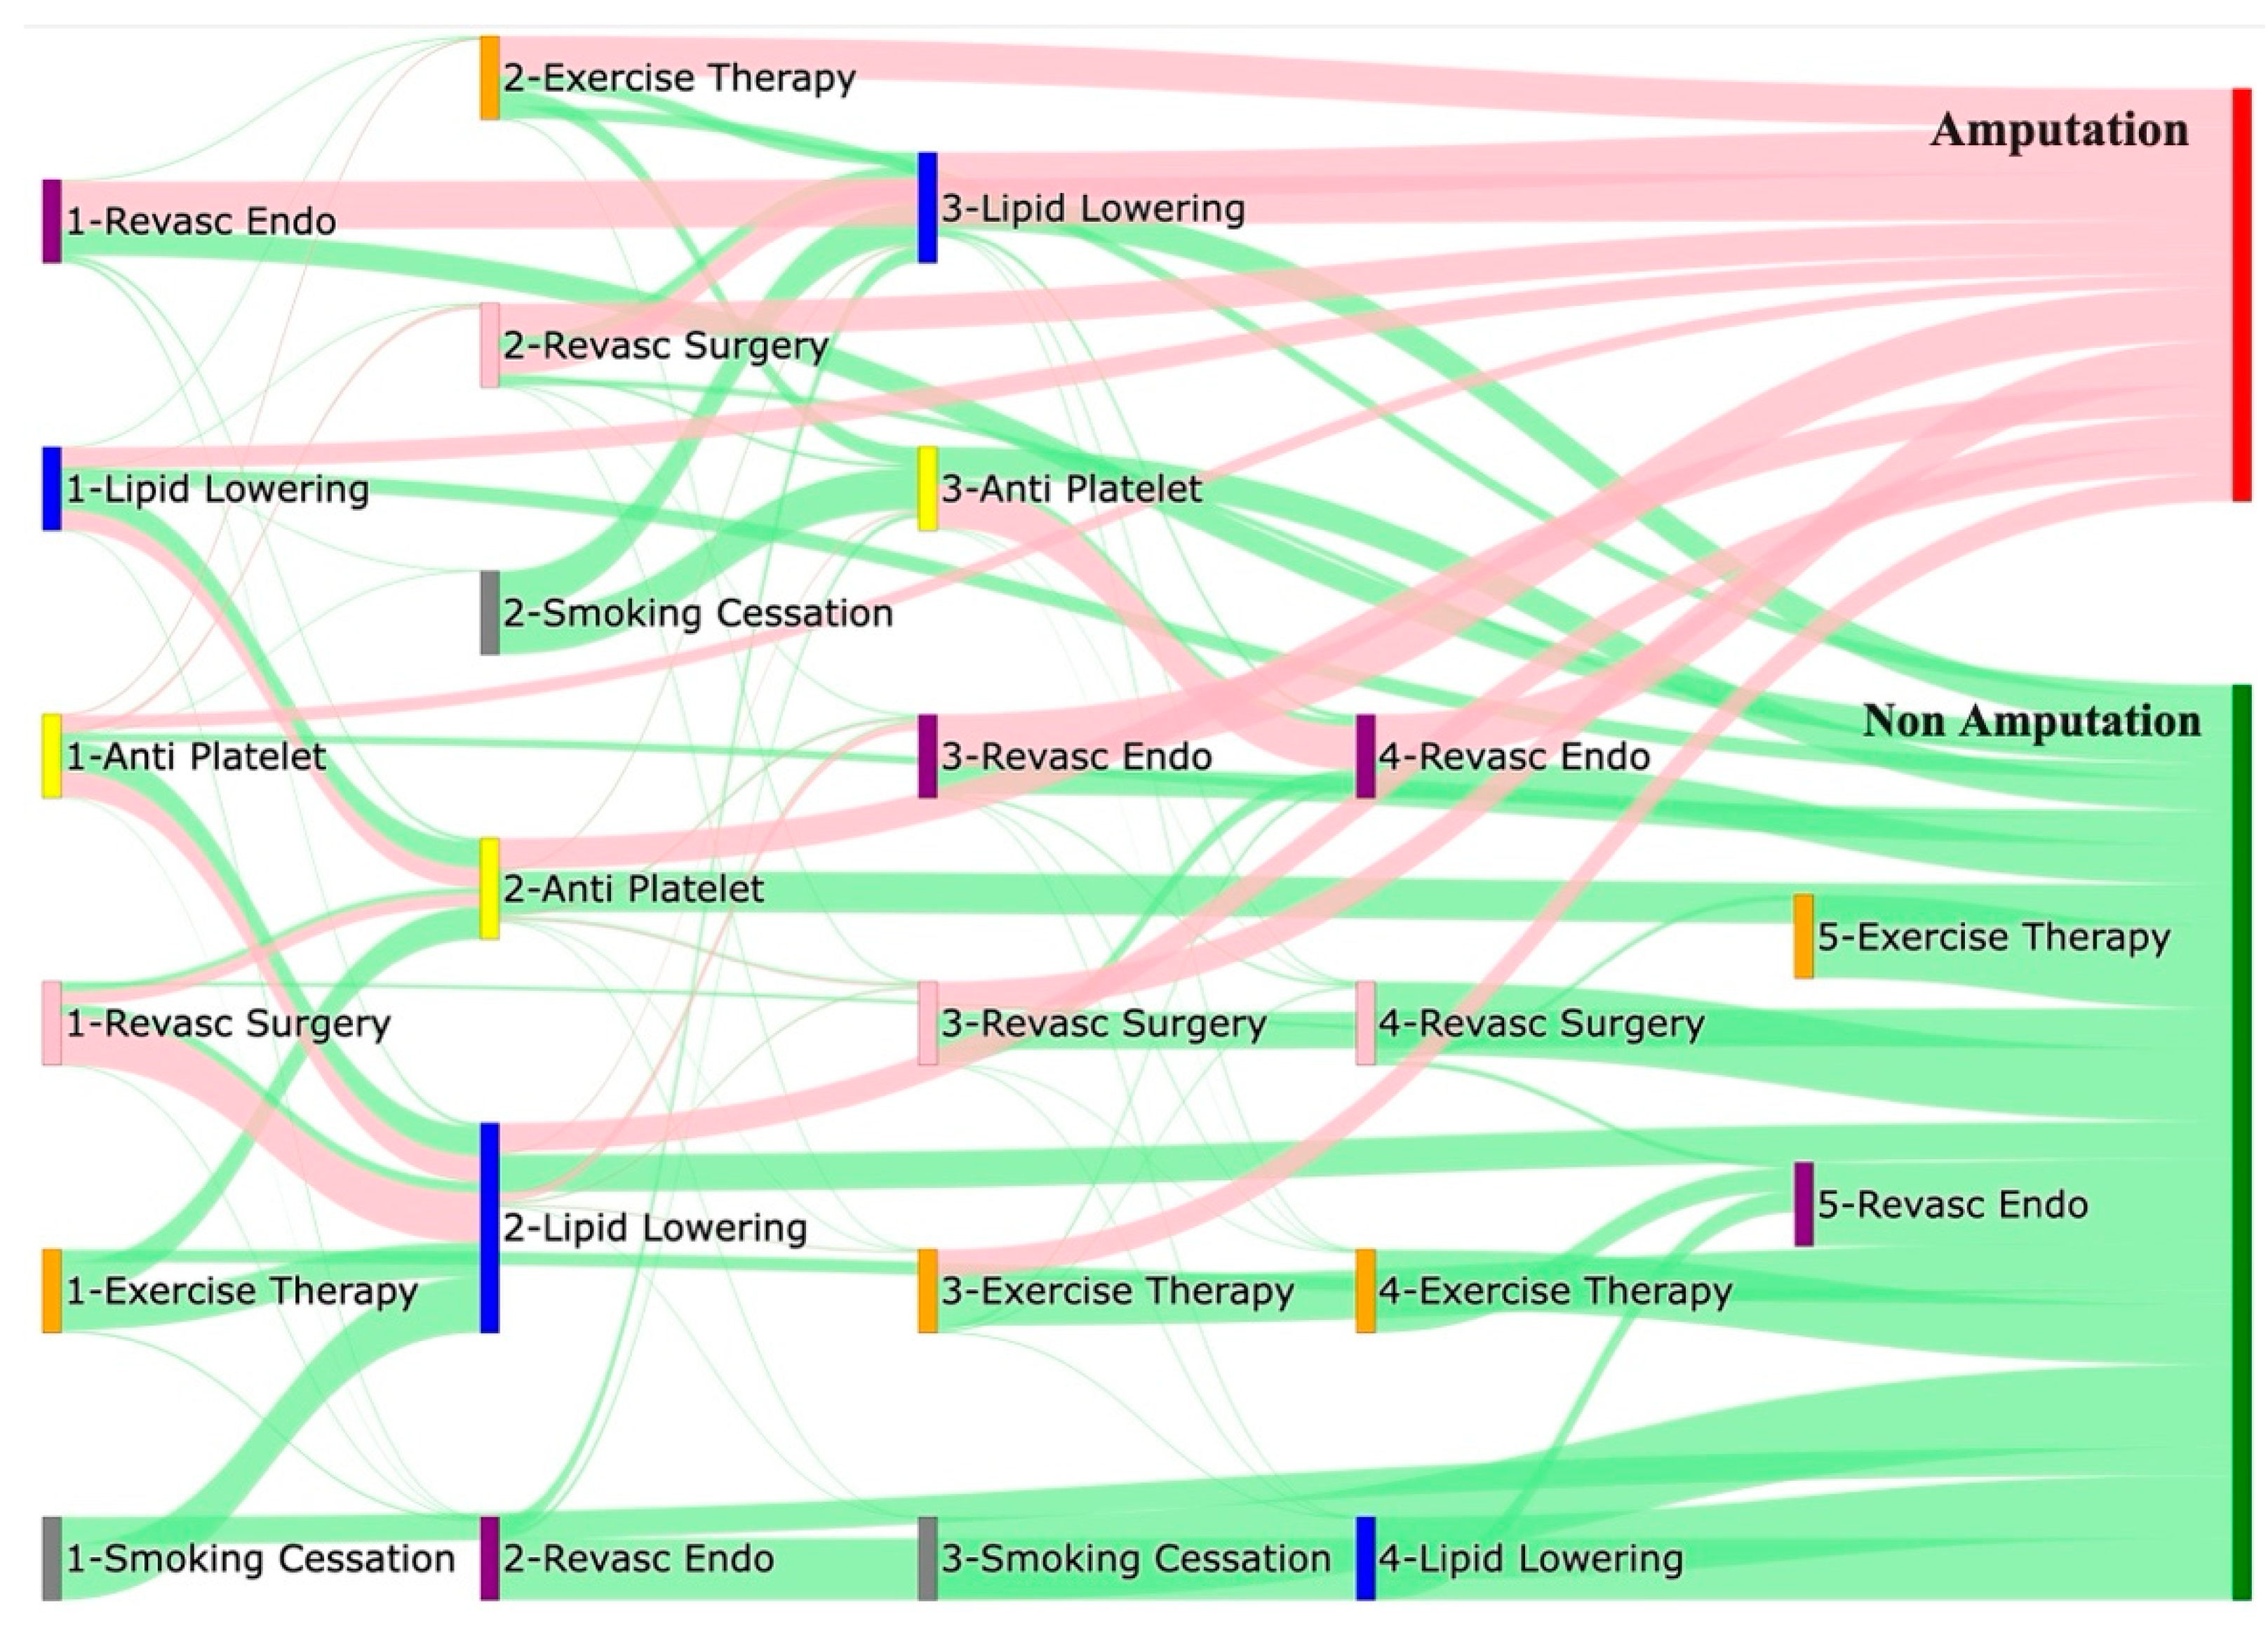
Figure 2.
Sunburst Plot for STARR data, innermost layer only indicates if the pathway belong to amputation cohort or non amputation cohort. The second layer indicates the first treatment the patient experiences following till the end of the sequence of treatments. Empty layer indicates the end of the sequence, a detailed interactive HTML version of this plot can be downloaded here.
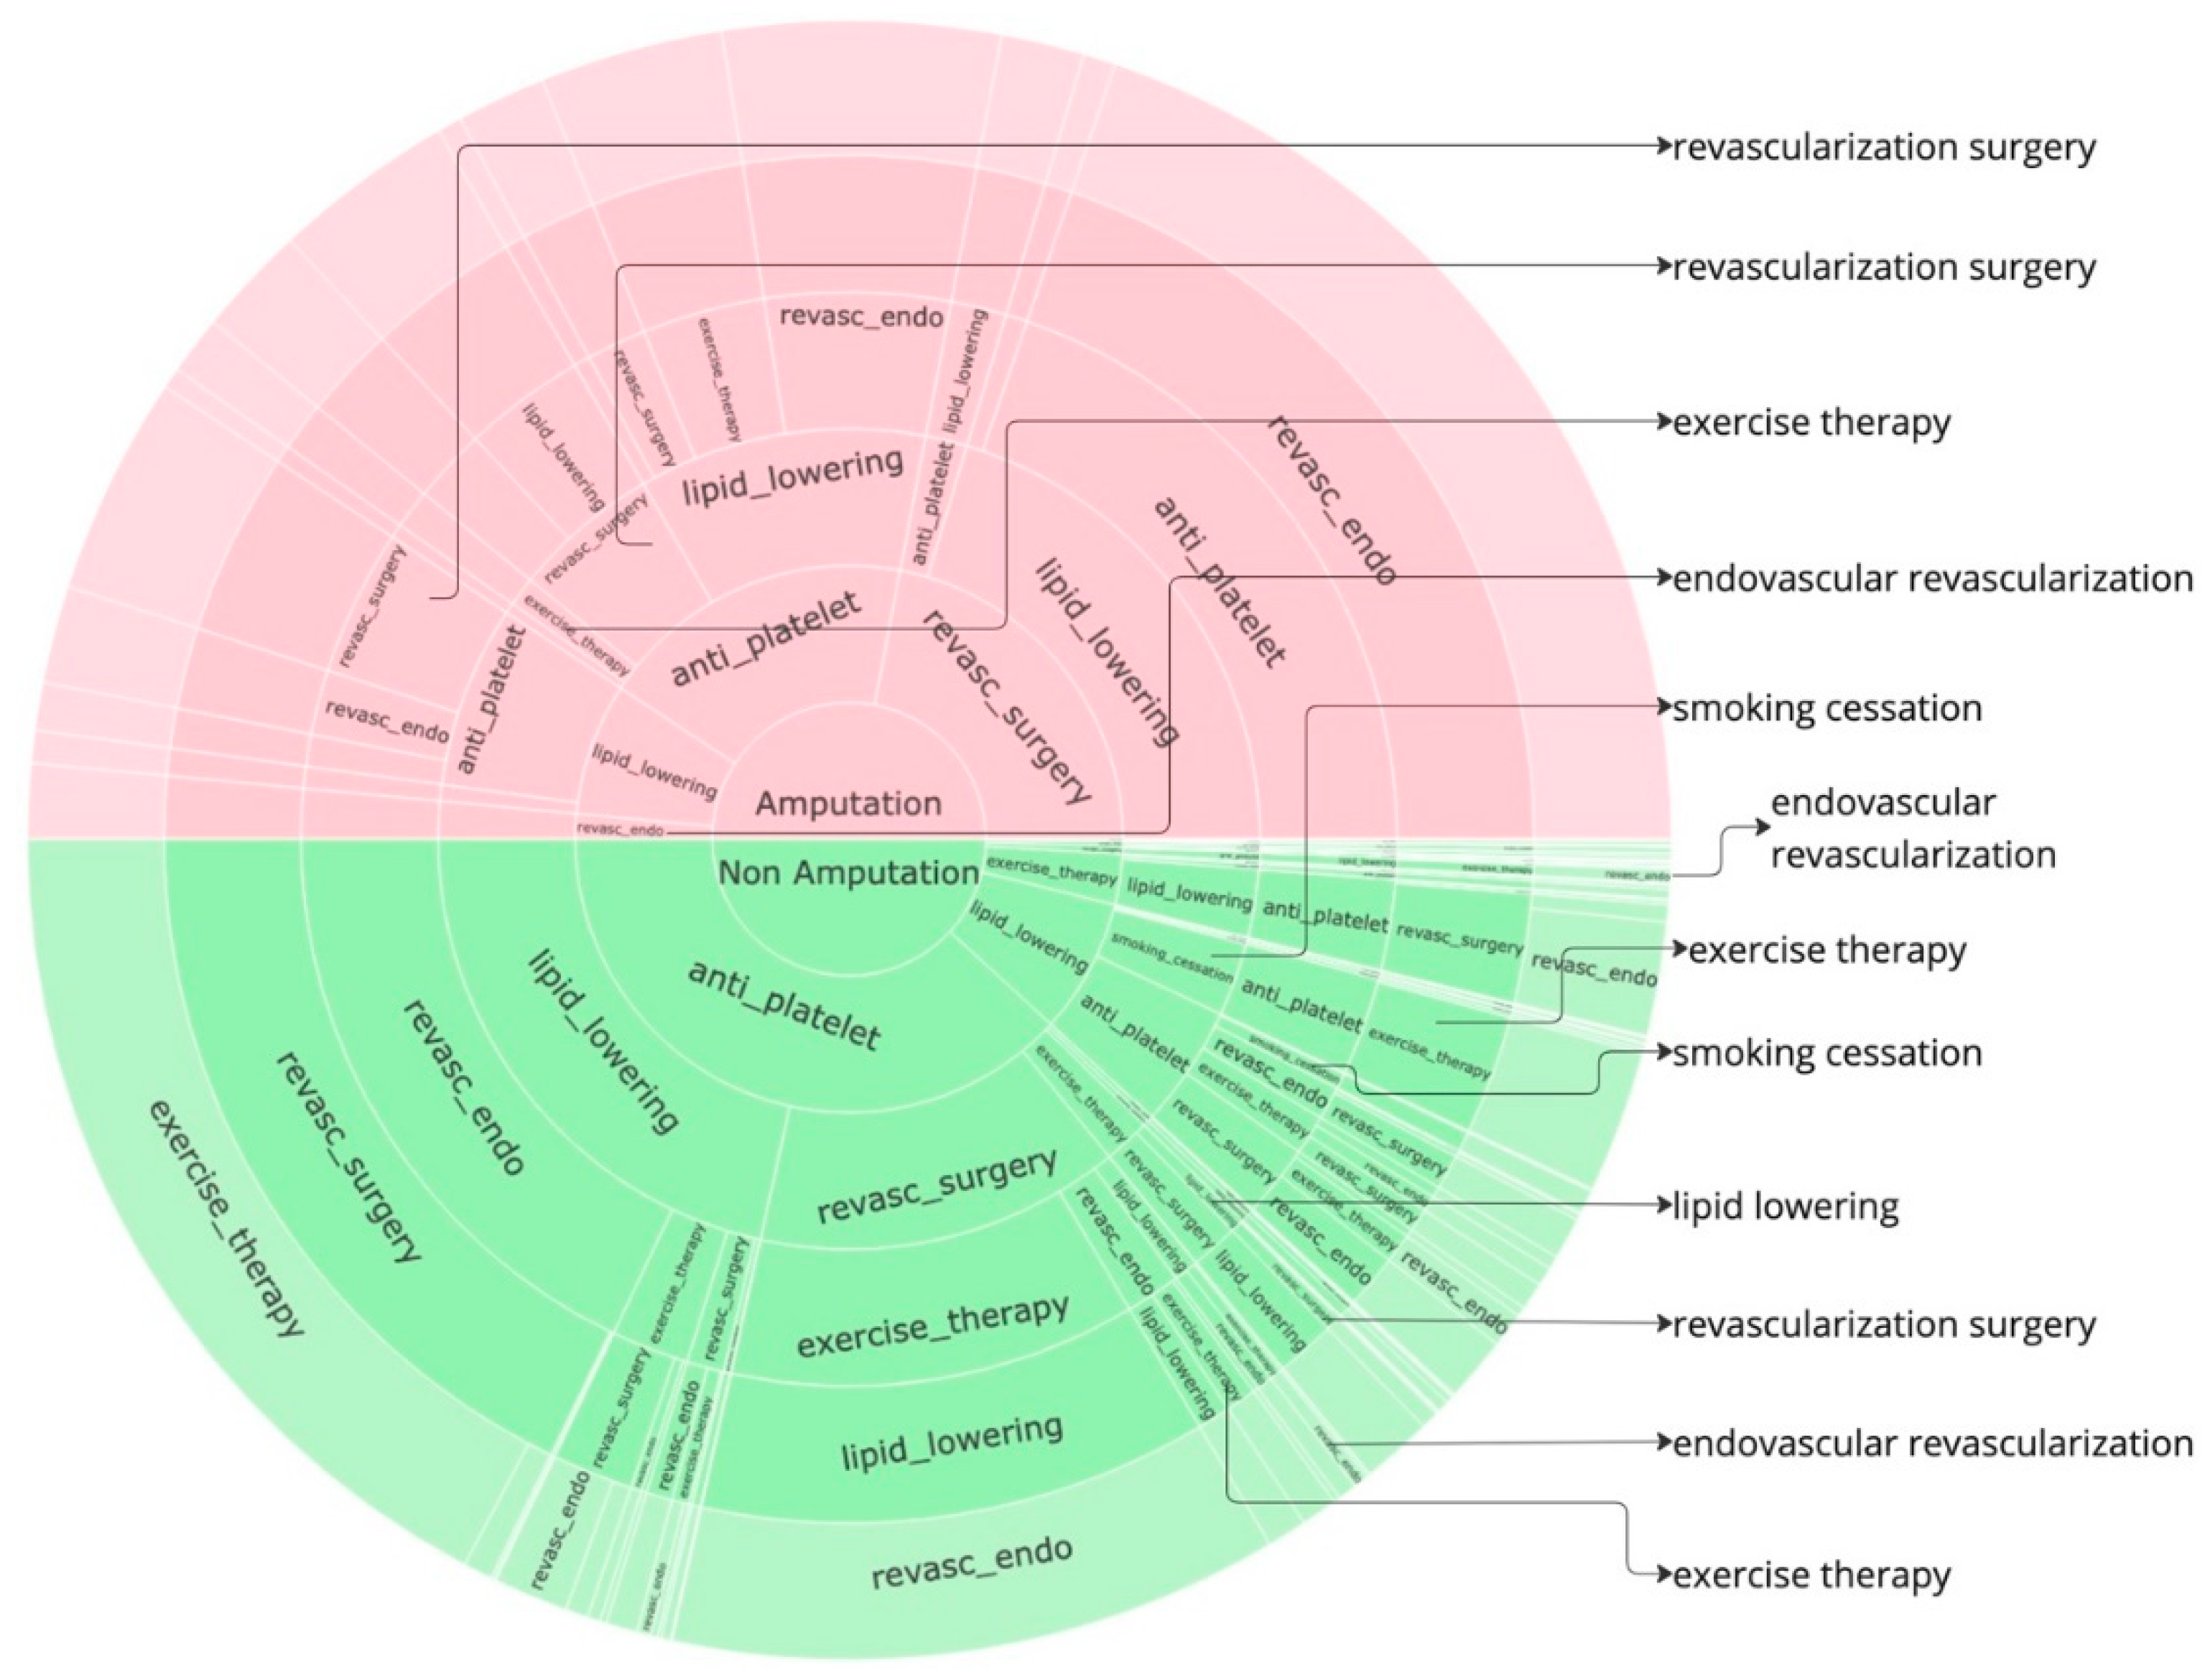
Figure 3.
Icicle plot for the STARR data, depicts the left to right occurance of sequence of treatments, the first column depicts the cohort the sequence belongs to. Empty block indicates the end of sequence of treatments, a detailed HTML version of this plot can be downloaded here.
Figure 3.
Icicle plot for the STARR data, depicts the left to right occurance of sequence of treatments, the first column depicts the cohort the sequence belongs to. Empty block indicates the end of sequence of treatments, a detailed HTML version of this plot can be downloaded here.
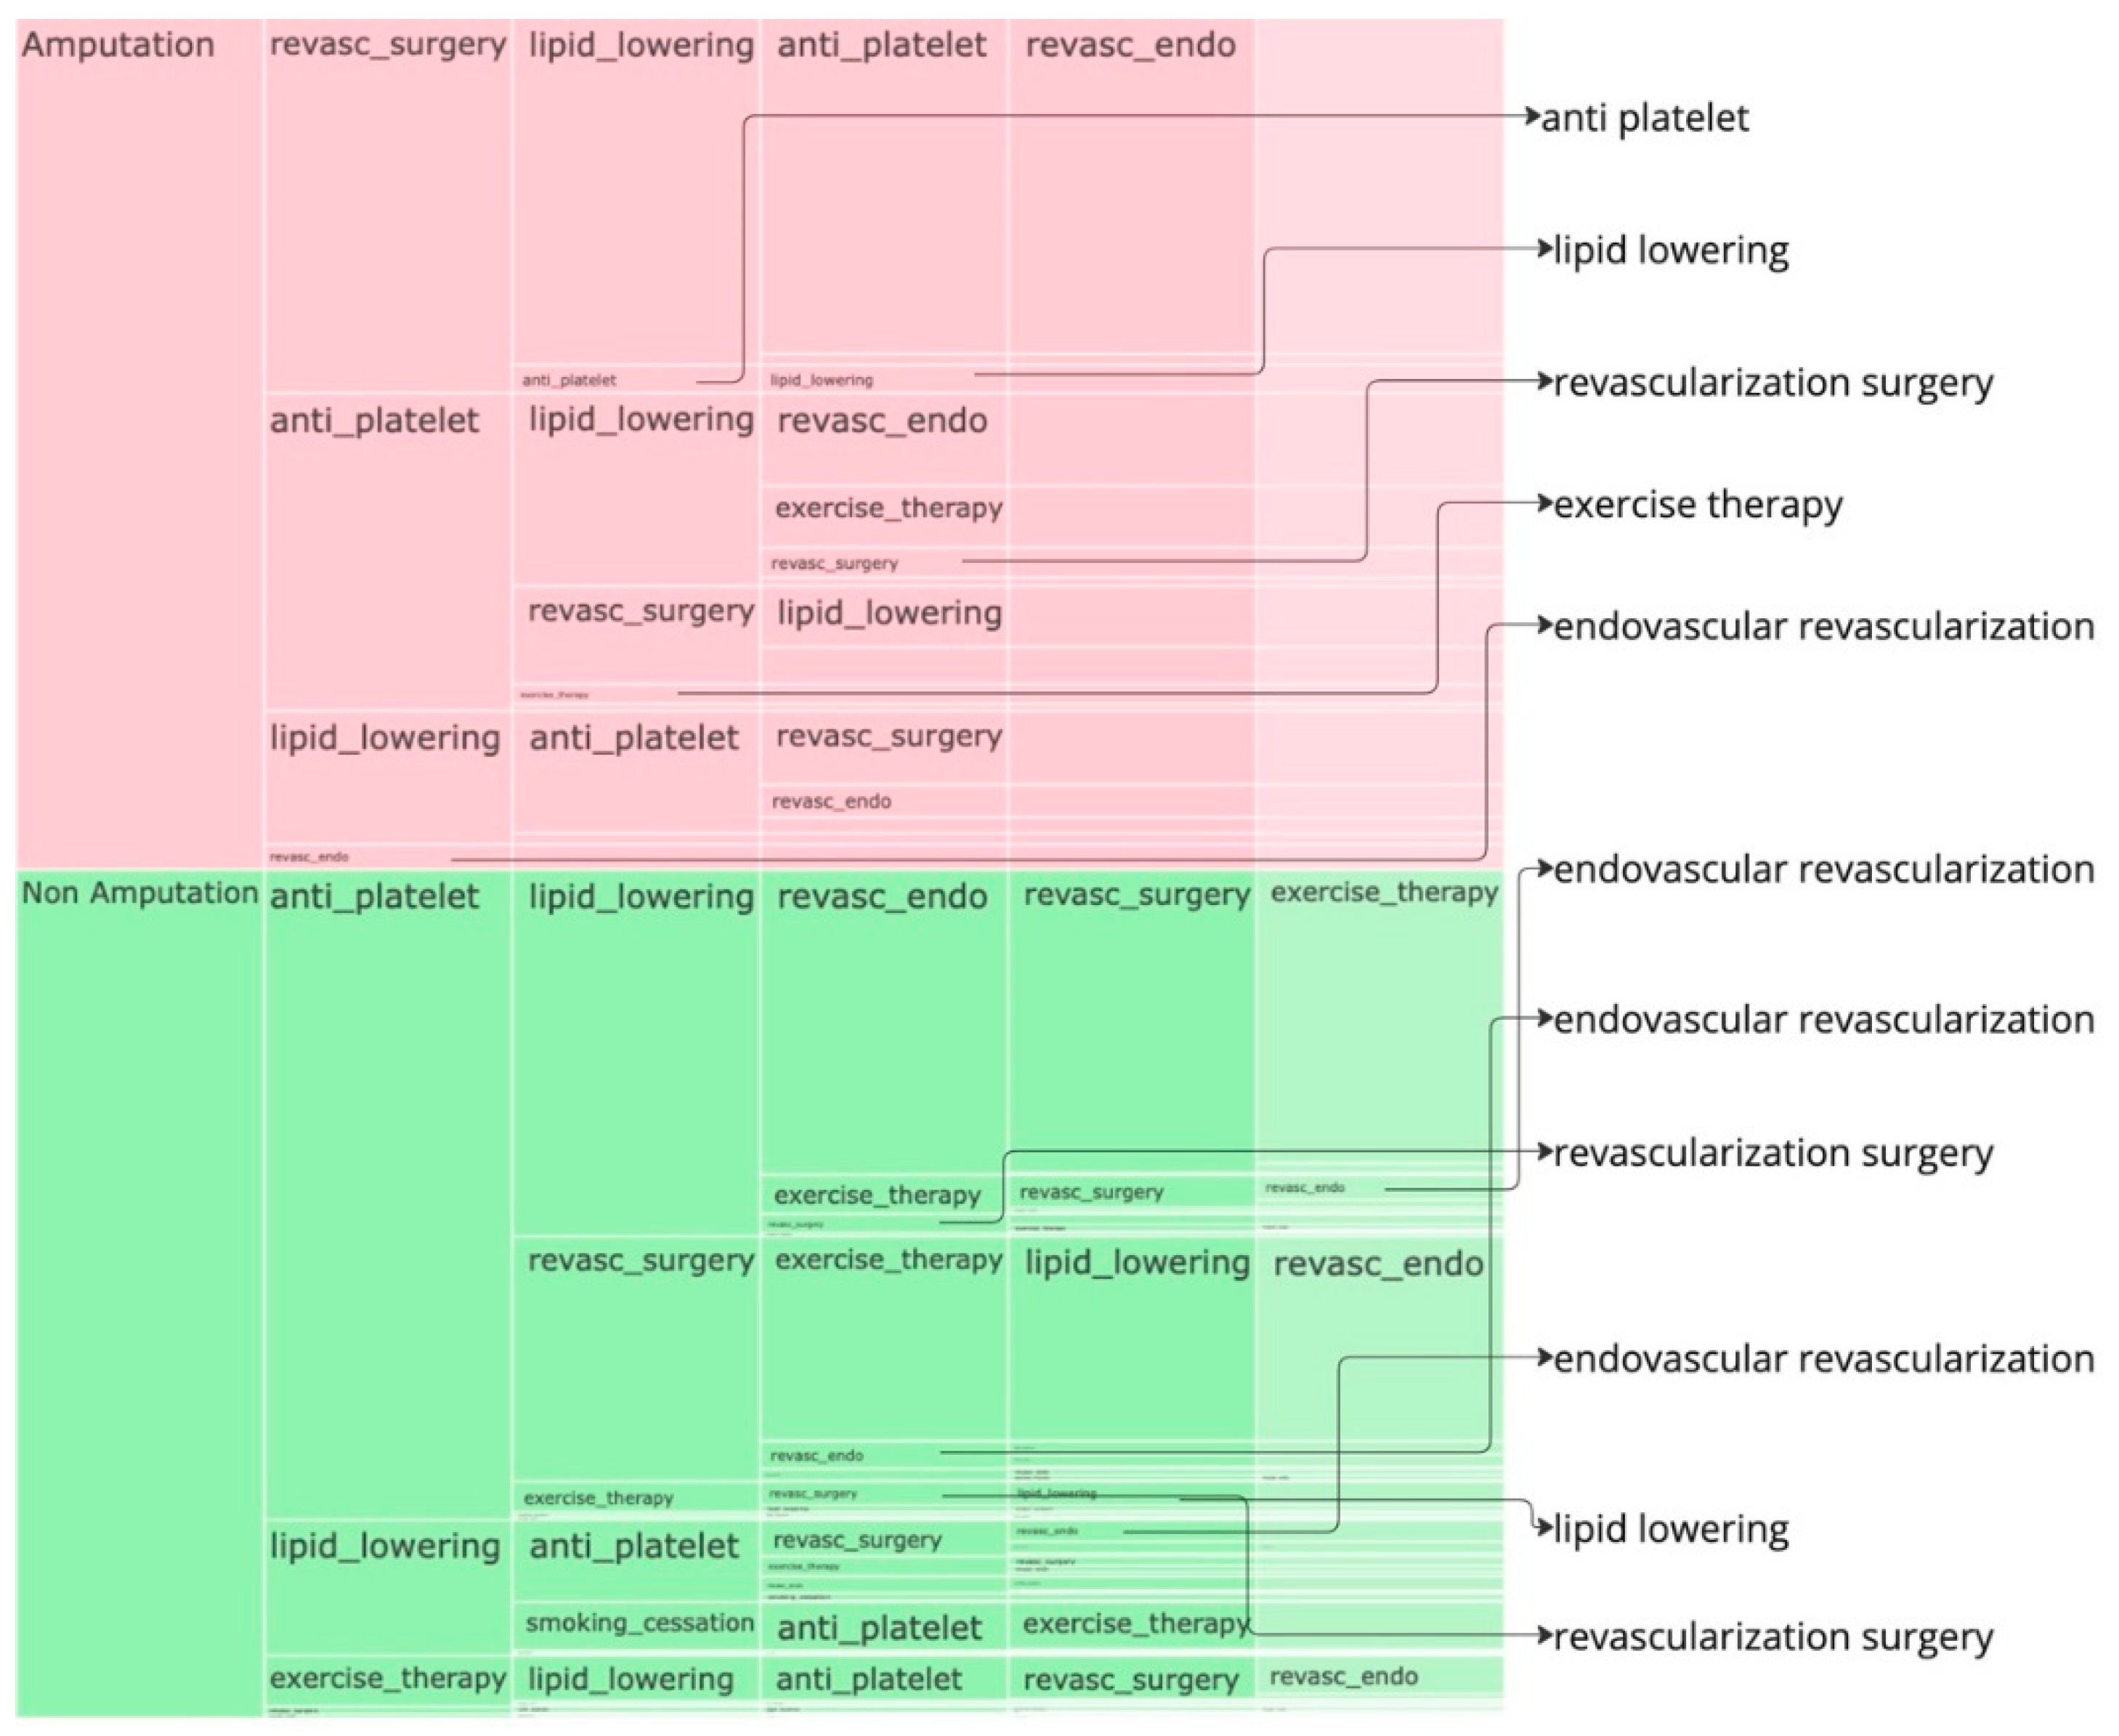
Figure 4.
Sankey Plot for the All of Us Data, depicting the flow of treatments between the patients that experienced amputation and those who did not experience any amputation, thickness of the pathway indicates the number of patients experiencing the treatment, a detailed interactive HTML version can be downloaded here.
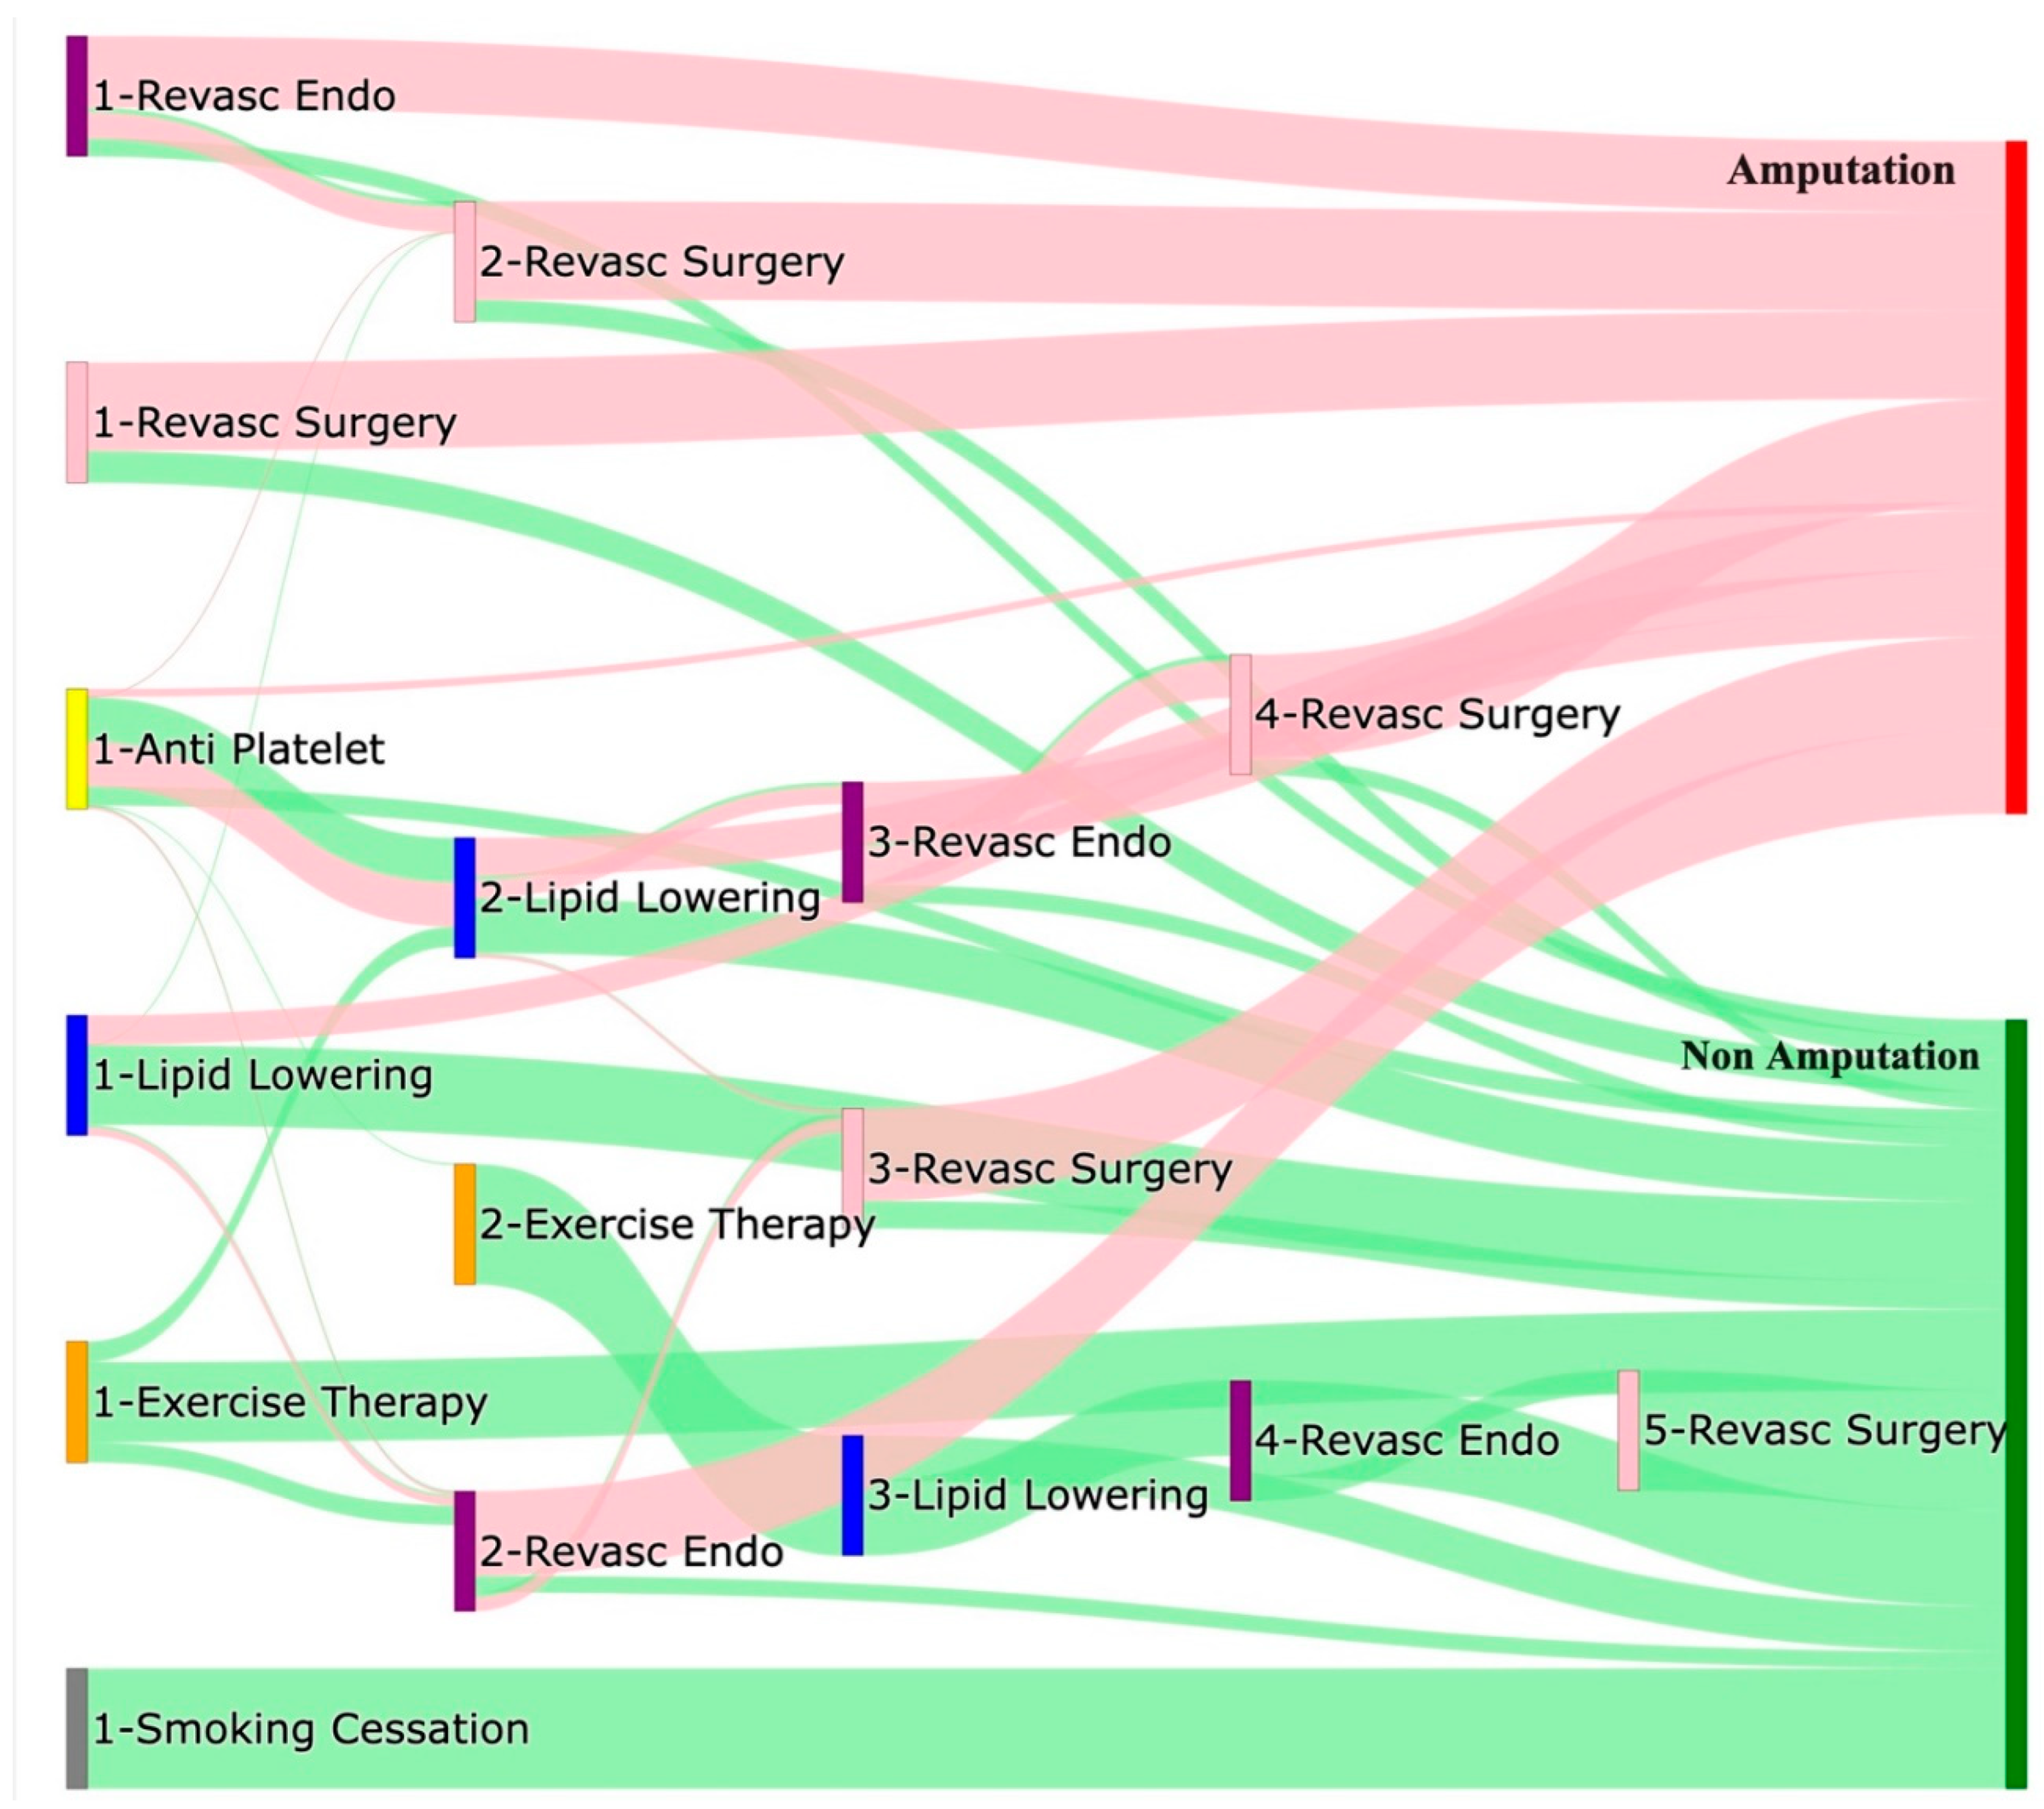
Figure 5.
Sunburst Plot for All of Us Data, innermost layer only indicates if the pathway belong to amputation cohort or non amputation cohort. The second layer indicates the first treatment the patient experiences following till the end of the sequence of treatments. Empty layer indicates the end of the sequence, a detailed interactive HTML version of this plot can be downloaded here.
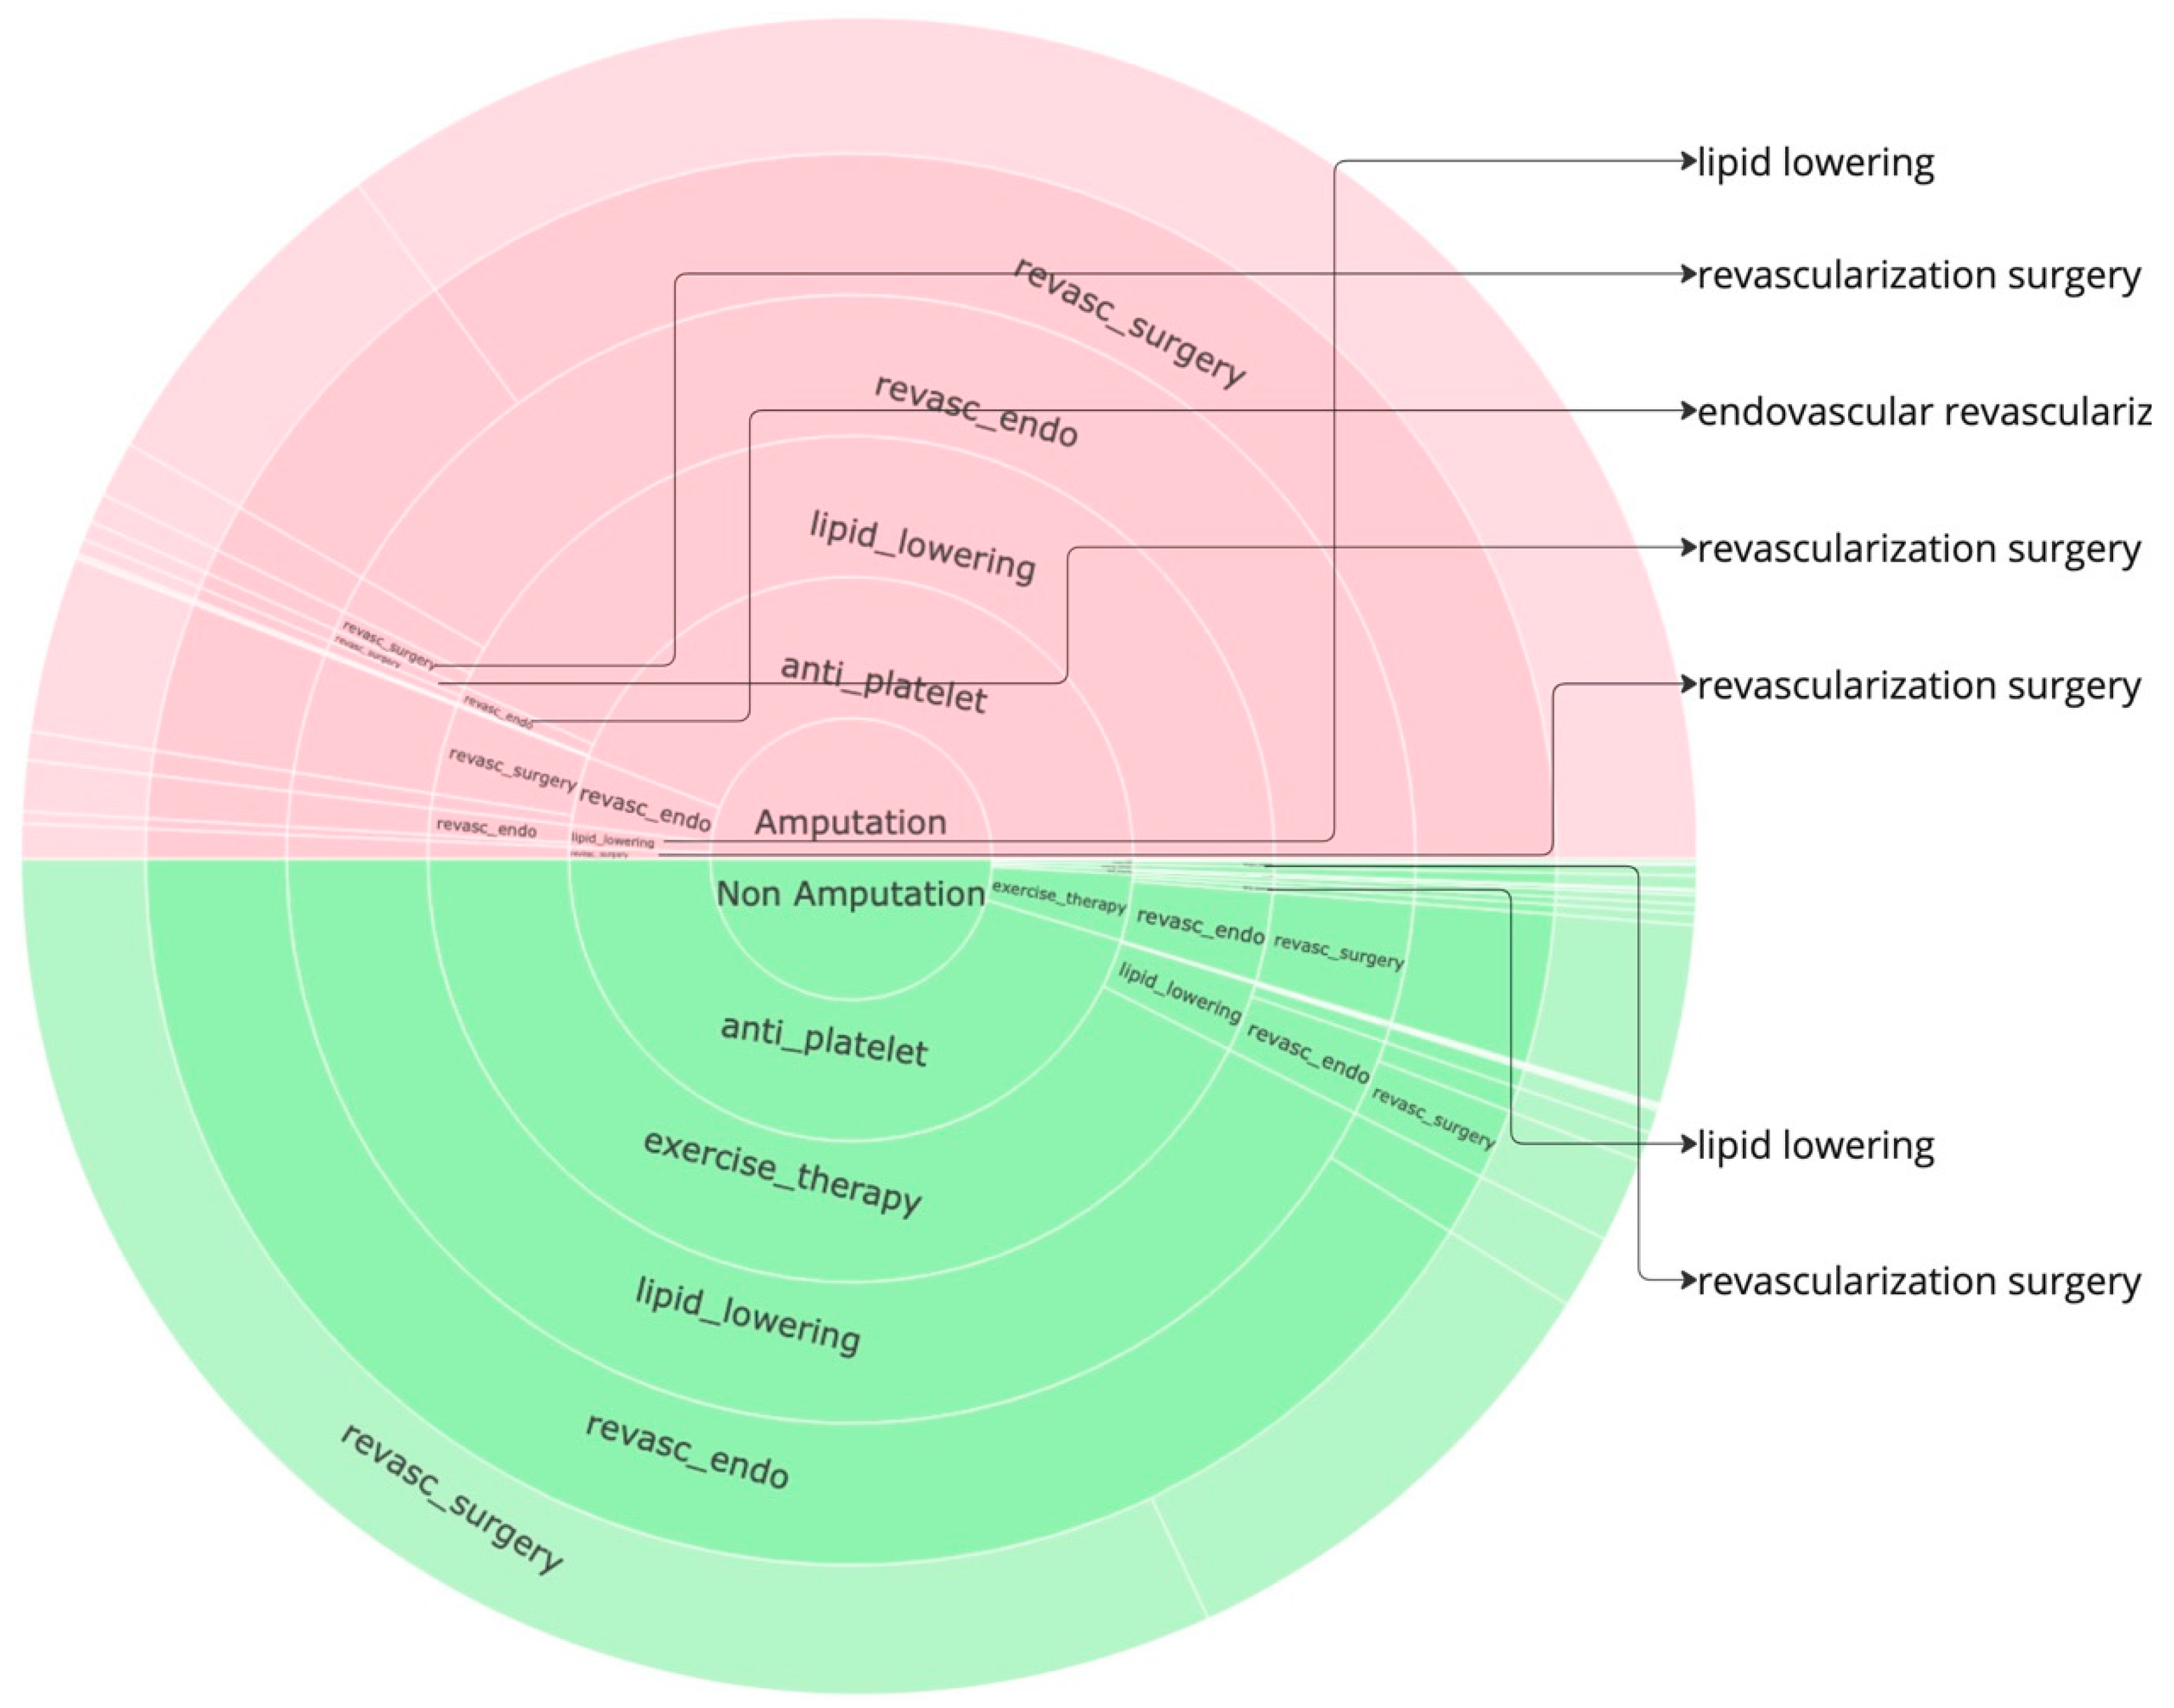
Figure 6.
Icicle Plot for All of Us Data, depicts the left to right occurance of sequence of treatments, the first column depicts the cohort the sequence belongs to. Empty block indicates the end of sequence of treatments, a detailed interactive HTML version of this plot can be downloaded here.
Figure 6.
Icicle Plot for All of Us Data, depicts the left to right occurance of sequence of treatments, the first column depicts the cohort the sequence belongs to. Empty block indicates the end of sequence of treatments, a detailed interactive HTML version of this plot can be downloaded here.
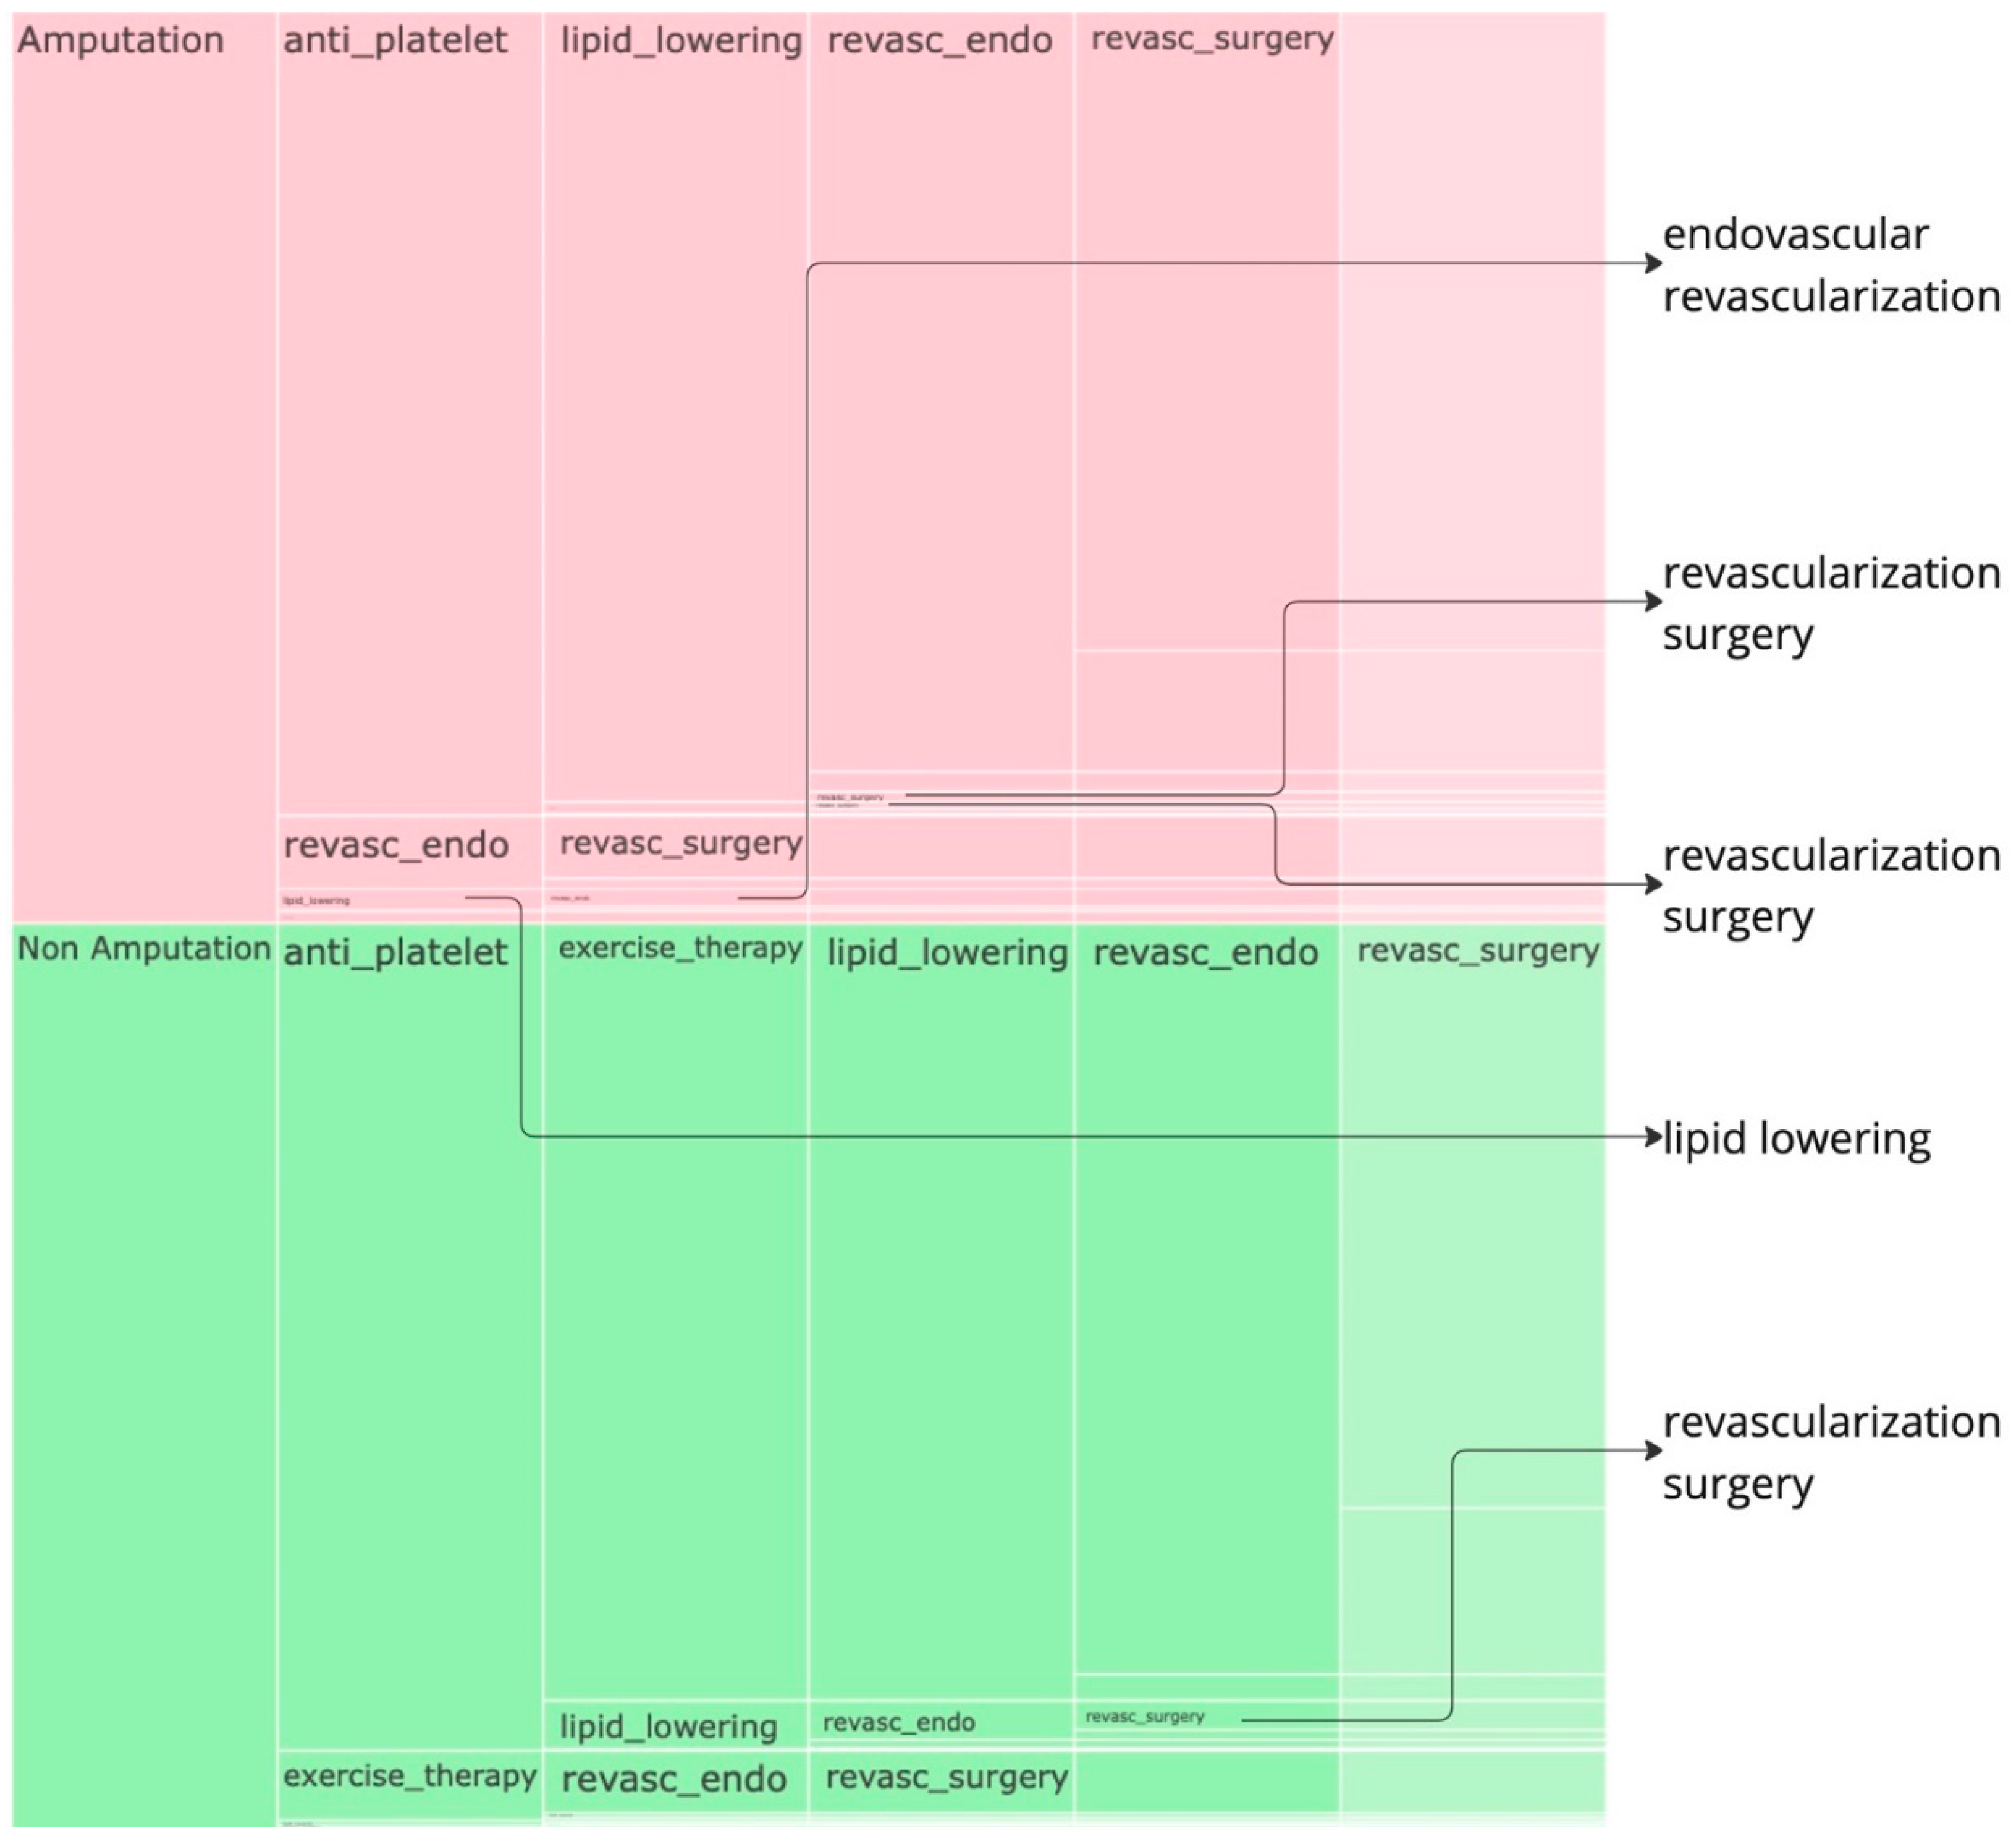

Table 1.
Counts of amputations vs non-amputations in the PAD datasets.
| Cohort | Patients with at least one Treatment before Amputation | Non-Amputations |
|---|---|---|
| STARR Data | 110 | 5510 |
| All of Us Data | 280 | 4106 |
Table 2.
Treatment pathways from odds ratio analysis in the STARR data, lowering the amputation risk.
Table 2.
Treatment pathways from odds ratio analysis in the STARR data, lowering the amputation risk.
| Pathway | Odds Ratio |
|---|---|
| Lipid-lowering, Anti-platelet, Revascularization (Surgery) | 0.83 |
| Anti-platelet, Lipid-lowering, Revascularization (Surgery) | 0.81 |
| Lipid-lowering, Anti-platelet | 0.70 |
| Anti-platelet, Lipid-lowering | 0.62 |
| Lipid-lowering, Anti-platelet, Revascularization (Endovascular) | 0.60 |
Table 3.
Treatment pathways from odds ratio analysis in the All of Us data, lowering the amputation risk.
Table 3.
Treatment pathways from odds ratio analysis in the All of Us data, lowering the amputation risk.
| Pathway | Odds Ratio |
|---|---|
| Anti-platelet | 0.35 |
| Anti-platelet, Lipid-lowering | 0.53 |
| Lipid-lowering | 0.34 |
Disclaimer/Publisher’s Note: The statements, opinions and data contained in all publications are solely those of the individual author(s) and contributor(s) and not of MDPI and/or the editor(s). MDPI and/or the editor(s) disclaim responsibility for any injury to people or property resulting from any ideas, methods, instructions or products referred to in the content. |
© 2024 by the authors. Licensee MDPI, Basel, Switzerland. This article is an open access article distributed under the terms and conditions of the Creative Commons Attribution (CC BY) license (http://creativecommons.org/licenses/by/4.0/).
Copyright: This open access article is published under a Creative Commons CC BY 4.0 license, which permit the free download, distribution, and reuse, provided that the author and preprint are cited in any reuse.


