
Submitted:
16 June 2025
Posted:
17 June 2025
You are already at the latest version
Abstract
Climatic comfort, a pivotal element in elevating human well-being and health, is influenced by an intricate network of meteorological variables. This investigation employs a structural equation modeling (SEM) approach, specifically partial least squares, alongside spatial modeling, and machine learning to scrutinize the multi-faceted impact of various cli-matic constructs on composite indices of climatic comfort across Iran. The constructs under examination encompass thermal, radiative, humidity, wind, and pressure elements, as well as distinct extreme climatic phenomena. Thermal constructs such as diurnal and annual temperature ranges, dew point temperature, and annual minimum and maxi-mum temperatures are analyzed within the model, alongside radiation constructs, including shortwave radiation and albedo. Similarly, humidity and wind constructs, represented by variables like relative humidity, precipitation, and wind speed and direction, are incorporated. Furthermore, specific climatic events, such as summer days, warm nights, and the Warm Spell Duration Index (WSDI), enhance understanding of the climatic conditions shaping thermal comfort. Composite comfort indices, including the Predicted Mean Vote (PMV), Universal Thermal Climate Index (UTCI), and Wet Bulb Globe Temperature (WBGT), serve as the ultimate criteria for comfort assessment in the model. Modeling outcomes reveal that thermal conditions (with a coefficient of 0.515) and extreme climatic occurrences (with a coefficient of 0.381), notably summer days, warm nights, and heat spell duration, exert the most pronounced positive and direct influence on the composite climatic comfort indices. These findings corroborate the primary role of elevated temperatures and extreme events in engendering thermal discomfort within Iran, particularly in southern and southeastern regions (e.g., the Per-sian Gulf and Oman Sea coasts), which experience the highest intensity of these phenomena. Conversely, solar radiation demonstrated a moderate inverse effect (-0.298), while humidity conditions (-0.074) and wind/pressure (0.043) exhibited weaker impacts on comfort. The model's substantial explanatory power (R2=0.811) and robust predictive capability (Q2=0.620) underscore its high efficacy in elucidating and forecasting climatic comfort variations. Moreover, the com-plete alignment of spatial patterns derived from comfort index maps (PMV, UTCI, WBGT, Humidex, TDI) and extreme event maps (Summer Days, Warm Nights, WSDI) with the model's results validates the accuracy and credibility of the findings in pinpointing areas with significant thermal challenges (south and southwest) and regions with more favora-ble comfort levels (mountainous and northern areas). Consequently, the interplay of these constructs and their reciprocal effects plays a crucial role in shaping climatic comfort conditions across diverse Iranian locales. This research can offer substantial guidance for policymakers in devising mechanisms to enhance climatic quality and manage urban and re-gional climatic change.
Keywords:
structural equations
; partial least squares
; climatic constructs
; climatic comfort
; Iran
1. Introduction
Climatic comfort is a foundational pillar in evaluating environmental quality, particularly within human contexts [1,2]. It emerges from the complex interplay between atmospheric conditions and human physiological and psychological responses [3]. Over recent decades, significant shifts in global climate, accelerating urbanization trends, and evolving land use patterns have transformed the precise scientific analysis of factors influencing climatic comfort into an indispensable necessity for urban planners, health policy-makers, and climate researchers [4,5]. Iran, with its vast geographical expanse and remarkable climatic diversity from ultra-arid central regions to humid northern and southern zones, presents a unique environment for investigating climatic relationships and conducting comfort analysis [6,7]. Far from being a simplistic, single-factor phenomenon, climatic comfort is shaped by the interaction of various meteorological constructs [8,9]. These constructs can be broadly categorized into four key groups: thermal conditions (such as daily and annual temperatures, temperature ranges, and dew point temperature), radiative conditions (including direct radiation, diffused radiation, and albedo), humidity conditions (like relative humidity, cloud cover, and precipitation), and wind and pressure conditions (such as wind speed, direction, and surface pressure) [10,11]. Beyond these variables, extreme events like warm nights, cold days, and indices such as the Warm Spell Duration Index (WSDI) significantly contribute to individuals’ perception of climatic conditions [12,13]. The amalgamation of these factors into composite indices including the Universal Thermal Climate Index (UTCI) [14,15], Predicted Mean Vote (PMV) [16], Wet Bulb Globe Temperature (WBGT) [17], and Humidex [18] enables a simultaneous analysis of physiological, psychological, and climatic aspects [19].
Despite ongoing efforts in human-climate studies, many prior investigations have been limited to single-variable or localized analyses. The causal and structural relationships between climatic variables and comfort levels have rarely been explored within comprehensive theoretical models. In this context, a Structural Equation Modeling (SEM) approach [20,21] offers a practical framework for identifying, explaining, and quantifying the influence of each climatic factor on climatic comfort. SEM allows for the simultaneously examining of relationships between latent constructs and observed variables.
The objective of this research is to design and elaborate a conceptual model based on the structural relationships among climatic variables that affect comfort in Iran. This aims not only to ascertain the relative contribution of each construct to creating or disrupting comfort conditions but also to provide a scientific foundation for climatic decision-making, urban design, sustainable development, and mitigating climatic vulnerability. Utilizing long-term climatic data, multivariate statistical analysis, and an integrated theoretical framework, the current study endeavors to present a systematic and practical depiction of the climatic mechanisms impacting comfort across Iran.
2. Materials and Methods
2.1. Study Area
Iran, a land characterized by remarkable climatic diversity, stretches from the humid coasts of the Caspian Sea to the arid central plateau deserts, and from the fertile western plains to the snow-capped Zagros and Alborz mountains. This extensive geographical spread, located between 25°3′N to 39°47′N latitudes and 44°5′E to 63°18′E longitudes, fosters an exceptionally complex climatic pattern. This study leverages 40 years of climatic data (1984–2024) and an analysis of latent climatic constructs to offer a multifaceted depiction of thermal, radiative, humidity, wind, and extreme weather conditions across Iran.
2.2. Data Sources and Pre-Processing
The data utilized in this research were sourced from reputable global and national repositories, including the ERA5 and NCEP/NCAR databases, as well as synoptic stations operated by the Iran Meteorological Organization. To ensure spatial and temporal consistency, comprehensive pre-processing steps were undertaken. These involved addressing outliers and missing values, normalizing variables, performing geostatistical interpolation (such as Kriging), and ensuring temporal alignment. Statistical computations and the derivation of composite indices were conducted using MATLAB, ArcGIS, SPSS, and other relevant software environments.
For a thorough, multi-dimensional analysis of climatic conditions influencing thermal comfort in Iran, this study integrated various credible data sources, encompassing observational station data, reanalysis products, and outputs from global climate models. Observational climatic data, including temperature, humidity, wind, precipitation, solar radiation, and surface pressure variables, were collected from national meteorological synoptic stations spanning the 1984–2024 period, with rigorous quality control measures applied. For comprehensive spatial and temporal coverage, especially in areas with sparse meteorological stations, reanalysis data such as ERA5 and NCEP/NCAR were employed [22]. These datasets facilitated the high-accuracy extraction of radiative and composite parameters like albedo, diffuse radiation, and dew point temperature. Additionally, extreme climatic and heat stress indices derived from CMIP6 (Coupled Model Intercomparison Project Phase 6) simulations were utilized for practical components of this study [23]. The data include various greenhouse gas emission scenarios (e.g., SSP2-4.5 and SSP5-8.5) and are projected for future periods (2021–2100).
2.3. Latent Constructs and Observed Variables
To comprehensively analyze the multi-construct impact of climatic variables on climatic comfort across Iran, a robust set of long-term, high-quality climatic data was compiled and processed. The data used in this study comprise a combination of observed variables that are theoretically grouped into latent constructs. This conceptual framework allows researchers to model the intricate relationships between climatic elements and composite thermal comfort indices with greater precision. Accordingly, this study employed several latent constructs and observed variables. Six primary latent constructs were defined in this research: thermal conditions, radiation conditions, moisture/humidity conditions, wind and pressure conditions, extreme climate events, and composite thermal comfort indices. Each latent construct consists of multiple quantitative and qualitative variables collected on a daily, monthly, or annual basis. These constructs are categorized as follows:
-
Thermal Conditions: This construct measures temperature components influencing climatic comfort and includes the following variables:
- ○
- Daily Temperature Range
- ○
- Yearly Temperature Range
- ○
- Daily Maximum Temperature
- ○
- Annual Mean Temperature
- ○
- Annual Maximum Temperature
- ○
- Annual Minimum Temperature
- ○
- Dew Point Temperature (Notably, dew point temperature functions as a dual indicator within thermal and humidity constructs. Its final placement was determined based on factor loading in the ultimate analysis.)
-
Radiation Conditions: This construct represents the amount of solar radiant energy received and reflected from the Earth’s surface, directly impacting surface heating. Defined variables include:
- ○
- Shortwave Downward Irradiance
- ○
- Shortwave Diffuse Irradiance
- ○
- Shortwave Downward Irradiance
- ○
- Albedo (Variables may be classified as a subset of direct or diffuse radiation depending on the technical definition of the data source. For precise analysis, this was examined separately.)
-
Humidity Conditions: Relative humidity and related parameters are pivotal in evaporation, transpiration, and human thermal sensation. This construct encompasses:
- ○
- Relative Humidity
- ○
- Dew Point Temperature
- ○
- Cloud Amount
- ○
- Daily and Annual Precipitation
-
Wind and Pressure Conditions: This construct is designed to assess mechanical heat transfer parameters and the influence of natural ventilation on comfort. The key variables are:
- ○
- Wind Speed
- ○
- Wind Direction
- ○
- Surface Pressure
-
Extreme Climate Events: Extreme phenomena, such as intense heatwaves and cold spells, directly impact the increase or decrease of thermal comfort. The following variables were selected to represent this construct:
- ○
- Summer Days
- ○
- Warm Nights
- ○
- Yearly Warm Nights
- ○
- Tropical Nights
- ○
- Cold Days
- ○
- Warm Days
- ○
- Warm Spell Duration Index (WSDI)
-
Composite Thermal Comfort Indices: To investigate human perception of climatic comfort, internationally recognized and validated composite indices were utilized. These indices integrate components of temperature, humidity, radiation, and wind, and include:
- ○
- Predicted Mean Vote (PMV)
- ○
- Universal Thermal Climate Index (UTCI)
- ○
- Wet Bulb Globe Temperature (WBGT)
- ○
- Humidex
- ○
- Thermal Discomfort Index (TDI)
3. Methods
This study employed various statistical and modeling approaches to analyze the multi-construct influence of climatic variables on climatic comfort in Iran. Specifically, to quantify the direct and indirect effects of each climatic construct on thermal comfort indices, we utilized a causal model and Structural Equation Modeling (SEM) based on Partial Least Squares (PLS_SEM) [24,25]. SEM is a powerful, multifaceted tool that allows for the simultaneous examination of complex relationships among latent variables (constructs) and observed variables. Beyond assessing causal relationships, this method aids in evaluating the overall fit of the conceptual research structure and determines the consistency between the observed data and the theoretical model.
3.1. SEM Implementation Stages
The implementation of the SEM model in this research involved three primary stages:
1. Conceptual and Theoretical Model Specification
In this initial stage, latent climatic constructs including thermal, radiative, humidity, wind and pressure conditions, extreme climatic phenomena, and composite thermal comfort indices were conceptually defined. Hypothesized relationships between these constructs and their effects on climatic comfort were formulated based on existing literature and theoretical frameworks. This stage involves:
- Defining Latent Variables: Identifying variables like climatic comfort that are not directly measurable.
- Selecting Observed Indicators: Choosing measurable variables such as mean temperature, relative humidity, and wind speed to represent the latent constructs.
- Formulating Causal Relationships: Specifying direct and indirect influences among constructs and observed variables.
- Designing the Path Diagram: Creating a graphical representation of the constructs, indicators, and their causal relationships.
3.2. Measurement Model Estimation and Assessment
The aim of the measurement model is to evaluate the quality of how latent variables (constructs) are measured by their observable indicators. Using collected data from reliable sources (synoptic stations, ERA5 and NCEP/NCAR reanalysis data, and CMIP6 indices), the validity and reliability of the latent constructs were assessed. This was performed through Confirmatory Factor Analysis (CFA) to ensure that the observed variables accurately represent their respective constructs.
In developing the measurement model, the validity and reliability of the research measures were examined via CFA. This process confirmed the correctness of relationships between observed variables and latent constructs. CFA was used to evaluate the appropriate factor loadings for each construct and its defined indicators.
The reliability of the constructs was assessed using Cronbach’s Alpha and Composite Reliability (CR) for internal consistency. To assess the validity of the model, convergent validity (using Average Variance Extracted (AVE)) and discriminant validity (comparing the square root of AVE with inter-construct correlations) were employed [26,27]. Additionally, weak indicators were removed based on low factor loadings (below 0.5 or 0.6, depending on the model). Ultimately, the quality of measurement instruments and the accuracy of construct measurement were evaluated. In the measurement model assessment process, bootstrapping was used to test hypothesized effects, particularly for mediation analysis. This technique was applied to obtain t-values and evaluate the significance of direct relationships before testing mediating effects. Therefore, the measurement model test assessed reliability (internal consistency) and discriminant validity. Key aspects included the reliability of each item or observed variable, the Composite Reliability of each construct, and the AVE for observed variables or items. Measuring the factor loading of each observed variable is crucial for calculating the reliability index. Cronbach’s Alpha was also used to assess the consistency of each item. Dillon-Goldstein’s Rho (or Dillon-Goldstein’s Coefficient) was also utilized, with an acceptable value of 0.7 or higher. The third indicator, Average Variance Extracted (AVE), includes values of 0.5 or greater. To assess the discriminant validity of the constructs, two criteria were considered. First, items or indicators of a construct must have the highest factor loading on their construct, meaning they should have the lowest Cross-Loading on other constructs. Based on Straub’s recommendation, the factor loading of each item on its corresponding construct should be at least 0.1 higher than its loading on other constructs. Furthermore, another index for evaluating the quality or fit of the measurement model, the CV-Communality (Construct Cross-validated Communality) index, was used [28]. Positive values of this index indicate good quality of measurement instruments, while negative values suggest poor quality in measuring the latent variable.
Reliability of variables was also used in evaluating the measurement model. Accordingly, the Outer Loading index, with values greater than 0.7, was considered. To assess the second criterion for item reliability (i.e., the significance of factor loadings at the 0.01 level), the Bootstrapping procedure was executed. The Outer Model T-Statistic was used in this stage, where the magnitude of t-statistics indicates the significance of factor loadings [29,30]. Values greater than 2.66 at the 0.01 level or higher demonstrate significance. The Quality Criteria index was also used to assess the Composite Reliability of each construct, with values greater than 0.7 being acceptable. Additionally, the Average Variance Extracted (AVE) values greater than 0.5 were selected.
To assess the discriminant validity of the constructs, two criteria were considered. In Cross-Loadings, the factor loading for each item on its construct was considered to be at least 0.1 higher than its loading on other constructs. For the second criterion, Latent Variable Correlations were used, employing the latent variable correlation matrix. By placing the square root of AVE values on the diagonal of this matrix, higher correlation values for a construct were considered acceptable. Finally, the Blindfolding command was run, and the Construct Cross-validated Communality report was clicked. In the table, the sum of squares of observations (SSO) for each latent variable block and the sum of squares of prediction errors (SSE) for each variable block is specified. The ratio of 1 - SSE/SSO is the CV-Communality index [31]. Positive values of this index indicate the sound quality of the measurement model.
3.3. Structural Model Testing
The purpose of testing the structural model is to evaluate the strength and significance of hypothesized causal relationships among latent variables (constructs), as well as the explanatory power of independent variables on the variance of dependent variables. Therefore, the structural model was examined to assess:
- Path Coefficients and their Significance: Path coefficients range between -1 and +1. Values close to +1 indicate a strong positive relationship, values close to -1 indicate a strong negative relationship, and values close to 0 suggest a weak or no relationship.
- Coefficient of Determination (R-squared): The interpretation of R-squared values depends on the research context, but generally, values of 0.75, 0.50, and 0.25 are considered strong, moderate, and weak, respectively.
- Stone-Geisser’s Q-squared (Q²) or CV-Redundancy: Used to assess the structural quality or predictive relevance. Q² evaluates the model’s ability to predict the values of dependent variables out-of-sample. Values of Q² greater than zero indicate that the model has predictive power. Values of 0.02, 0.15, and 0.35 are considered small, medium, and large for predictive power, respectively.
Thus, structural model testing is performed after confirming the quality of the measurement model and focuses on examining the relationships between constructs. This includes evaluating the strength and significance of path coefficients using t-tests and p-values, assessing the explanatory power of dependent variable variance using the R-squared coefficient, and evaluating the model’s predictive power using Stone-Geisser’s Q². The Inner Model T-Statistic report, showing explained variance along with t-values (e.g., 1.96 for 0.05 significance level and 2.58 for 0.01 in a two-tailed test), was used in the structural model evaluation. This test indicates that t-values greater than a critical value signify a significant relationship.
3.4. Integrating Structural and Spatial Analyses
In this study, we employed a two-pronged analytical approach, combining Structural Equation Modeling (SEM) using Partial Least Squares (PLS-SEM) with geostatistical techniques based on Kriging, to achieve a comprehensive understanding of climatic comfort in Iran. This integrated methodology allowed us to simultaneously explore both the underlying causal relationships and the spatial distribution of comfort conditions. Our structural equation modeling framework enabled us to quantify and explain the complex causal relationships between latent climatic constructs (including thermal, radiative, humidity, wind/pressure conditions, and extreme climatic events) and composite comfort indices (such as PMV, UTCI, and WBGT) across the country. This analysis provided insights into the strength and direction of each construct’s influence on overall climatic comfort. Concurrently, to accurately map the spatial distribution of these phenomena and validate our statistical findings, we utilized ArcGIS Geostatistical Analyst and ordinary Kriging techniques. For the semivariogram model, we specifically used the spherical model to capture the spatial autocorrelation of the measured sample points. This powerful tool interpolated measured data from meteorological stations to generate precise and continuous spatial maps of climatic comfort indices and extreme climatic events across unmeasured locations throughout Iran. The integration of these distinct yet complementary approaches proved crucial. While SEM revealed the causal drivers of discomfort (e.g., the substantial positive impact of thermal conditions and extreme events), the geostatistical mapping visually confirmed these statistical relationships by showing the corresponding spatial patterns. For instance, areas identified by SEM as having high thermal discomfort drivers directly corresponded to regions on the Kriging maps experiencing severe heat (like the Persian Gulf and Oman Sea coasts). This dual perspective provided a robust and holistic understanding of the intricate interplay between climatic factors and human comfort, pinpointing thermally challenging areas and those offering more favorable conditions. The core of SEM involves both the measurement model (how latent variables are measured by observed indicators) and the structural model (relationships between latent variables) [32,33]. Within Structural Equation Modeling (SEM), diverse models are utilized to investigate the relationships between latent and observed variables. Specifically, the measurement model (reflective indicators), commonly applied in PLS-SEM research, shows through the follow equation how an observed variable(xi) influences and is measured by a latent construct (ηj) [34,35]:
where xi is the observed variable, is the factor loading , is the latent construct , and is the measurement error for xi .
The estimation method for the structural model is highly significant in analyzing the influence of latent variables. The relationships among latent variables are examined based on the structural model. This can be calculated using the following equation, which represents the relationship between a dependent latent construct (ηj) and independent latent constructs (ηk) [29,36]:
where ηj is the dependent latent construct (e.g., Composite Thermal Comfort) , ηk is the independent latent constructs (e.g., Thermal Conditions, Extreme Climate Events), βjk is the path coefficient (strength and direction of relationship between ηk and ηj), and ζj is the error term for ηj (variance not explained by the model).
The kriging method for an unmeasured location is highly significant in analyzing the weighted average of measured values. The fundamental equation for Kriging is the weighted average estimation. This can be calculated using the following equation based on at an unmeasured location (Z∗(s0)) as a weighted average of measured values (Z(si)) [37,38]:
where Z∗(s0) is the predicted value at the unmeasured location s0 , Z(si) is the measured value at the i-th known location si , λi is the kriging weight assigned to the i-th measured value, and N is the number of measured points used in the estimation. The weights (λi) are derived from the semivariogram model and the spatial conFigureureuration of the points, minimizing the estimation variance. The experimental semivariogram (γ(h)) measures the dissimilarity between points separated by a lag distance (h) [39]:
where γ(h) is the semivariance for a given lag distance h, N(h) is the number of pairs of points separated by distance h , Z(si) is the value at location si , and Z(si+h) is the value at location si shifted by vector h. In this study, the spherical model for the semivariogram was used.
The analysis of integrating structural and spatial relationships was performed using specialized software such as SPSS.27, SmartPLS.4, MATLAB.2024, and ArcGIS Pro3. This approach facilitated a precise and comprehensive analysis of complex climatic data, providing a deeper understanding of how climatic variables influence thermal comfort in Iran.
3.5. Machine Learning for Climatic Comfort Analysis
In this paper, Random Forest (RF) models were employed to investigate the influence of various climatic variables on thermal comfort constructs, and their findings were compared with those from Structural Equation Modeling (SEM) and spatial statistical methods. This approach integrates classic statistical modeling principles with advanced machine learning algorithms. Initially, the Random Forest algorithm was implemented. Subsequently, SEM and spatial models were utilized for cross-validation and to assess the consistency of the results across different methodological paradigms. We calculated and derived the impact of climatic variables based on several standard thermal comfort indices: PMV (Predicted Mean Vote), UTCI (Universal Thermal Climate Index), WBGT (Wet Bulb Globe Temperature), Humidex, and TDI (Thom’s Discomfort Index). Rigorous data quality control and pre-processing were conducted from multiple perspectives. This involved identifying and managing missing values through methods like mean imputation or deletion, detecting and removing outliers, normalizing variables for consistent scaling, and recording geographical coordinates (X and Y) for spatial analysis. All pre-processed data were then meticulously organized.
The Random Forest model, a supervised learning algorithm that builds an ensemble of decision trees using bootstrap aggregation and random feature selection, was employed to reduce variance, enhance prediction accuracy, and uncover non-linear relationships among variables. Model implementation involved several key stages: data splitting (dividing the dataset into 80% for training and 20% for testing), designing input and target variables (each comfort index, such as PMV and UTCI, was modeled separately with climatic variables as inputs and the comfort index as the output), and parameter tuning. Hyperparameters like the number of trees (n_estimators), maximum tree depth (max_depth), and minimum samples per leaf (min_samples_leaf) were optimized using cross-validation. Finally, established model evaluation metrics were used to validate the predicted values.
A significant advantage of the Random Forest algorithm is its capability to assess predictor importance. This evaluation helped identify the most influential climatic factors affecting each comfort index, enabling a nuanced regional analysis of these differences.
For a comprehensive validation and to evaluate the robustness of the Random Forest model, its findings were subjected to a comparative analysis with results from Structural Equation Modeling (SEM) and spatial models. This comparative approach facilitated a deeper, multifaceted analysis of the causal relationships between climatic variables and comfort indices. Consequently, leveraging Random Forest as a data-driven model alongside SEM as a conceptual-structural model provided a multi-layered analysis of climatic components influencing comfort.
4. Results
This study defined six primary latent constructs: thermal conditions, radiation conditions, moisture/humidity conditions, wind and pressure conditions, extreme climate events, and composite thermal comfort indices. Each latent construct consisted of several quantitative variables gathered on a daily, monthly, or annual basis. Figure 1 illustrates the relationships between these latent constructs and the climatic comfort construct.
Figure 1 presents the Structural Equation Model (SEM), specifically employing the Partial Least Squares (PLS-SEM) approach. This model was designed and analyzed to explain and predict “Climatic Comfort Indices” based on five categories of environmental/climatic conditions.
It illuminates the intricate connections between latent (unobserved) and observed variables (indicators). In this diagram, the dependent variable, Climatic Comfort Indices, is measured by five indicators: Humidex, PMV, TDI, UTCI, and WBGT. The independent variables were defined as: Thermal Conditions (including variables like annual and daily mean, maximum, and minimum temperatures); Humidity Conditions (encompassing indicators such as cloud amount, dew point, precipitation, and relative humidity); Extreme Events (including indices like the number of cold days, warm days, tropical nights, and annual drought/heating indices); Radiation Conditions (comprising albedo and shortwave radiation indicators); and Wind and Pressure Conditions (including indicators such as surface pressure, wind direction, and wind speed).
The coefficient of determination (R2) of 0.914 points to a strong explanatory power for the model. This high R2 value signifies that 91.4% of the variance in climatic comfort indices is accounted for by the five constructs: “Thermal Conditions,” “Humidity Conditions,” “Extreme Events,” “Radiation Conditions,” and “Wind and Pressure Conditions.” This underscores the model’s exceptionally robust explanatory capability. Figure 1 further reveals that Thermal Conditions (with a path coefficient of 0.515) exert the most substantial positive and direct influence on climatic comfort indices. This suggests that improved thermal conditions (likely optimal temperatures) increase comfort. Extreme Events (with a path coefficient of 0.381) also demonstrate a positive and relatively strong impact on climatic comfort indices. Conversely, Radiation Conditions (with a path coefficient of -0.298) show a moderate negative influence on climatic comfort indices, indicating that increased radiation (possibly unwanted or excessive) can diminish climatic comfort. Figure 1 also reflects that Humidity Conditions (with a path coefficient of -0.074) have a negative but weak effect on climatic comfort. Finally, Wind and Pressure Conditions (with a path coefficient of 0.043) exhibit a positive but very weak influence on climatic comfort indices.
4.1. Measurement Model Evaluation: Initial Findings
In the initial evaluation of factor loadings (convergent validity and reliability), results indicated that most indicators had positive factor loadings on their respective constructs, suggesting a correlation with the intended construct. However, some indicators, such as annual minimum temperature and DTR for Thermal Conditions, Dew Point T and Precipitation for Humidity Conditions, and several Extreme Events indicators, displayed low (e.g., less than 0.5) or even negative factor loadings. These instances flagged potential issues with their convergent validity or reliability, suggesting they might need adjustment or removal to ensure credible measurements. The model indicates that thermal conditions, extreme events, and radiation conditions are the most significant environmental factors explaining comfort. In contrast, humidity, wind, and pressure conditions have a lesser impact on climatic comfort. The model’s high explanatory power (R2=0.914) demonstrates its strong efficacy in predicting climatic comfort. However, to ensure the full validity of these findings, more detailed analyses were conducted, including assessing the statistical significance of coefficients (p-values and t-values from bootstrapping), discriminant validity (HTMT and Fornell-Larcker), and other model fit criteria. Table 1 presents the t-test results.
These findings reveal that all five categories of environmental/climatic conditions exert a statistically significant influence on climatic comfort indices. Thermal conditions (with a coefficient of 0.515) represent the strongest positive influencing factor, with extreme events (coefficient of 0.381) ranking second. Radiation conditions (coefficient of 0.072) and wind and pressure conditions (coefficient of 0.043) show positive but weak effects. Humidity conditions (coefficient of -0.074) are the only factor demonstrating a negative and weak impact on climatic comfort. These results offer crucial insights into the primary determinants of comfort in the studied environment.
4.2. Measurement Model Evaluation
For the designed measurement model, we utilized Composite Reliability (CR) for each construct, Average Variance Extracted (AVE) values, and Cronbach’s Alpha. Table 2 displays these reliability and validity indicators. Results from Table 2 show that Cronbach’s Alpha values are predominantly greater than 0.7 (with values above 0.6 being acceptable for exploratory research), indicating that the constructs in the measurement model exhibit acceptable internal consistency.
Specifically, Cronbach’s Alpha for Climatic Comfort Indices was 0.947. The internal consistency of the constructs was further assessed: a value of 0.871 for Climatic Comfort Indices signifies prefect internal consistency, while 0.781 for Humidity Conditions indicates suitable internal consistency. Thermal Conditions were estimated at 0.863, demonstrating very good internal consistency for this construct. However, initial internal consistency values for the Extreme Events (-0.271), Wind and Pressure (-0.325), and Radiation (-0.381) constructs were poor and unacceptable, necessitating re-evaluation and control. Furthermore, Table 2 indicates that the Composite Reliability (CR) of most constructs, excluding the Radiation construct, is greater than 0.7. Specifically, CR for Climatic Comfort Indices was 0.918, and for Humidity (0.853) and Thermal (0.891) constructs, CR values indicated extreme reliability. In contrast, the CR for Extreme Events (0.509), Pressure and Wind (0.455), and Radiation (0.175) constructs reflected weak reliability. An analysis of Average Variance Extracted (AVE) values showed that values greater than 0.5 indicate adequate convergent validity. Climatic Comfort Indices (0.713), Humidity Conditions (0.603), and Thermal Conditions (0.547), along with the Extreme construct (0.454), were initially estimated with appropriate convergent validity. However, the radiation (0.336) and Wind/Pressure (0.249) constructs measured weak convergent validity. Consequently, the “Comfort Indices, “Thermal Conditions,” and “Humidity Conditions” constructs demonstrated excellent reliability (across all three criteria) and convergent validity (AVE), fully meeting the required benchmarks. These constructs were accurately measured by their indicators. To ensure complete confidence in the structural relationship results, serious issues concerning the reliability and convergent validity of “Extreme Events,” “Radiation Conditions,” and “Wind and Pressure Conditions” constructs were addressed. This involved the removal of some variables from the Radiation, Extreme, and Wind and Pressure constructs.
The final Table 2 presents key criteria for evaluating the Internal Consistency Reliability and Convergent Validity of the measurement model for the six latent constructs. Internal Consistency Reliability was assessed using Cronbach’s Alpha, rho_A, and Composite Reliability, with a desirable value greater than 0.7 for all three.
- Cronbach’s Alpha values ranged from 0.776 (for Extreme Events) to 1 (for Radiation Conditions and Wind and Pressure Conditions), signifying that all constructs exhibit Cronbach’s Alpha values above 0.7, indicating appropriate to excellent internal consistency for their items. “Comfort Indices” (0.871) and “Thermal Conditions” (0.863) also show perfect internal consistency.
- rho_A values, ranging from 0.854 (for Extreme Events) to 1 (for Radiation Conditions and Wind & Pressure Conditions), further confirm their appropriate to excellent internal consistency.
- Composite Reliability (CR) values, ranging from 0.853 (for Humidity Conditions) to 1 (for Radiation Conditions and Wind and Pressure Conditions), likewise confirm that all constructs possess CR values greater than 0.7, indicating appropriate to excellent composite reliability. Thus, the composite reliability results for all constructs in the model demonstrate firm and acceptable internal consistency.
Table 2 also shows Convergent Validity among the model’s constructs, assessed using Average Variance Extracted (AVE), where a desirable value is ≥0.5. AVE values ranged from 0.547 (for Thermal Conditions) to 1.000 (for Radiation and Wind and Pressure Conditions). This indicates that all constructs have AVE values greater than 0.5, signifying appropriate to excellent convergent validity. This means each construct explains over 50% of the variance in its indicators. The “Comfort Indices” construct, with an AVE of 0.713, exhibits the highest convergent validity among multi-item constructs. Based on these findings, all multi-item constructs in this model demonstrate robust and statistically acceptable internal consistency reliability and convergent validity. These results confirm that the measurement instruments accurately and consistently measured the latent constructs.
Following the evaluation of the measurement model, the structural model was assessed based on the research hypotheses, examining path coefficients, their significance, and coefficient of determination (R2) values. A collinearity assessment using the Variance Inflation Factor (VIF) was conducted to ensure that independent (predictor) variables were not highly correlated, which could lead to unreliable path coefficient estimates. The collinearity analysis confirmed the absence of severe multicollinearity among the variables. The R2 value for “Comfort Indices” was 0.811. This signifies that 81.1% of the variance in “Comfort Indices” is explained by the five independent variables in the model: Extreme Events, Humidity Conditions, Radiation Conditions, Thermal Conditions, and Wind and Pressure Conditions. Based on Cohen’s criteria, an R2 of 0.811 indicates a “substantial” explanatory power. This means the model possesses a very high ability to account for the variations in “Climatic Comfort Indices,” thereby fully confirming the conceptual model and hypothesized relationships. The selected independent variables demonstrate strong explanatory power over climatic comfort, suggesting the model’s high capability for predicting and managing climatic comfort indices in real-world environmental conditions. An elevated R2 is highly desirable, indicating a structural model with strong explanatory power.
Furthermore, the f2 (f-squared) effect size was estimated. Results reveal that among the five independent variables, “Extreme Events” (with f2=0.811) and “Thermal Conditions” (with f2=0.578) exert substantial and dominant effects on “Comfort Indices.” In contrast, “Humidity Conditions” (f2=0.031), “Radiation Conditions” (f2=0.036), and “Wind and Pressure Conditions” (f2=0.034) all exhibit minor effects on “Comfort Indices.” This indicates that while all relationships were statistically significant, the primary contribution to explaining “Climatic Comfort Indices” largely stems from “Extreme Events” and “Thermal Conditions.”
Figure 2 illustrates the predictive relevance of the constructs. The model’s structure comprises six latent constructs and their corresponding observed indicators. The nature of the relationships specifies that “Thermal Conditions,” “Humidity Conditions,” and “Extreme Events” were modeled as formative constructs (meaning their indicators constitute the construct rather than reflecting it).
In contrast, “Comfort Indices,” and likely “Radiation Conditions” and “Wind and Pressure Conditions” (being single-item constructs), were modeled as reflective constructs. The reported R2 value for “Comfort Indices” (0.580) likely represents an initial or approximate R2, with the final and more reliable value being 0.811, derived from the R2 table.
Following the evaluation of the measurement model, the structural model was assessed based on the research hypotheses, examining path coefficients, their significance, and coefficient of determination (R2) values. A collinearity assessment using the Variance Inflation Factor (VIF) was conducted to ensure that independent (predictor) variables were not highly correlated, which could lead to unreliable path coefficient estimates. The collinearity analysis confirmed the absence of severe multicollinearity among the variables.
The R2 value for “Comfort Indices” was 0.811. This signifies that 81.1% of the variance in “Comfort Indices” is explained by the five independent variables in the model: Extreme Events, Humidity Conditions, Radiation Conditions, Thermal Conditions, and Wind and Pressure Conditions. Based on Cohen’s criteria, an R2 of 0.811 indicates a “Substantial” explanatory power. This means the model possesses a very high ability to account for the variations in “Climatic Comfort Indices,” thereby fully confirming the conceptual model and hypothesized relationships. The selected independent variables demonstrate strong explanatory power over climatic comfort, suggesting the model’s high capability for predicting and managing climatic comfort indices in real-world environmental conditions. An elevated R2 is highly desirable, indicating a structural model with strong explanatory power.
Furthermore, the f2 (f-squared) effect size was estimated. Results reveal that among the five independent variables, “Extreme Events” (with f2=0.811) and “Thermal Conditions” (with f2=0.578) exert substantial and dominant effects on “Comfort Indices.” In contrast, “Humidity Conditions” (f2=0.031), “Radiation Conditions” (f2=0.036), and “Wind and Pressure Conditions” (f2=0.034) all exhibit minor effects on “Comfort Indices.” This indicates that while all relationships were statistically significant, the primary contribution to explaining “Climatic Comfort Indices” largely stems from “Extreme Events” and “Thermal Conditions.”
Figure 2 illustrates the predictive relevance of the constructs. The model’s structure comprises six latent constructs and their corresponding observed indicators. The nature of the relationships specifies that “Thermal Conditions,” “Humidity Conditions,” and “Extreme Events” were modeled as formative constructs (meaning their indicators constitute the construct rather than reflecting it). In contrast, “Comfort Indices,” and likely “Radiation Conditions” and “Wind and Pressure Conditions” (being single-item constructs), were modeled as reflective constructs. The reported R2 value for “Comfort Indices” (0.580) likely represents an initial or approximate R2, with the final and more reliable value being 0.811, derived from the R2 table.
At this stage of the structural equation modeling analysis, we evaluated the predictive relevance (Q2) of the model. This assessment determines the model’s ability to predict out-of-sample data, effectively gauging whether the model performs well not just on existing data but also on new, unseen data. Table 3 presents the Q2 index results. The Q2 value for “Comfort Indices” was 0.620. This value is significantly significant, indicating that the model possesses extreme predictive power.
In other words, the model is not only capable of explaining the observed data but also demonstrates a high ability to predict out-of-sample data (i.e., data not used in the model’s construction) for “Climatic Comfort Indices.” Therefore, a positive and high Q2 value reinforces the model’s generalizability, suggesting that its findings are applicable and can predict “Climatic Comfort Indices” in similar situations (with new data). This outcome signifies the overall stability and validity of the model. Interpreting the Q2 values for each construct further elucidates how climatic comfort indices can be understood and evaluated from various construct perspectives. The SSO (Sum of Squares Total) of 110,995 represents the total variance (variation) in the observed data for the “Comfort Indices” construct that the model aims to explain. Conversely, the SSE (Sum of Squares Error) of 42,190.039 indicates the sum of squared prediction errors (unexplained variance) for “Comfort Indices.” Notably, “Comfort Indices” is the only endogenous (dependent) variable in the designed model for which the Q2 value holds interpretive significance. The Q2 value of 0.620 for “Comfort Indices” highlights the extreme predictive power of your model for this construct, significantly enhancing its credibility and generalizability in forecasting new data. In summary, this research utilized the Partial Least Squares Structural Equation Modeling (PLS-SEM) approach to investigate the relationships between climatic variables and climatic comfort indices in Iran. The comprehensive model evaluation proceeded in two main phases: the assessment of the measurement model and the assessment of the structural model.
4.3. Measurement Model Evaluation
This stage assessed the quality of the measurement instruments for the latent constructs (unobserved variables) regarding their reliability and convergent validity. The results are summarized in Table 1.
-
Internal Consistency Reliability:
- ○
- Cronbach’s Alpha: All multi-item constructs (Comfort Indices, Extreme Events, Humidity Conditions, Thermal Conditions) exhibited Cronbach’s Alpha values ranging from 0.776 (for Extreme Events) to 0.871 (for Comfort Indices). These values consistently exceeded the acceptable threshold of 0.70, indicating perfect internal consistency for the constructs.
- ○
- Composite Reliability (CR): CR values for the multi-item constructs varied between 0.853 (for Humidity Conditions) and 0.918 (for Comfort Indices). All these Figure were also above 0.70, confirming excellent composite reliability for all constructs.
- ○
- rho_A: The rho_A values for multi-item constructs ranged from 0.854 to 0.946, further substantiating the high reliability of the constructs.
- ○
- Note: For the “Radiation Conditions” and “Wind and Pressure Conditions” constructs, which are likely single-item, all reliability and validity criteria were reported as 1.000, reflecting their measurement type.
-
Convergent Validity:
- ○
- Average Variance Extracted (AVE): AVE values for the multi-item constructs ranged from 0.547 (for Thermal Conditions) to 0.713 (for Comfort Indices). All these values surpassed the 0.50 threshold. This outcome indicates desirable convergent validity, meaning each latent construct explains over 50% of the variance associated with its observed indicators.
Conclusion of Measurement Model Section: The findings confirm that the measurement instruments employed in this research possess sufficient quality and robustness regarding internal consistency reliability and convergent validity. These results provide a strong foundation for proceeding with the analysis and evaluation of relationships within the structural model.
4.4. Structural Model Evaluation
This stage involved testing the hypothesized relationships among the latent constructs.
-
Path Coefficients and Their Significance:
- ○
- The significance of relationships was determined using bootstrapping (5000 subsamples) at a 0.05 significance level. Results showed that all five hypothesized relationships leading to “Comfort Indices” reported P-values of 0.000 (i.e., P < 0.001). Additionally, the corresponding t-statistics (ranging from 19.369 to 156.118) were substantially larger than the 1.96 threshold. Furthermore, the 95% Bias Corrected and Accelerated (BCa) confidence intervals for none of the relationships included zero. These findings unequivocally confirm that all hypothesized relationships in the model are statistically significant at the 0.05 level.
-
Direction and Strength of Influence:
- ○
- “Extreme Events” → “Comfort Indices”: Path coefficient of -0.494 (strong negative influence).
- ○
- “Thermal Conditions” → “Comfort Indices”: Path coefficient of 0.426 (strong positive influence).
- ○
- “Humidity Conditions” → “Comfort Indices”: Path coefficient of -0.074 (weak negative influence).
- ○
- “Radiation Conditions” → “Comfort Indices”: Path coefficient of 0.060 (weak positive influence).
- ○
- “Wind and Pressure Conditions” → “Comfort Indices”: Path coefficient of 0.050 / 0.058 (weak positive influence).
Therefore, all examined climatic variables (extreme events, humidity, radiation, thermal, and wind/pressure conditions) significantly impact climatic comfort indices in Iran. Among these, “Extreme Events” and “Thermal Conditions” emerged as the strongest predictors of climatic comfort.
-
Coefficient of Determination (R2):
- ○
- The R2 value for the dependent construct “Comfort Indices” was reported as 0.811. This indicates that 81.1% of the variance in “Climatic Comfort Indices” is explained by the five independent variables within the model. This R2 value signifies a “Substantial” explanatory power for the model in accounting for climatic comfort.
-
Effect Size (f2):
- ○
- The effect size of each independent variable on “Comfort Indices” was determined:
- ■
- “Extreme Events” (f2=0.811) and “Thermal Conditions” (f2=0.578) showed very large effects (both >> 0.35).
- ■
- “Humidity Conditions” (f2=0.031), “Radiation Conditions” (f2=0.036), and “Wind and Pressure Conditions” (f2=0.034) exhibited small effects (all > 0.02).
- ○
- The effect size index highlights that while all factors had a significant impact, the primary contribution to explaining changes in climatic comfort came from “Extreme Events” and “Thermal Conditions.”
-
Predictive Relevance (Q2):
- ○
- The Q2 value for the “Comfort Indices” construct was calculated as 0.620. Since this value is significantly greater than zero (0), the current model demonstrates extreme predictive power for “Climatic Comfort Indices.” This means the model can effectively predict climatic comfort values in new, unseen data.
4.5. Structural Model Diagram
The structural model diagram visually presents the constructs, their indicators, and the hypothesized relationships among them. In this model, “Thermal Conditions,” “Humidity Conditions,” and “Extreme Events” were modeled as formative constructs, meaning their indicators collectively define the construct. Conversely, “Radiation Conditions” and “Wind and Pressure Conditions” are single-item constructs, likely modeled as reflective. The value of 0.580 for “the Comfort Index” probably represents an initial or approximate R2 for the model.
Overall Model Performance and Climatic Construct Contributions
The overall results from this study indicate that the proposed model for explaining and predicting climatic comfort indices in Iran possesses high statistical quality. The measurement instruments demonstrate strong reliability and convergent validity. All examined climatic variables significantly influence climatic comfort, with “Extreme Events” and “Thermal Conditions” identified as the most impactful factors. The model exhibits high explanatory power (R2=0.811) and predictive relevance (Q2=0.620).
This study specifically investigated the performance of climatic constructs in explaining climatic comfort. Figure 3 illustrates the performance of various constructs on climatic comfort. Based on the Latent Variable (LV) performance analysis, different climatic indicators play varying roles in explaining climatic comfort conditions. Among these, “Radiation Conditions” with a value of 69.49 showed the highest contribution to determining climatic comfort status, emerging as the most effective factor.
This suggests that solar radiation (including direct, net, or sunshine hours) plays a crucial role in human perception of heat or cold, especially in Iran’s arid and semi-arid regions. Following radiation, “Thermal Conditions” ranked second with a value of 54.43, demonstrating a significant impact on thermal comfort or discomfort sensation. These findings indicate that maximum, minimum, and mean temperatures (or ground surface temperature), alongside radiation, are key factors in climatic comfort analysis. “Humidity Conditions” (33.54) and “Wind and Pressure Conditions” (32.19) played a moderate to minor role in this analysis. This could be due to the relative stability of these factors in the study area or their lesser influence compared to radiation and thermal conditions. Finally, “Extreme Events” (30.77), such as heatwaves, cold spells, or heavy precipitation, showed the least impact on climatic comfort conditions. This finding might be attributed to the temporal and spatial dispersion of these phenomena or their minor contribution to long-term averages.
The MV (Medium Voltage) Performances index was examined, with Table 4 presenting its results. This table evaluates the performance of predictive models for climatic variables influencing climatic comfort in Iran using various statistical indicators. The results indicate that the Yearly Temperature Range, with a performance coefficient of 73.47%, showed the highest accuracy in the model.
This signifies the model’s acceptable ability to simulate annual temperature fluctuations. Daily Temperature Range , at 65.94%, and Shortwave Downward Irradiance , at 69.49%, were other variables the model predicted well, underscoring the importance of solar radiation and temperature fluctuations for thermal comfort. Conversely, variables related to precipitation and indices associated with severe summer heat like Warm Spell Duration Index (WSDI) and Tropical Nights showed poor performance, less than 20%. This highlights the models’ challenges in accurately predicting these sensitive climatic variables, crucial for human thermal comfort in Iran’s hot and dry climate. Temperature variables, such as Annual Mean Temperature (52.75%), Annual Maximum Temperature (51.62%), and Annual Minimum Temperature (39.70%), were assessed as having medium performance, indicating the model’s relative capability in simulating annual temperature trends. Similarly, human thermal comfort indices like UTCI and WBGT, with approximately 50% performance, demonstrate medium accuracy for the models in predicting human thermal comfort conditions. Humidity indices like Relative Humidity and Dew Point Temperature, performing at less than 40%, showed that these variables are more challenging for the models, and thus require more precise data and forecasting methods. Overall, the results suggest that climatic models perform relatively well in predicting temperature and radiation variables but require significant improvements in forecasting variables related to precipitation and severe thermal conditions. This underscores the importance of developing more comprehensive models and utilizing more accurate data for a better assessment of climatic comfort conditions and climate risk management in Iran.
This article provides a comprehensive examination of environmental performance and climatic comfort in Iran. By utilizing quantitative data from three sets—low-level performance indicators (LV Performances), medium-level climatic performance indicators (MV Performances), and an analysis of factor influence on comfort indices (Construct Total Effects for [Comfort Indices])—the study aims to present a holistic picture of Iran’s climatic conditions and the main factors influencing human comfort. The results clearly identify a prevalent hot and dry climate with intense radiation. MV Performance data unequivocally demonstrate a severely hot and arid climate. The Annual Mean Temperature is approximately 52.750 units, and the Daily Maximum Temperature = reaches 64.643 units, indicating intense heat. This heat is further confirmed by many warm days and nights: 51.814 Summer Days, 15.756 Tropical Nights, and 28.438 Yearly Warm Nights. The Warm Spell Duration Index (WSDI) of 15.144 also confirms the prolonged nature of unusually warm periods. In stark contrast to this heat, precipitation is a meager 1.013 units, signifying the region’s aridity. This dryness aligns with a Relative Humidity of (38.457) and a Dew Point Temperature of (33.322). Solar radiation, at 69.492 (Shortwave Downward radiance in MV Performance and Radiation Conditions in LV Performance), is also very high, a significantly contributing to the environment’s heat and aridity. Furthermore, high thermal stress and wide temperature fluctuations characterize the predominant climatic conditions in Iran, leading to significant human thermal stress. Composite climatic comfort indices such as Humidex (46.024), TDI (63.713), UTCI (50.232), and WBGT (51.086) all indicate unfavorable to hazardous conditions regarding thermal comfort. These Figure strongly suggest that prolonged outdoor activities may pose serious challenges. The overall Climatic Comfort Indices in LV Performances, at 55.638, are also assessed as moderate to low, confirming this level of discomfort. Additionally, Iran experiences substantial temperature fluctuations. The Yearly Temperature Range reaches 73.470 units, and the Daily Temperature Range reaches 65.940. These high Figure indicate severe temperature differences between the coldest and warmest seasons, as well as between day and night, which can impact building design requirements and energy management.
Extreme Events (coefficient of 0.348) and Thermal Conditions (coefficient of 0.319) have the most significant positive impact on climatic comfort indices. This could imply that effective management of these factors or the system’s response to them is vital in maintaining comfort levels. (It is important to note that in some models, a positive effect can mean improved comfort, while in other cases, the scale of the comfort index needs to be examined for accurate interpretation). In contrast, Humidity Conditions, with a coefficient of -0.057, is the only factor with a negative influence on climatic comfort, meaning increased humidity reduces comfort, which is a logical finding. Wind and Pressure and Radiation Conditions, with coefficients of 0.032 and 0.035, respectively, show the least impact on climatic comfort indices.
Therefore, a comprehensive analysis of the Figure reveals that Iran faces a severely hot and dry climate, intense solar radiation, and extensive temperature fluctuations. These conditions significantly and negatively impact human thermal comfort, leading to high thermal stress. While thermal conditions and managing extreme events play important roles in comfort, humidity, as the only factor with a negative impact, requires special attention in environmental design and management. These findings are highly significant for urban planning, sustainable building design, and climate adaptation strategies in the region.
4.6. Spatial Explanation of Climatic Comfort Indices
Figure 4 reveals that Iran experiences a broad spectrum of Humidex conditions. While the northern and northwestern parts of the country benefit from relatively more comfortable conditions in terms of climatic comfort, the southern regions, especially along the Persian Gulf and Oman Sea coasts, confront extremely severe heat and hazardous climatic comfort conditions due to the combination of high temperature and humidity, which can jeopardize human health.
The most favorable spatial distribution of climatic comfort, based on the Humidex index, is predominantly found in vast areas of northwest, west, and northeast Iran, particularly in mountainous and higher-altitude regions. In these areas, the air feels considerably more comfortable due to lower temperatures and/or reduced humidity, creating highly desirable conditions for climatic comfort. The second climatic comfort zone, according to the Humidex index, encompasses sections of northeast, central, and northwest Iran, indicating slight discomfort. In these areas, the air might feel somewhat warm and sticky, but it remains tolerable for most individuals. The third zone is distributed across extensive parts of central Iran and, to a lesser extent, the west, signifying conditions ranging from slight to considerable discomfort. Under these circumstances, many people feel uncomfortable, and strenuous physical activities could become somewhat challenging. The fourth zone includes the southern parts of Khuzestan, Fars, and Kerman provinces, along with significant portions of Hormozgan and Sistan and Baluchestan provinces (extending southward). Based on Humidex, these values (which may approximate 40 to 45) denote high discomfort. In these regions, the air feels exceptionally hot and humid, and it’s advisable to abstain from vigorous physical activities. The risk of heatstroke and heat exhaustion escalates. The fifth zone is primarily situated along the southern coasts of the Persian Gulf and the Oman Sea, notably encompassing the southern parts of Khuzestan, Bushehr, Hormozgan provinces, and various islands. According to Humidex, these areas exhibit the highest values (exceeding 45 on the Canadian scale), signifying dangerous conditions. In these locales, the sensation of heat is overwhelmingly intense and unbearable. The probability of heatstroke and other heat-related illnesses is exceptionally high.
Figure 5 illustrates the distribution of the Predicted Mean Vote (PMV) across Iran, revealing a broad spectrum of thermal comfort conditions. These range from the typically cooler and more comfortable mountainous and northwestern regions to the southern and coastal areas, which experience significant thermal discomfort due to intense heat and high humidity.
The first zone encompasses extensive parts of northwest, west, north, and, to some extent, central and eastern Iran. This includes provinces such as West Azerbaijan, East Azerbaijan, Kurdistan, Hamadan, Kermanshah, Lorestan, Chaharmahal and Bakhtiari, Kohgiluyeh and Boyer-Ahmad, along with portions of the Khorasan provinces and Alborz. In these regions, the PMV index is close to zero, indicating neutral to slightly cool thermal comfort conditions. In essence, most individuals in these areas feel comfortable or calm, which is generally considered desirable. The second zone comprises parts of central Iran, the northeast, and some areas of the southeast. Here, the PMV index is slightly above zero, suggesting marginally warm thermal comfort conditions. People might perceive the air as somewhat warm, but it remains within an acceptable comfort range. The third zone is predominantly located in southern and southeastern Iran, particularly along the coasts of the Persian Gulf and the Oman Sea (Khuzestan, Bushehr, Hormozgan provinces, and the southern parts of Fars, Kerman, and Sistan and Baluchestan). In these areas, the PMV index trends towards high positive values (warm to very warm). This signifies severe thermal discomfort due to heat. Individuals in these regions experience considerable heat and discomfort and may necessitate active cooling measures, such as air conditioning. Strenuous physical activities are challenging and perilous under these conditions.
Figure 6 depicts the distribution of “Warm Days” or “Summer Days” across various regions of Iran. The term “warm day” or “summer day” typically refers to the annual number of days when the daily maximum temperature exceeds 25 degrees Celsius. Based on this index, Iran is delineated into several distinct regions. The first zone is primarily distributed across northwest, west, north, and northeast Iran, notably in high-altitude and mountainous areas (e.g., Azerbaijan provinces, Kurdistan, Alborz, Central Zagros, and North Khorasan). These regions experience the fewest summer days in Iran. This implies that air temperatures in these areas cross the defined threshold for a “warm day” for a shorter duration. These regions possess more temperate to colder climates and consequently have shorter or cooler summers. Negative values, if present, would indicate a standardized or normalized index representing a mean or deviation from the mean.
The second zone encompasses substantial portions of central Iran, the east, and select areas of the west. These regions experience a moderate number of summer days. Summers in these areas are warmer than in the first zone, but the intensity and duration of the heat are not as pronounced as in the southern regions. The third zone extends throughout southwest, south, and southeast Iran, including Khuzestan, Bushehr, Hormozgan, Sistan and Baluchestan provinces, and parts of Fars and Kerman. These regions experience the highest number of summer days. In these locales, air temperatures exceed the “warm day” threshold for a significant portion of the year, indicative of very long, hot, and intense summers. These areas are renowned for their oppressive heat. Figure 6 proves highly valuable for comprehending Iran’s climatic patterns, informing agricultural planning, water resource management, urban planning, public health initiatives (particularly concerning heat-related illnesses), and the tourism industry. For instance, areas with more summer days necessitate specialized planning to mitigate severe heat and ensure adequate cooling infrastructure.
Figure 7 illustrates the “Warm Nights” index for various regions of Iran. This index represents the percentage of days when the minimum nocturnal temperature exceeds the 90th percentile of the corresponding calendar day’s minimum temperature within a 5-day moving window during the base period. “Warm nights” can significantly impact human health, agriculture, and energy consumption because the body lacks sufficient opportunity to cool down, leading to an increased demand for nocturnal air conditioning. The diversity of warm nights across Iran underscores the variability of this index. The first zone, based on this index, encompasses vast areas of northwest, west, north, northeast, and, to some extent, central Iran, particularly in elevated and mountainous regions (e.g., the Azerbaijan provinces, Kurdistan, Alborz, Central Zagros, Khorasan provinces, and Semnan). These regions experience the fewest warm nights, meaning that nocturnal temperatures rarely, if ever, cross the defined threshold for a “warm night.” These areas are characterized by cooler and more comfortable nights. The second zone includes parts of central Iran and segments of the country’s eastern and western regions, experiencing a moderate number of warm nights. Nighttime temperatures in these areas may be slightly warmer than in the first zone, but are generally tolerable, and the need for continuous air conditioning may be less pronounced. The third zone is predominantly located in southwest, south, and southeast Iran, especially along the coasts of the Persian Gulf and the Oman Sea (Khuzestan, Bushehr, Hormozgan provinces, and the southern parts of Fars, Kerman, and Sistan and Baluchestan). These regions experience the highest number of warm nights. In these areas, nocturnal temperatures remain elevated for a significant portion of the year, indicative of exceptionally warm and oppressive nights.
These conditions can lead to sleep disturbances, an elevated risk of heat-related illnesses (especially for vulnerable populations), and a substantial increase in energy consumption for cooling. A comparison of this index with others reveals a strong resemblance to the Humidex and PMV maps. The overall heat distribution pattern in this map (warmer in the south and cooler in the north and west) is highly consistent with the previously interpreted Humidex, PMV, and “Summer Days” maps. This underscores the reality that southern Iran generally experiences significantly warmer and more uncomfortable climatic conditions, regardless of the time of day or the presence of humidity. Furthermore, the emphasis on the minimum night temperature is crucial. Even if daytime temperatures in a region are high, the body can recover if nights cool down. However, in the regions marked in red, the absence of nocturnal cooling significantly exacerbates thermal stress. It is important to note that the “Warm Nights” index is particularly vital for understanding the impact of climate change on human health and energy consumption. An increasing number of warm nights can directly affect public health and impose a greater financial burden on communities for providing cooling energy.
Figure 8 illustrates the Universal Thermal Climate Index (UTCI), one of the most advanced and comprehensive indices for assessing thermal comfort. It expresses human thermal sensation based on a reference temperature (typically in degrees Celsius). This index employs a multi-node model of human heat transfer, considering various environmental factors such as air temperature, radiant temperature, humidity, and wind speed, and subsequently models their physiological effects on the human body. The UTCI scale generally includes standard classifications for different levels of thermal stress:
- Above 46°C: Extreme heat stress
- 38 to 46°C: Very strong heat stress
- 32 to 38°C: Strong heat stress
- 26 to 32°C: Moderate heat stress
- 18 to 26°C: No thermal stress
- 10 to 18°C: Slight cold stress
- 0 to 10°C: Moderate cold stress
- Below 0°C: Strong to extreme cold stress
Based on Figure 8, an apparent diversity in comfort zones is evident across Iran. The first zone encompasses northwest, west, north (Caspian Sea coastal areas), the northeast, and the high-altitude central regions of Iran. In these areas, the UTCI shows lower values. This indicates that during this period (likely summer, given the high values observed in the south), people experience thermal comfort or feel cool, with minimal to no heat stress. These regions benefit from milder climatic conditions due to their elevation, local winds, and/or lower humidity.
The second zone in Iran comprises extensive areas of central, eastern, and, to some extent, western Iran. In these regions, the UTCI indicates moderate to intense heat stress. Residents in these areas experience warmth and discomfort, necessitating active cooling measures.
The third zone includes southern and southeastern Iran, particularly the coasts of the Persian Gulf and the Oman Sea (Khuzestan, Bushehr, Hormozgan provinces, and southern Sistan and Baluchestan). These regions exhibit the highest UTCI values, signifying severe heat stress. Under these conditions, the risk of heatstroke, heat exhaustion, and other heat-related illnesses is exceptionally high. Outdoor physical activities must be severely restricted. These areas endure extremely challenging climatic conditions due to elevated temperatures, high humidity, and intense solar radiation.
Figure 9 illustrates the Wet-Bulb Globe Temperature (WBGT) index for various regions across Iran. WBGT is a comprehensive index for assessing environmental heat stress, particularly for evaluating the risk of heatstroke during outdoor physical activities. This index accounts for the primary environmental factors influencing the human body’s thermal balance. In Iran, this index also exhibits distinct patterns of comfort variation. The first zone encompasses the northwest, west, north (Caspian Sea coastal areas), northeast, and the high-altitude central regions of Iran. In these areas, WBGT values are lower. This signifies that during this period of the year (likely the warmer seasons, given the high values in the south), the risk of heat stress from physical exertion is very low or negligible. These regions benefit from milder climatic conditions due to their elevation, local winds, and/or reduced humidity. The second zone covers extensive areas of central, eastern, and, to some extent, western Iran. In these regions, WBGT indicates a moderate risk of heat stress. Strenuous physical activity under these conditions may necessitate caution and regular breaks.
The third zone includes southern and southeastern Iran, particularly the coasts of the Persian Gulf and the Oman Sea (Khuzestan, Bushehr, Hormozgan provinces, and southern Sistan and Baluchestan). These parts of Iran exhibit the highest WBGT values, indicating a high risk of heat stress. Under these conditions, engaging in intense outdoor physical activities can be exceptionally dangerous, potentially leading to heatstroke and other thermal disorders. Severe limitations are imposed on outdoor activities, and ample hydration, shade, and rest are essential.
The distribution pattern of WBGT on this map bears a strong resemblance to the Humidex and UTCI maps. This high correlation is logical, as all three indices assess heat sensation and thermal stress and are influenced by similar climatic factors, especially temperature and humidity. Southern Iran consistently displays the highest values across all these indices, signifying exceedingly challenging thermal conditions in these areas. Therefore, this index demonstrates that southern Iran experiences very hot and humid climatic conditions that severely elevate the risk of heat stress. In contrast, the northern and higher-altitude regions of the country enjoy more favorable conditions.
Figure 10 presents the Warm Spell Duration Index (WSDI) for various regions in Iran. WSDI is a climatic index that quantifies the duration of warm spells, defined as periods of unusually warm weather.
This index typically considers, on an annual basis, the number of days that are part of a continuous period (spell) of at least six consecutive days where the daily maximum temperature exceeds the 90th percentile of the corresponding calendar day’s maximum temperature (calculated using a 5-day moving window) during the base period. Specifically, for a period to qualify as a “warm spell,” it must comprise a minimum specified number of consecutive warm days (e.g., 5 or 6 days). Furthermore, the temperature on each day within this period must surpass a particular thermal threshold, typically the 90th or 95th percentile of the daily temperature for the identical calendar day in a designated reference period. This index, similar to others, reveals distinct patterns of comfort variation across Iran. The first zone encompasses extensive areas of northwest, west, north, northeast, central, and eastern Iran. In these regions, WSDI values are notably low. This indicates that these areas experience the fewest warm spells, or warm spells with very short durations and lower intensity. These regions generally possess more temperate to colder climates and are less impacted by prolonged periods of intense heat. Values close to zero or negative may suggest the absence of warm spells or indicate a standardized index. The second zone forms a narrow strip along southwest Iran, primarily covering Ilam, Khuzestan, and Bushehr provinces, and to some extent, the southern part of Fars province. In these areas, WSDI exhibits moderate to high values. This signifies that these regions experience warm spells of considerable duration.
The third zone is a confined and concentrated area in the southwest of Khuzestan province (likely including locales such as Abadan and Ahvaz) and portions of Bushehr province. These areas register the highest WSDI values, indicating the most prolonged and/or most intense warm spells in Iran. In these regions, the populace faces unusually warm temperatures for significantly extended durations, which can have severe ramifications for public health, agriculture, and infrastructure. A comparison of this index with other indicators reveals that while indices such as Humidex and UTCI primarily focus on the intensity of heat or the sensation of warmth, WSDI emphasizes explicitly the duration of heat persistence in terms of warm spells. This is a crucial index for comprehending climatic challenges, as prolonged periods of heat, even if the daily intensity is not exceptionally high, can exert greater strain on both natural and human systems. Thus, the focus of WSDI is on the continuity of heat, rather than merely instantaneous intensity. Furthermore, consistent with other indices, the southern regions of Iran (particularly the southwest) are most significantly affected by extended warm periods. Consequently, this index is highly pertinent for long-term climatic planning, managing heat-related crises, and conducting climate change studies.
Figure 11 illustrates the Temperature Diversity Index (TDI). This index quantifies the variability or range of temperature fluctuations, typically between the daily maximum and minimum temperatures.
It reveals the difference between the warmest and coldest moments within a day or a specific period. A high TDI signifies substantial diurnal temperature oscillations (cooler nights and warmer days), whereas a low TDI indicates reduced fluctuations and greater thermal uniformity. This index also exhibits a distinct spatial pattern across Iran. The first zone encompasses a narrow strip along the coasts of the Persian Gulf and the Oman Sea in the south, as well as parts of the north (Caspian Sea coastal areas) and northwest Iran. In these regions, the TDI shows low values, indicating that these areas experience less daily temperature variability. In other words, the difference between the daily maximum and minimum temperatures is less pronounced. In coastal areas, this thermal uniformity is typically due to the moderating influence of humidity and the thermal mass of seawater, which helps maintain warmer night temperatures and prevents sharp drops. In the northern regions, high humidity and vegetation cover may also contribute to this uniformity. The second zone covers extensive areas of central, eastern, western, and northeast Iran. In these regions, the TDI presents moderate values, signifying that these areas experience moderate diurnal temperature variability. Days are warm, and nights become cooler, but this difference is not as extreme as observed in desert regions. The third zone is predominantly located in the deserts and arid regions of central Iran (such as Dasht-e Kavir and Dasht-e Lut), along with parts of the country’s northeast. These regions exhibit the highest TDI values, indicating the most significant diurnal temperature diversity. In these areas, days can be exceptionally hot and scorching. However, nights, due to the absence of humidity and cloud cover, experience rapid heat radiation into space, causing temperatures to drop sharply, resulting in relatively cool nights. This stark difference between day and night temperatures is a hallmark of desert climates.
When comparing the TDI with other indices, it is evident that while most previous indices focused on the “amount of heat” or “sensation of heat,” the TDI specifically highlights temperature oscillation and variations over 24 hours. Furthermore, the impact of humidity and aridity is crucial for this index. It demonstrates the influence of humidity (in coastal areas) and aridity (in desert regions) on the temperature range. Humid regions exhibit less fluctuation, whereas arid regions display greater fluctuations. This index is highly valuable for building design (insulation and heating/cooling systems), agriculture (selecting crops resilient to temperature fluctuations), and climatic studies (understanding the thermal regimes of different regions). Therefore, the TDI illustrates that the central desert regions of Iran experience the most significant daily temperature fluctuations. At the same time, coastal areas (particularly in the south) and parts of the northwest undergo less variability.
4.7. Comparing the Results of RF and SEM_PLS Methods
In this study, random forest methods, structural equation modeling (SEM_PLS) ,and spatial methods were employed in combination with spatial modeling of variables. Random Forest findings clearly show that the Daily Maximum Temperature is the most significant factor in determining the Humidex index in the designed model. This means that changes in daily maximum temperature have the most significant impact on heat and humidity. Additionally, variables linked to sustained warm weather such as Summer Days, Yearly Warm Nights, Warm Days, and Tropical Nights are also highly important. These variables suggest that not only instantaneous temperature but also the duration of warm periods and lack of nighttime cooling play a crucial role in climate comfort, especially concerning Humidex. Interestingly, Relative Humidity, despite being part of the Humidex formula, showed a relatively low importance (9.89139E-06) compared to temperature variables. This could be because temperature variations in Iran’s climate might have a more dominant effect on Humidex, is strongly correlated with temperature variables, and its effect is already captured through them. It is also possible that in some climates, temperature itself is the primary determinant, and humidity acts merely as a “regulator.” Furthermore, variables related to wind, precipitation, cloud cover, and solar radiation had negligible importance for Humidex in this model. This does not necessarily mean that these factors have no impact on thermal comfort, but in our model for predicting Humidex, their influence was significantly less compared to temperature factors.
Comparing the results from these two methods reveals a convergence in identifying the primary factors. Both methods unequivocally highlight the dominant role of thermal factors (temperature and related characteristics) in explaining climate comfort. Random Forest: The variable importance results from Random Forest indicated that Daily Maximum Temperature was the most significant individual variable impacting Humidex. Furthermore, variables like Summer Days, Yearly Warm Nights, and Warm Days, all directly linked to thermal conditions and prolonged heat, were of very high importance. PLS-SEM: In the PLS-SEM structural model, the “Thermal Conditions” latent construct showed the most substantial positive and direct influence on the composite climate comfort indices, with the highest path coefficient (0.515) and the second-largest effect size (f²=0.578). This convergence in results validates the strong role of temperature in Iran’s climate comfort. Another shared strength in both analyses is the emphasis on the importance of extreme climatic events. Although specific “extreme event” variables (like Cold Days and WSDI) had relatively less importance in the Random Forest analysis, variables such as Tropical Nights and Yearly Warm Nights, which can be considered indicators of extreme heat, showed significant importance. The “Extreme Events” latent construct in PLS-SEM, with a path coefficient of 0.381 and the highest effect size (f²=0.811), was the second most important factor. This indicates that at a construct level, extreme climatic events play a very prominent role in overall comfort. The substantial effect of this construct in PLS-SEM underscores the need for particular attention to extreme phenomena in climate comfort management.
The comparison between the two methods also reveals some differences. Relative Humidity had a relatively low importance (9.89139E-06) for Humidex in the Random Forest analysis (which is itself a humidity index). However, in the PLS-SEM model, the “Humidity Conditions” construct showed a negative and weak effect (path coefficient = -0.074) on overall comfort. This difference might stem from Random Forest assessing the direct importance of variables on a specific index (Humidex). At the same time, PLS-SEM measures relationships between latent constructs (measured by several observed variables) and a set of comfort indices. It is probable that in Random Forest, the effect of humidity was covered mainly by its correlation with temperature variables. Regarding the role of wind and radiation, both methods showed that wind and pressure conditions and radiation conditions have less importance and impact on comfort compared to thermal factors and extreme events. In Random Forest, radiation and wind variables had very low importance. In PLS-SEM, the constructs related to wind and radiation also showed positive but weak effects (path coefficients 0.043 and 0.072, respectively). This could mean that in Iran’s climate, compared to the intensity of heat and extreme events, the role of wind and direct radiation on overall thermal comfort is less, or these factors act more as secondary modifiers. Therefore, the convergence of results in identifying thermal conditions and extreme events as the most crucial factors affecting climate comfort strongly reinforces the validity of this study’s findings. This indicates that despite differences in algorithms and analytical approaches, both methods reached a common key conclusion.
To comprehensively understand the factors influencing the Predicted Mean Vote (PMV) comfort index, we compared the results from two analytical approaches. Variable importance analysis using the Random Forest method revealed that wind speed, with the highest importance score (0.000112893), was the most significant direct and individual factor in explaining variations in the PMV index. This finding is entirely consistent with the nature of PMV, which considers the critical role of air velocity in body heat exchange and comfort assessment. Following that, Dew Point Temperature (with an importance of 2.11633E-05) and Daily Maximum Temperature (with an importance of 4.40756E-06) were also important factors, ranking subsequently. These results emphasize that, at the level of observed variables, managing airflow and controlling humidity play a prominent role in directly influencing PMV. In the PLS-SEM model, the PMV index functions as one of the components forming the latent construct “Comfort Indices.” This approach evaluated more complex relationships between latent environmental/climatic constructs and the set of comfort indices (of which PMV is a part). PLS-SEM results indicated that Thermal Conditions (with a path coefficient of 0.515) and Extreme Climatic Events (with a path coefficient of 0.381) had the strongest and most significant positive effects on the overall “Comfort Indices” construct (with R²=0.811 and Q²=0.620). Although the direct effects of the Wind and Pressure Conditions construct (with a path coefficient of 0.043) and Humidity Conditions (with a path coefficient of -0.074) were weaker, they were still considered significant at the construct level. While Random Forest emphasizes explicitly the high importance of wind speed and dew point as direct influencing factors on PMV, the PLS-SEM model highlights the key role of thermal conditions and extreme climatic events in determining overall comfort (to which PMV also contributes). This difference in emphasis stems from the different nature and level of analysis of each method: Random Forest focuses on non-linear relationships and the predictive importance of individual variables, while PLS-SEM addresses structural relationships between latent constructs and the comprehensiveness of their explanation. Both sets of results contribute to climate planning and environmental design for improving PMV and thermal comfort in Iran.
The results of the variable importance analysis using the Random Forest method provided significant insights for the TDI comfort index. In this comfort index, albedo, with the highest importance score (5.19389E-06), was the most significant individual factor in explaining variations in the TDI index. This finding emphasizes that the amount of solar radiation reflected from surfaces plays a central role in determining outdoor thermal comfort. Results point to the importance of selecting materials and surface coverings with high reflectivity in urban design and climate architecture to reduce heat absorption and improve outdoor comfort. Daily maximum temperature, with an importance of 1.86288E-05, was the second most important factor affecting TDI. This indicates the direct contribution of air temperature to outdoor comfort. Other variables such as Dew Point Temperature (5.91698E-06) and Relative Humidity (4.12713E-06) also showed significant importance in explaining TDI, confirming the role of humidity in outdoor comfort.
In the PLS-SEM model, the TDI index served as one of the five observed variables (along with Humidex, PMV, UTCI, and WBGT) measuring the latent construct “Comfort Indices.” Although PLS-SEM does not directly calculate the “importance of individual variables” on TDI, it specifies the contribution of latent constructs to the overall “Comfort Indices” construct. Thermal Conditions (with a path coefficient of 0.515) and Extreme Climatic Events (with a path coefficient of 0.381) showed the strongest and most significant positive effects on the overall “Comfort Indices” construct (with R²=0.811 and Q²=0.620). This emphasis on temperature and extreme phenomena suggests that these factors, at a macro level, influence all aspects of comfort (including what TDI measures). Radiation Conditions (with a path coefficient of 0.072) also had a positive but weak effect on overall comfort. This effect, though weak at the construct level, aligns with the high importance of albedo (as a representative of radiation conditions) in the Random Forest analysis for TDI. Humidity and Wind and Pressure Conditions also showed weaker effects on overall comfort.
Results of these two analytical approaches regarding TDI demonstrated that albedo is the most important factor in Random Forest for TDI, and provides an efficient and operational insight for designing outdoor environments. This indicates that in managing outdoor thermal comfort, attention to the reflective properties of surfaces (which directly affect the body’s received radiation) is more critical than many other factors. The positive effect of the “Radiation Conditions” construct in PLS-SEM also confirms this importance at the construct level. Daily Maximum Temperature for TDI in Random Forest and the dominant role of “Thermal Conditions” in PLS-SEM, emphasize that air temperature remains a fundamental component in determining outdoor comfort.
Accordingly, while Random Forest allows us to highlight concrete observed variables like Albedo for specialized indices like TDI, PLS-SEM provides a more comprehensive framework for understanding how different groups of climatic factors (in the form of latent constructs) relate to overall comfort. This combination of methods offers both operational insights at the micro level (e.g., material selection) and strategic understanding at the macro level (e.g., overall impact of climate change) for managing climate comfort.
This study examined the factors influencing the Universal Thermal Climate Index (UTCI). We compared the results from two distinct analytical approaches. The variable importance analysis using the Random Forest method, specifically for the UTCI index, provided significant insights. Warm days, with an importance score of 5.27895E-05, emerged as the most important individual variable. This highlights the crucial role of sustained warm conditions in influencing the perceived thermal environment, as measured by UTCI. Daily Maximum Temperature also showed high importance (4.12003E-05), emphasizing the direct impact of daily peak temperatures on UTCI. Albedo (1.50707E-05) and Tropical Nights (1.46984E-05) were also found to be highly influential factors. The prominence of albedo indicates the significant role of surface reflectivity and radiation balance in shaping outdoor thermal comfort, which is central to UTCI calculation. Tropical Nights also points to the continuous thermal stress resulting from warm nighttime conditions. Other notable variables included Annual Temperature (2.52776E-05) and Cold Days (1.46237E-05), indicating the broader impact of temperature-related extreme events on UTCI.
In the PLS-SEM model, UTCI, alongside Humidex, PMV, TDI, and WBGT, functioned as an observed variable in measuring the latent construct “Comfort Indices.” While PLS-SEM does not directly measure the importance of individual variables on UTCI alone, it clarifies the broader structural relationships between latent environmental/climatic constructs and overall thermal comfort. The PLS-SEM results showed that Thermal Conditions (path coefficient: 0.515) and Extreme Climatic Events (path coefficient: 0.381) had the strongest and most significant positive effects on the overall “Comfort Index” construct. These results strongly align with the Random Forest findings for UTCI, where Warm Days and Daily Maximum Temperature (components of “Thermal Conditions”) and Tropical Nights (an “Extreme Event”) were found to be highly influential. This alignment reinforces the undeniable importance of ambient temperature and the occurrence of extreme temperatures for a comprehensive thermal comfort assessment, including UTCI. Radiation Conditions (path coefficient: 0.072) also showed a positive, albeit weaker, effect on overall comfort. This finding is consistent with the high importance of albedo for UTCI in the Random Forest analysis, confirming the role of radiation balance in outdoor thermal comfort. Wind and Pressure Conditions (path coefficient: 0.043) and Humidity Conditions (path coefficient: -0.074) had relatively weaker effects on the overall “Comfort Index” construct, although they were statistically significant.
The comparison of methods provides a rich and multifaceted understanding of the factors governing UTCI and broader thermal comfort. Both methods emphatically emphasize the fundamental importance of thermal conditions and extreme climatic events. Random Forest identified specific temperature-related variables (Warm Days, Daily Maximum Temperature) as crucial for UTCI, while PLS-SEM confirmed the overarching impact of the relevant latent constructs (“Thermal Conditions,” “Extreme Events”). This re-emphasizes that managing ambient temperature and mitigating the effects of extreme heat events are vital for improving UTCI and overall comfort. Furthermore, the high importance of albedo for UTCI in the Random Forest analysis provides a clear and actionable insight for urban planning and design. This detail, though not directly expressed as a path coefficient in PLS-SEM, is indirectly supported by the positive effect of the “Radiation Conditions” construct. This suggests that strategies related to selecting surface materials to optimize the radiation balance are highly relevant for enhancing outdoor comfort, especially as measured by UTCI. The Random Forest method excels at identifying the direct and non-linear predictive power of individual variables on a specific comfort index like UTCI. PLS-SEM provides a robust framework for understanding the underlying structural relationships between broader climatic constructs and overall comfort, demonstrating the model’s high explanatory (R²=0.811) and predictive (Q²=0.620) capabilities. In conclusion, the combined insights from the Random Forest and PLS-SEM methods consistently identify thermal conditions, extreme events, and radiation balance as the primary drivers of UTCI and overall thermal comfort in the study area.
To identify the factors influencing the Wet-Bulb Globe Temperature (WBGT) index, we compared the results from two analytical approaches. The variable importance analysis using the Random Forest method, specifically for the WBGT index, showed that Summer Days, with the highest importance score (0.000227052), were the most significant individual factor in explaining variations in the WBGT index. This finding emphasizes the critical role of sustained warm conditions in creating heat stress, which WBGT measures. Daily maximum temperature, with an importance of 0.000199189, was the second most important factor affecting WBGT. This indicates a direct contribution of air temperature to heat stress. Annual Temperature (8.86307E-05) and Yearly Warm Nights (7.688E-05) were also important factors, emphasizing WBGT’s connection to general and persistent temperature conditions. Radiation-related variables such as Shortwave Downward Irradiance A (1.43363E-07) and Albedo (1.15884E-07) were also among the influential factors, indicating the importance of solar radiation in WBGT calculation. These findings suggest that WBGT is strongly influenced by high temperatures and sustained heat, which aligns with its nature in assessing heat stress and underscores the need to manage extreme thermal conditions to prevent health risks.
In the PLS-SEM model, the WBGT index functioned as one of the five observed variables (along with Humidex, PMV, TDI, and UTCI) measuring the latent construct “Comfort Indices.” The PLS-SEM results showed that: Thermal Conditions (with a path coefficient of 0.515) and Extreme Climatic Events (with a path coefficient of 0.381) had the strongest and most significant positive effects on the overall “Comfort Indices” construct (with R²=0.811 and Q²=0.620). This emphasis on temperature and extreme phenomena aligns with the high importance of Summer Days and Daily Maximum Temperature for WBGT in the Random Forest analysis, emphasizing the dominant role of these factors in heat stress. Radiation Conditions (with a path coefficient of 0.072) also had a positive, albeit weak, effect on overall comfort. This effect, though weak at the construct level, aligns with the presence of radiation variables among the important WBGT factors in Random Forest. Humidity Conditions, Wind and Pressure Conditions also showed weaker effects on overall comfort, but were statistically significant.
Therefore, comparing the results of these two analytical approaches regarding WBGT shows that both methods unequivocally emphasize the central role of high temperatures and sustained warm conditions (such as Summer Days and Daily Maximum Temperature) in determining WBGT and heat stress. Additionally, although radiation variables had lower absolute importance compared to temperature and warm days in Random Forest, their presence among the important WBGT factors, and the positive effect of the “Radiation Conditions” construct in PLS-SEM, indicate the importance of managing solar radiation in environments where heat stress is assessed through WBGT. Furthermore, Random Forest, by identifying the importance of specific variables (like Summer Days, and Daily Maximum Temperature) on WBGT, provides practical insights for predicting and managing heat stress conditions at an operational level. In contrast, PLS-SEM, by modeling latent constructs and their structural relationships, offers a general and strategic understanding of how groups of climatic factors influence comfort (including WBGT) at a macro level. This combination of methods enables both direct solutions for reducing heat stress and a deeper understanding of the underlying factors influencing it. This analysis suggests that to reduce heat stress and improve safety and comfort in work and sports environments in Iran, focusing on managing high temperatures, especially during warm seasons and warm nights, as well as controlling solar radiation, are primary priorities.
4.8. Spatial Distribution of Indices Based on Random Forest Analysis
Figure 12 illustrates the predicted TDI distribution in Iran, revealing three distinct comfort zones. Regions with negative TDI values generally suggest cooler, more comfortable conditions, requiring minimal “therapeutic dose” (physiological adjustment or external intervention) to maintain comfort. Areas with TDI values roughly between 0 and 0.4 indicate neutral to mildly warm conditions, where deviations from ideal comfort are minimal. The third zone, of 0.4 to 0.8, signifies increasingly hot and uncomfortable conditions, demanding a higher “therapeutic dose” to mitigate heat stress. Iran’s northern and northwestern regions (along the Caspian Sea and mountainous areas) exhibit lower TDI values, indicative of cooler, more agreeable thermal conditions consistent with their higher elevations and the Caspian Sea’s influence. These areas require less physiological effort to maintain comfort. Conversely, the central and eastern Iranian plateau shows relatively high to elevated TDI values, reflecting increasingly warm-to-hot conditions and a greater need for adaptive responses. This pattern is typical for Iran’s arid and semi-arid interior. The southern coastal zones (Persian Gulf and Gulf of Oman) display the highest TDI values, pointing to extreme heat stress and a substantial “therapeutic dose” necessary for human comfort, aligning with the well-known hot and humid climate of these desert coastal areas. Figure 12 effectively visualizes the predicted thermal stress levels (or “therapeutic dose” needed for comfort) across Iran.
This underscores that while the northern and northwestern parts generally offer more favorable thermal environments, the vast central, eastern, and primarily southern coastal regions face significant heat stress, necessitating increased physiological adaptation or proactive measures. These observed patterns align consistently with Iran’s recognized climatic zones.
Figure 13 depicts the predicted Humidex distribution across Iran. Areas with negative index values suggest severely cold and uncomfortable conditions, while positive values indicate extremely hot and humid (highly uncomfortable) environments. Northern and northwestern regions, particularly along the Caspian Sea and mountainous areas, show more extraordinary or even cold sensations. Central Iran experiences neutral to slightly warm and humid conditions.
The southern regions, including the Persian Gulf and Sea of Oman coasts, exhibit the highest levels of heat- and humidity-induced discomfort, signifying intensely hot and humid conditions. Figure 14 displays the predicted WBGT across Iran. WBGT serves as a key metric for assessing heat stress, particularly in environments with high physical activity and direct solar radiation. The results indicate that northern and northwestern Iran experience the least heat stress (incredible to moderate), central regions face moderate heat stress (warm), and the south and southeast show the highest and most severe heat stress (extremely hot and hazardous). Consequently, heat stress in Iran generally escalates from north to south and southeast, with the most severe conditions concentrated in the southern coastal and desert areas.
Figure 15 illustrates the predicted UTCI distribution in Iran. This map reveals three distinct comfort zones based on the Random Forest methodology.
Negative values are observed in northern and northwestern Iran (especially along the Caspian Sea and western mountains), signifying cold to cool thermal conditions, typically categorized as “cold stress” or “cool” by UTCI. The second zone encompasses vast parts of central and eastern Iran, representing neutral to warm thermal conditions where relative comfort prevails, or a slight sensation of warmth is experienced. The third zone, found in southern regions, particularly along the Persian Gulf and Sea of Oman coasts, displays high to very high UTCI values (warm to extremely hot), leading to severe discomfort. Thus, this index effectively highlights stark differences in predicted thermal comfort across Iran, with more incredible experiences in the northern and mountainous areas, contrasted by severe heat stress in the tropical and southern coastal regions. Figure 16 showcases the predicted PMV distribution, dividing Iran into four distinguishable comfort zones. A region exhibiting negative index values is identified as a cool comfort zone. The second zone, extending up to a coefficient of one, represents a neutral to slightly warm thermal comfort zone (ideal).
The third zone, with a coefficient between one and three, is designated as a warm comfort zone. Finally, areas with a coefficient greater than three are categorized as extremely hot and uncomfortable zones. Based on this, northern and northwestern Iran (along the Caspian Sea and mountainous areas) generally demonstrate cooler or more comfortable thermal conditions, likely due to higher elevations and the Caspian Sea’s influence. Central and eastern Iran show hot to very hot thermal conditions, typical for arid and semi-arid regions. The southern coastal areas (Persian Gulf and Sea of Oman) consistently exhibit extremely hot and uncomfortable conditions, as expected, given the high temperatures and humidity prevalent in these desert coastal areas. Cities like Bushehr fall within this high-discomfort zone. The southern coastal regions are identified as significant hotspots for thermal discomfort, with predicted PMV values frequently exceeding +3. Some pockets in the central and eastern deserts also display high PMV values, reflecting intense heat.
4.9. Comparative Spatial Analysis of Methodologies
The Random Forest application involved predicting and mapping the detailed spatial distribution of climatic comfort indices (PMV, Humidex, TDI, UTCI, and WBGT) across Iran. This method enabled the identification of the relative importance of individual environmental variables (such as temperature, humidity, wind speed, radiation, and albedo) in explaining each comfort index. The findings allowed for precise mapping of comfort/discomfort spatial patterns and the detection of “hot spots” or “cold spots” with high granularity across Iran’s diverse geography. This approach offers operational and localized insights for climate planning. In this study, PLS-SEM was employed to examine the causal and structural relationships among latent climatic constructs (e.g., “thermal conditions,” “extreme climatic events,” “humidity conditions,” “radiation and wind conditions”) and their impact on overall climatic comfort. This method aided in understanding the underlying mechanisms through which climatic factors influence comfort within a comprehensive theoretical framework, allowing for the assessment of the overall importance of these broader constructs at a larger scale.
Figure 12 illustrates the predicted Thermal Dose Index (TDI) distribution across Iran. Based on this comfort metric, Iran can be divided into three distinct zones. The first zone, characterized by negative index values, generally points to cooler, more comfortable conditions, requiring less “therapeutic dose” for thermal stress. Lower (more negative) values likely indicate ideal, cooler environments, demanding minimal physiological adjustment for comfort. The second zone, with values ranging from approximately 0 to 0.4, represents neutral to moderately warm conditions, where values near zero suggest minimal deviation from ideal comfort. The third zone, featuring values from 0.4 to 0.8, indicates increasingly hot and uncomfortable conditions, necessitating a higher “therapeutic dose” (more physiological adaptation or intervention) to cope with the heat. Higher values correlate with greater thermal stress.
Consequently, Iran’s northern and northwestern regions (along the Caspian Sea and mountainous areas) show lower TDI values, signifying cooler, more pleasant thermal conditions consistent with higher elevations and the Caspian Sea’s influence. These areas require less physiological effort or external intervention to maintain comfort. Conversely, the central and eastern parts of Iran, encompassing large sections of the central and eastern plateau, exhibit relatively high to high TDI values. This points to progressively warm to hot conditions, demanding greater physiological or adaptive responses for comfort, typical of Iran’s arid and semi-arid inland regions. The southern coastal areas (Persian Gulf and Gulf of Oman) display the highest TDI values, indicating extremely high thermal stress and a significant “therapeutic dose” for human comfort, aligning with the known hot and humid climate of these coastal desert zones. Therefore, Figure 12 effectively depicts the predicted thermal stress levels (or “therapeutic dose” needed for comfort) across Iran. It highlights that while the northern and northwestern areas generally offer more favorable thermal conditions, vast central, eastern, and primarily southern coastal regions face considerable thermal stress, requiring greater physiological adjustment or adaptive measures. The observed patterns align with Iran’s well-known climatic regions.
Figure 13 showcases the predicted Humidex spatial distribution in Iran, derived using the Random Forest method. Areas with negative index values signify icy and uncomfortable conditions, whereas positive values denote extremely hot and humid (severely uncomfortable) conditions. Specifically, the northern and northwestern regions, particularly along the Caspian Sea coast and mountainous zones, indicate cold or incredible sensations. Central Iran experiences neutral to moderately warm and humid conditions. The southern regions and the coasts of the Persian Gulf and Gulf of Oman exhibit the highest levels of discomfort from heat and humidity, identifying these areas as intensely hot and humid.
Figure 14 presents the predicted Wet-Bulb Globe Temperature (WBGT) distribution throughout Iran. WBGT is a key metric for assessing heat stress, especially in environments with high physical activity and direct radiation. The results indicate that northern and northwestern Iran experience the lowest heat stress (calm or moderate), while central regions show moderate heat stress (warm). The southern and southeastern areas register the highest and most severe heat stress, characterized by extremely hot and hazardous conditions. Consequently, heat stress in Iran escalates from north to south and southeast, with the most severe conditions concentrated in the southern coastal and desert zones.
Figure 15 illustrates the predicted Universal Thermal Climate Index (UTCI) spatial distribution across Iran. The spatial pattern of this index, as determined by the Random Forest method, reveals three distinct zones. Negative values are observed in Iran’s northern and northwestern regions (especially along the Caspian Sea and western mountains). These areas signify cold to cool thermal conditions, typically categorized as “cold stress” or “cool” by UTCI. The second zone encompasses broad areas of central and eastern Iran, representing neutral to warm thermal conditions where relative comfort exists or a slight feeling of warmth is present. The third zone is found in the southern regions, notably along the Persian Gulf and Gulf of Oman coasts. These areas demonstrate high to very high thermal stress (hot to extremely hot), leading to severe discomfort. Therefore, this index effectively highlights significant variations in predicted thermal comfort across Iran, with northern and mountainous regions experiencing cooler conditions. At the same time, tropical and southern coastal areas confront severe thermal stress.
Figure 16 displays the predicted Mean Vote (PMV) spatial distribution utilizing the Random Forest method. This analysis delineates Iran into four distinct comfort regions. A zone showing a negative index distribution is identified as a “cool comfort” zone. A second zone, up to a coefficient of one, signifies a neutral to slightly warm thermal zone (the ideal range). The third zone, with a coefficient between one and three, is categorized as a warm comfort zone. A region with a coefficient exceeding three is marked as a very hot and uncomfortable zone. Based on this, Iran’s northern and northwestern areas (along the Caspian Sea and mountainous regions) indicate cooler or more comfortable thermal conditions, likely due to higher elevations and the Caspian Sea’s influence. Central and eastern Iran exhibit warm to hot thermal conditions, a common state for arid and semi-arid inland areas. The southern coastal regions (Persian Gulf and Gulf of Oman) along the southern coastline show extremely hot and uncomfortable conditions, as expected, given the high temperatures and humidity in these coastal desert areas. Cities like Bushehr fall into this highly uncomfortable zone. The southern coastal regions are identified as significant hotspots for thermal discomfort, with predicted PMV values frequently exceeding +3. Some scattered areas within the central and eastern deserts also display high PMV values, reflecting intense heat.
4.10. Comparison of Spatial Analysis Methods in Climatic Comfort Study
This study aimed to conduct a comprehensive assessment of climatic comfort in Iran and the identification of its influencing factors, utilizing three robust and complementary analytical approaches: Random Forest, Partial Least Squares Structural Equation Modeling (PLS-SEM), and spatial modeling. Random Forest method is a machine learning algorithm from the ensemble learning family. Its application in this study involved predicting and mapping the precise spatial distribution of various thermal comfort indices (including PMV, Humidex, TDI, UTCI, and WBGT) across Iran. This allowed for identifying the relative importance of individual environmental variables (such as air temperature, humidity, wind speed, radiation, and albedo) in explaining each comfort index. The results from this method enabled us to pinpoint specific spatial patterns of comfort/discomfort and identify “hot spots” or “cold spots” with great detail in different geographical regions of Iran. This approach provides operational and localized insights for climate-related planning and decision-making. In this study, PLS-SEM was employed to investigate the causal and structural relationships between latent climatic constructs (such as “thermal conditions,” “extreme climatic events,” “humidity conditions,” and “radiation and wind conditions”) and their influence on overall climatic comfort. This method helped us understand the underlying mechanisms through which climatic factors impact comfort within a comprehensive theoretical framework, allowing for the assessment of the overall importance of these broader constructs at a larger scale. However, while the Random Forest method focuses on accurate prediction and identifying the importance of individual variables in spatial distribution (addressing “what happens where”), it emphasizes understanding the structural and causal relationships among broader groups of factors (addressing “why and how”), in this study, spatial methods were employed to investigate the spatial relationships between latent climatic constructs (such as “thermal conditions,” “extreme climatic events,” “humidity conditions,” and “radiation and wind conditions”) and their spatial influence on overall climatic comfort.
5. Discussion
This study aimed to investigate the multifaceted impact of climatic variables on climatic comfort in Iran. By utilizing a Structural Equation Modeling (SEM) approach, Machine Learning, and examining the spatial patterns of climatic comfort indices, we gained a comprehensive understanding of these complex relationships. The modeling results, based on long-term climatic data (1984-2024) from reputable national and international sources, yielded key findings, highlighting the significant influence of thermal conditions and extreme events on perceived comfort.
5.1. Findings and Implications
Model’s findings demonstrate that thermal conditions (with a coefficient of 0.515) and extreme climatic phenomena (with a coefficient of 0.381) exert the most substantial positive and direct influence on composite climatic comfort indices. This confirms that elevated temperatures and extreme occurrences like summer days, warm nights, and prolonged heat waves are the primary drivers of thermal discomfort across Iran’s geographical expanse. Maps depicting these indices further illustrate that the southern and southeastern regions of Iran, particularly the Persian Gulf and Oman Sea coasts, experience the highest intensity and frequency of these phenomena. This underscores the critical need for adaptation strategies in these particularly vulnerable areas.
Conversely, the study highlighted the more moderate role of radiation, humidity, and wind/pressure in climatic comfort. While solar radiation showed a moderate negative impact on comfort (with a coefficient of -0.298), humidity conditions (with a coefficient of -0.074) and wind and pressure (with a coefficient of 0.043) exhibited relatively weaker effects on climatic comfort indices. This suggests that while humidity and wind do play a role in thermal comfort perception, their contribution to explaining variance in climatic comfort is less significant at the national scale compared to thermal and extreme components. It is worth noting that indices like Humidex and WBGT, which account for humidity, still indicate very high temperatures in the southern coastal areas, necessitating more precise local investigations to fully understand the interactive effects of variables in these specific microclimates.
A crucial aspect of our findings is the high explanatory and predictive power of the model. The developed Structural Equation Model boasts a very high explanatory power (R2 = 0.811) for climatic comfort indices, indicating the significant ability of the selected climatic constructs to explain variations in thermal comfort across Iran. Furthermore, the predictive power index (Q2 = 0.620) also points to the model’s excellent capability in predicting out-of-sample data and the generalizability of its findings. This high validity positions the model as a reliable tool for analyzing and forecasting future climatic comfort conditions, making it valuable for proactive planning.
Moreover, the spatial patterns of the indices are of great importance. The patterns derived from the maps of composite comfort indices (PMV, UTCI, WBGT, Humidex, TDI) and extreme phenomena (Summer Days, Warm Nights, WSDI) align perfectly with the quantitative results from the Structural Equation Modeling. This correlation indicates the model’s high accuracy in identifying regions with significant thermal challenges (such as the southern and southwestern parts of Iran) and areas with more favorable thermal comfort conditions (the mountainous and northern regions). The TDI index, by showcasing the range of temperature fluctuations, effectively elucidated the distinct characteristics of desert climates (high oscillation) and coastal areas (low oscillation).
5.2. Practical Implications and Future Directions
The findings of this research have significant practical implications for national and regional policymaking and planning, especially within the context of climate change. In urban management and climatic architecture, acknowledging the dominant influence of thermal conditions and extreme phenomena necessitates that urban design and building architecture in warm regions (particularly southern Iran) prioritize principles of climatic sustainability, reduced heat absorption, natural ventilation, and materials with appropriate thermal mass.
Another significant finding pertains to public health in urban Iran. Results indicate that developing heat warning programs, raising public awareness about the health risks of heatstroke, and establishing cooling shelters during warm seasons, especially in areas with high WSDI, are essential public health interventions. Furthermore, the study’s findings are important for agricultural and water resource planning. A precise understanding of the duration of heat waves and the number of warm days can aid in selecting heat-resistant cropping patterns and optimizing water consumption planning in the agricultural sector, which is critical in arid regions.
Based on these findings, we emphasize the importance of climate change studies. This model can serve as a powerful tool for predicting future changes in climatic comfort under various climate change scenarios and assessing the vulnerability of different regions. Therefore, continued attention to future research based on this study’s models is crucial. Future studies should also investigate the impact of socio-economic and psychological factors on the perception of climatic comfort, providing more comprehensive models for climatic comfort analysis. Additionally, a more detailed analysis of the interactive effects of climatic variables at local scales, focusing on specific regions, can provide deeper insights into thermal comfort dynamics. In conclusion, this study, by providing a comprehensive analytical framework and practical results, marks a significant step towards enhancing our understanding of climatic comfort in Iran, paving the way for evidence-based decision-making to improve quality of life and resilience in the face of climate change.
6. Conclusions
This research aimed to investigate the multifaceted impact of climatic variables on climatic comfort in Iran. Utilizing a Structural Equation Modeling (SEM) approach and examining the spatial patterns of climatic comfort indices, the study provides a comprehensive understanding of these complex relationships. The modeling results, based on long-term climatic data (1984-2024) from reputable national and international sources, yielded key findings, highlighting the significant influence of thermal conditions and extreme events, as evidenced by path coefficients in the structural model. The analysis of path coefficients demonstrated that thermal conditions (with a coefficient of 0.515) and extreme climatic phenomena (with a coefficient of 0.381) exert the most substantial positive and direct influence on the composite climatic comfort indices. This finding confirms that elevated temperatures and extreme occurrences like summer days, warm nights, and prolonged heat waves are the primary factors contributing to thermal discomfort across Iran’s geographical expanse. Maps depicting these indices illustrate that the southern and southeastern regions of Iran, particularly the Persian Gulf and Oman Sea coasts, experience the highest intensity and frequency of these phenomena.
Conversely, the study underscored the moderating role of radiation, humidity, and wind/pressure in climatic comfort. While solar radiation showed a moderate negative impact on comfort (coefficient of -0.298), humidity conditions (with a coefficient of -0.074) and wind and pressure (with a coefficient of 0.043) exhibited relatively weaker effects on climatic comfort indices. This suggests that although humidity and wind play a role in thermal comfort perception, their contribution to explaining the variance in climatic comfort is less significant at the national scale when compared to thermal and extreme components. It is worth noting that indices like Humidex and WBGT, which account for humidity, still indicate very high temperatures in the southern coastal areas, necessitating more precise local investigations to ascertain the interactive effects of variables.
Another crucial aspect is the high explanatory and predictive power of the model. The developed Structural Equation Model boasts a very high explanatory power (R² = 0.811) for climatic comfort indices, indicating the significant ability of the selected climatic constructs to explain variations in thermal comfort across Iran. Furthermore, the predictive power index (Q² = 0.620) also points to the model’s excellent capability in predicting out-of-sample data and the generalizability of its findings. This high validity positions the model as a reliable tool for analyzing and forecasting future climatic comfort conditions.
Moreover, examining spatial patterns of the indices is of great importance. The spatial patterns derived from the maps of composite comfort indices (PMV, UTCI, WBGT, Humidex, TDI) and extreme phenomena (Summer Days, Warm Nights, WSDI) are in complete alignment with the quantitative results from the Structural Equation Modeling. This correlation indicates the model’s high accuracy in identifying regions with significant thermal challenges (such as the southern and southwestern parts of Iran) and areas with more favorable thermal comfort conditions (the mountainous and northern regions of the country). The TDI index, by showcasing the range of temperature fluctuations, effectively elucidated the distinct characteristics of desert climates (high oscillation) and coastal areas (low oscillation). The findings of this research have important practical implications for national and regional policy-making and planning, especially within the context of climate change. In urban management and climatic architecture, acknowledging the dominant influence of thermal conditions and extreme phenomena necessitates that urban design and building architecture in warm regions (particularly southern Iran) prioritize principles of climatic sustainability, reduced heat absorption, natural ventilation, and materials with appropriate thermal mass. Another significant finding pertains to public health in urban Iran. The research indicates that developing heat warning programs, raising public awareness about the health risks of heatstroke, and establishing cooling shelters during warm seasons, especially in areas with high WSDI, are essential. Furthermore, the research findings are important for agricultural and water resource planning. A precise understanding of the duration of heat waves and the number of warm days can aid in selecting heat-resistant cropping patterns and optimizing water consumption planning in the agricultural sector. Based on these findings, emphasis is placed on climate change studies. This model can be a powerful tool for predicting future changes in climatic comfort under various climate change scenarios and assessing the vulnerability of different regions. Therefore, attention to future research based on this study’s models is crucial. Future studies should also investigate the impact of socio-economic and psychological factors on the perception of climatic comfort to provide more comprehensive models for climatic comfort analysis. Additionally, a more detailed analysis of the interactive effects of climatic variables at local scales, focusing on specific regions, can provide deeper insights. In conclusion, this study, by providing a comprehensive analytical framework and practical results, marks a significant step towards enhancing our understanding of climatic comfort in Iran, paving the way for evidence-based decision-making to improve quality of life and resilience in the face of climate change.
Author Contributions
Majid Javari: Conceptualization, Methodology, Software, Validation, Formal analysis, Investigation, Resources, Data Curation, Writing—Original Draft, Visualization, Project administration, Funding acquisition.
Funding
This research was conducted with the support of facilities and resources provided by Payame Noor University. No external funding was received.
Data Availability Statement
Data will be made available on request.
Conflicts of Interest
The authors declare that they have no known competing financial interests or personal relationships that could have appeared to influence the work reported in this paper.
References
- Riffelli, S. Global Comfort Indices in Indoor Environments: A Survey. Sustainability 2021, 13, 12784. [CrossRef]
- Karaiskos, P.; Munian, Y.; Martinez-Molina, A.; Alamaniotis, M. Indoor air quality prediction modeling for a naturally ventilated fitness building using RNN-LSTM artificial neural networks. Smart Sustain. Built Environ. 2024, ahead-of-p. [CrossRef]
- Ojha, V.K.; Griego, D.; Kuliga, S.; Bielik, M.; Buš, P.; Schaeben, C.; Treyer, L.; Standfest, M.; Schneider, S.; König, R.; et al. Machine learning approaches to understand the influence of urban environments on human’s physiological response. Inf. Sci. 2019, 474, 154–169. [CrossRef]
- Ren, Z.; Fu, Y.; Dong, Y.; Zhang, P.; He, X. Rapid urbanization and climate change significantly contribute to worsening urban human thermal comfort: A national 183-city, 26-year study in China. Urban Clim. 2022, 43. [CrossRef]
- Kara, Y.; Yavuz, V. Urban Microclimates in a Warming World: Land Surface Temperature (LST) Trends Across Ten Major Cities on Seven Continents. Urban Sci. 2025, 9, 115. [CrossRef]
- Zargari, M.; Mofidi, A.; Entezari, A.; Baaghideh, M. Climatology of Tehran surface heat Island: a satellite-based spatial analysis. Sci. Rep. 2025, 15, 1–28. [CrossRef]
- Javari, M. Rainfall random variability and its effects on flood risk management in Iran. Model. Earth Syst. Environ. 2021, 8, 1109–1133. [CrossRef]
- Liu, Y. Indoor thermal comfort and VR landscape design of low-energy buildings based on interactive design technology. Therm. Sci. Eng. Prog. 2025, 59. [CrossRef]
- Avci AB. Machine learning-based prediction of thermal comfort: exploring building types, climate, ventilation strategies, and seasonal variations. Building Research & Information. 2025:1-18.
- Kamal, A.S.M.M.; Fahim, A.K.F.; Shahid, S. Changes in wet bulb globe temperature and risk to heat-related hazards in Bangladesh. Sci. Rep. 2024, 14, 1–19. [CrossRef]
- Machard A, Salvati A, P. Tootkaboni M, Gaur A, Zou J, Wang LL, et al. Typical and extreme weather datasets for studying the resilience of buildings to climate change and heatwaves. Scientific Data. 2024;11(1):531.
- Wang, Z.-M.; Ma, H.-Y.; Li, W.; Chen, H.-S. Human influence on the duration of extreme temperature events in Asia's hotspot regions. Adv. Clim. Chang. Res. 2024, 15, 312–326. [CrossRef]
- de Oliveira-Júnior JF, Mendes D, Porto HD, Cardoso KRA, Neto JAF, da Silva EBC, et al. Analysis of drought and extreme precipitation events in Thailand: trends, climate modeling, and implications for climate change adaptation. Scientific Reports. 2025;15(1):4501.
- Pantavou, K.; Kotroni, V.; Lagouvardos, K.; Kyriakou, P. Future changes of bioclimate in Greece: Variations in thermal stress according to the Universal Thermal Climate Index (UTCI). Sci. Total. Environ. 2025, 980, 179514. [CrossRef]
- Mahdavinejad, M.; Shaeri, J.; Nezami, A.; Goharian, A. Comparing universal thermal climate index (UTCI) with selected thermal indices to evaluate outdoor thermal comfort in traditional courtyards with BWh climate. Urban Clim. 2024, 54. [CrossRef]
- Yao, R.; Li, B.; Liu, J. A theoretical adaptive model of thermal comfort – Adaptive Predicted Mean Vote (aPMV). Build. Environ. 2009, 44, 2089–2096. [CrossRef]
- Spangler, K.R.; Liang, S.; Wellenius, G.A. Wet-Bulb Globe Temperature, Universal Thermal Climate Index, and Other Heat Metrics for US Counties, 2000–2020. Sci. Data 2022, 9, 1–9. [CrossRef]
- Rana, R.; Kusy, B.; Jurdak, R.; Wall, J.; Hu, W. Feasibility analysis of using humidex as an indoor thermal comfort predictor. Energy Build. 2013, 64, 17–25. [CrossRef]
- Howarth, E.; Hoffman, M.S. A multidimensional approach to the relationship between mood and weather. Br. J. Psychol. 1984, 75, 15–23. [CrossRef]
- Fan, Y.; Chen, J.; Shirkey, G.; John, R.; Wu, S.R.; Park, H.; Shao, C. Applications of structural equation modeling (SEM) in ecological studies: an updated review. Ecol. Process. 2016, 5, 1–12. [CrossRef]
- Javari, M. Comparing causal techniques for rainfall variability analysis using causality algorithms in Iran. Heliyon 2018, 4, e00774. [CrossRef]
- Nacar, S.; Kankal, M.; Okkan, U. Evaluation of the suitability of NCEP/NCAR, ERA-Interim and, ERA5 reanalysis data sets for statistical downscaling in the Eastern Black Sea Basin, Turkey. Meteorol. Atmospheric Phys. 2022, 134, 1–23. [CrossRef]
- Brunner, L.; Pendergrass, A.G.; Lehner, F.; Merrifield, A.L.; Lorenz, R.; Knutti, R. Reduced global warming from CMIP6 projections when weighting models by performance and independence. Earth Syst. Dyn. 2020, 11, 995–1012. [CrossRef]
- Ali, F.; Rasoolimanesh, S.M.; Sarstedt, M.; Ringle, C.M.; Ryu, K. An assessment of the use of partial least squares structural equation modeling (PLS-SEM) in hospitality research. Int. J. Contemp. Hosp. Manag. 2018, 30, 514–538. [CrossRef]
- Shukla, A.; Tandel, B.N.; Kajaliya, P.P. Auditory and mental well-being of teachers in urban noise environment: A partial least square structural equation model approach. Appl. Acoust. 2024, 230. [CrossRef]
- Carter SR. Using confirmatory factor analysis to manage discriminant validity issues in social pharmacy research. International Journal of Clinical Pharmacy. 2016;38(3):731-7.
- Hair, J.F.; Risher, J.J.; Sarstedt, M.; Ringle, C.M. When to use and how to report the results of PLS-SEM. Eur. Bus. Rev. 2019, 31, 2–24. [CrossRef]
- Ghlichlee, B.; Bayat, F.; Hatami, A. Knowledge-oriented leadership and business performance: the mediating role of intellectual capital and sustainable competitive advantage in the knowledge-intensive service industry. J. Intellect. Cap. 2024, 26, 152–173. [CrossRef]
- Wong KK-K. Partial least squares structural equation modeling (PLS-SEM) techniques using SmartPLS. Marketing bulletin. 2013;24(1):1-32.
- Johri, A. Impact of artificial intelligence on the performance and quality of accounting information systems and accuracy of financial data reporting. Account. Forum 2025, 1–25. [CrossRef]
- Guenzi, P.; Georges, L. Interpersonal trust in commercial relationships. Eur. J. Mark. 2010, 44, 114–138. [CrossRef]
- Sarkar, A.; Azim, J.A.; Al Asif, A.; Qian, L.; Peau, A.K. Structural equation modeling for indicators of sustainable agriculture: Prospective of a developing country’s agriculture. Land Use Policy 2021, 109, 105638. [CrossRef]
- Keith TZ. Multiple Regression and Beyond An Introduction to Multiple Regression and Structural Equation Modeling. 2019.
- Temme, D.; Diamantopoulos, A. Higher-order models with reflective indicators. J. Model. Manag. 2016, 11, 180–188. [CrossRef]
- Garson GD. Partial Least Squares. Regression and Structural Equation Models. Partial Least Squares Regression and Structural Equation Models2016.
- Jos eEH, Jr., Hufit GTsM, Ringle CM, Sarstedt M. A PRIMER ON PARTIAL LEAST SQUARES STRUCTURAL EQUATION MODELING (PLS-SEM). Proceedings of the National Academy of Sciences. 2014;108(supplement_3):15639-46.
- Li, Y.; Baorong, Z.; Xiaohong, X.; Zijun, L.; Abu Nyeem, H.M. Application of a semivariogram based on a deep neural network to Ordinary Kriging interpolation of elevation data. PLOS ONE 2022, 17, e0266942. [CrossRef]
- Zhou SSHXX. Encyclopedia of GIS: Springer International Publishing; 2017.
- Olea, R.A. A six-step practical approach to semivariogram modeling. Stoch. Environ. Res. Risk Assess. 2006, 20, 307–318. [CrossRef]
Figure 1.
Relationships between Latent Constructs using PLS-SEM.
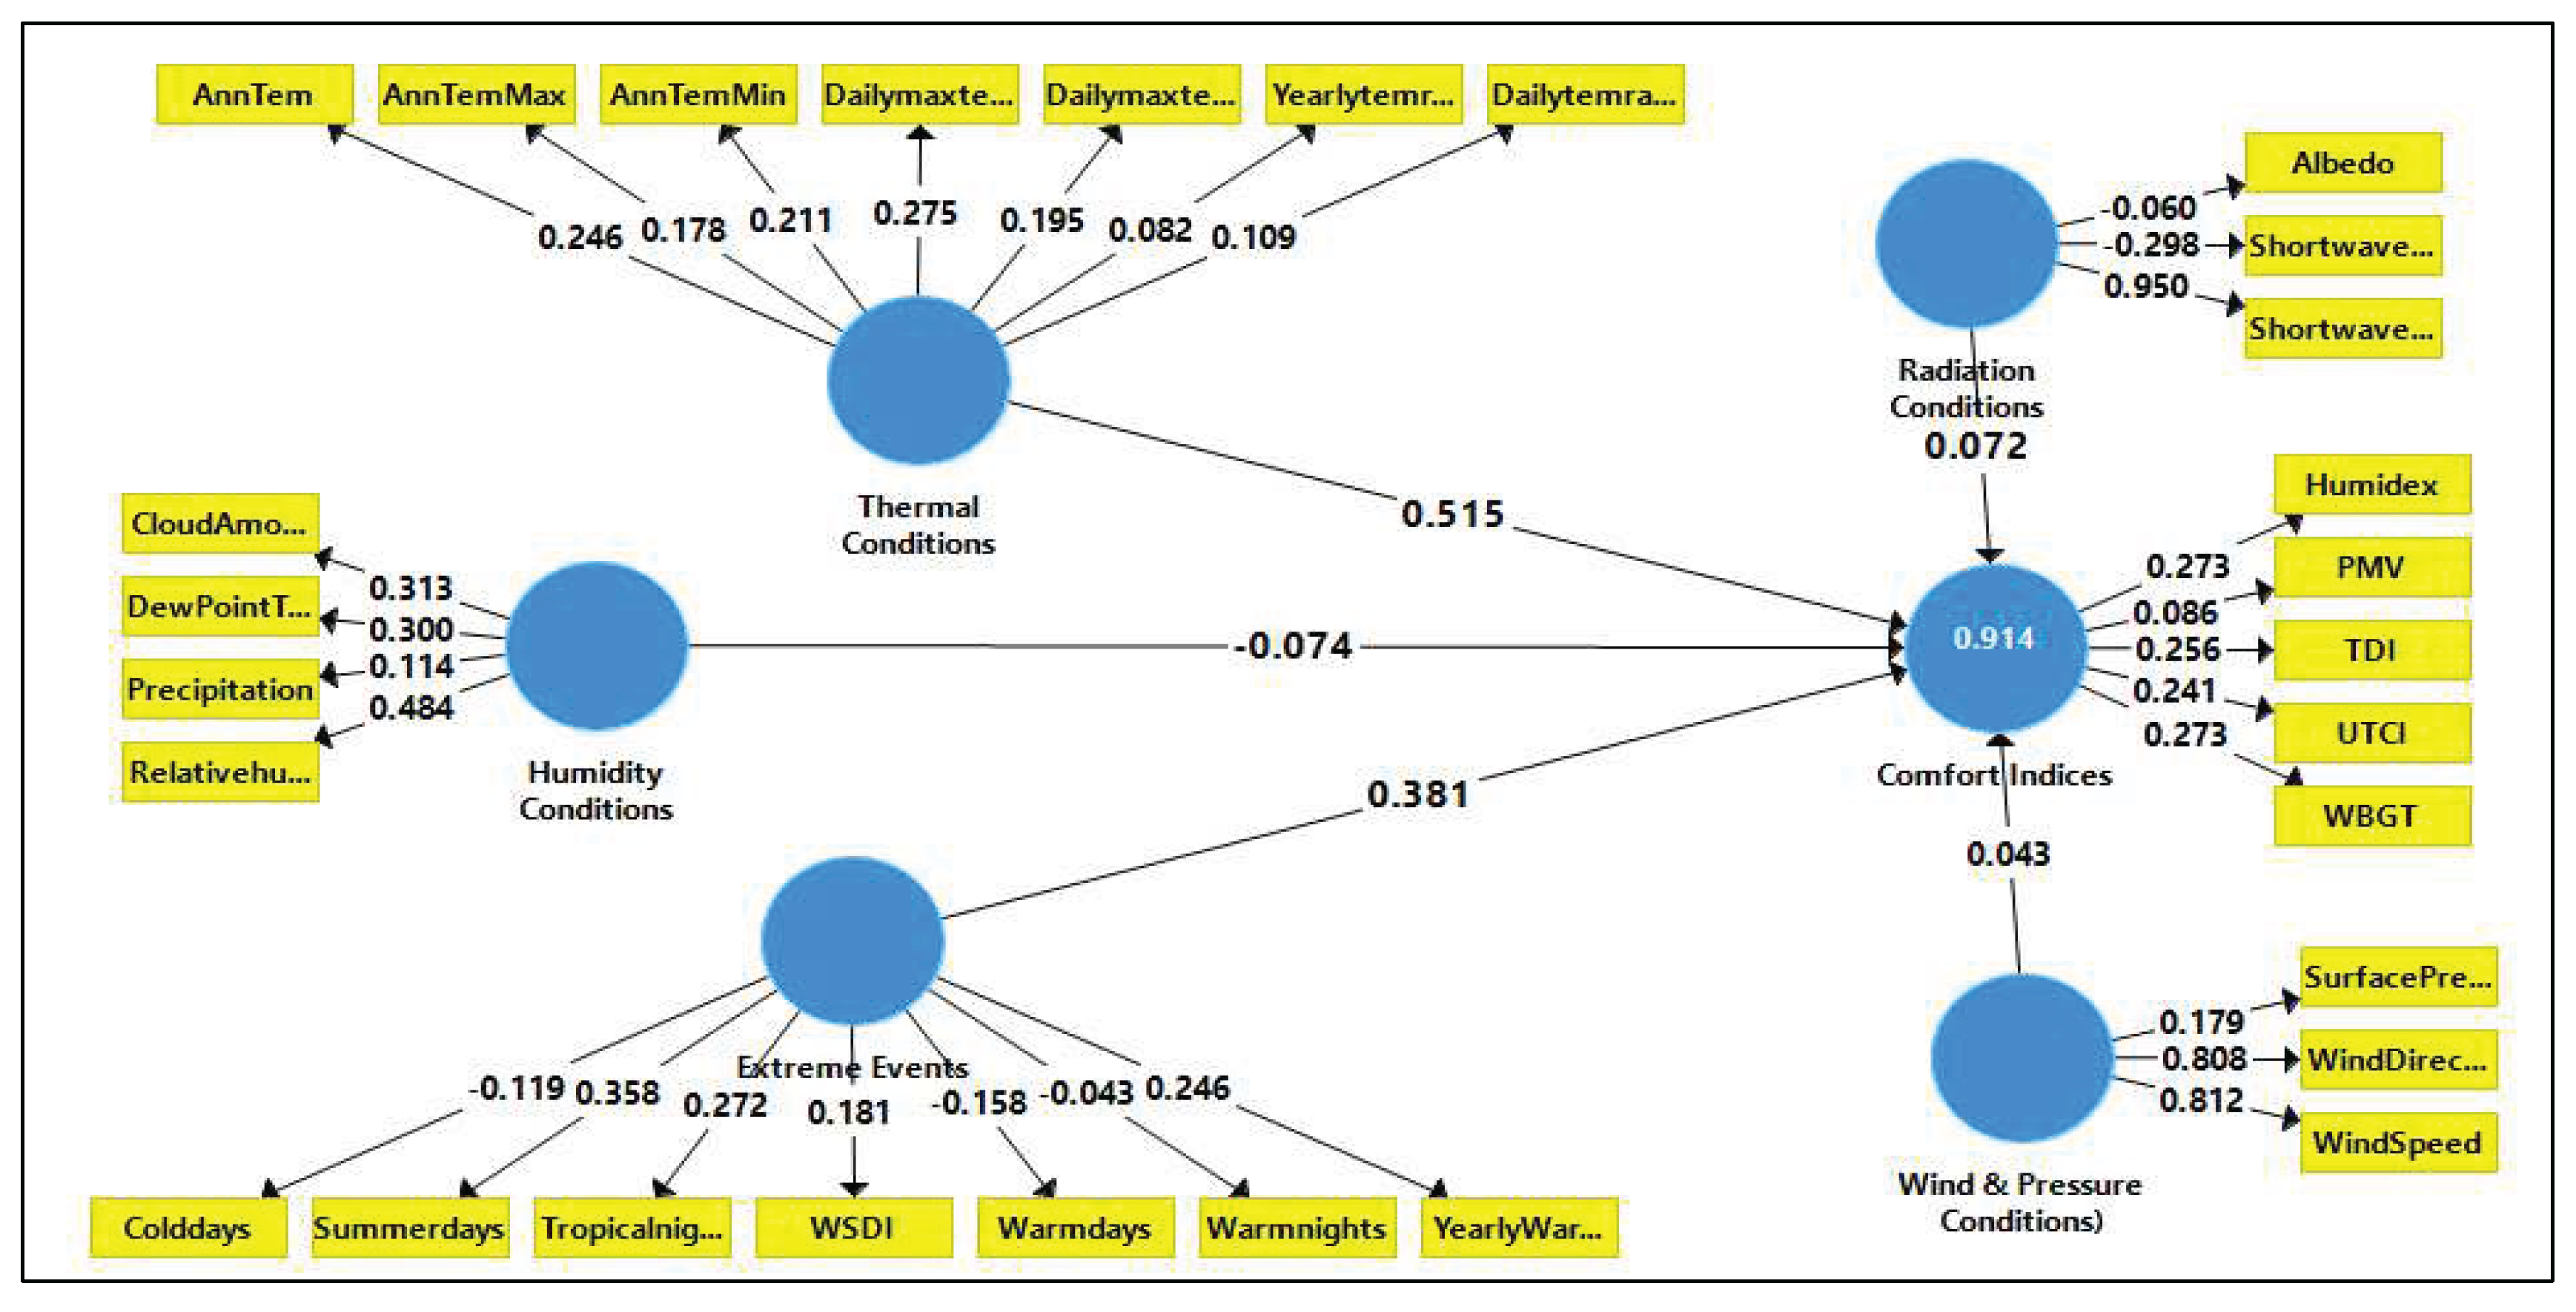
Figure 2.
Prediction of Constructs from Observed Indicators using PLS-SEM.
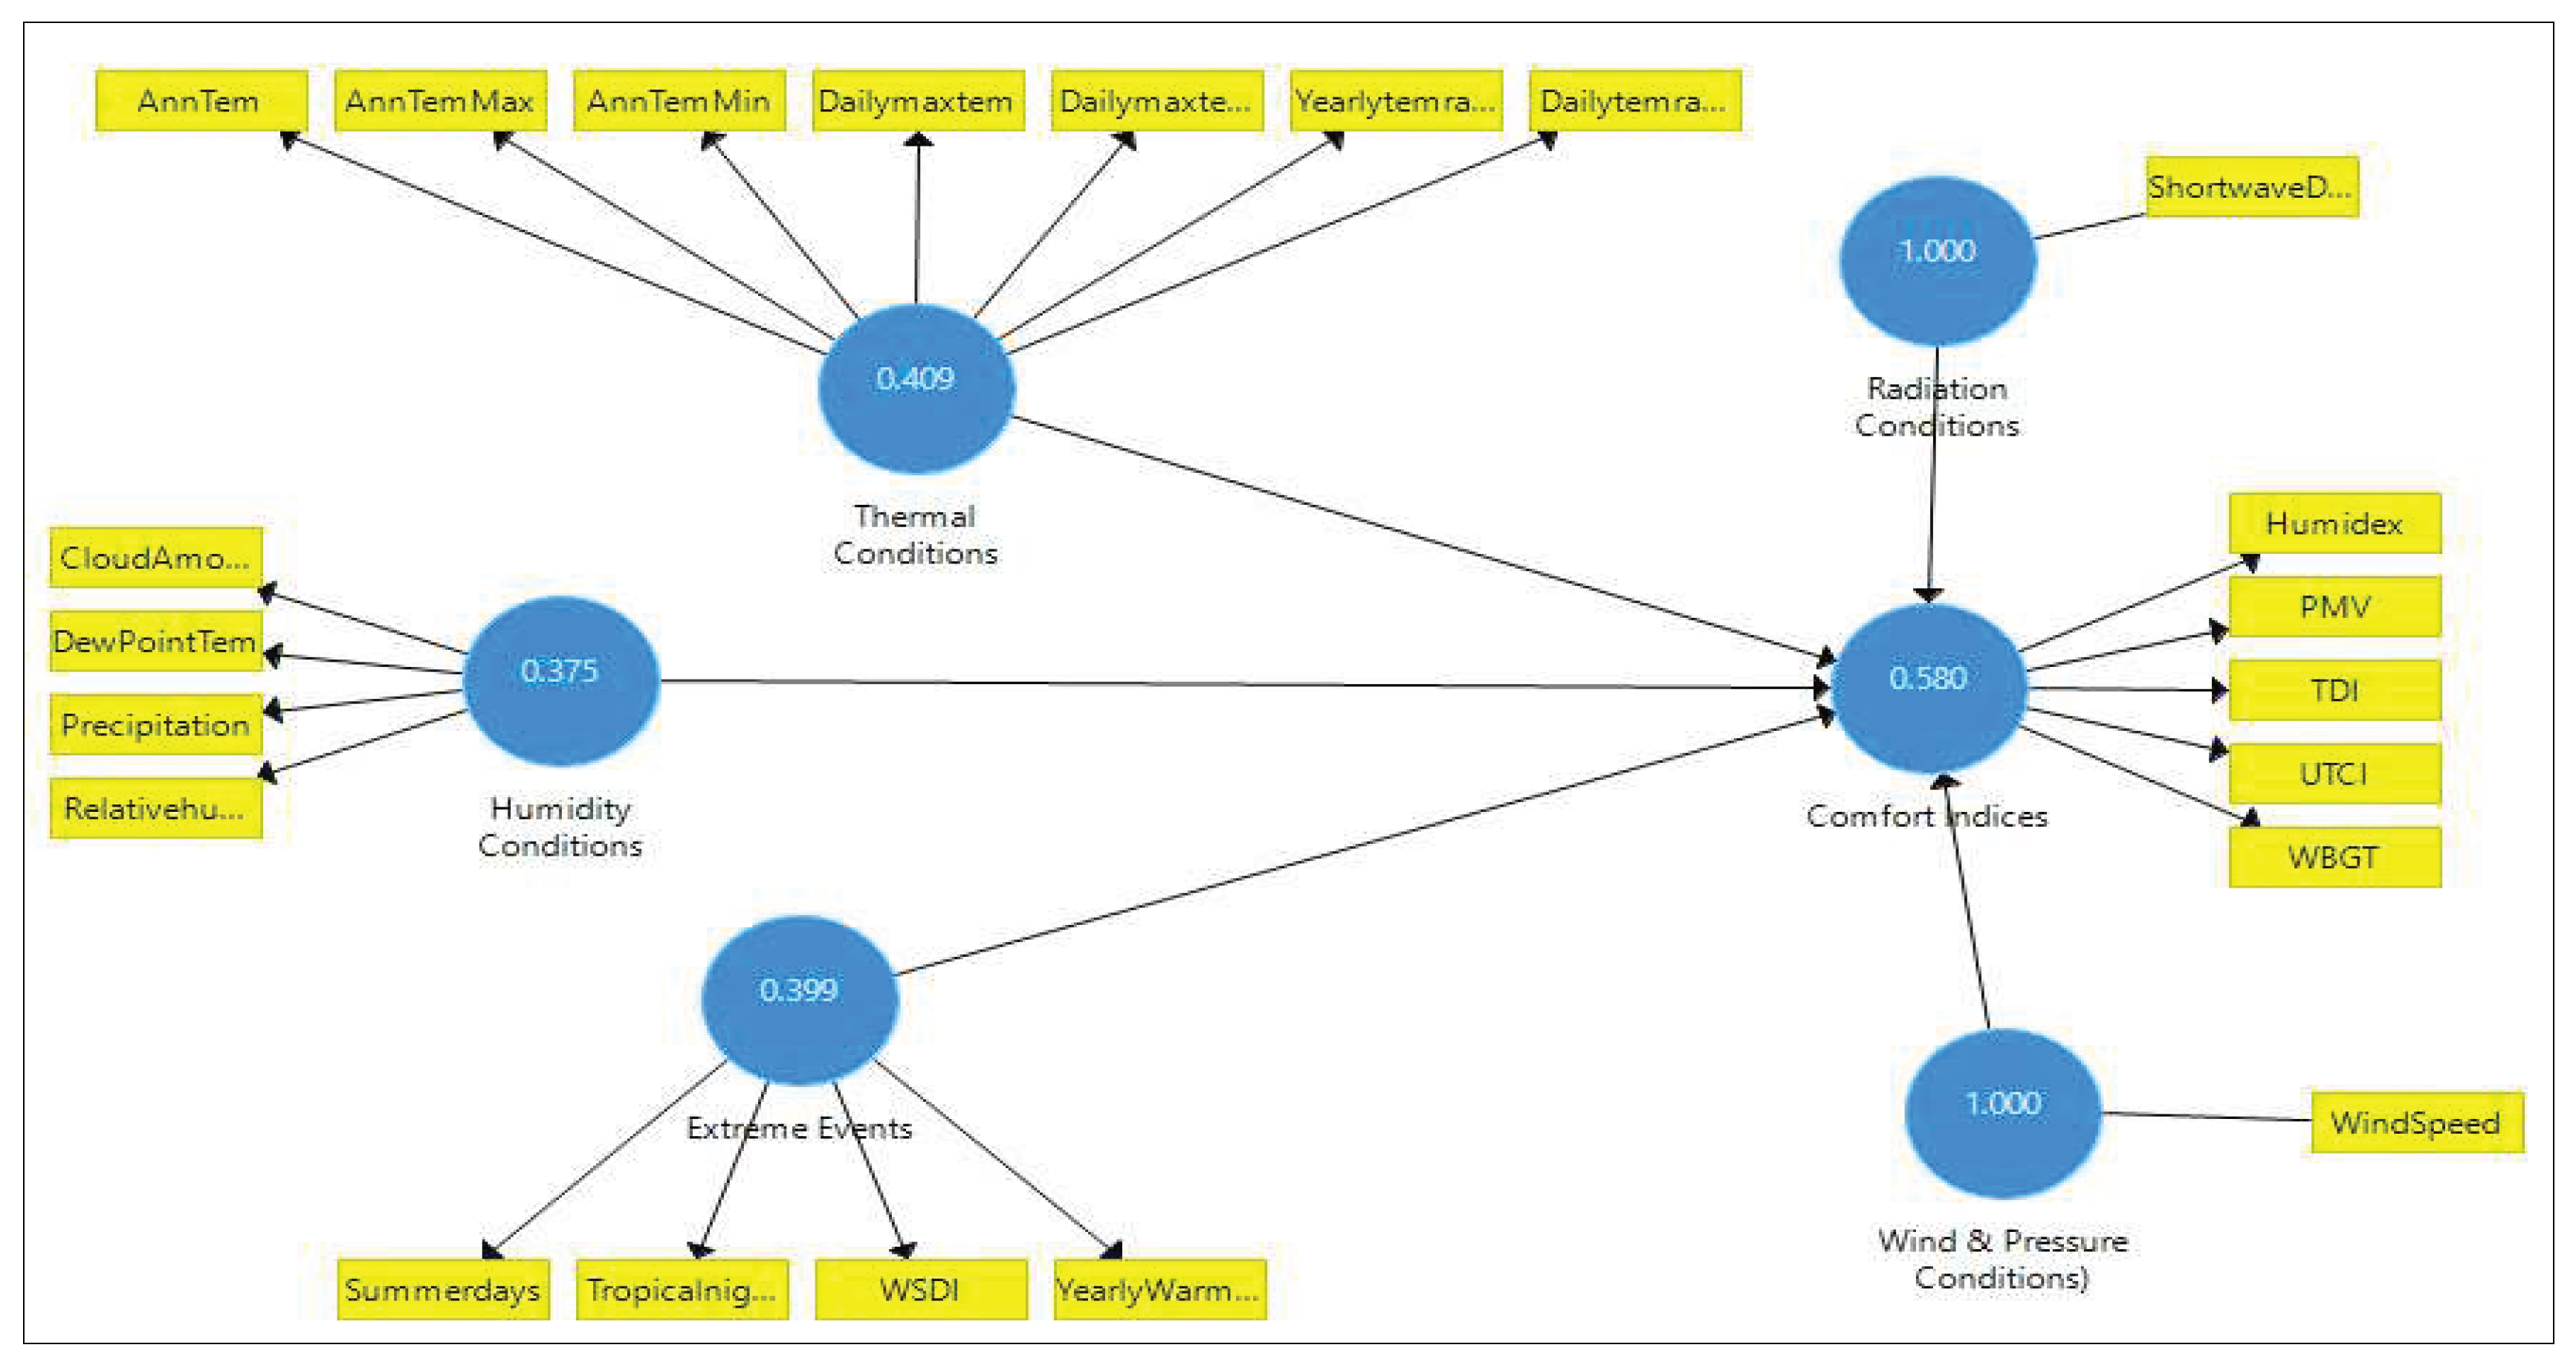
Figure 3.
Performance of Various Constructs on Climatic Comfort using PLS-SEM in Iran.
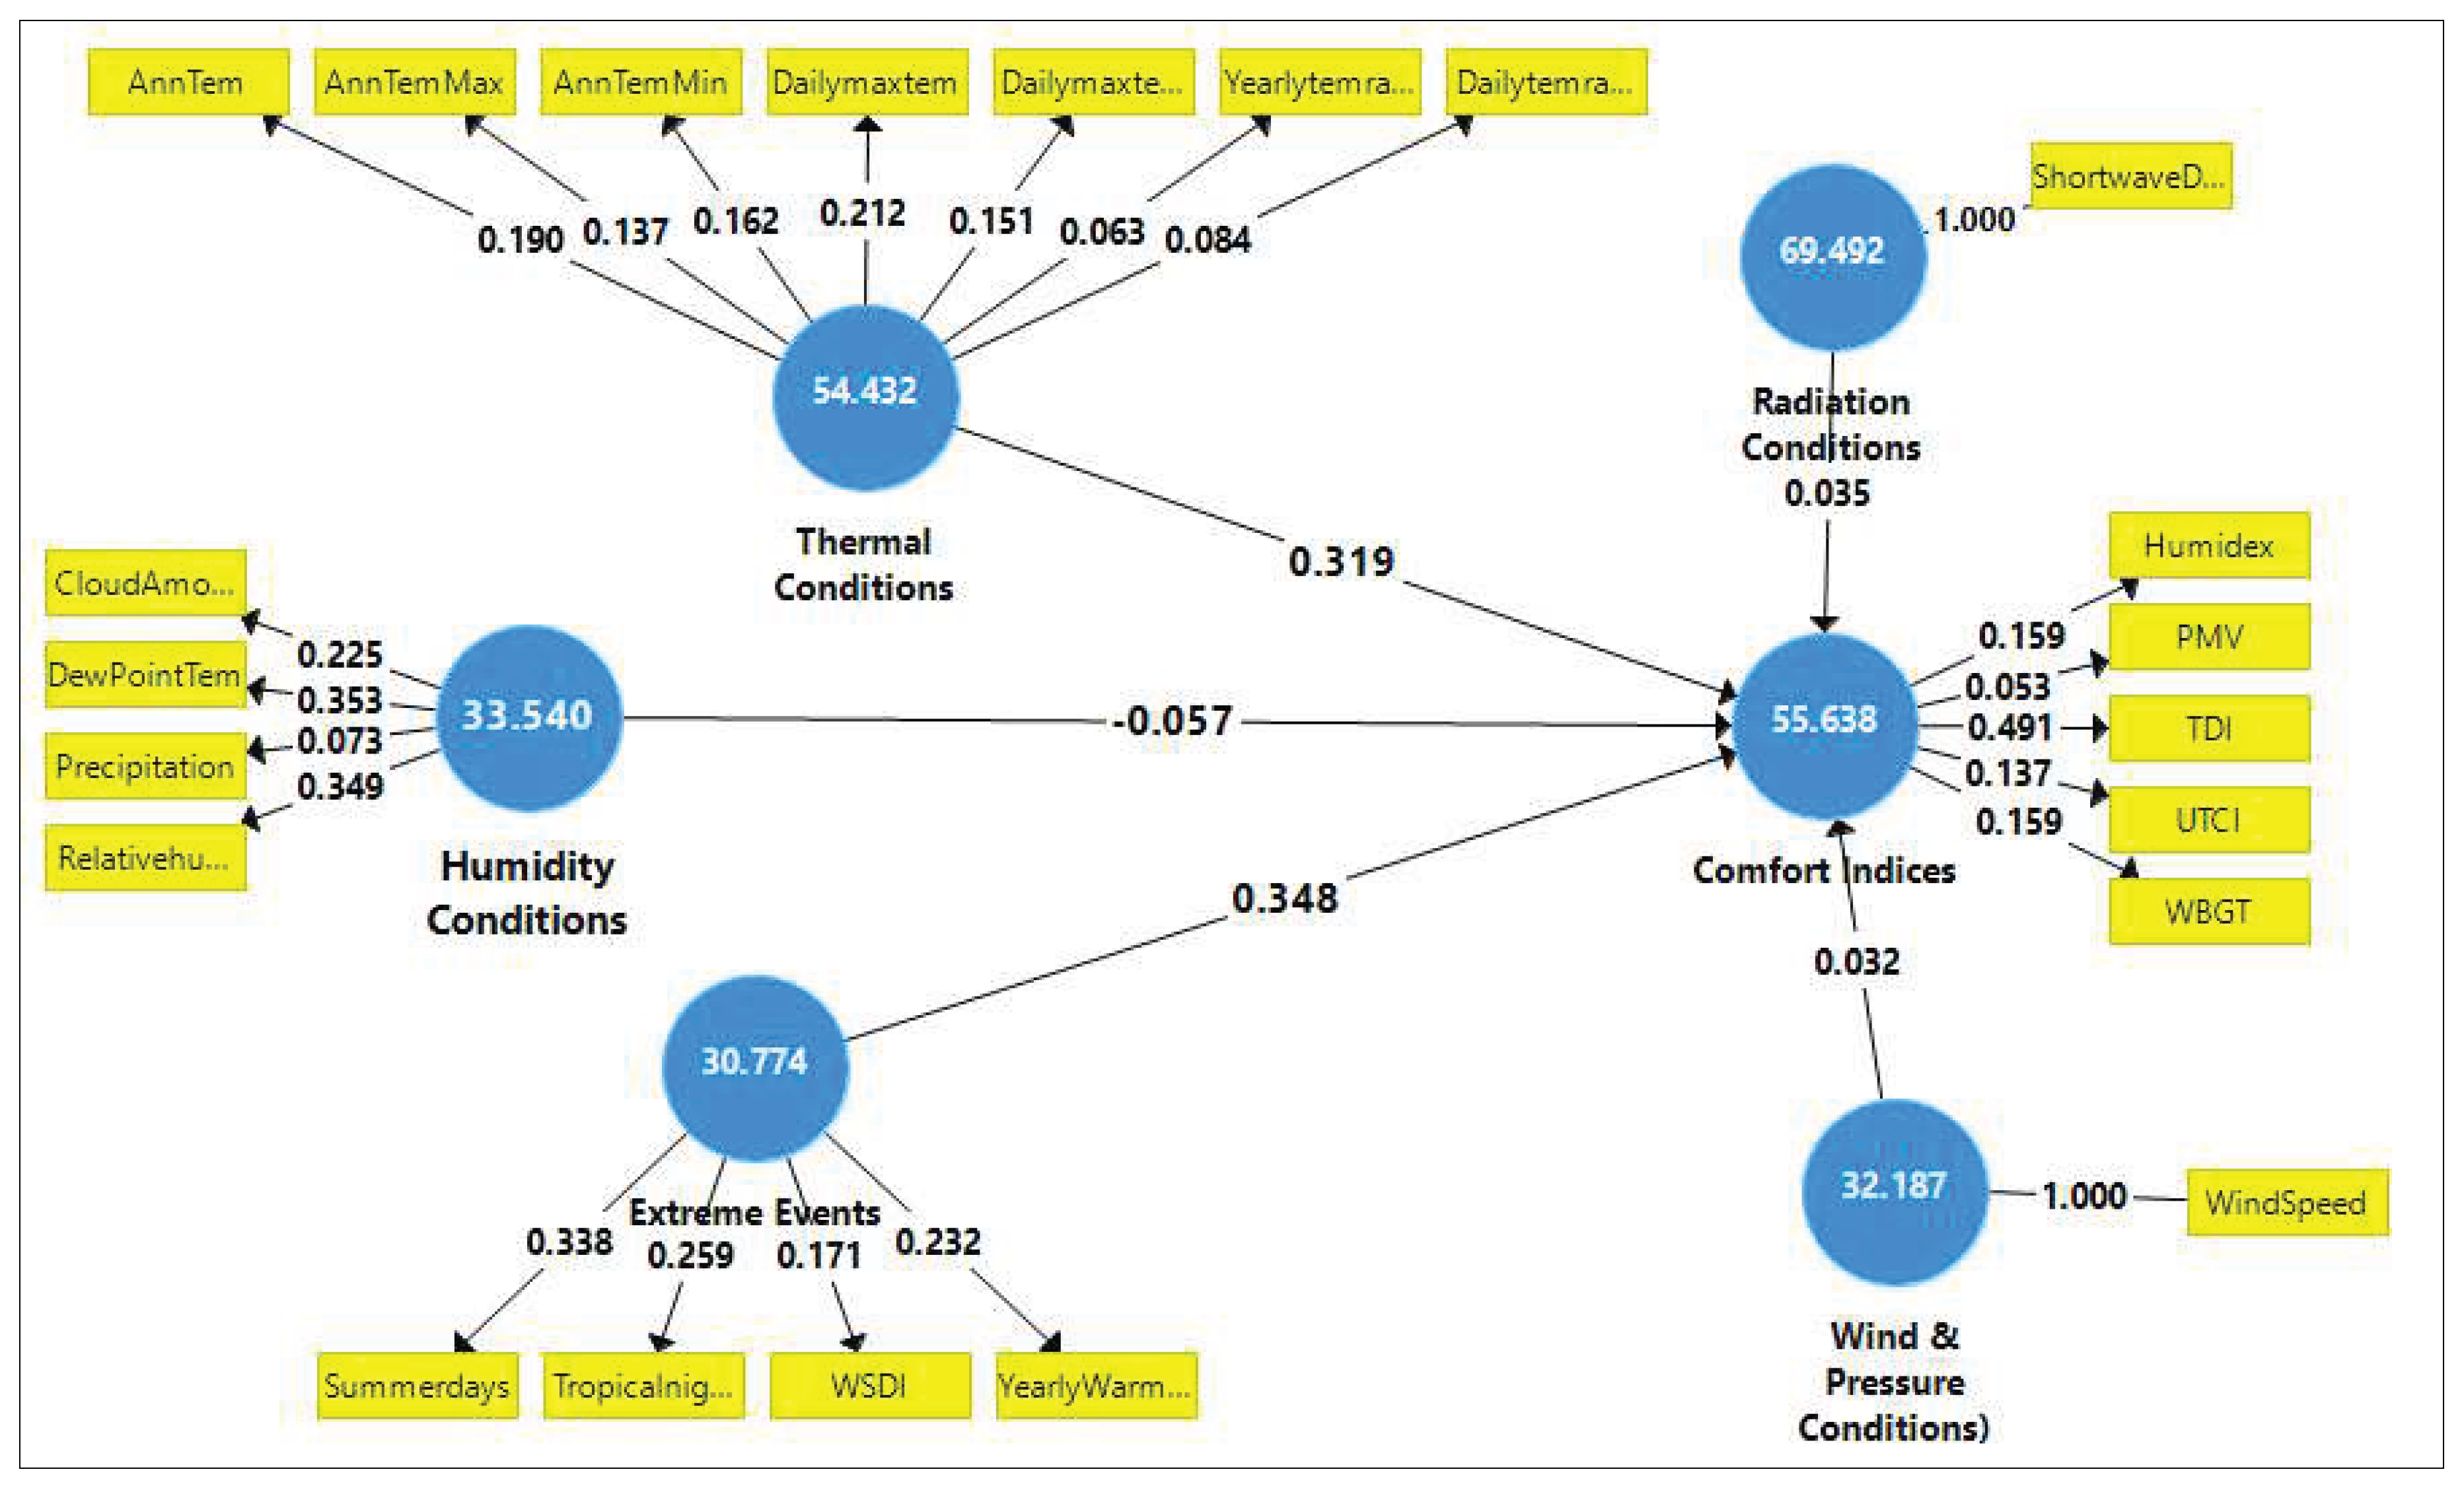
Figure 4.
Spatial Distribution of Humidex using spatial modeling in Iran.
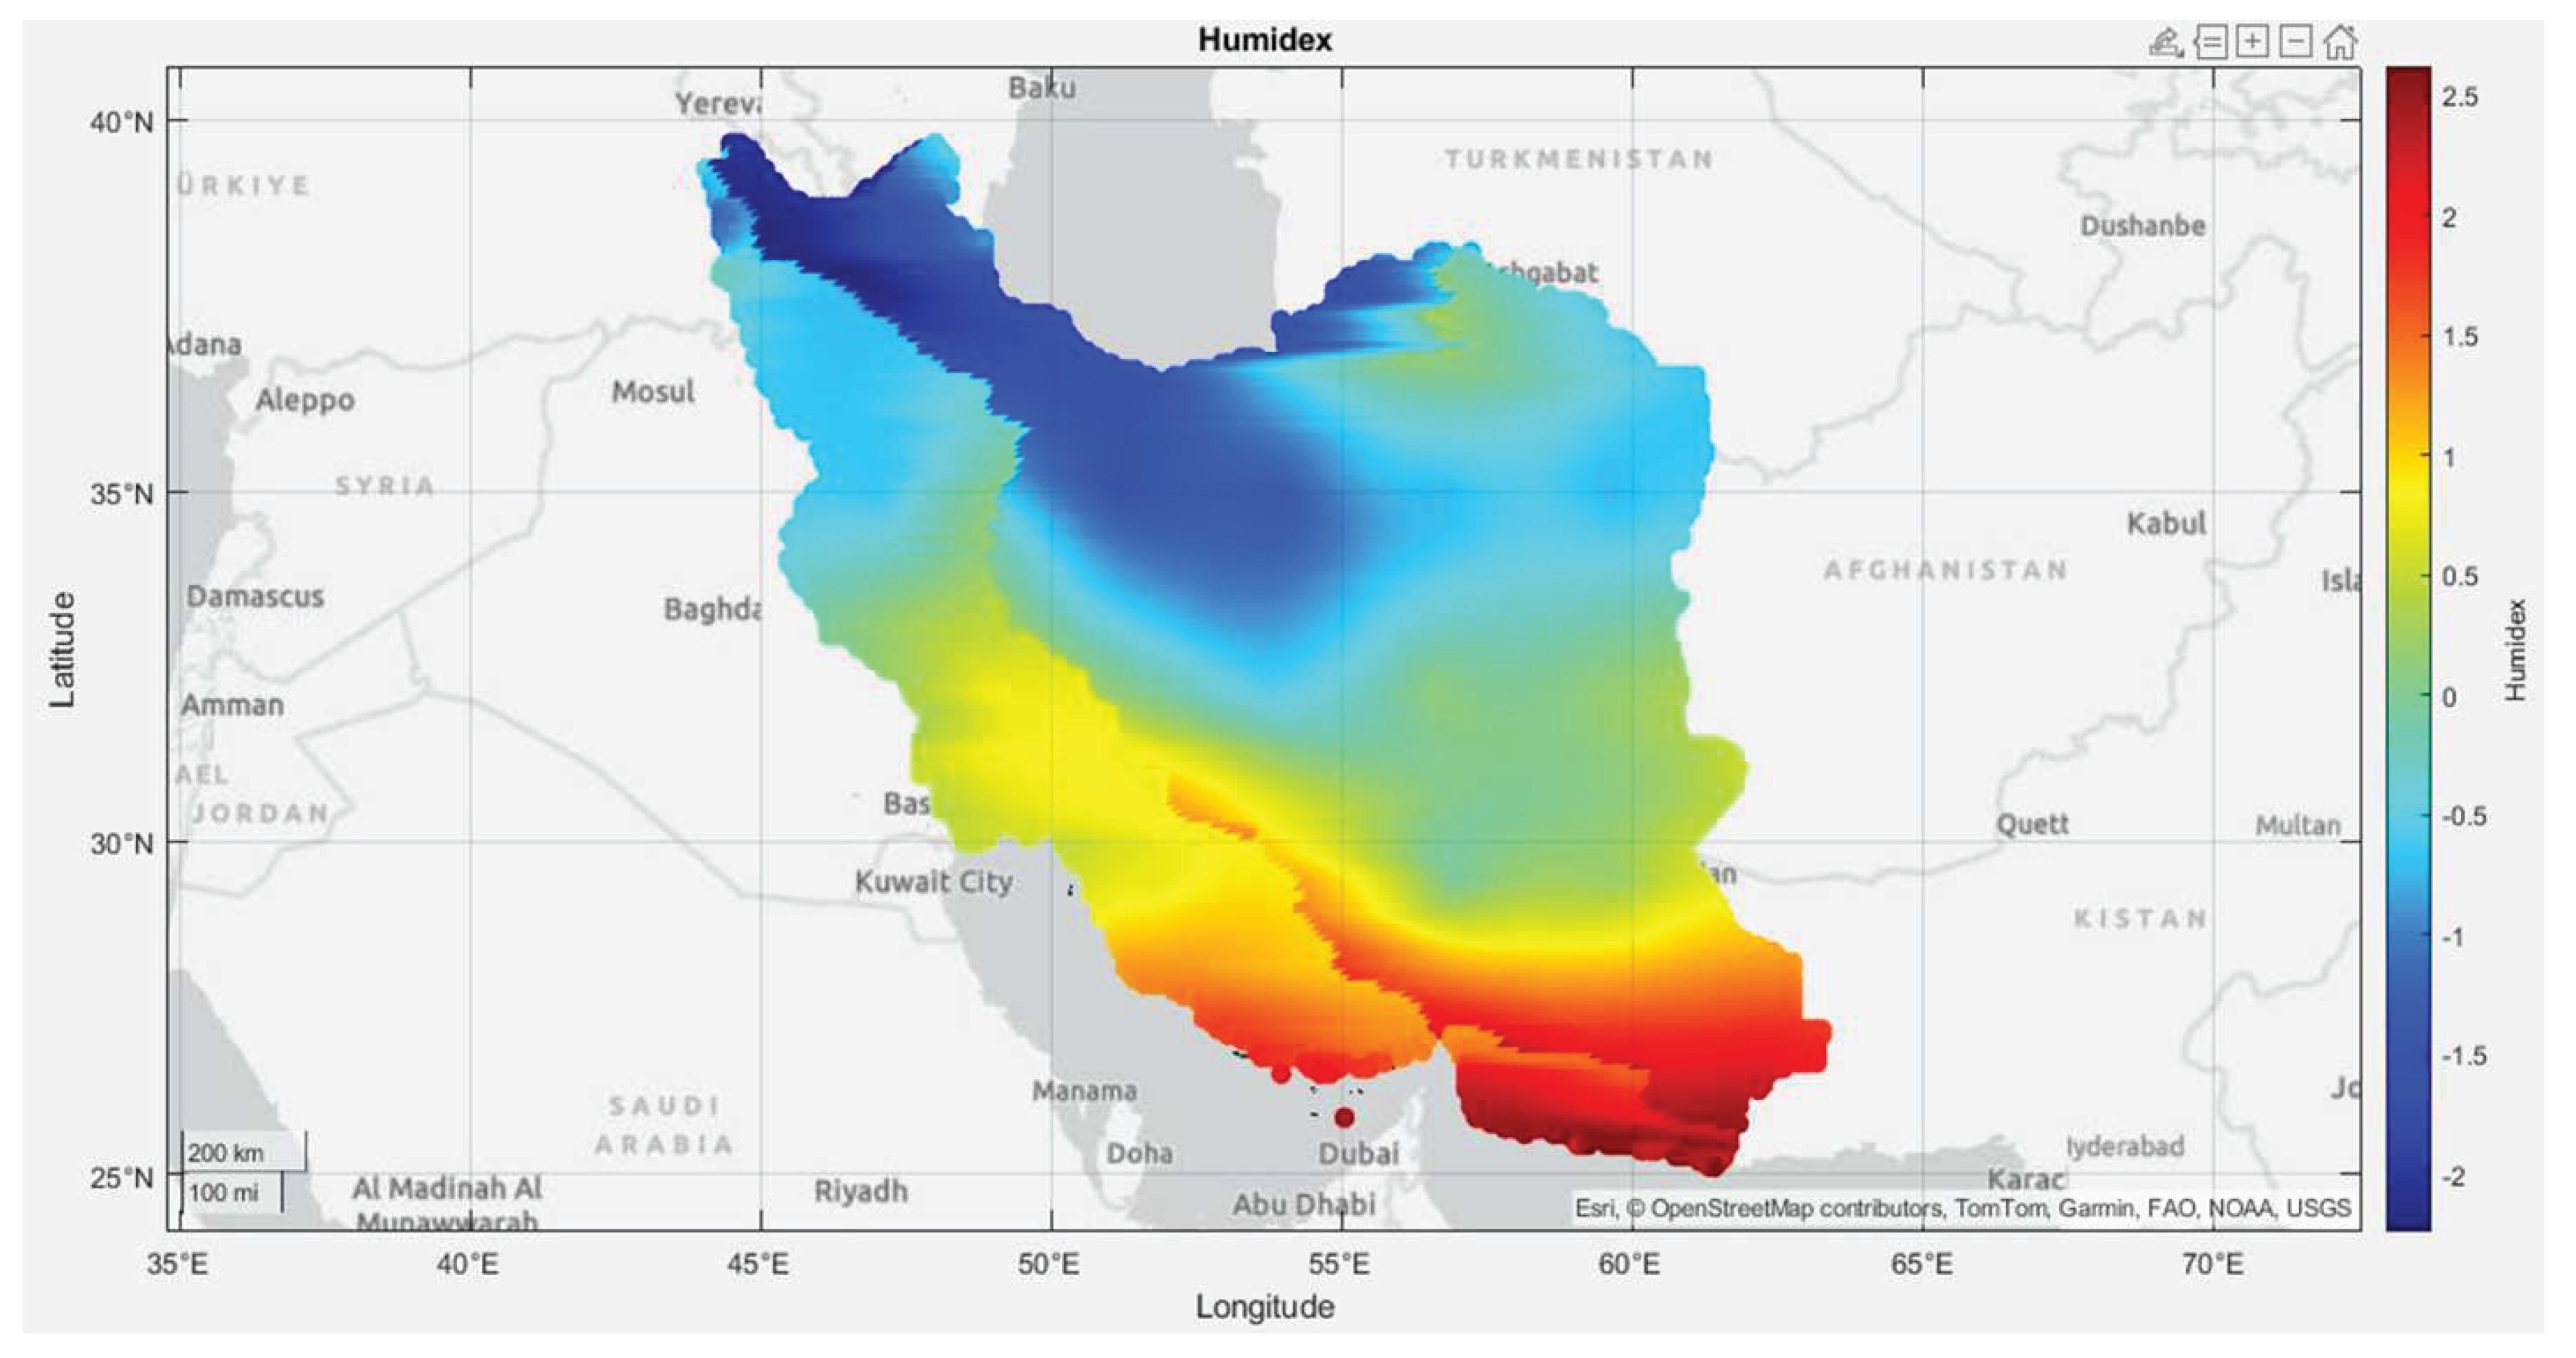
Figure 5.
Distribution of PMV using spatial modeling in Iran.
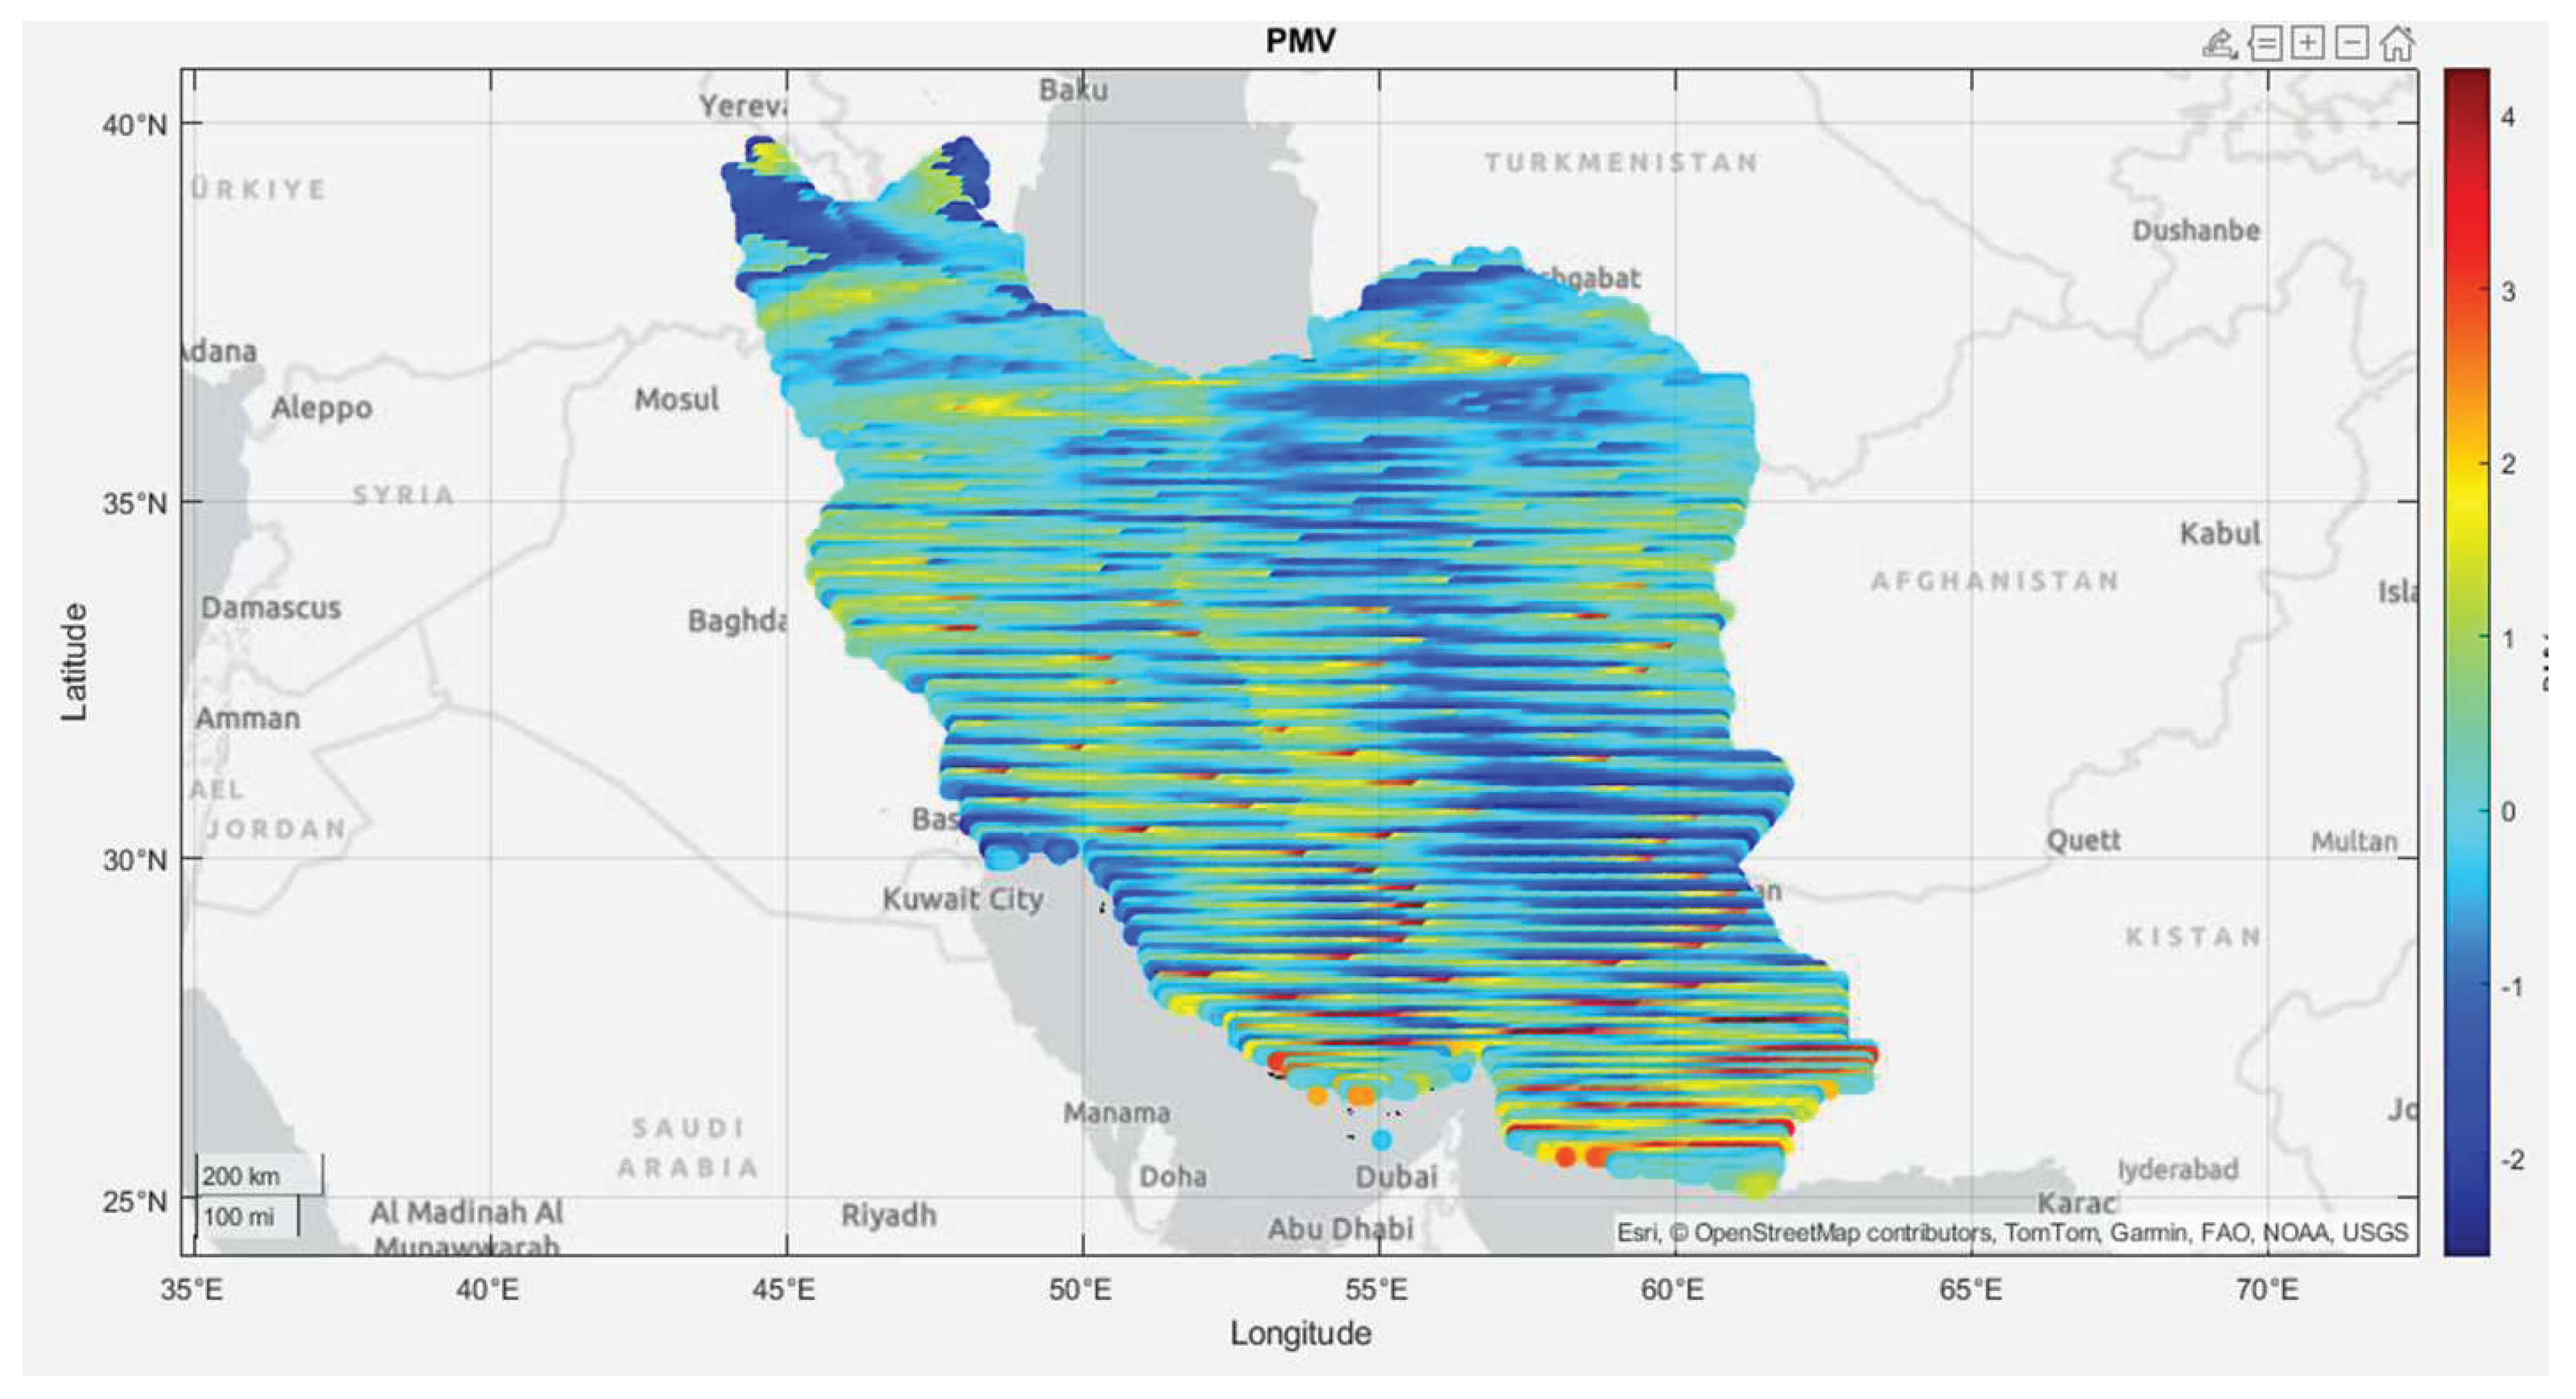
Figure 6.
Spatial Distribution of Summer Days using spatial modeling in Iran.
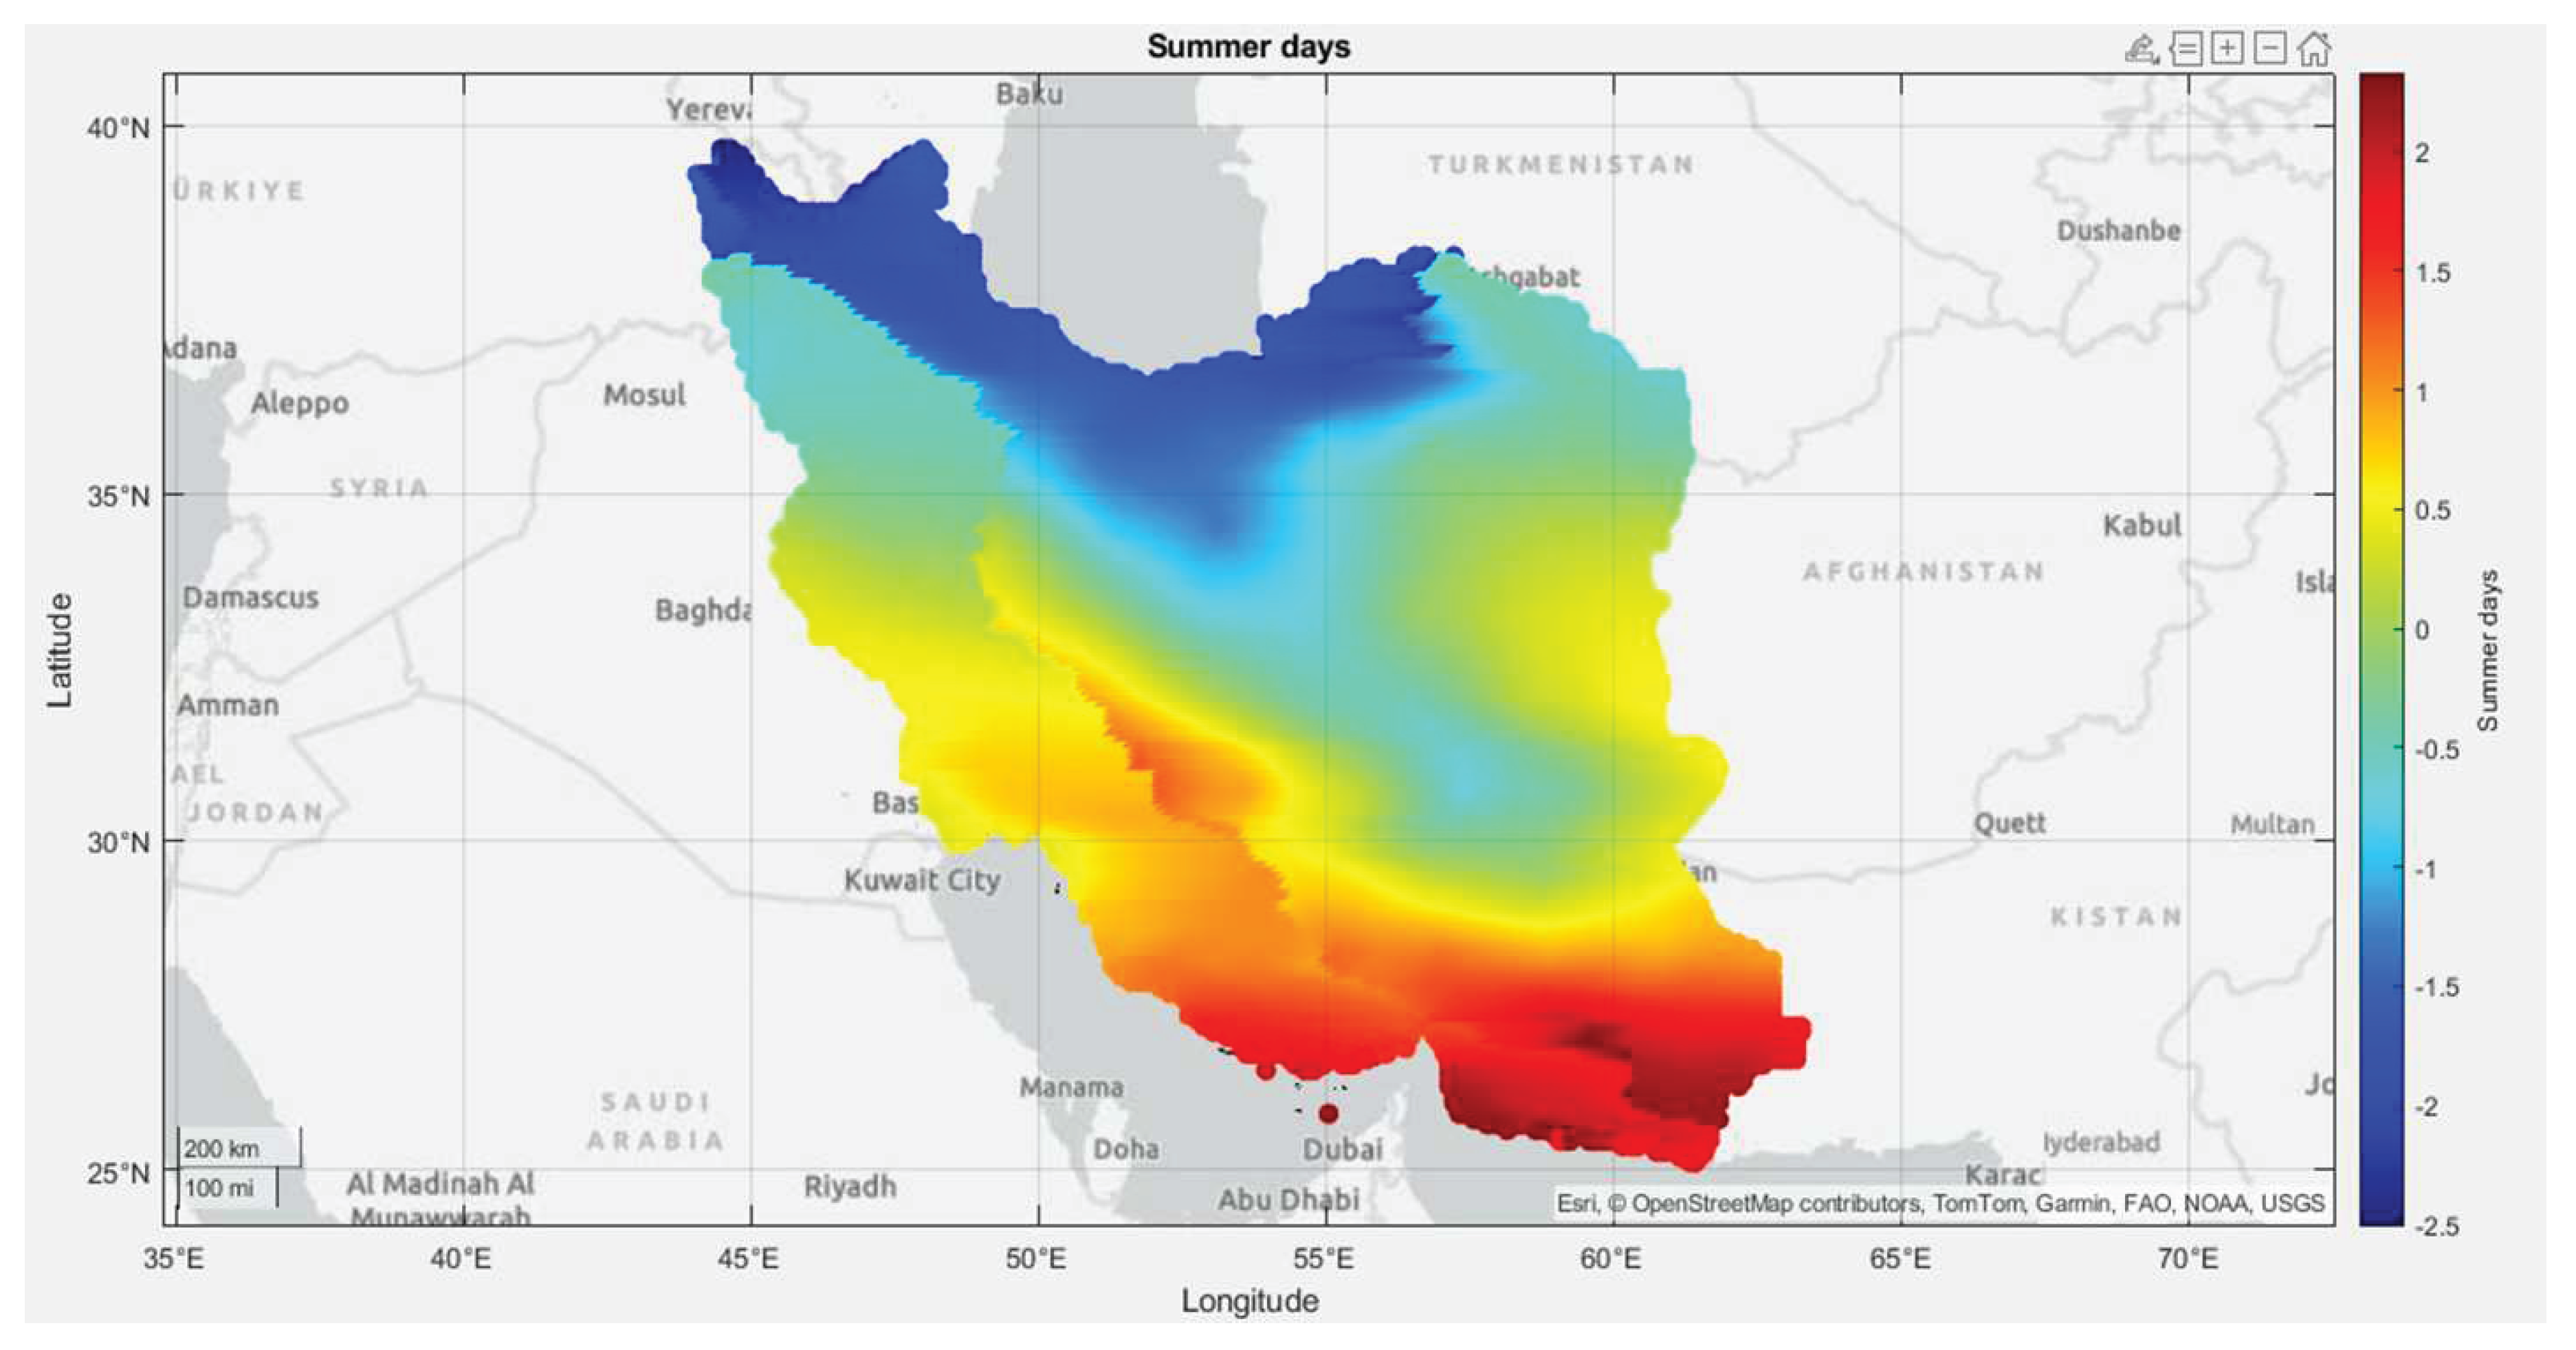
Figure 7.
Spatial Distribution of the Warm Nights Index using spatial modeling in Iran.
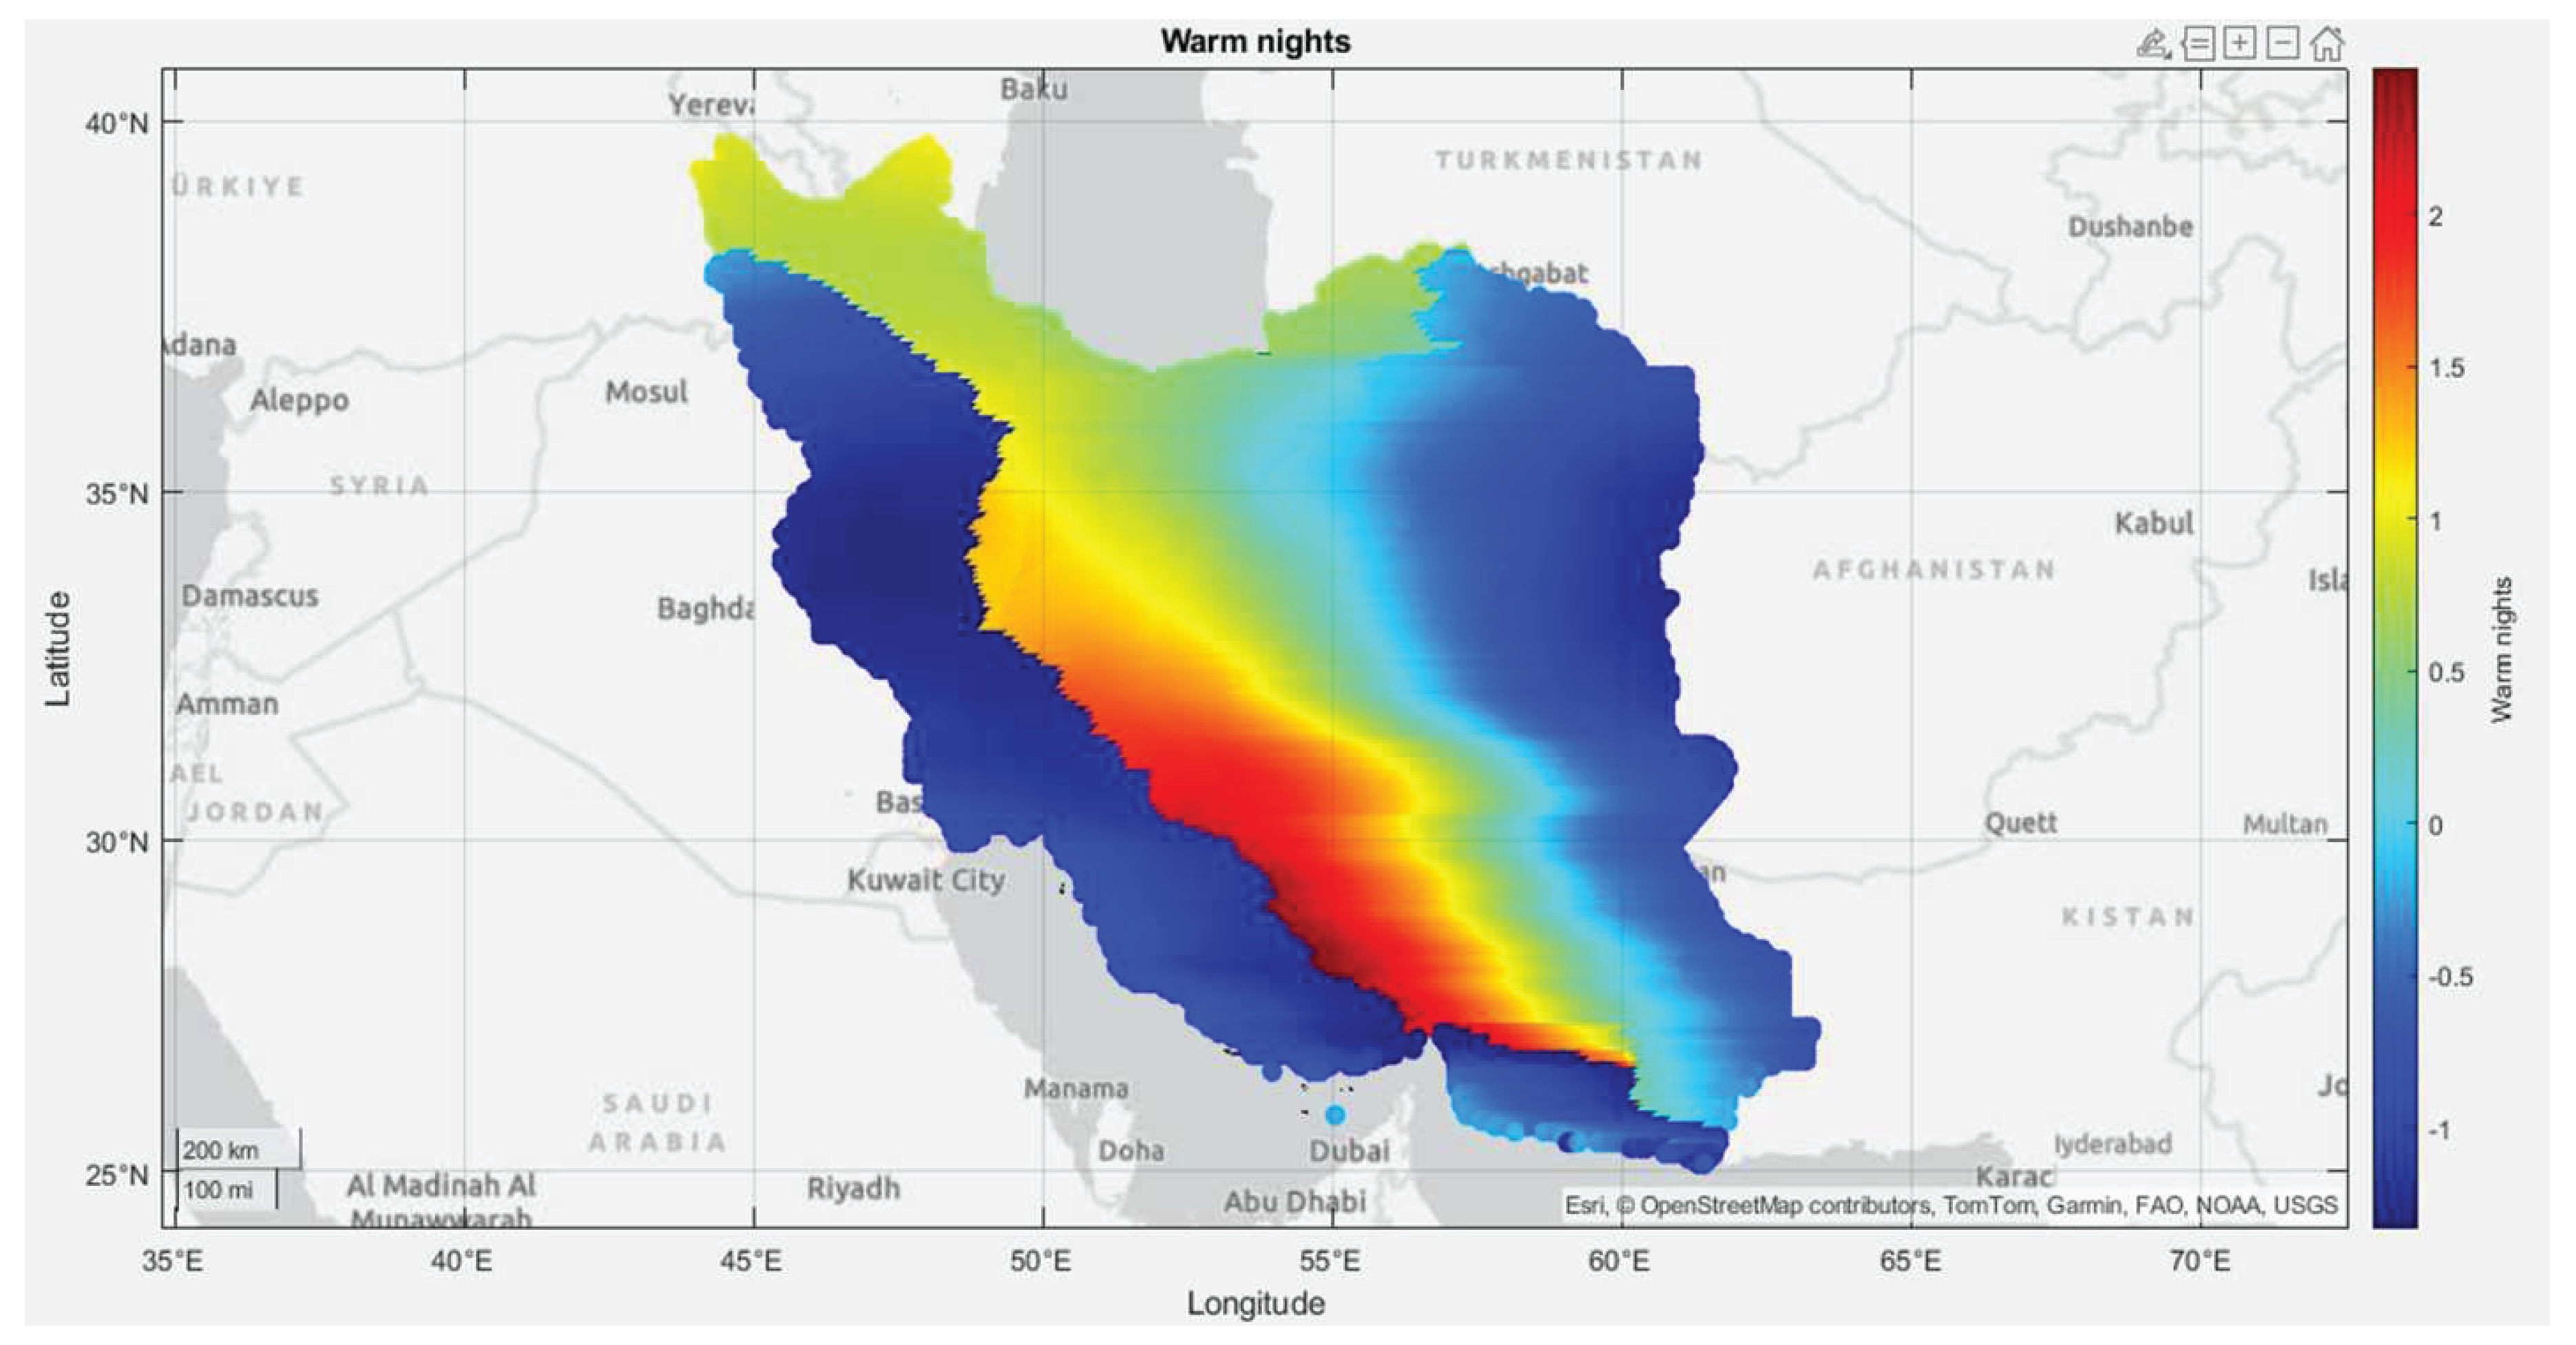
Figure 8.
Spatial Diversity of UTCI Comfort Zones using spatial modeling in Iran.
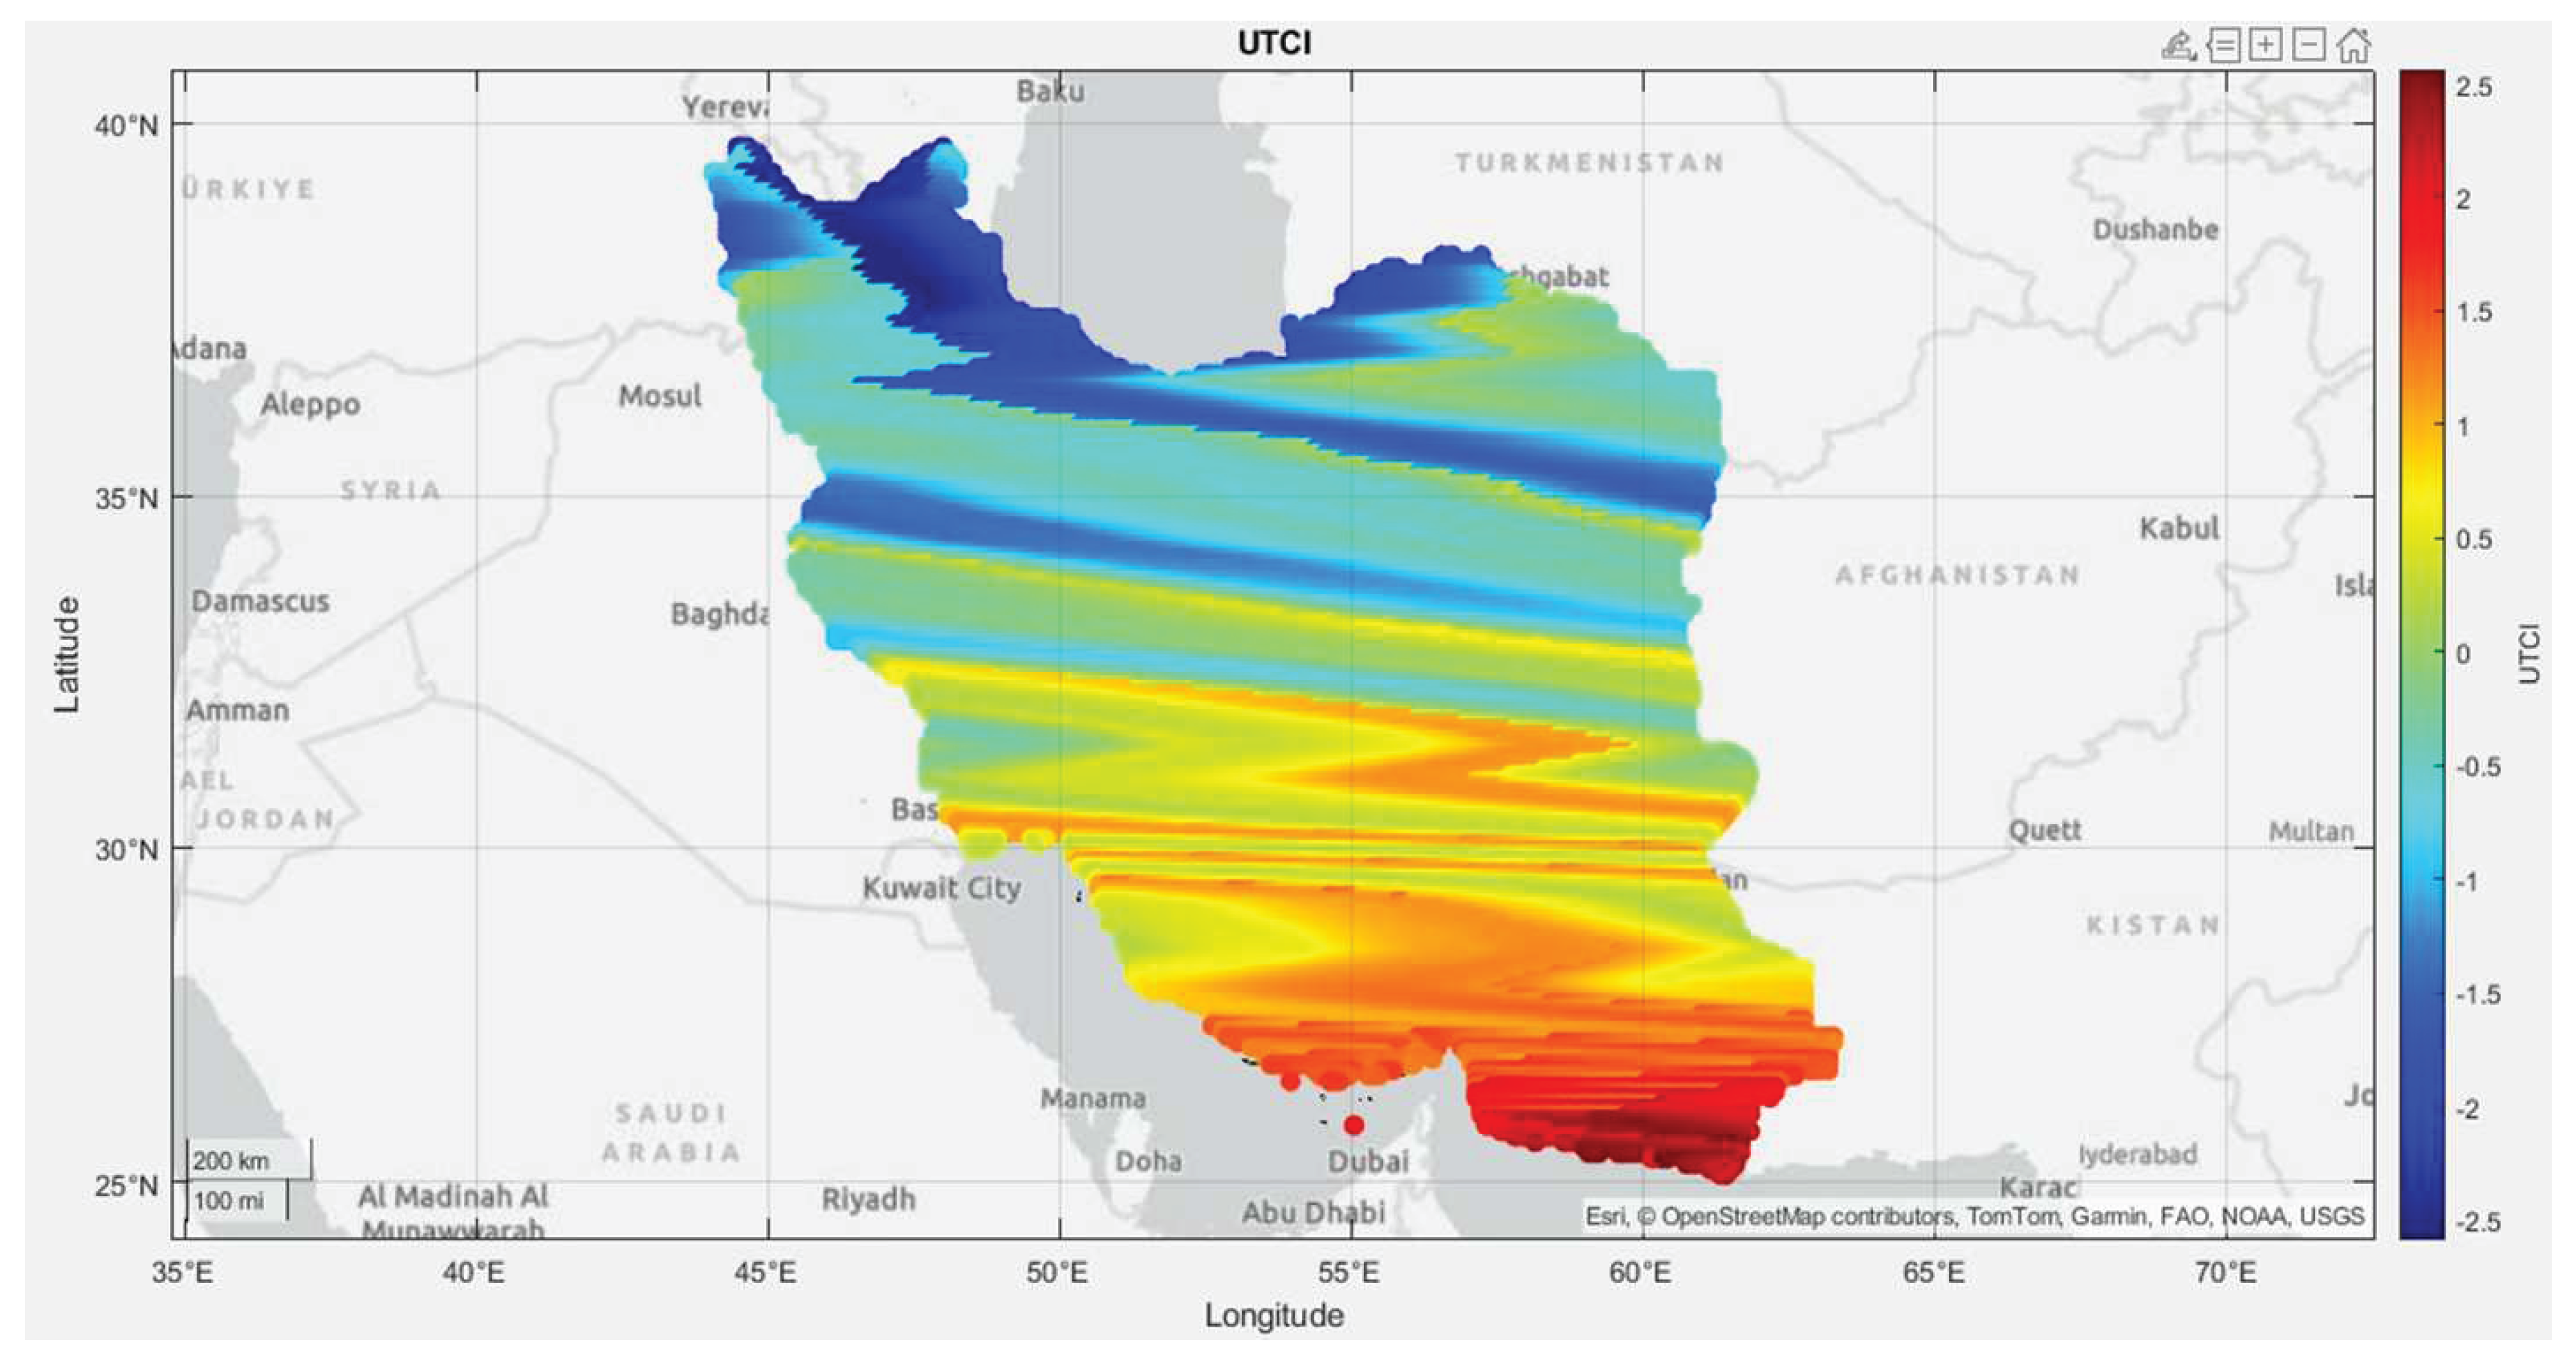
Figure 9.
WBGT Index Across Various Regions of Iran using spatial modeling.
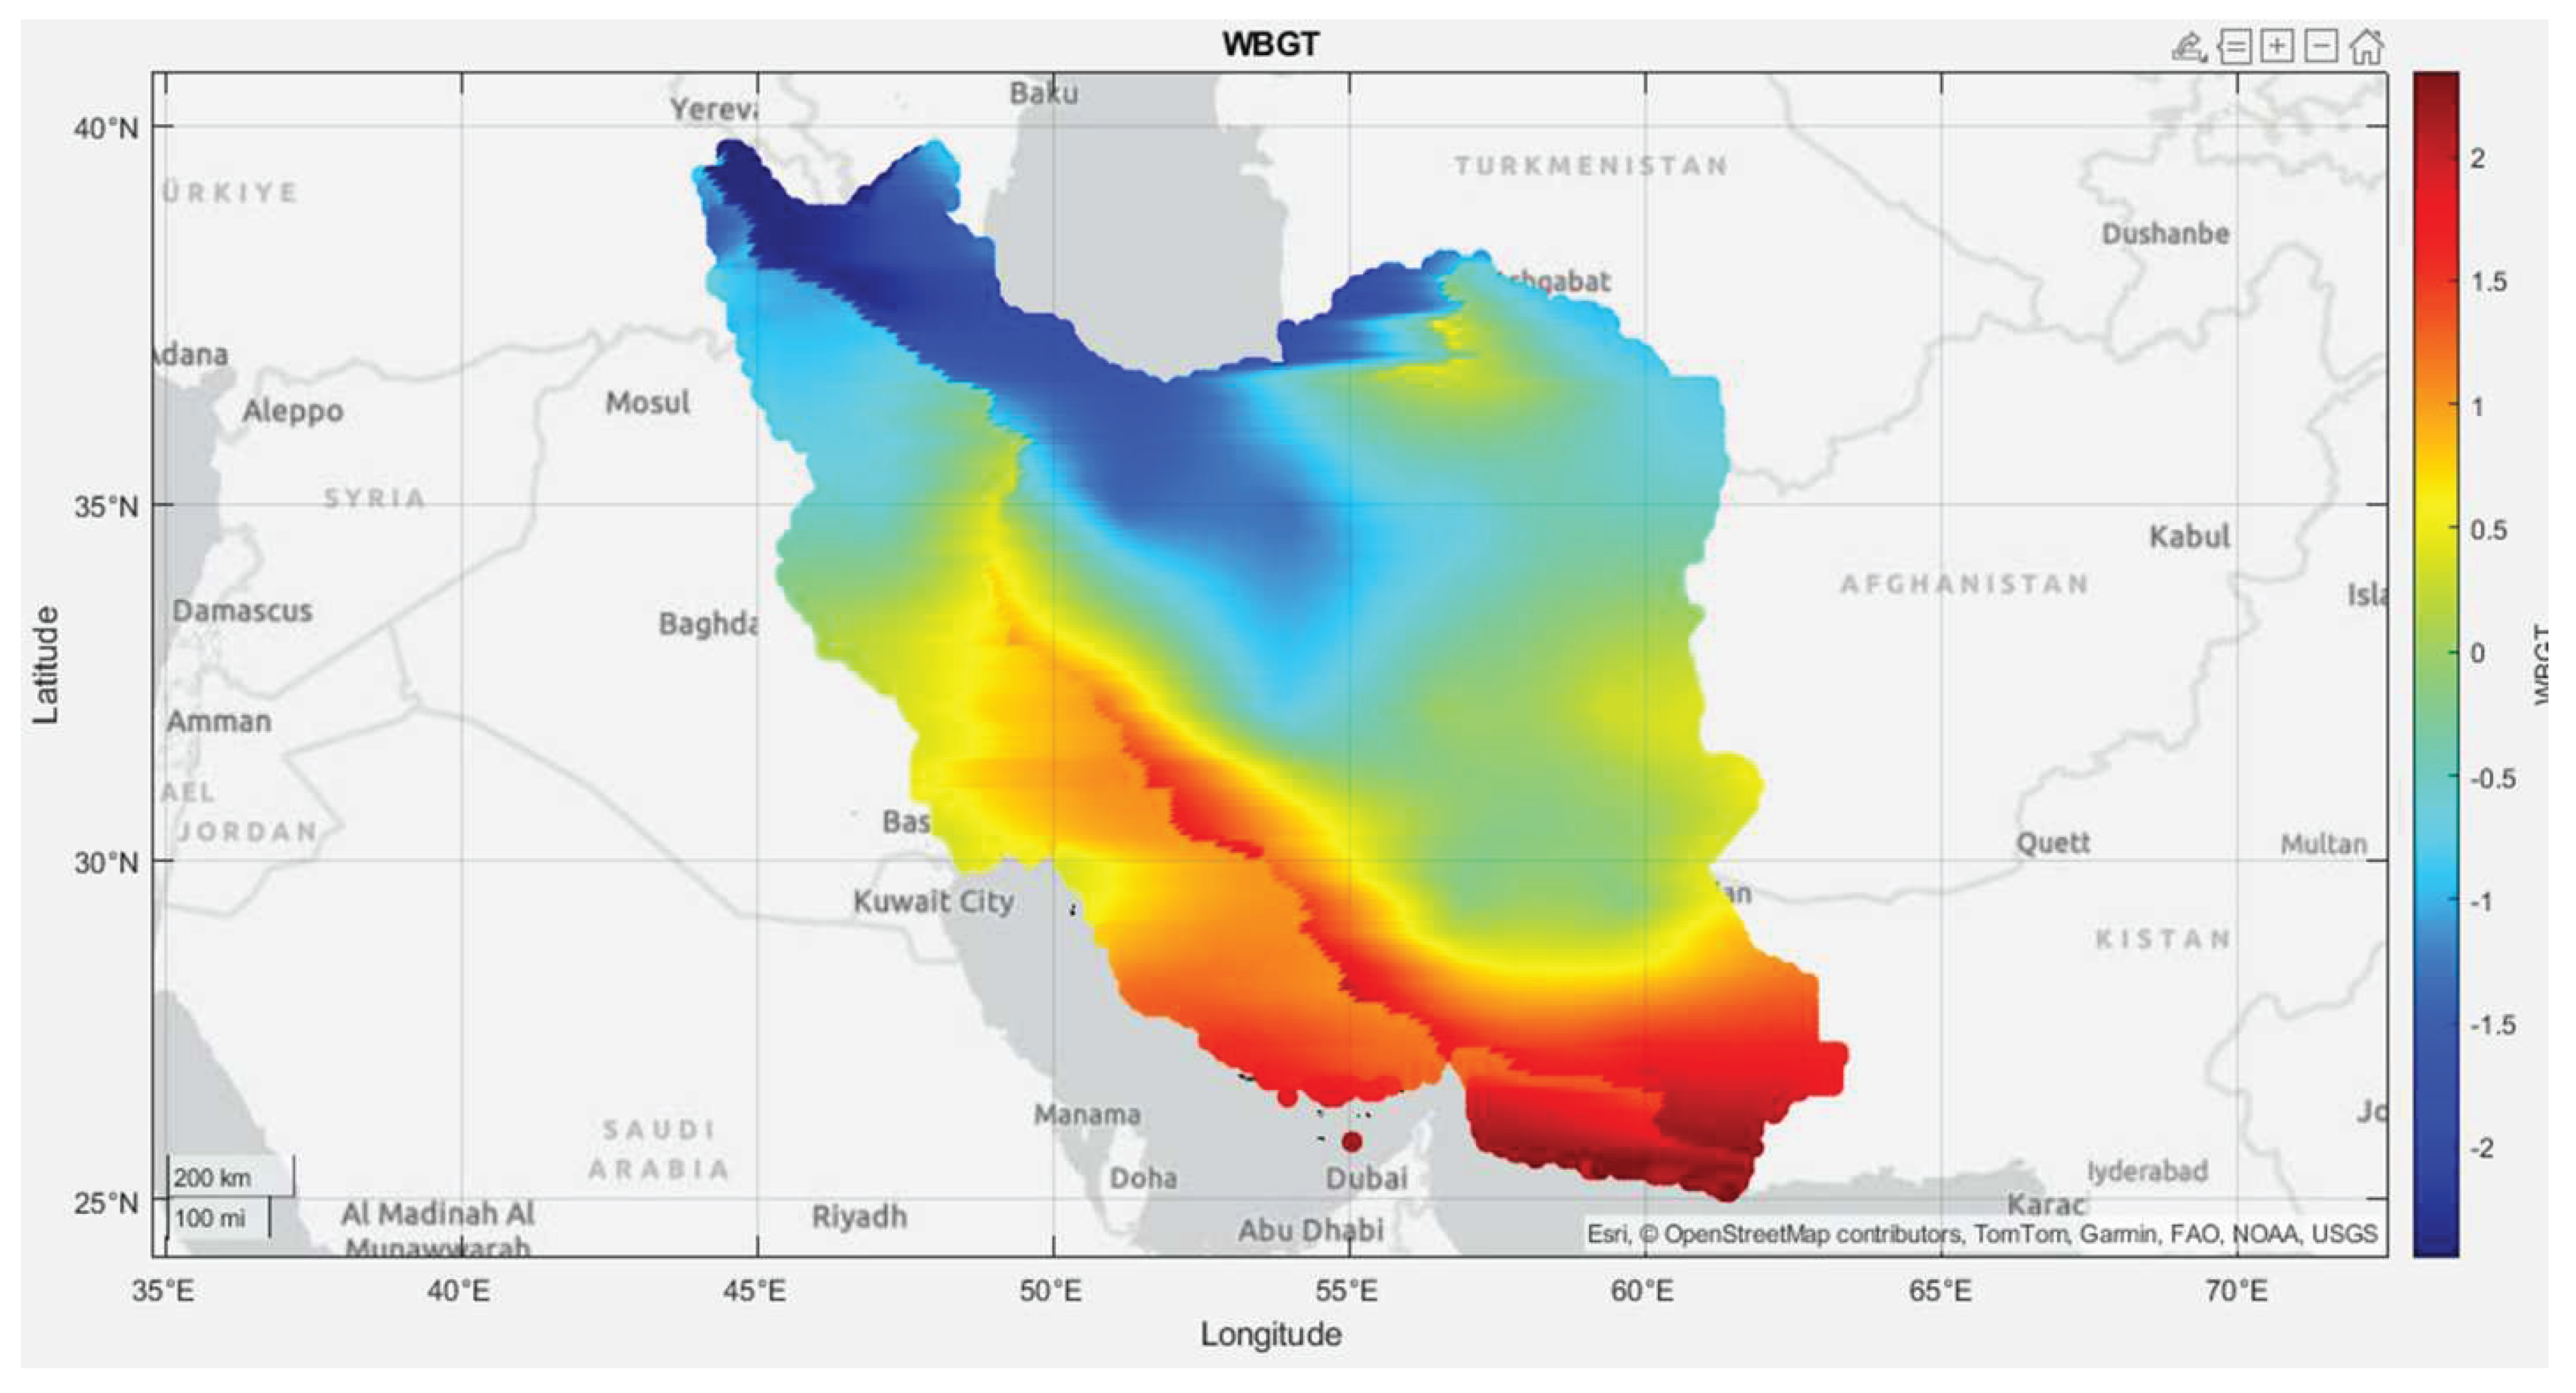
Figure 10.
Spatial Distribution of WSDI using spatial modeling in Iran.
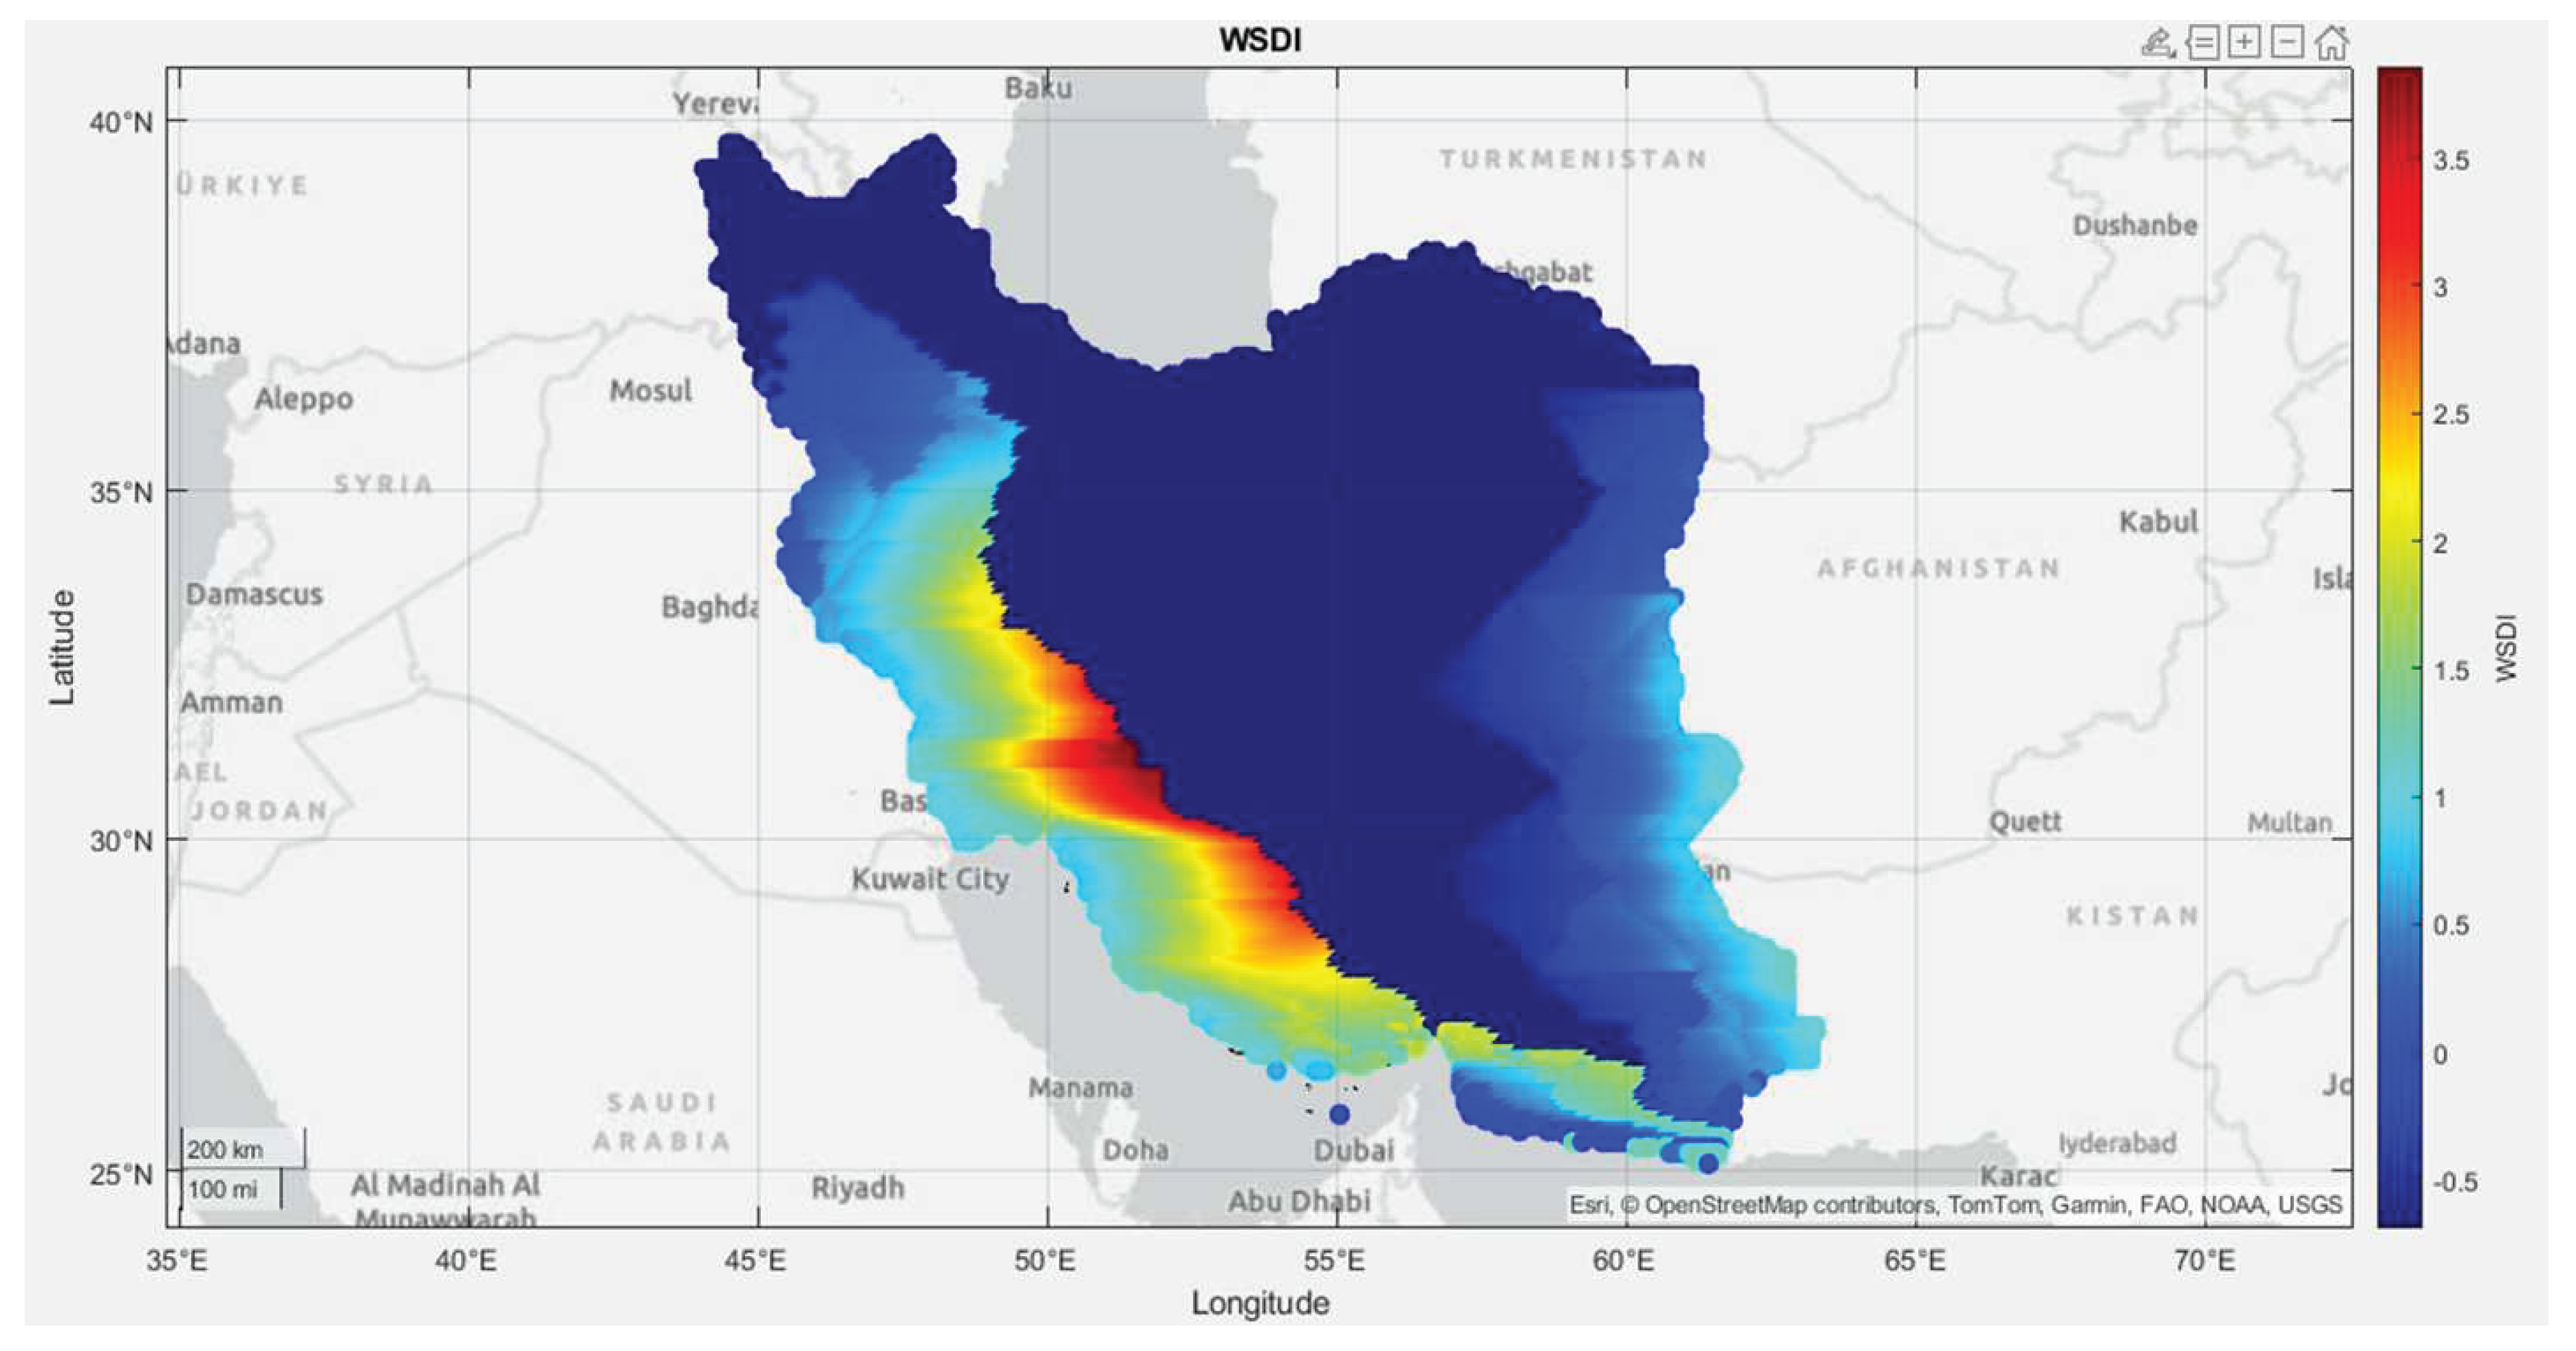
Figure 11.
Spatial Distribution of TDI across Iran using spatial modeling.
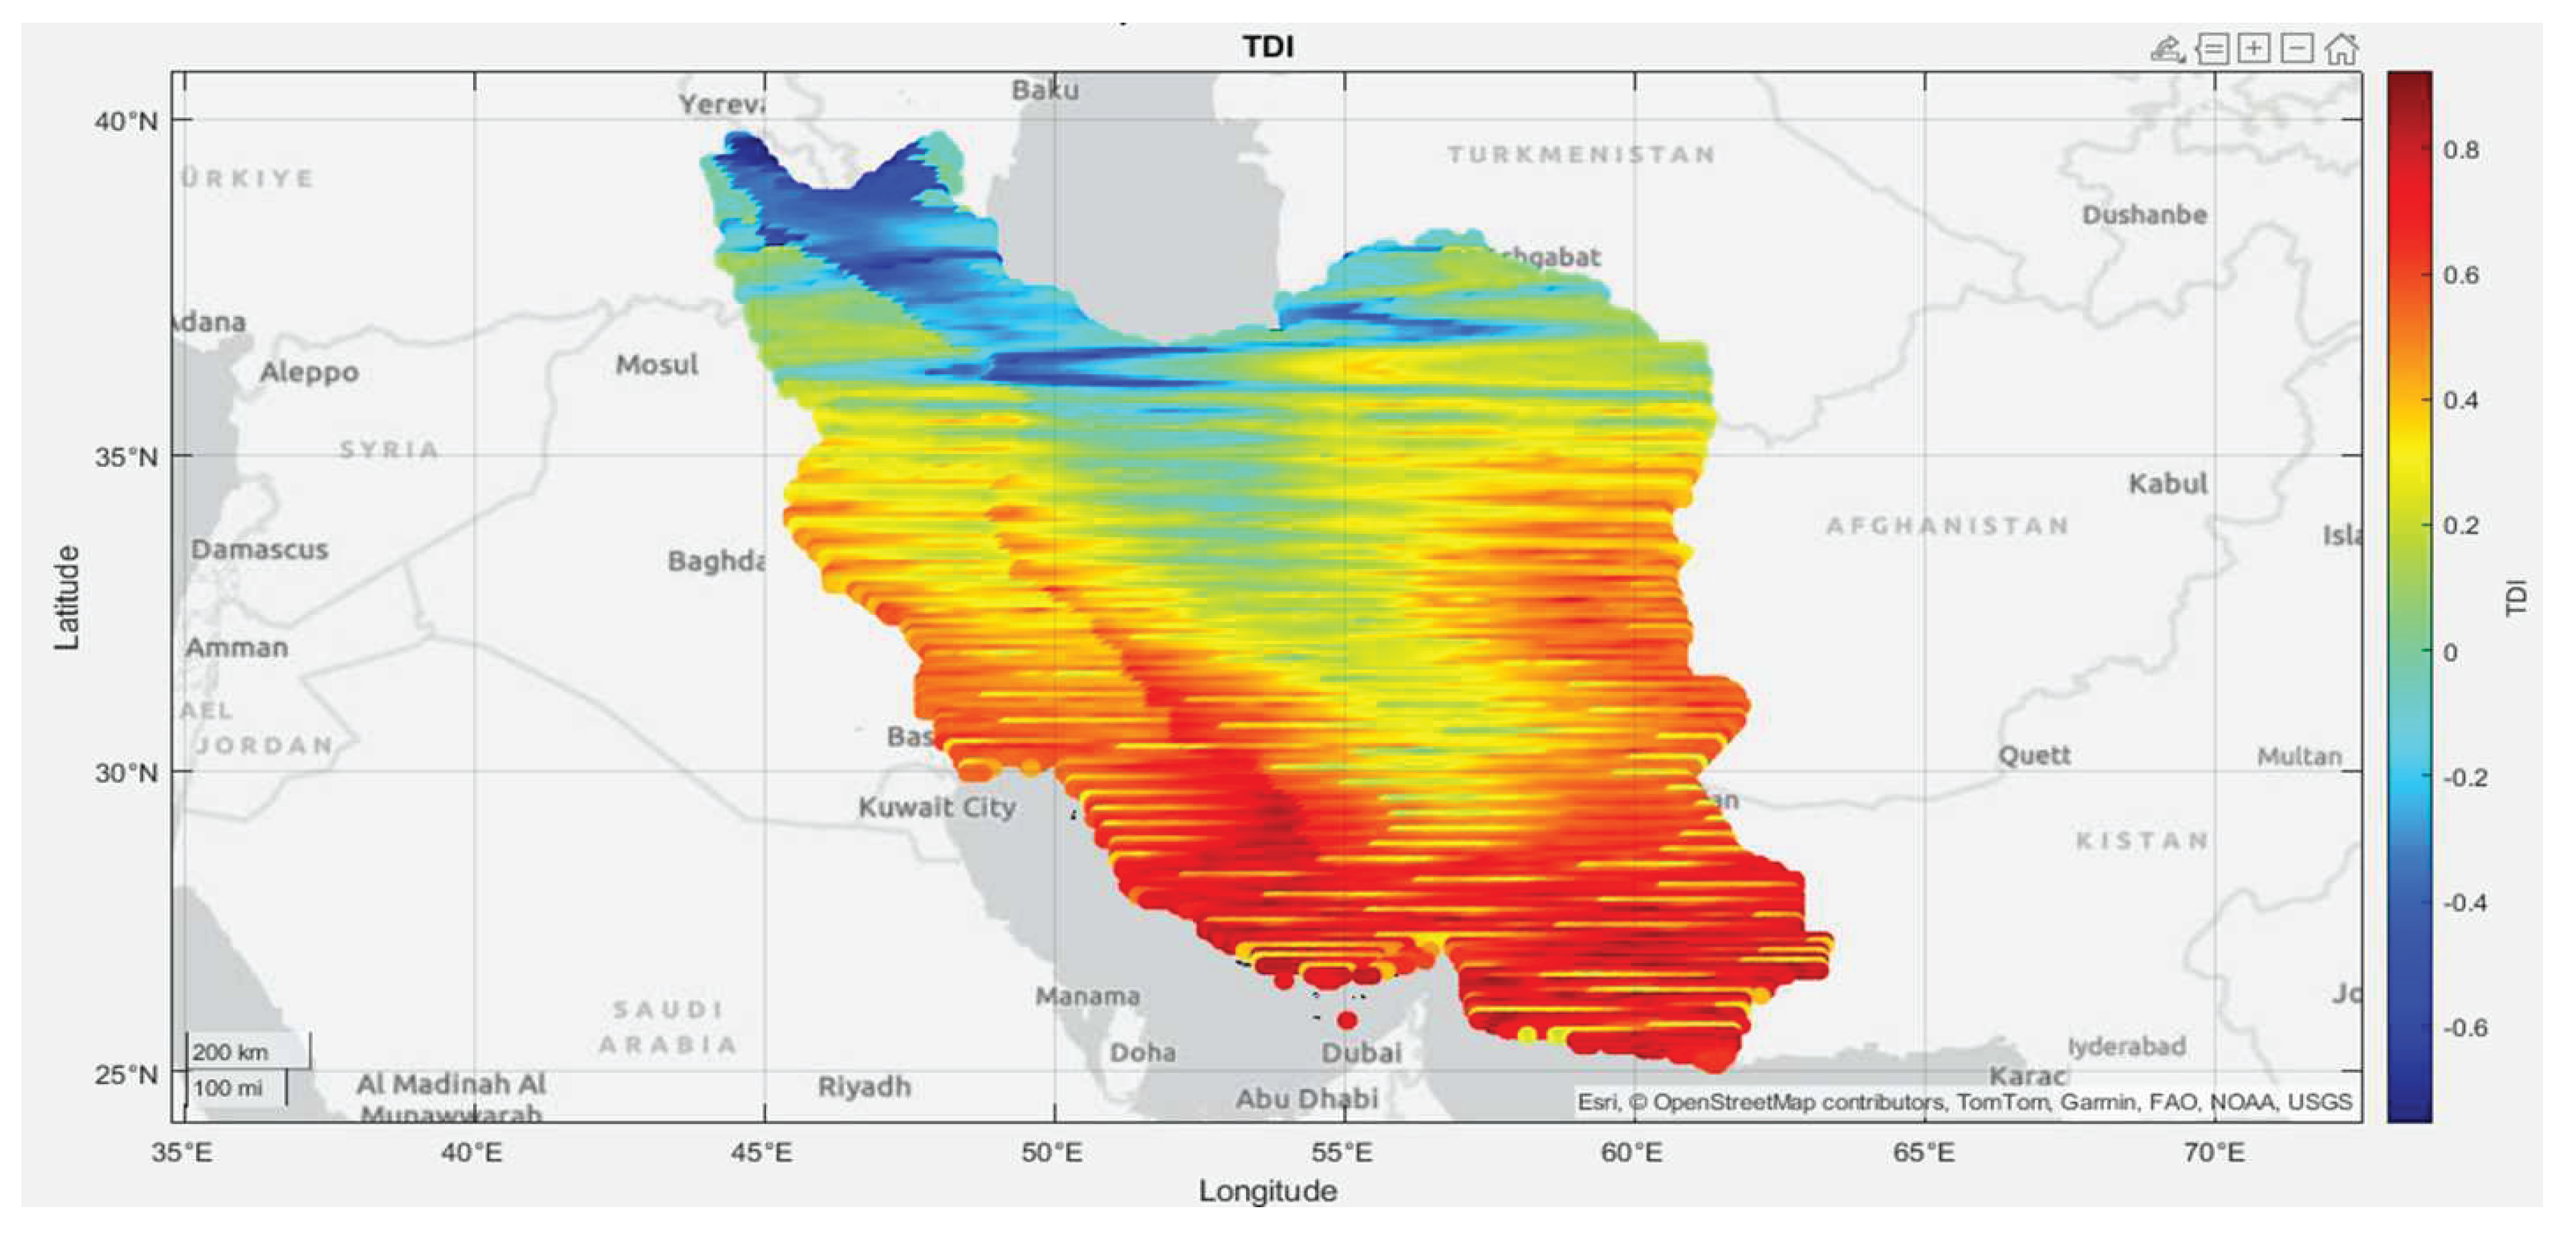
Figure 12.
Spatial Distribution of TDI across Iran using Random Forest modeling.
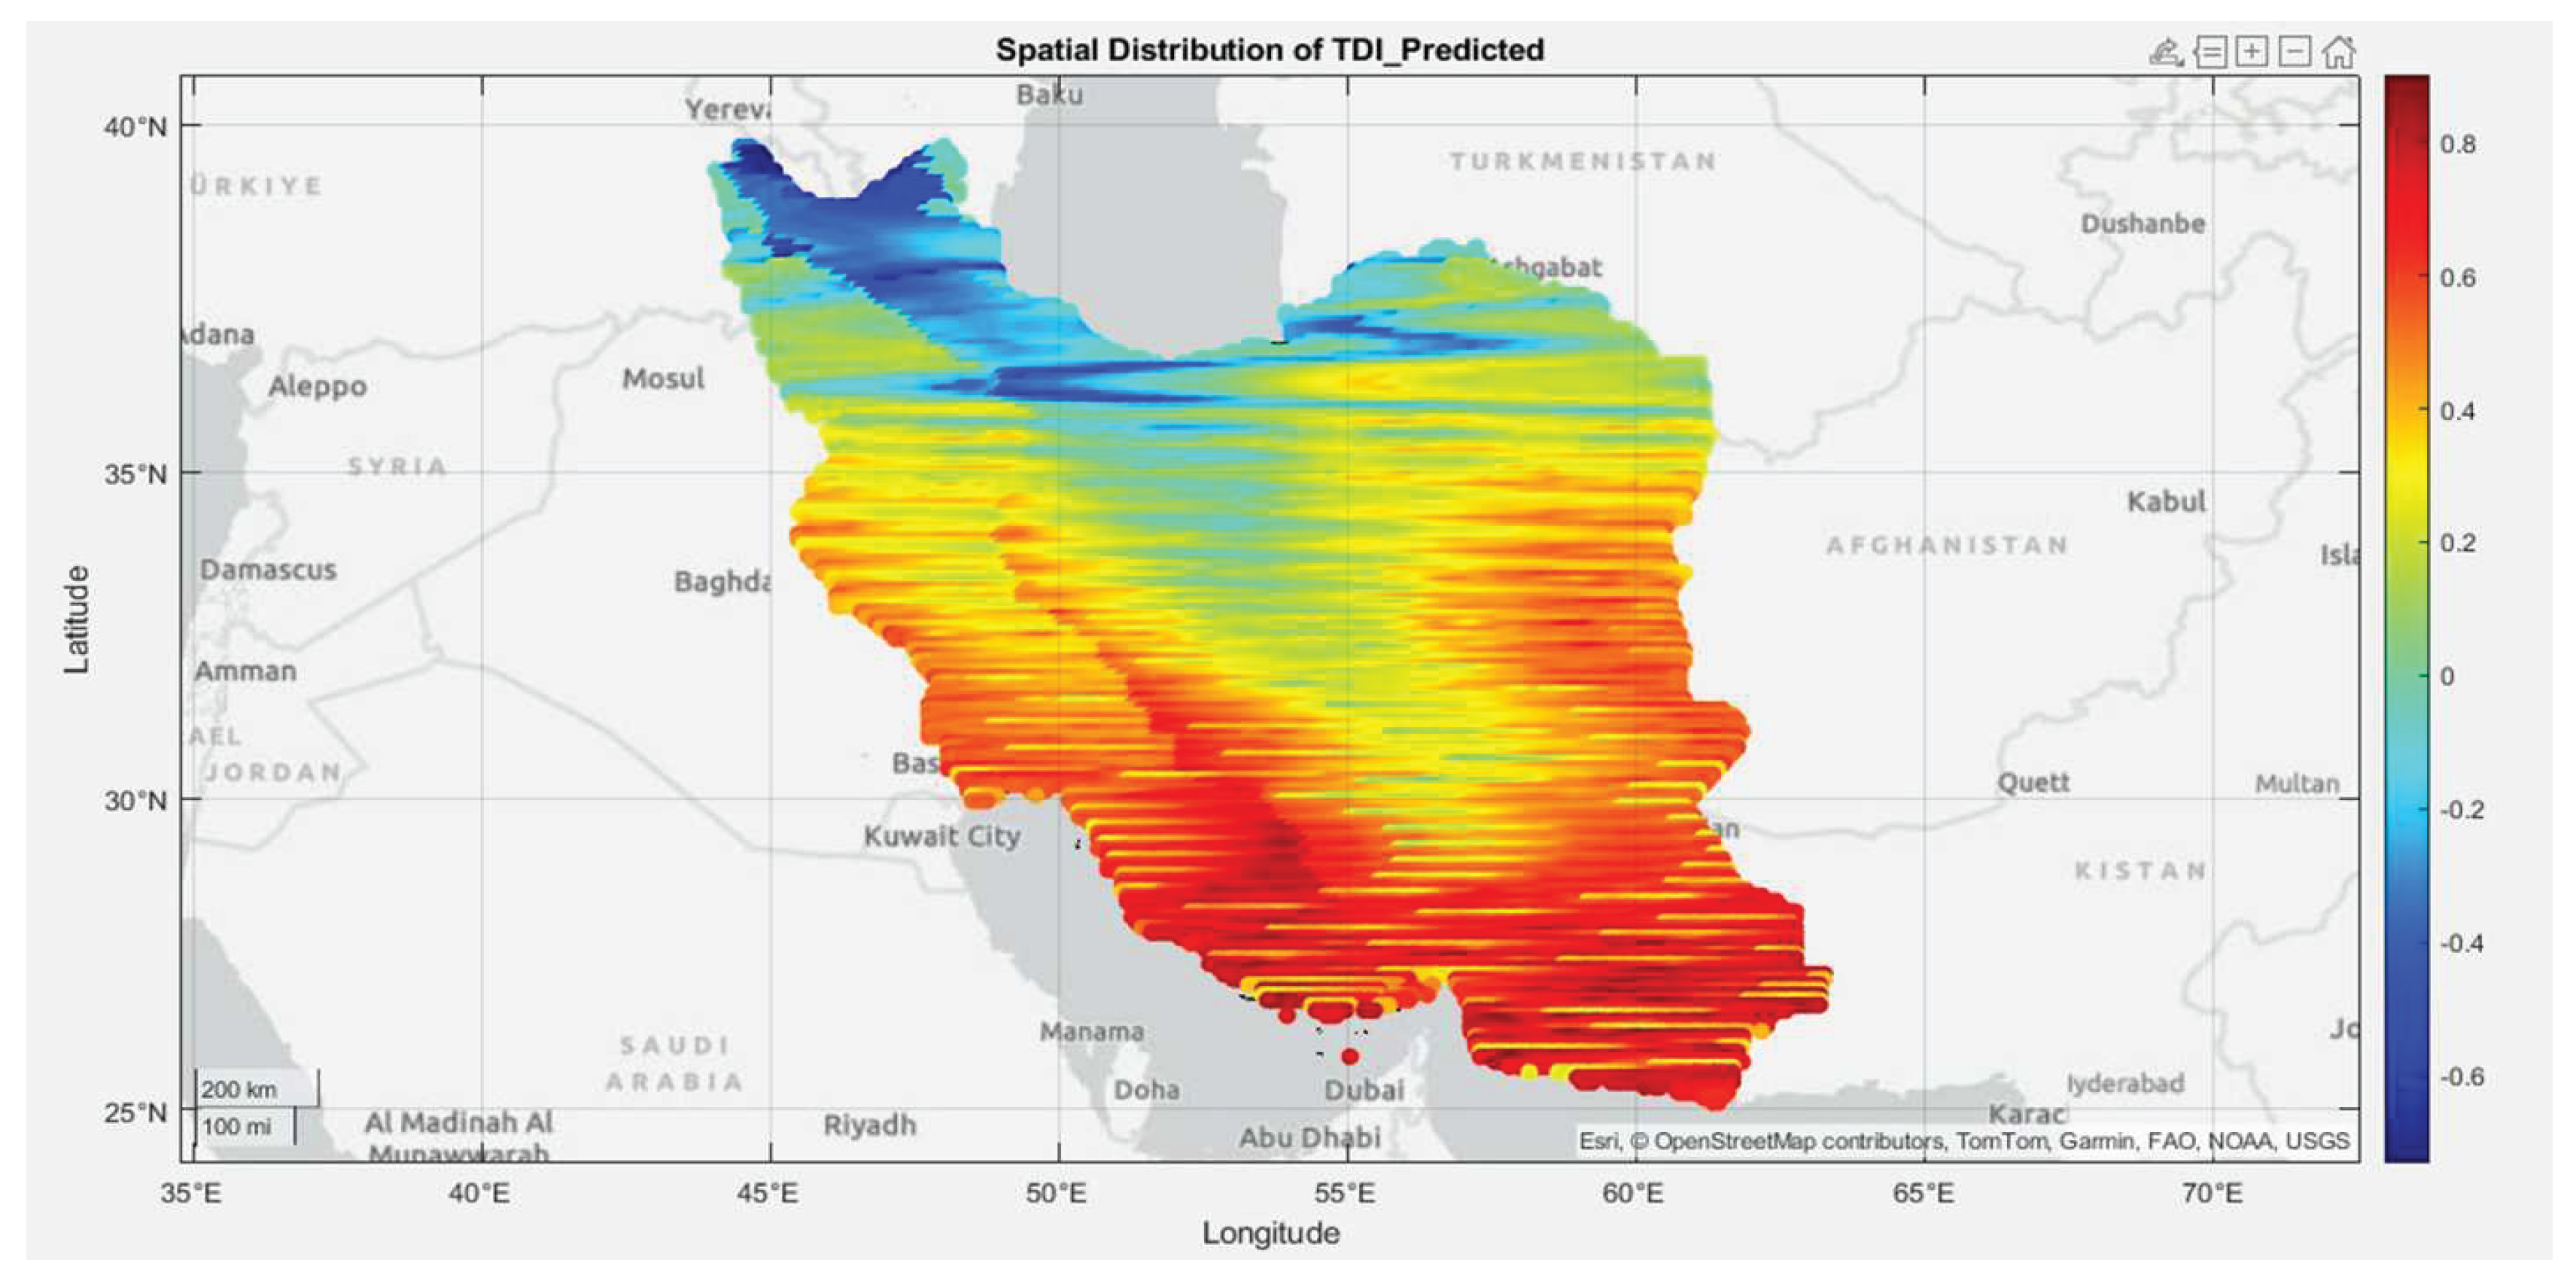
Figure 13.
Spatial Distribution of Humidex across Iran using Random Forest modeling.
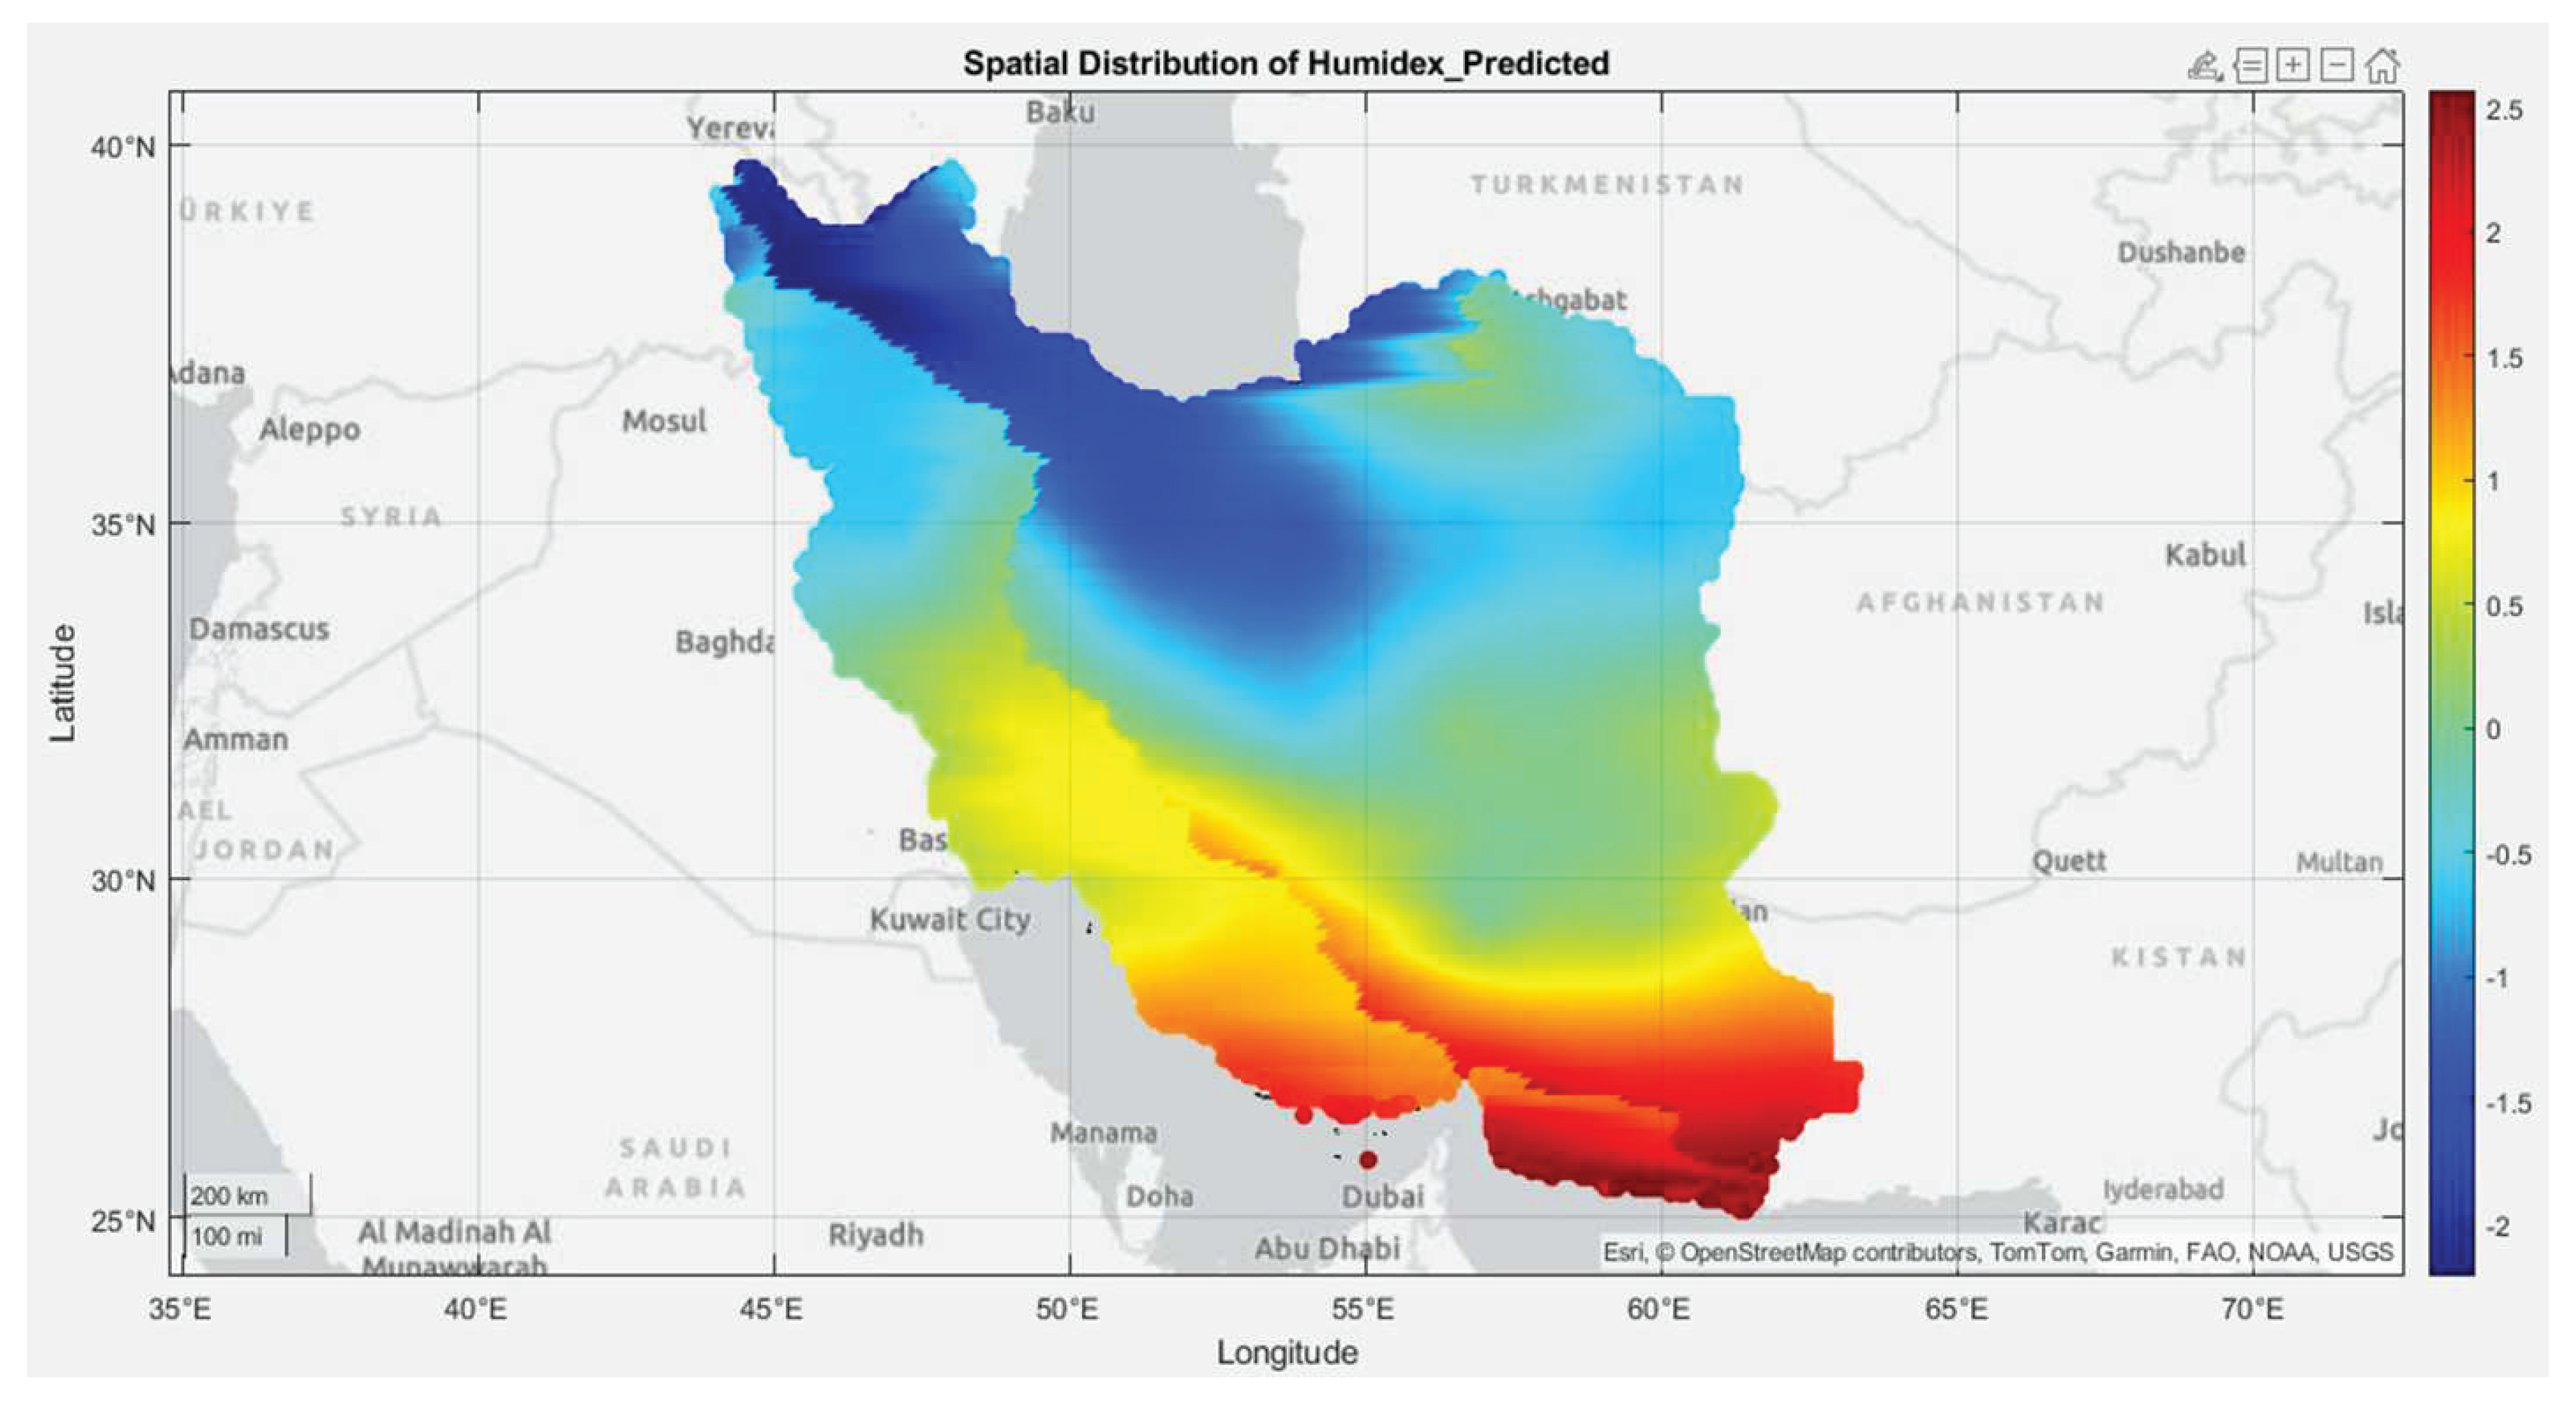
Figure 14.
Spatial Distribution of WBGT across Iran using Random Forest modeling.
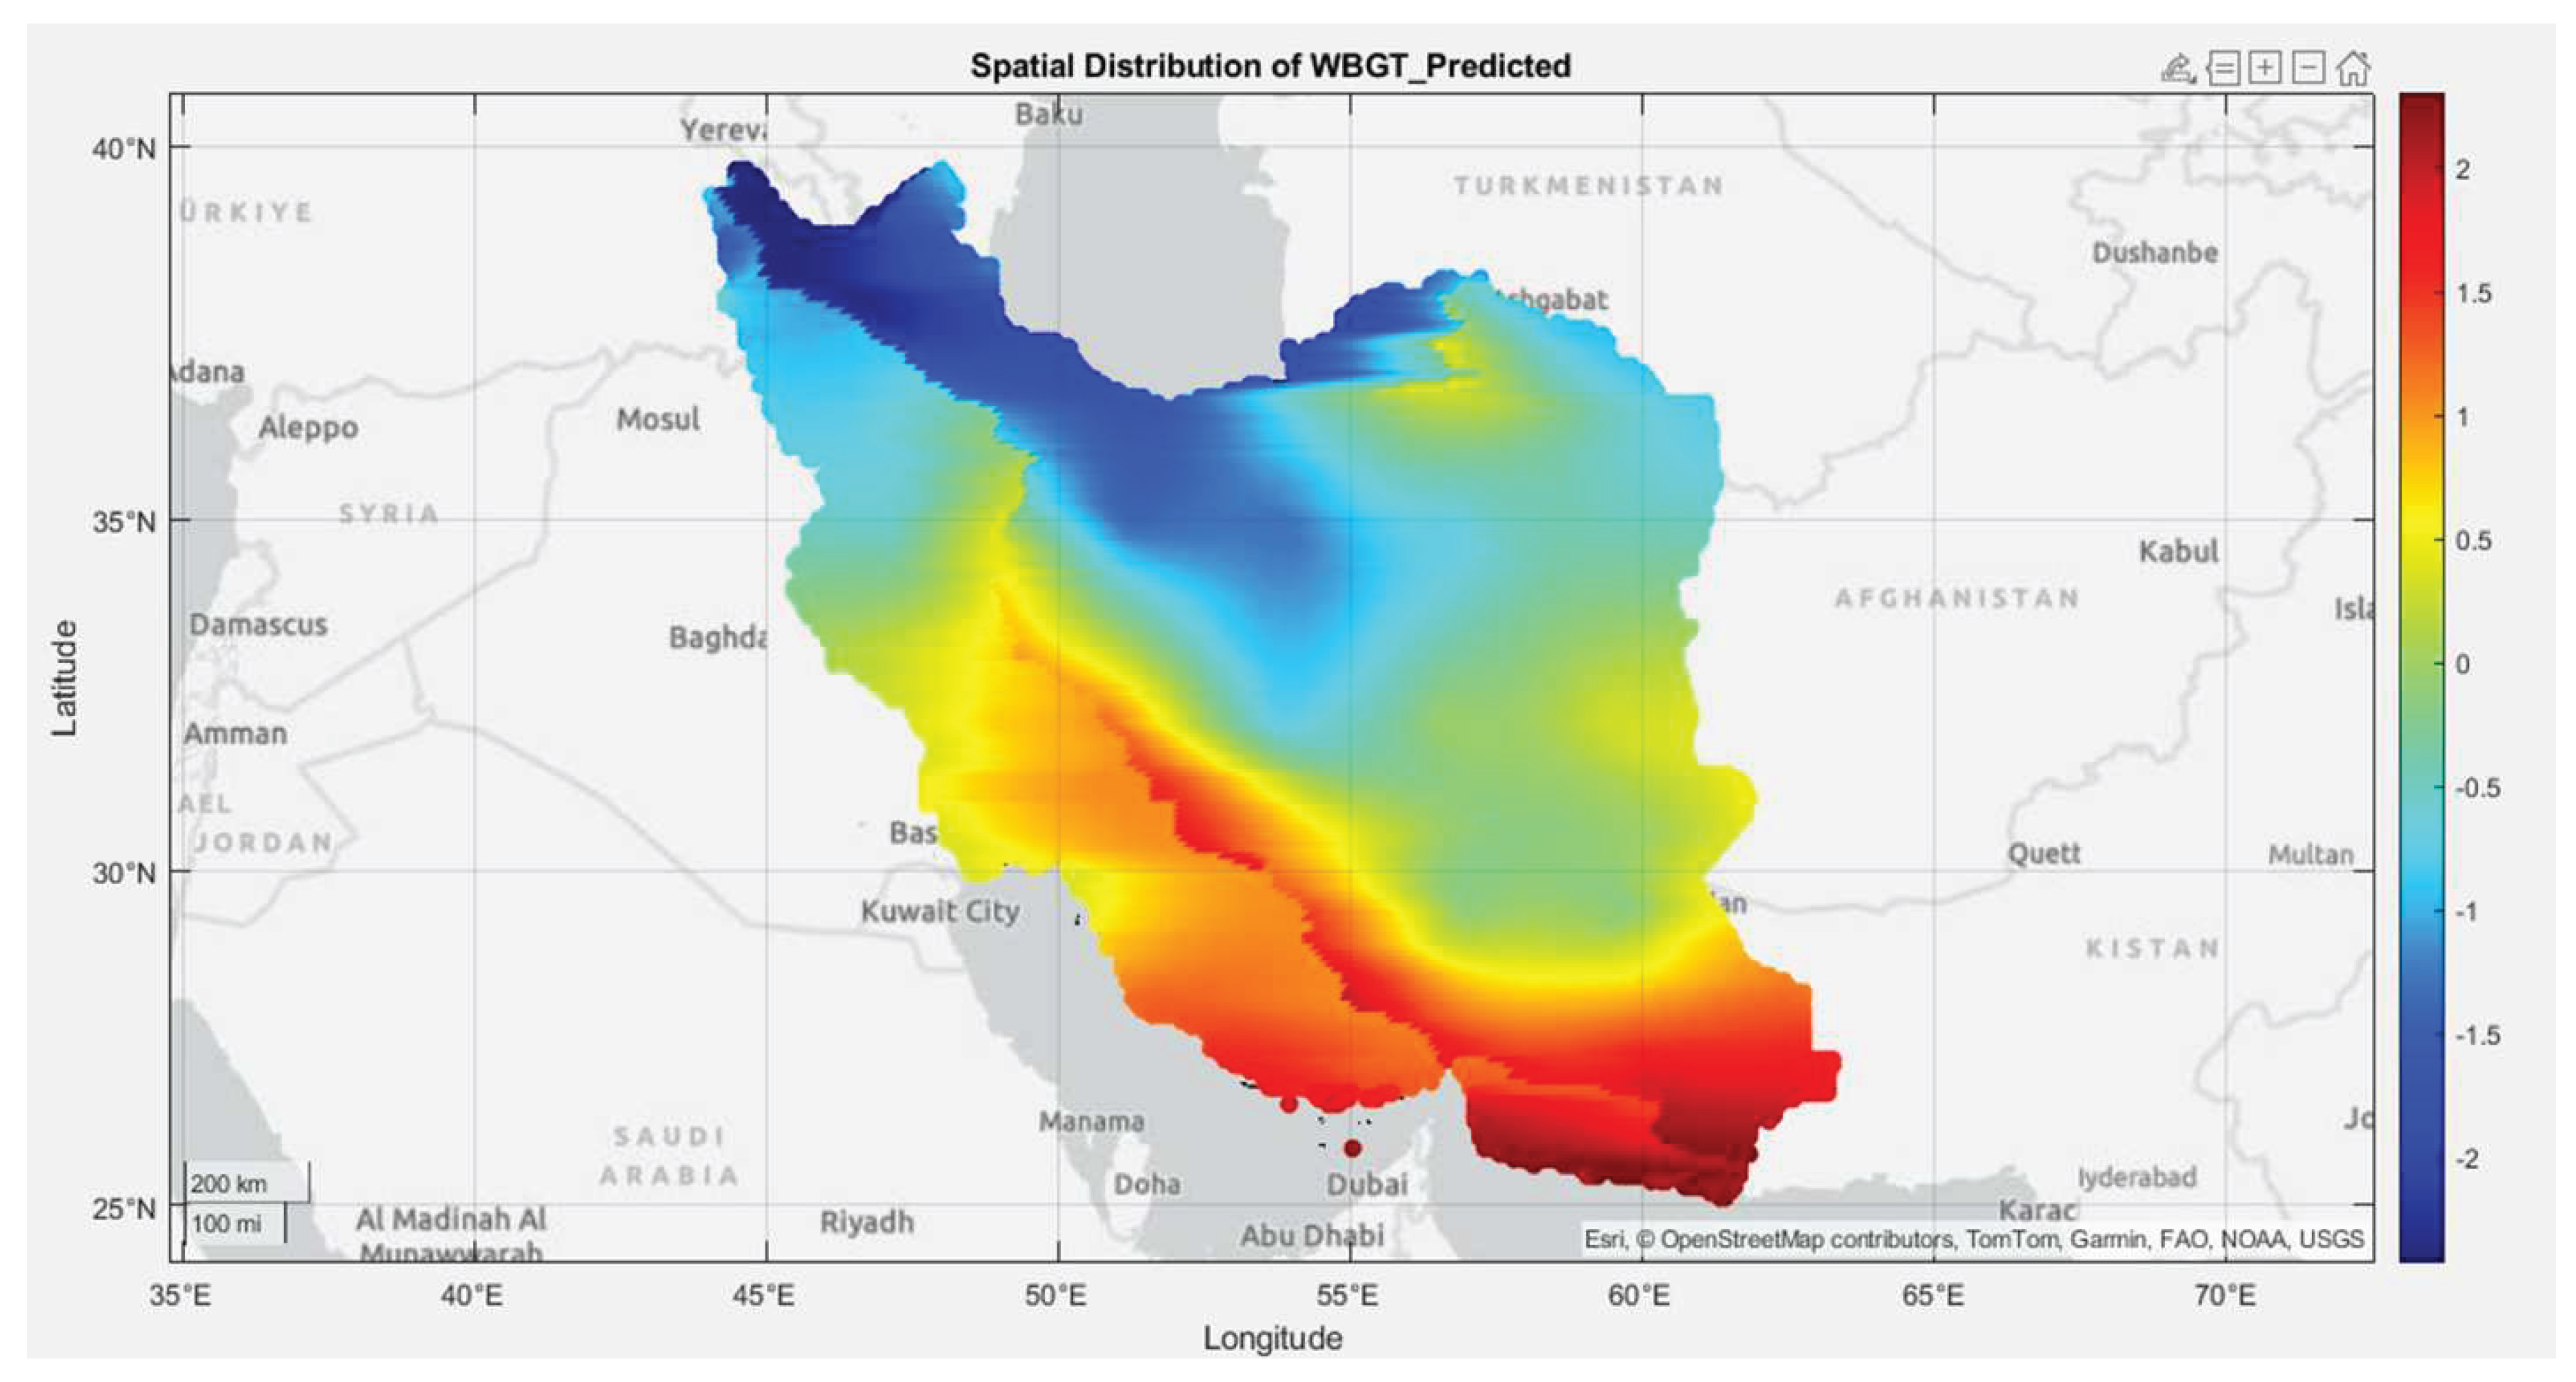
Figure 15.
Spatial Distribution of UTCI across Iran using Random Forest modeling.
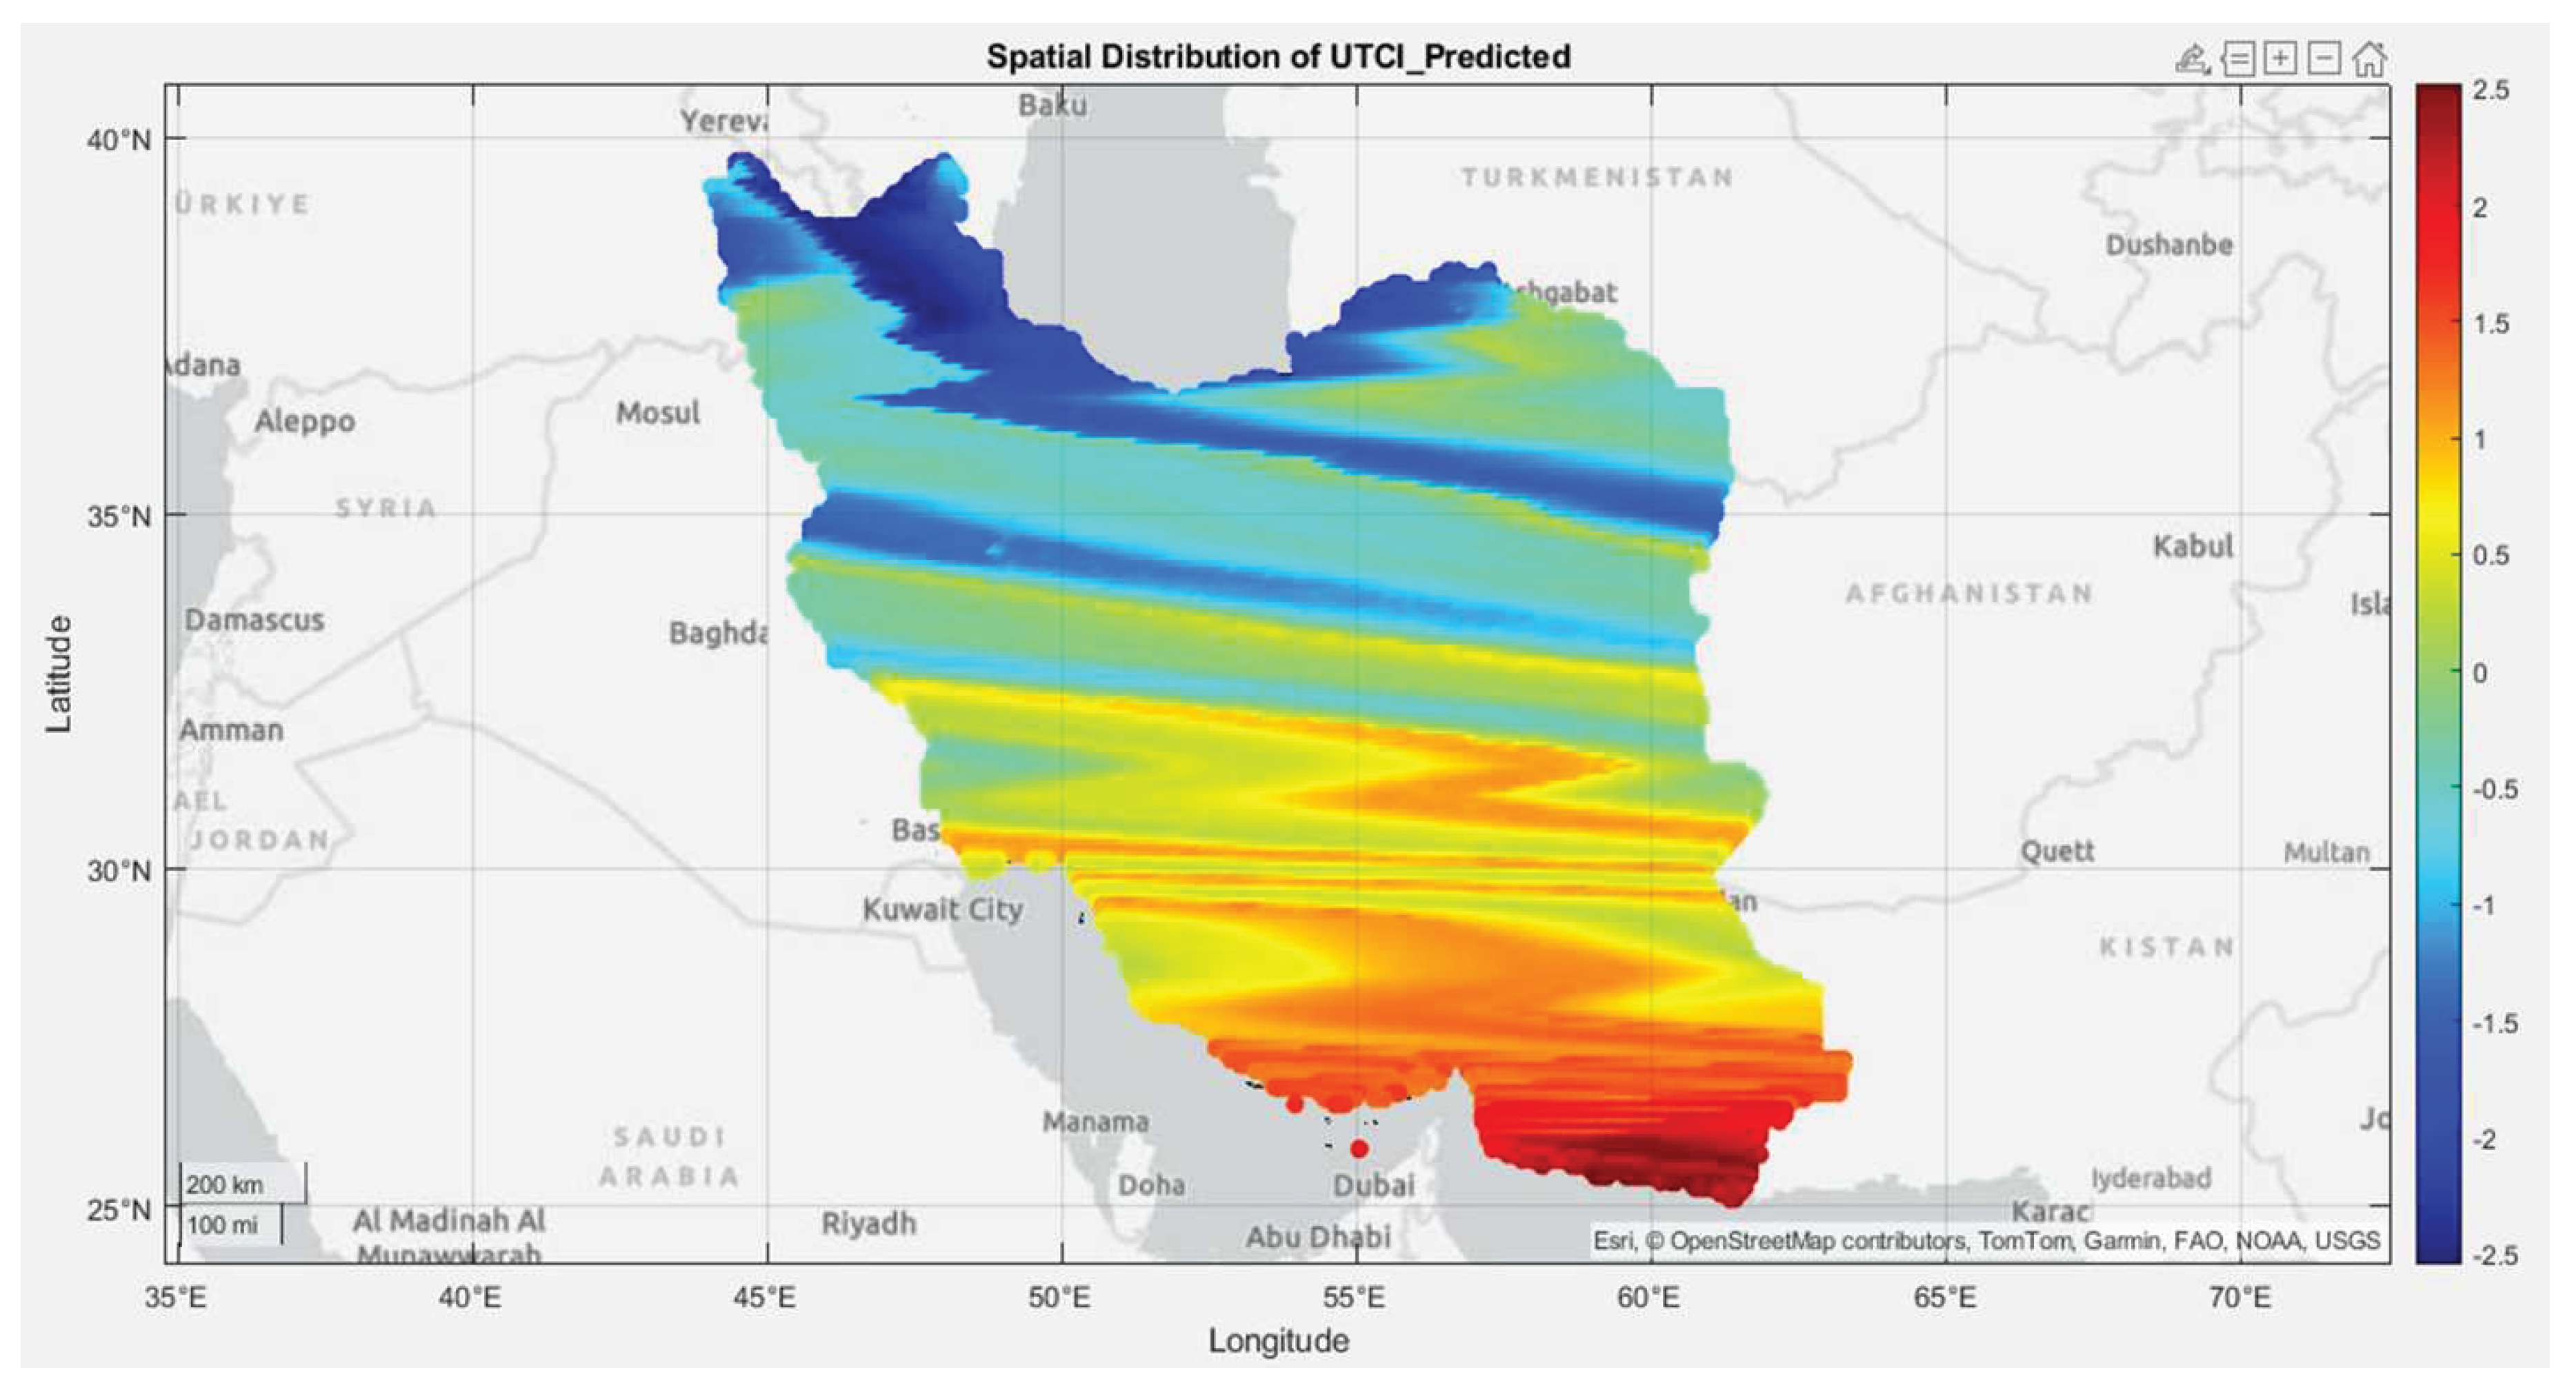
Figure 16.
Spatial Distribution of PMV using Random Forest modeling in Iran.
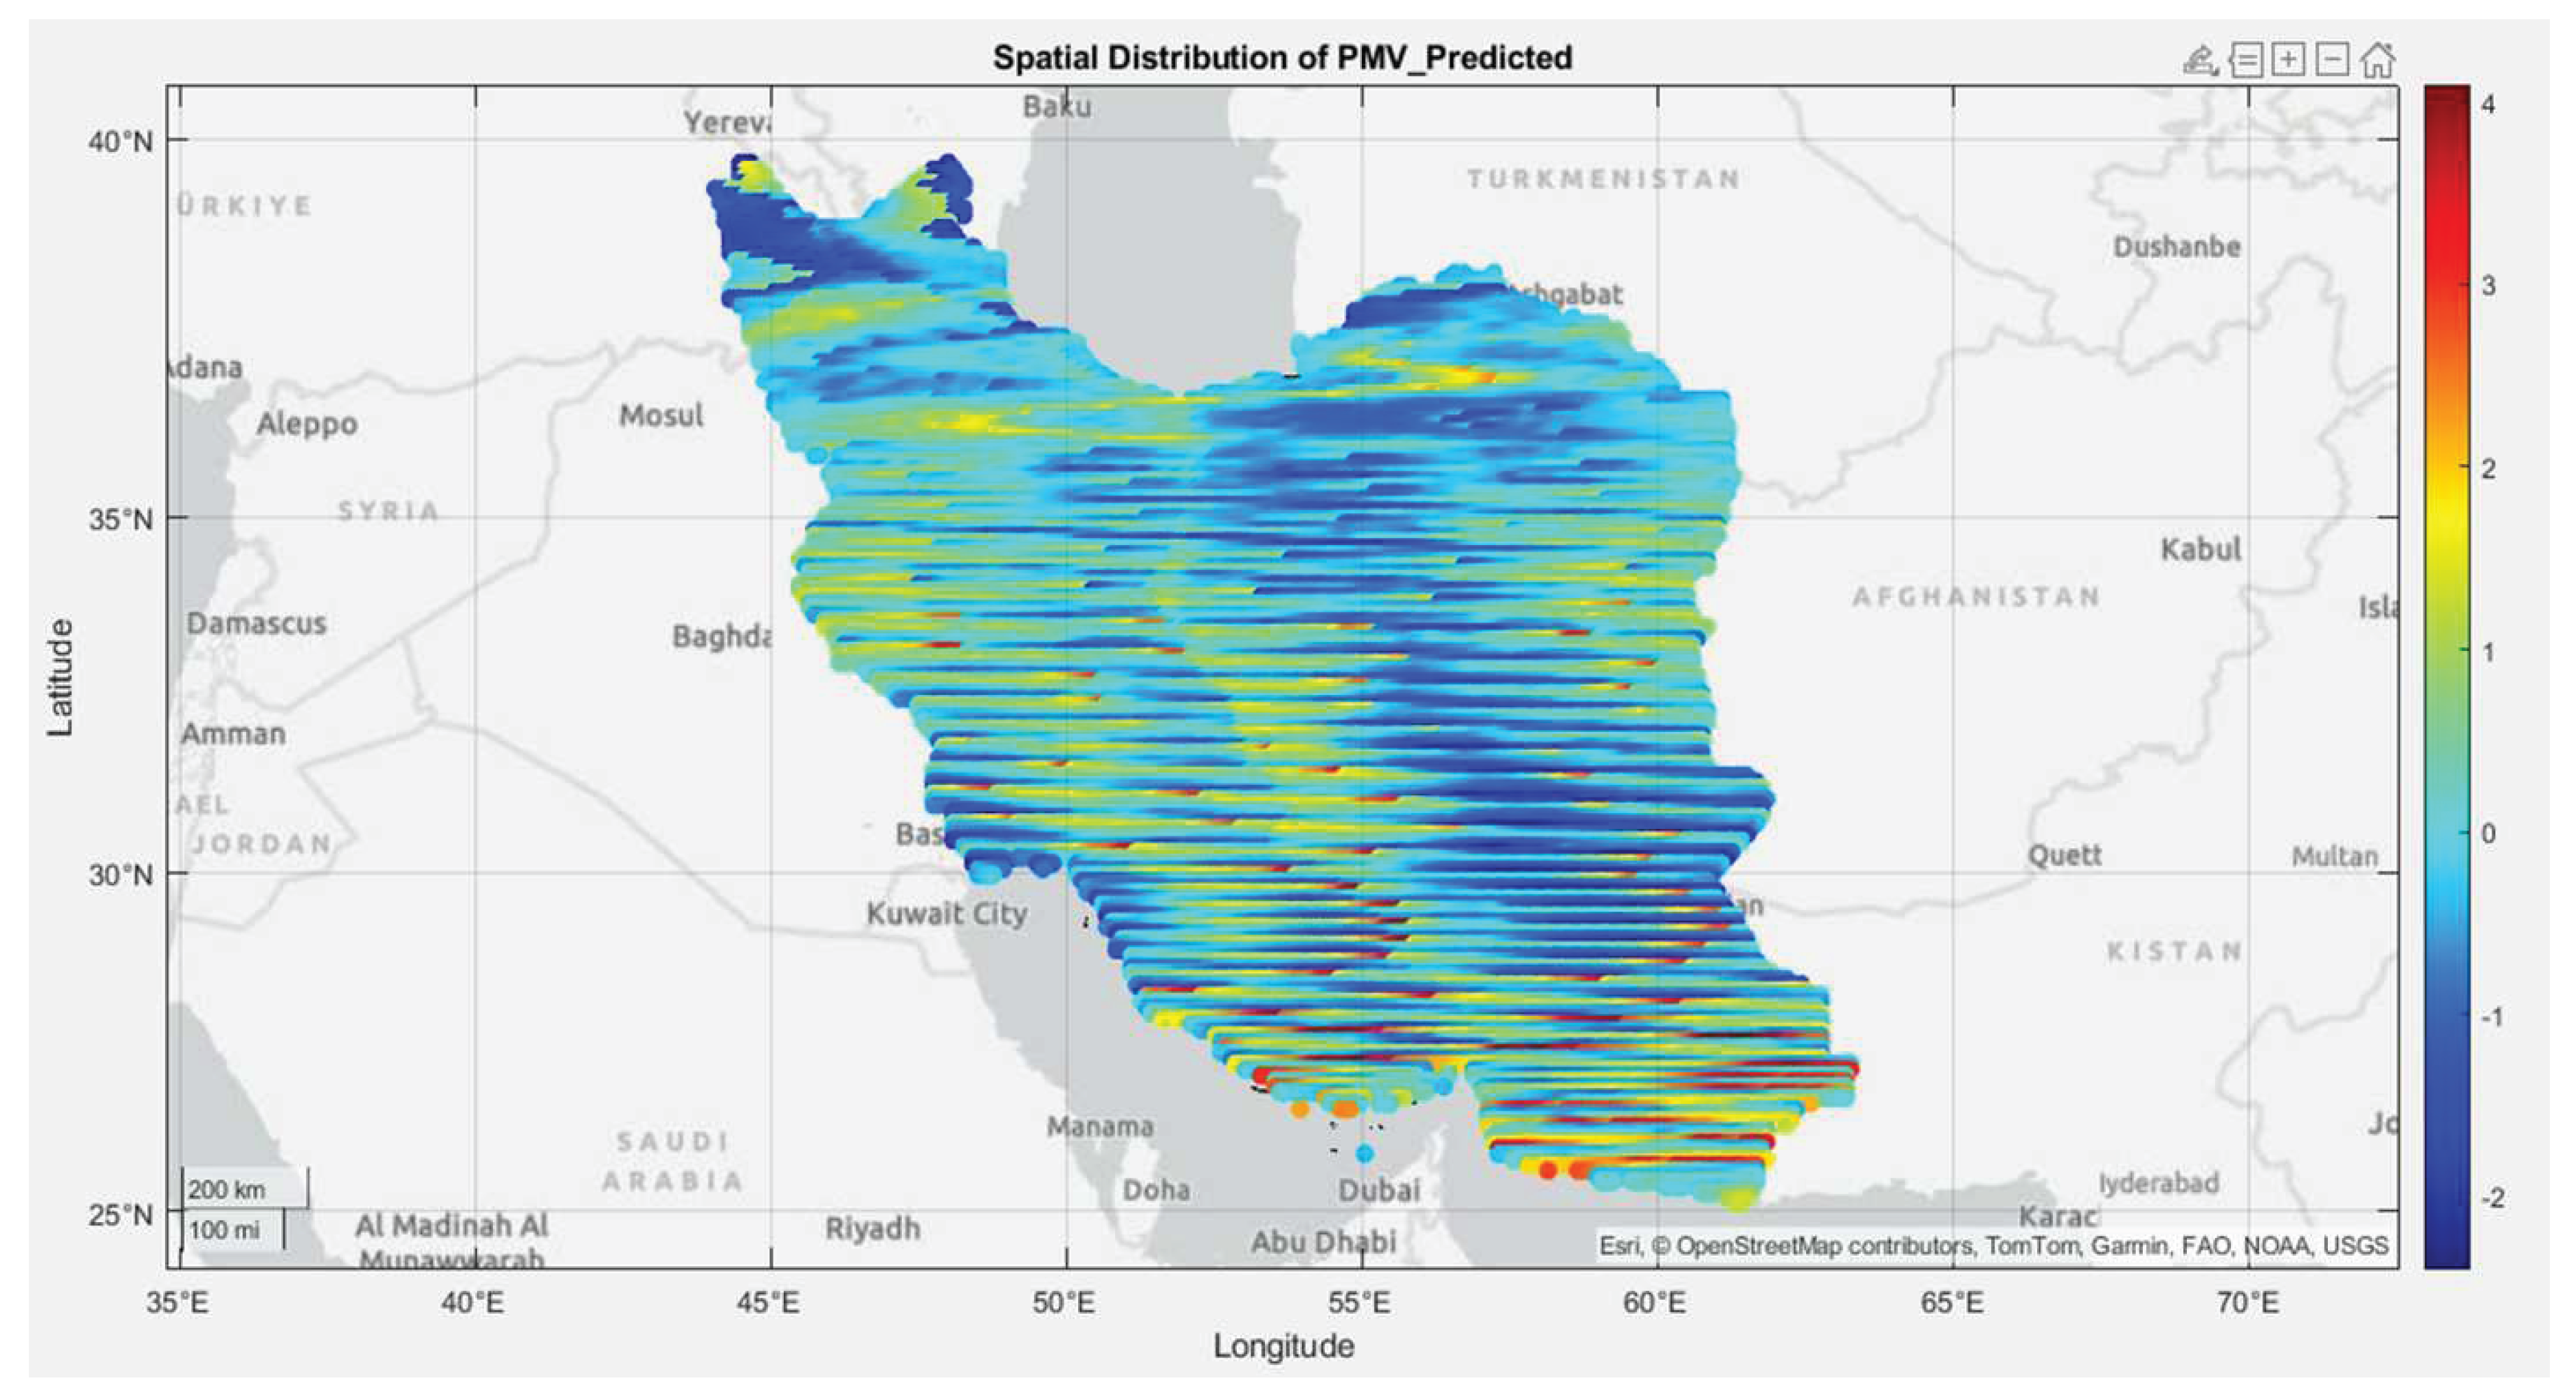

Table 1.
Significance of t-tests for Model Constructs.
| Path (Influence) | Path Coefficient (O) | T Statistics (T-Value) | P Values | Direction & Strength of Influence | Statistical Significance |
|---|---|---|---|---|---|
| Extreme Events -> Comfort Indices | 0.381 | 123.333 | 0.0000 | Positive and Moderate | Significant |
| Humidity Conditions -> Comfort Indices | -0.074 | 21.5 | 0.0000 | Negative and Weak | Significant |
| Radiation Conditions -> Comfort Indices | 0.072 | 31.334 | 0.0000 | Positive and Weak | Significant |
| Thermal Conditions -> Comfort Indices | 0.515 | 140.031 | 0.0000 | Positive and Strongest | Significant |
| Wind & Pressure Conditions -> Comfort Indices | 0.043 | 15.343 | 0.0000 | Positive and Very Weak | Significant |
Table 2.
Composite Reliability for Model Constructs.
| Cronbach’s Alpha | rho_A | Composite Reliability | Average Variance Extracted (AVE) | |
|---|---|---|---|---|
| Comfort Indices | 0.871 | 0.946 | 0.918 | 0.713 |
| Extreme Events | 0.776 | 0.854 | 0.863 | 0.624 |
| Humidity Conditions | 0.781 | 0.917 | 0.853 | 0.603 |
| Radiation Conditions | 1.000 | 1.000 | 1.000 | 1.000 |
| Thermal Conditions | 0.863 | 0.907 | 0.891 | 0.547 |
| Wind & Pressure Conditions) | 1.000 | 1.000 | 1.000 | 1.000 |
Table 3.
Q² Statistic for the Validation of the Model.
| SSO | SSE | Q² (=1-SSE/SSO) | |
|---|---|---|---|
| Comfort Indices | 110,995.000 | 42,190.039 | 0.620 |
| Extreme Events | 88,796.000 | 88,796.000 | |
| Humidity Conditions | 88,796.000 | 88,796.000 | |
| Radiation Conditions | 22,199.000 | 22,199.000 | |
| Thermal Conditions | 155,393.000 | 155,393.000 | |
| Wind & Pressure Conditions) | 22,199.000 | 22,199.000 |
Table 4.
Multivariate Performance Estimates for the Model.
| MV Performances | |
|---|---|
| Annual Temperature | 52.750 |
| Annual Maximum Temperature | 51.622 |
| Annual Minimum Temperature | 39.701 |
| Cloud Amount | 36.738 |
| Dew Point Temperature | 64.643 |
| Dew Point Temperature in Year | 46.187 |
| Dew Point Temperature | 33.322 |
| Humidex | 46.024 |
| PMV | 37.519 |
| Precipitation | 1.013 |
| Relative humidity | 38.457 |
| Shortwave Downward radiance | 69.492 |
| Summer days | 51.814 |
| TDI | 63.713 |
| Tropical nights | 15.756 |
| UTCI | 50.232 |
| WBGT | 51.086 |
| WSDI | 15.144 |
| Wind Speed | 32.187 |
| Yearly Warm nights | 28.438 |
| Yearly Temperature Range | 73.470 |
| Daily Temperature Range | 65.940 |
Disclaimer/Publisher’s Note: The statements, opinions and data contained in all publications are solely those of the individual author(s) and contributor(s) and not of MDPI and/or the editor(s). MDPI and/or the editor(s) disclaim responsibility for any injury to people or property resulting from any ideas, methods, instructions or products referred to in the content. |
© 2025 by the authors. Licensee MDPI, Basel, Switzerland. This article is an open access article distributed under the terms and conditions of the Creative Commons Attribution (CC BY) license (http://creativecommons.org/licenses/by/4.0/).
Copyright: This open access article is published under a Creative Commons CC BY 4.0 license, which permit the free download, distribution, and reuse, provided that the author and preprint are cited in any reuse.


