
Submitted:
13 June 2025
Posted:
16 June 2025
You are already at the latest version
Abstract
Ocean Alkalinity Enhancement (OAE) is a promising carbon dioxide removal strategy, but its ecological impacts on marine microbial communities under varying nutrient condi-tions remain poorly understood. We conducted laboratory incubations using a natural North Atlantic microbial assemblage to investigate responses to OAE under both natural and nutrient-enriched regimes. We tracked phytoplankton and bacterioplankton dynam-ics, biomass, and leucine aminopeptidase (LAP) and alkaline phosphatase (ALP) activity as indicators of organic matter remineralization. OAE consistently reduced phytoplank-ton abundance in both nutrient regimes, likely due to CO₂ limitation, resulting in lower production of phytoplankton-derived organic matter. This reduction was reflected in de-creased LAP activity and shifts in the relative abundance of phytoplankton-associated bacterial taxa. These findings indicate that OAE can directly affect phytoplankton through carbonate chemistry alterations, with potential microbial responses largely mediated by changes in organic matter availability. While short-term microbial disruptions were modest, the ecological consequences of altered bloom dynamics should be carefully con-sidered in future OAE deployment strategies.
Keywords:
Ocean Alkalinity Enhancement
; Marine Microbial Communities
; Nutrient Limitation
; Extracellular Enzyme Activity
1. Introduction
Mitigation of climate change is urgent, particularly to meet the targets set by the Paris Agreement, which aims to limit global warming to below 2 °C (ideally 1.5 °C) [1]. To achieve this goal, global emissions must peak before 2025 and fall by 43% by 2030 [2]. Current emission trajectories, however, remain incompatible with these targets, posing severe risks to ocean health. As a result, ocean-based carbon dioxide removal (mCDR) strategies are gaining momentum [3,4].
Ocean Alkalinity Enhancement (OAE) is a mCDR approach that enhances the ocean's natural capacity to sequester atmospheric CO2 by increasing alkalinity and thereby shifting the carbonate equilibrium toward bicarbonate (HCO₃⁻) and carbonate (CO₃²⁻) ion formation [5,6,7,8,9]. Alkalinity can be enhanced through the addition of natural minerals (e.g., silicates, carbonates) or synthetic compounds like quicklime (CaO) and slaked lime (Ca(OH)₂).
Among these, CaO, often referred to as "ocean liming", is a non-CO₂-equilibrated strategy that offers rapid alkalinity enhancement while simultaneously helping to counteract ocean acidification by increasing seawater pH [5,10,11,12]. However, it also raises concerns regarding energy demands and CO₂ emissions associated with its production [13,14,15].
Although research on the ecological impacts of OAE is expanding, most studies have focused on carbonate-based, CO₂-equilibrated scenarios. This includes recent mesocosm experiments in the subtropical North Atlantic, which have reported generally limited effects on phytoplankton physiology, microbial activity, and biogeochemical fluxes under these conditions [16,17,18,19]. Other efforts have tested more realistic deployment scenarios using steel slag, a CaO-rich byproduct of industrial processes, to assess both biogeochemical impacts and potential trace metal release [20,21]. While these studies provide valuable insights, they have largely emphasized phytoplankton responses and primary production [22,23] with less attention given to bacterioplankton dynamics, which play a crucial role in organic matter turnover and nutrient regeneration.
This microbial interface, where phytoplankton-derived organic matter fuels heterotrophic bacterial activity, is key to understanding how OAE may influence carbon export efficiency and nutrient cycling. Importantly, environmental context matters: insights from ocean acidification studies indicate that nutrient availability, particularly phosphate, can modulate microbial responses [24,25,26]. This is especially relevant in oligotrophic systems like the subtropical North Atlantic, where seasonal or episodic nutrient pulses regulate microbial productivity and remineralization [24].
Timing may be critical when deploying OAE, as ecological outcomes can vary significantly between nutrient-depleted and nutrient-replete periods [27]. In nutrient-depleted conditions, microbial responses may differ in ways that affect both ecosystem function and the efficiency of carbon removal. Moreover, interactions with artificial upwelling, a proposed complementary CDR strategy, could further influence microbial and biogeochemical dynamics [28]. Testing OAE under varying nutrient conditions can therefore help determine optimal deployment timing and assess its potential compatibility with artificial upwelling.
In this study, we conducted a laboratory incubation with a natural marine microbial community from the North Atlantic to evaluate the combined effects of CaO-based OAE and nutrient availability on microbial ecosystem dynamics. We examined changes in phytoplankton and bacterioplankton community composition and biomass under ambient and nutrient-enriched conditions, along with the activities of two key extracellular enzymes—leucine aminopeptidase (LAP) and alkaline phosphatase (ALP)—to assess microbial functional responses. Our aim was to determine how microbial ecosystems respond to OAE under contrasting nutrient conditions and to explore how baseline nutrient availability may shape the ecological outcomes of OAE deployment.
2. Materials and Methods
2.1. Sampling Site
The effects of OAE under different nutrient settings were assessed on a natural microbial marine community from the North Atlantic, offshore Terceira Island (38°39’20.3’’N 27°16’54.3’’W), in the Azores.
The nutrient regimes used resulted from a previous (Figure 1) showing a strong decrease regarding inorganic nutrient concentration (nitrate, phosphate and silica) within ≈ 50m (Supplementary Figure 1).
2.2. Experimental Setup
The seawater collected was immediately filtered through a 200 μm mesh on site, to exclude zooplankton, as our focus did not include higher trophic levels. At the lab, the community was divided into two containers, one corresponding to the natural nutrient treatment concentrations (NN) and another corresponding to the enhanced nutrient treatment concentrations (EN). In the NN, no nutrients were added, while in the EN, nitrate and phosphate were added at the final concentrations of 80.77 and 3.48 µM, respectively, to prevent nutrient limitation during the exponential growth phase and ensure that any potential depletion would occur only in the later stages of the experiment. Initial measurements at t0 confirmed the effectiveness of nutrient manipulation, with the EN treatment reaching target nitrate and phosphate concentrations (Table 1), while the NN treatment reflected background levels typical of Negrito Bay (see Figure 2). Subsequently, from each nutrient treatment, half of the containers obtained after the nutrient addition were further manipulated by increasing total alkalinity (TA) by 250 μmol kg⁻¹ using CaO (Calcidrata, Portugal). This value was chosen because it has previously been reported to ensure no precipitation and consequent loss of TA [29]. TA addition was based on the principle of CaO dissolution, whereby the addition of 1 mole of CaO results in a 2-mole increase in TA via bicarbonate (HCO₃⁻) formation. To facilitate this process, a highly alkaline solution with a ΔTA of 4000 μmol kg⁻¹ was prepared in filtered seawater and subsequently added to the OAE containers.
Finally, after all experimental conditions were established, the study was conducted in microcosms (1 L bottles). Each bottle was filled completely, leaving no airspace and samples for t0 were taken. Four experimental conditions were established in a 2 × 2 design, combining two nutrient settings (NN and EN) with two alkalinity conditions (present and OAE), with triplicates for each condition and sacrificial sampling at two time points (t3 and t6), resulting in a total of 24 bottles. The sampling points t3 and t6 were selected based on their relevance to community dynamics. Bottles were incubated in a climate-controlled chamber under conditions matching those recorded at the collection site (18 °C, 150 ± 10 μmol m⁻² s⁻¹ light intensity, and a 14:10 light/dark cycle). To minimize experimental bias, bottles were manually mixed and their position changed twice a day.
Nutrient manipulation was confirmed by measurements taken at the start of the experiment (t0). The EN treatment had elevated concentrations of phosphate (3.48 μM) and nitrate (80.77 μM), while the NN treatment reflected background conditions, with only 0.24 μM phosphate and 7.91 μM nitrate (Table 1). Silica concentrations were similar across all treatments, ranging from 44 to 48 μM. These values are consistent with those observed in the Negrito Bay transect (Supplementary Figure 1).
2.3. Parameters Evaluated
Carbonate system parameters were sampled at t0, t3 and t6, with TA samples being syringe filtered (polyethersulfone 0.2 µm pore) prior to analysis and measured with Metrohm Titrino Plus 848 coupled with an 869 Compact Sample Changer. Final TA values were corrected against certified reference material supplied by Dickson [30]. Total pH (pHt) was assessed by glass electrode (WTW,pH 340i) and corrected by TRIS buffer supplied by Dickson [31]. Lastly, pCO2 and additional components of carbonate chemistry were calculated through the CO2SYS script for excel [32], with salinity, pressure, temperature, total phosphorus and silica, TA, and pHt as input alongside the equilibrium constants defined by Lueker [33].
For dissolved inorganic nutrients determination (nitrate, nitrite, phosphate and silicate), samples were collected on t0, t3 and t6 filtered as described above through a 0.2 µm syringe filter and stored at - 20 °C until further analysis. Nutrient concentrations were then determined by spectrophotometry (Varian Cary 50) according to Hansen & Koroleff, (1999) [34].
Extracellular enzymatic activity of leucine aminopeptidase (LAP) and alkaline phosphatase (ALP) was determined by fluorometric assay based on Hoppe (1983) [35] by adding the fluorogenic substrate analogs solutions, L-leucine-7-amido-4-methylcoumarine hydrochloride (Leu-MCA) and 4-methylumbelliferyl phosphate (MUF-Phos) 300 μL of sample reaching the final concentration of 32 μM to in 96-well plates and incubating it for 3 h before reading fluorescence (FLUOstar Omega). The values obtained were then assessed using a calibration curve using as standards L-Leucine 7-amido-4-methylcoumarin hydrochloride and 4-Methylumbelliferyl for LAP and ALP, respectively. For alkaline phosphatase samples and standards, 30 μL of ammonia-glycine buffer (final pH 10.5, adjusted with NaOH) was added before readings.
The abundance and composition of microphytoplankton was assessed from Lugol-fixed samples (2 %) (Utermöhl chamber) through inverted microscopy (Nikon TS100) at 200 X magnification, on t0, t3 and t6. Additional samples were collected to determine the presence of calcifying nanoplankton, specifically coccolithophores. Samples were taken at t0 and t6, filtered onto cellulose nitrate membrane filters, washed with low-mineral water, air-dried, and cut at an angle of approximately 30°. The filter pieces were then mounted on glass slides and fixed with Entellan mounting medium. Coccolithophores were visually identified using a polarization microscope (Leica DM 2700 P).
Lastly, the composition of the bacterial community was analyzed using 16S rRNA gene metagenomics. Community samples (approximately 90–150 mL) were collected by vacuum filtration onto 0.22 µm polycarbonate filters (47 mm diameter), which were preserved in 100% ethanol at -20 °C. Prior to DNA extraction, the filters were cut into small pieces. DNA was extracted using the FastDNA™ Spin Kit for Soil (MP Biomedicals), following the manufacturer’s protocol. The resulting DNA samples were sent to STABVIDA (Lisbon) for paired-end sequencing of the 16S rRNA gene on the Illumina MiSeq platform, targeting the V4 region [36] with primers 515F (5′-3′: GTGCCAGCMGCCGCGGTAA) and 806R (5′-3′: GGACTACHVGGGTWTCTAAT).
2.4. Data Analysis
All statistical analyses were performed using RStudio [37]. A multifactorial ANOVA was conducted with nutrient treatment and alkalinity treatments as factors, applied to carbonate chemistry parameters, microphytoplankton abundance and enzymatic activity. Post hoc comparisons were performed using Tukey's multiple pairwise comparison test with a 95% confidence interval. Pearson correlation analysis was conducted to evaluate the strength and direction of linear relationships between pairs of continuous variables. For the microphytoplankton community, a PERMANOVA based on Bray–Curtis dissimilarities of Hellinger-transformed abundances was conducted using the vegan package to assess the effects of OAE and/or nutrient treatment.
For the sequencing data, algorithms in QIIME2 (version 2023.5) were used to transform the amplicon libraries to an amplicon sequence variant (ASV) abundance table. Taxonomy was assigned to ASVs using the SILVA database of the 16S reference sequences at 99% similarity (version 138, released December 2019). While the bacterial community, alpha diversity indexes were calculated using vegan package.
Differences among alpha diversity indexes (Shannon H’, Pielou J (evenness) and Fisher alpha (richness)) were determined by a multifactorial ANOVA. The significant effects of OAE within nutrient treatment was assessed through PERMANOVA. A taxon-specific analysis for all relevant orders (relative abundance > 2.5 %) was performed through a multifactorial ANOVA applied to general linearized model (GLM) (vegan).
3. Results
3.1. Carbonate Chemistry and Nutrient Conditions
The increase in alkalinity was achieved across all OAE treatments (Table 2), accompanied by a decrease in pCO2 and an increase in pHt, remaining constant throughout the experiment.
The two nutrient regimes showed distinct drawdown dynamics. In the natural nutrient (NN) treatment, phosphate was depleted early, by day 3, while nitrate declined more gradually and was only depleted by day 6. Silicate remained consistently available and did not become limiting. In contrast, under nutrient-enriched (EN) conditions, only phosphate became depleted, and only at the end of the experiment, with nitrate and silicate remaining in excess throughout (Figure 2a–c).
3.2. Phytoplankton Dynamics
The initial community abundance of 23 cells mL-1 increased a noticeable 6- to 9-fold after 3 days (Figure 3). By the end of the experiment, phytoplankton abundance differed significantly across treatments, with higher cell numbers in the higher nutrient treatment (Figure 3). Importantly, independent of the nutrient concentrations, there was an OAE effect, decreasing the phytoplankton abundance until day 6, where all treatments showed phosphate depletion (Figure 3 and Figure 2b).
Initially, the phytoplankton community (Figure 4) consisted of approximately 40% coccolithophores, 35% diatoms, 12% dinoflagellates, and 13% unidentified taxa. Over the course of the experiment, a pronounced shift occurred, with diatoms becoming dominant (92–98%) and dinoflagellates comprising 1–9% across all treatments with no statistically significant effects of alkalinity (PERMANOVA, p = 0.302) or nutrient enrichment (PERMANOVA, p = 0.132), on community composition. This shift was accompanied by a marked decline in dissolved silica concentrations by day 6 (Figure 2c).
3.3. Enzymatic Activity
The activity of leucine aminopeptidase (LAP) was undetectable at t0 and showed similar activity across all treatments mid-experiment (159–205 nmol L⁻¹ h⁻¹), indicating no nutrient or OAE effect at that stage. However, by the end of the experiment LAP increased 10-fold under the EN setting (Figure 5a) compared to the NN treatment (p < 0.001). Furthermore, under the EN scenario OAE reduced LAP relative to the present alkalinity treatment (p = 0.014).
This rise in LAP activity corresponded with phytoplankton growth, showing a strong positive linear correlation with phytoplankton abundance (r = 0.93, p < 0.001). To determine whether the observed effects at day 6 were independent of phytoplankton biomass, LAP activity was normalized to cell counts (Table 3). When expressed per cell, LAP activity remained significantly higher under nutrient-enriched conditions (p < 0.001), but no significant effect of OAE was detected.
Alkaline phosphatase activity was undetectable at the start of the experiment but peaked by day 3 in the NN treatment under OAE, reaching higher levels (average of 449 nmol L⁻¹ h⁻¹) than in all other treatments (23–62 nmol L-1 h-1) (Figure 5b). By day 6, however, no significant differences were observed among treatments, despite lower phosphate concentrations in all treatments (Figure 3b).
3.4. Bacterioplankton Community Structure
Bacterial communities across all treatments were dominated by Proteobacteria—primarily Alteromonadales, Oceanospirillales, and Rhodobacterales—and by Bacteroidota, mainly represented by Flavobacteriales (Figure 6). Alpha diversity analysis revealed treatment-specific effects: evenness was slightly reduced in the OAE treatments (p < 0.047), while richness significantly declined under enhanced nutrient conditions (p < 0.01), as indicated by multifactorial ANOVA.
Concerning bacterial community composition, no significant effect of OAE was inferred, but instead a significant influence of nutrient enrichment was observed (PERMANOVA; p = 0.002). When analyzed separately within each nutrient setting (natural and enhanced), OAE continued to show no significant impact on bacterial community structure.
Although no overall significant effect of alkalinity on the community composition could be detected, specific microbial orders responded significantly to OAE within each nutrient treatment.
For instance, Chitinophagales, primarily composed of ASVs from the Saprospiraceae family, showed a marked decrease in relative abundance under OAE on both nutrient conditions (Table 4). In the NN condition, Cellvibrionales, composed mainly by the families Halieaceae, Spongiibacteraceae, Porticoccaceae and Cellvibrionaceae exhibited increased relative abundances in response to OAE (Table 4). In the EN condition, both Rhodobacterales (mosly Rhodobacteraceae) and Flavobacteriales (mainly Flavobacteriaceae) decreased in relative abundance under OAE compared to present alkalinity (Table 4).
Correlations between phytoplankton abundance and the relative abundance of dominant bacterial orders revealed that Chitinophagales had a moderate, non-significant positive association with phytoplankton (r = 0.54, p = 0.067), which became significant after excluding an outlier (replicate 3 from the EN + OAE treatment, where Chitinophagales were absent; r = 0.76, p = 0.006). Flavobacteriales showed a significant positive correlation with phytoplankton abundance (r = 0.77, p = 0.003), whereas Cellvibrionales were negatively associated (r = –0.83, p < 0.0019). Rhodobacterales showed no significant relationship to phytoplankton (r = –0.079, p = 0.807).
4. Discussion
4.1. Drivers of Phytoplankton Response to Ocean Alkalinity Enhancement
The shift towards diatom dominance in the phytoplankton community was expected under both nutrient conditions, given the initially high concentrations of nitrate, phosphate, and silica that favor rapid diatom growth [38]. While OAE had no significant impact on the overall community composition, it consistently decreased diatom abundance in both enhanced and natural nutrient scenarios. This difference in biomass aligns with previous observations of decreased phytoplankton development under OAE in a similarly non-CO₂-equilibrated experiment [39], and is further supported here by phytoplankton abundance and the OAE induced initial decrease in pCO2, suggesting that CO2 limitation likely contributed to the decreased bloom progression, particularly in diatoms.
Moreover, the decrease in phytoplankton abundance regardless of nutrient condition reported here is a novel observation. However, previous non-equilibrated, calcium-based OAE experiments have documented delays in phytoplankton blooms, where growth lagged [40]. This could raise the possibility that, rather than a true decline in biomass, we might have observed a delay in phytoplankton development. Yet, the clear nutrient drawdown observed (Figure 2a–c), particularly phosphate depletion, suggests that the communities had already undergone active growth, supporting that we observed an actual reduction in abundance rather than a delayed bloom. To cope with potential CO₂ limitation under these conditions, diatoms likely relied on carbon-concentrating mechanisms (CCMs) to enhance the efficiency of RubisCO [41,42]. While CCMs do not consume inorganic phosphate (Pi) directly, Pi is indirectly essential for the energy and metabolic processes required to sustain their operation. Furthermore, recent laboratory studies have demonstrated reduced growth rates in Thalassiosira pseudonana under prolonged alkalinization without CO₂ replenishment [43], reinforcing the idea that elevated alkalinity and limited pCO₂ can directly constrain phytoplankton growth.
Conversely, lab experiments using CO2-equilibrated conditions reported no change in Chaetoceros sp. growth [44] and other non-equilibrated OAE studies with higher TA increases (~300–500 μmol kg-1) also found no decrease in phytoplankton abundance [20,22]. However, those studies differed in both carbonate chemistry and nutrient conditions, suggesting that microbial responses to OAE are context-dependent and likely shaped by site-specific environmental settings.
4.2. Phytoplankton-Mediated Enzymatic Activity Under Ocean Alkalinity Enhancement
Concomitantly to the increase in phytoplankton abundance, leucine aminopeptidase activity increased significantly under nutrient enrichment by the end of the experiment (Figure 3 and Figure 5a). This pattern persisted after normalizing LAP to phytoplankton abundance, indicating that the phytoplankton cells were producing more, as leucine aminopeptidase activity is closely tied to leucine-rich compounds released during blooms [45]. The phytoplankton communities were dominated by diatoms, and the bacterial community included diatom-associated taxa such as Saprospiraceae and Flavobacteriales, both known for degrading complex organic matter [46,47,48]. While LAP activity was lower under OAE in the EN setting, this difference was not observed when normalized to phytoplankton abundance. This indicates that the apparent OAE effect on LAP activity was not direct but rather mediated through reduced phytoplankton biomass.
The transient increase in ALP activity under OAE in the natural nutrient (NN) setting coincided with early phosphate depletion (Figure 2b and Figure 3b), consistent with ALP’s role in mobilizing phosphorus under limiting conditions [49]. By the end of the experiment, phosphate was depleted across all treatments, and no differences in ALP activity were detected between OAE and control groups or between nutrient regimes. These results could indicate that the observed ALP response to OAE was not a direct effect of alkalinity enhancement, but rather indirectly driven by changes in microbial community structure during early phosphorus stress.
4.3. Phytoplankton-Bacteria Coupling Shapes Microbial Responses to OAE
The relative abundance of Flavobacteriaceae and Saprospiraceae was positively correlated with phytoplankton abundance, while Cellvibrionales were inversely correlated, indicating that their responses were not directly driven by the changes in carbonate system that result of OAE, but instead mediated through changes in phytoplankton abundance. Since phytoplankton abundance was sensitive to both nutrient enrichment and OAE—particularly the decreased diatom bloom under OAE—shifts in these bacterial groups could reflect changes in organic matter availability linked to bloom development. These findings are consistent with the ecological roles of both taxa: Saprospiraceae are commonly epiphytic and associated with algae, particles, and filamentous bacteria [48,50,51], while Flavobacteriaceae are frequently linked to diatom blooms and known for degrading high-molecular-weight organic compounds [52]. In contrast, the negative correlation of Cellvibrionales with phytoplankton abundance suggests an earlier role in bloom succession, consistent with findings from upwelling systems where Cellvibrionales dominate during bloom initiation, while Flavobacteriales and Saprospirales become more prominent during bloom decay and senescence as DOM composition shifts [53].
Rhodobacteraceae showed reduced relative abundance under OAE but only in the enhanced nutrient setting, a response likely linked to shifts in phytoplankton dynamics. As phytoplankton succession and the composition of associated dissolved organic matter (DOM) are major factors shaping bacterioplankton communities [54,55,56], the abundance in bloom progression under OAE likely influenced substrate availability and timing, altering conditions for Rhodobacteraceae proliferation.
These patterns highlight the close ecological coupling between bacterioplankton and phytoplankton, which supply essential organic substrates and nutrients that support bacterial growth and activity [57,58,59,60]. This tight interdependence helps explain the observed correlations between specific bacterial taxa and phytoplankton abundance. Perturbations to marine biogeochemistry, such as elevated CO2 levels and ocean alkalinity enhancement (OAE), can therefore indirectly shape bacterioplankton community composition and function by altering phytoplankton bloom dynamics and the quantity and quality of available organic matter [61,62,63,64,65].
5. Conclusions
The consistent reduction in diatom development observed under OAE, across both natural and nutrient-enriched conditions, led to reduced availability of phytoplankton-derived organic matter. This, in turn, was reflected in lower leucine aminopeptidase (LAP) activity and shifts in the relative abundance of phytoplankton-associated bacterial taxa. The strong correlation between LAP activity and phytoplankton biomass underscores the tight trophic coupling between these microbial groups.
Although microbial responses were largely mediated by phytoplankton dynamics, the effects of OAE on microbial ecosystem function remain ecologically significant. These findings highlight the importance of considering both nutrient availability and carbonate chemistry when evaluating the broader ecological consequences of OAE, particularly in the context of large-scale climate intervention strategies.
Supplementary Materials
The following supporting information can be downloaded at the website of this paper posted on Preprints.org, Figure S1: Inorganic nutrient concentrations at sampling sites A, B, C, D and E (Negrito Bay).
Author Contributions
Conceptualization and experimental design: IC and JBR. Investigation and data analysis: IC, JBR, SR, PFSB, MC and AL. Funding acquisition: JBR and EBA. Writing of original draft: IC. Reviewing and editing of original draft: all authors.
Funding
This research was supported by the FCT project of IITAA with the reference UIDB/00153/2020, by the ARM Program supported by DOE, in the framework of the ENA project through the agreement between LANL and the University of the Azores, IC is financed by National Funds through the Portuguese funding agency, FCT -Fundação para a Ciência e a Tecnologia with the grant UI/BD/150890/2021, SCR is supported by FCT grant UIDP/00153/2020, and JBR is supported by FCT, within Contrato-Programa, Apoio Institucional.
Data Availability Statement
The original contributions presented in this study are included in the article. Further inquiries can be directed to the corresponding author.
Conflicts of Interest
The authors declare no conflicts of interest.
Abbreviations
The following abbreviations are used in this manuscript:
| ALP | Alkaline phosphatase |
| CCM | Carbon-concentrating mechanism |
| LAP | Leucine aminopeptidase |
| OAE | Ocean Alkalinity Enhancement |
| TA | Total Alkalinity |
References
- United Nations Framework Convention on Climate Change; 2015.
- Calvin, K.; Dasgupta, D.; Krinner, G.; Mukherji, A.; Thorne, P.W.; Trisos, C.; Romero, J.; Aldunce, P.; Barrett, K.; Blanco, G.; et al. IPCC, 2023: Climate Change 2023: Synthesis Report. Contribution of Working Groups I, II and III to the Sixth Assessment Report of the Intergovernmental Panel on Climate Change [Core Writing Team, H. Lee and J. Romero (Eds.)]. IPCC, Geneva, Switzerland.; 2023.
- Low, S.; Baum, C.M.; Sovacool, B.K. Rethinking Net-Zero Systems, Spaces, and Societies: “Hard” versus “Soft” Alternatives for Nature-Based and Engineered Carbon Removal. Global Environmental Change 2022, 75. [Google Scholar] [CrossRef]
- Rau, G.H.; McLeod, E.L.; Hoegh-Guldberg, O. The Need for New Ocean Conservation Strategies in a High-Carbon Dioxide World. Nat Clim Chang 2012, 2, 720–724. [Google Scholar] [CrossRef]
- Bach, L.T.; Gill, S.J.; Rickaby, R.E.M.; Gore, S.; Renforth, P. CO2 Removal With Enhanced Weathering and Ocean Alkalinity Enhancement: Potential Risks and Co-Benefits for Marine Pelagic Ecosystems. Frontiers in Climate 2019, 1. [Google Scholar] [CrossRef]
- Gattuso, J.-P.; Williamson, P.; Duarte, C.M.; Magnan, A.K. The Potential for Ocean-Based Climate Action: Negative Emissions Technologies and Beyond. Frontiers in Climate 2021, 2. [Google Scholar] [CrossRef]
- Hartmann, J.; West, A.J.; Renforth, P.; Köhler, P.; De La Rocha, C.L.; Wolf-Gladrow, D.A.; Dürr, H.H.; Scheffran, J. Enhanced Chemical Weathering as a Geoengineering Strategy to Reduce Atmospheric Carbon Dioxide, Supply Nutrients, and Mitigate Ocean Acidification. Reviews of Geophysics 2013, 51, 113–149. [Google Scholar] [CrossRef]
- Kheshgi, H.S. SEQUESTERING ATMOSPHERIC CARBON DIOXIDE BY INCREASING OCEAN ALKALINITY; 1995; Vol. 20;
- Renforth, P.; Henderson, G. Assessing Ocean Alkalinity for Carbon Sequestration. Reviews of Geophysics 2017, 55, 636–674. [Google Scholar] [CrossRef]
- Feng (), E.Y. 冯玉铭; Keller, D.P.; Koeve, W.; Oschlies, A. Could Artificial Ocean Alkalinization Protect Tropical Coral Ecosystems from Ocean Acidification? Environmental Research Letters 2016, 11, 074008. [Google Scholar] [CrossRef]
- Gattuso, J.P.; Magnan, A.K.; Bopp, L.; Cheung, W.W.L.; Duarte, C.M.; Hinkel, J.; Mcleod, E.; Micheli, F.; Oschlies, A.; Williamson, P.; et al. Ocean Solutions to Address Climate Change and Its Effects on Marine Ecosystems. Front Mar Sci 2018, 5. [Google Scholar] [CrossRef]
- Keller, D.P.; Feng, E.Y.; Oschlies, A. Potential Climate Engineering Effectiveness and Side Effects during a High Carbon Dioxide-Emission Scenario. Nat Commun 2014, 5. [Google Scholar] [CrossRef]
- Eisaman, M.D.; Geilert, S.; Renforth, P.; Bastianini, L.; Campbell, J.; Dale, A.W.; Foteinis, S.; Grasse, P.; Hawrot, O.; Löscher, C.R.; et al. Assessing the Technical Aspects of Ocean-Alkalinity-Enhancement Approaches. State of the Planet 2023, 2-oae2023, 1–29. [Google Scholar] [CrossRef]
- Foteinis, S.; Andresen, J.; Campo, F.; Caserini, S.; Renforth, P. Life Cycle Assessment of Ocean Liming for Carbon Dioxide Removal from the Atmosphere. J Clean Prod 2022, 370. [Google Scholar] [CrossRef]
- Renforth, P.; Jenkins, B.G.; Kruger, T. Engineering Challenges of Ocean Liming. Energy 2013, 60, 442–452. [Google Scholar] [CrossRef]
- Marín-Samper, L.; Arístegui, J.; Hernández-Hernández, N.; Ortiz, J.; Archer, S.D.; Ludwig, A.; Riebesell, U. Assessing the Impact of CO2-Equilibrated Ocean Alkalinity Enhancement on Microbial Metabolic Rates in an Oligotrophic System. Biogeosciences 2024, 21, 2859–2876. [Google Scholar] [CrossRef]
- Ramírez, L.; Pozzo-Pirotta, L.J.; Trebec, A.; Manzanares-Vázquez, V.; Díez, J.L.; Arístegui, J.; Riebesell, U.; Archer, S.D.; Segovia, M. Ocean Alkalinity Enhancement (OAE) Does Not Cause Cellular Stress in a Phytoplankton Community of the Subtropical Atlantic Ocean. Biogeosciences 2025, 22, 1865–1886. [Google Scholar] [CrossRef]
- Subhas, A. V.; Marx, L.; Reynolds, S.; Flohr, A.; Mawji, E.W.; Brown, P.J.; Cael, B.B. Microbial Ecosystem Responses to Alkalinity Enhancement in the North Atlantic Subtropical Gyre. Frontiers in Climate 2022, 4. [Google Scholar] [CrossRef]
- Suessle, P.; Taucher, J.; Goldenberg, S.U.; Baumann, M.; Spilling, K.; Noche-Ferreira, A.; Vanharanta, M.; Riebesell, U. Particle Fluxes by Subtropical Pelagic Communities under Ocean Alkalinity Enhancement. Biogeosciences 2025, 22, 71–86. [Google Scholar] [CrossRef]
- Guo, J.A.; Strzepek, R.F.; Swadling, K.M.; Townsend, A.T.; Bach, L.T. Influence of Ocean Alkalinity Enhancement with Olivine or Steel Slag on a Coastal Plankton Community in Tasmania. Biogeosciences 2024, 21, 2335–2354. [Google Scholar] [CrossRef]
- Guo, J.A.; Strzepek, R.F.; Yuan, Z.; Swadling, K.M.; Townsend, A.T.; Achterberg, E.P.; Browning, T.J.; Bach, L.T. Effects of Ocean Alkalinity Enhancement on Plankton in the Equatorial Pacific. Commun Earth Environ 2025, 6, 270. [Google Scholar] [CrossRef]
- Ferderer, A.; Chase, Z.; Kennedy, F.; Schulz, K.G.; Bach, L.T. Assessing the Influence of Ocean Alkalinity Enhancement on a Coastal Phytoplankton Community. Biogeosciences 2022, 19, 5375–5399. [Google Scholar] [CrossRef]
- Xin, X.; Goldenberg, S.U.; Taucher, J.; Stuhr, A.; Arístegui, J.; Riebesell, U. Resilience of Phytoplankton and Microzooplankton Communities under Ocean Alkalinity Enhancement in the Oligotrophic Ocean. Environ Sci Technol 2024. [Google Scholar] [CrossRef]
- Barcelos e Ramos, J.; Schulz, K.G.; Voss, M.; Narciso, Á.; Müller, M.N.; Reis, F. V.; Cachão, M.; Azevedo, E.B. Nutrient-Specific Responses of a Phytoplankton Community: A Case Study of the North Atlantic Gyre, Azores. J Plankton Res 2017, 39, 744–761. [Google Scholar] [CrossRef]
- Crummett, L.T. Acidification Decreases Microbial Community Diversity in the Salish Sea, a Region with Naturally High PCO2. PLoS One 2020, 15, e0241183. [Google Scholar] [CrossRef] [PubMed]
- Lin, S. Phosphate Limitation and Ocean Acidification Co-Shape Phytoplankton Physiology and Community Structure. Nat Commun 2023, 14, 2699. [Google Scholar] [CrossRef] [PubMed]
- Burt, D.J.; Fröb, F.; Ilyina, T. The Sensitivity of the Marine Carbonate System to Regional Ocean Alkalinity Enhancement. Frontiers in Climate 2021, 3. [Google Scholar] [CrossRef]
- Jürchott, M.; Oschlies, A.; Koeve, W. Artificial Upwelling—A Refined Narrative. Geophys Res Lett 2023, 50. [Google Scholar] [CrossRef]
- Moras, C.A.; Bach, L.T.; Cyronak, T.; Joannes-Boyau, R.; Schulz, K.G. Ocean Alkalinity Enhancement - Avoiding Runaway CaCO3 Precipitation during Quick and Hydrated Lime Dissolution. Biogeosciences 2022, 19, 3537–3557. [Google Scholar] [CrossRef]
- Dickson, A.G.; Afghan, J.D.; Anderson, G.C. Reference Materials for Oceanic CO2 Analysis: A Method for the Certification of Total Alkalinity. Mar Chem 2008, 185–197. [Google Scholar] [CrossRef]
- Dickson, A.G.; Afghan, J.D.; Anderson, G.C. Reference Materials for Oceanic CO2 Analysis: A Method for the Certification of Total Alkalinity. Mar Chem 2003, 80, 185–197. [Google Scholar] [CrossRef]
- Lewis, E.; Wallace, D.; Allison, L.J. Program Developed for CO2 System Calculations; Oak Ridge, TN, 1998.
- Lueker, T.J.; Dickson, A.G.; Keeling, C.D. Ocean PCO Calculated from Dissolved Inorganic Carbon, 2 Alkalinity, and Equations for K and K : Validation Based on 1 2 Laboratory Measurements of CO in Gas and Seawater at 2 Equilibrium. Mar Chem 2000, 70, 105–119. [Google Scholar] [CrossRef]
- Hansen, H.; Koroleff, F. Determination of Nutrients. In Methods of Seawater Analysis; 1999.
- Hoppe, H.-G. Significance of Exoenzymatic Activities in the Ecology of Brackish Water: Measurements by Means of Methylumbelliferyl-Substrates. Mar Ecol Prog Ser 1983, 11, 299–308. [Google Scholar] [CrossRef]
- Caporaso, J.G.; Lauber, C.L.; Walters, W.A.; Berg-Lyons, D.; Lozupone, C.A.; Turnbaugh, P.J.; Fierer, N.; Knight, R. Global Patterns of 16S RRNA Diversity at a Depth of Millions of Sequences per Sample. Proceedings of the National Academy of Sciences 2011, 108, 4516–4522. [Google Scholar] [CrossRef] [PubMed]
- Posit team RStudio: Integrated Development Environment for R 2025.
- Margalef, R. Life Forms of Phytoplankton as Survival Alternatives in an Unstable Environment. Oceanology Acta 1978, 1, 493–509. [Google Scholar]
- de Castro, I.; C. Ribeiro, S.; Louvado, A.; C. M. Gomes, N.; Cachão, M.; Brito de Azevedo, E.; Barcelos e Ramos, J. Ocean Liming Effect on a Microbial Community from the North Atlantic: Composition and Rates (under revision) 2025.
- Marín-Samper, L.; Arístegui, J.; Hernández-Hernández, N.; Riebesell, U. Responses of Microbial Metabolic Rates to Non-Equilibrated Silicate- versus Calcium-Based Ocean Alkalinity Enhancement. Biogeosciences 2024, 21, 5707–5724. [Google Scholar] [CrossRef]
- Matsuda, Y.; Hopkinson, B.M.; Nakajima, K.; Dupont, C.L.; Tsuji, Y. Mechanisms of Carbon Dioxide Acquisition and CO 2 Sensing in Marine Diatoms: A Gateway to Carbon Metabolism. Philosophical Transactions of the Royal Society B: Biological Sciences 2017, 372, 20160403. [Google Scholar] [CrossRef]
- Hopkinson, B.M.; Dupont, C.L.; Matsuda, Y. The Physiology and Genetics of CO2 Concentrating Mechanisms in Model Diatoms. Curr Opin Plant Biol 2016, 31, 51–57. [Google Scholar] [CrossRef]
- Oberlander, J.L.; Burke, M.E.; London, C.A.; Macintyre, H.L. Assessing the Impacts of Simulated Ocean Alkalinity Enhancement on Viability and Growth of Nearshore Species of Phytoplankton. Biogeosciences 2025, 22, 499–512. [Google Scholar] [CrossRef]
- Gately, J.A.; Kim, S.M.; Jin, B.; Brzezinski, M.A.; Iglesias-Rodriguez, M.D. Coccolithophores and Diatoms Resilient to Ocean Alkalinity Enhancement: A Glimpse of Hope? 2023, 9.
- Shi, Z.; Xu, J.; Li, X.; Li, R.; Li, Q. Links of Extracellular Enzyme Activities, Microbial Metabolism, and Community Composition in the River-Impacted Coastal Waters. J Geophys Res Biogeosci 2019, 124, 3507–3520. [Google Scholar] [CrossRef]
- Buchan, A.; LeCleir, G.R.; Gulvik, C.A.; González, J.M. Master Recyclers: Features and Functions of Bacteria Associated with Phytoplankton Blooms. Nat Rev Microbiol 2014, 12, 686–698. [Google Scholar] [CrossRef]
- McIlroy, S.J.; Nielsen, P.H. The Family Saprospiraceae. In The Prokaryotes; Springer Berlin Heidelberg: Berlin, Heidelberg, 2014; pp. 863–889. [Google Scholar]
- Xia, Y.; Kong, Y.; Thomsen, T.R.; Halkjær Nielsen, P. Identification and Ecophysiological Characterization of Epiphytic Protein-Hydrolyzing Saprospiraceae (“ Candidatus Epiflobacter” Spp.) in Activated Sludge. Appl Environ Microbiol 2008, 74, 2229–2238. [Google Scholar] [CrossRef]
- Hoppe, H.-G. Phosphatase Activity in the Sea. Hydrobiologia 2003, 493, 187–200. [Google Scholar] [CrossRef]
- Korlević, M.; Markovski, M.; Zhao, Z.; Herndl, G.J.; Najdek, M. Seasonal Dynamics of Epiphytic Microbial Communities on Marine Macrophyte Surfaces. Front Microbiol 2021, 12. [Google Scholar] [CrossRef] [PubMed]
- Miranda, L.N.; Hutchison, K.; Grossman, A.R.; Brawley, S.H. Diversity and Abundance of the Bacterial Community of the Red Macroalga Porphyra Umbilicalis: Did Bacterial Farmers Produce Macroalgae? PLoS One 2013, 8, e58269. [Google Scholar] [CrossRef] [PubMed]
- Grossart, H.; Levold, F.; Allgaier, M.; Simon, M.; Brinkhoff, T. Marine Diatom Species Harbour Distinct Bacterial Communities. Environ Microbiol 2005, 7, 860–873. [Google Scholar] [CrossRef] [PubMed]
- Pontiller, B.; Martínez-García, S.; Joglar, V.; Amnebrink, D.; Pérez-Martínez, C.; González, J.M.; Lundin, D.; Fernández, E.; Teira, E.; Pinhassi, J. Rapid Bacterioplankton Transcription Cascades Regulate Organic Matter Utilization during Phytoplankton Bloom Progression in a Coastal Upwelling System. ISME J 2022, 16, 2360–2372. [Google Scholar] [CrossRef]
- Delgadillo-Nuño, E.; Teira, E.; Pontiller, B.; Lundin, D.; Joglar, V.; Pedrós-Alió, C.; Fernández, E.; Pinhassi, J.; Martínez-García, S. Coastal Upwelling Systems as Dynamic Mosaics of Bacterioplankton Functional Specialization. Front Mar Sci 2023, 10. [Google Scholar] [CrossRef]
- Pontiller, B.; Martínez-García, S.; Joglar, V.; Amnebrink, D.; Pérez-Martínez, C.; González, J.M.; Lundin, D.; Fernández, E.; Teira, E.; Pinhassi, J. Rapid Bacterioplankton Transcription Cascades Regulate Organic Matter Utilization during Phytoplankton Bloom Progression in a Coastal Upwelling System. ISME Journal 2022, 16, 2360–2372. [Google Scholar] [CrossRef]
- Teeling, H.; Fuchs, B.M.; Becher, D.; Klockow, C.; Gardebrecht, A.; Bennke, C.M.; Kassabgy, M.; Huang, S.; Mann, A.J.; Waldmann, J.; et al. Substrate-Controlled Succession of Marine Bacterioplankton Populations Induced by a Phytoplankton Bloom. Science (1979) 2012, 336, 608–611. [Google Scholar] [CrossRef]
- Amin, S.A.; Parker, M.S.; Armbrust, E.V. Interactions between Diatoms and Bacteria. Microbiology and Molecular Biology Reviews 2012, 76, 667–684. [Google Scholar] [CrossRef]
- Eigemann, F.; Rahav, E.; Grossart, H.; Aharonovich, D.; Sher, D.; Vogts, A.; Voss, M. Phytoplankton Exudates Provide Full Nutrition to a Subset of Accompanying Heterotrophic Bacteria via Carbon, Nitrogen and Phosphorus Allocation. Environ Microbiol 2022, 24, 2467–2483. [Google Scholar] [CrossRef]
- Kieft, B.; Li, Z.; Bryson, S.; Hettich, R.L.; Pan, C.; Mayali, X.; Mueller, R.S. Phytoplankton Exudates and Lysates Support Distinct Microbial Consortia with Specialized Metabolic and Ecophysiological Traits. Proceedings of the National Academy of Sciences 2021, 118. [Google Scholar] [CrossRef]
- Seymour, J.R.; Amin, S.A.; Raina, J.-B.; Stocker, R. Zooming in on the Phycosphere: The Ecological Interface for Phytoplankton–Bacteria Relationships. Nat Microbiol 2017, 2, 17065. [Google Scholar] [CrossRef] [PubMed]
- Bunse, C.; Lundin, D.; Karlsson, C.M.G.; Akram, N.; Vila-Costa, M.; Palovaara, J.; Svensson, L.; Holmfeldt, K.; González, J.M.; Calvo, E.; et al. Response of Marine Bacterioplankton PH Homeostasis Gene Expression to Elevated CO2. Nat Clim Chang 2016, 6, 483–487. [Google Scholar] [CrossRef]
- Huang, R.; Sun, J.; Yang, Y.; Jiang, X.; Wang, Z.; Song, X.; Wang, T.; Zhang, D.; Li, H.; Yi, X.; et al. Elevated PCO2 Impedes Succession of Phytoplankton Community From Diatoms to Dinoflagellates Along With Increased Abundance of Viruses and Bacteria. Front Mar Sci 2021, 8. [Google Scholar] [CrossRef]
- Sperling, M.; Piontek, J.; Gerdts, G.; Wichels, A.; Schunck, H.; Roy, A.-S.; La Roche, J.; Gilbert, J.; Nissimov, J.I.; Bittner, L.; et al. Effect of Elevated CO 2 on the Dynamics of Particle-Attached and Free-Living Bacterioplankton Communities in an Arctic Fjord. Biogeosciences 2013, 10, 181–191. [Google Scholar] [CrossRef]
- Wang, Y.; Zhang, R.; Yang, Y.; Tu, Q.; Zhou, J.; Jiao, N. Ocean Acidification Altered Microbial Functional Potential in the Arctic Ocean. Limnol Oceanogr 2023, 68. [Google Scholar] [CrossRef]
- Xia, X.; Wang, Y.; Yang, Y.; Luo, T.; Van Nostrand, J.D.; Zhou, J.; Jiao, N.; Zhang, R. Ocean Acidification Regulates the Activity, Community Structure, and Functional Potential of Heterotrophic Bacterioplankton in an Oligotrophic Gyre. J Geophys Res Biogeosci 2019, 124, 1001–1017. [Google Scholar] [CrossRef]
Figure 1.
Map of the sampling area, including five sampling sites at the Negrito Bay, Angra do Heroísmo. a) Azores Archipelago location; b) Terceira Island location; c) Negrito bay location (Spatial data were projected using the WGS84 geodetic datum).
Figure 1.
Map of the sampling area, including five sampling sites at the Negrito Bay, Angra do Heroísmo. a) Azores Archipelago location; b) Terceira Island location; c) Negrito bay location (Spatial data were projected using the WGS84 geodetic datum).
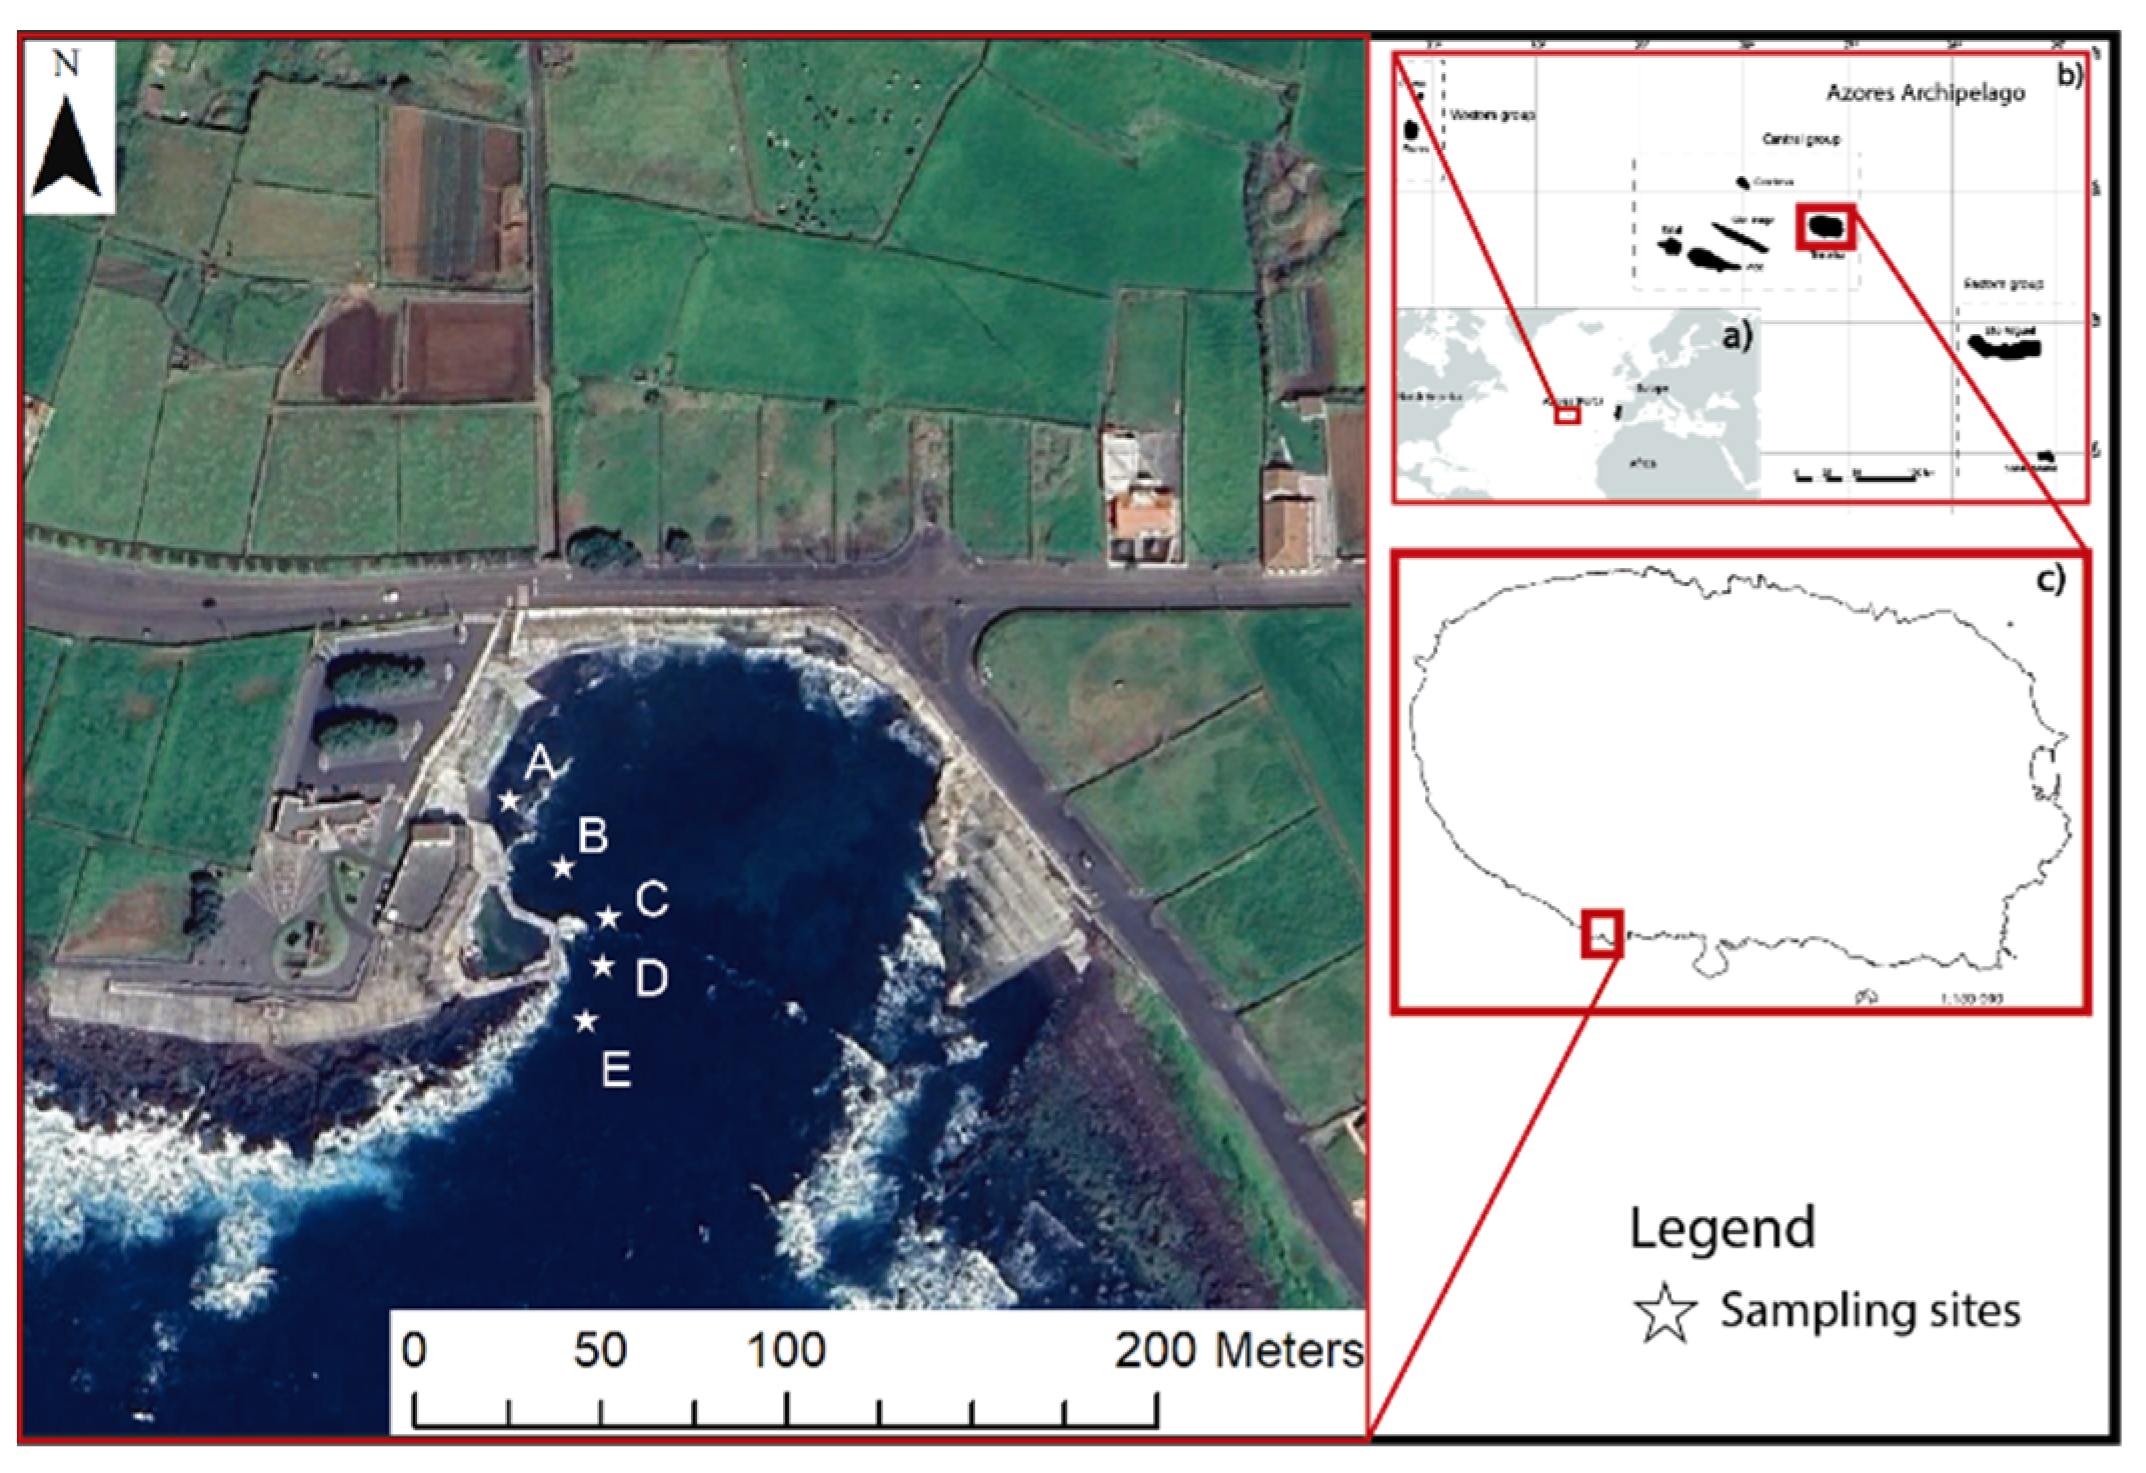
Figure 2.
Temporal development of inorganic nutrient concentrations of: (a) nitrate + nitrite; (b) phosphate; (c) silicate. Line colors indicate conditions: green for present alkalinity and blue for OAE. Line shading reflects nutrient treatment: lighter lines show natural nutrients (NN), while darker lines indicate enhanced nutrients (EN).
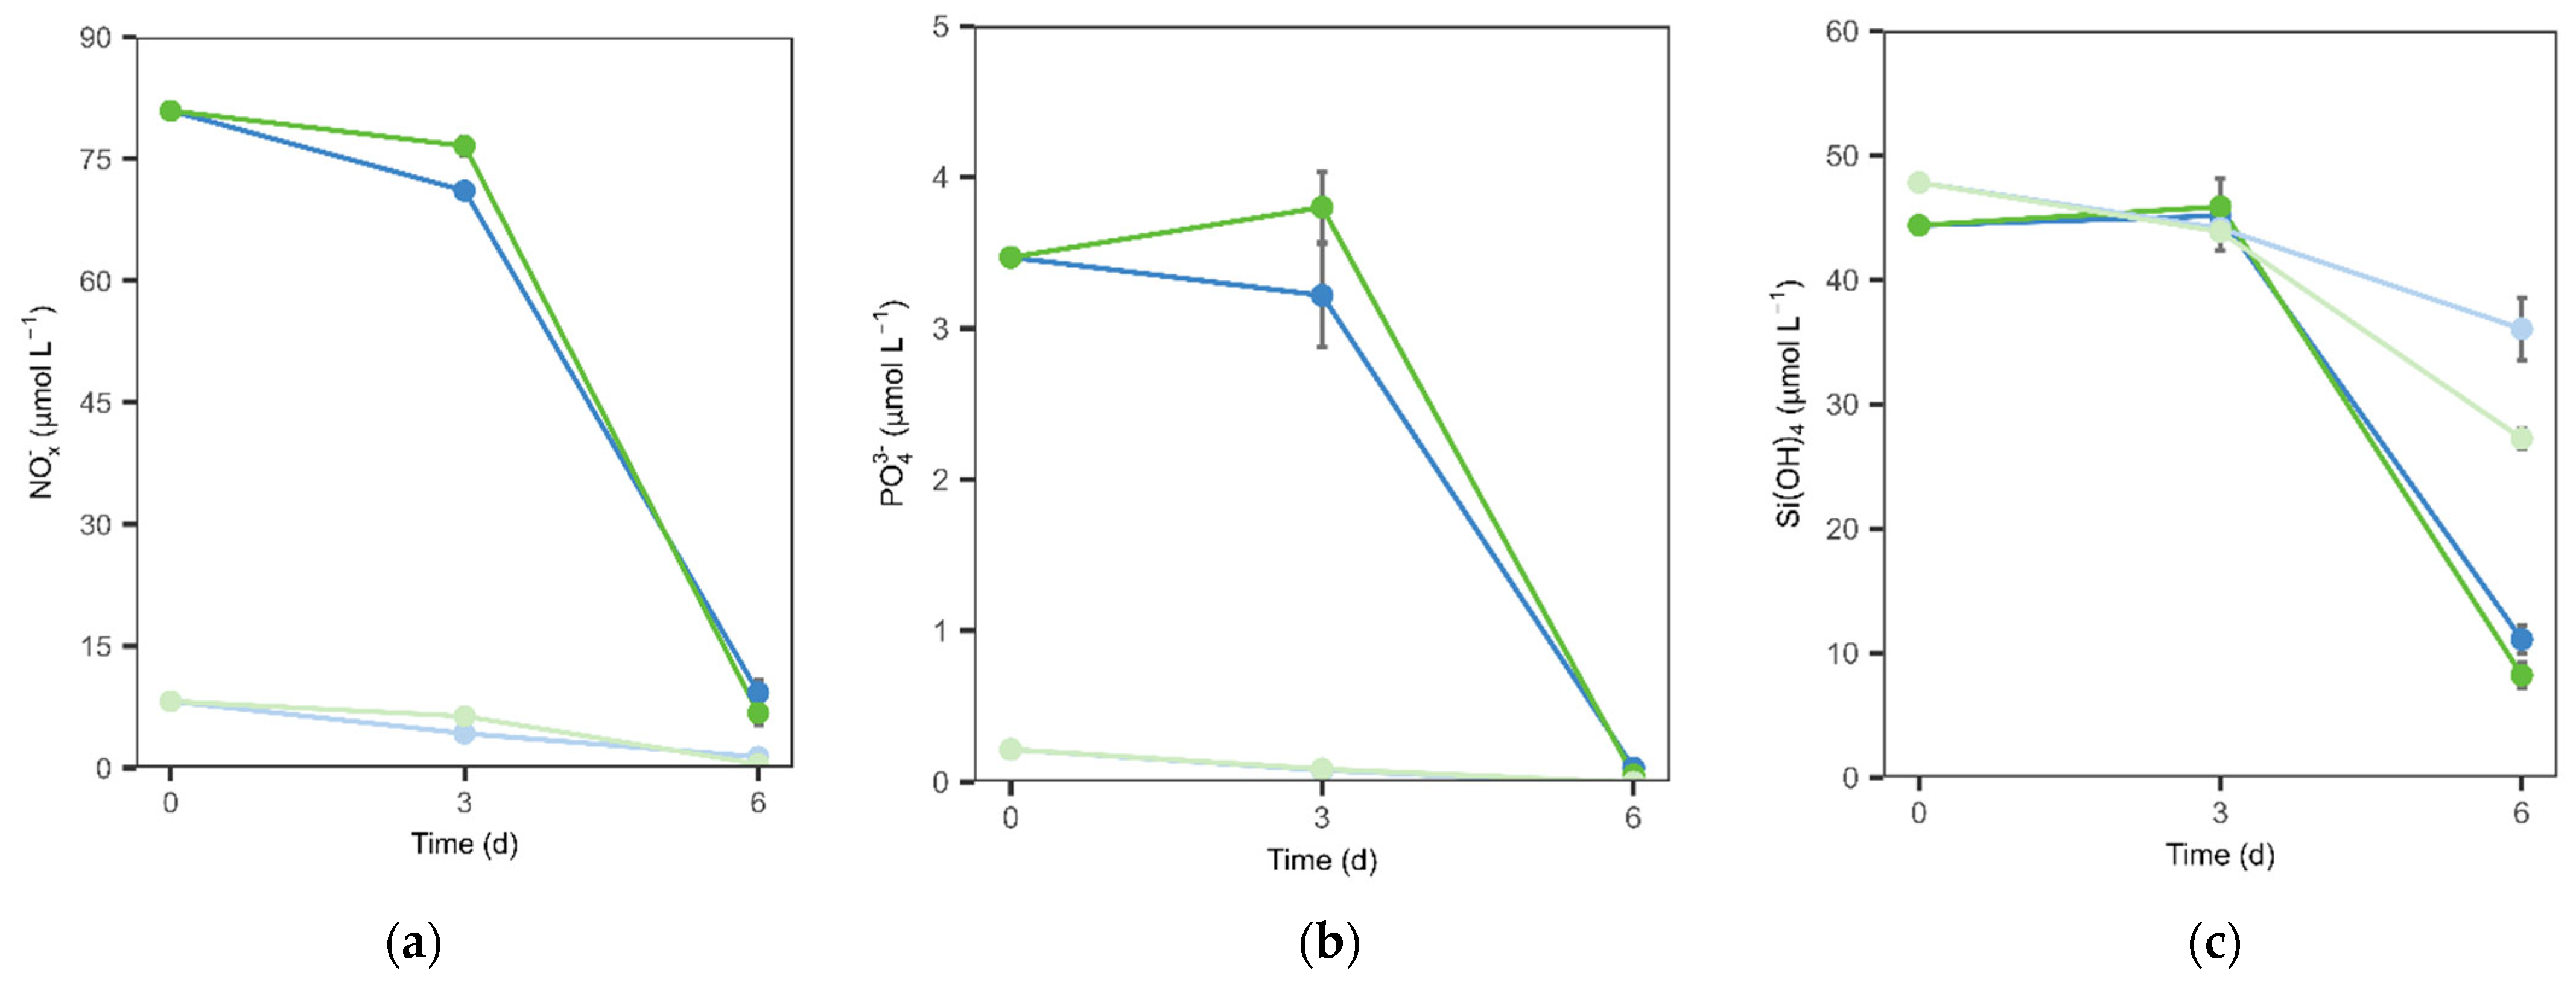
Figure 3.
Phytoplankton abundance throughout the experiment. Line colors indicate conditions: green for present alkalinity and blue for OAE. Line shading reflects nutrient treatment: lighter lines show natural nutrients (NN), while darker lines indicate enhanced nutrients (EN).
Figure 3.
Phytoplankton abundance throughout the experiment. Line colors indicate conditions: green for present alkalinity and blue for OAE. Line shading reflects nutrient treatment: lighter lines show natural nutrients (NN), while darker lines indicate enhanced nutrients (EN).
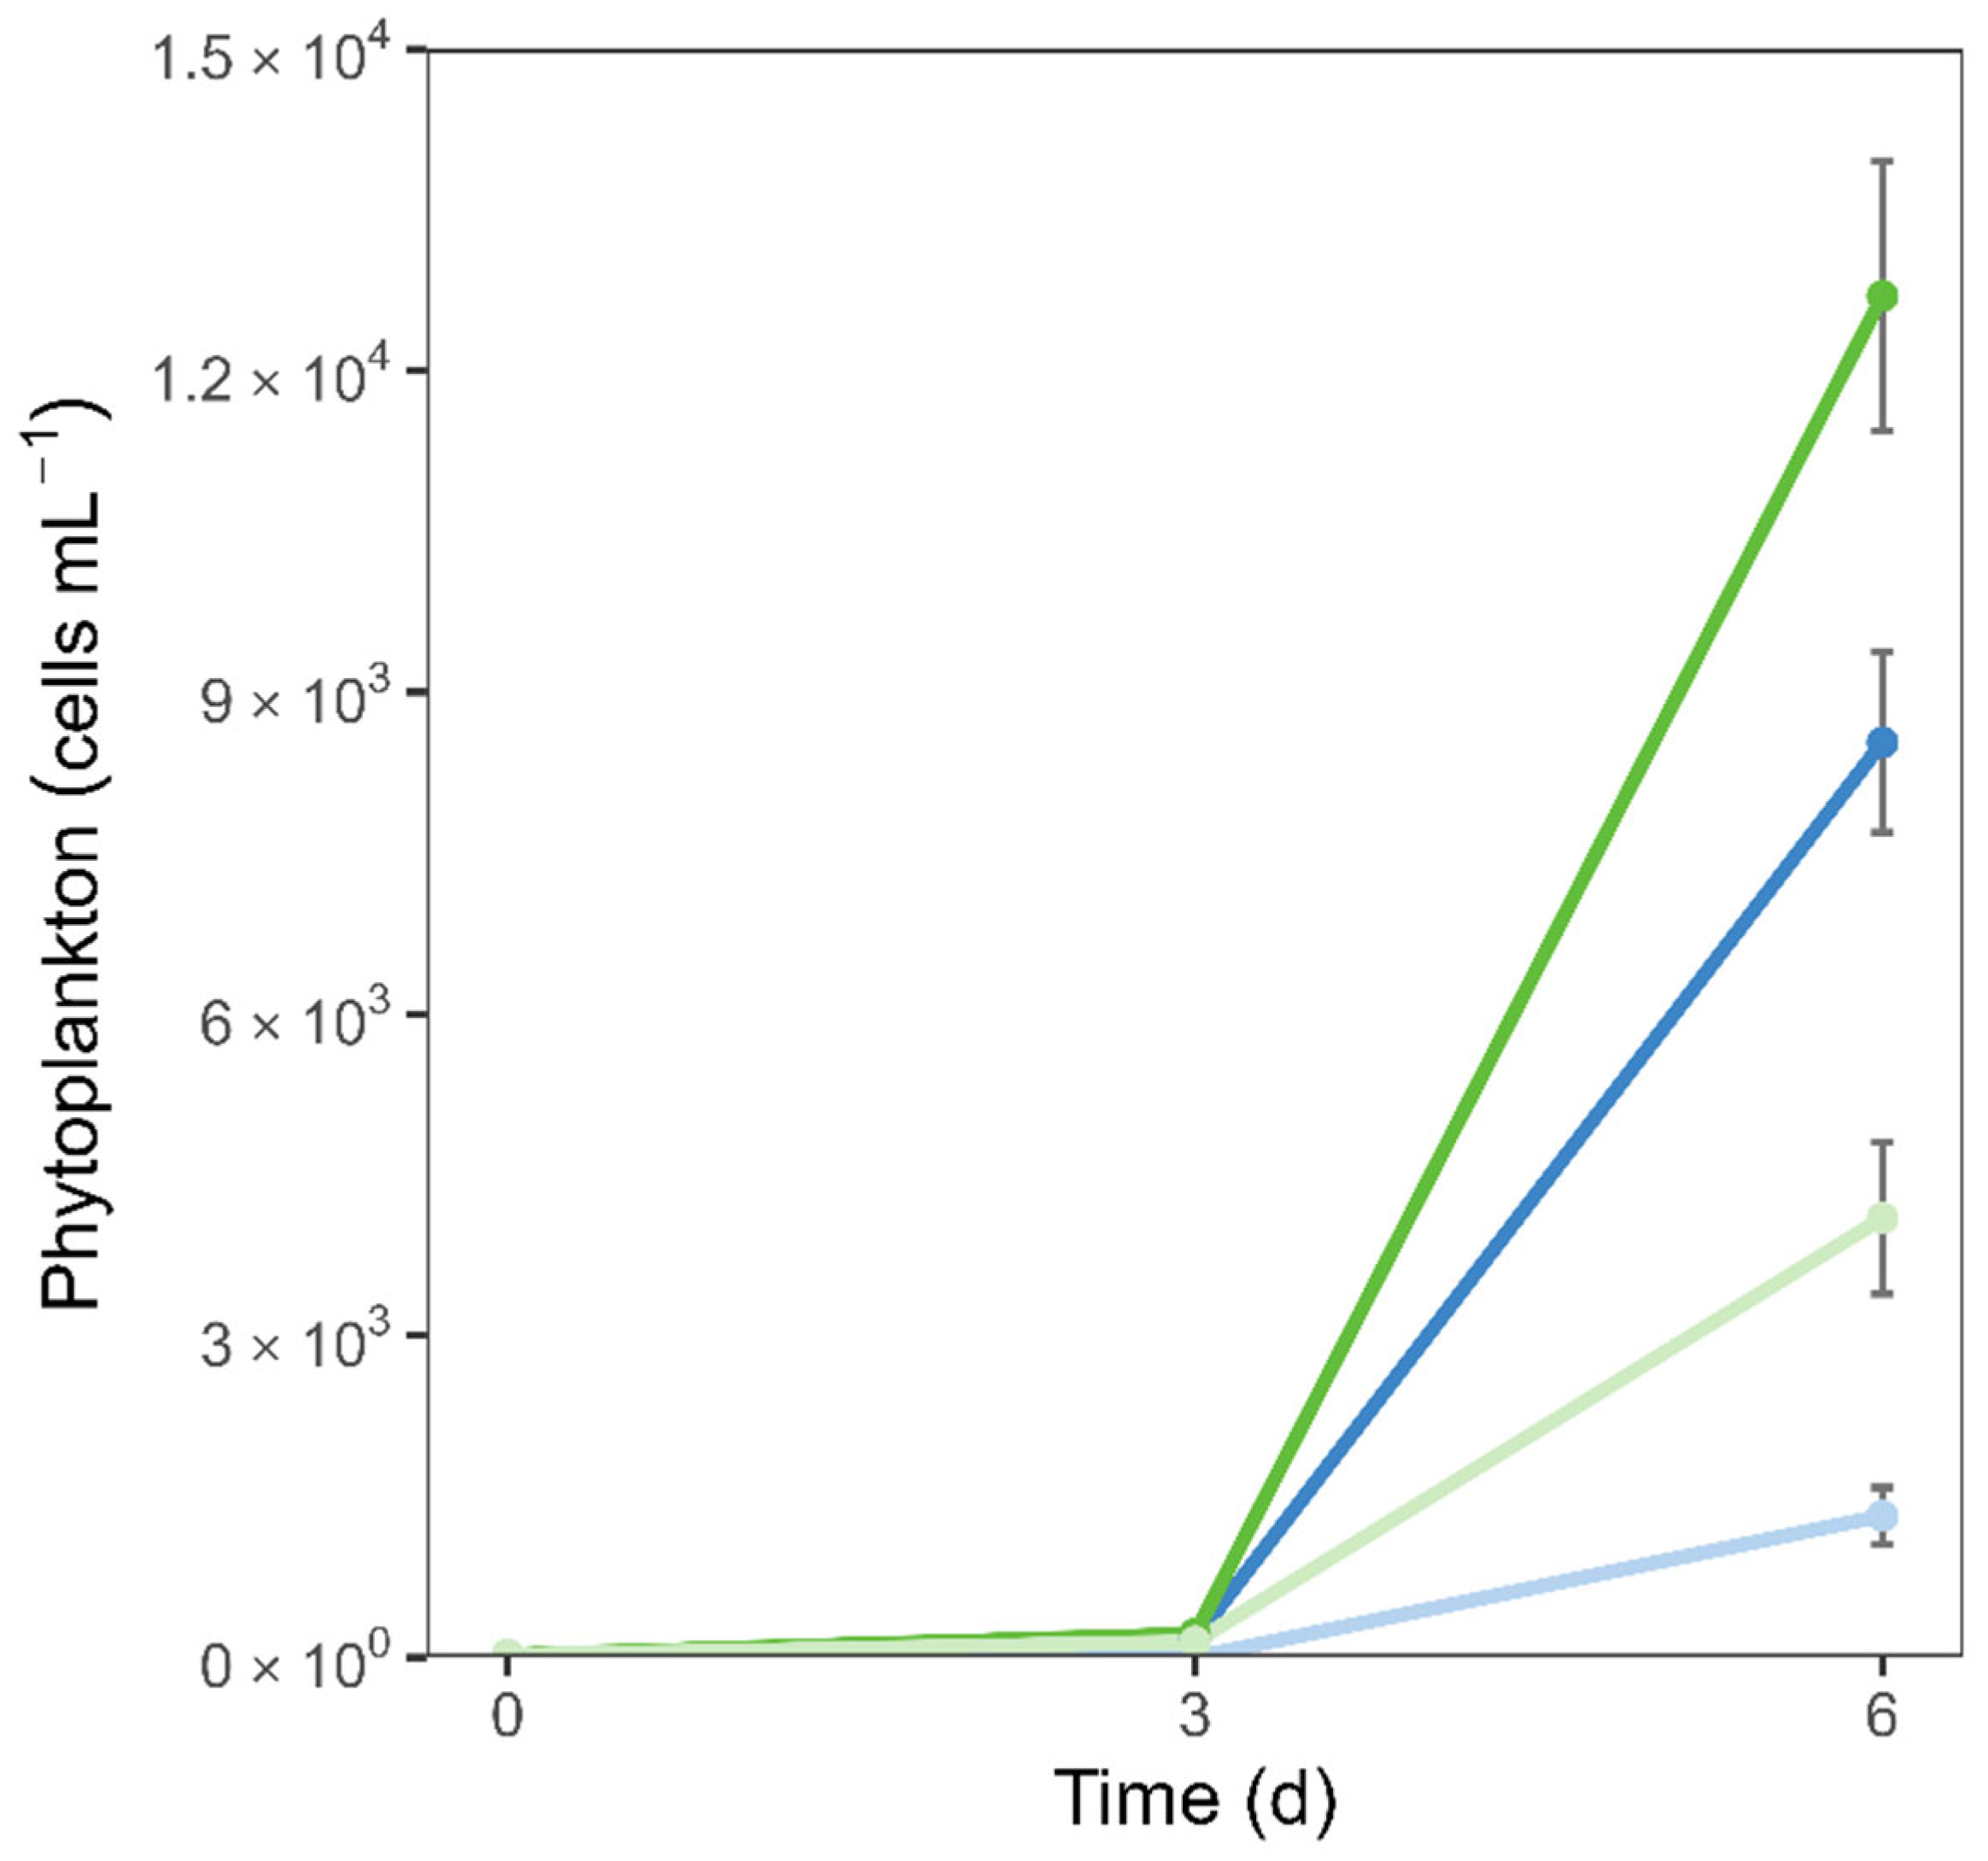
Figure 4.
Relative abundance of functional groups of phytoplankton of the total community on day 6. NN- natural nutrients; EN- enhanced nutrients; P – Present alkalinity; OAE – OAE.
Figure 4.
Relative abundance of functional groups of phytoplankton of the total community on day 6. NN- natural nutrients; EN- enhanced nutrients; P – Present alkalinity; OAE – OAE.
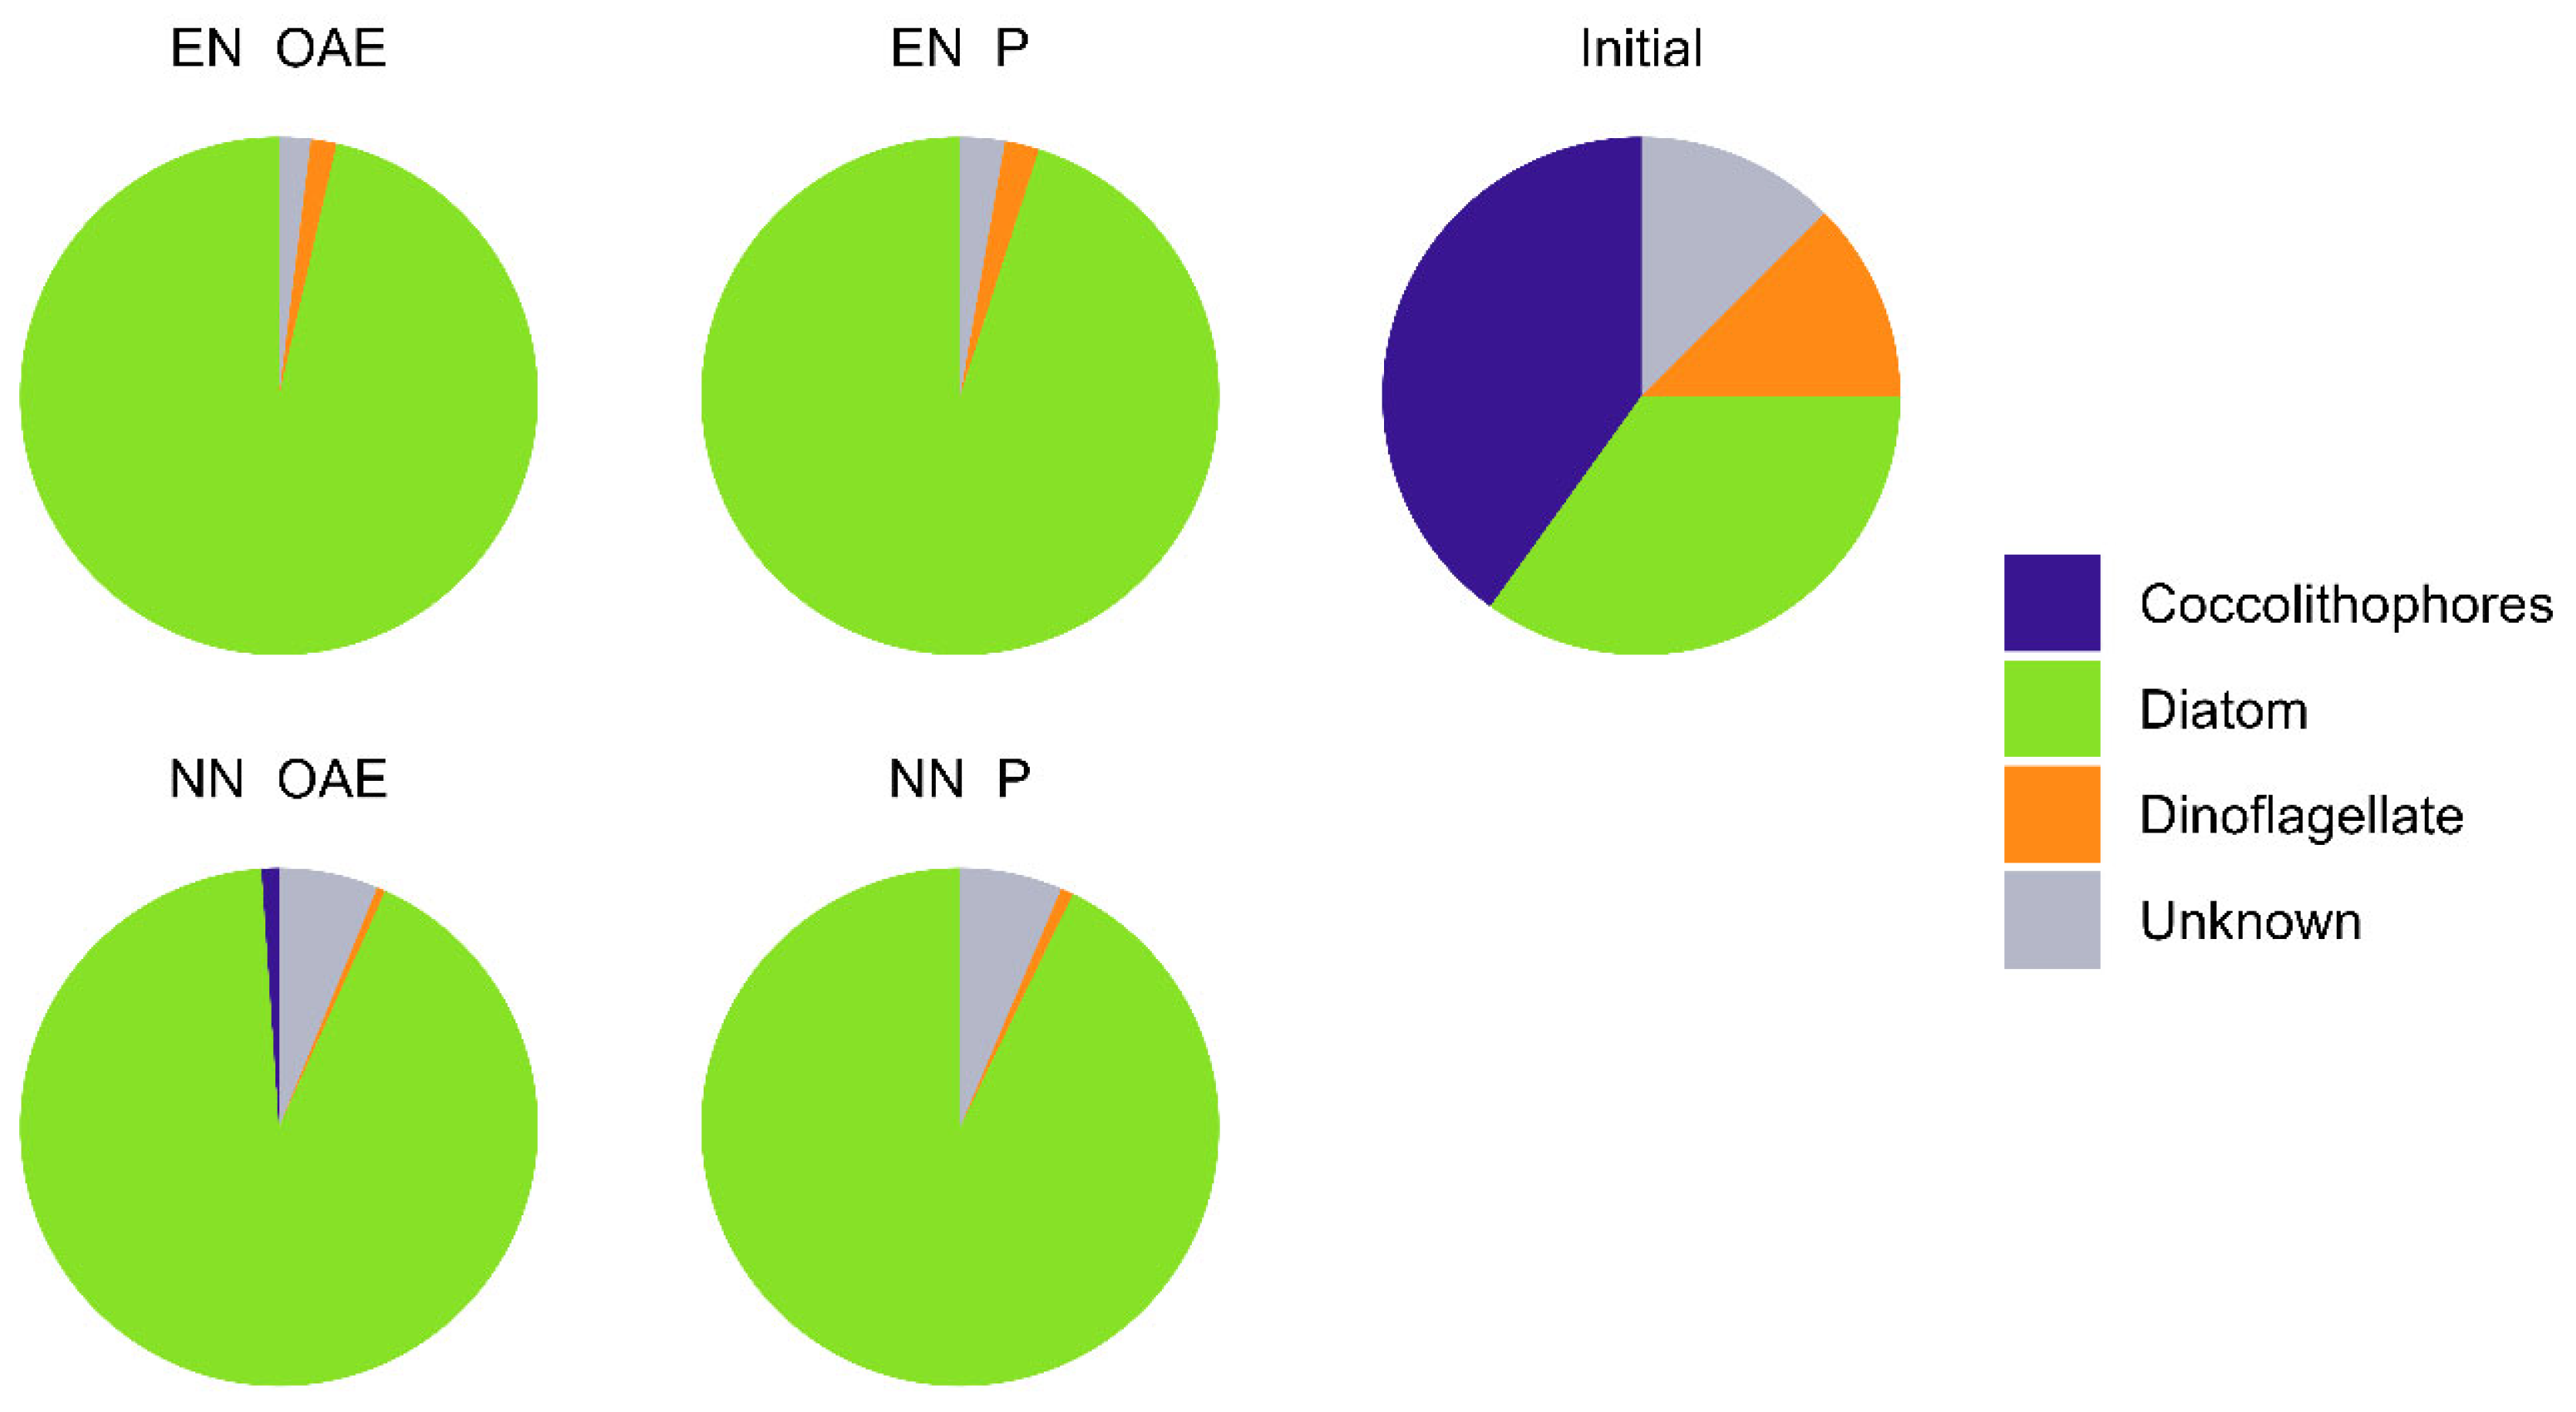
Figure 5.
Activity rates of: (a) leucine aminopeptidase; (b) alkaline phosphatase. Bar colors indicate conditions: green for present alkalinity and blue for OAE. Bar shading reflects nutrient treatment: lighter bars represent natural nutrients (NN), while darker bars indicate enhanced nutrients (EN).
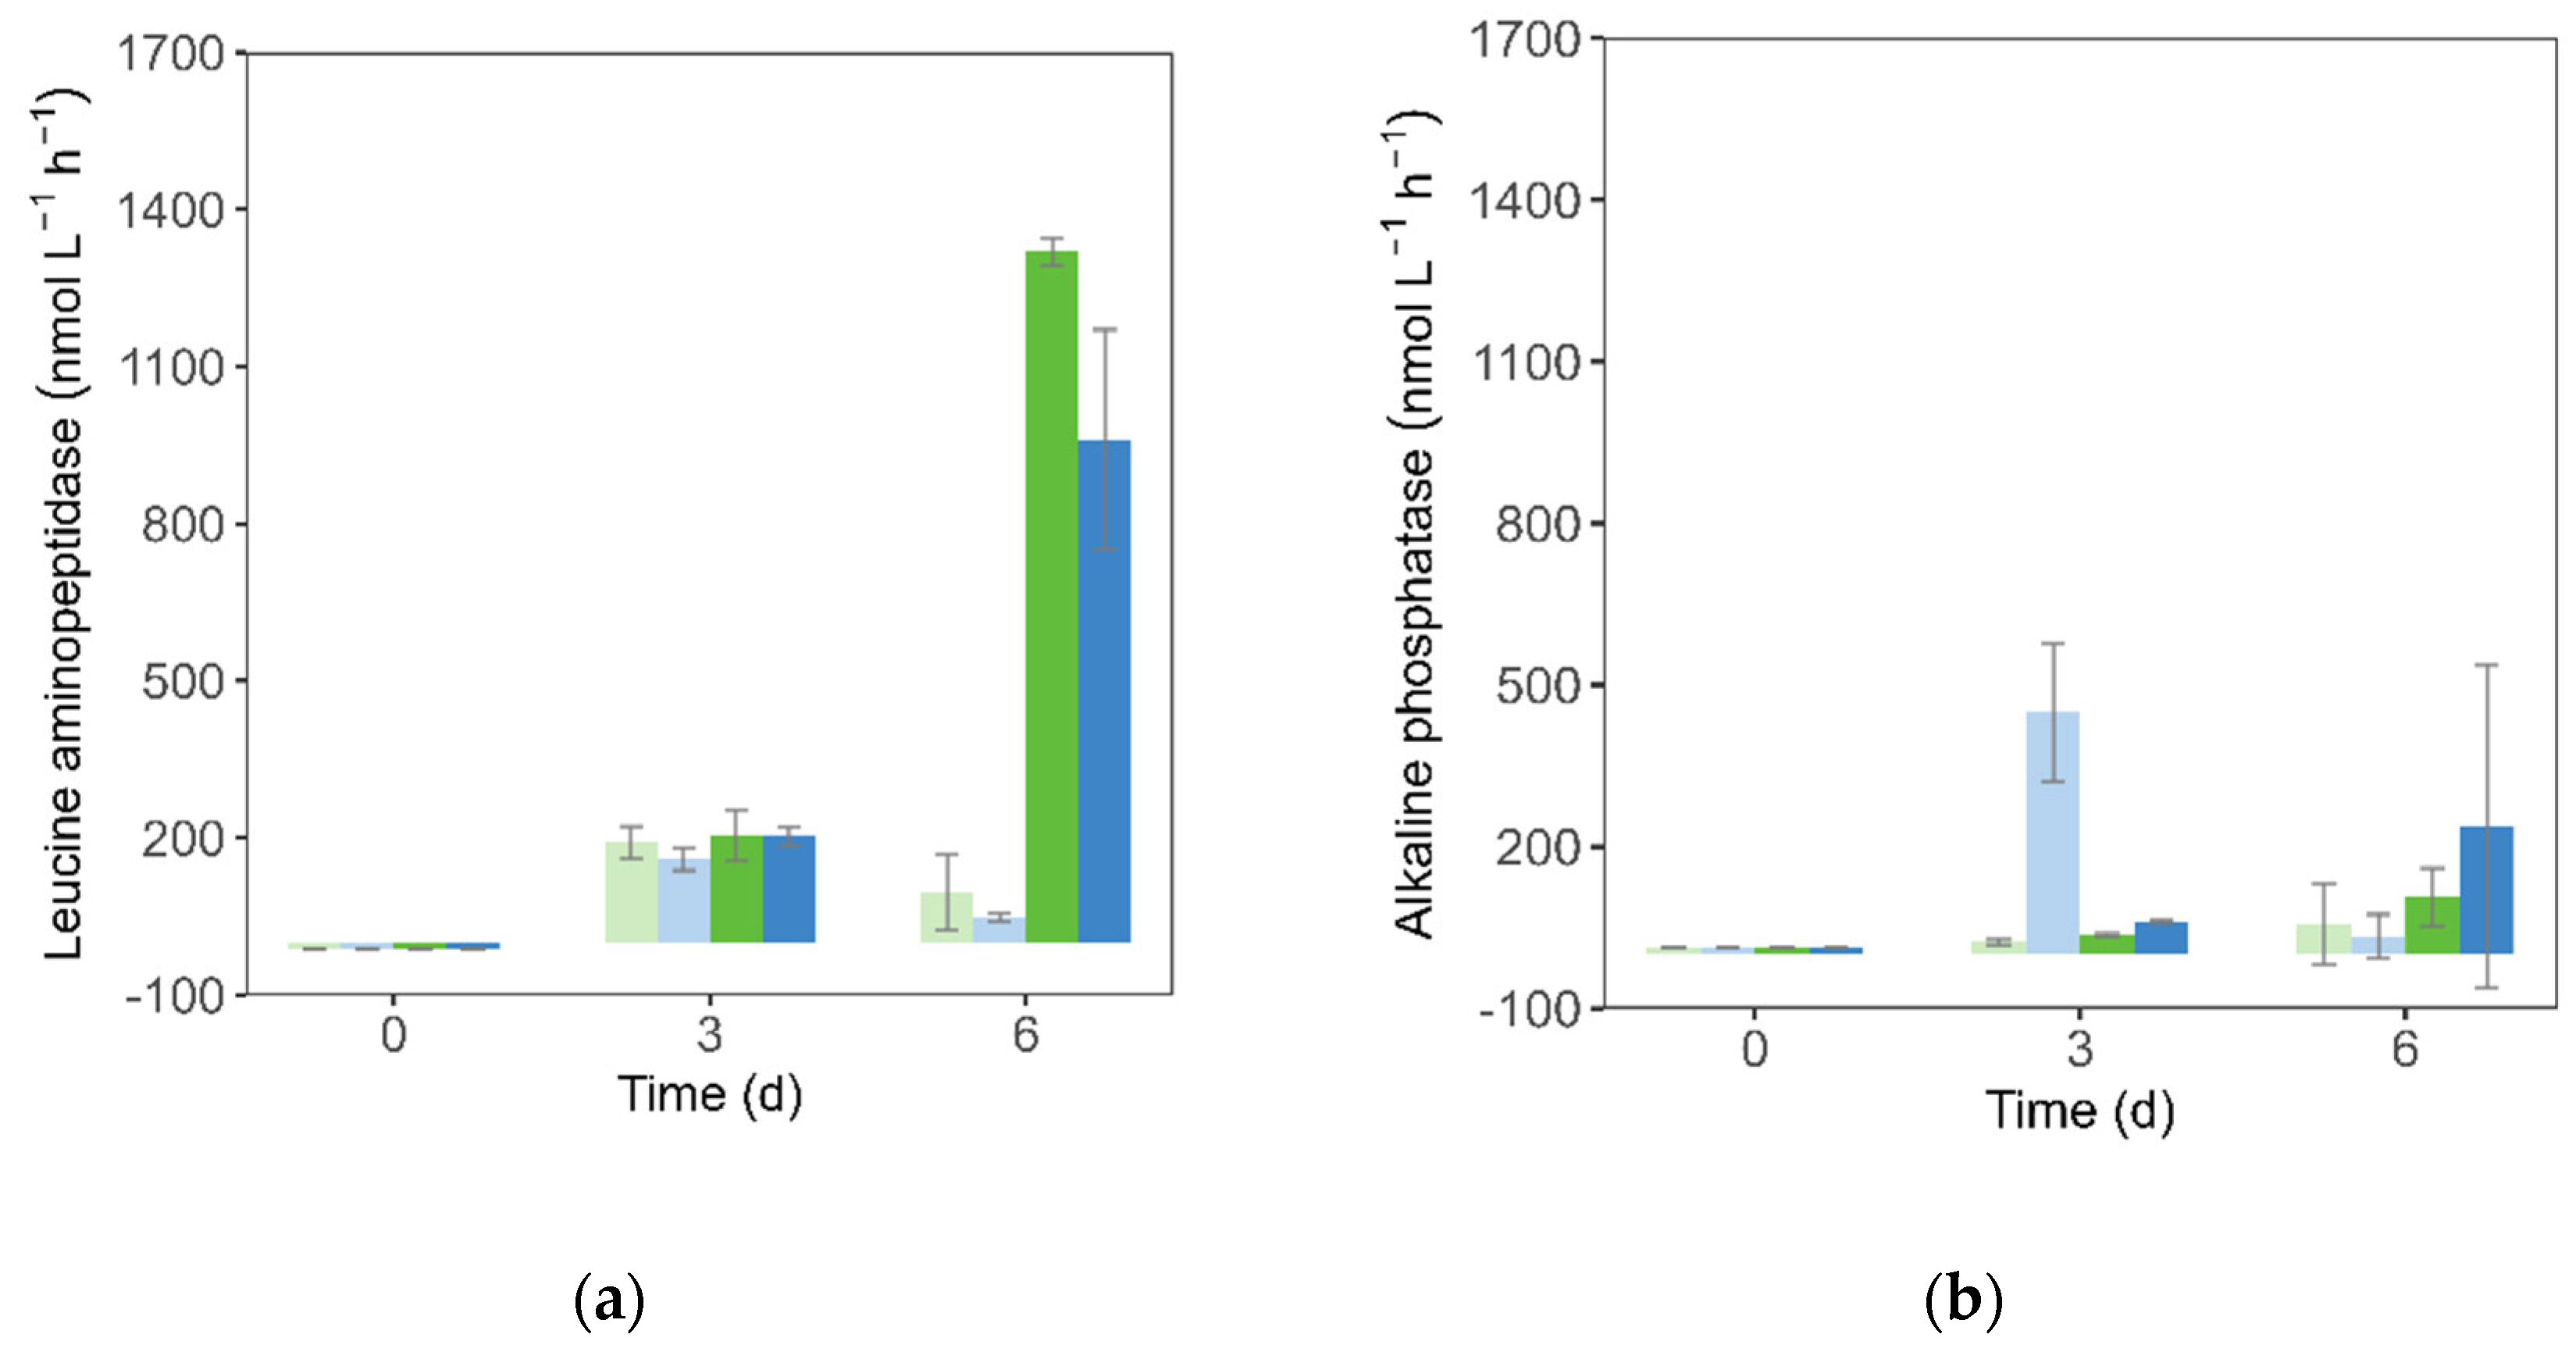
Figure 6.
Relative abundance of the 20 most abundant orders in the overall dataset. NN- natural nutrients; EN- enhanced nutrients; P – Present alkalinity; OAE – OAE.
Figure 6.
Relative abundance of the 20 most abundant orders in the overall dataset. NN- natural nutrients; EN- enhanced nutrients; P – Present alkalinity; OAE – OAE.
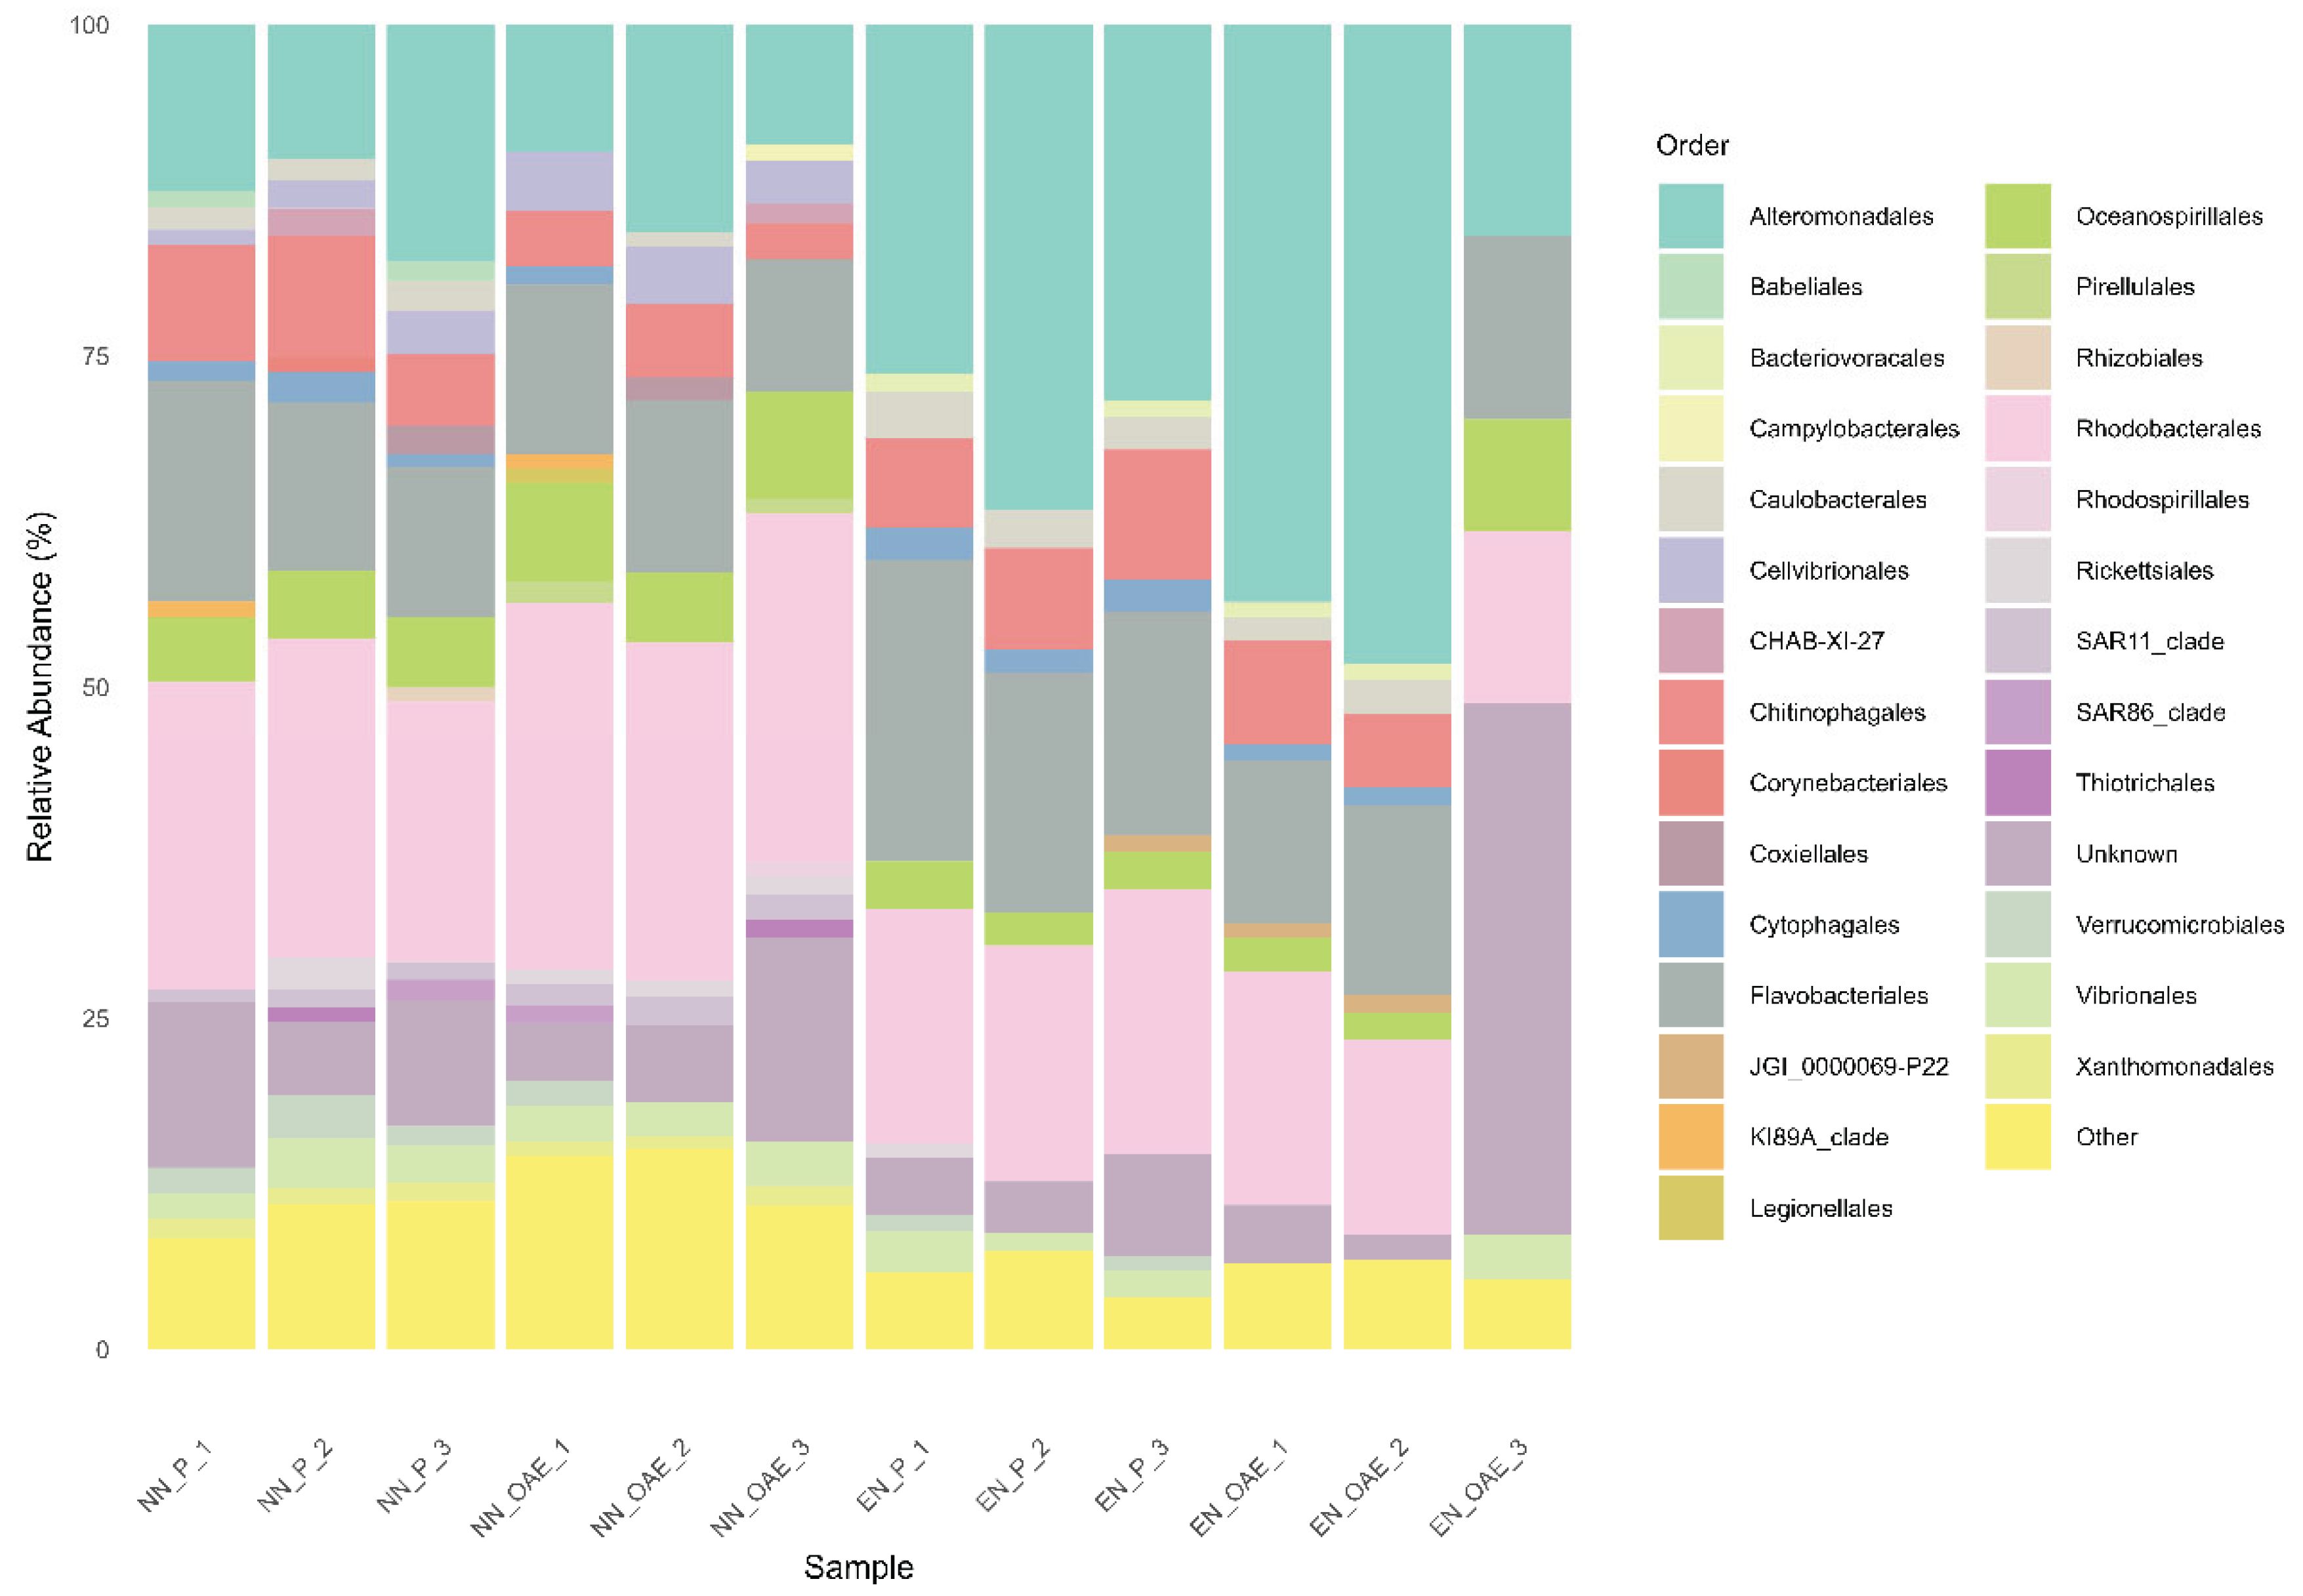

Table 1.
Inorganic nutrient starting conditions under the two nutrient treatments: natural (NN) and enhanced (EN).
Table 1.
Inorganic nutrient starting conditions under the two nutrient treatments: natural (NN) and enhanced (EN).
| Nutrient condition | NO3- (µM) | PO43- (µM) | Si(OH)4 (µM) | NO2- (µM) |
|---|---|---|---|---|
| NN | 7.91 | 0.24 | 47.81 | 0.31 |
| EN | 80.77 | 3.48 | 44.38 | 0.17 |
Table 2.
Inorganic nutrient starting conditions under the two nutrient treatments, NN and EN.
| TA (µmol kg-1) | pHt | pCO2 (µatm) | ||||||||
| Nutrients | Alkalinity | T0 | T3 | T6 | T0 | T3 | T6 | T0 | T3 | T6 |
| NN | Present | 2353 (0) | 2344 (0.89) | 2359 (1.78) | 8.05 (0) | 8.05 (0) | 8.28 (0.06) | 409 (0) | 399 (2.36) | 219 (37.99) |
| OAE | 2530 (0) | 2516 (1.39) | 2528 (0.74) | 8.28 (0) | 8.22 (0) | 8.25 (0) | 227 (0) | 267 (0.56) | 253 (3.30) | |
| EN | Present | 2353 (0) | 2332 (2.25) | 2406 (3.09) | 8.03 (0) | 8.01 (0) | 8.68 (0.03) | 429 (0) | 445 (1.65) | 60 (5.36) |
| OAE | 2524 (0) | 2505 (1.73) | 2537 (7.20) | 8.28 (0) | 8.24 (0.01) | 8.71 (0) | 228 (0) | 257 (3.73) | 57 (0.18) | |
Table 3.
Leucine aminopeptidase activity per phytoplankton cell at t6.
| Nutrients | Alkalinity | LAP activity (nmol L-1 h-1) per cell |
| NN | P | 2.1 ± 0.6 × 10⁻⁸ |
| OAE | 3.9 ± 0.4× 10⁻⁸ | |
| EN | P | 1.1 ± 0.1× 10⁻⁷ |
| OAE | 1.1 ± 0.1× 10⁻⁷ |
Table 4.
GLM results (ANOVA F-tests) showing the effect of alkalinity (present vs. OAE) on the relative abundance of dominant bacterial orders (>2.5% mean abundance) under natural (NN) and enhanced (EN) nutrient conditions. Significant p-values (p < 0.05) are shown in bold.
Table 4.
GLM results (ANOVA F-tests) showing the effect of alkalinity (present vs. OAE) on the relative abundance of dominant bacterial orders (>2.5% mean abundance) under natural (NN) and enhanced (EN) nutrient conditions. Significant p-values (p < 0.05) are shown in bold.
| Nutrient treatment | ||
|---|---|---|
| Orders | Natural (NN) | Enhanced (EN) |
| Oceanospirillales | 0.229 | 0.798 |
| Flavobacteriales | 0.764 | 0.002 |
| Vibrionales | 0.918 | − |
| Chitinophagales | 0.018 | 0.007 |
| Alteromonadales | 0.718 | 0.528 |
| Cellvibrionales | 0.026 | − |
| Rhodobacterales | 0.194 | 0.0391 |
Disclaimer/Publisher’s Note: The statements, opinions and data contained in all publications are solely those of the individual author(s) and contributor(s) and not of MDPI and/or the editor(s). MDPI and/or the editor(s) disclaim responsibility for any injury to people or property resulting from any ideas, methods, instructions or products referred to in the content. |
© 2025 by the authors. Licensee MDPI, Basel, Switzerland. This article is an open access article distributed under the terms and conditions of the Creative Commons Attribution (CC BY) license (http://creativecommons.org/licenses/by/4.0/).
Copyright: This open access article is published under a Creative Commons CC BY 4.0 license, which permit the free download, distribution, and reuse, provided that the author and preprint are cited in any reuse.


