
Submitted:
14 June 2025
Posted:
17 June 2025
You are already at the latest version
Abstract
Euryops abrotanifolius, commonly known as mountain resin bush, belongs to the Asteraceae family. Ethno-medicinally, it is used to treat chest ailments and as a general tonic for managing high blood pressure and diabetes. This research investigated the qualitative and quantitative metabolite profiling of methanolic extract from E. abrotanifolius using LC-MS and NMR and evaluates its anti-melanogenic and anti-diabetic potential as there has been no report on the phytochemistry as well as the mentioned inhibitory assays despite reports on some of its traditional uses. The air-dried plant material was macerated in 80 % aqueous methanol and fractionated with hexane, dichloromethane (DCM), ethyl acetate (EtOAc) and butanol (BuOH). LC-MS analysis led to the identification of 22 compounds in the methanolic extract. Additionally, three compounds were isolated for the first time from the plant and identified as ligularenolide (1), franchetianone B (2) and 1α-senecioyloxy-10β -hydroxyeremophil-7(11)-en-8α, 12-olide (3). The methanolic extract and the EtOAc soluble fraction showed favourable inhibitory activities against tyrosinase with IC50 values of 34.52 µg/mL and 53.26 µg/mL respectively, whereas the isolated compounds did not show any significant tyrosinase inhibitory activity. Despite reports of the plant being used traditionally for treating diabetes, the α-glucosidase and α-amylase inhibitory activities of the extracts and the isolated compounds did not substantiate this claim.
Keywords:
Asteraceae
; Euryops abrotanifolius
; phytochemistry
; diabetes
; melanogenesis
; tyrosinase
; α-glucosidase
; α-amylase
; inhibition
1. Introduction
E. abrotanifolius, commonly called mountain resin bush in English and bergharpuisbos and geelmagriet in Afrikaans is from the Asteraceae family. This plant is commonly found in the sandstones in Southwestern and Southern Cape, Cape Peninsula as well as the Arabian Peninsula (Notten, 2008, Davids et al., 2016). It is an upright shrub of about 0.2-2 m tall with bright yellow daisies (Figure 1). The plant is mostly smooth except for a small tuft of woolly hairs at the base of the flower stalk. The leaves are deep green, between 6 cm to 9 cm, positioned close to each other, and are divided into thin lobes (Notten, 2008). The stems and leaves are used in combination with Elytropappus rhinocerotis and Diosma oppositifolia as a general tonic for high blood pressure and diabetes as well as in treating chest complaints traditionally (Davids et al., 2016; Balogun and Ashafa, 2019). Diabetes, a disease characterized by abnormally high blood sugar levels, is usually managed traditionally, conventionally or a combination of the two. Since this plant has been reported to be used traditionally in treating diabetes, it is important to investigate its phytochemistry and to assess the isolated compounds for activity against α-glucosidase and α amylase, the enzymes responsible for the digestion of carbohydrates in the body.
To the best of our knowledge there is no existing report on the chemical constituents of E. abrotanifolius, although the phytochemistry of other species from the Euryops genus has been reported. Elkady et al., 2020 identified 25 compounds from E. pectinatus using MS/MS. Phenolic acids, which were mostly derivatives of caffeic, quinic, protocatechuic and sinapic acids were identified. Major flavonol glycosides reported were quercetin, kaempferol, isorhamnetin and syringetin glycosides. Rutin, dicaffeoyl quinic acid, quercetin-3-O-hexoside, kaempferol-O-rutinoside, caffeoyl malonylhexoside and hydroxy-octadecadienoic acid were the major compounds identified in the plant extract. The isolation of 18,19-dihydroxy-kaura-16-en-3-one, 7-hydroxy-3’,4’,6,8-tetramethoxyflavone, 5,6-dihydroxy-3’,4’,6,7-tetramethoxyflavone, 5-hydroxy-4’,6,7,8-tetramethoxy flavone, 5-hydroxy-3’,4’,7-trimethoxyflavone, 5-hydroxy-3’,4’,6,7,8-petamethoxyflavone, 5,8-dihydroxy-3’,4’,6,7-tetramethoxyflavone, 5-hydroxy-3′,4′,6,7-tetramethoxyflavone, 5,5′-dihydroxy-3′,4′,6,7-tetramethoxy flavone and 3’,8-dihydroxy-4’,5’,6,7-tetramethoxyflavone was reported from the chloroform-methanol extract of E. arabicus, another plant from the Euryops genus (Alarif et al., 2013; Abdel-Lateff et al., 2020).
Like its phytochemistry, the bioactivities of E. abrotanifolius have not been reported, although plants from the same genus have been explored for bioactivities. Extracts, fractions and compounds from E. arabicus which was obtained from Saudi Arabia, were reported to possess good antioxidant and immune stimulating properties. In addition, they also showed anticancer activities at various doses on human breast carcinoma (Alarif et al., 2013). Abdel-Lateff et al. (2020) reported reduced inflammation by E. arabicus extracts in carrageenan-induced male Wistar rats by 14.2 and 22.2 % at doses of 100 and 250 mg/kg respectively. In E. paniculatus, dicaffeoyl quinic acid, kaempferol-O-rutinoside, rutin, and isorhamnetin-O-rutinoside were found to be the most active compounds responsible for inhibiting PB1 protein, which is known to promote tumor growth, using in silico-molecular docking. In the same study, extracts from the plant’s flower-head also showed beneficial results in reducing multi-drug resistance (Elkady et al., 2020).
Melanin, produced by melanocytes, protects skin by absorbing visible light and UV radiation (Solano, 2020; Mostert, 2021). Eumelanin, the most common type of melanin in humans is dark due to broad absorption (Solano, 2020; Mostert, 2021). Excess melanin can lead to dermatological issues like hyperpigmentation, freckles, melasma, solar lentigo, cervical poikiloderma, age spots and skin cancer risks (Cestari et al., 2014; Nouveau et al., 2016; Dorga and Sarangal, 2014). Tyrosinase, a multi-copper enzyme found in animal tissues, drives melanin production and tanning, making anti-tyrosinase agents essential for controlling overproduction (Zolghadri et al., 2019; Chang, 2009). Common inhibitors like hydroquinone, azelaic acid, and kojic acid lighten skin but may cause side effects, necessitating safer alternatives (Liu, 2022). In this study, the anti-melanogenic potential of E. abrotanifolius was investigated.
2. Results and Discussion
Three compounds (Figure 2) were isolated from the combined hexane and DCM fractions of E. abrotanifolius. The structures of these compounds were determined by comparing their NMR spectroscopic data with the data present in literature (Liu et al., 2008; Burgueño-Tapia et al., 2006; Maldonado et al., 2008). These compounds were reported for the first time in this plant.
2.1. Structural Elucidation of Isolated Compounds
The comparison of NMR spectroscopic data obtained for the isolated compounds with those available in literature confirmed the compounds to be ligularenolide (1) (Liu et al., 2008), franchetianone B (2) (Burgueño-Tapia et al., 2006) and 1α-senecioyloxy-10β-hydroxyeremophil-7(11)-en-8α, 12-olide (3) (Maldonado et al., 2008). Melting point for compound 1 was observed at 135 ℃. The melting point of compounds 2 and 3 were observed at 159 ℃ and 200 ℃ which is similar to what was reported in literature (Burgueño-Tapia et al., 2006; Maldonado et al., 2008).
2.2. Identification of Compounds by LCMS
Chromatogram (Figure 3) was obtained by performing LC-MS on the methanolic extract (EAC) of E. abrotanifolius in a negative mode ([M-H]-). The proposed structures of the 22 compounds were predicted by comparing their m/z ratio as well as their fragmentation patterns against various data bases like UNPD, COCONUT, NPA, HMDB, KNApSAcK, ChEBI, FooDB, PubChem and NANPDBS.
The 22 identified compounds as well as their molecular formula, mass in the negative ion mode, peak intensity and retention time are presented in Table 1. The most abundant peaks were at retention times 4.65 (Palmitic acid), 6.66 minutes (Eucomic acid) and 11.05 minutes (Trigonotin A). The abundance of other compounds was presented in relation to the most prominent peak (Palmitic acid). A plant from the same genus, E. paniculatus, had similar compounds like chlorogenic acid, 3-O-feruloylquinic acid (Figure 4), 1,3-dicaffeoylquinic acid, rutin, 4-O-caffeoyl quinic acid, dicaffeoyl quinic acid hexoside and quercetin 3-galactoside reported from its LC-MS data (Elkady et al., 2020).
2.3. Tyrosinase Inhibitory Activities of Fractions and Isolated Compounds
Fractions from E. abrotanifolius were screened against mushroom tyrosinase at 100 µg/mL (Table 2). EtOAc fraction (EAE) had the strongest inhibition while BuOH (EAB) fraction had the weakest inhibitions at 50.35 ± 3.22 % and 28.25 ± 4.44 % respectively. IC50 was determined for all the fractions as the preliminary screening gave promising results. Screening of compounds 1, 2 and 3 against mushroom tyrosinase at 200 µM gave inhibition ranging from 14.1 ± 2.53 % to 23.3 ± 4.23 %. Although these activities were neither strong nor comparable with kojic acid, which was used as the positive control, IC50 was determined to ascertain the potential of the compounds as anti-tyrosinase agents as there has been no report of this in the literature. The IC50 of samples from E. abrotanifolius leaves (Table 2) resulted in the methanolic extract (EAC) having the strongest inhibition (34.52 µg/mL) despite having a weaker activity when compared to ethyl acetate fraction (EAE) in the preliminary screening. This could be attributed to the fact that EAC showed concentration independence as the inhibition ranged from 39.5 µg/mL to 41.2 µg/mL within a wide concentration of 31.25 to 250 µg/mL. The IC50 value of compound 2 was not reported due to the instability noticed in the experimental results as there was no reproducibility, the inhibitions had wide variations at the same experimental conditions. Compounds 1 and 3 were inactive as they had similar IC50 values of 1638 and 1633 µM respectively which may be attributed to the similarities in their chemical structures.
2.4. A-Glucosidase Activity of E. abrotanifolius
The inhibition of fractions from E. abrotanifolius against α-glucosidase at 200 µg/mL were observed at a close range of 0.3 ± 0.6 % to 3.2 ± 0.52 % for hexane fraction and methanolic extract respectively. The butanolic fraction had negative inhibition, therefore it was labelled “not determined”. The compounds had similar activities ranging from 5.06 to 7.10 % at the same concentration for compounds 3 and 1 respectively; this could be attributed to their similar chemical structures. All samples from this plant had weak inhibitory activity against the enzyme despite reports of the plant being used traditionally for treating diabetes, therefore further analysis was not done as the results did not substantiate this claim (Davids et al., 2016). The traditional use of the plant for diabetes could be related to its high antioxidant property rather than enzyme inhibition as E. arabicus, a plant from the same genus that has been reported to have a high antioxidant activity (Abdel-Lateff et al., 2020).
2.5. A-Amylase Activity of E. abrotanifolius
The amylase inhibitory activities of fractions from E. abrotanifolius on α-amylase enzymes at concentration of 100 µg/mL was investigated. The only fraction with activity (3.67 ± 1.05 %) is the DCM fraction. The other fractions had no activity. The compounds had weak amylase inhibitory activity at and 200 µM when compared to acarbose which was the positive control. The inhibitory activity of the compounds ranged from 1.98 ± 0.7 to 9.57 ± 1.81 % while acarbose’s was 71.19 ± 2% at the same concentration. Compounds 1 and 3 exhibits similar inhibition at 9.12 ± 2.78 and 9.57 ± 1.81 % respectively. Further assays were not done due to the weak activities of the samples against this enzyme.
3. Materials and Methods
3.1. Plant Material
The leaves were collected on 19th March, 2021 at Harold Porter National Botanical Garden, Betty’s Bay, Western Cape, South Africa, where it was identified by a taxonomist (Accession number: GHPG-182-2008). It was air dried at room temperature for 10 days and milled using a laboratory blender. The resulting plant material was weighed.
3.2. Equipment and Chemical Reagents
The NMR spectra (1D and 2D) were recorded on the Bruker Avance 400 MHz NMR spectrometer (Bruker, Rheinstetten, Germany) at 400 MHz and 100 MHz for proton (1H) and carbon (13C) respectively. The chemical shifts (δ) were reported in parts per million (ppm) and coupling constants (J) in Hz. The 1H and 13C NMR values were relative to the internal standard, tetramethyl silane (TMS) and were acquired in deuterated chloroform (CDCl3). Column chromatography was performed using normal-phase silica gel (particle size 0.063-0.2 mm; 70-230 mesh ASTM while TLC was performed on silica gel aluminum sheets (Silica gel 60 F254, Merck). Visualization of the spots on TLC sheets was achieved by spraying the sheets with vanillin sulfuric acid spray and applying heat from a heat gun. Liquid Chromatography- Mass Spectrometry (LC-MS) was used in analyzing the methanolic extract and BuOH fraction for the determination of the compounds present in the mixtures. This was achieved by dissolving the samples in 2 mL MeOH which were diluted 20 times and obtaining the chromatograms in a negative mode. The chromatograms were compared to UNPD, COCONUT, NPA, HMDB, KNApSAcK, ChEBI, FooDB, PubChem and NANPDBS databases to predict the present compounds.
3.3. Extraction and Fractionation of the Plant Material
Powdered E. abrotanifolius (270 g) was macerated in 80% methanol (4 x 1 L) and filtered after 24 hours. The filtrate was concentrated using a rotary evaporator at 45 ℃ until all the methanol was removed and then freeze dried for 72 hours. The dried methanolic extract (60.2 g) was dissolved in deionized water (250 mL) and successively extracted with hexane (150 mL), DCM (180 mL), EtOAc (200 mL) and BuOH (200 mL) in a separating funnel. The respective extracts were concentrated till dryness. Thin Layer Chromatography (TLC) was performed for each extract to visualize the profile and determine the suitable solvent system for the column chromatography (CC). Hexane and DCM extracts were combined due to their similar TLC profiles. The combined extracts (15 g) were fractionated using gradient elution initiated with 100% hexane and gradually increasing the polarity with EtOAc until 100% EtOAc to complete the elution. This resulted in the collection of 80 fractions. Compound 1 (56 mg), which is a pale-yellow powder, crystallized out from fractions 8, 9 and 10. Compounds 2 (100 mg) and 3 (60 mg), formed as white crystals from fractions 20-22 and 34-36 respectively. The crystals were washed with a mixture of hexane and DCM to remove any residual impurities.
3.4. Anti-melanogenic activity
The anti-melanogenic activity was ascertained by determining the tyrosinase inhibitory activity of the fractions and isolated compounds. A method described by Nerya et al. (2003) with some modifications was used. For the extracts, the stock solution (10 mg/mL) was prepared by dissolving each sample (10 mg) in DMSO (1 mL), while for the positive control (kojic acid) and isolated compounds, the stock solution (0.02 M) was prepared by dissolving the corresponding weight of the compounds, based on their molecular masses in DMSO (1 mL). The test samples were diluted from the stock solutions: 100 µg/mL and 200 µM for the extracts and compounds respectively. The reaction was initiated by introducing the test sample (70 µl) into a 96 well-plate, 30 µl of L-tyrosinase (1000 units/mL) was added immediately and the solution was incubated at room temperature (25 ℃) for 20 minutes. After this incubation, 100 µl of substrate (2 mM L-tyrosine) was added and a second incubation was done for 30minutes at the same temperature. The absorbance was read at 490nm after the incubation. For control without enzyme (C), background solvent (20 µl DMSO in 1980 µl distilled water) was used in place of the test samples while buffer of pH 6.5 was used in place of the enzyme. Kojic acid was used as positive control at various concentrations. The percentage inhibition was calculated using equation 1.
Where
CE: Absorbance of control with enzyme
C: Absorbance of control without enzyme
SE: Absorbance of the test sample with enzyme
S: Absorbance of test sample without enzyme
3.5. Alpha-Glucosidase Inhibitory Assay
The inhibitory activity of the plant extracts and isolated compounds against α-glucosidase from Saccharomyces cerevisiae was determined by a slight modification of the method reported by Yamaki and Mori (2006). The reaction mixture of 50 μL of phosphate buffer (50 mM, pH 6.8), sample (10 μL, 200 µg/mL) and 50 μL of α-glucosidase solution (1U/mL) was incubated at 37 ℃ for 15 minutes in a 96 well plate. After the initial incubation, 20 μL of 5 mM substrate which was p-nitrophenyl-α-D-glucopyranoside (p-NPG) was added to the reaction mixtures in the 96 well plates and incubated at 37 ℃ for 20 mins then the enzymatic reaction was terminated by adding 0.1 M sodium carbonate (Na2CO3) solution (50 μL). The enzymatic hydrolysis of the substrate was monitored by the amount of p-nitrophenol liberated in the reaction mixture at 405 nm using the AccuReader M965 Metertech (V1.11) spectrophotometer. Control without enzyme (C) was prepared by substituting enzyme with the phosphate buffer while in control with enzyme (CE), DMSO, which is diluted to the same concentration as the samples was used in place of the test samples. Acarbose at different concentrations was used as the positive control. All experiments were done in triplicates and the % inhibitory activity of the samples on α-glucosidase was calculated using equation 1.
3.6. Alpha-Amylase Inhibitory Assay
In a 96-well plate, 50 µL of phosphate buffer (0.01 M, pH 6.9), 20 µL of porcine pancreatic α-amylase (2 U/mL) solution and the test samples (20 µL) were added and incubated at room temperature for 20 minutes. Afterwards, 20 µL of 1 % soluble starch was added to the well plates and incubated further for 30 minutes at room temperature after which the reaction was stopped by the addition of 90 µL of 3,5-dinitro salicylic acid (DNS). The reaction mixture was placed in a boiling water bath for 10 minutes and the absorbance was read at 540 nm. Acarbose, at various concentrations was used as a standard and each experiment was done in triplicate. The percentage inhibitory activity of the α-amylase was calculated using equation 1.
4. Conclusions
The phytochemical studies of E. abrotanifolius resulted in the isolation of three known compounds; 1, 2 and 3. These compounds were isolated for the first time in this plant as there has been no report of either the phytochemical or bio-evaluation studies. Twenty-two metabolites were identified using LC-MS, the most abundant compounds were palmitic acid, eucomic acid, trigonotin A, chlorogenic acid and smilaside A. Despite reports of the plants being used traditionally to treat diabetes, the extracts and isolated compounds from the plants did not show significant α-amylase and α-glucosidase inhibitory activities. The methanolic extract (34.52 µg/mL) and the EtOAc fraction (53.26 µg/mL) showed good tyrosinase inhibitory activities while the compounds showed no inhibitions.
Supplementary Materials
The following supporting information can be downloaded at the website of this paper posted on Preprints.org.
Author Contributions
Conceptualization, W.T.M and O.I.W; methodology, W.T.M, A.A.H, R.S, O.I.W; formal analysis, O.I.W, M.Y, R.S; investigation, O.I.W, R.S, M.M, M.Y; resources, A.A.H, W.T.M.; writing—original draft preparation, O.I.W; writing—review and editing, M.Y, M.M, R.S, A.A.H, W,T,M; visualization, O.I.W, M.M, R.S, M.Y; supervision, W.T.M, A.A.H; project administration, W.T.M, A.A.H, R.S; funding acquisition, O.I.W, W.T.M, A.A.H. All authors have read and agreed to the published version of the manuscript
Funding
Please add: This research was funded by the National Research foundation-The World Academy of Science (NRF-TWAS), grant numbers 116101 and 139209 and the APC was funded by University of the Western Cape (UWC).
Institutional Review Board Statement
Not applicable.
Informed Consent Statement
Not applicable.
Data Availability Statement
Experimental data obtained from this research will be made available upon request from the corresponding author.
Acknowledgments
We thank Harold Porter National Botanical Garden, Betty’s Bay, Western Cape, South Africa for the provision of the plant material used in this study.
Conflicts of Interest
The authors declare no conflicts of interest.
References
- Abdel-Lateff, A.; Alarif, W.M.; Algandaby, M.M.; Alburae, N.A.; Abdel-Naim, A.B. Euryops arabicus displays anti-inflammatory activities in experimental models. J. Ethnopharmacol. 2020, 247, 112278. [CrossRef]
- Alarif, W.M.; Abdel-Lateff, A.; Al-Abd, A.M.; Basaif, S.A.; Badria, F.A.; Shams, M.; Ayyad, S.-E.N. Selective cytotoxic effects on human breast carcinoma of new methoxylated flavonoids from Euryops arabicus grown in Saudi Arabia. Eur. J. Med. Chem. 2013, 66, 204–210. [CrossRef]
- Balogun, F.O.; Ashafa, A.O.T. A Review of Plants Used in South African Traditional Medicine for the Management and Treatment of Hypertension. Planta Medica 2018, 85, 312–334. [CrossRef]
- Burgueño-Tapia, E., Hernández-Carlos, B., Joseph-Nathan, P. (2006). DFT, solution, and crystal conformation of eremophilanolides. Journal of molecular structure, 825(1-3), 115-123.
- Cestari, T. F., Dantas, L. P., Boza, J. C (2014). Acquired hyperpigmentations. Anais Brasileiros de Dermatologia. 89:11–25.
- Chang, T.-S. An Updated Review of Tyrosinase Inhibitors. Int. J. Mol. Sci. 2009, 10, 2440–2475. [CrossRef]
- Chen, H.-J.; Inbaraj, B.S.; Chen, B.-H. Determination of Phenolic Acids and Flavonoids in Taraxacum formosanum Kitam by Liquid Chromatography-Tandem Mass Spectrometry Coupled with a Post-Column Derivatization Technique. Int. J. Mol. Sci. 2011, 13, 260–285. [CrossRef]
- Davids, D.; Gibson, D.; Johnson, Q. Ethnobotanical survey of medicinal plants used to manage High Blood Pressure and Type 2 Diabetes Mellitus in Bitterfontein, Western Cape Province, South Africa. J. Ethnopharmacol. 2016, 194, 755–766. [CrossRef]
- Dorga, S., Sarangal, R. (2014). Pigmentary disorders: an insight. Pigment International, 1:5–7.
- Elkady, W.M.; Ayoub, I.M.; Abdel-Mottaleb, Y.; ElShafie, M.F.; Wink, M. Euryops pectinatus L. Flower Extract Inhibits P-glycoprotein and Reverses Multi-Drug Resistance in Cancer Cells: A Mechanistic Study. Molecules 2020, 25, 647. [CrossRef]
- Liu, J.-K. Natural products in cosmetics. Nat. Prod. Bioprospecting 2022, 12, 1–43. [CrossRef]
- Liu, J.-Q.; Zhang, M.; Zhang, C.-F.; Qi, H.-Y.; Bashall, A.; Bligh, S.A.; Wang, Z.-T. Cytotoxic sesquiterpenes from Ligularia platyglossa. Phytochemistry 2008, 69, 2231–2236. [CrossRef]
- Lusa, M.G.; Martucci, M.E.P.; Loeuille, B.F.P.; Gobbo-Neto, L.; Appezzato-Da-Glória, B.; Da Costa, F.B. Characterization and evolution of secondary metabolites in Brazilian Vernonieae (Asteraceae) assessed by LC-MS fingerprinting. Bot. J. Linn. Soc. 2016, 182, 594–611. [CrossRef]
- Lyu, X., Li, Y. H., Li, Y., Li, D., Han, C., Hong, H., Yu, T., Lida, H., Bin, L., Qiu, L. J. (2023). The domestication-associated L1 gene encodes a eucomic acid synthase pleiotropically modulating pod pigmentation and shattering in soybean. Molecular Plant, 16(7), 1178-1191.
- Maldonado, J.; Arciniegas, A.; Pérez-Castorena, A.-L.; Arciniegas, M.; Villasenor, J.L. Eremophilanolides from Roldana lobata. Z. Fur Naturforschung Sect. B-A J. Chem. Sci. 2008, 63, 331–334. [CrossRef]
- Mostert, A.B. Melanin, the What, the Why and the How: An Introductory Review for Materials Scientists Interested in Flexible and Versatile Polymers. Polymers 2021, 13, 1670. [CrossRef]
- Nerya, O.; Vaya, J.; Musa, R.; Izrael, S.; Ben-Arie, R.; Tamir, S. Glabrene and Isoliquiritigenin as Tyrosinase Inhibitors from Licorice Roots. J. Agric. Food Chem. 2003, 51, 1201–1207. [CrossRef]
- Notten, A. (2008). E. abrotanifolius. Kirstenbosch National Botanical Garden, South African National Biodiversity Institute. Plantz Africa http://pza.sanbi.org/euryops abrotanifolius.
- Nayak, C.S.; Nouveau, S.; Agrawal, D.; Kohli, M.; Bernerd, F.; Misra, N. Skin hyperpigmentation in Indian population: Insights and best practice. Indian J. Dermatol. 2016, 61, 487–95. [CrossRef]
- Paponov, M.; Ziegler, J.; Paponov, I.A. Light exposure of roots in aeroponics enhances the accumulation of phytochemicals in aboveground parts of the medicinal plants Artemisia annua and Hypericum perforatum. Front. Plant Sci. 2023, 14, 1079656. [CrossRef]
- Solano, F. Photoprotection and Skin Pigmentation: Melanin-Related Molecules and Some Other New Agents Obtained from Natural Sources. Molecules 2020, 25, 1537. [CrossRef]
- Sotenjwa, V.Z.; Chen, W.; Veale, C.G.; Anokwuru, C.P.; Tankeu, S.Y.; Combrinck, S.; Kamatou, G.P.; Viljoen, A.M. Chemotypic variation of non-volatile constituents of Artemisia afra (African wormwood) from South Africa. Fitoterapia 2020, 147, 104740. [CrossRef]
- Simirgiotis, M.J.; Benites, J.; Areche, C.; Sepúlveda, B. Antioxidant Capacities and Analysis of Phenolic Compounds in Three Endemic Nolana Species by HPLC-PDA-ESI-MS. Molecules 2015, 20, 11490–11507. [CrossRef]
- Waithaka, J. (2004). The evaluation of markers for quality control studies of flavonoid-containing medicinal preparations (Doctoral dissertation, University of the Western Cape).
- Yamaki, K.; Mori, Y. Evaluation of .ALPHA.-glucosidase Inhibitory Activity in Colored Foods: a Trial Using Slope Factors of Regression Curves. Nippon. Shokuhin Kagaku Kogaku Kaishi 2006, 53, 229–231. [CrossRef]
- Zolghadri, S.; Bahrami, A.; Hassan Khan, M.T.; Munoz-Munoz, J.; Garcia-Molina, F.; Garcia-Canovas, F.; Saboury, A.A. A comprehensive review on tyrosinase inhibitors. J. Enzym. Inhib. Med. Chem. 2019, 34, 279–309. [CrossRef]
Figure 1.
Pictures of E. abrotanifolius plant (a) during flowering and (b) non-flowering stages.
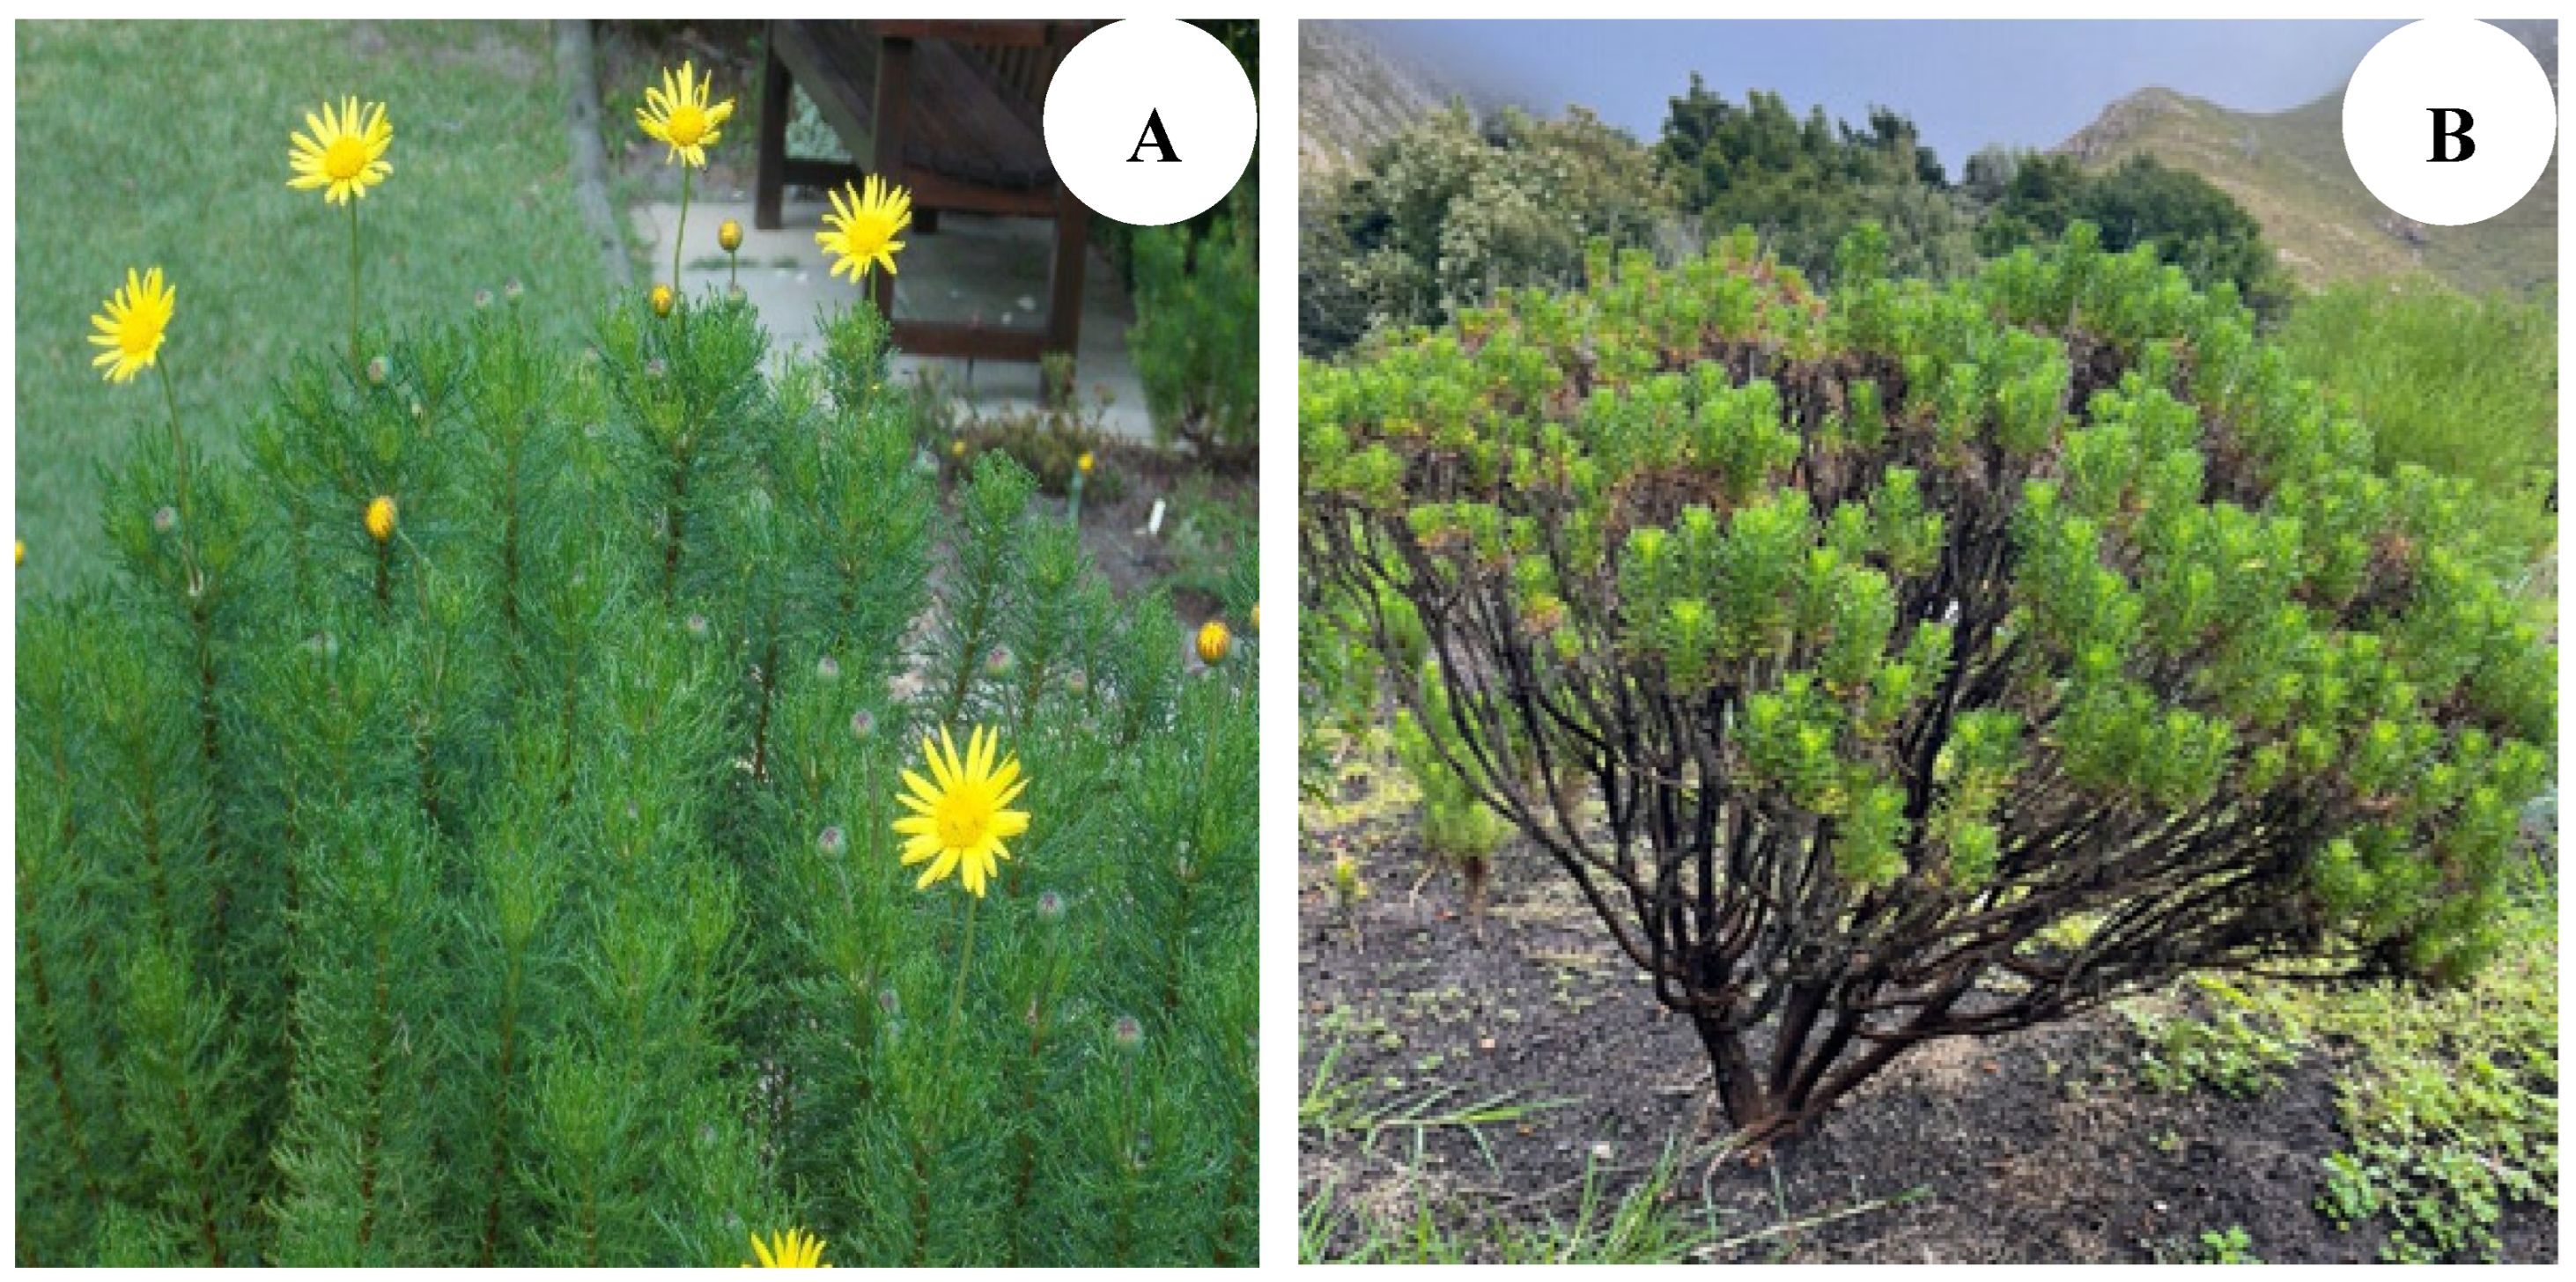
Figure 2.
Chemical structure of isolated compounds from E. abrotanifolius.
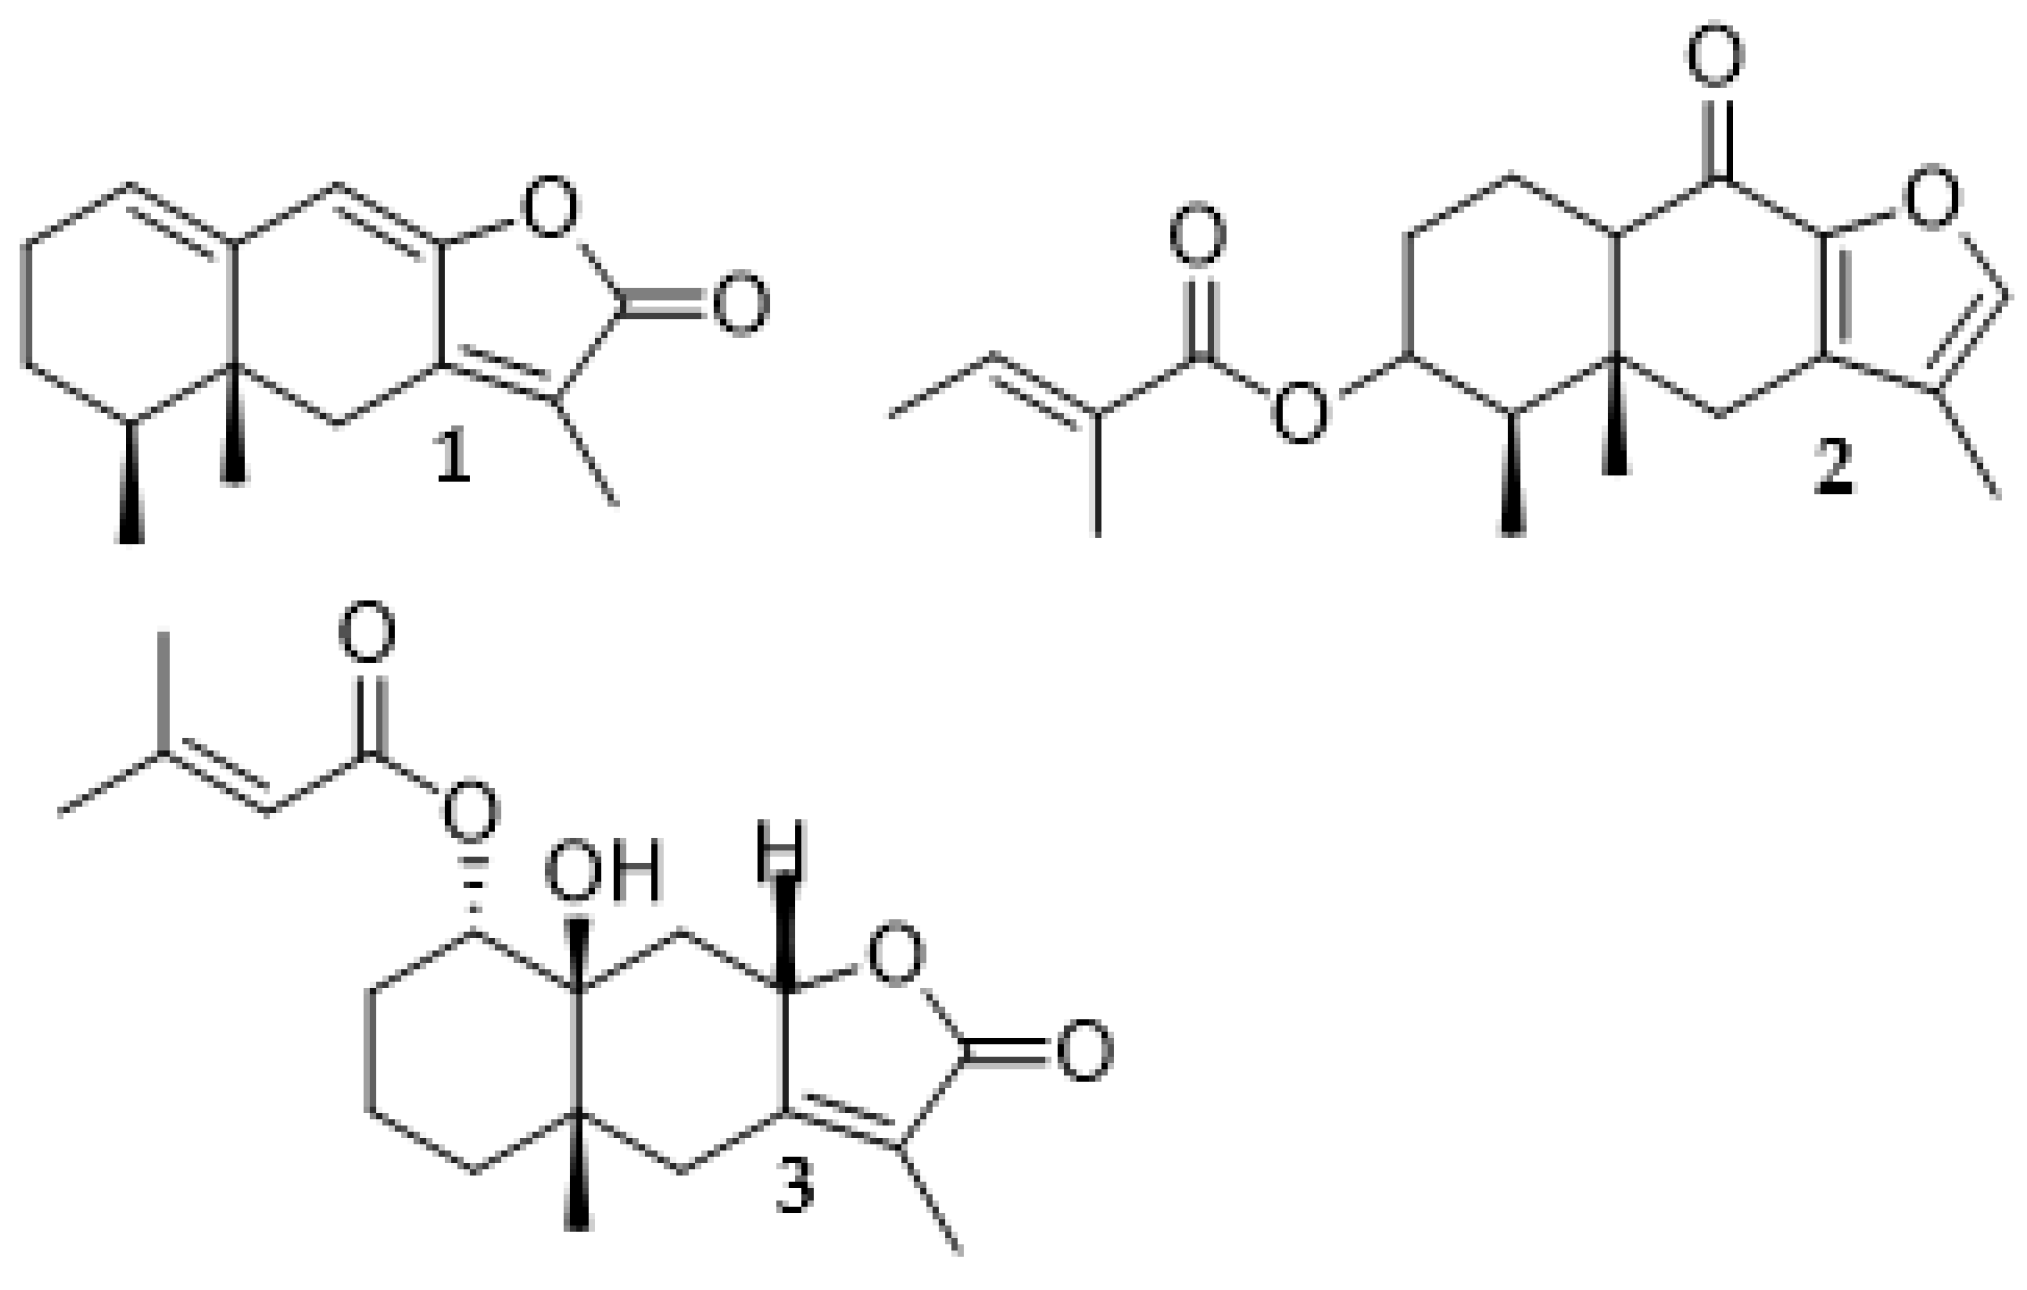
Figure 3.
LC-MS chromatogram of methanolic extract of E. abrotanifolius.
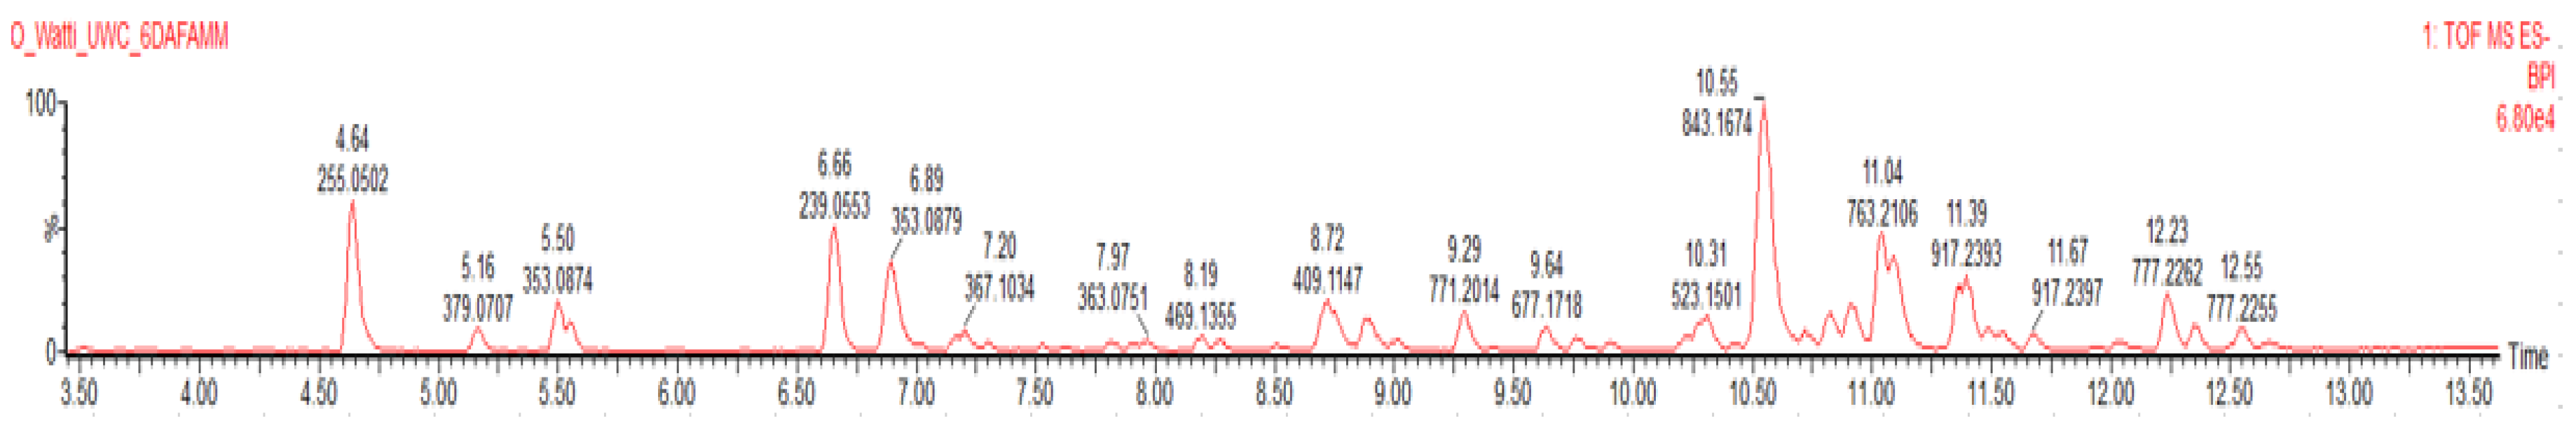
Figure 4.
Major compounds identified by LCMS.
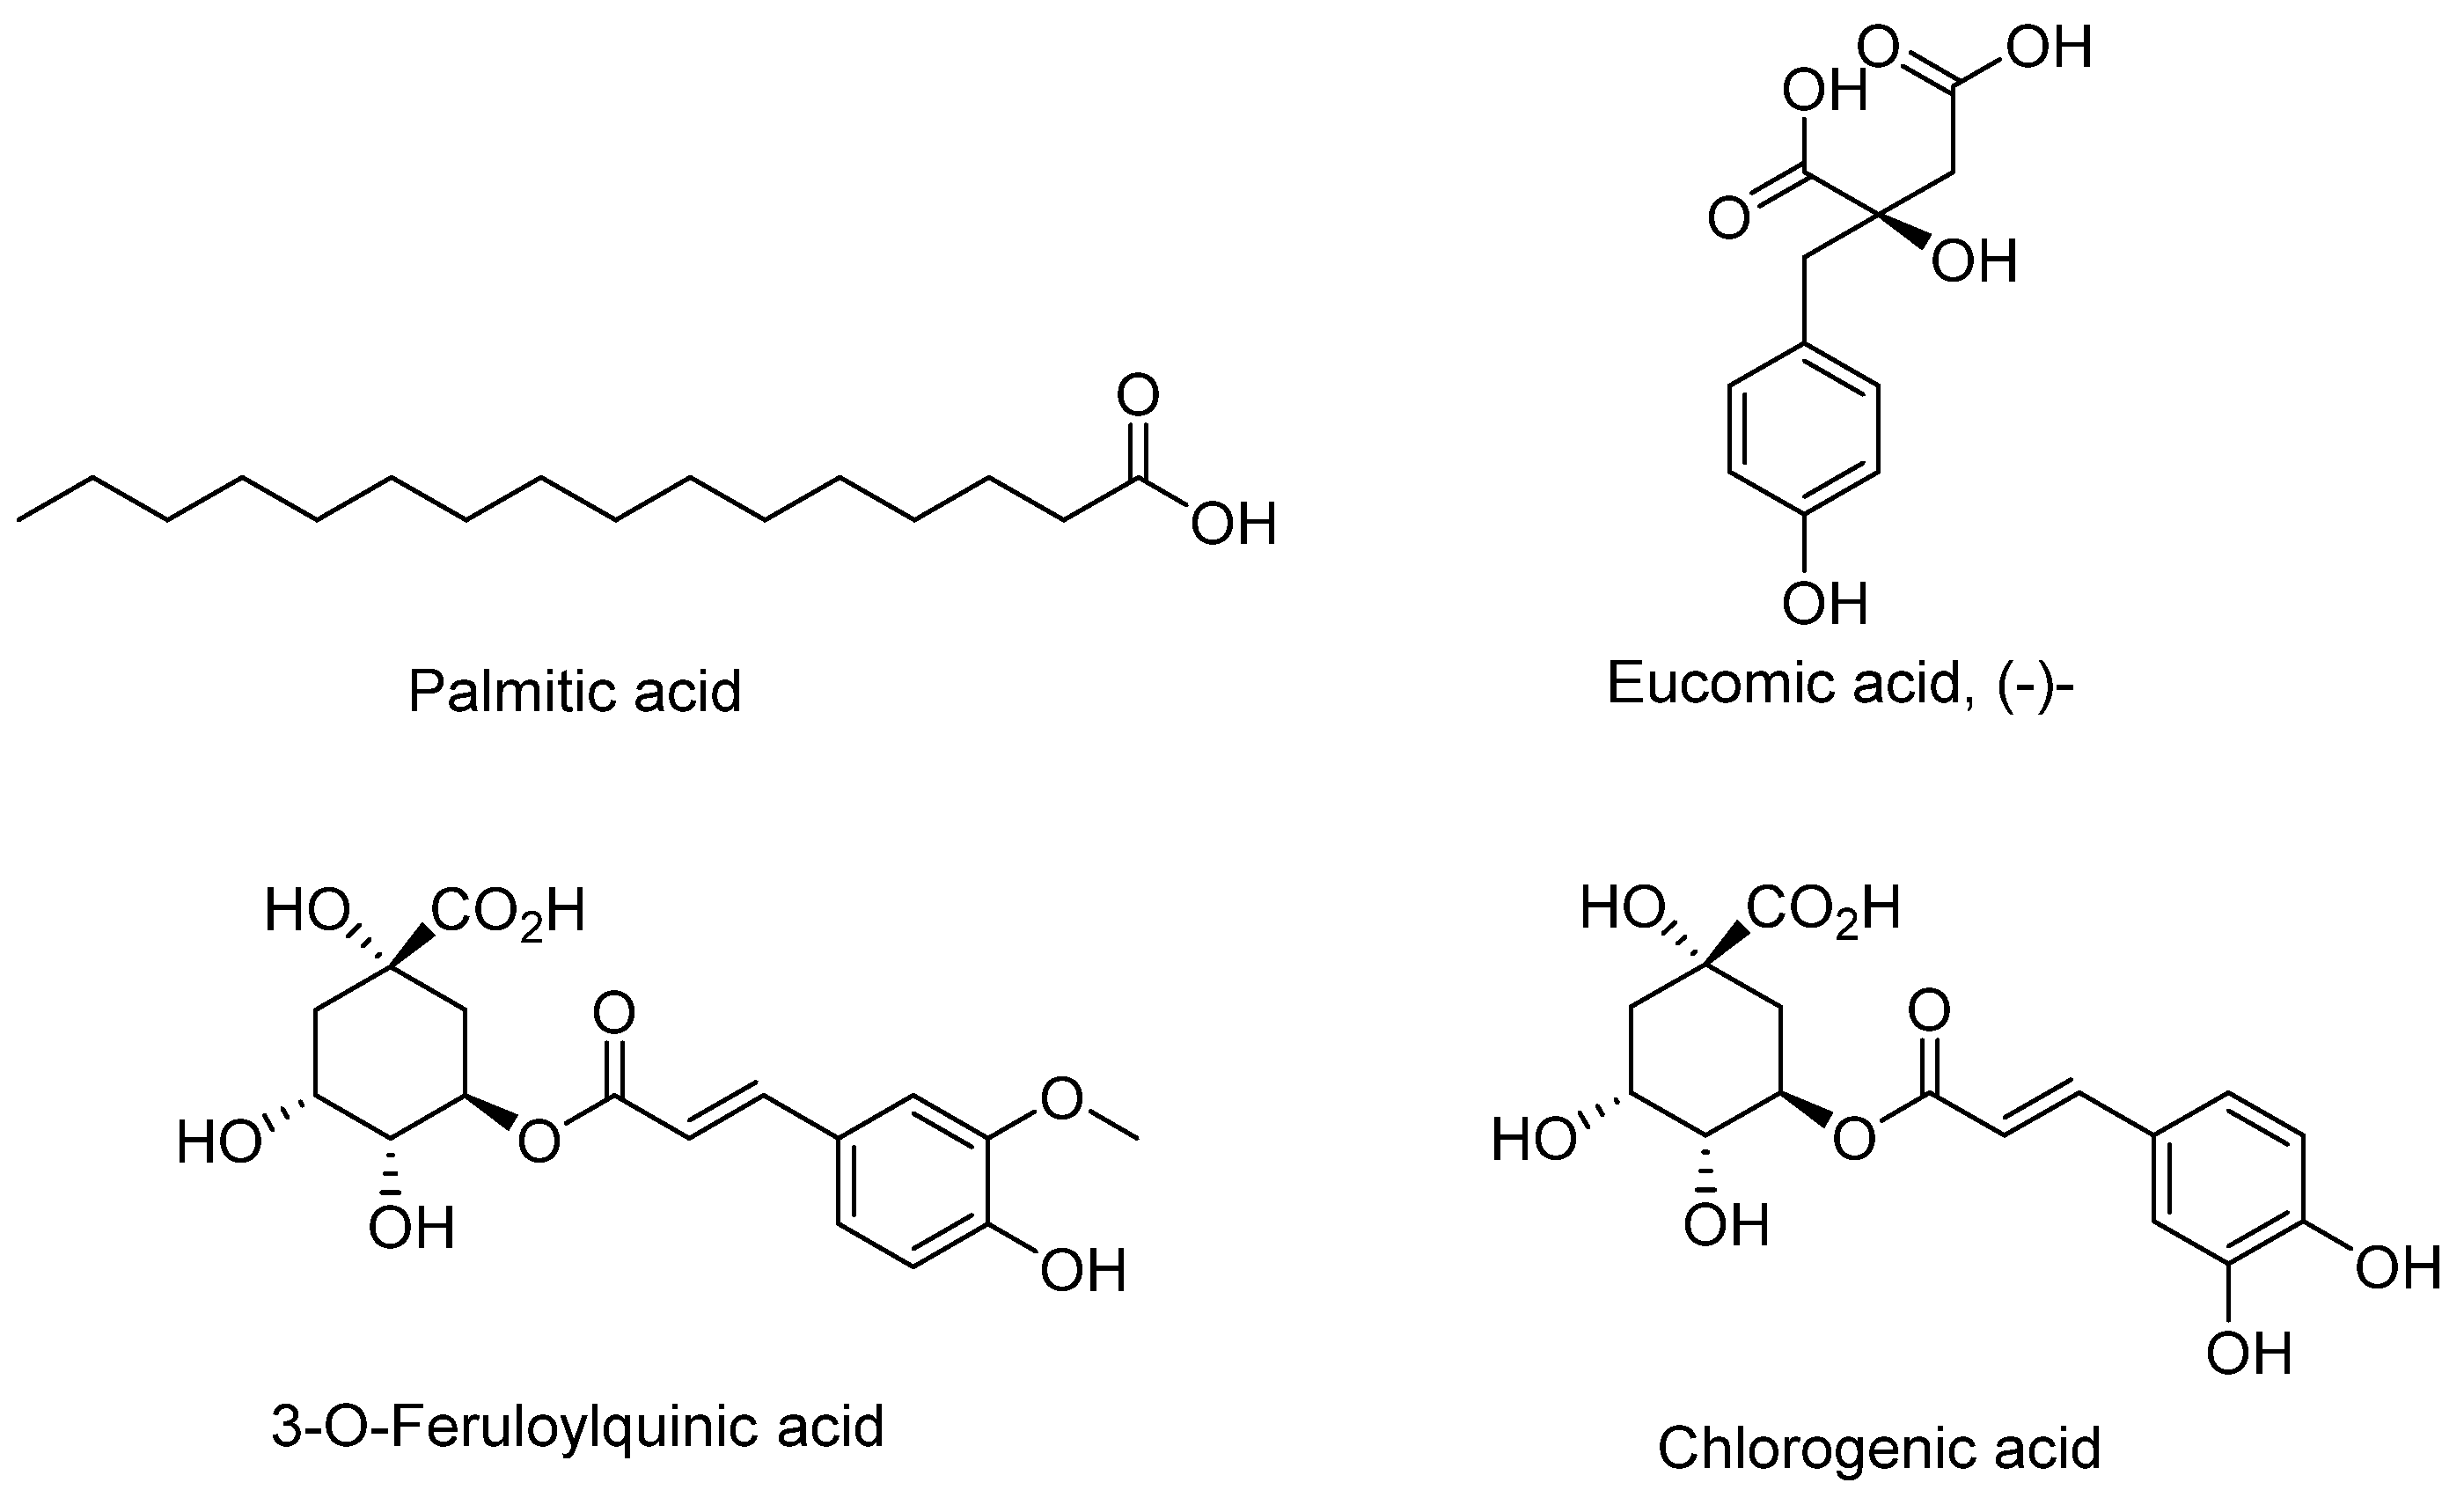

Table 1.
Compounds identified in the LC-MS spectra of methanolic extract of E. abrotanifolius.
| S/N | RT | Mass (M/z) | Compounds | Formula | Prominent Peaks | References |
| 1. | 4.65 | 255.05 | Palmitic acid | C16H32O2 | 255.05, 165.05 | Farag et al., 2015 |
| 2. | 5.51 | 353.09 | 4-O-caffeoyl quinic acid | C16H18O9 | 353.09, 191.06 | Elkhady et al., 2020 |
| 3. | 6.53 | 475.15 | Ombuin-rhamnoside | C23H23O11 | 475.15, 355.10 | Farag et al., 2015 |
| 4. | 6.66 | 239.06 | Eucomic acid, (-)- | C11H12O6 | 239.06, 177.05 | Lyu et al., 2023 |
| 5. | 6.90 | 353.09 | Chlorogenic acid | C16H18O9 | 191.06, 353.09 | Simirgiotis et al., 2015 |
| 6. | 7.21 | 367.10 | 3-O-feruloylquinic acid | C17H20O9 | 367.10, 193.05 | Simirgiotis et al., 2015 |
| 7. | 7.83 | 471.15 | 5'-((Z)-feruloyl) 3-(2'-methylarabinosylxylose) | C21H28O12 | 471.15, 411.13 | |
| 8. | 7.90 | 387.17 | 7-epi-12-hydroxyjasmonic acid glucoside | C18H28O9 | 387.17, 300.99 | Farag et al., 2015 |
| 9. | 8.20 | 469.13 | Plumieride | C21H26O12 | 469.13, 281.10 | |
| 10. | 8.72 | 409.11 | 6-[4-hydroxy-2-methyl-6-[(2S,3R,4S,5S,6R)-3,4,5-trihydroxy-6-methylol-tetrahydropyran-2-yl]oxy-phenyl]-4-methoxy-pyran-2-one | C19H22O10 | 409.11, 211.08 | |
| 11. | 8.76 | 645.18 | Paeonidanin B | C31H34O15 | 645.18, 211.08 | |
| 12. | 9.30 | 771.20 | 6-hydroxykaempferol 3-rutinoside-6-glucoside | C33H40O21 | 771.2, 301.03 | |
| 13. | 9.64 | 677.17 | Dicaffeoyl quinic acid hexoside | C31H34O17 | 515.14, 677.17 | Elkhady et al., 2020 |
| 14. | 9.77 | 609.15 | Rutin | C27H30O16 | 609.15, 300.03 | Sotenjwa et al., 2020 |
| 15. | 10.02 | 463.09 | Quercetin 4'-glucoside | C21H20O12 | 463.09, 300.03 | Waithaka, 2004 |
| 16. | 10.18 | 463.09 | Quercetin 3-galactoside | C21H20O12 | 463.09, 300.03 | Paponov et al., 2023 |
| 17. | 11.05 | 763.21 | Trigonotin A | C35H40O19 | 763.21, 609.15 | |
| 18. | 11.19 | 623.16 | Isorhamnetin-O-rutinoside | C28H32O16 | 623.16, 315.05 | Lusa et al., 2016 |
| 19. | 11.50 | 515.12 | 1,3-dicaffeoylquinic acid | C25H24O12 | 515.12, 353.09 | Chen et al., 2012 |
| 20. | 11.69 | 917.24 | Quercetin 3-(6'''-p-coumarylglucosyl)(1->2)-rhamnoside 7-glucoside | C42H46O23 | 917.24, 301.04 | |
| 21. | 12.55 | 777.23 | Smilaside A | C36H42O19 | 777.22, 759.21 | |
| 22. | 12.56 | 529.14 | 3,5-dicaffeoylquinic methyl ester | C26H26O12 | 529.14, 367.10 |
Base peaks are in bold fonts.
Table 2.
Tyrosinase inhibitory assay of samples from E. abrotanifolius.
| Fractions/Compounds | % Inhibition | IC50 | ||
| 100 µg/mL | 200µM | (µg/mL) | (µM) | |
| EAC | 40.04 | - | 34.52 | - |
| EAH | 34.05 | - | inactive | - |
| EAD | 42.19 | - | 98.56 | - |
| EAE | 50.35 | - | 53.26 | - |
| EAB | 28.25 | - | inactive | - |
| 1 | - | 19.80 | - | inactive |
| 2 | - | 23.31 | - | nd |
| 3 | - | 14.10 | - | inactive |
| Kojic acid | - | 100 | - | 17.26 |
EAC: methanolic extract (crude); EAH: hexane fraction, EAD: DCM fraction; EAE: ethyl acetate fraction; butanolic fraction; nd (not determined) due to non-reproducibility; inactive: >100 µg/mL or µM.
Disclaimer/Publisher’s Note: The statements, opinions and data contained in all publications are solely those of the individual author(s) and contributor(s) and not of MDPI and/or the editor(s). MDPI and/or the editor(s) disclaim responsibility for any injury to people or property resulting from any ideas, methods, instructions or products referred to in the content. |
© 2025 by the authors. Licensee MDPI, Basel, Switzerland. This article is an open access article distributed under the terms and conditions of the Creative Commons Attribution (CC BY) license (http://creativecommons.org/licenses/by/4.0/).
Copyright: This open access article is published under a Creative Commons CC BY 4.0 license, which permit the free download, distribution, and reuse, provided that the author and preprint are cited in any reuse.


