
Submitted:
12 June 2025
Posted:
18 June 2025
You are already at the latest version
Abstract
This paper presents an analytical forecasting exercise about the criticality of an important collection of materials, namely copper, cobalt, nickel, lithium, and rare-earth, recognized to-day as fundamental materials for the energy transition.The criticality of this set of materials is scrutinized not only in function of the comparison production/reserves, but also in function of geopolitical and environmental aspects related to their exploration. For the quantitative forecasting exercise was used a logistic equation tool developed to estimate the future accumulated production considering the logistic extrapolation of the current level of production.
Keywords:
critical materials
; energy transtion
; low carbon economy
; consumption forecasting
; logistic equation
1. Introduction
The notion of ‘critical materials’ emerged in force in the last twenty years, being target of several recent studies on the subject of materials availability, as for instance Graedel et al (2015), Nassar et al (2015), OECD report (2019), Pitron (2020), Gielen (2021), Gielen, Papa (2021), CSS-UMichigan (2022), IEA (2022), Devezas et al (2017, 2022), to mention a few. Important to highlight the fact that since then there have been successive CRITICAL MATERIALS SUMMITs, sponsored by IEA (2022 and 2023), the most recent one hold in July 2024 in Belgrade, when was signed a Memorandum of Understanding for strategic partnership between EU and Serbia.
The achievement of the goal of zero emissions by the middle of the 21st century, attending the Paris Agreement and the intended Great Energy Transition, implies overcoming a bottleneck unprecedented in the entire history of the energy transitions occurred in the past, because now we have the problem of availability, costs of extraction and production, aggression to the environment, and geopolitical aspects, related to the use of an immense range of materials indispensable for the full implementation of all the new energy alternatives - whether photovoltaic cells, wind turbines, or batteries of any type. This bottleneck can be resumed into a very simple question: where all the necessary materials for the so-called Green Transition come from?
The French journalist, author and documentary maker Guillaume Pitron, a specialist in the geopolitics of raw materials, starts the second chapter of his book “The Rare Metals War” stating: “The technologies that we delight in calling ‘Green’ may not be as green as we think, they could have an enormously impact on the environment…” (Pitron, 2020, pp. 34). The author analyses deeply how humanity, in order to overcome the disruptive effects of fossil fuels on the climate change have developed new and supposedly cleaner and more efficient inventions – wind turbines, solar panels, electric batteries (that can connect to high-voltage ultra-performance grids) but is absolutely unaware that the expected more sustainable world is largely dependent on rock-borne substance called rare metals. He tells us how humans have long mined big names primary metals, like iron, gold, silver, copper, lead, or aluminum. But in last forty years or so, we have turned our sights to a bunch of lesser-known metals found in terrestrial rocks in infinitesimal amounts, a subset of some thirty raw materials with a shared characteristic – they are often associated with nature’s most abundant metals, and very difficult (and expensive) to refine and process. Pitron points out the fact that “we have carved out a multitude of applications in two fundamental areas of the energy transition: supposedly ‘green’ technologies and digital technologies” and goes further stating that we are assured that the convergence of the two will create a better world. The first examples of this convergence (wind turbines, solar panels, and electric cars) are packed with rare metals to produce decarbonized energy that travels through high-performance grids to enable power savings, but these grids (which also imply an immense need for copper and nickel) are also driven by digital technologies that is heavily dependent on these same metals.
The numbers associated with these new green material needs are mind-boggling. For instance, eight and half tons of rock are needed to produce a kilogram of vanadium, fifty tones for the equivalent in gallium, and a staggering 1,200 tons for one simple kilogram of one of rarest of the rare-earths – lutecium. Let’s also consider the case of car batteries: a car battery for an electric car weighs about 500 kg, the volume is the size of a suitcase. It contains about 12 kg of lithium, 30 kg of nickel, 20 kg of manganese, 15 kg of cobalt, 100 kg of copper, 200 kg of aluminum (whose production is extremely power-hungry), steel and plastic. Inside there are 6831 lithium-ion cells. It should be of concern that all of these components come from mining. For example, to make a car battery, you have to process 10 tons of brine to produce lithium, 15 tons of ore for the cobalt, 2 tons of ore for nickel and 12 tons of ore for the copper. A total of 200 tons are dug up from the earth's crust for a single battery. If we multiply 200 tons by the number of units needed to run the global fleet of vehicles (over 2 billions) electrically, we arrive at numbers simply far beyond the world's extraction and production capacity (400 billion tones, or 250 billion cubic meters of soil!).
Within this context, the concept of ‘critical materials’ emerged in the last decade, ultimately a return to the discussion prevalent in the 1970s and 1980s about the limits to the extraction and exploitation of raw materials. There is still no consensus regarding a definition of ‘critical material’, the concept is typically contextual. Material criticality can be assessed in terms of vulnerability to supply restrictions, supply risk, and environmental menaces (CSS-UMichigan, 2022).
In general, this concept applies to the set of minerals and metals that require a significant extraction effort, whose production is concentrated in a small number of countries, where the quality of natural resources is decreasing, where a massive increase in supply and in which prices have shown large fluctuations that reflect imbalances between supply and demand (IEA, 2023).
Certain materials have been used in increasing quantities for decades or centuries, and their increasing supply faces no restrictions. For example, steel and concrete are not generally considered critical materials despite recent concerns about the availability of sand and gravel for concrete in some parts of the world. Aluminum is also not considered a critical material, despite the need for a massive increase in supply: the resource (bauxite) is available and widely distributed throughout the world.
A review of the literature mentioned at the beginning of this Introduction suggests that there is little consensus on which materials are critical. But some materials are included in most evaluation studies, such as:
- Cobalt
- Copper
- Nickel
- Lithium
Rare earth elements, mainly Neodymium, Dysprosium, Praseodymium.
Not all critical materials are metals, like for instance graphite. Graphite is considered critical not because of its scarcity as a mineral resource, but fundamentally because its exploitation is extremely aggressive to the environment and harmful to health. For some of the critical materials, the field of applications is limited. In other cases, the application is quite widespread. For example, the recent increased demand for lithium, cobalt and nickel is closely related to the mass production of lithium-ion batteries. The search for neodymium and dysprosium is closely related to the production of permanent magnets in electric motors and generators. However, copper is of paramount importance in all three application domains: in renewable energy production, in electrical grids and in electrical end-use applications such as electric vehicles.
Meanwhile, there have been growing concerns regarding the reliability of the supply of some of the above-mentioned metals. One of the main factors contributing to these concerns is the fact that many of these metals are only recovered as by-products from a limited number of geopolitically concentrated ore deposits, making their supplies unable to respond to rapid changes in demand.
It is paramount to note that the crucial point regarding the future supply of the materials necessary to meet the demand for new energy sources and produce the panoply of new devices related to the new digital era concerns mining. It is estimated that it will be necessary to multiply a thousand times the number of existing mines in order to meet future demand for materials (World bank, 2017).
Currently, materials of the greatest concern tend to be those with three basic characteristics: they are accessible mostly or even entirely as by-products, they are used in very reduced quantities for highly specialized applications, or they have no effective substitutes. Additional reasons for concerns regard high geopolitical concentration of the occurrences and exploration, as well as environmental implications.
The first case (by- products) is probably the main contributor to the currently observed concerns – a phenomenon referred by scientists as companionality – which regards the fact that some metals, which occur in the continental crust in concentrations of less than 0.1% and seldom form viable deposits of their own (also coined as ‘minor’ metals), occur mostly interstitially in the ores of metals with similar physical and chemical properties. These ‘minor’ metals are thus recovered mostly as by-products during the processing of the ‘major’ metals – their ‘hosts1’. The exploration of these by-product or companion metals is strongly dependent not only on the mining production of their host metals, but also on whether the companion metals are interesting to recover rather than to be discarded without further processing.
2. Methodological Approach
This article performs a prospective and analytical analysis of the currently identified most critical materials, namely cobalt, copper, nickel, lithium, and rare earth metals, describing shortly their main applications in to-day technological scenario, as well as an analytical forecasting analysis about the possible (or not) depletion of these materials in the near future. For the forecasting analysis a logistic-based method will be applied to the historical production of these materials during the last 20 years or so, which is described in the next section.
As conclusion it will be presented the author’s conclusions about the global perspective scenarios for the next thirty years (2050).
2.1. The Logistic Approach
For the purposes of this work, it was developed by the author a logistic-based analytical method, namely an integration logistic curve model based on a previous model developed by Devezas and Corredine (2002).
The classical logistic equation, as expressed in equation (1), also known as Universal Growth Law, describes the growth unfolding of the N units of given system within a niche where there exists a growth limit M.
Where a is the rate of growth (or growth capacity) of the system and t0 is the time where the growth reaches M/2, as shown in Figure 1. The logistic curve is an important mathematical tool for forecasting, due to the simplicity of its formulation and versatility of applications. Throughout its history it has also been designated by other names, such as sigmoid curve, Pearl curve, or learning curve (Devezas, 2023).
It is important to highlight that the logistic curve is not an explanatory model but instead it constitutes a universal law of growth. It is above all a heuristic method that allows capturing the essence of the mechanisms of change in technologies, innovations and markets and a powerful tool for describing and predicting technological development processes.
In our case it can be used, based on the historical development of the production of a given material, to forecast the trend to the ceiling, that is the approximate limit of production within the near future. But to accomplish the goal of this report this is not sufficient; we wish to compare the total (accumulated) foreseen production in the next 20 – 30 years with the estimated reserves-and/or resources. To carry out the above-mentioned goal an integration logistic curve model was developed that allows us to forecast the total production of a given material in a given time interval.
2.2. The Integration Logistic Curve Model
To forecast the total production P of a given material in a given time span t2 -t1 we must calculate the integral
To solve this integral we can use the symmetry of the curve around t0 substituting (t-t0) by a variable u, then du = dt. Accordingly, we have u1=t1-t0 and u2=t2-t0. Then rewriting the integral we get:
The solution of the integral given by equation (3) gives:
After performing the substitution u = t – t0 and returning to t, results:
Equation (5) represents the area under a logistic growth curve from t1 to t2 which can be used to forecast the accumulated production/consumption of a given material during a given time span, as shown in Figure 2.
The first step to apply this model is to find the estimated limit M (ceiling) of the historical production using the fitting program LSM2 developed at IIASA (IIASA, 2024).
The methodology described above will be applied to the historical data of the production of the critical materials pointed out. After finding the ceiling value (M), the accumulated production curve can be obtained with equation (5) applying it to successive and regular sets of pairs of years (e.g. 2023 - 2026, 2026 - 2029, 2029 - 2032, etc.), and then finally to the total desired time spam (e.g. 2023 – 2050). This procedure allows us to compare the accumulated production curve with the estimated reserves or resources of the material under analysis.
3. Prospective and Quantitative Analysis of the Main Critical Materials
As stated in the introduction, the focus of this study is a prospective analysis of a given set of materials that are considered in most reports as the more critical, namely copper, cobalt, nickel, lithium, and rare earth metals.
3.1. Copper
The soft, malleable, and very ductile metal copper is explored by humans since the remote antiquity. By 4,000 BC it was the first metal to be cast into a shape in a mold, and about 3,500 BC it was the first metal to be alloyed with another metal, tin, to create bronze, inauguring then an important period of human civilization, the so-called Bronze Age. Its most important physical property, responsible for its widest range of applications, is its high thermal and electrical conductivity, the second highest (second to silver) among pure metals at room temperature.
As pointed out previously, copper is a primary metal, which can be found in nature as pure metal (native copper), but the vast majority of mineral ores currently in operation are copper sulfides, with some few copper carbonates and oxides. Extraction from copper sulfides from open pit mines in porphyry deposits offer the largest copper content (about 0,4 to 1,0 %), when compared with other non-sulfide ores. There are copper mining operations in several countries, but Chile is currently the top producer (a quarter of the global production), soon followed by Peru and Democratic Republic of Congo (DRC)2. The numbers for 2023 (USGS, 2024) indicate a worldwide production of about 22,000 thousand tons, with Chile producing ca. 5,000 thousand tons, Peru 2,600, DRC 2,500, China 1,700, USA 1,100, and Russia 900. Kazakhstan is also an important producer with about 600 thousand tons last year. Regarding consumption China is currently the largest copper consumer, with a share of about 50% corresponding to over 10 thousand tons, followed by European Union in distant second place.
Figure 3 presents the unfolding of worldwide production since 1970. As can be observed, there are two growth phases: the first one from 1970 until 2003, and then a steeper upward trend after 2004 that seems to further increase in 2022-2023.
Presently most copper is used in electric equipment (ca. 44%, wiring, transformers, power transmission and generation), industrial machinery (10%, heat exchangers), construction (20%, roofing and plumbing), appliances and electronics (14%), and some other, but its most intensive use has been in the construction of the immense distribution networks necessary to support the large number of wind and solar farms around the world, as well as in the sub grids necessary for the domestic distribution of solar panels. Considering the recent demand necessary for the planned energy transition, some growth in production and consumption is to be expected in the coming years.
The logistic fit of the data from Figure 3 is presented in Figure 4; it points out to a ceiling value (M) of about 63,000 thousand tons in 2060. This finding is supported by some authors, like for instance Venditti (2021), who states that copper consists nowadays the “Essential Metal for the Energy Transition”. This author points out that planetary demand for copper, both in the energy and transport sectors, is expected to double in the coming decades. New energy technologies require even more copper than conventional energy sources. Solar photovoltaic systems contain approximately 5 tons (t) per megawatt (MW) of copper, while grid energy storage facilities rely on 2.7 to 3.6 t per MW. This author estimates a significant jump in global demand for copper for alternative energy sources, as a consequence of its widespread usage in electrical grids, batteries for EVs, wind turbines, solar panels and EV charging infrastructures. He also points out that a gasoline car uses around 20 kg of copper, mainly as wiring, while a fully electric car has around 80 kg of copper and notes that the demand for copper for charging electric vehicles is expected to increase by more than 1,000% by 2030, compared to 2020.
Figure 5 exhibits the cumulative production curve obtained from the results presented in Figure 4 using the method described in the previous section (equation (5) and Figure 2).
Current existing copper reserves are estimated at around 890,000 thousand tons (Statista, 2023), which, considering the forecast shown in Figure 5, would be enough for just 25 years from now, or perhaps a little longer, if we consider its ease of recycling (currently around 8,700 thousand tons, i.e. around 1/3 of global production). Considering then the hypothesis of recycling at the level currently observed, the reserves can surpass the level of about 1 billion tons and postpone the depletion of the reserves for more five years, around 2050.
Therefore, copper is indeed a critical material, not for geopolitical reasons, but mainly due to the limited availability of easily accessible reserves. For this reason, the exploration of polymetallic marine nodules has been seriously considered. These nodules located at the depths of the Pacific Ocean (at about 3,000 to 6,500 meters below the sea level) contains also other valuable metals such as cobalt and nickel. Adding to that, the continued melting of the sea ice in the Artic zone of the Earth has been speculated as an important source for the exploration of mineral deposits, including copper, rare earths, niobium, and other critical metals (Krivovichev, 2019), what can be seen as a possible way to overcome the bottleneck in the supply of strategic mineral deposits.
3.2. Cobalt
Figure 6 shows the world production of cobalt from 1995 to 2023, according to data from USGS (2023) and Statista (2023). As can be seen, the growth in global production after 2007 is notable, as are the fluctuations between 2010 – 2021, followed in 2022 – 2023 by a renewed growth trend as in the case of copper.
The search for this material is not new, however. Cobalt played an important role all over the 20th century mainly due to its use in alloying metals, particularly in the production of high-strength steel, as well as in many production branches like the ceramic industry, catalysators, magnets, etc. But in the last fifteen years battery production is the main driving force in the demand for cobalt, being currently responsible for 55% of its production, other 45% is distributed to other areas, 19% of which are still dominated by the production of superalloys.
Currently 130,000 metric tons come from Democratic Republic of Congo (DRC - 65%), and only 10,000 from Indonesia (5%), 9,000 (4.5%) from Russia, and 6,000 (3%) from Australia, what gives us a clear idea about the geopolitical criticality.
Nevertheless, when the discourse is about the criticality of this metal, this is due to its mineral origin. Cobalt is a typical by-product metal – presently 75% of its extraction comes from copper mining, while the other 25% comes from nickel mining. Additionally, its criticality is strongly related to two very important issues – geopolitical and environmental. The vast majority of the known reserves are located in the Copperbelt, a mining area that includes part of Kantanga province, in the Democratic Republic of Congo (DRC), which constitutes the mining ore of higher grade (3% cobalt), when compared to the global average of about 0,6% to 0.8%. But the mining activity in DRC is largely controlled by two big Chinese companies, and also other minor companies from Russia and the United Kingdom.
Supply risk exists in the extraction and refining phases of cobalt, mainly due to its by-product nature and the political instability of the supplying country. The main challenge arising from cobalt's status as a by-product material lies in its dependence on the extraction of other metals, in particular copper and nickel, as already mentioned. This interdependence creates inherent vulnerabilities in the cobalt supply chain. Fluctuations in demand for primary metals can have a direct impact on cobalt production, leading to supply shortages or surpluses, as is evident in the fluctuations of production appearing in Figure 6.
Regarding environmental problems in cobalt exploration, it is necessary to consider the miserable and extreme poverty conditions in which mines are exploited in the DRC. Around 20% of the cobalt mined in the Copperbelt comes from artisanal or small-scale mines (ASM) (Ritchie, 2023), a very hazardous activity, which can harm the eyes, skin, heart, and lungs. Particles emitted during cobalt mining have radioactivity due to the presence of uranium in copper ores. There are records of an alarming presence of radioactivity in the hazy air surrounding these mines, which also causes vision problems, vomiting, nausea, heart problems, and thyroid damage. Moreover, it is worth noting that the not artisanal mining activities, not only in the DRC, but all over the world, are anything but environmentally friendly, as giant diesel-powered machines and trucks are used, and the question can be asked where the contribution to the decarbonization of the environment is that is expected to be achieved with the mass production of batteries?
Following the same procedure as described in the previous section for copper we can estimate the ceiling value M for the global production, as well as the accumulated production to be observed until 2050. These results are presented in Figure 7 and Figure 8.
According to USGS (2023) the identified global reserves of terrestrial cobalt are about 11 million tons. Considering the forecast presented in Figure 8 these reserves would be sufficient for more than 40 years. But considering the estimated global resources of about 25 million tons (USGS, 2023), we can state that depletion of cobalt is not a major issue in the near future, even considering its growing intensive usage in the production of EV batteries.
Resuming, cobalt is a critical material, not as a consequence of an approaching depletion of resources, but mainly as a sequel of its by-product nature, geopolitical reasons, and the currently observed very hazardous mining activity.
3.3. Nickel
As well as copper, nickel is also a primary metal that can be found in nature as a native metal, and its ores were mistaken for copper ores since antiquity. Some primeval bronzes cast in the Fertile Crescent around 3500 BC contain about 2% nickel, and cupro-nickel coins were used in China around 1400 BC. As mentioned previously, nickel ores are also explored to get cobalt (ca. 25% of global cobalt production).
Since the beginning of the 20th century nickel has been used to produce stainless steel, which represents nowadays about 60% of world production. Other common uses are in nickel-based and copper-based alloys (10%), plating (9%), other alloy steels (7%), foundries (3%, coins for instance), and more recently in rechargeable batteries (4%, but with projections of significant growth).
Figure 9 presents the unfolding of the global production of nickel since 1985.
It is evident a jump in production after 2010 due to the widespread adoption of EV’s with Ni-based Li-ion batteries. Between 2013 and 2016 a brief production decline was observed due to the production surplus observed, mainly due to the abandonment of Ni-Cd batteries all over the world during the previous years. After 2017, however, the rate of growth soared again.
The most of mined nickel come from two types of ores: laterite (a complex mixture of (Fe, Ni) hydroxides and silicates, and magmatic (Fe, Ni) sulfide deposits. Indonesia is the world leader with 1,600 thousand tons (45 %), followed at a distance by the Philippines (330 thousand tons, 9%), Russia (220 thousand tons, 6%), New Caledonia (France)(190 thousand tons, 5%), Australia (160 thousand tons, 4.4%), and Canada (130 thousand tons, 3.6%). The two largest nickel mines are situated in Russia – the Kola MMC Mine (Murmansk) and the Sarawak Mine (south Sulawesi) (World Bank, 2017).
Nickel has been extensively used in batteries, firstly in nickel-cadmium batteries, whose adoption has been abandoned in many countries after 2006, mainly in Europe, and largely substituted for the longer lasting nickel-metal-hydride (NiMH) rechargeable batteries, which were introduced on the market in the 1980s, widely adopted in power tools and early digital cameras. Quickly such adoption evidenced their potential for all types of portable devices, which are now part of our daily lives. Starting in the mid-1990s the use of Li-ion batteries with nickel hydroxide cathodes emerged on the electric automobile market.
The major advantage of using nickel in batteries is that it helps deliver higher energy density and greater storage capacity at a lower cost. Further advances in nickel-containing battery technology contributed for an increasing role in energy storage systems, helping make the cost of each kWh of battery storage more competitive. In tandem with this increasing market share, battery technology is also advancing, another reason why the proportion of nickel-containing Li-ion batteries in use is set to grow. Two of the most commonly used types of batteries, Nickel Cobalt Aluminum (NCA, the most used by Tesla) and Nickel Manganese Cobalt (NMC) use 56% and 33% nickel respectively, but newer developments of NMC batteries are also approaching 80% nickel.
As in the cases of copper and cobalt, applying the logistic tool modeling we can forecast the future demand of nickel, as well as the cumulative production expected until 2050. These results are presented in Figure 10 and Figure 11.
Estimates of global reserves of nickel, 60% laterites and 40% sulfide deposits, amount to 100 million metric tons (USGS, 2024), which, considering the forecasted results, would barely last for the next twenty years. If we consider the growing demand currently observed, the future supply situation is at serious risk, despite nickel, like copper, being an easily recyclable metal (currently ca. 350,000 tons of nickel is recovered from scrap, mainly used by the stainless-steel industry).
As in the case of copper, the criticality of nickel is not of a geostrategic nature, but essentially due to the scarcity of mineral reserves with a good content (at least 1%) of the metal. This shortage is a serious threat to the future of electric cars, which recently led Elon Musk, CEO of Tesla, to state that “the shortage of nickel supply will be the most worrying problem of future production expansion” (Junzhi, 2021), For this reason Tesla is planning in the near future to put into use the new lithium-iron phosphate batteries.
3.4. Lithium
The case of lithium as a critical material is quite different from the other metals analyzed previously in this work and the experts' opinion is quite divergent (Gielen, Papa, 2021) (CSS, U Michigan, 2022) (Graedel et al, 2015).
Lithium, the lightest metal in the universe, with a density of 0.53 g/cm3, as high as pine wood, does not occur freely in nature due to its very high reactivity and solubility and is widely distributed on Earth, being found as pegmatite minerals as well as in brines. At 20 mg lithium per kg on Earth’s crust, lithium is the 25th most abundant element. But although the number of known lithium containing deposits and brines is large, most of them have too low metal concentrations, which mostly implies a very low commercial value.
What makes the case of lithium different from other ‘critical materials’ regards troubles related to handling and environmental issues and consequently the rentability of its processing (Benchmark, 2023). Moreover, like all alkali metals, lithium is highly reactive and flammable, and must be stored in vacuum, inert atmosphere, or inert liquid (kerosene or mineral oil).
Until very recently lithium and its compounds have had limited industrial applications, mainly as oxide component in heat-resistant glass and ceramics, lithium grease lubricants, flux additives for iron and steel production, and more recently in the development of advanced Al-Li alloys for the aeronautical industry. But the situation changed radically with the introduction in the market of the Li-ion batteries for laptops, cell phones, and electric vehicles. Currently 65% of global production is directed to the battery sector, 18% to ceramics and glasses, lubricants and greases 5%, continuous casting processes 3%, polymers additives 3%, and the remaining 7% go to aerospace industry (GlobalData. 2023).
Figure 12 presents the global production of lithium in the time span 1985 - 2023.
As we can see, global lithium production experienced a spectacular boost after 2015, mainly due to the push from the electric vehicle market. The drop in 2020 was a consequence of the COVID pandemic, which quickly recovered in 2021. The production in 2023 (198,000 metric tons) presented an increase of 32% over 2022, with Australia presenting itself as the largest producer in the world (46.7%), followed by Chile (23.8%), China (18%), Argentina (5%), Brazil (2.6%), Canada and Zimbabwe (1.8 % each). Australia’s production comes primarily from hard rock mines (Greenbushe’s pegmatite), while the other producers rely mostly in extracting lithium from brines. According to GlobalData, lithium production is expected to increase at a CAGR (Compound Annual Growth Rate) of about 13% by 2030 (GlobalData, 2023).
The results of the application of the logistic tool modeling to forecast the future demand of lithium, as well as the cumulative production expected until 2050 are presented in Figure 13 and Figure 14
US Geological Survey (USGS, 2024) estimate worldwide lithium reserves to be of the order of 20 million tons but point out that such estimates are very difficult to calculate, mainly due to the fact that most lithium classification schemes were developed for mineral ore deposits, whereas brine is a fluid that cannot be treated with the same classification scheme due to large varying concentrations. Pegmatite ores are far richer (ca. 2.4% Li) than brines, which present very low concentrations (usually lower than 1%). According to this conservative estimate there are reserves for at least another 50 years.
It is also important to note that there are many other very optimistic estimates about immense potential reserves of hard rock ores in DRC, Zimbabwe and Afghanistan, and as brines in the so called “Lithium Triangle” involving three countries – Chile, Bolivia, and Argentina, with high quality salt flats. Brine resources are more abundant than hard rock ores, but the technology currently in use to extract lithium from continental brine relies on open air evaporation to concentrate salt, and in this way large volumes of water containing lithium carbonate are lost, raising concerns about the overall sustainability of the process. Furthermore, the process is very slow (10 to 24 months), which means that brine exploration is not suitably responsible to short terms change in demand, what can explain the sudden fall of production around 2020.
In Russia there exists a large deposit in Kolmozerskoye (Murmansk region). In 2023 a joint venture was formed called Polar Lithium between Nornickel and Rosatom to develop this deposit, aiming to produce 45,000 tons of lithium per year by 2030 (Rosatom, 2023).
All in one, the lithium reserves are in fact gigantic, and one can’t speak about criticality involving shortage of the material. The trouble with lithium exploration regards a series of environmental and health-related issues. Environmental concerns include wildlife habitat degradation, potable water pollution (arsenic and antimony contamination), immense water consumption, and massive mining waste, including radioactive uranium and acid sulfuric discharge. Health concerns are a consequence of the fact that lithium metal is highly corrosive and requires special handling and transportation to avoid skin contact. Breathing lithium dust irritate noise and throat and may cause pulmonary edemas. Add to that the fact that, to attend the current expansion of demand, it will be necessary to increase about six times ore and/or brine exploration until 2030.
3.5. Rare-Earth Metals
A large majority of new materials that are widely used in new digital technologies and in new devices necessary for the energy transition, belong to the family of so-called Rare Earths, or more correctly, to the lanthanides family, the set of 15 elements shown blue highlighted in the periodic table presented in Figure 15
Scandium and yttrium (green highlighted in the picture) don’t belong to the lanthanide’s family but are considered as rare-earth because they tend to occur in the same ore deposits as the lanthanides and exhibit very similar chemical properties. The term rare-earth is in fact a misnomer because they are not rare or scarce materials. Instead, they are relatively abundant in the Earth’s crust – for instance cerium is the 25th most abundant element, more than copper, and thulium and lutetium, the two least abundant rare-earth elements, have each a crustal abundance nearly 200 times greater than gold or platinum. The designation as rare-earth derives of the fact that these materials in practice are found spread thin across trace impurities, so to obtain these metals at usable purity grade requires processing large amounts of ore at a great expense and effort. What it is rare is to find them in concentrations high enough for economic extraction.
The rare-earth metals are often found together. World resources are contained primarily in bastnasite (carbonate-fluoride minerals) and monazite sands (phosphate mineral). The former, with main deposits in China and the United States constitute the largest percentage of the Earth’s rare-earth economic resources, while monazite deposits in Australia, Brazil, China, India; Malaysia, South Africa, Myanmar, Thailand, and the United States constitute the second largest segment. Also, loparite (a perovskite mineral) has been explored in Russia (Kola peninsula) as an important source of cerium and some lanthanides. There are nowadays 178 deposits widely distributed over the Earth (Zhou et al., 2017).
The most abundant rare-earth metals are cerium, yttrium, lanthanum, and neodymium, with average abundance that are very similar to other commonly explored industrial metals like nickel, chromium, or zinc. But as stated above, they are rarely found in economically extractable concentrations. Moreover, monazite sands are radioactive due to the presence of thorium and, in some deposits, also uranium.
The rare-earth metals are often found together, and for this reason there is no single rare-earth metal market, the most statistics about their production consider all of them together, being very difficult to find reliable data for the individual metals. Figure 16 presents a recent statistic of the global rare-earth production.
As can be observed, we are now witnessing a significant growth of rare-earth production, about 160 % in the last six years. In order to understand the behavior of this curve it is paramount to consider some details about the historical unfolding of rare-earth metals consumption/production.
The demand for these materials started to grow significantly in the mid-1960s when the first color TV-sets entered the market. Europium was the essential material for producing color images. At this time the Mountain Pass Mine (California, USA) began producing europium from bastnasite, which contained ca. 0.1% of the metal, which made this mine the largest rare-earth producer in the world and placed the United States as the leading producer. China only started to produce rare-earth metals in the 1980s and in the early 1990s became the world’s leading producer.
All along the 1990s and early 2000s, China regularly strengthened its grip on the world’s rare-earth metal and oxide market and start selling rare-earth at such low prices that in 2002 the Mountain Pass Mine, unable to compete, stopped operation, soon followed by many others throughout the world. Chinese domination reached a peak in 2010 when they controlled ca. 95% of the world production, and prices jumped over 500% in just a few years. The consequence was an awakening for rare-earth consumption, which on the other hand allowed mining companies throughout the world to reevaluate their prospects and explore for new ones. This context explains the drop in production observed in the graph of Figure 16 after 2010. Mountain Pass Mine restarted operation in 2012, as well as mines in Australia. However, the production soared after 2017 following the increasing demand of some of the rare earth metals in the most diverse branches of advanced technologies.
Currently the global production of about 350 thousand tons is dominated by China, with a share of 70%, followed by USA (14%) and Australia (4%). Other important producers are Myanmar, Thailand, Vietnam, India, and Russia (USGS, 2024). Important to note that China currently dominates completely the market of rare-earth metals, not only regarding mining and extraction, but also is responsible by 85% of the world capacity of processing these materials.
As of 2020 cerium was the most produced rare-earth metal, soon followed by lanthanum and neodymium. Figure 17 exhibits the breakdown of the most produced rare-earths according Techcet (2020). But neodymium is to-day the rare-earth metal with the highest number of uses, mainly in the field of strong and permanent magnets, used intensively in eco-energy applications like electric cars and wind turbines, as well as in all kinds of speakers we found in cell phones and laptops. Neodymium is foreseen to lead the global market in 2026.
Rare-earth metals have currently a wide panoply of
industrial applications, not only in traditional industrial branches, but also
in several new advanced digital and alternative energy generation capabilities.
Figure 18 presents a breakdown of the
main applications in 2022.
Applying the logistic approach methodology as
already done in the previous sections, we can determine the production ceiling
for the set of rare earth metals from the data presented in the figure16. The
result is shown in Figure 19.
Based on this result we can estimate the future
cumulative demand, exhibited in Figure 20.
The estimated global reserves, based on the current known mine exploration, amounts to about 100 million metric tons (USGS, 2023), what means that if demand continue to grow at this rate and even if no efficient recycling method of producing rare-earth metals were developed, known world reserves will be sufficient for the next 50 years. This estimation does not pose any concern about the future production capacity. Moreover, other authors have presented more optimistic prognostics based in a larger estimation of global reserves (taking in account some not yet explored existing ores) of about 478 million tons and state that these resources are sufficient to meet the global demand for the next hundred years (Zhou et al., 2017).
Certainly, the rare-earth market for applications in wind power, electric vehicles, and catalytic converters will face a continuous growth to a different degree in the next years, being expected a significant demand for neodymium and dysprosium that very probably might not be satisfied by the current rate of production. This scenario allow us to state that neodymium and dysprosium may become critical materials to meet their growing demand for clean technologies during the next decades. On the other hand, with the growing market for LED (Light Emitting Diodes), other forms of lighting sources like CFL (Compact Fluorescent Lamps) and LFL (Linear Fluorescent Lamp) will lose market over the next decade, and in this way the demand for europium, terbium and yttrium oxides will decrease in the lighting market.
Concluding, the criticality of rare earth metals is not related to the depletion of reserves or resources, but rather and fundamentally related to China's large-scale dominance over the means of production and processing of these materials. Considering Russia´s immense Siberian reserves, this country will probably emerge as a significant rare-earth producer in the coming years. Moreover, the competition with China has increased significantly, resulting in the USA, and Japan becoming also core participants in the competition network (Xu et al., 2024). Also worth to mention that the recently signed agreement to rare-earth exploration in Ukrainian soil between Ukraine and the USA will bring new perspectives in this race for this class of materials.
4. Conclusion
The future availability of some key materials for the much-talked-about energy transition has led to heated discussions about their criticality. Among the materials considered most critical are copper, cobalt, nickel, lithium, and the collection of materials known as rare earths. The application of a forecasting method based on logistic equations allows a comparative forecast between available reserves or resources and future consumption of these materials for the coming decades. Combining this quantitative analysis with some considerations on geopolitical and environmental aspects of their production leads us to the following considerations:
Copper: Considering the currently known reserves of this strategic material and the forecasted production/consumption in the next few decades it is estimated that its depletion may occur within the next 25 to 30 years, even considering the level of recycling observed in recent years. Therefore, copper is indeed a critical material, not for geopolitical reasons, but mainly due to the limited availability of easily accessible reserves. For this reason, the exploration of polymetallic marine nodules has been seriously considered.
Cobalt: Comparing the forecasted production in the next few decades with the identified global reserves it can be estimated that they will be sufficient for the next 40 years. Moreover, considering optimistic estimates about available resources, this time-span may be even longer, leading to the conclusion that depletion is not a major issue in the near future. On the other hand, cobalt is considered a critical material, not as a consequence of an approaching depletion of resources, but mainly as a sequel of its by-product nature, geopolitical reasons, and the currently observed very hazardous mining activity.
Nickel: The forecasted production consumption of nickel for the next decade indicates that the known reserves will be probably depleted within 20 years. Considering the rocketing demand of this materials in the battery market we can state that its future supply situation is at serious risk, despite nickel, like copper, being an easily recyclable metal. As in the case of copper, the criticality of nickel is not of a geostrategic nature, but essentially due to the scarcity of mineral reserves with a good content (at least 1%) of the metal. This shortage is a serious threat to the future of electric cars.
Lithium: This light metal is currently the basic material for the expanding market of electric cars. In spite of the ever growing demand, we have the fact that lithium reserves are in fact gigantic, and one can’t speak about criticality involving shortage of the material. The trouble with lithium exploration regards a series of environmental and health-related issues. Environmental concerns include wildlife habitat degradation, potable water pollution (arsenic and antimony contamination), immense water consumption, massive mining waste, including radioactive uranium and acid sulfuric discharge, and a long list of serious health concerns. There has been some discussion about the need to expand lithium ore and/or brine exploration about six times in order to satisfy the forecasted demand, but this whole discussion could fade away in the coming years as a result of the intense search for alternative materials, being worth to mention the possibility of developing Na-ion batteries, which are much more efficient and pose a lower environmental risk.
Rare-Earth metals: The forecasted production/consumption of this special set of materials when compared with the estimated global reserves point to the fact that there are no reasons for concern about a possible depletion, even if no efficient recycling method of producing rare-earth metals were developed, at least for the next 50 years or more. Moreover, other authors have presented more optimistic prognostics based on other optimistic assessments and state that these resources are sufficient to meet the global demand for the next hundred years. The criticality of rare earth metals is not related to the depletion of reserves or resources, but rather and fundamentally related to China's large-scale dominance over the means of production and processing of these materials. There are expectations of exploration of other potential rare earth resources in Russia, USA, and Japan that will make these countries also core participants in the competition network for rare-earth metals.
Acknowledgements
Researcher T. Devezas thanks the Portuguese Science and Technology Foundation (FCT), under the unit C-MAST (Center for Mechanical and Aerospace Science and Technologies), Projects UIDB/00151/2020 (https://doi.org/10.54499/UIDB/00151/2020) and UIDP/00151/2020 (https://doi.org/10.54499/UIDP/00151/2020)
References
- Benchmark (2023) – Hardrock lithium vs brine – how do their carbon curves compare? Benchmark source, March 3rd.
- CSS-U. Michigan. Critical Materials Factsheet, Center for Sustainable Systems; No. CSS14-15; University of Michigan, Pub.; Pub. No. CSS14-15, 2022. [Google Scholar]
- Devezas, T.; Corredine, J. (2002)-The Biological Determinants of Long Wave Behavior in Socioeconomic Growth and Development. Technological Forecasting and Social Change 2001, 68, 1–57. [Google Scholar] [CrossRef]
- Devezas, T. Devezas, T., Leitão, J., Sarygulov, A., Eds.; –Global Pattern in Materials Consumption: an Empirical Study. In Industry 4.0–Entrepreneurship and Structural Change in the New Digital Landscape; Springer Nature, Switzerland, 2017. [Google Scholar]
- Devezas, T. How Green is the Green Energy Transition? On the Road to Decarbonization. In Global Challenges of Climate Change; Devezas, T., Leitão, J., Yegorov, Y., Chistilin, D., Eds.; Springer Nature, Switzerland, 2022; vol 1. [Google Scholar]
- Devezas, T. (2023) – Introduction to Technological Forecasting, MSc Course, Peter the Great Polytechnic University, Saint Petersburg, Russia.
- Devezas, T., Ilyin I.V., Ilyashenko O.Y., Schenikov E.M. - PROGRAMME FOR FITTING PARAMETERS OF LOGISTIC EQUATION. Certificate of registration of computer program RU 2023688714, registered 25/12/2023.
- Dias, J.D. Economic drivers of commodity volatility–the case of copper. Resources Policy 2021, 73, 102224. [Google Scholar]
- E-Tech resources (2021) – What are Rare Earth Elements (REEs), where are they found and how are they mined, September 28, What are Rare Earth Elements (REEs), where are they found and how are they mined? E-TECH RESOURCES (etech-resources.com). etech-resources.com.
- Gielen, D. (2021) – Critical Materials for the Energy Transition, IRENA report, Technical Paper n. 5, Abu Dhabi. Abu Dhabi.
- Gielen, D., Papa, C. (2021) – Materials Shortage Will not Stop the Energy Transition, If We Plan Ahead, IRENA, November 4th.
- GlobalData (2023) – Lithium mining market analysis by Reserves, Production, Assets, Demand Drivers and Forecast to 2030, Published: October 06, 2023, Report Code: GDMMGLI007MR-ST.
- Graedel, *!!! REPLACE !!!*. Criticality of Metals and Metalloids. Proc. Natl. Acad. Sci. USA 2015, 112(14), 4257–4262. [Google Scholar] [CrossRef] [PubMed]
- Home, A. (2023) – The return of the London Metal Exchange’s nickel curse, Reuters News, March 21st.
- IIASA (2024) – Logistic Substitution Model II (LSM2) - Logistic Substitution model II (LSM2) IIASA.
- Junzhi, H. (2021) – Musk openly complains that the shortage of nickel supply will be the most worrying problem of the future production expansion, SMM, The Leading Metals Information Provider, February.
- Krivovichev, S. V. (2019) (Ed.)– Artic Mineral Resources, Science and Technology, MDPI (Printed paperback edition of the Special Issue published in Minerals).
- Nassar, *!!! REPLACE !!!*. –By-product metals are technologically essential but have problematic supply. Sci. Adv 2015, 1e1400180, pp 1–10. [Google Scholar] [CrossRef]
- NMR (2024) – Rare Earth Metals Market: Global Industry Analysis and Forecast (2023-2030), Rare-Earth Metals Market: Industry Analysis and Forecast (maximizemarketresearch.com).
- Pitron, G., 2020. The rare metals war: the dark side of clean energy and digital technologies. Scribe Publications, London, UK Brunswick, Australia Minneapolis, US.
- OECD (2019) – Global Materials Resources Outlook 2060– Economic Drivers and Environmental Consequences, OECD, February 12.
- Ritchie, H. – Is cobalt the ‘blue diamond of electric cars’? What can be done about it? Sustainability by Numbers (Blog), Is cobalt the blood diamond of electric cars? What can be done about it? (sustainabilitybynumbers.com).
- Rosatom (2023), Russian approach to Lithium, Newsletter # 262, February.
- Smil, V. (2014) – Making the Modern World, Materials and Dematerialization, Wiley, UK.
- Statista (2023) - Global copper mining industry - statistics & facts Statista.
- Statista (2023) - Nickel mine production worldwide 2023 Statista.
- Statista (2023) - Global lithium production 2023 Statista.
- Statista (2023) - Neodymium oxide price globally 2009-2030 Statista.
- Techcet (2020) – Rare Earth Elements Supply Uncertain for IC Fabs, July 29.
- USGS (2022) – Global Materials Survey - Commodity Statistics and Information U.S. Geological Survey (usgs.gov).
- USGS (2024) - Copper Statistics and Information U.S. Geological Survey (usgs.gov).
- Xu, J.; Jiahau, L.; Charles, V.; Zhao, Y. –Evolution of the rare earth trade network: A perspective dependency and competition. Geoscience Frontiers 2024, 15, 101653. [Google Scholar] [CrossRef]
- World Bank (2017) – The Growing Role of Minerals and Metals for a Low Carbon Future, Working Paper 117581, August 2017.
- Zhou, B. 2017)–Global Potential of Rare Earth Resources and Rare Earth Demand from Clean Technologies. Minerals 7(203), min 7110203.
| 1 | Only 10 metals are considered as ‘major’ or primary metals, namely Gold, Aluminum, Titanium, Platinum, Tin, Iron, Lead, Nickel, Copper and Zinc. |
| 2 | Production spread throughout the so called ‘copperbelt’, where there was found the ores with highest copper content. |
Figure 1.
Graph representation of the logistic equation (1), also known as the logistic curve. M/(1+b) is the starting value of the system, where b = eato.
Figure 1.
Graph representation of the logistic equation (1), also known as the logistic curve. M/(1+b) is the starting value of the system, where b = eato.
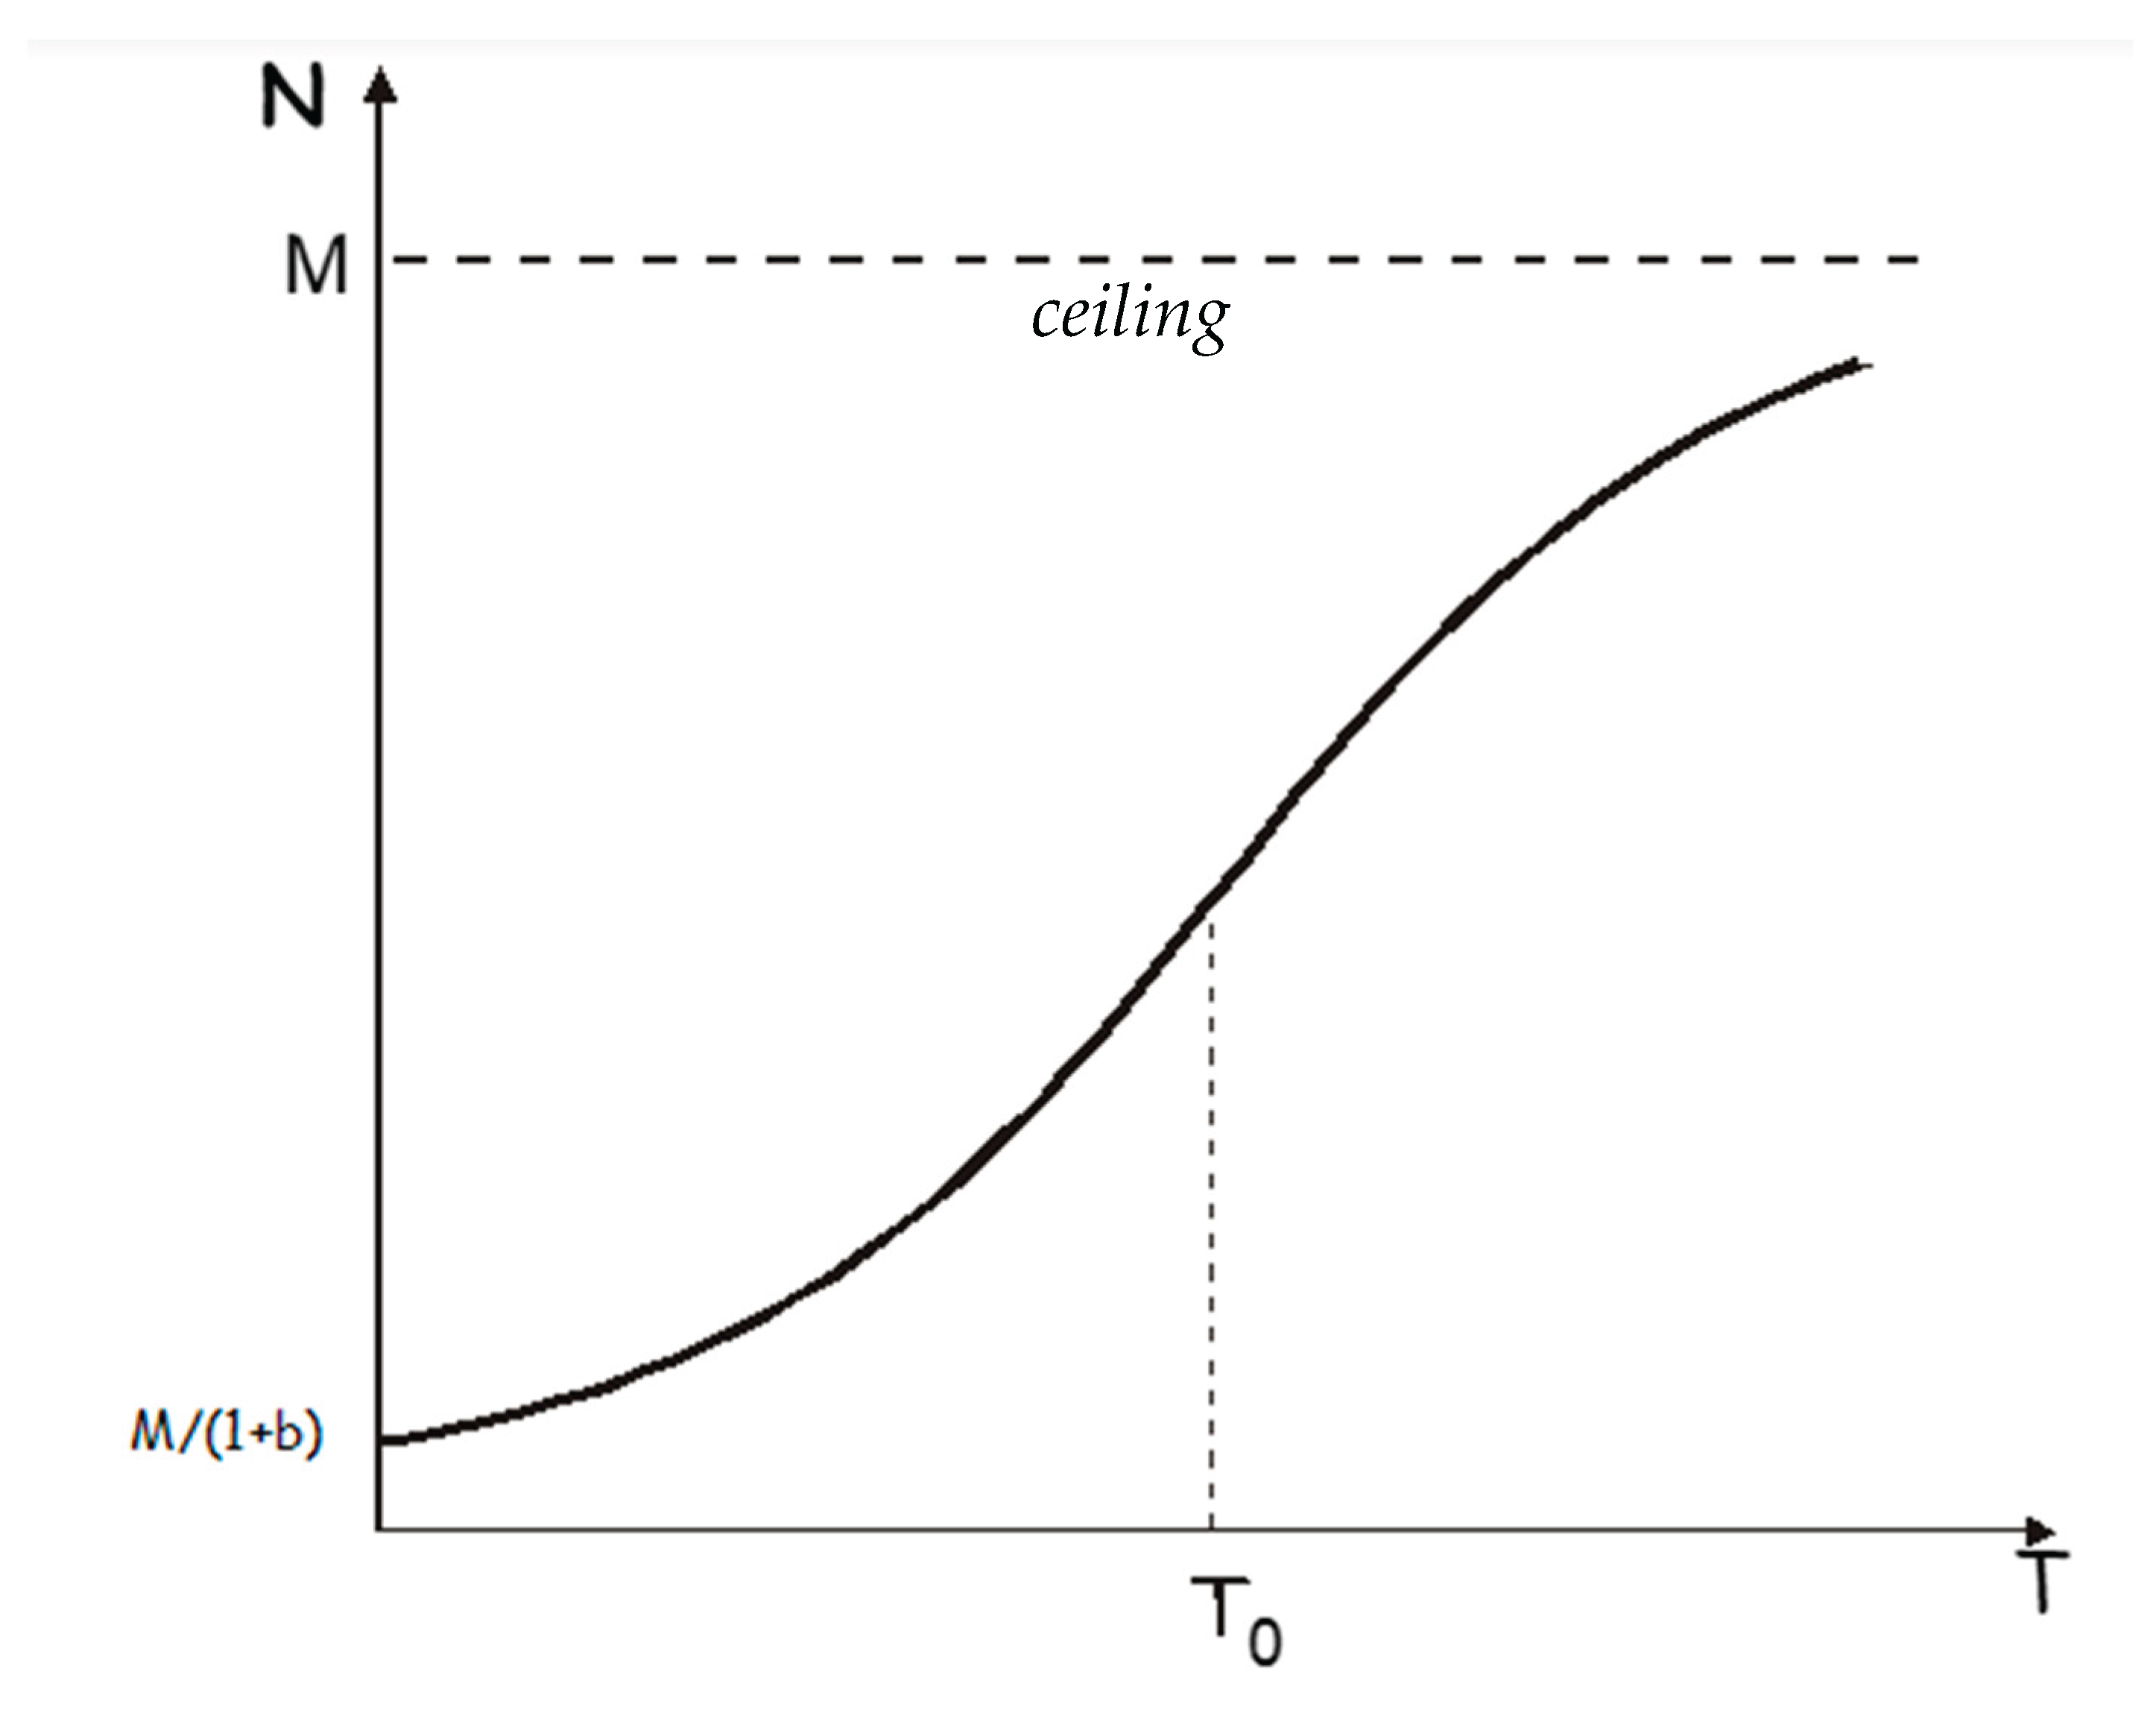
Figure 2.
– Hypothetical fitting of the growth of P to estimate the ceiling value M as given by equation (1). The highlighted area in the figure (between t1 and t2) represents the total accumulated value that can be calculated with equation (5).
Figure 2.
– Hypothetical fitting of the growth of P to estimate the ceiling value M as given by equation (1). The highlighted area in the figure (between t1 and t2) represents the total accumulated value that can be calculated with equation (5).
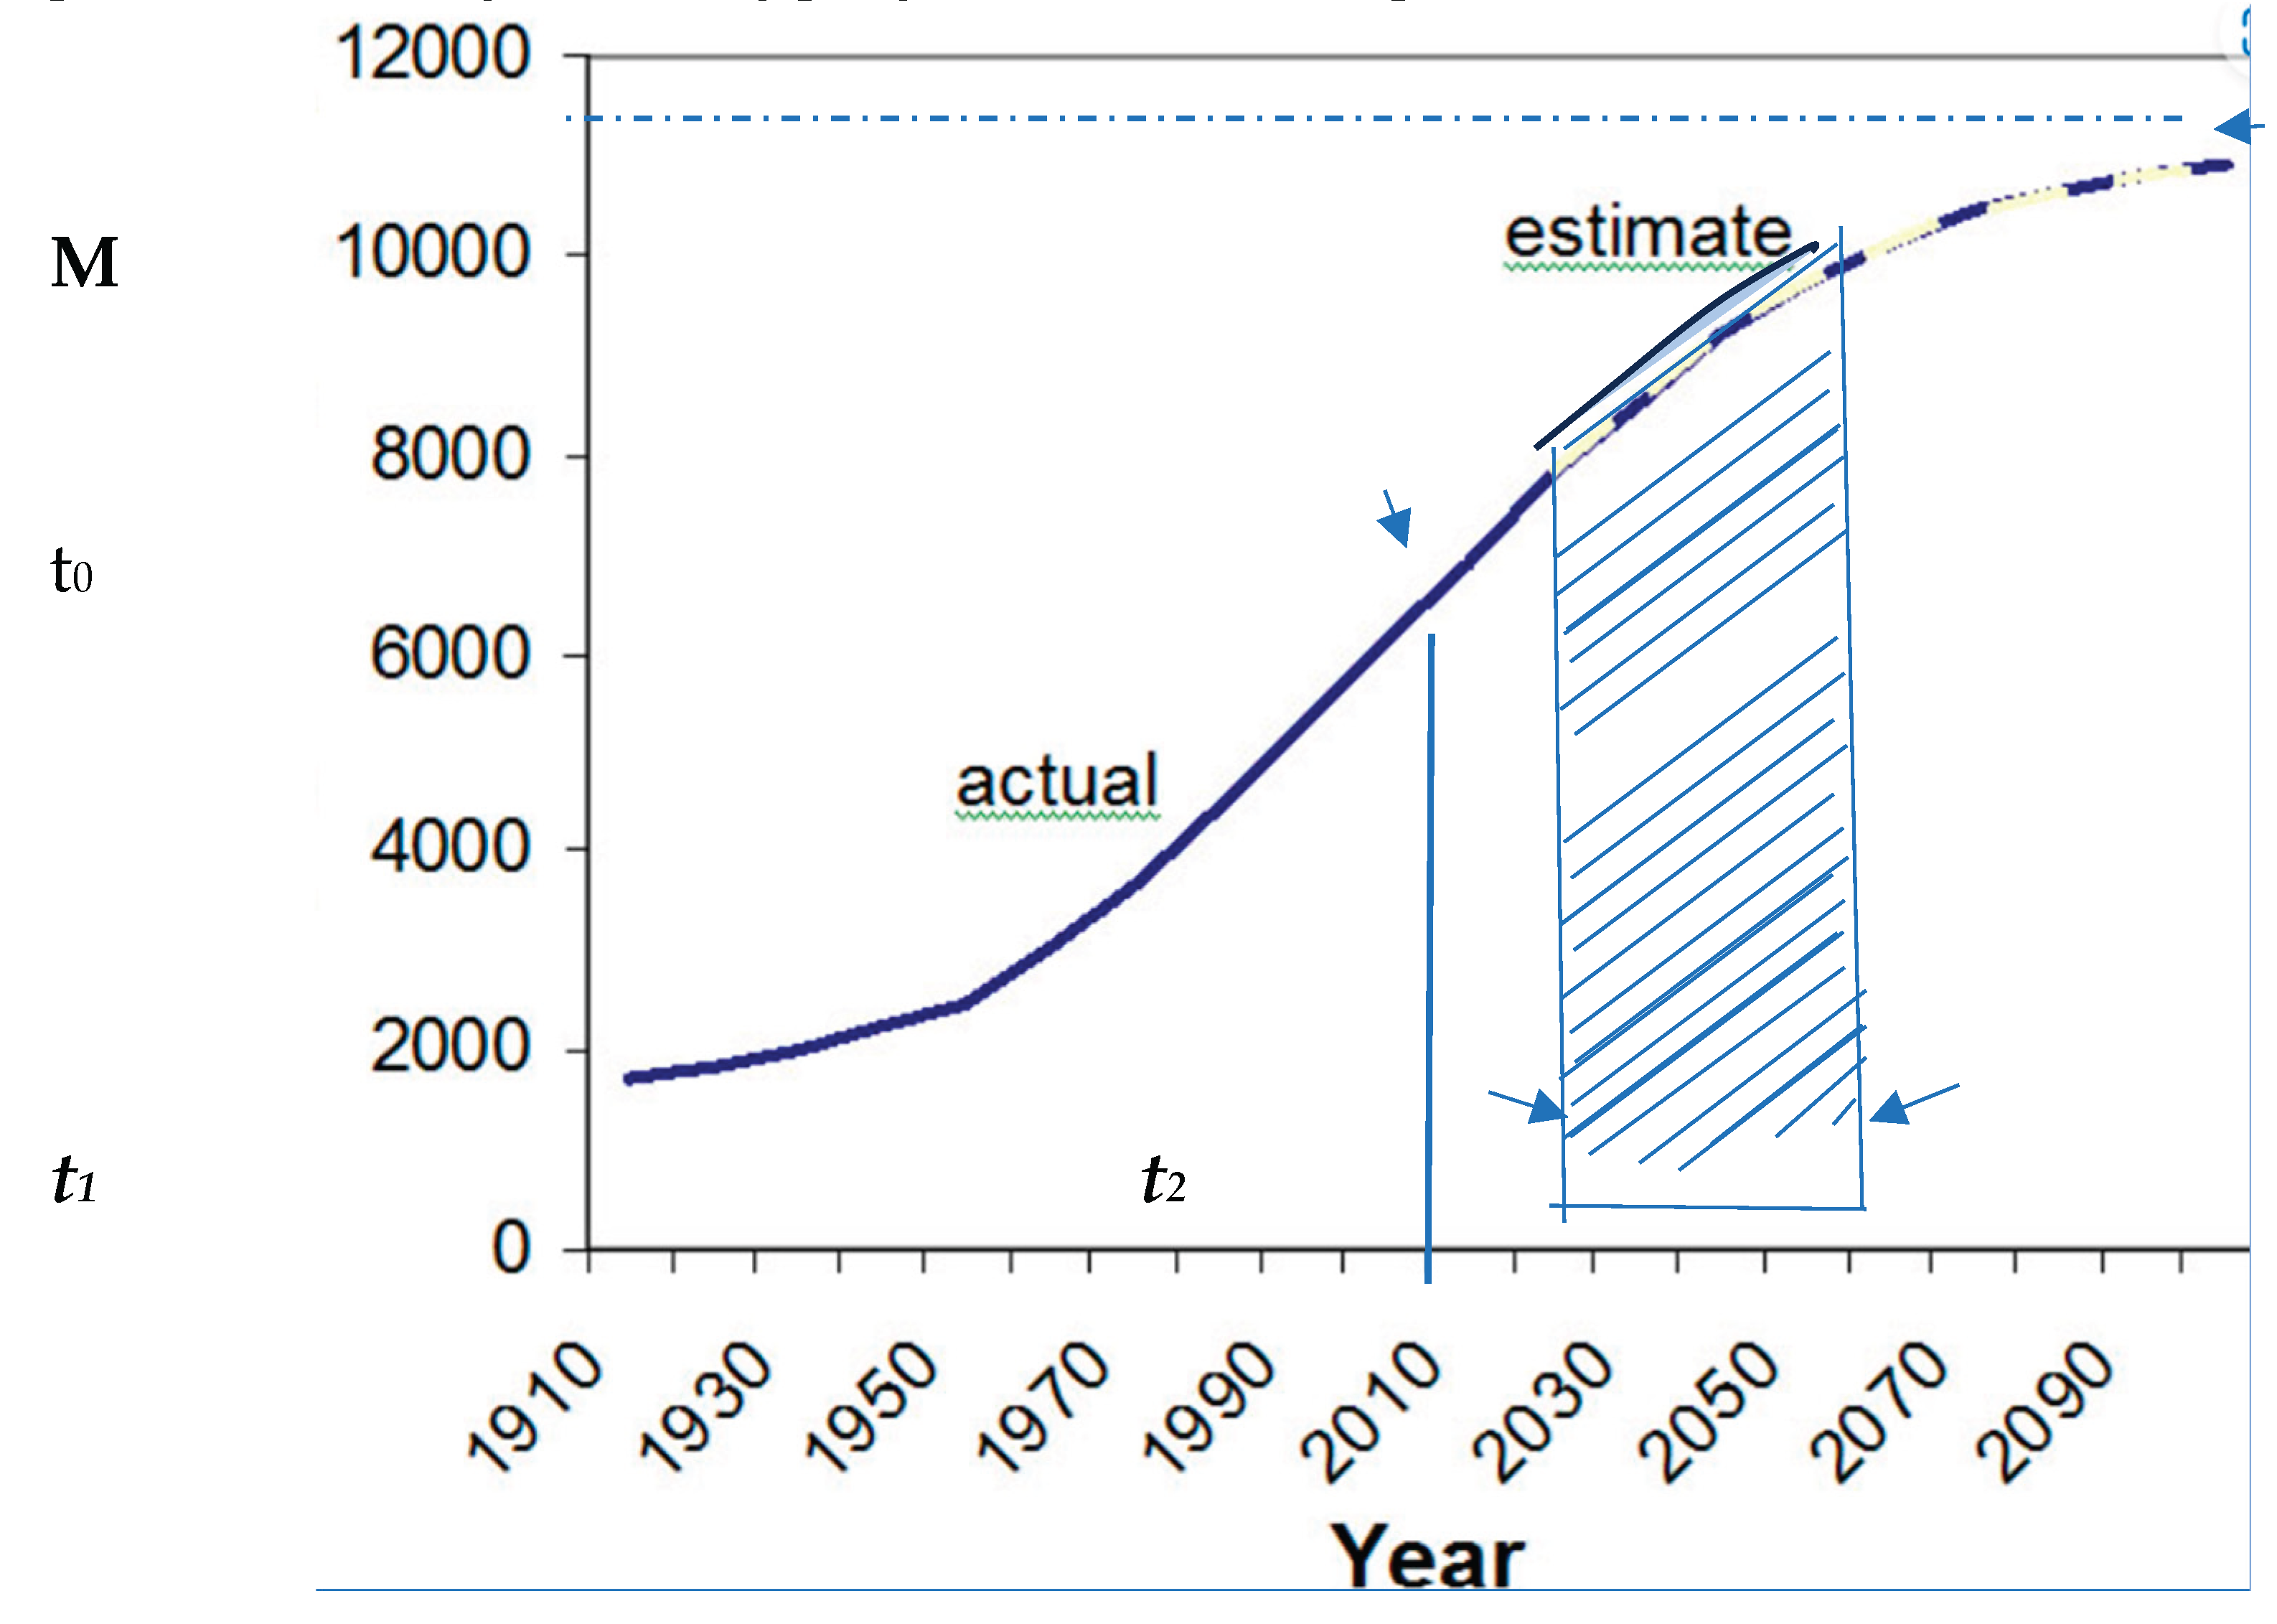
Figure 3.
Worldwide copper production from 1970 until 2023 (data from Statista, 2024, and USGS, 2024).
Figure 3.
Worldwide copper production from 1970 until 2023 (data from Statista, 2024, and USGS, 2024).
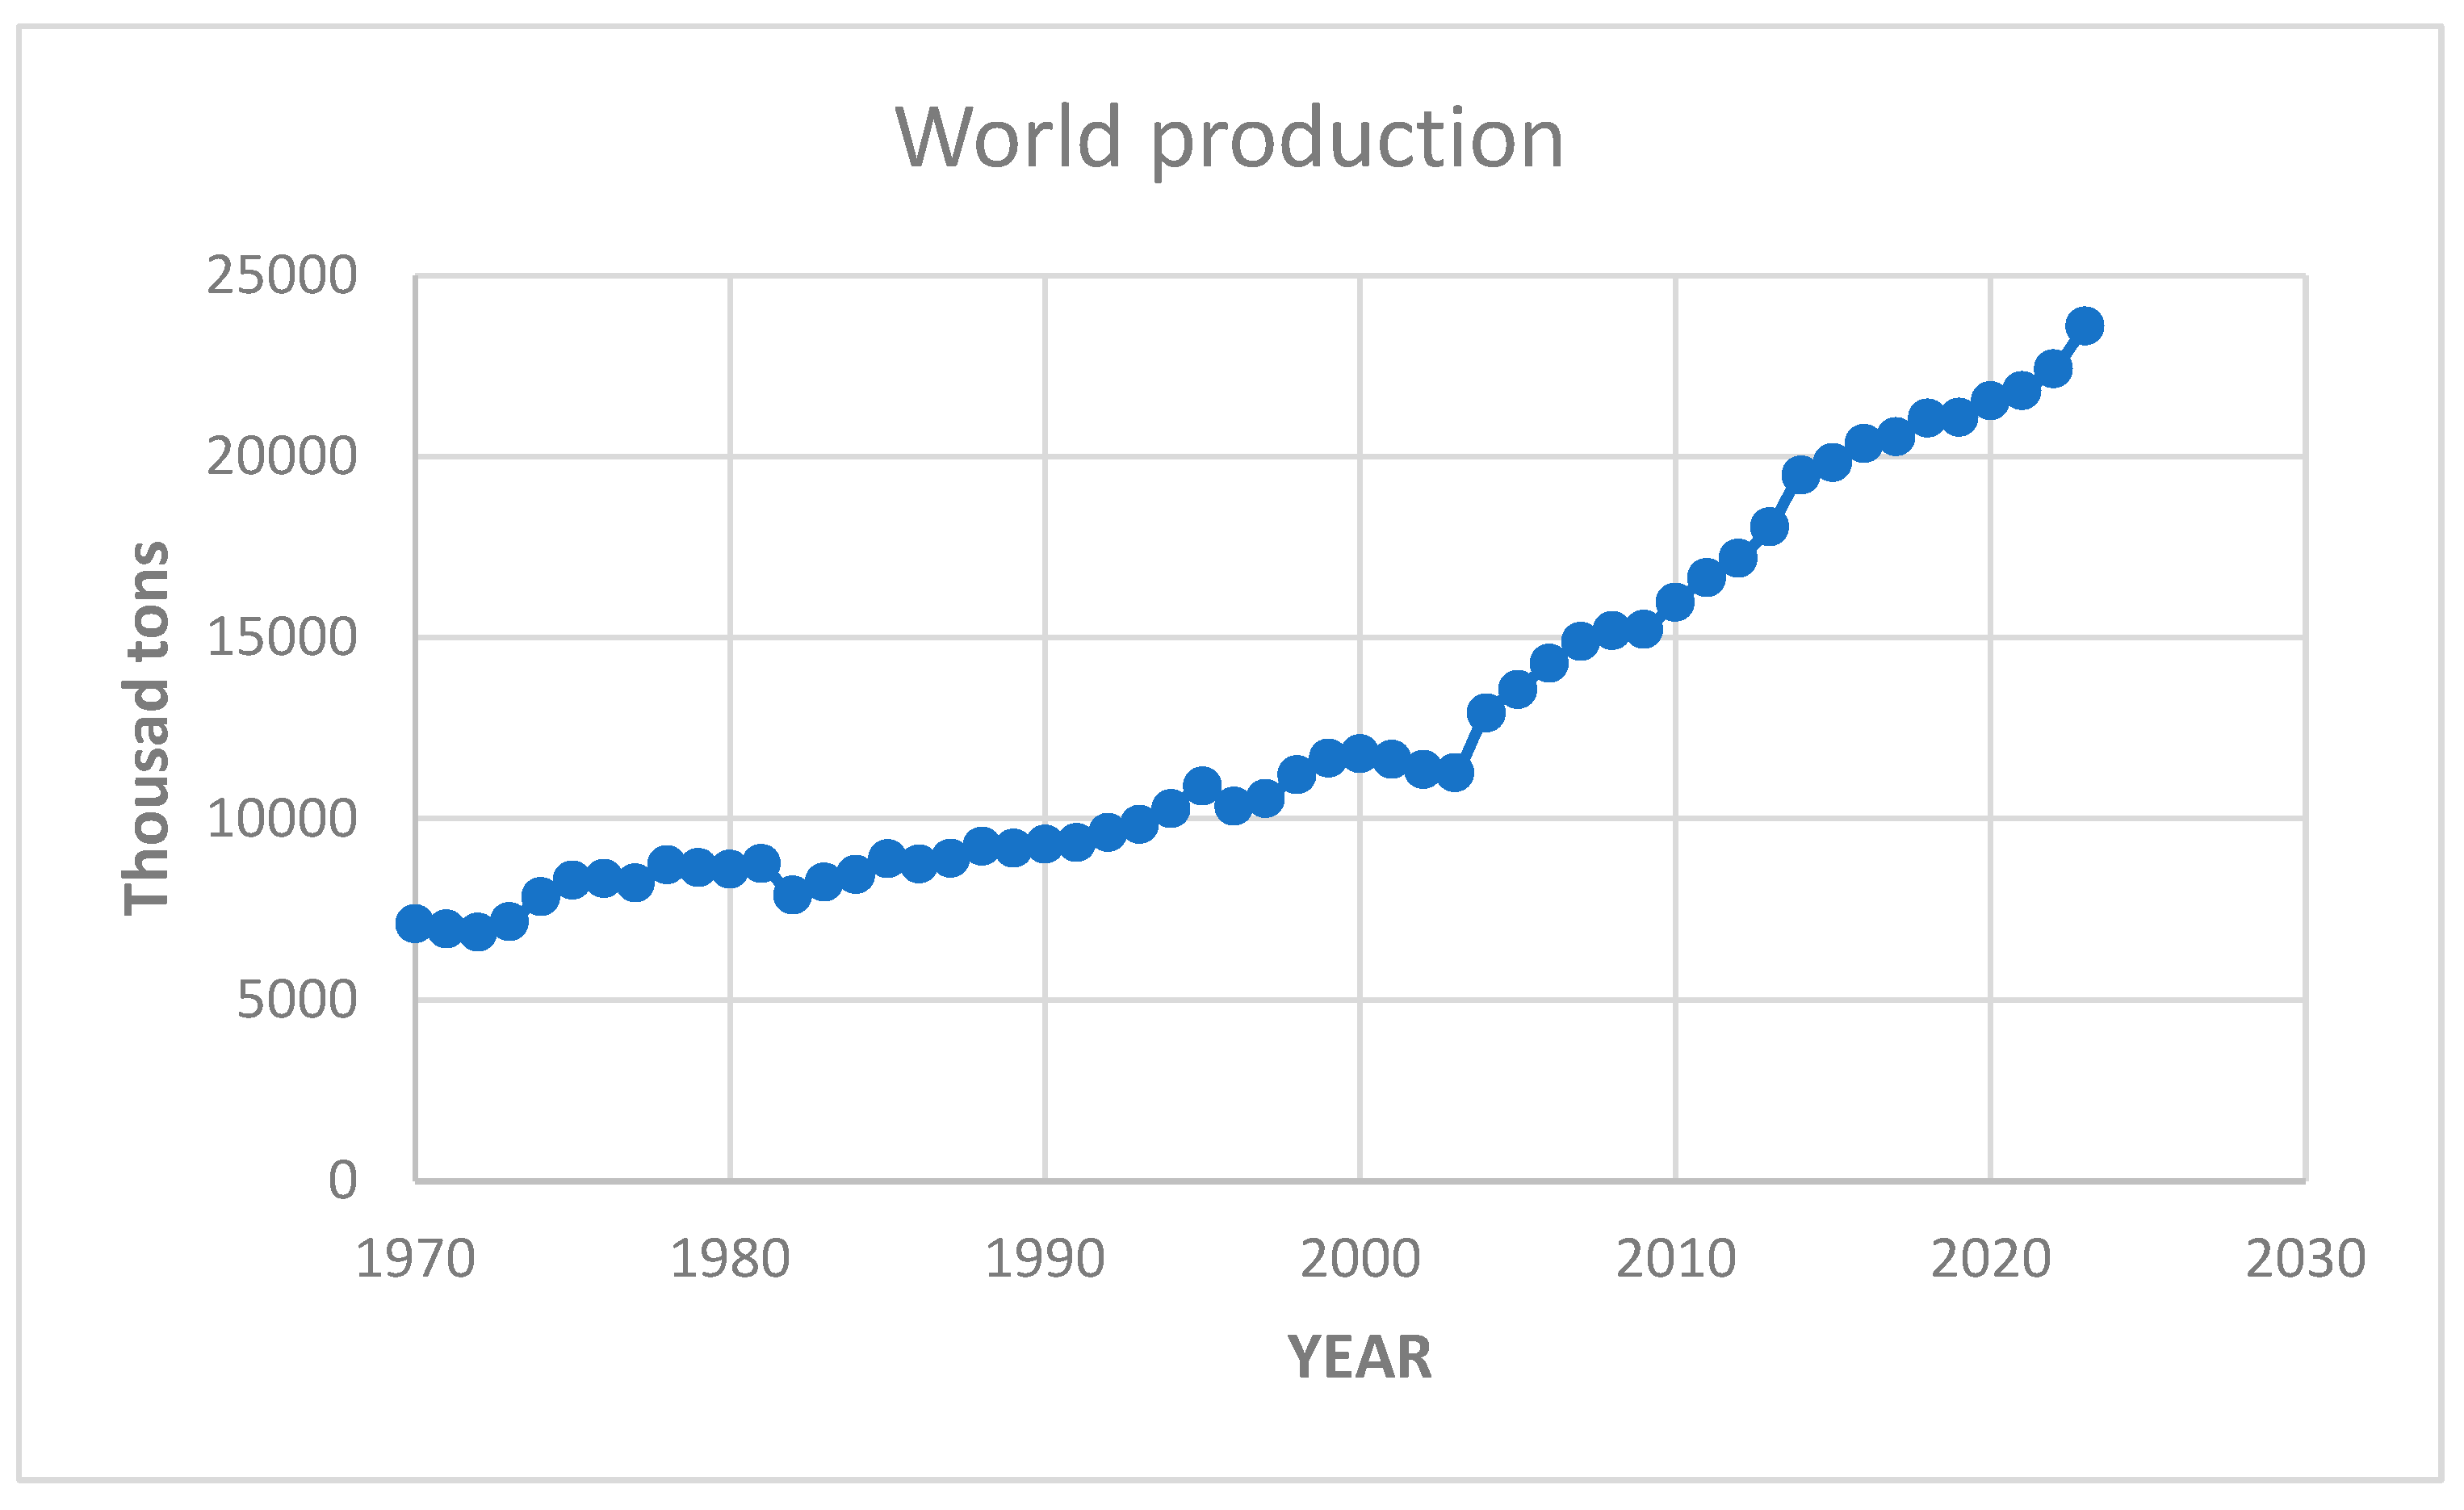
Figure 4.
Logistic fit of the world copper production pointing out a ceiling (green line) of about 63,000 thousand tons in 2060.
Figure 4.
Logistic fit of the world copper production pointing out a ceiling (green line) of about 63,000 thousand tons in 2060.
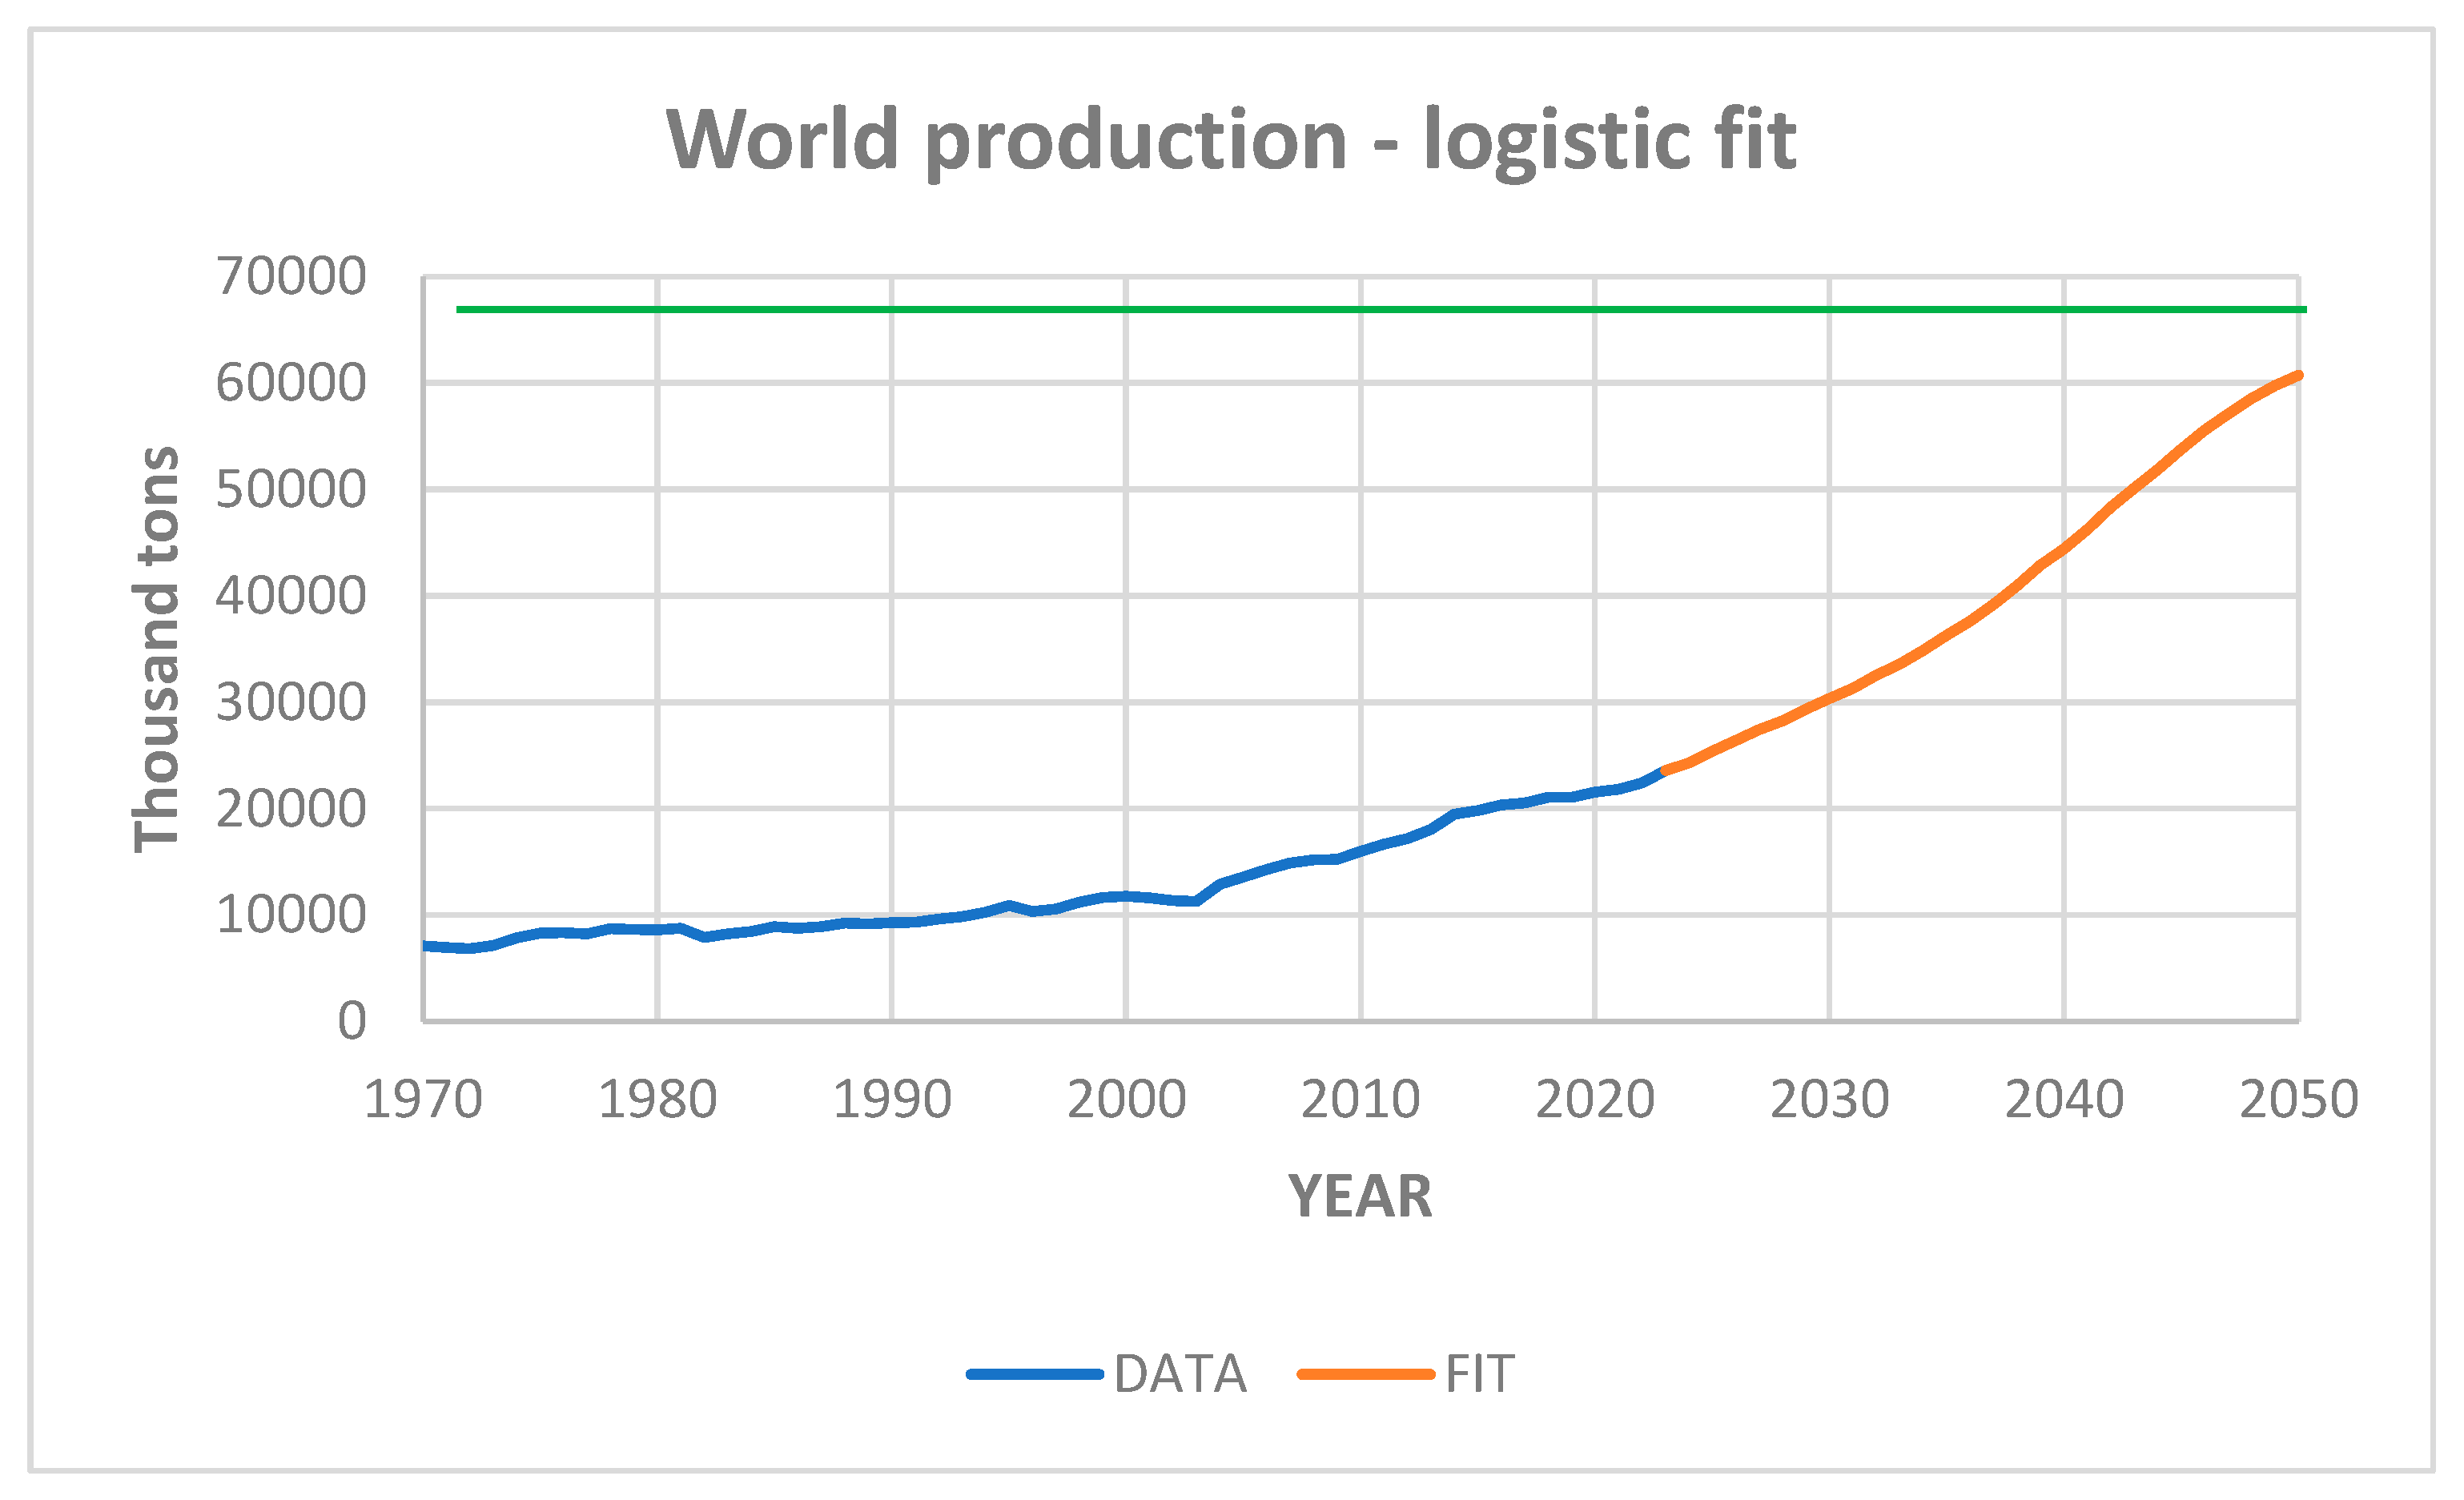
Figure 5.
Cumulative world production of copper until 2050 resulting of the application of the integral logistic model. The red line indicates the currently estimated copper reserves (Statista, 2023).
Figure 5.
Cumulative world production of copper until 2050 resulting of the application of the integral logistic model. The red line indicates the currently estimated copper reserves (Statista, 2023).
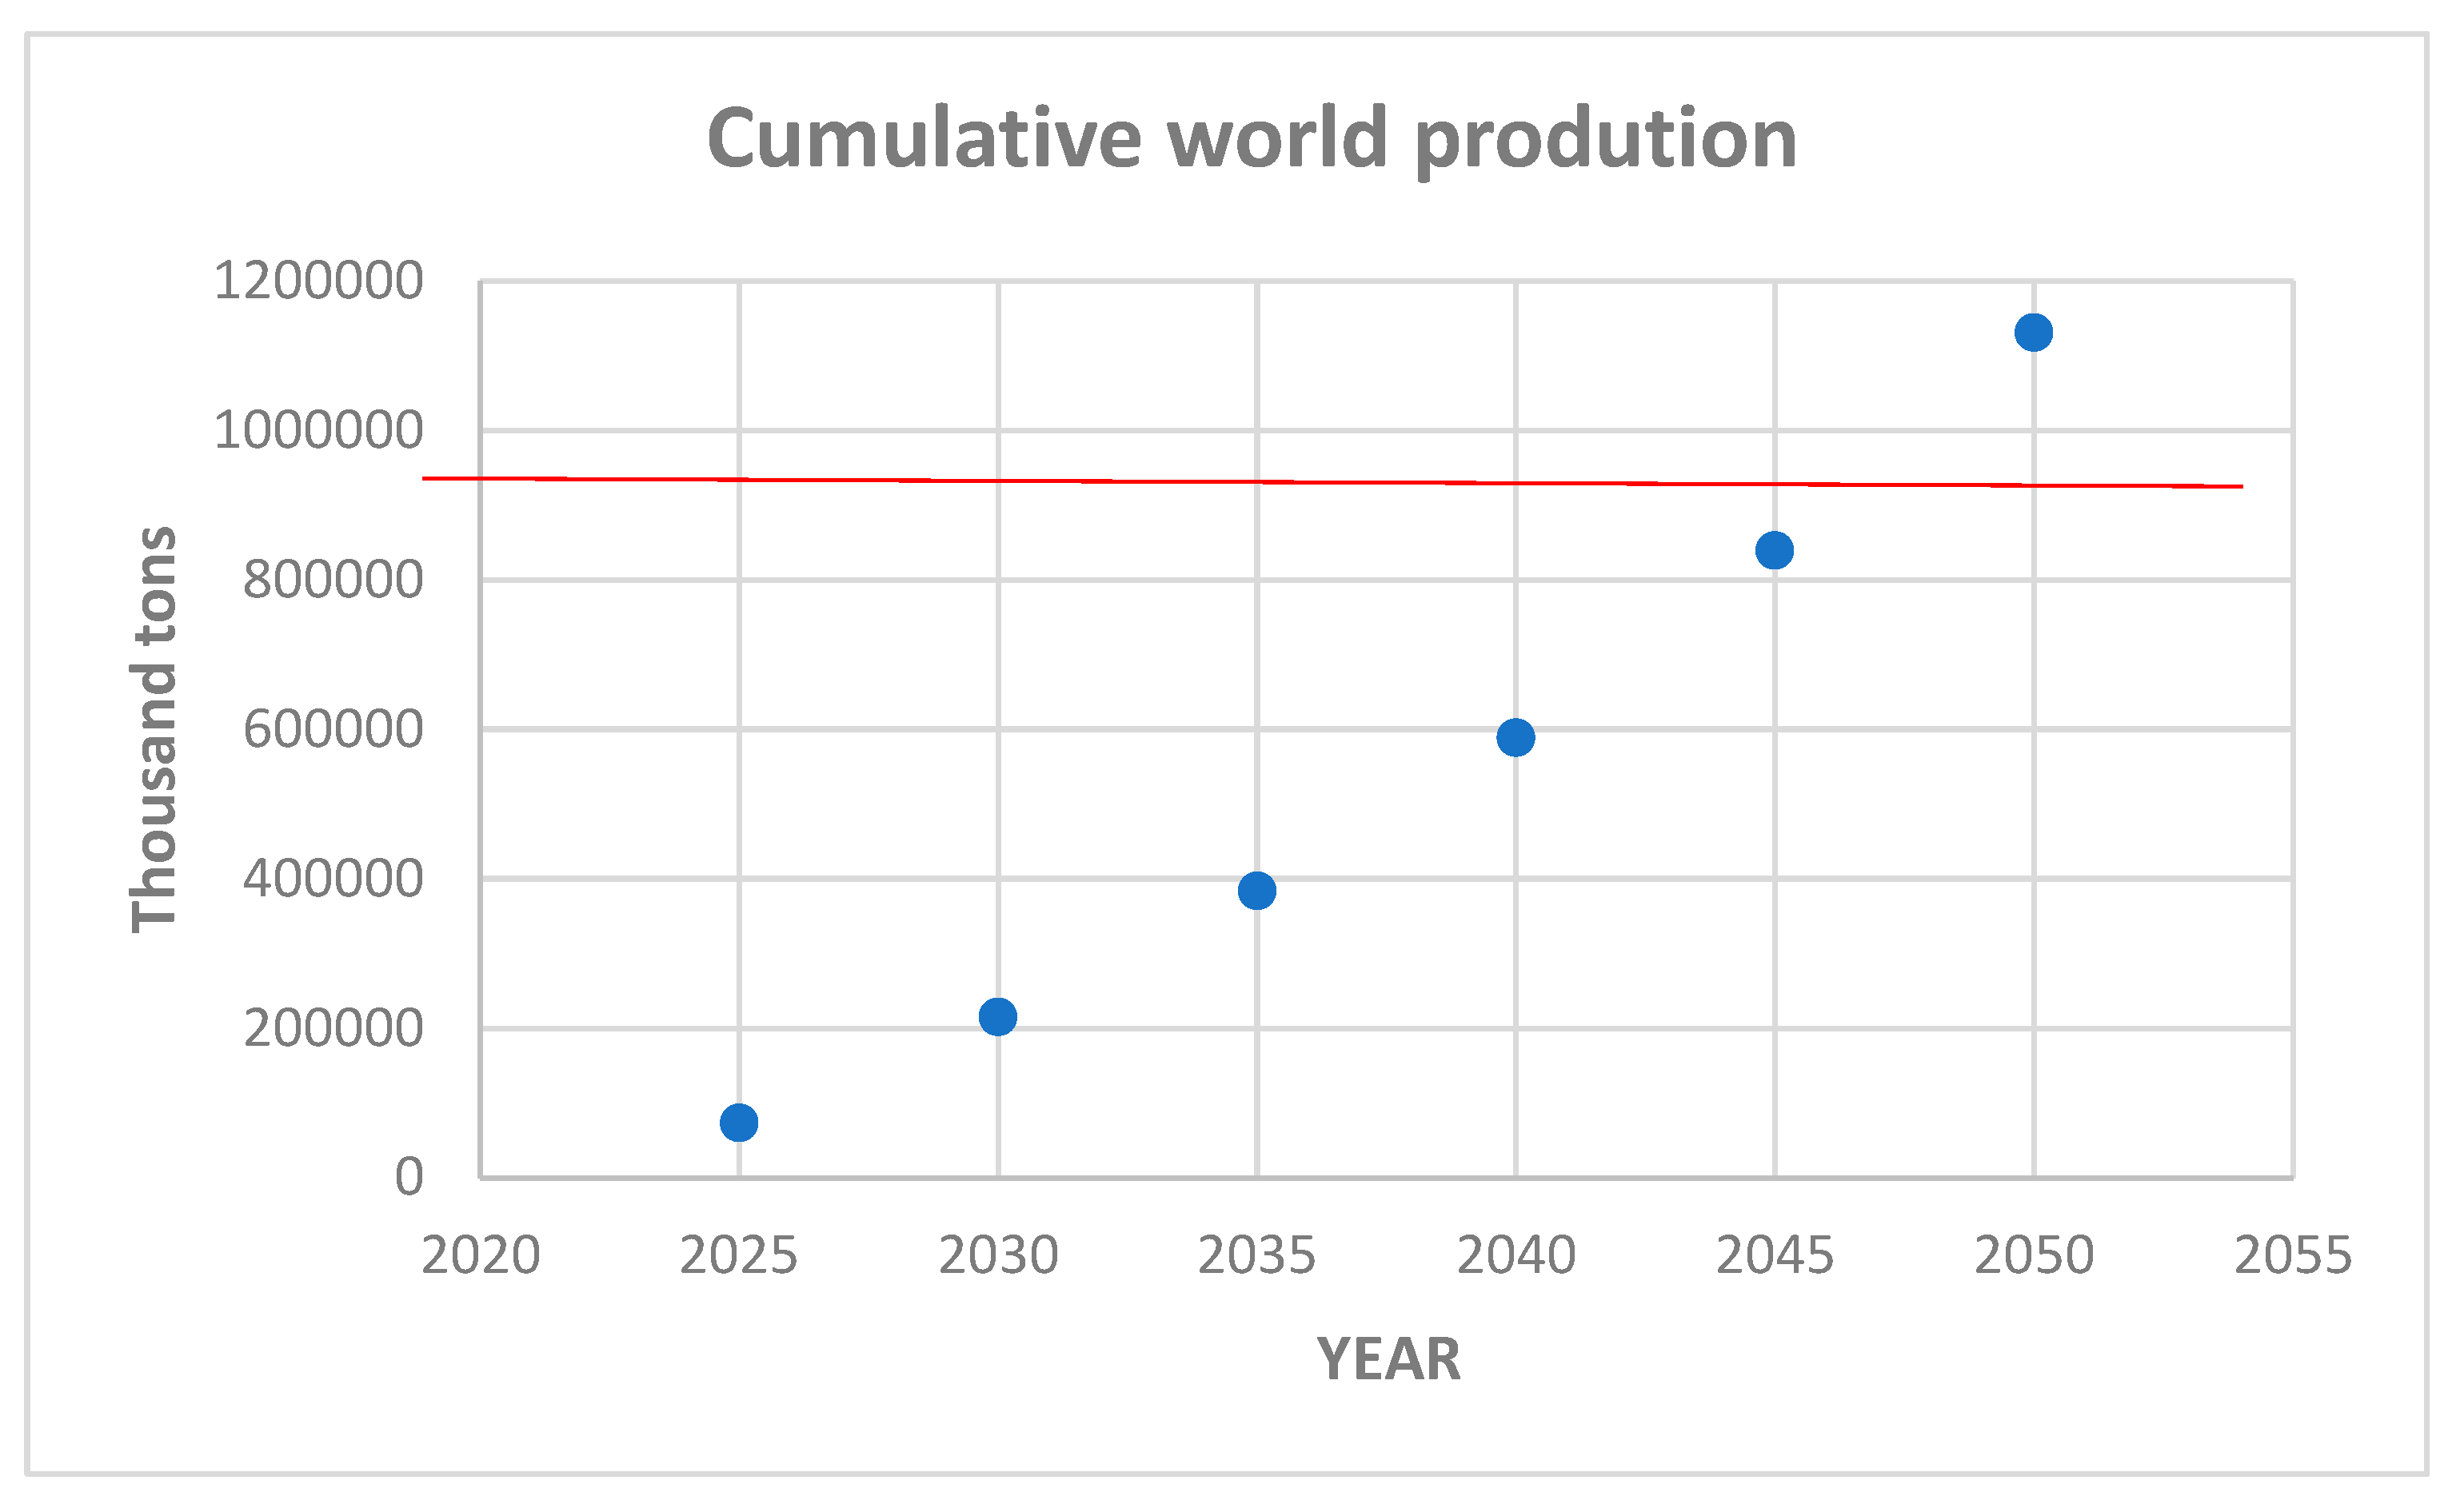
Figure 6.
- Worldwide cobalt production from 1995 until 2023 (data from Statista, 2024, and USGS, 2024).
Figure 6.
- Worldwide cobalt production from 1995 until 2023 (data from Statista, 2024, and USGS, 2024).
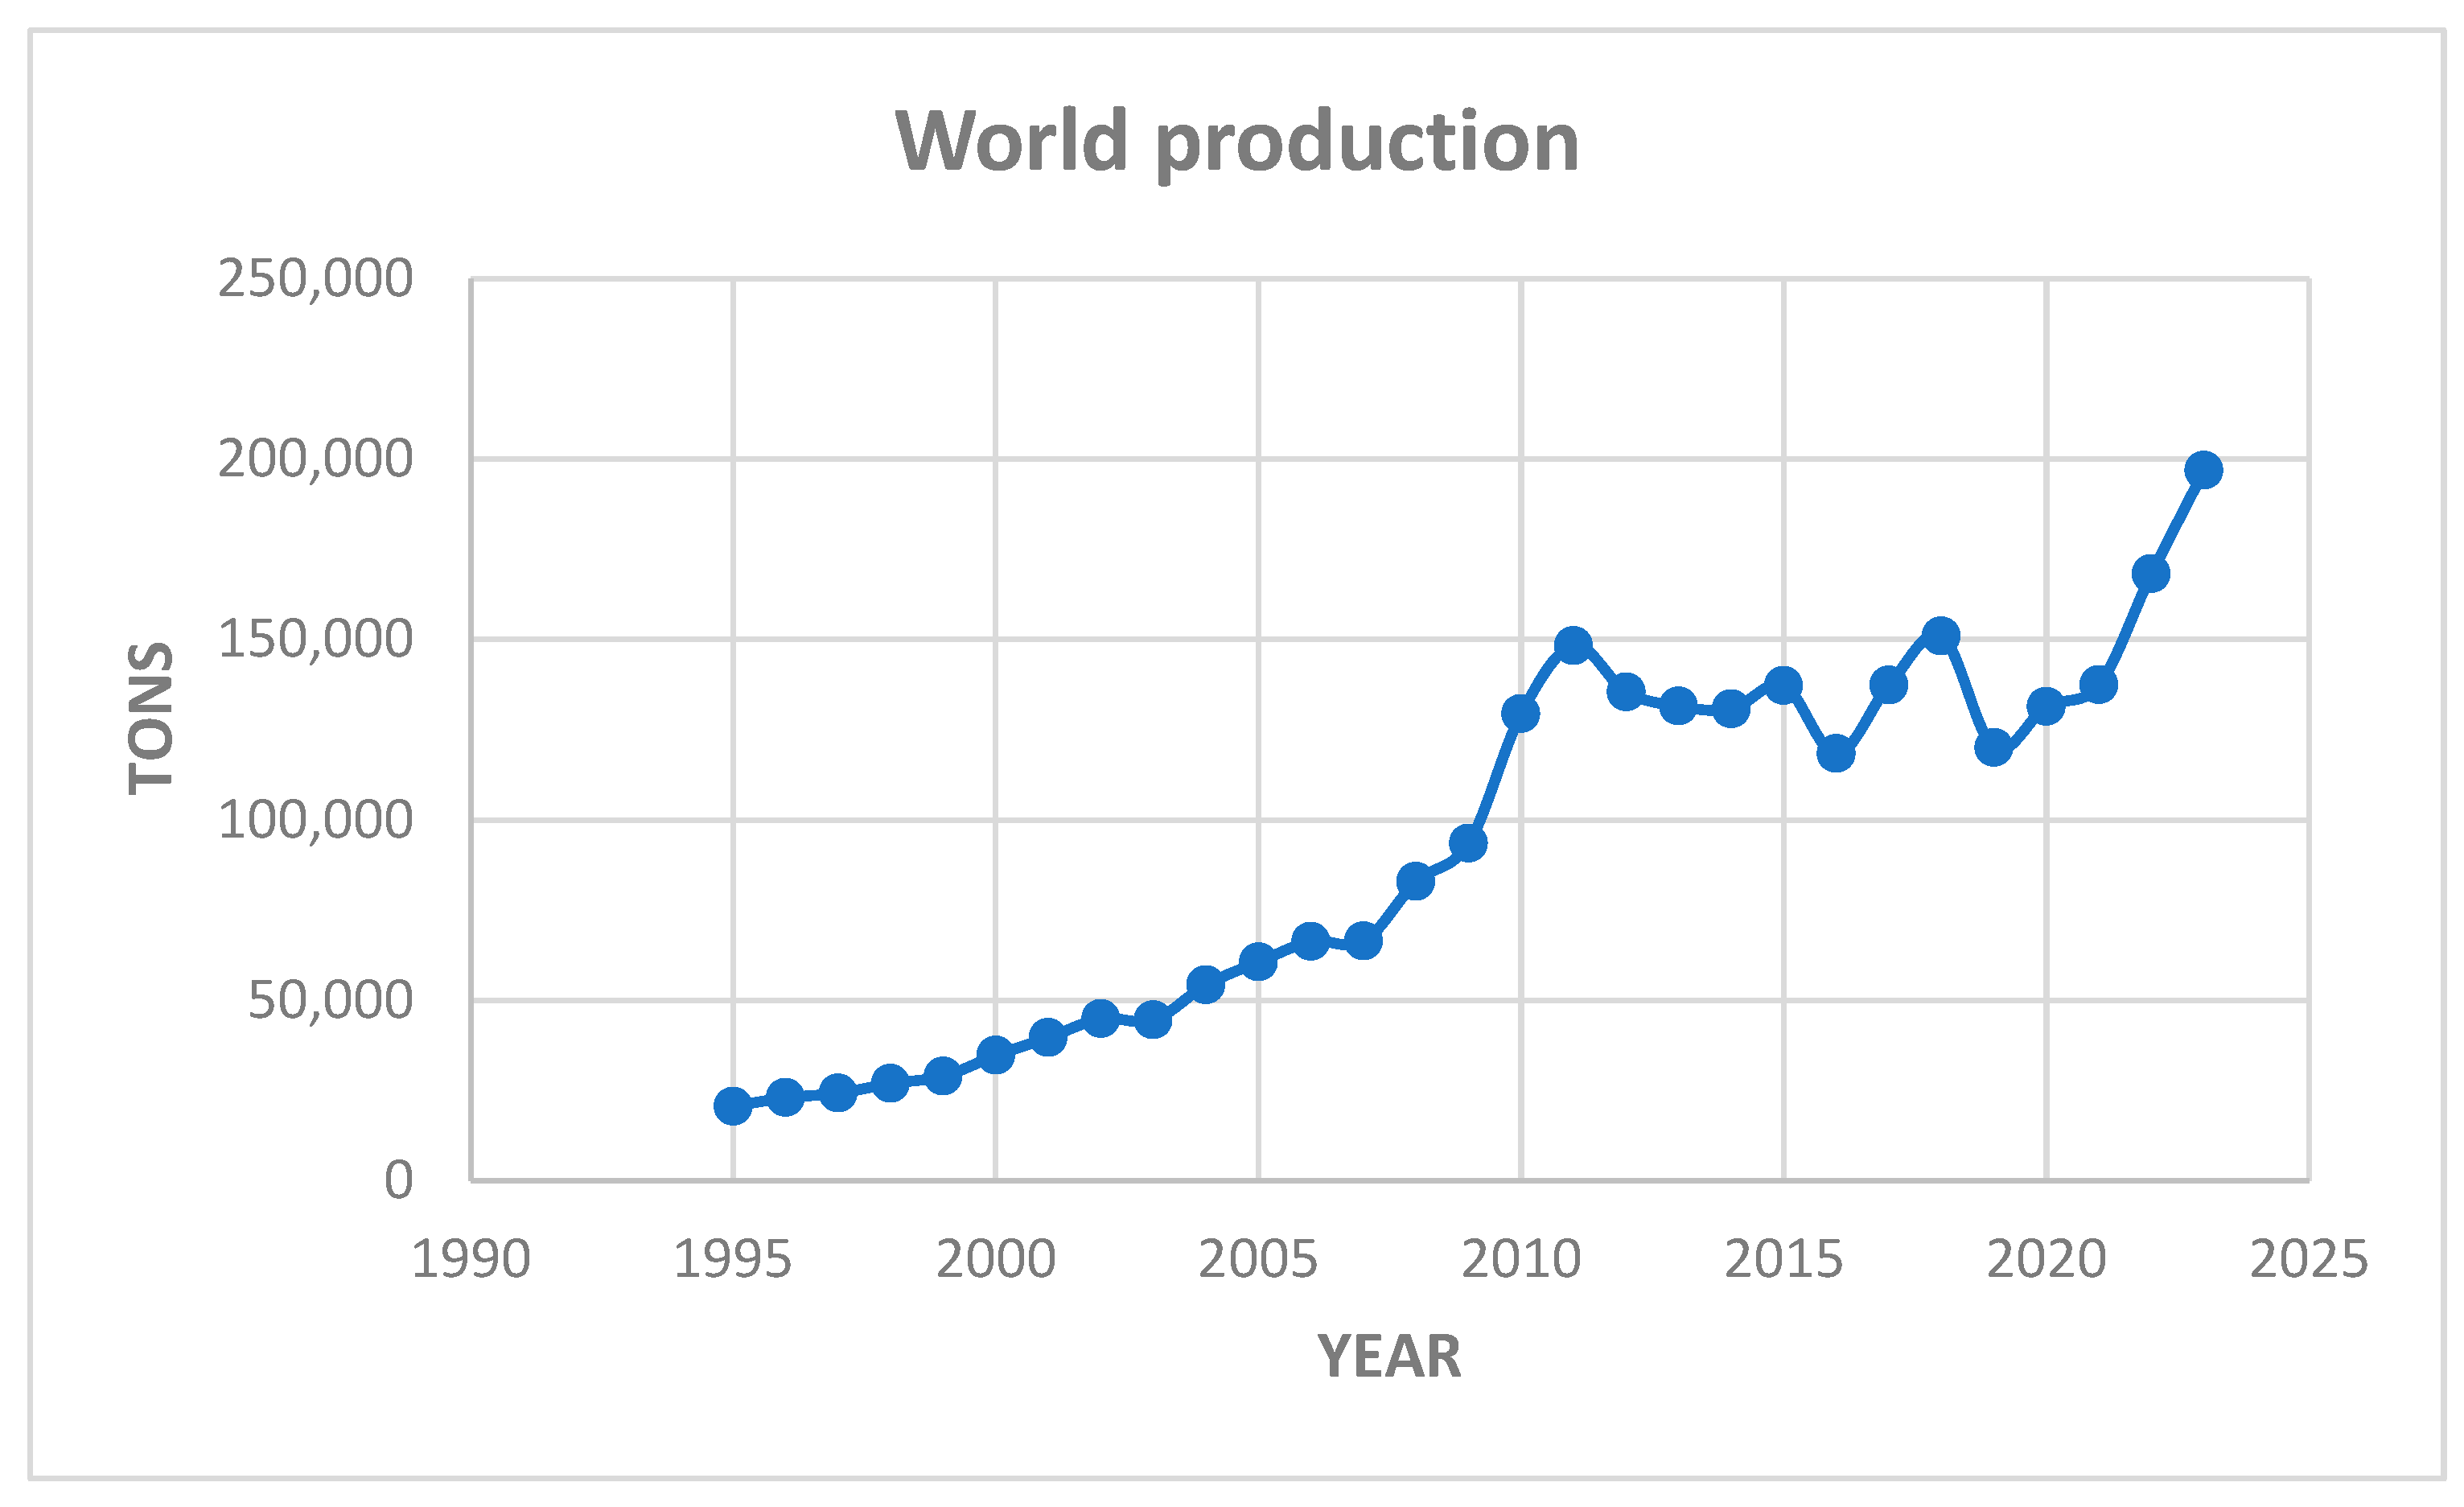
Figure 7.
- Logistic fit of the world cobalt production pointing out a ceiling (green line) of about 410,000 tons in 2060.
Figure 7.
- Logistic fit of the world cobalt production pointing out a ceiling (green line) of about 410,000 tons in 2060.
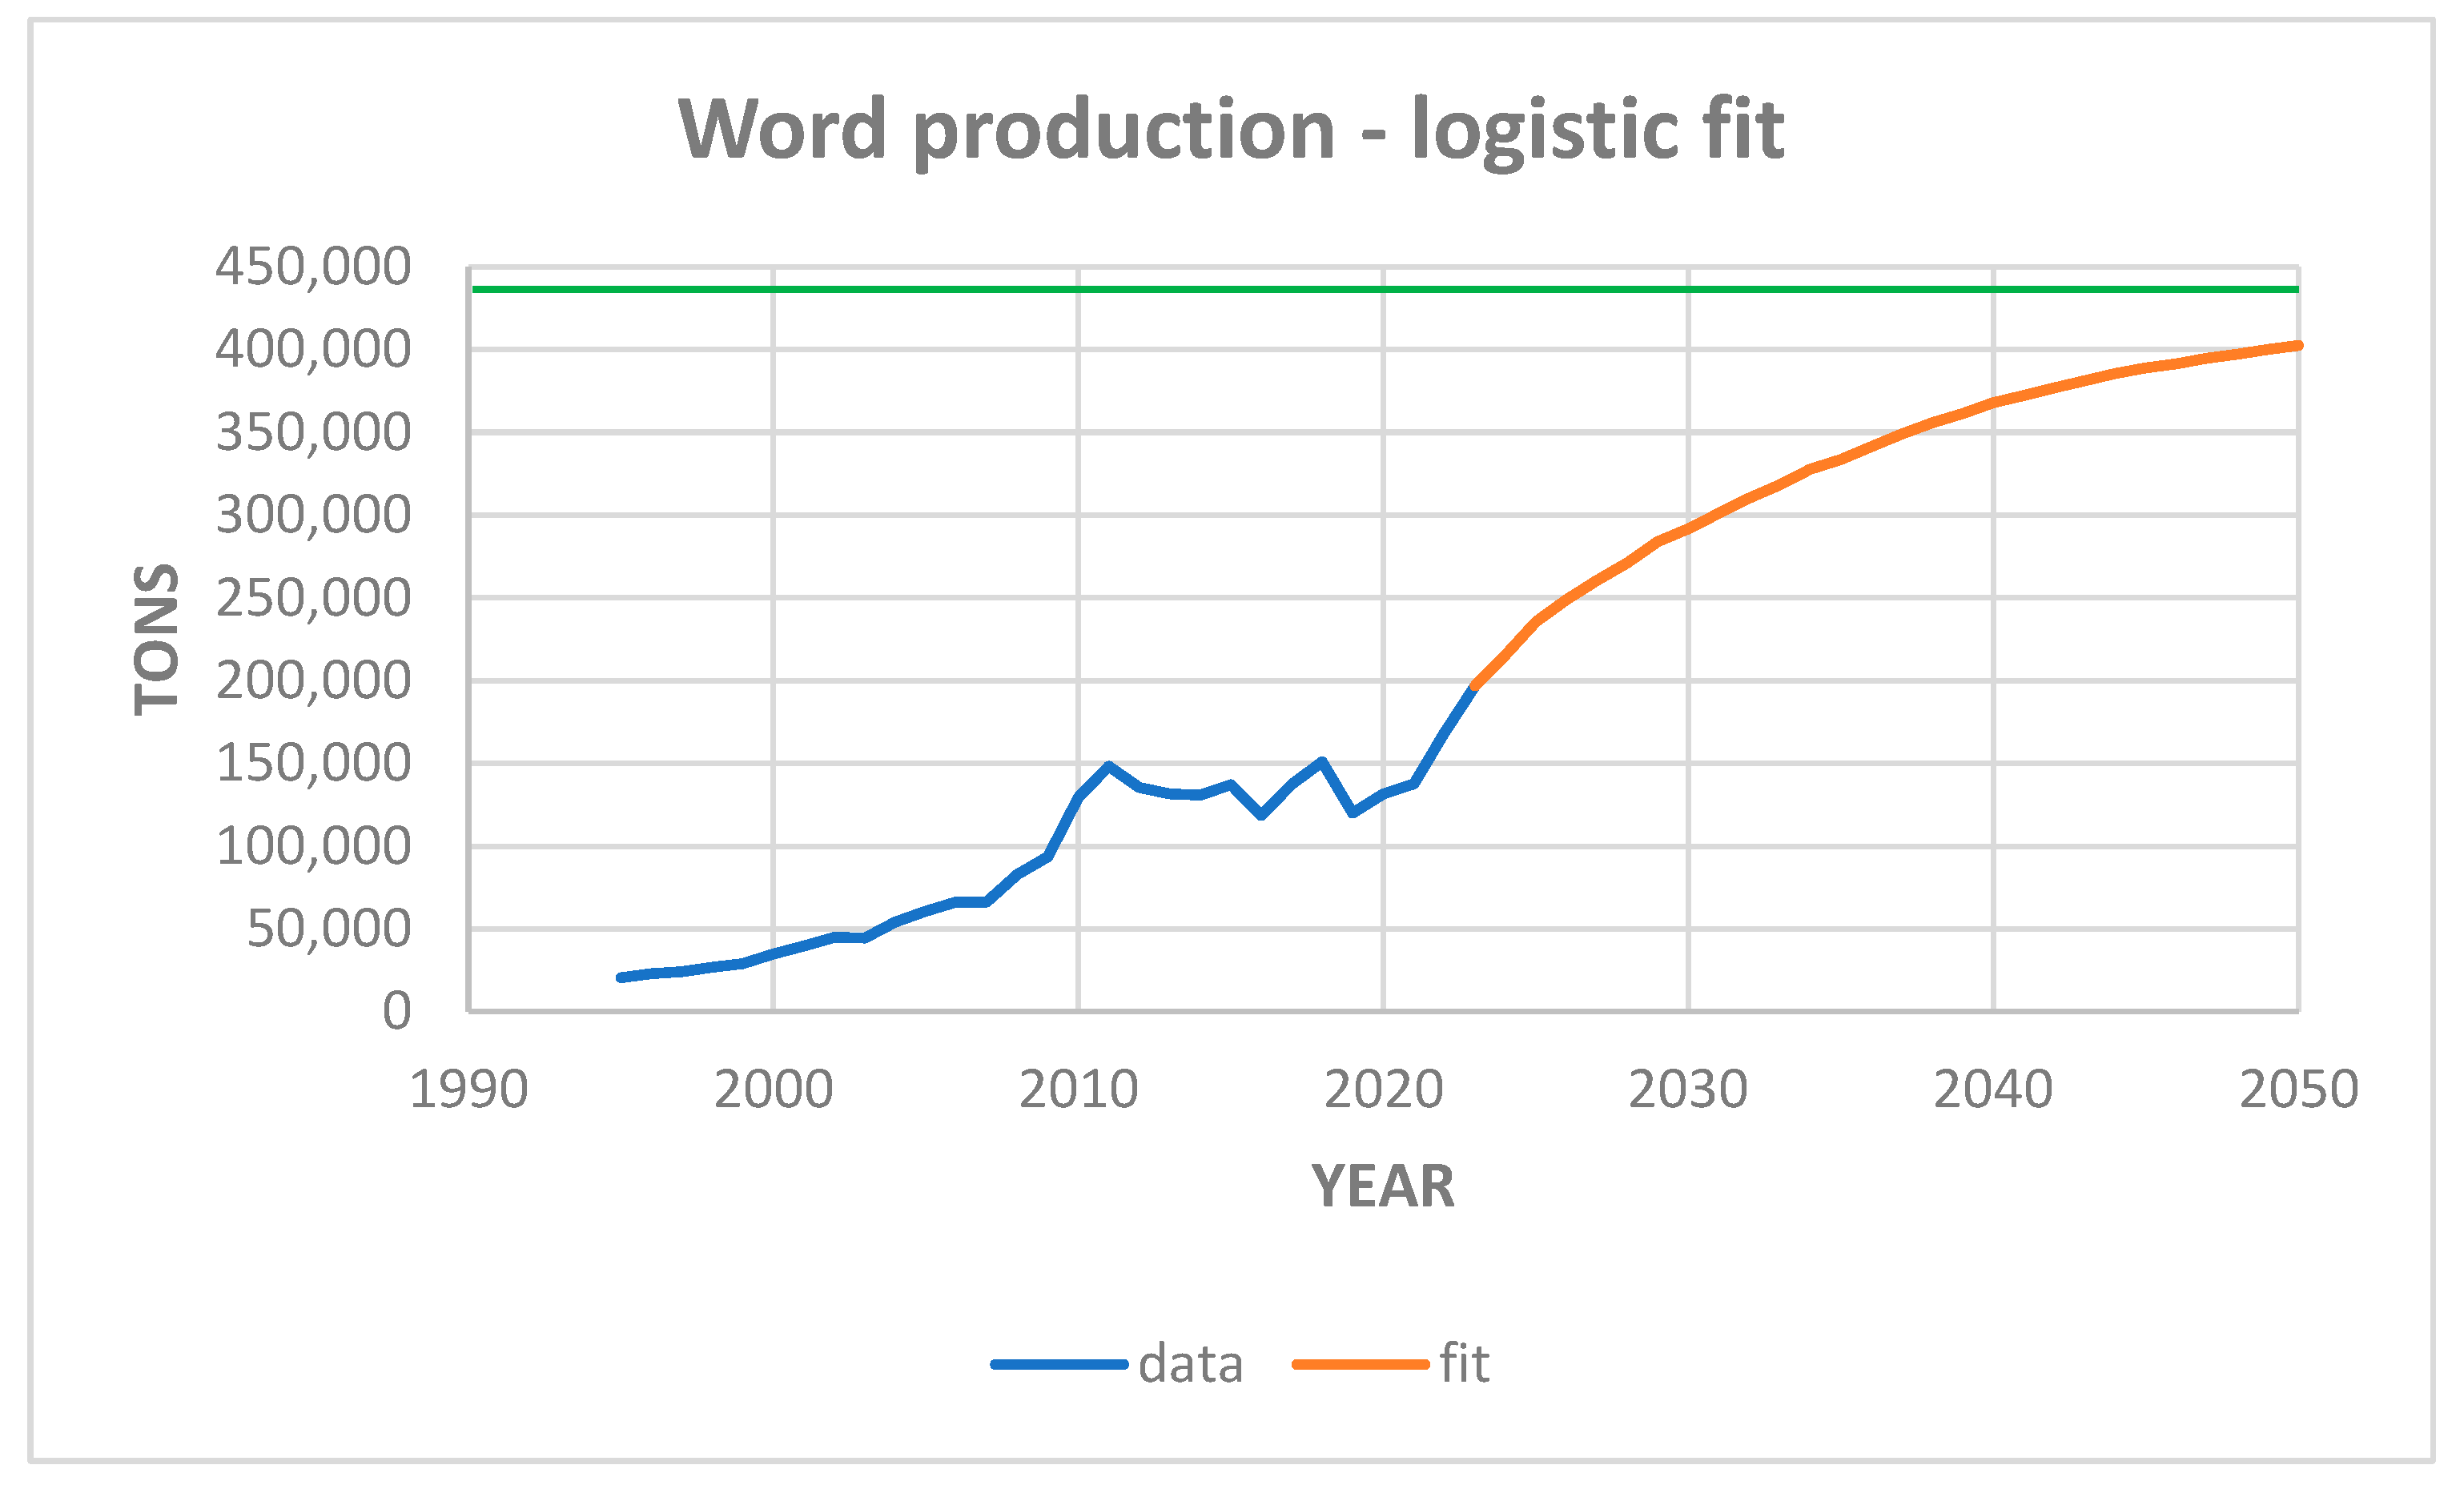
Figure 8.
- Cumulative world production of cobalt until 2050 resulting from the application of the integral logistic model. The red line indicates the currently estimated copper reserves (USGS, 2023).
Figure 8.
- Cumulative world production of cobalt until 2050 resulting from the application of the integral logistic model. The red line indicates the currently estimated copper reserves (USGS, 2023).
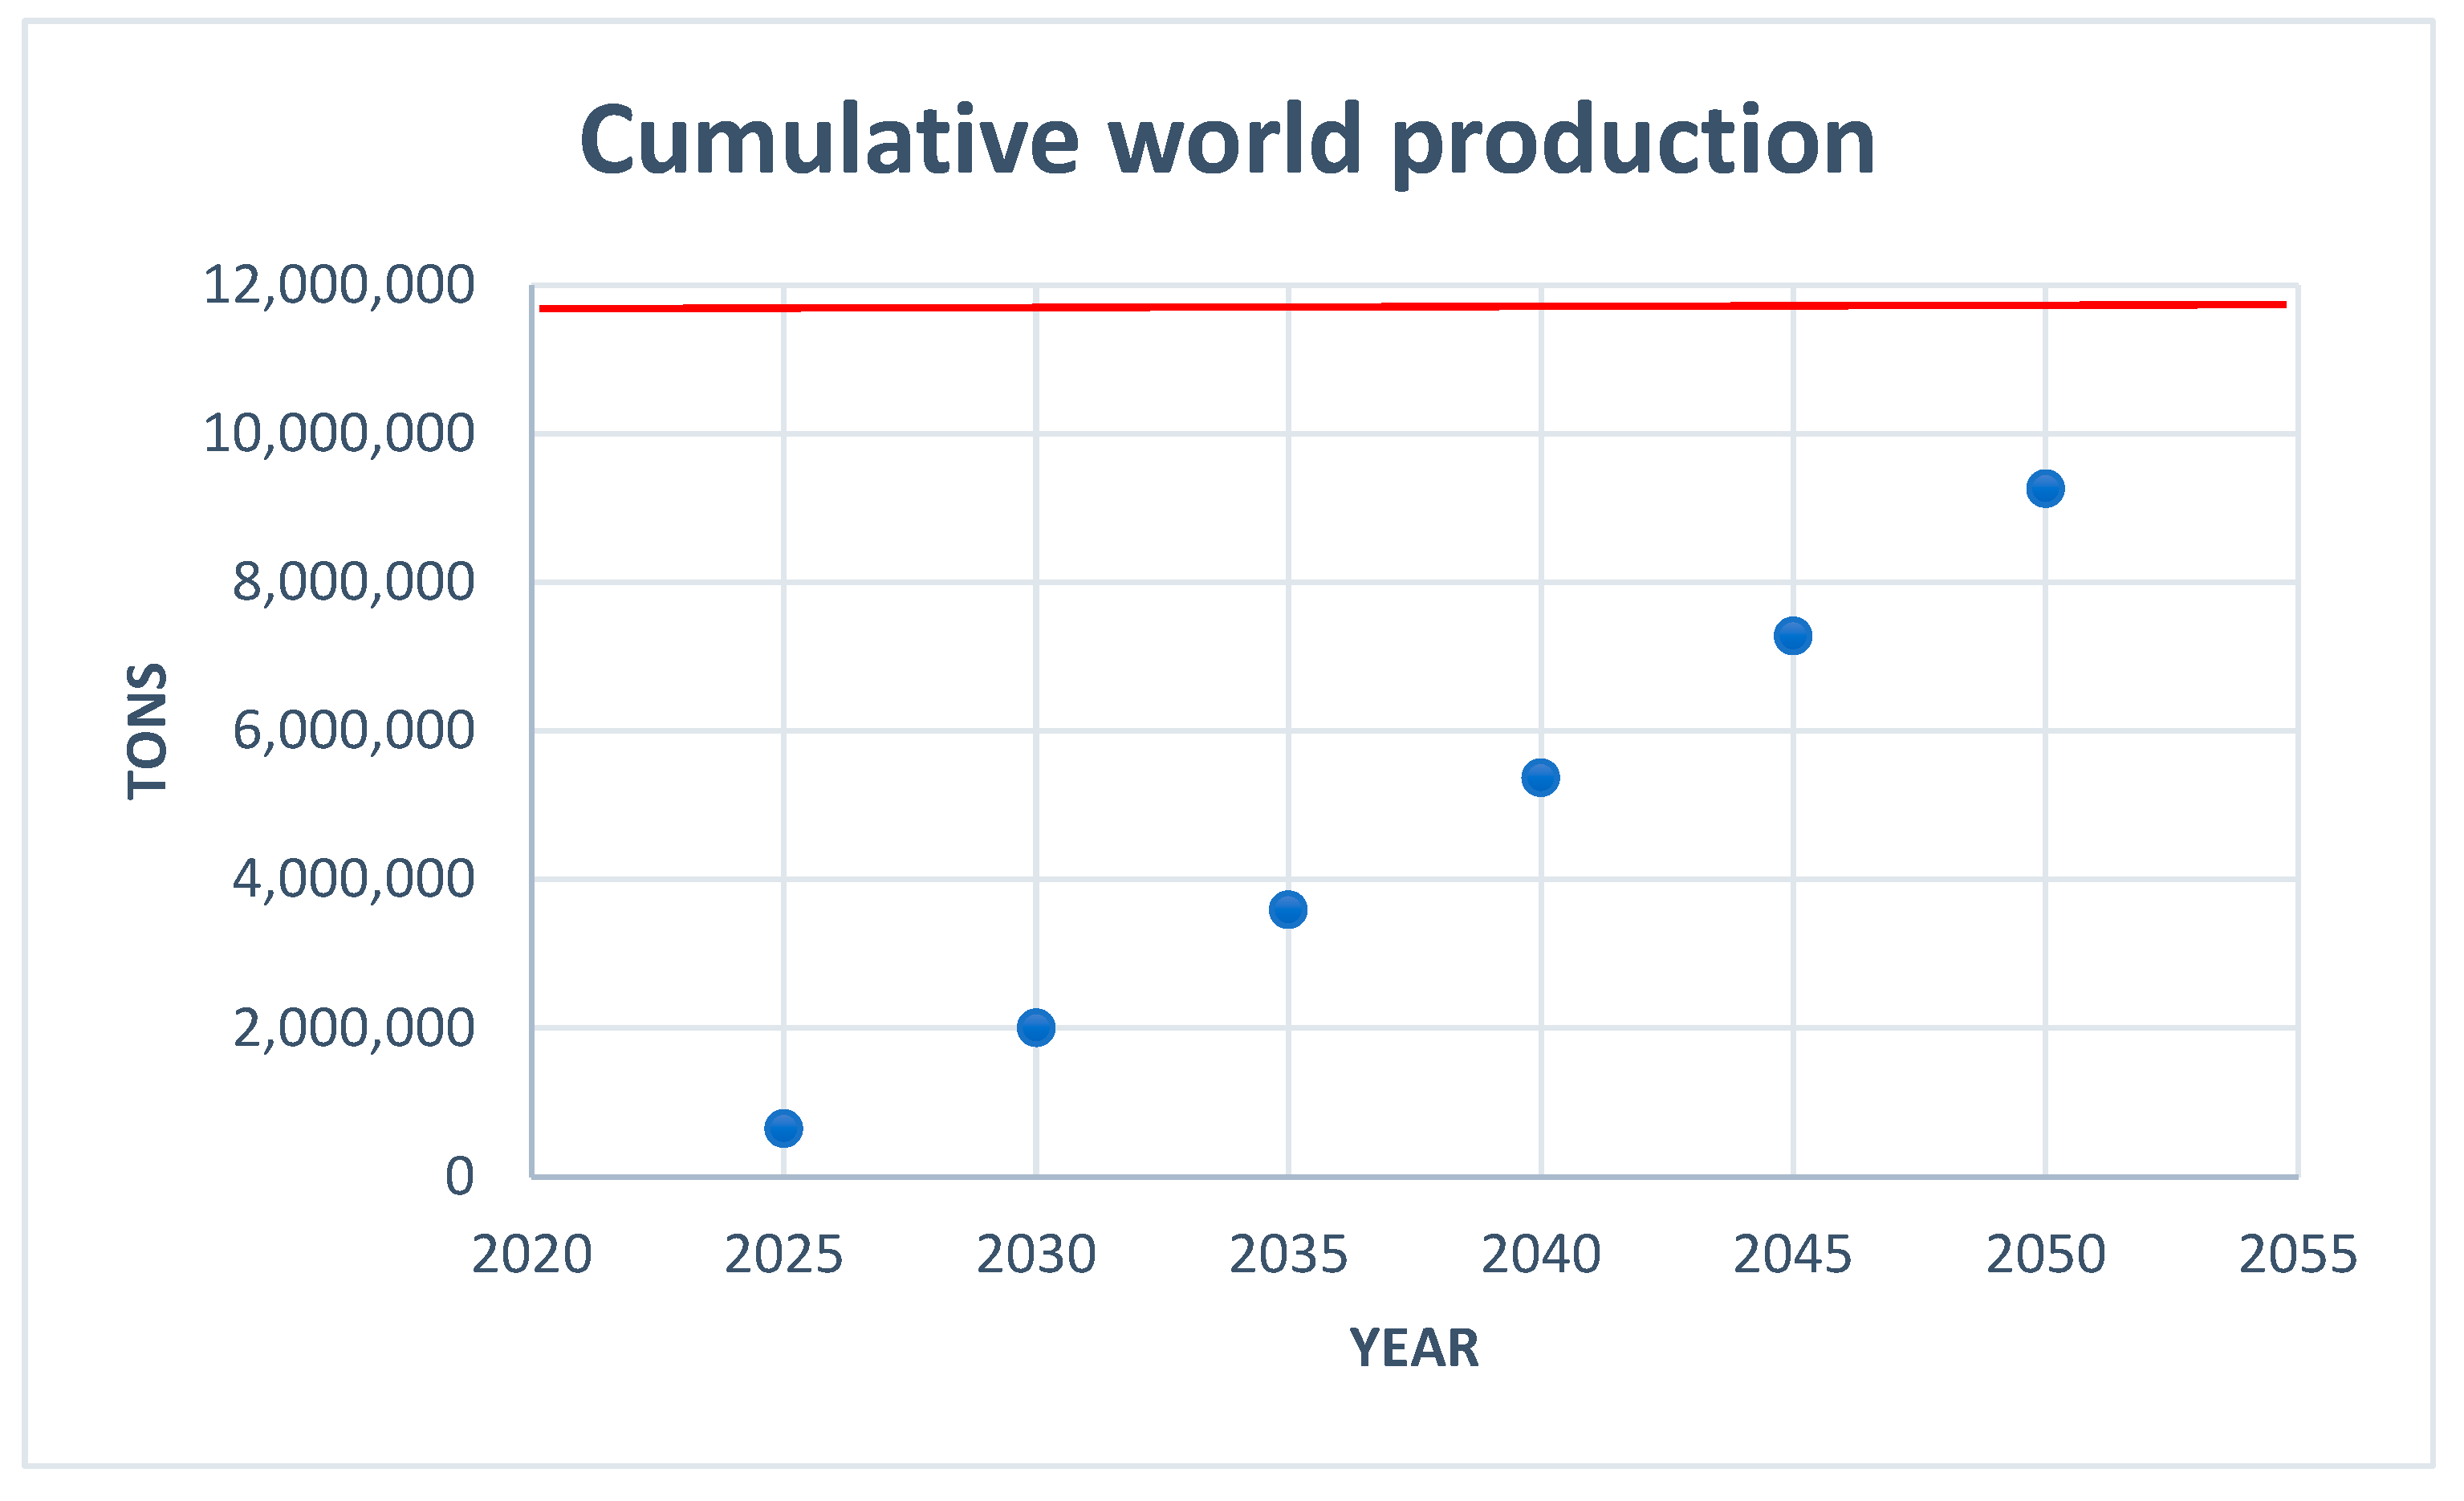
Figure 9.
- Worldwide nickel production from 1970 until 2023 (data from Statista, 2024, and USGS, 2024).
Figure 9.
- Worldwide nickel production from 1970 until 2023 (data from Statista, 2024, and USGS, 2024).
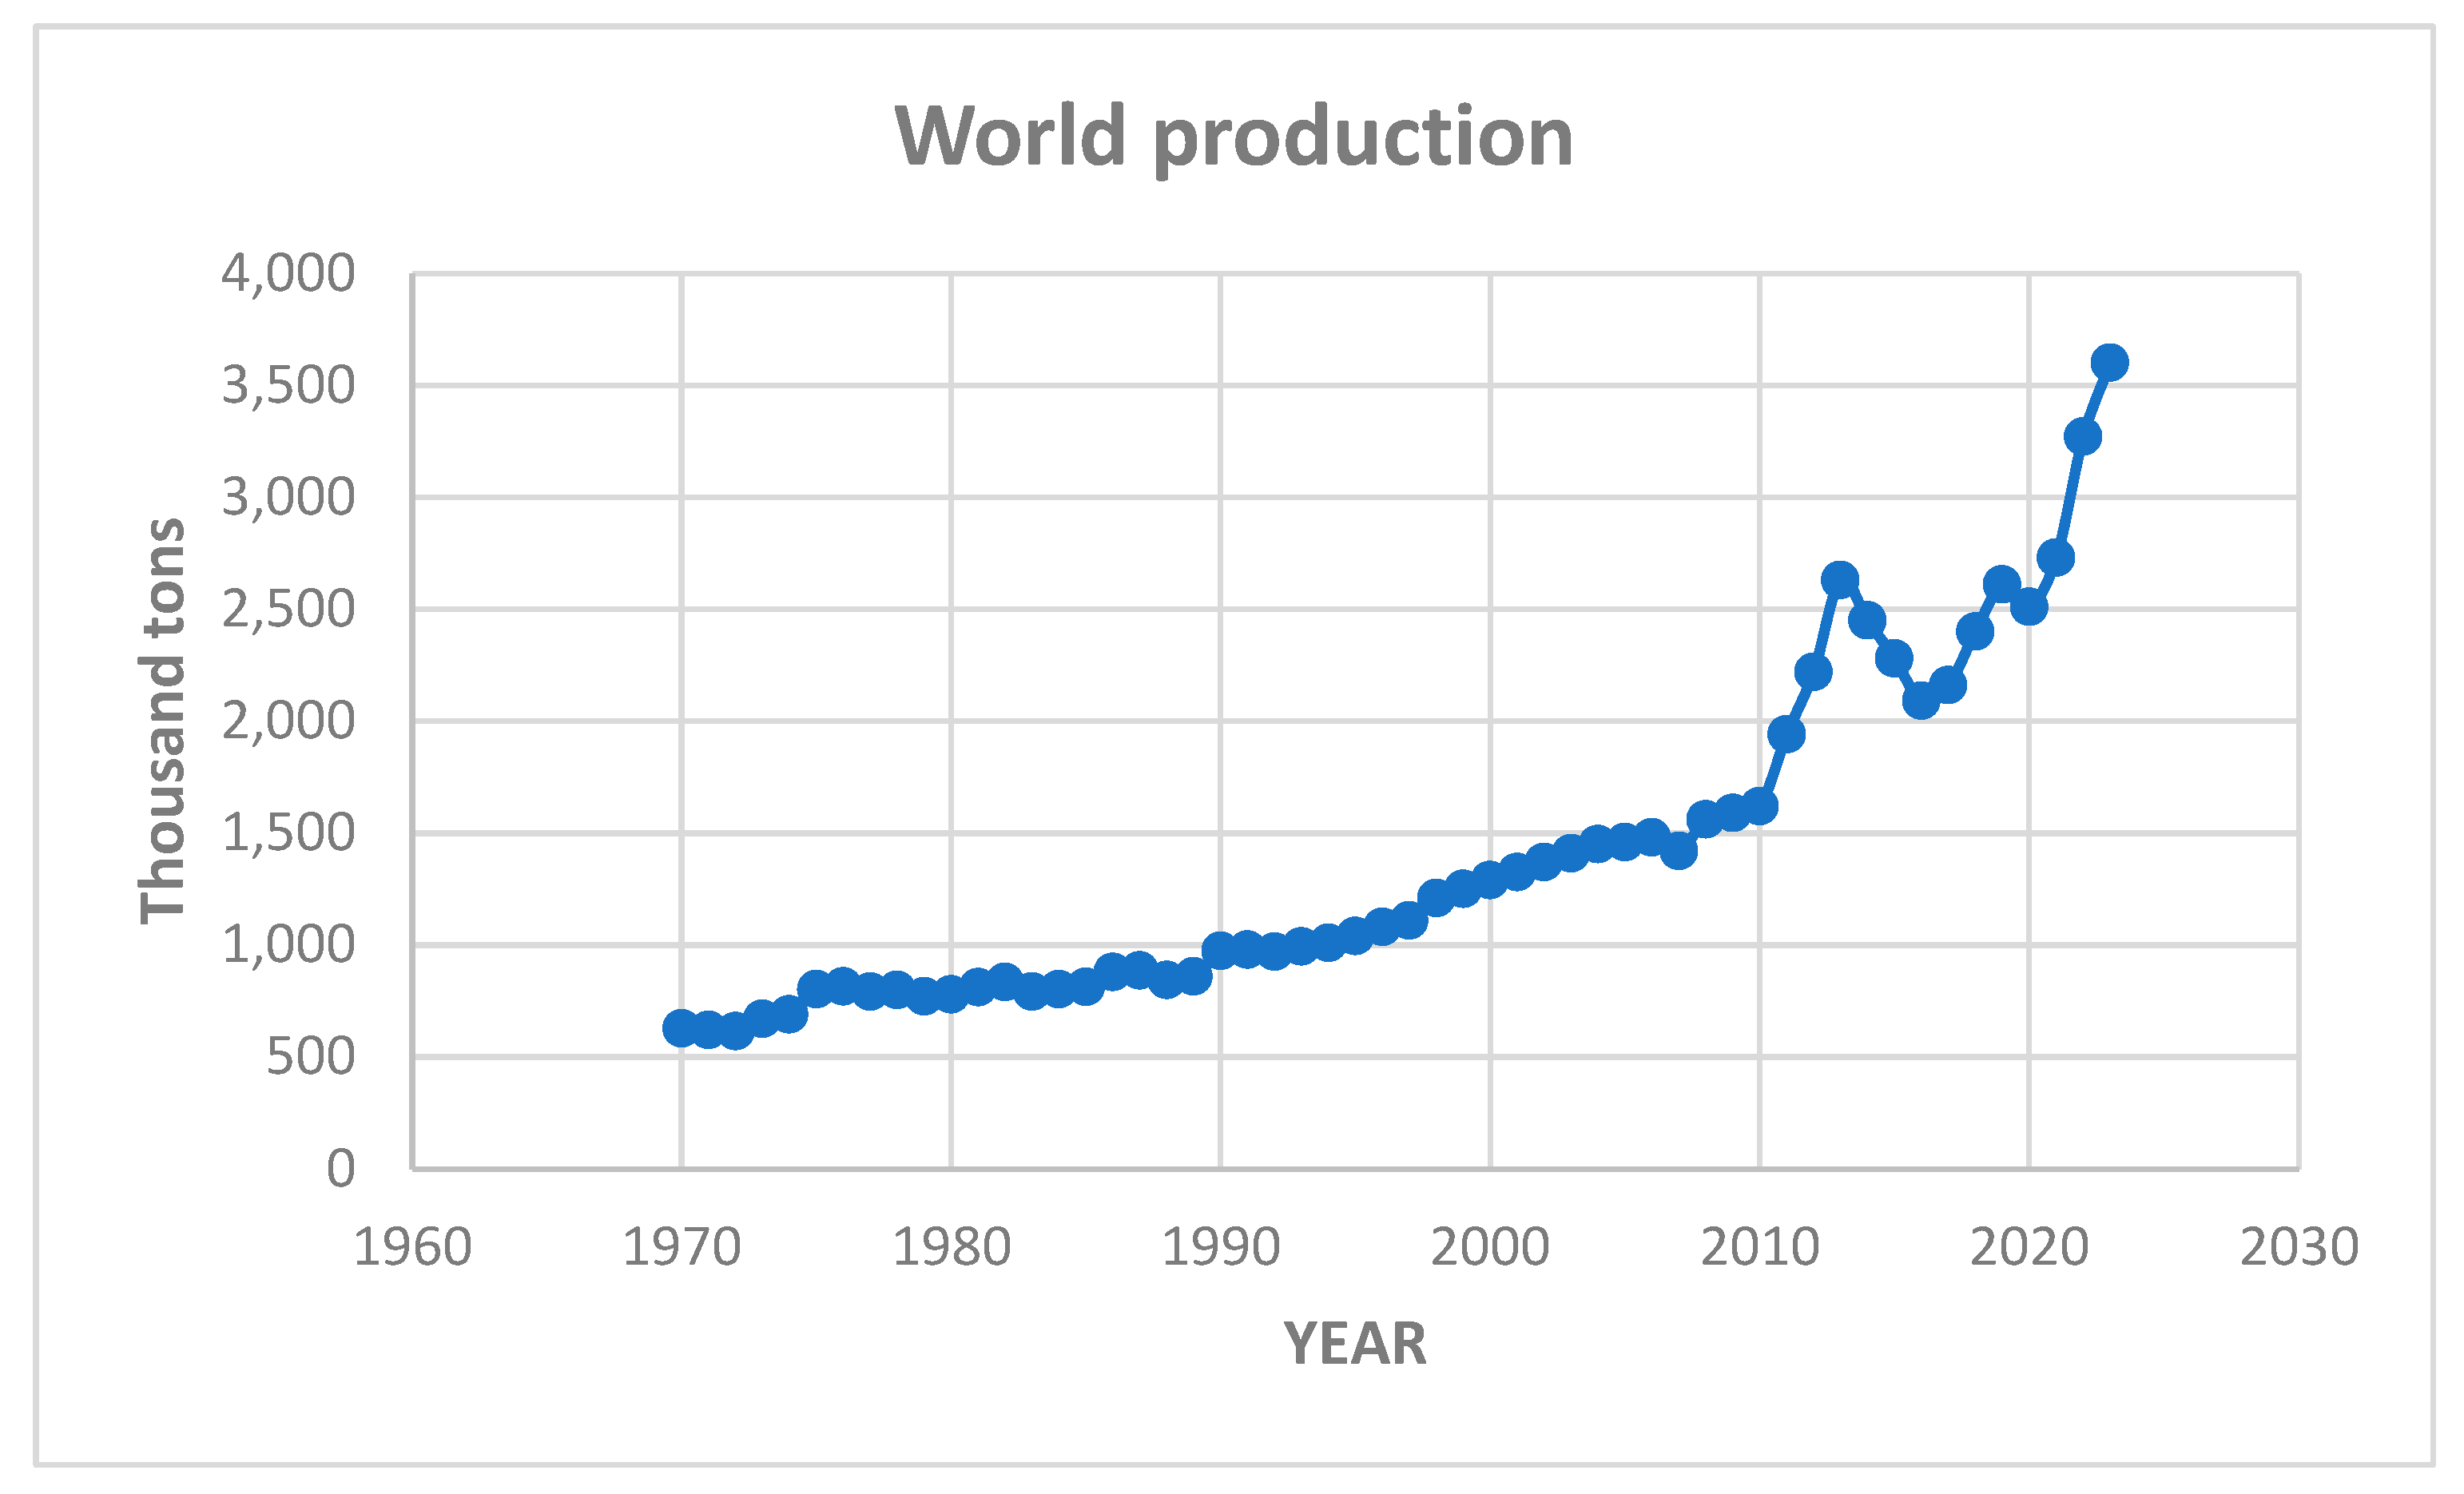
Figure 10.
- Logistic fit of the world nickel production pointing out a ceiling (green line) of about 6,900 thousand tons in 2060.
Figure 10.
- Logistic fit of the world nickel production pointing out a ceiling (green line) of about 6,900 thousand tons in 2060.
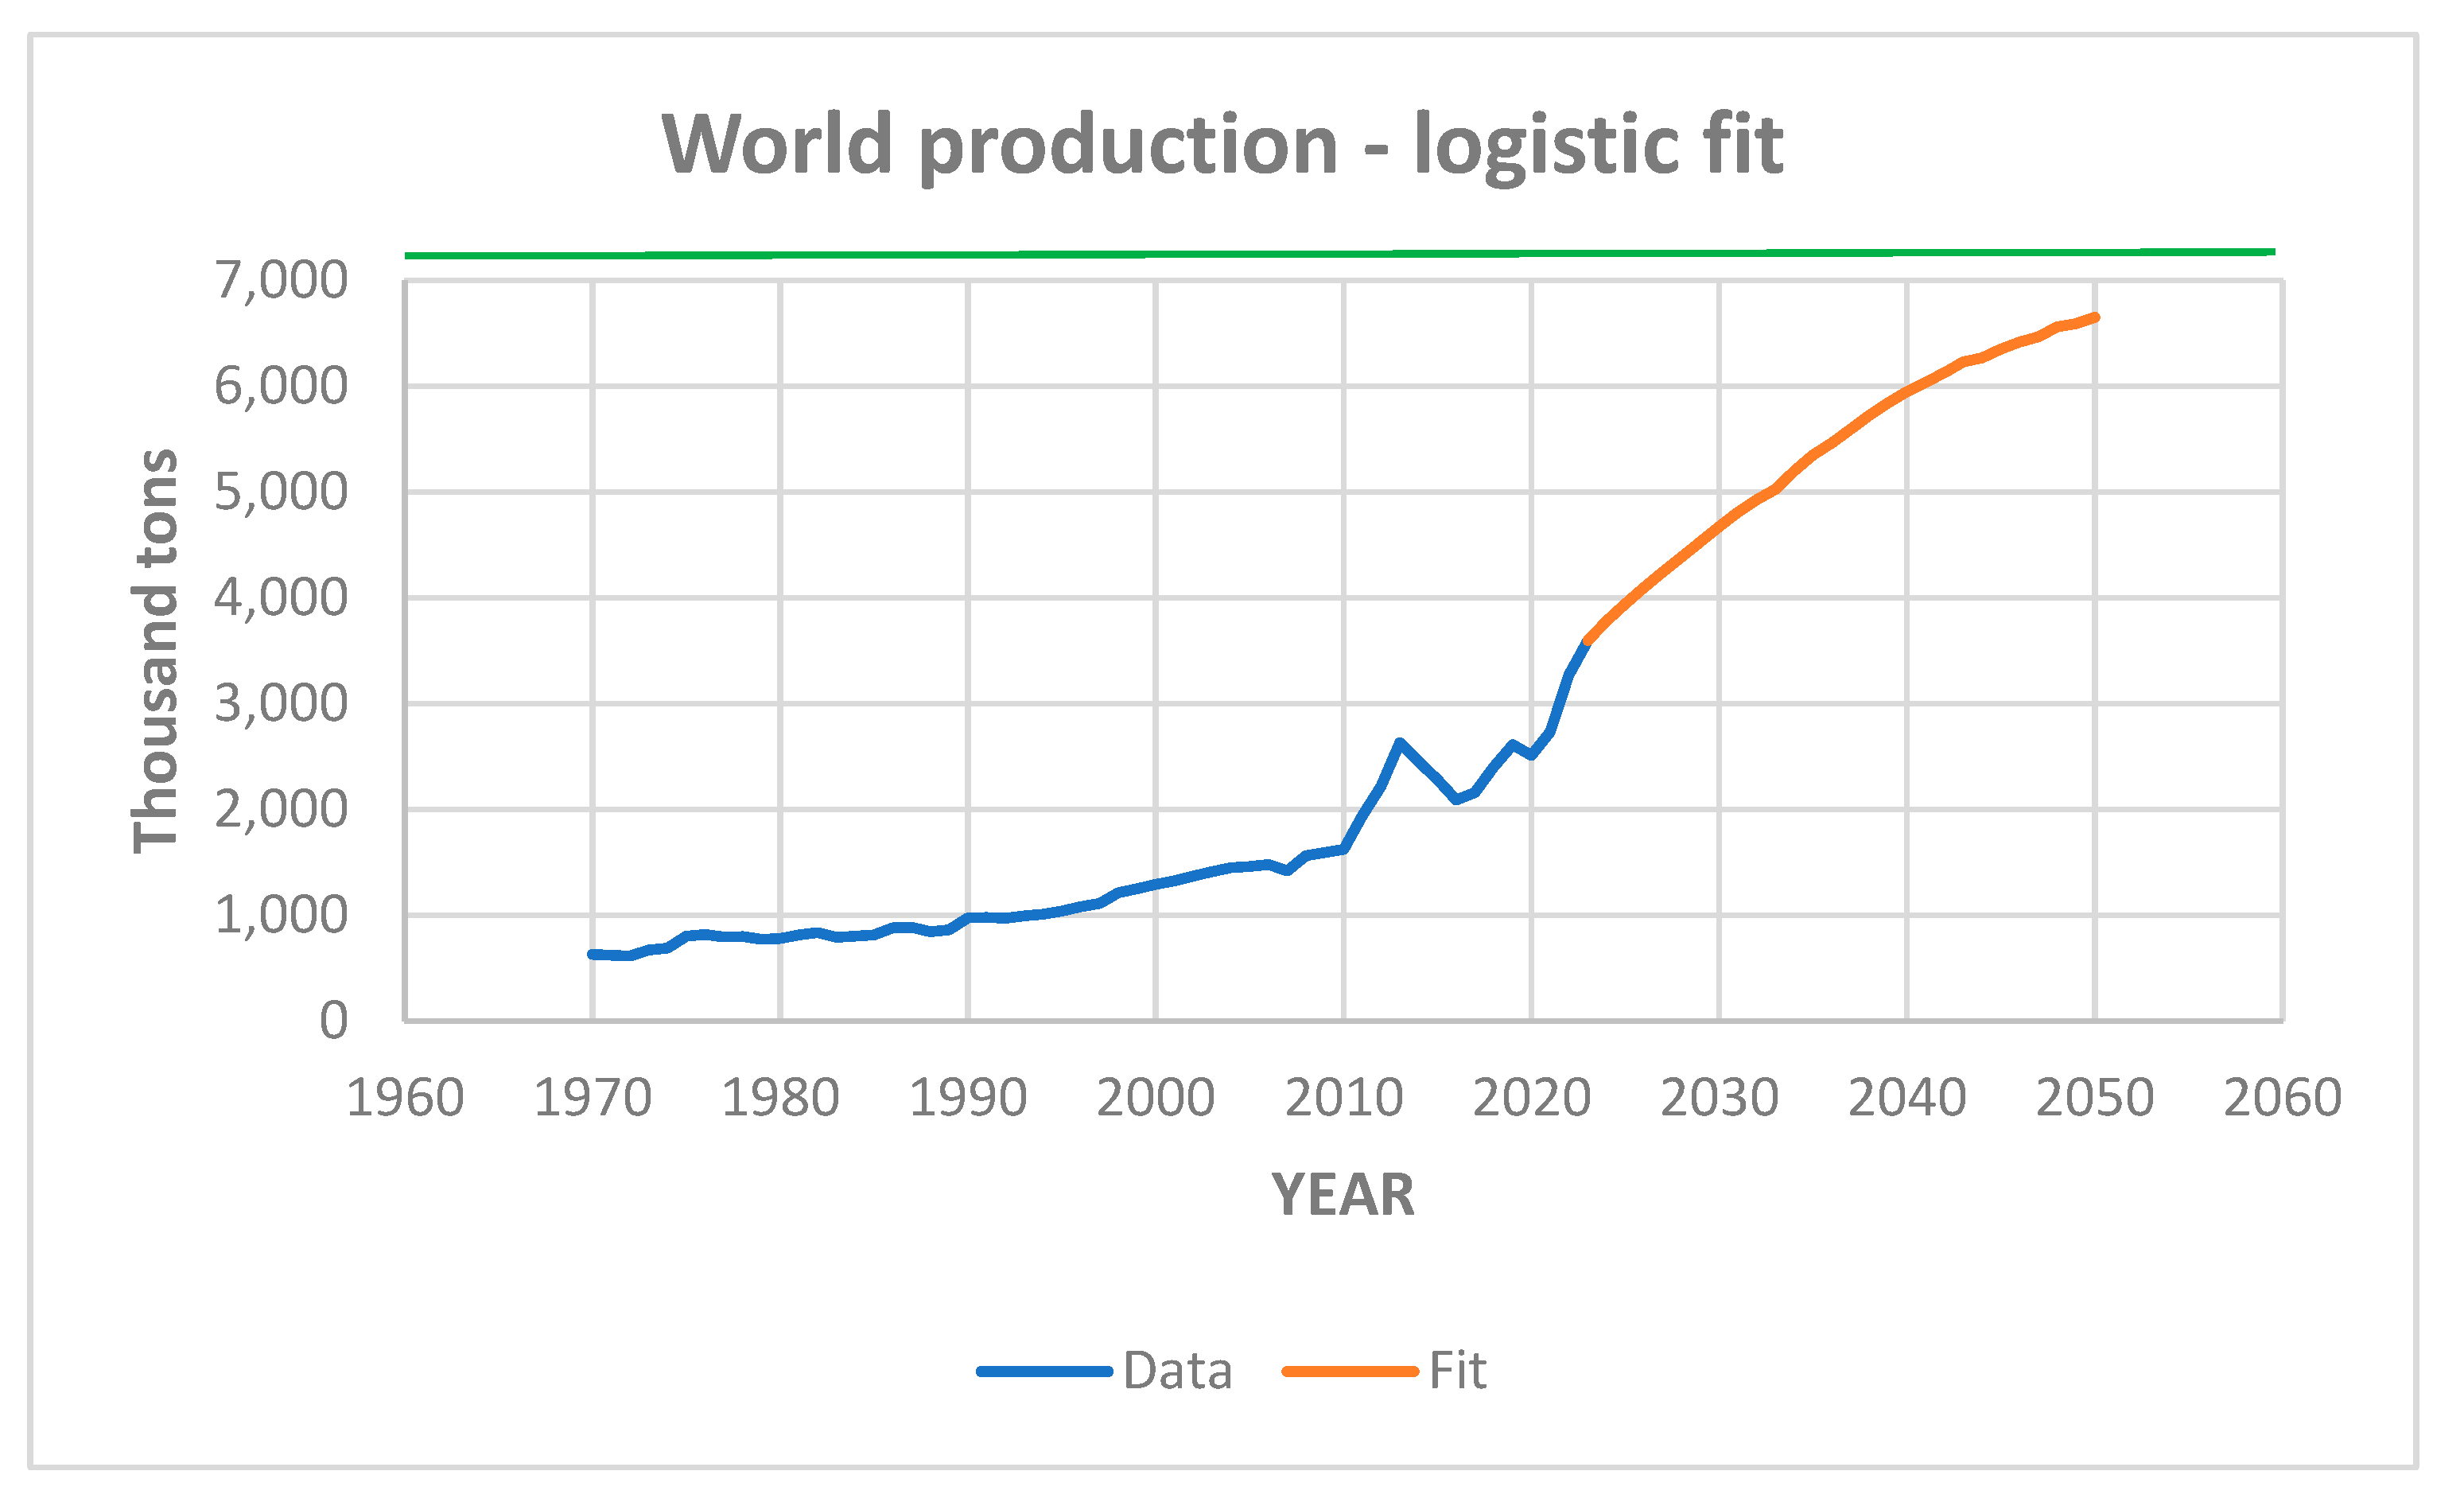
Figure 11.
- Cumulative world production of nickel until 2050 resulting from the application of the integral logistic model. The red line indicates the currently estimated nickel reserves (USGS, 2023).
Figure 11.
- Cumulative world production of nickel until 2050 resulting from the application of the integral logistic model. The red line indicates the currently estimated nickel reserves (USGS, 2023).
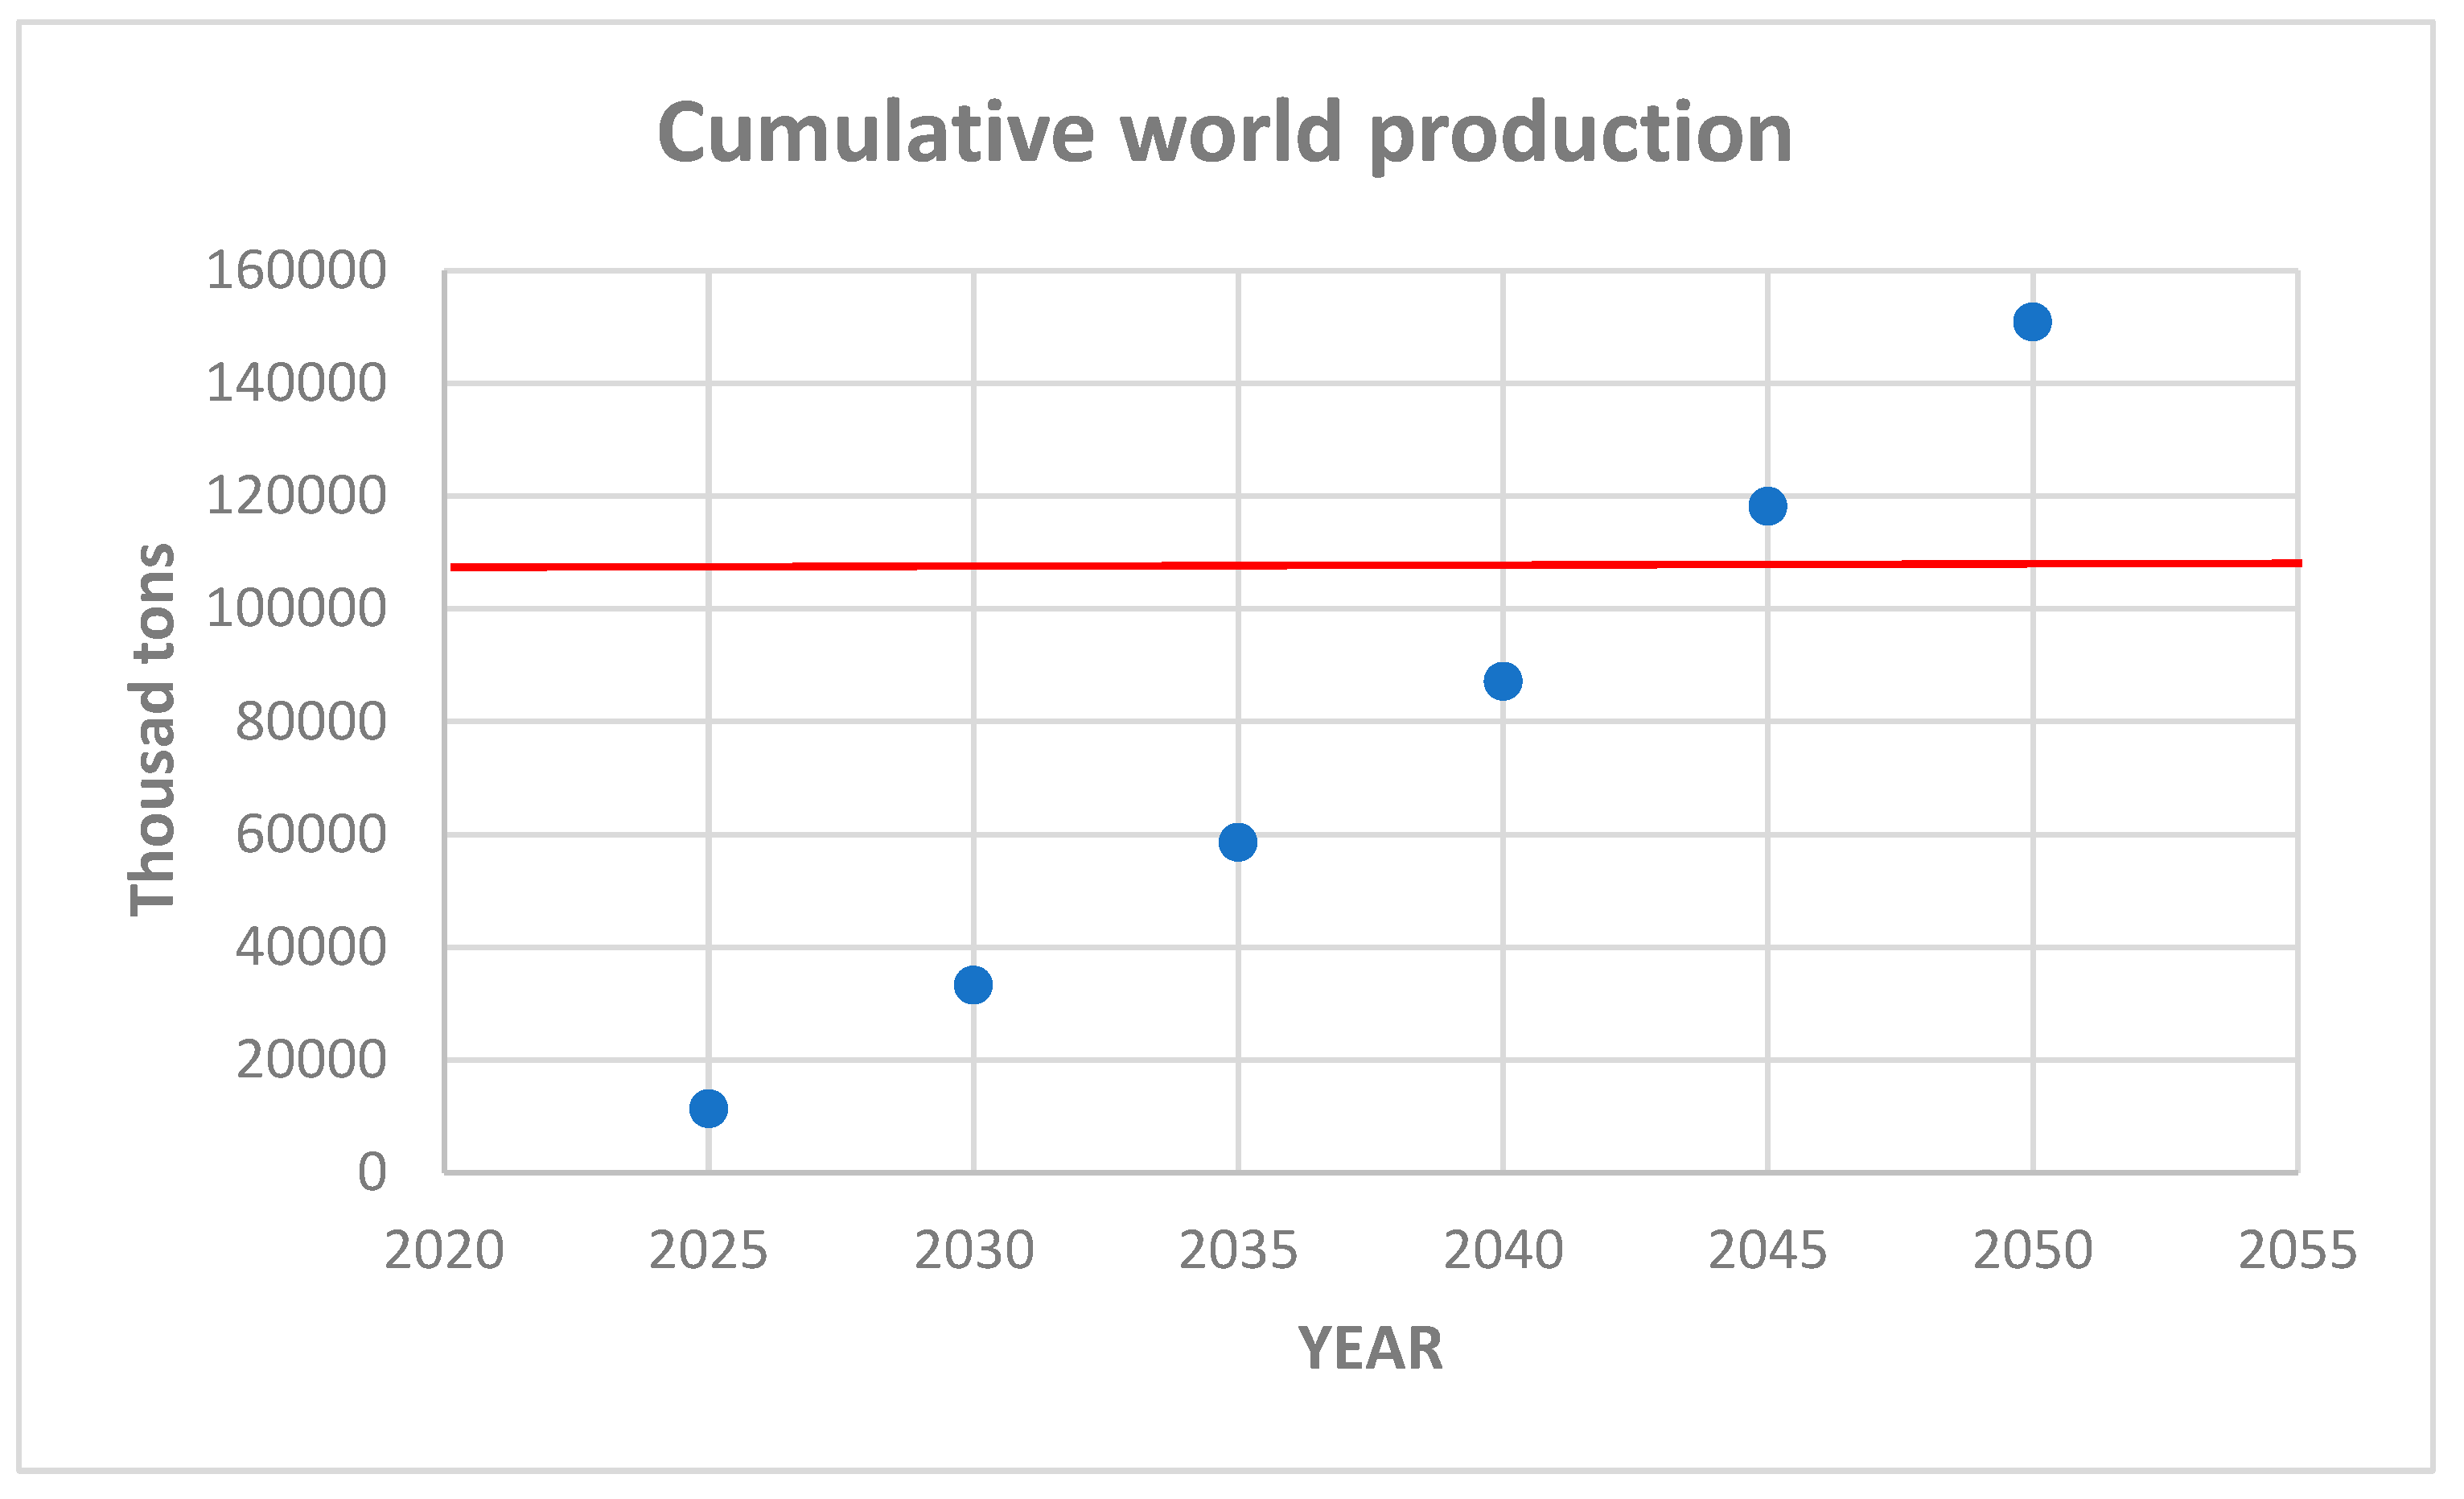
Figure 12.
- Worldwide production of lithium from 1995 onwards. Data from USGS (2024) and Statista (2024).
Figure 12.
- Worldwide production of lithium from 1995 onwards. Data from USGS (2024) and Statista (2024).
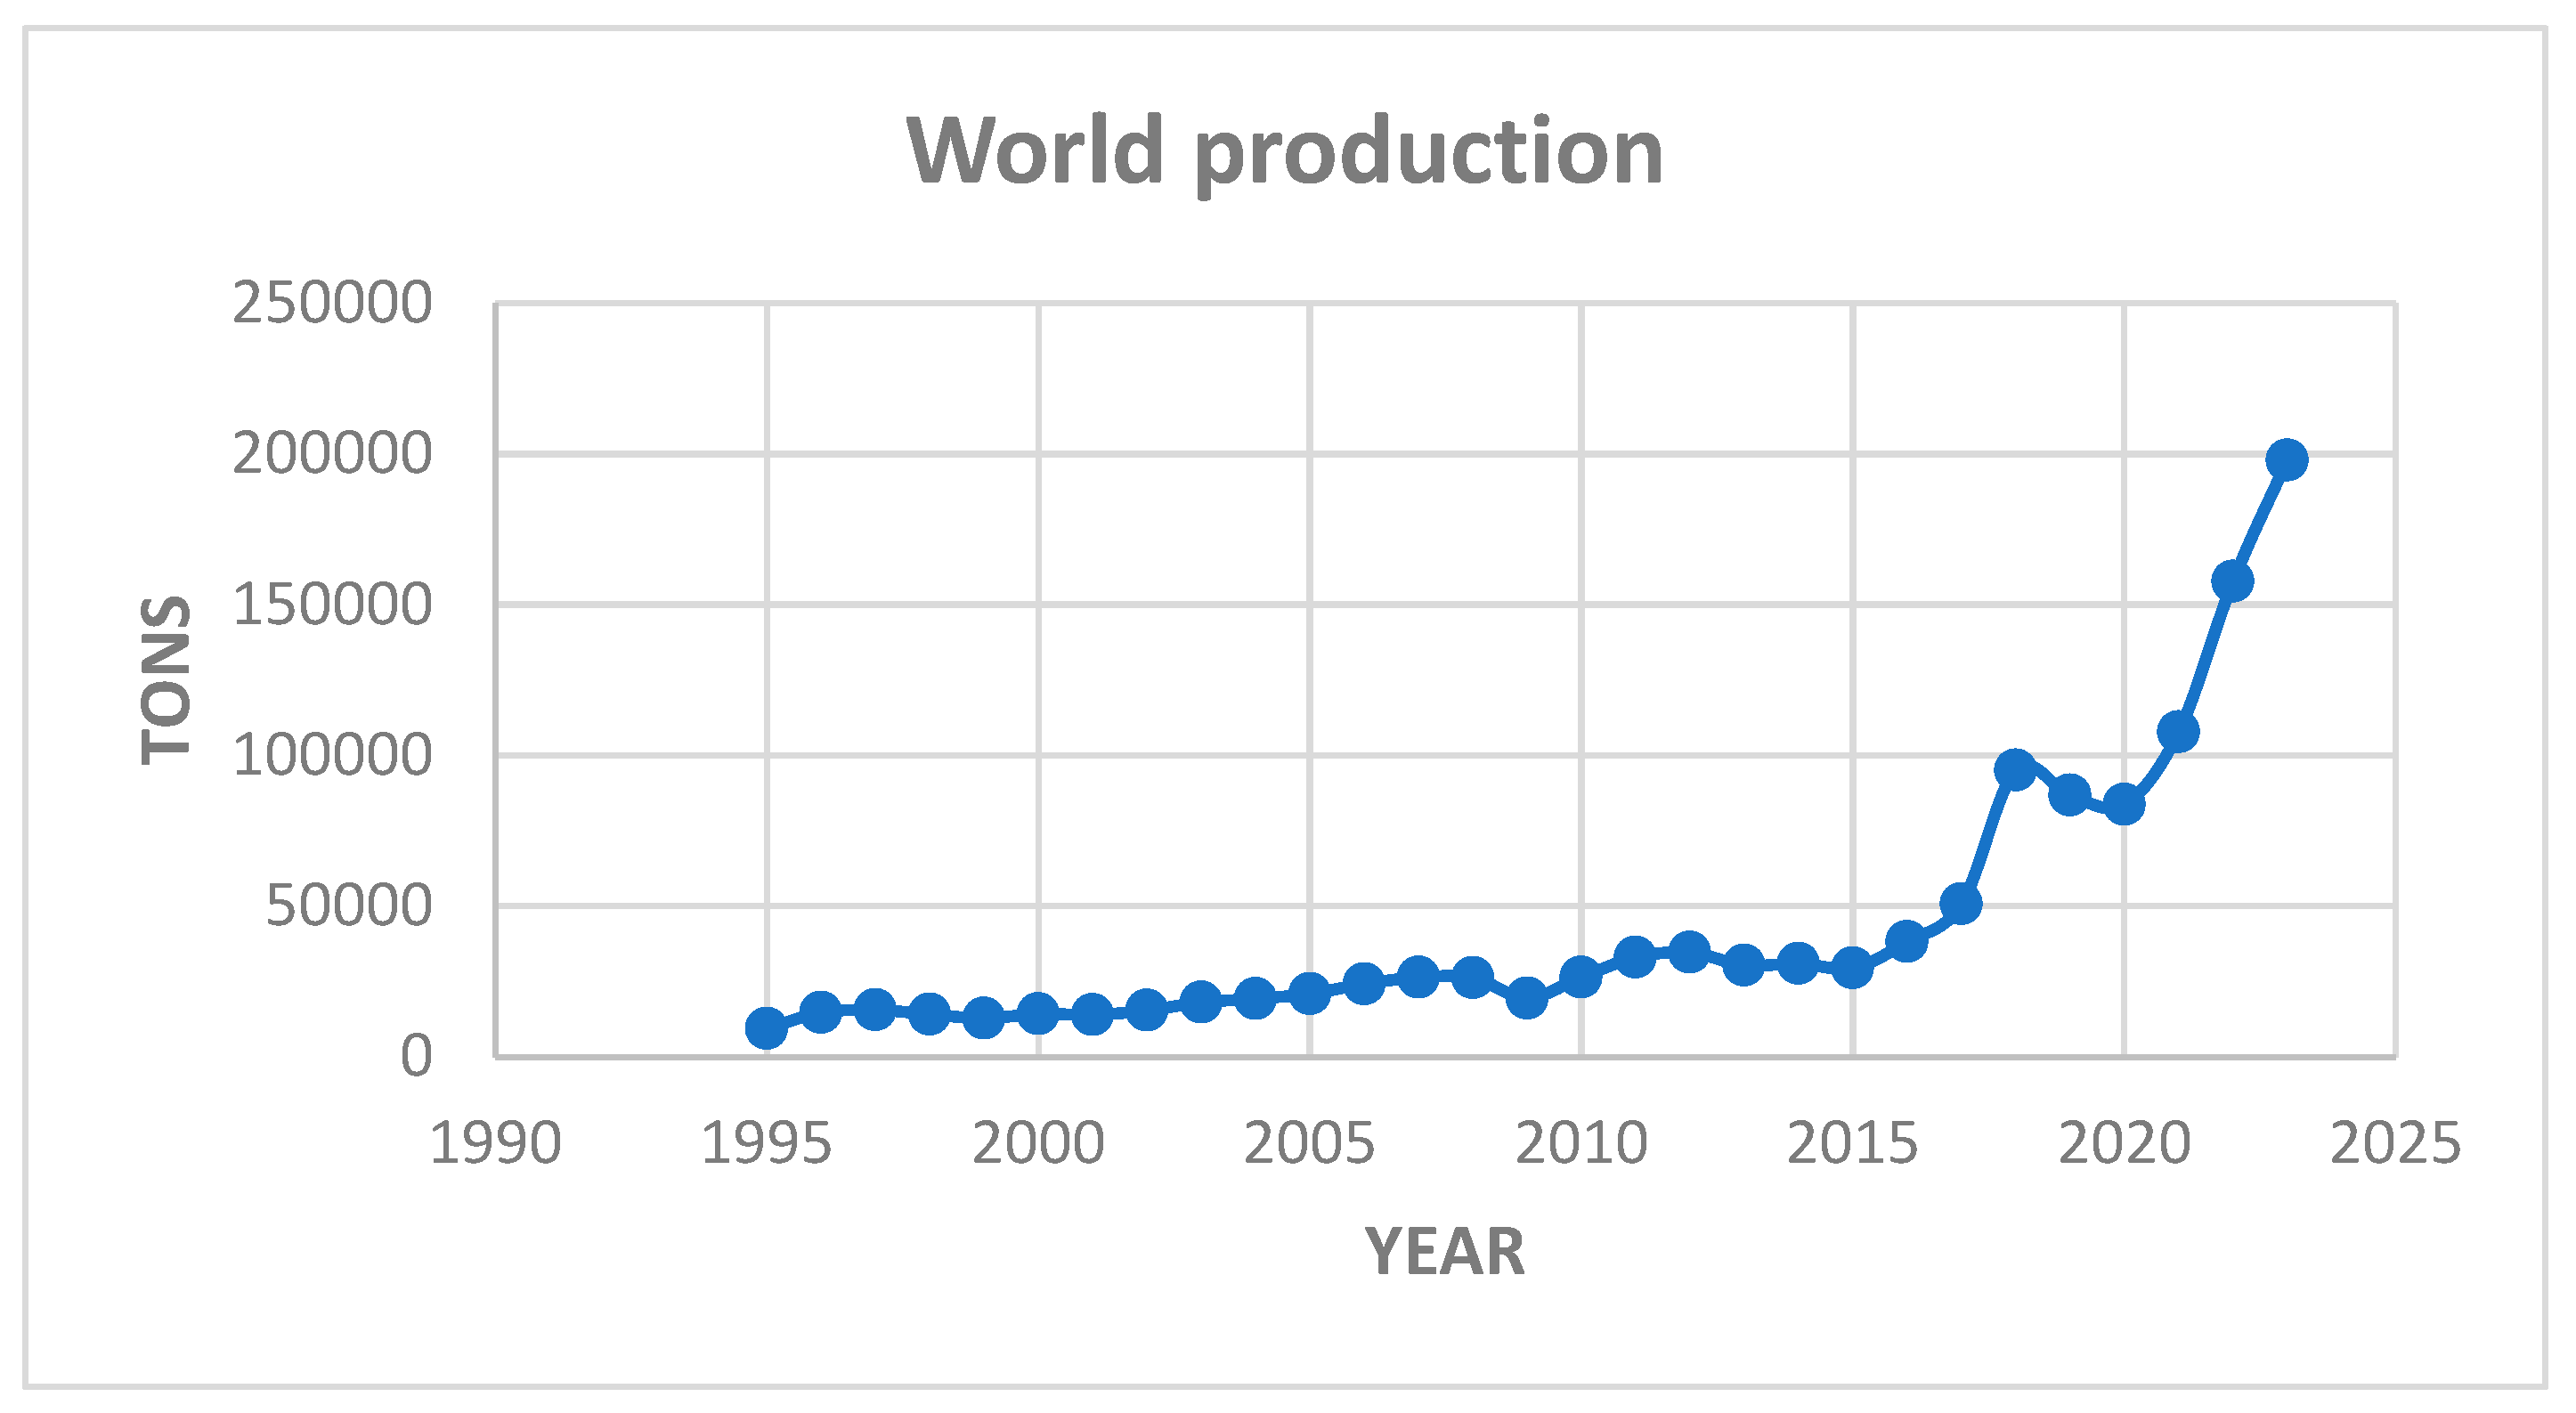
Figure 13.
- Logistic fit of the world lithium production pointing out a ceiling (green line) of about 630,000 tons in 2060.
Figure 13.
- Logistic fit of the world lithium production pointing out a ceiling (green line) of about 630,000 tons in 2060.
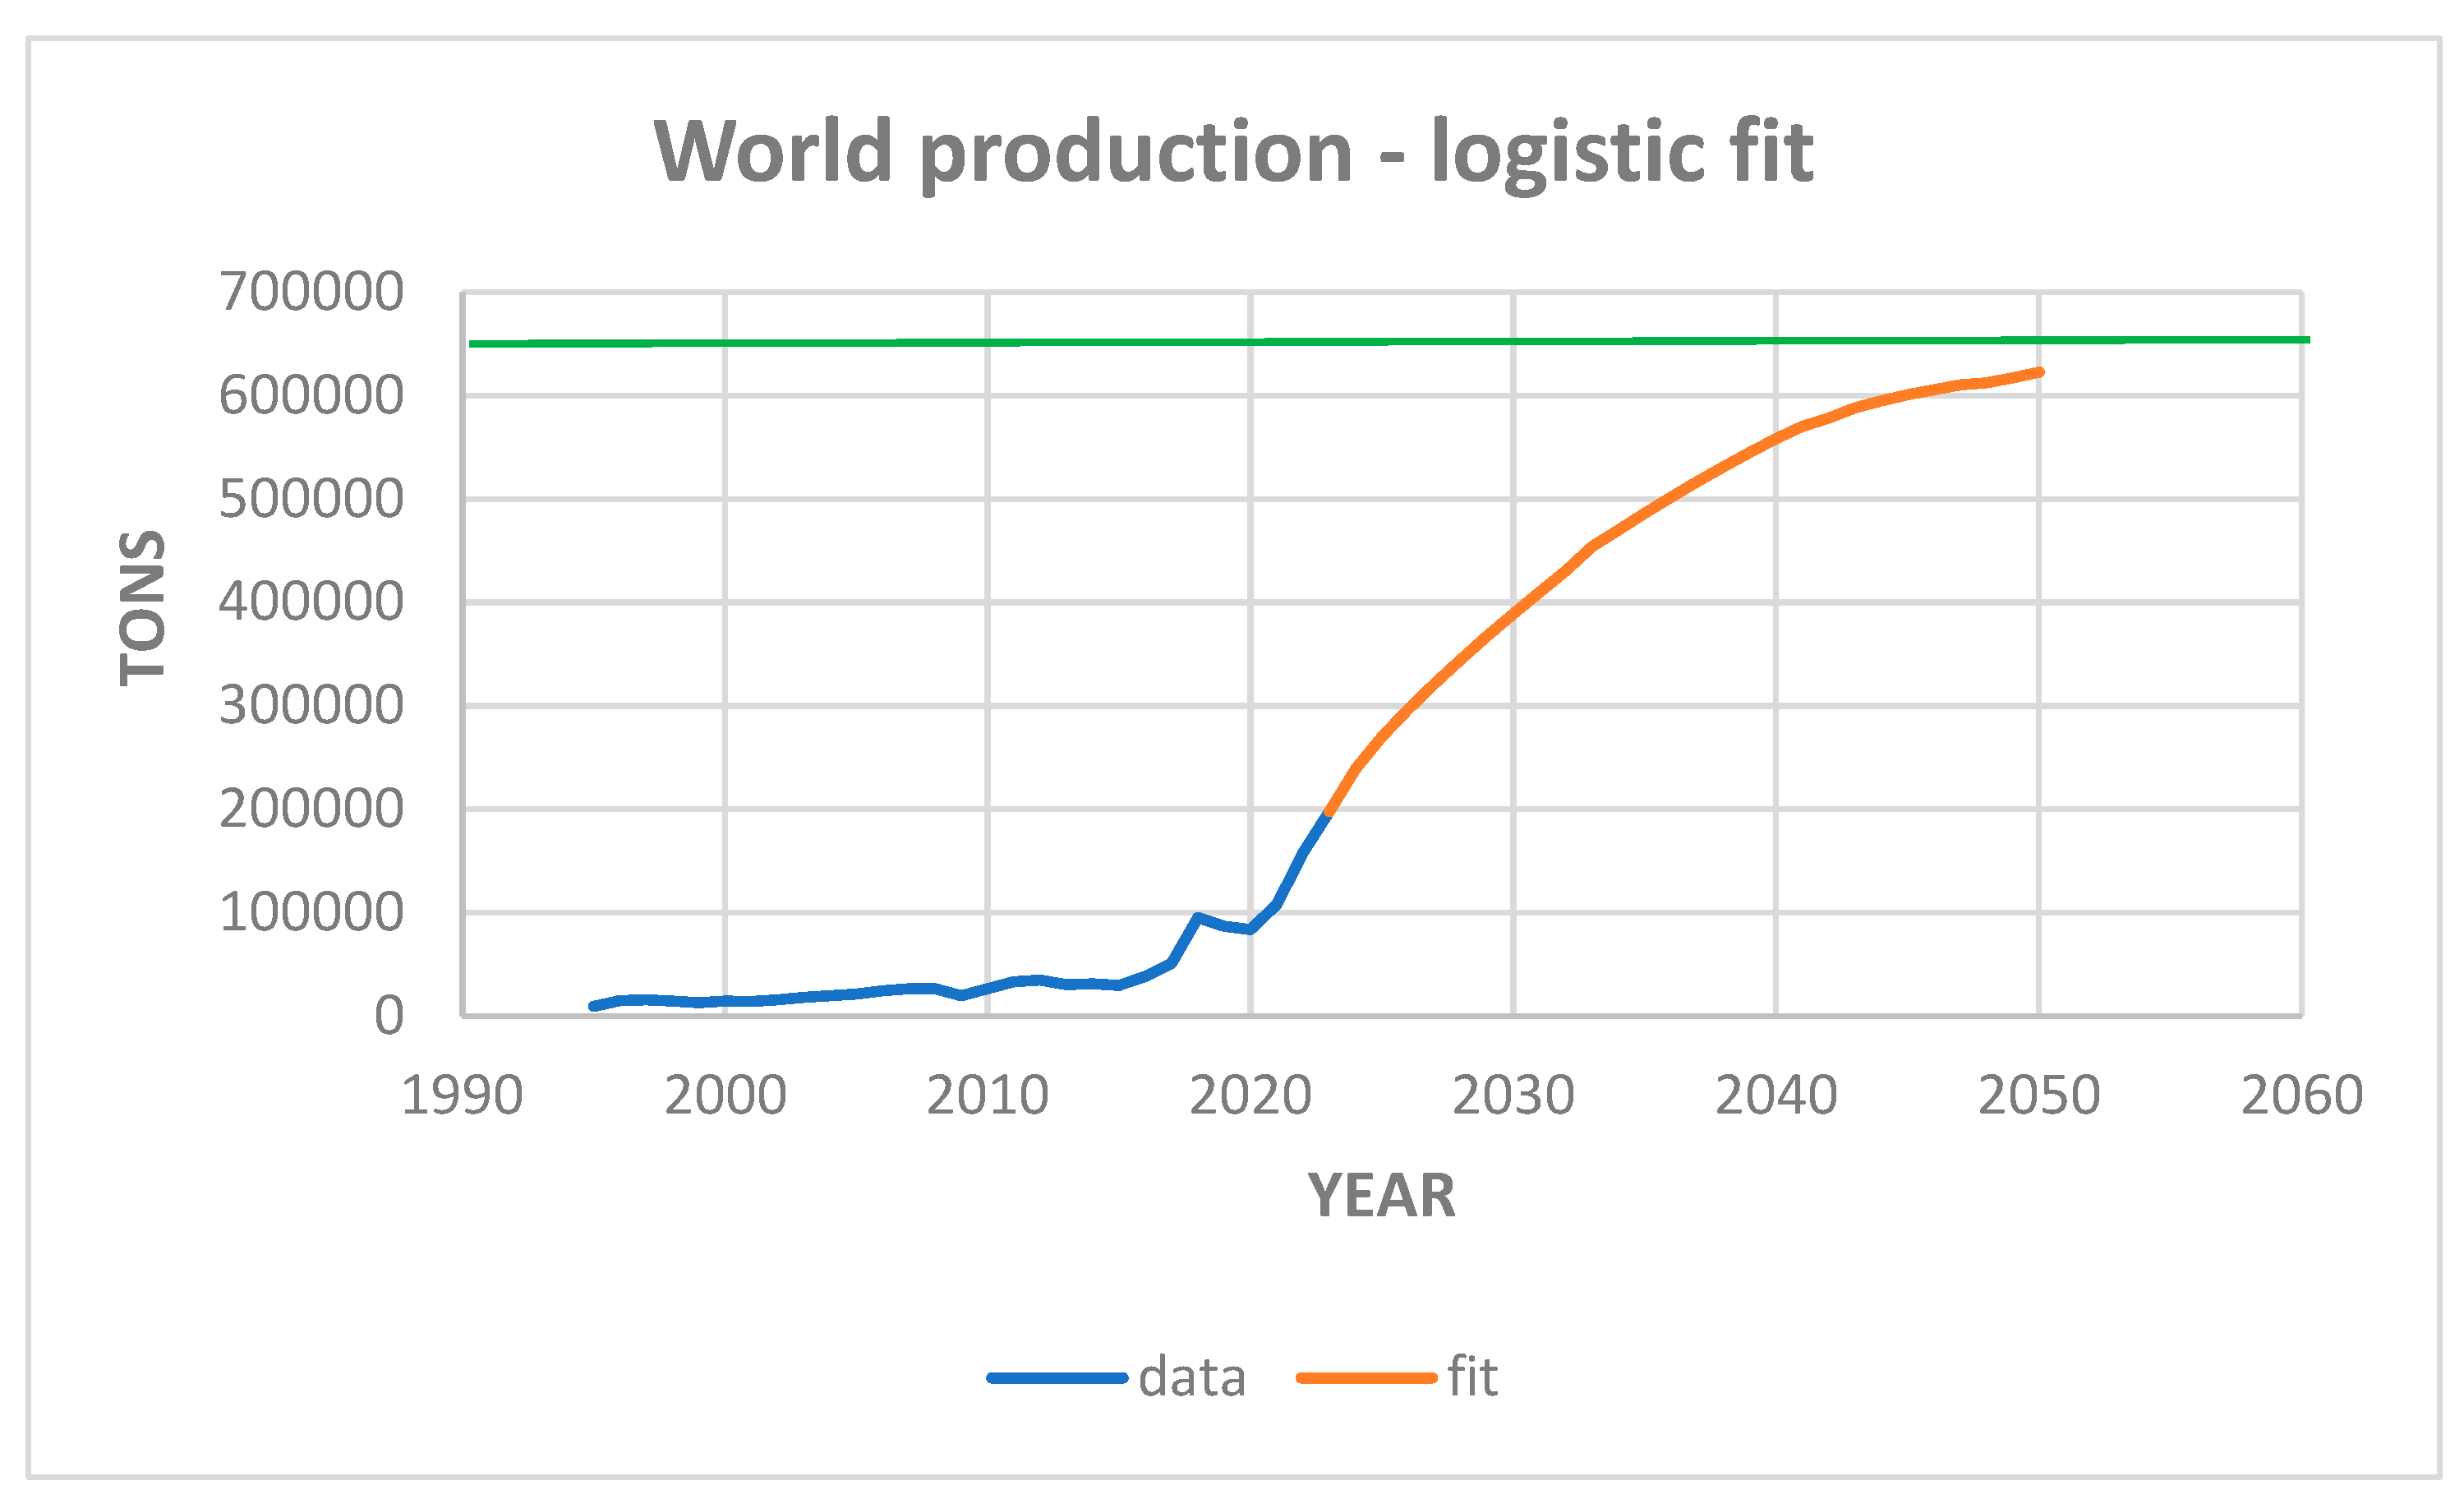
Figure 14.
- Cumulative world production of lithium until 2050 resulting from the application of the integral logistic model. The dotted red line indicates the currently estimated very conservative lithium reserves (USGS, 2023).
Figure 14.
- Cumulative world production of lithium until 2050 resulting from the application of the integral logistic model. The dotted red line indicates the currently estimated very conservative lithium reserves (USGS, 2023).
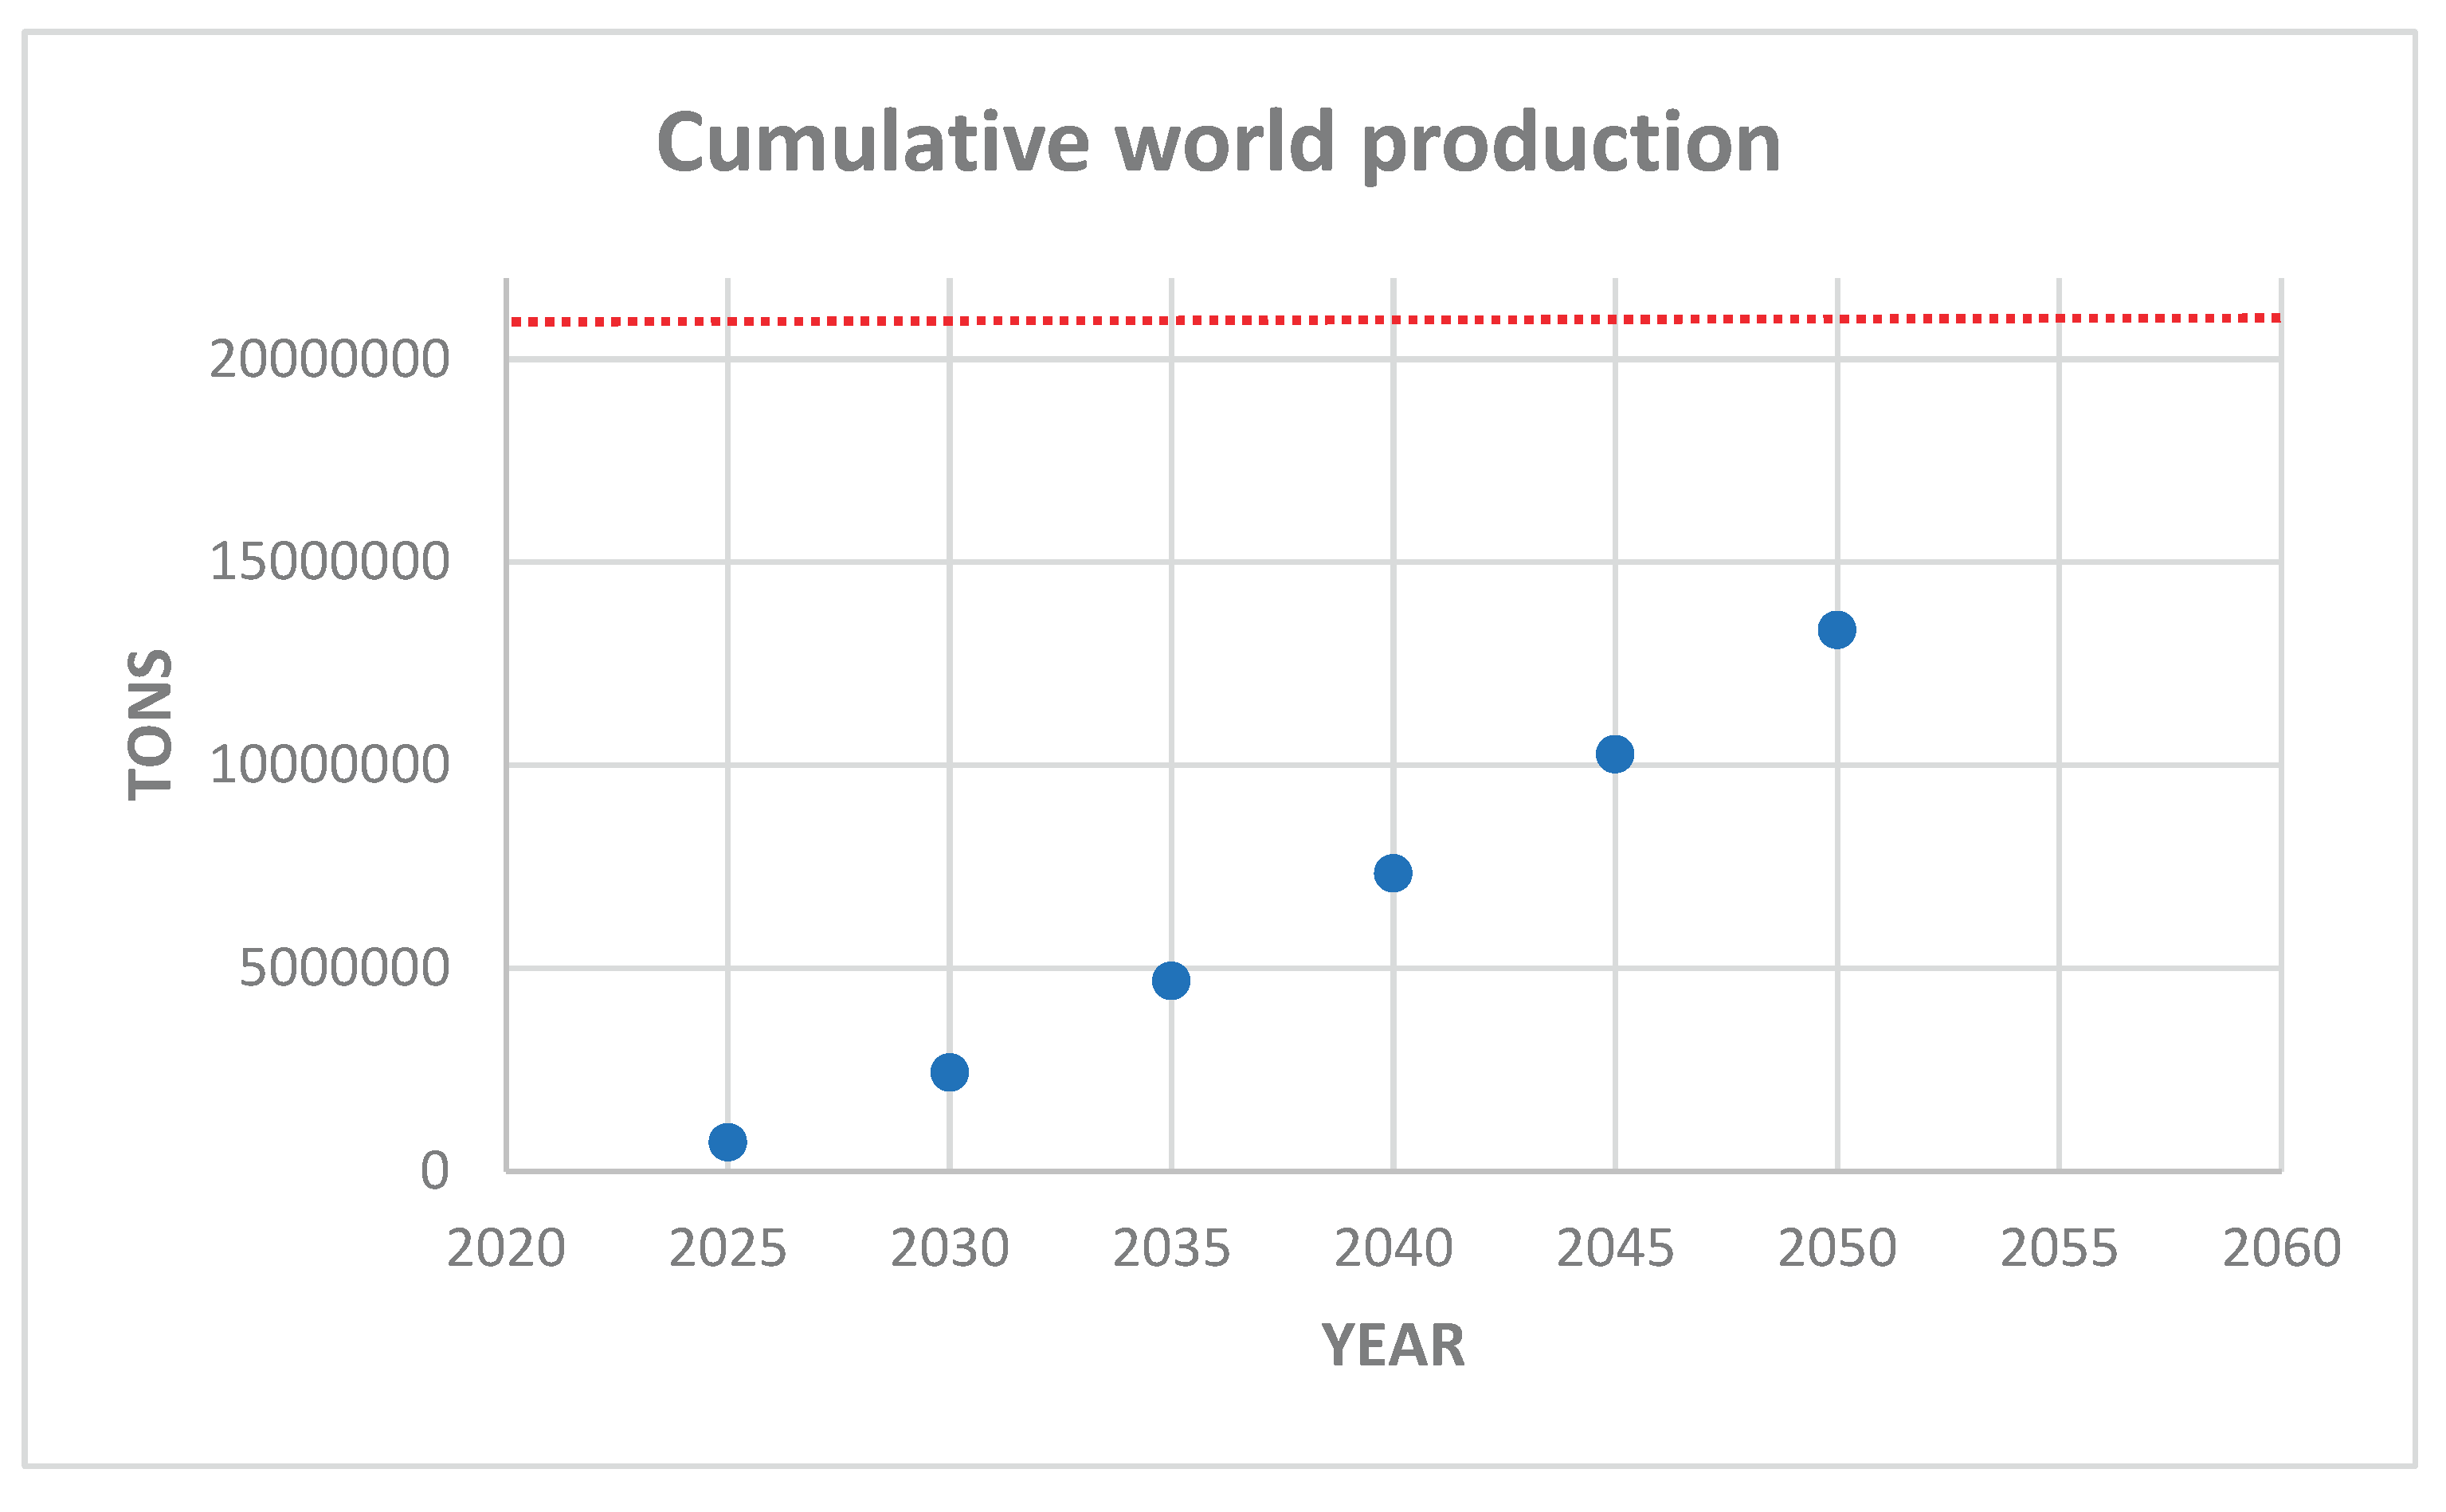
Figure 15.
- Set of Rare Earth elements (lanthanides, blue highlighted), plus Scandium and Yttrium, green highlighted, completing then a family of 17 elements (E-Tech resources, 2024).
Figure 15.
- Set of Rare Earth elements (lanthanides, blue highlighted), plus Scandium and Yttrium, green highlighted, completing then a family of 17 elements (E-Tech resources, 2024).
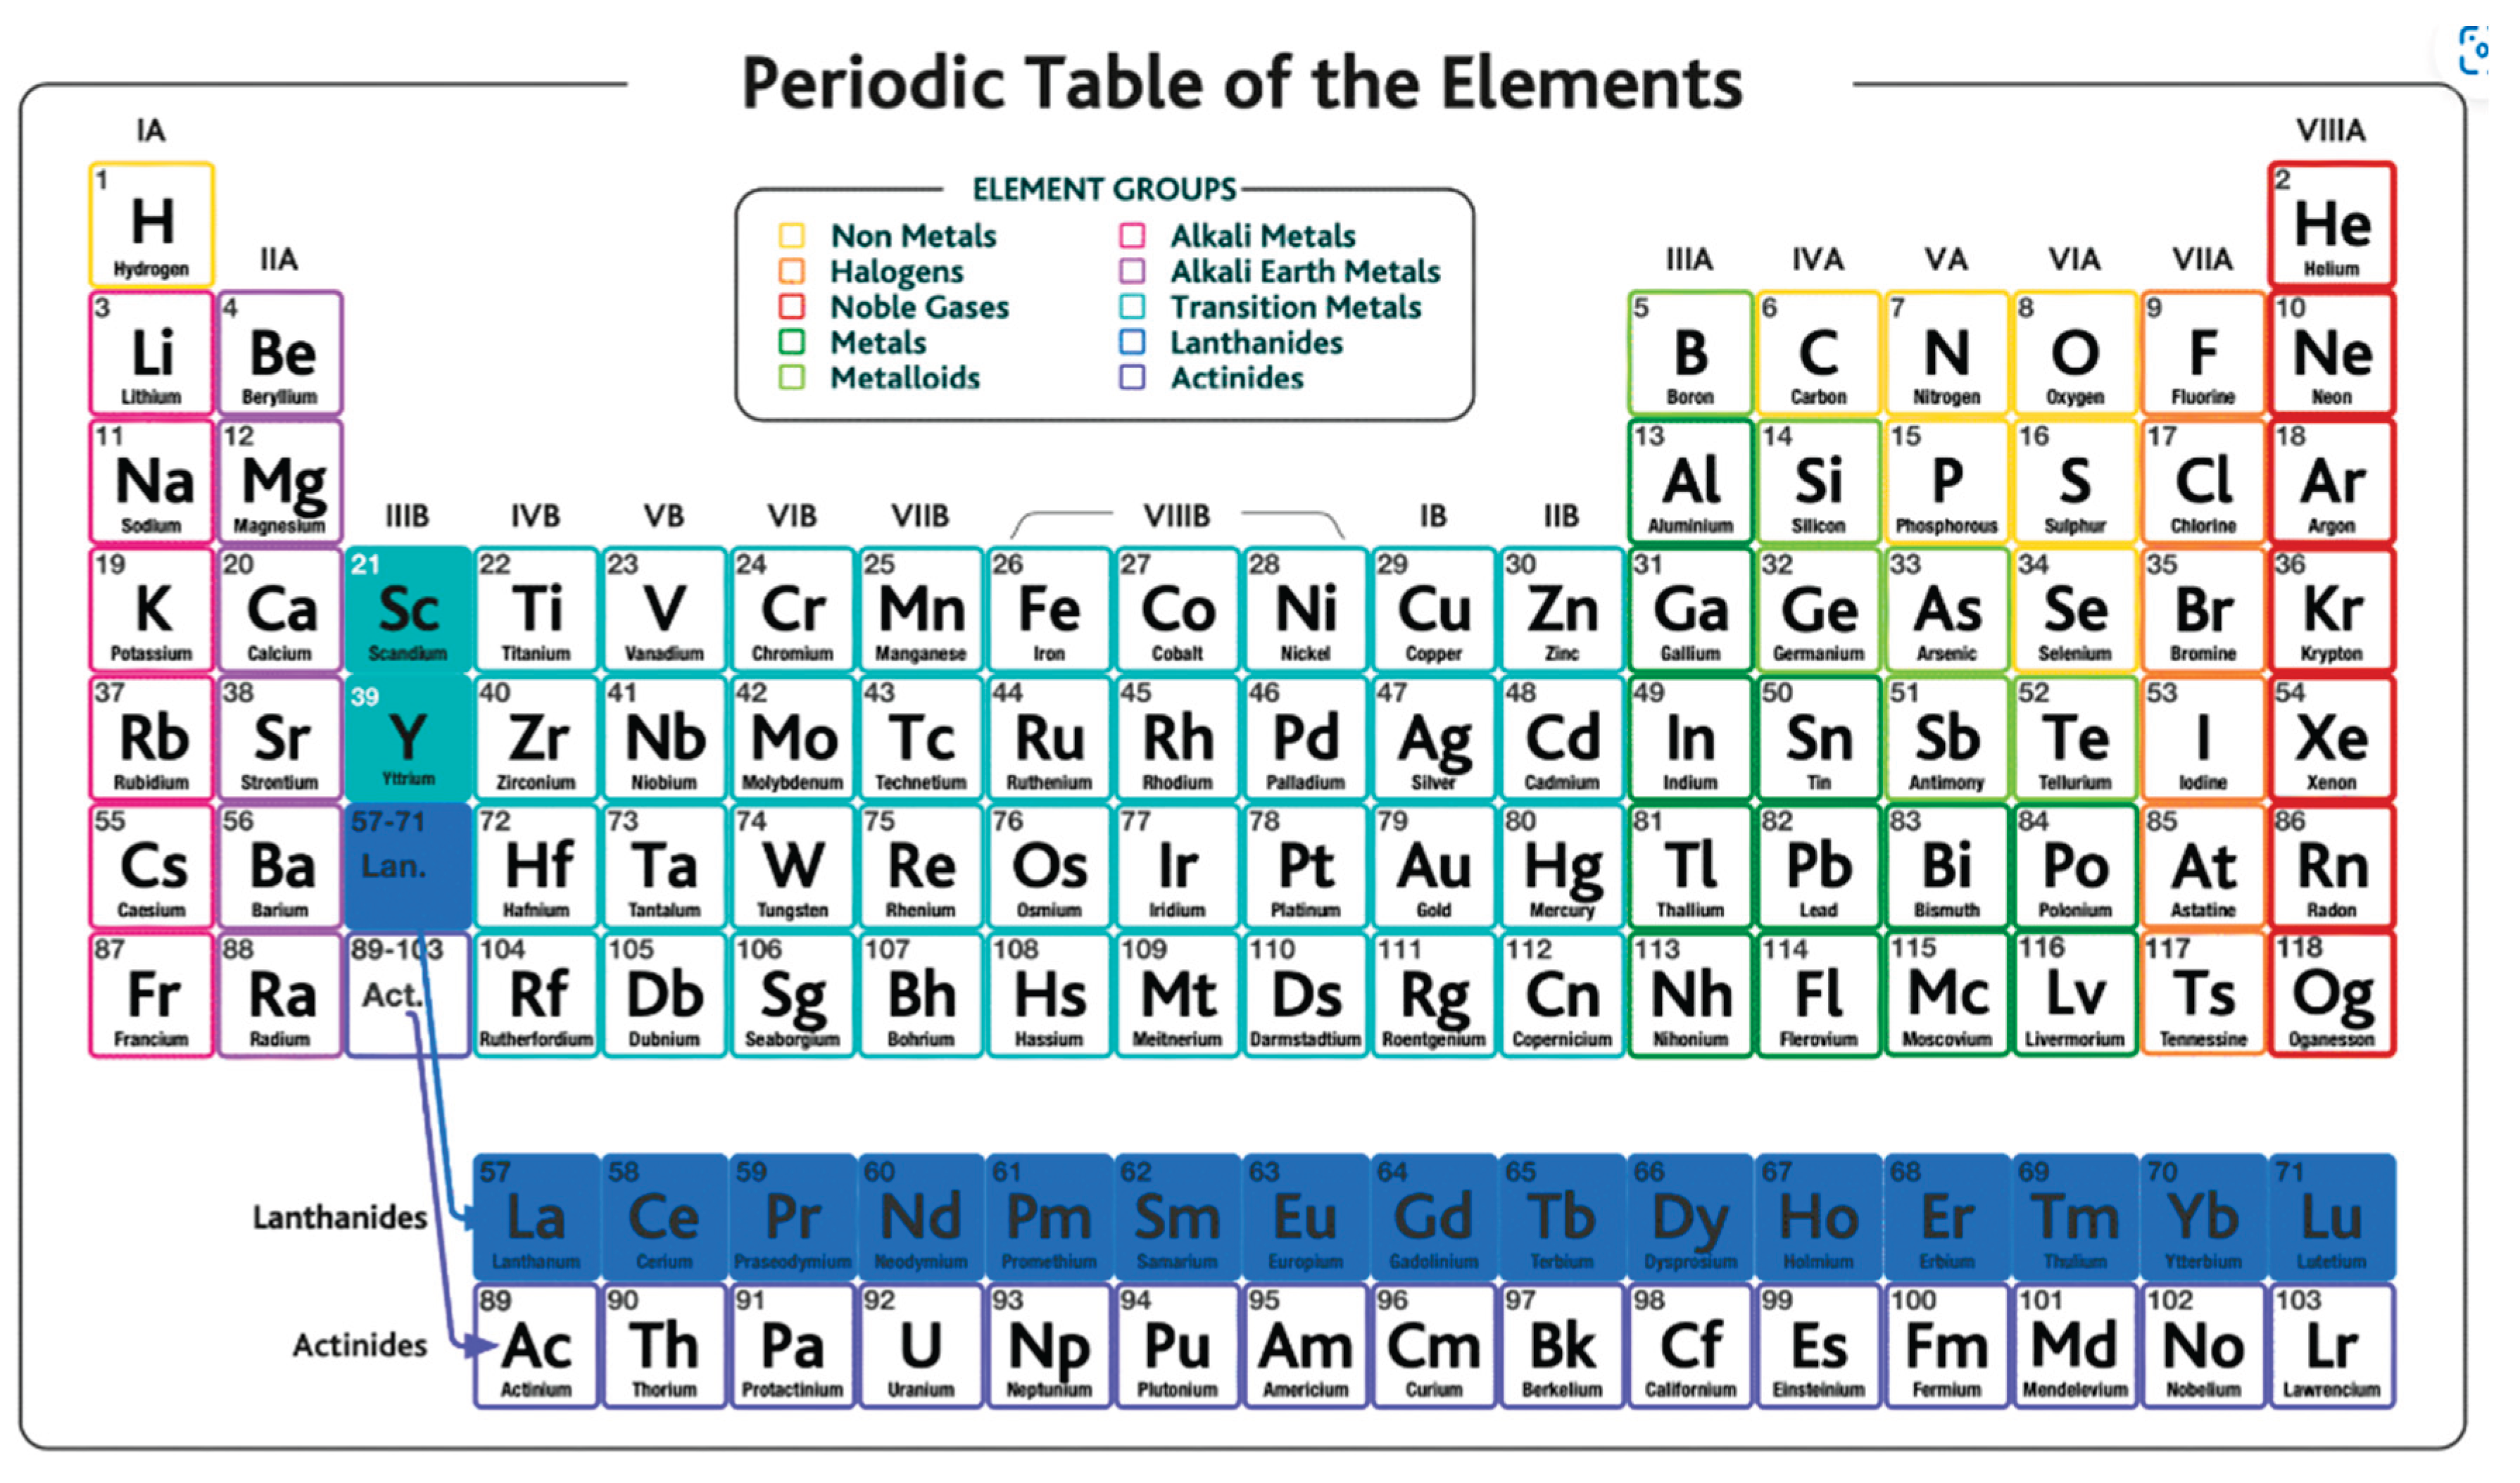
Figure 16.
- Worldwide production of rare-earth from 1970 until 2023. Data from USGS (2024) and Statista (2024).
Figure 16.
- Worldwide production of rare-earth from 1970 until 2023. Data from USGS (2024) and Statista (2024).
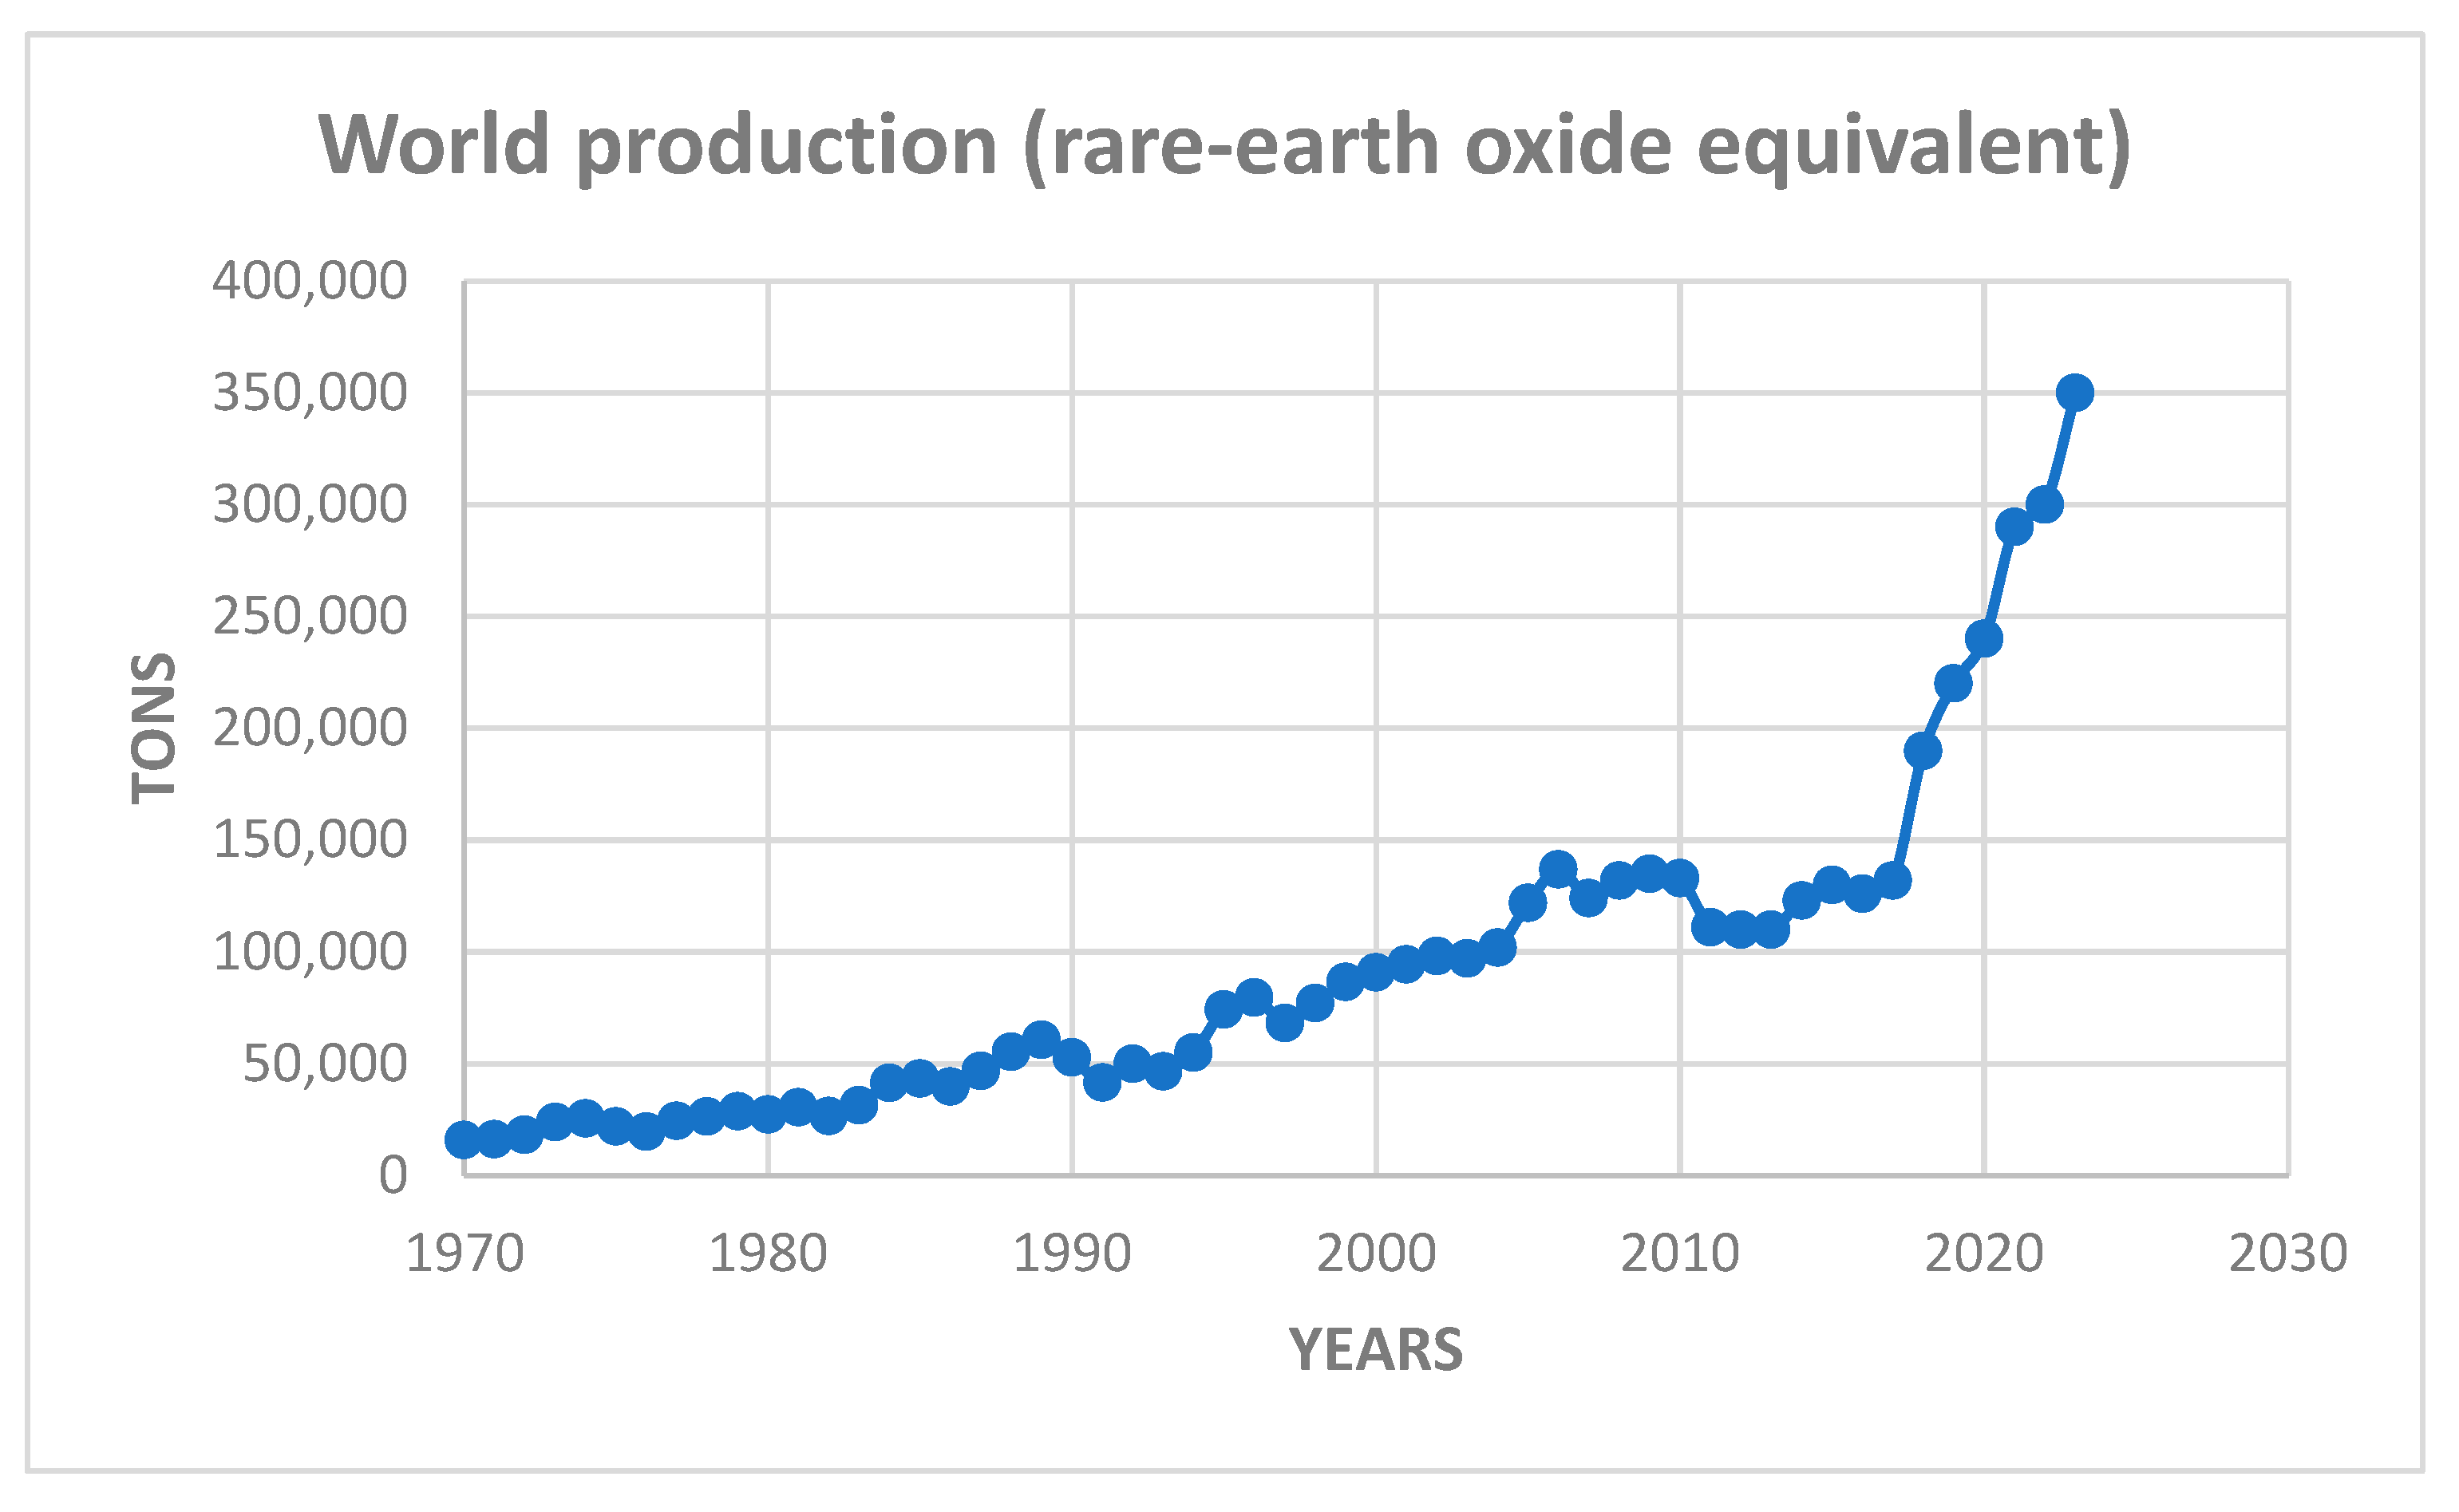
Figure 17.
– Breakdown of the market share in 2020 for the eight most produced rare earth metals (Techcet 2020).
Figure 17.
– Breakdown of the market share in 2020 for the eight most produced rare earth metals (Techcet 2020).
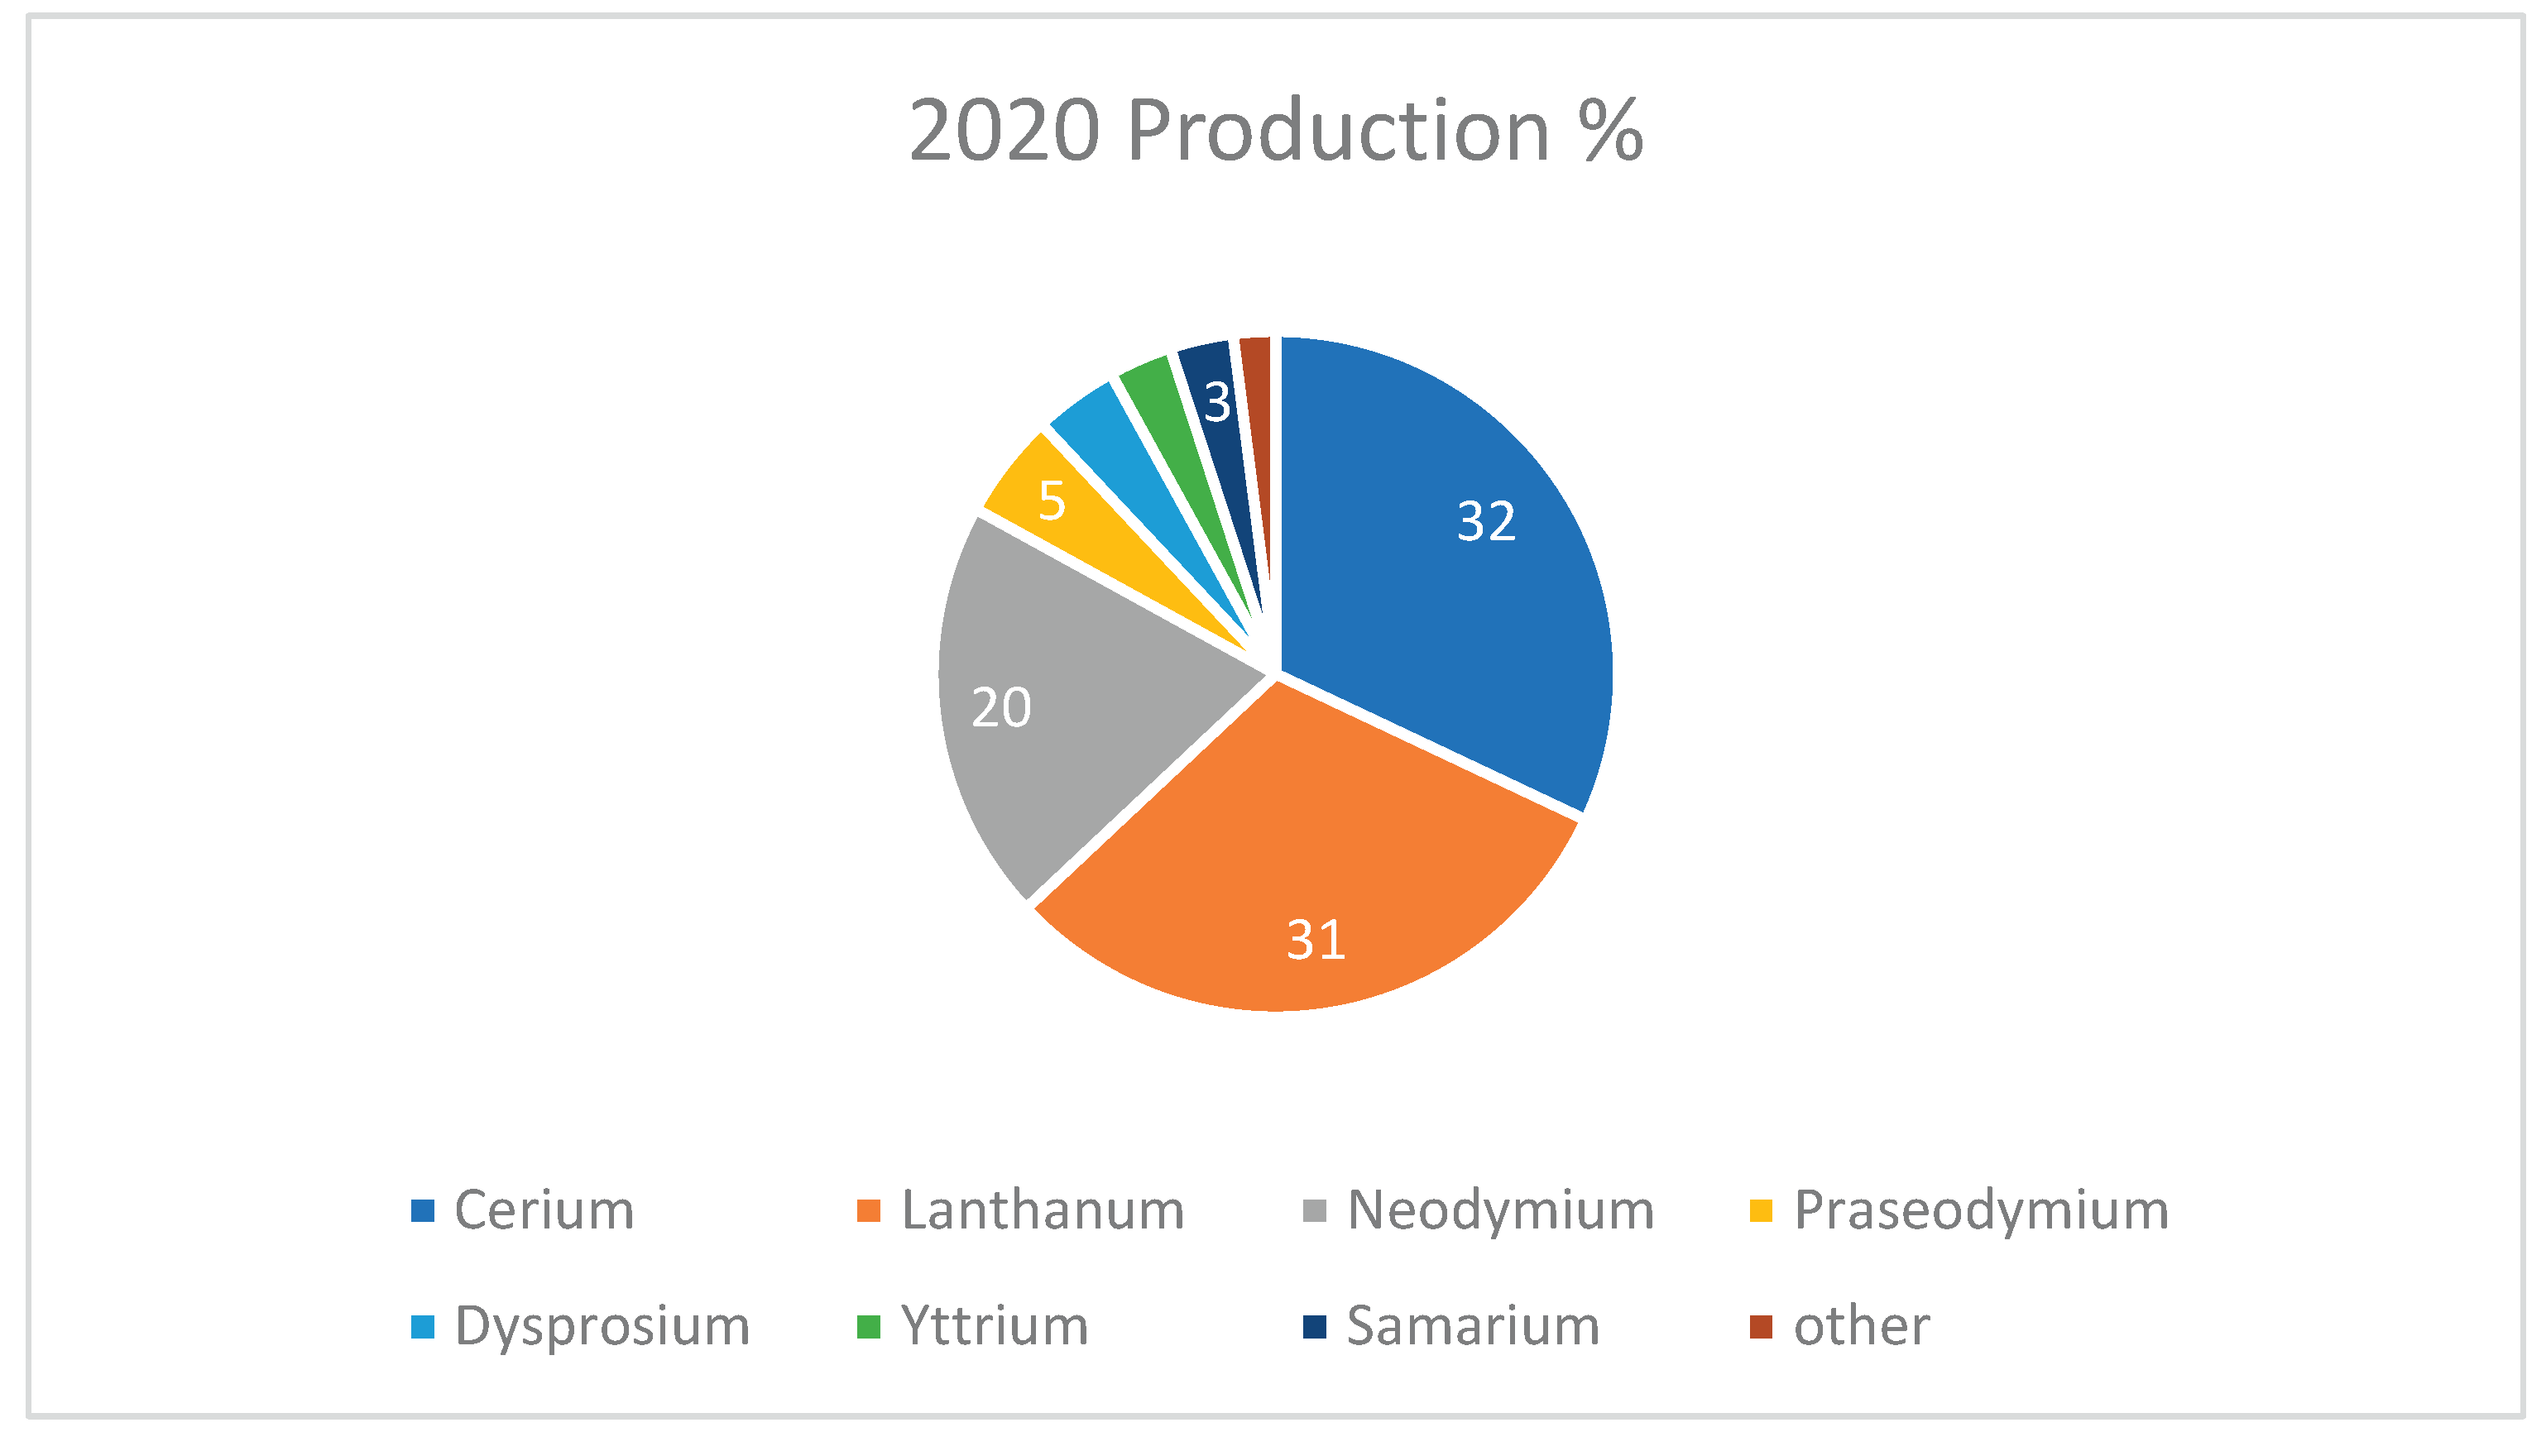
Figure 18.
– Breakdown of the rare-earth metal market by applications in 2022 (NMR, 2024).
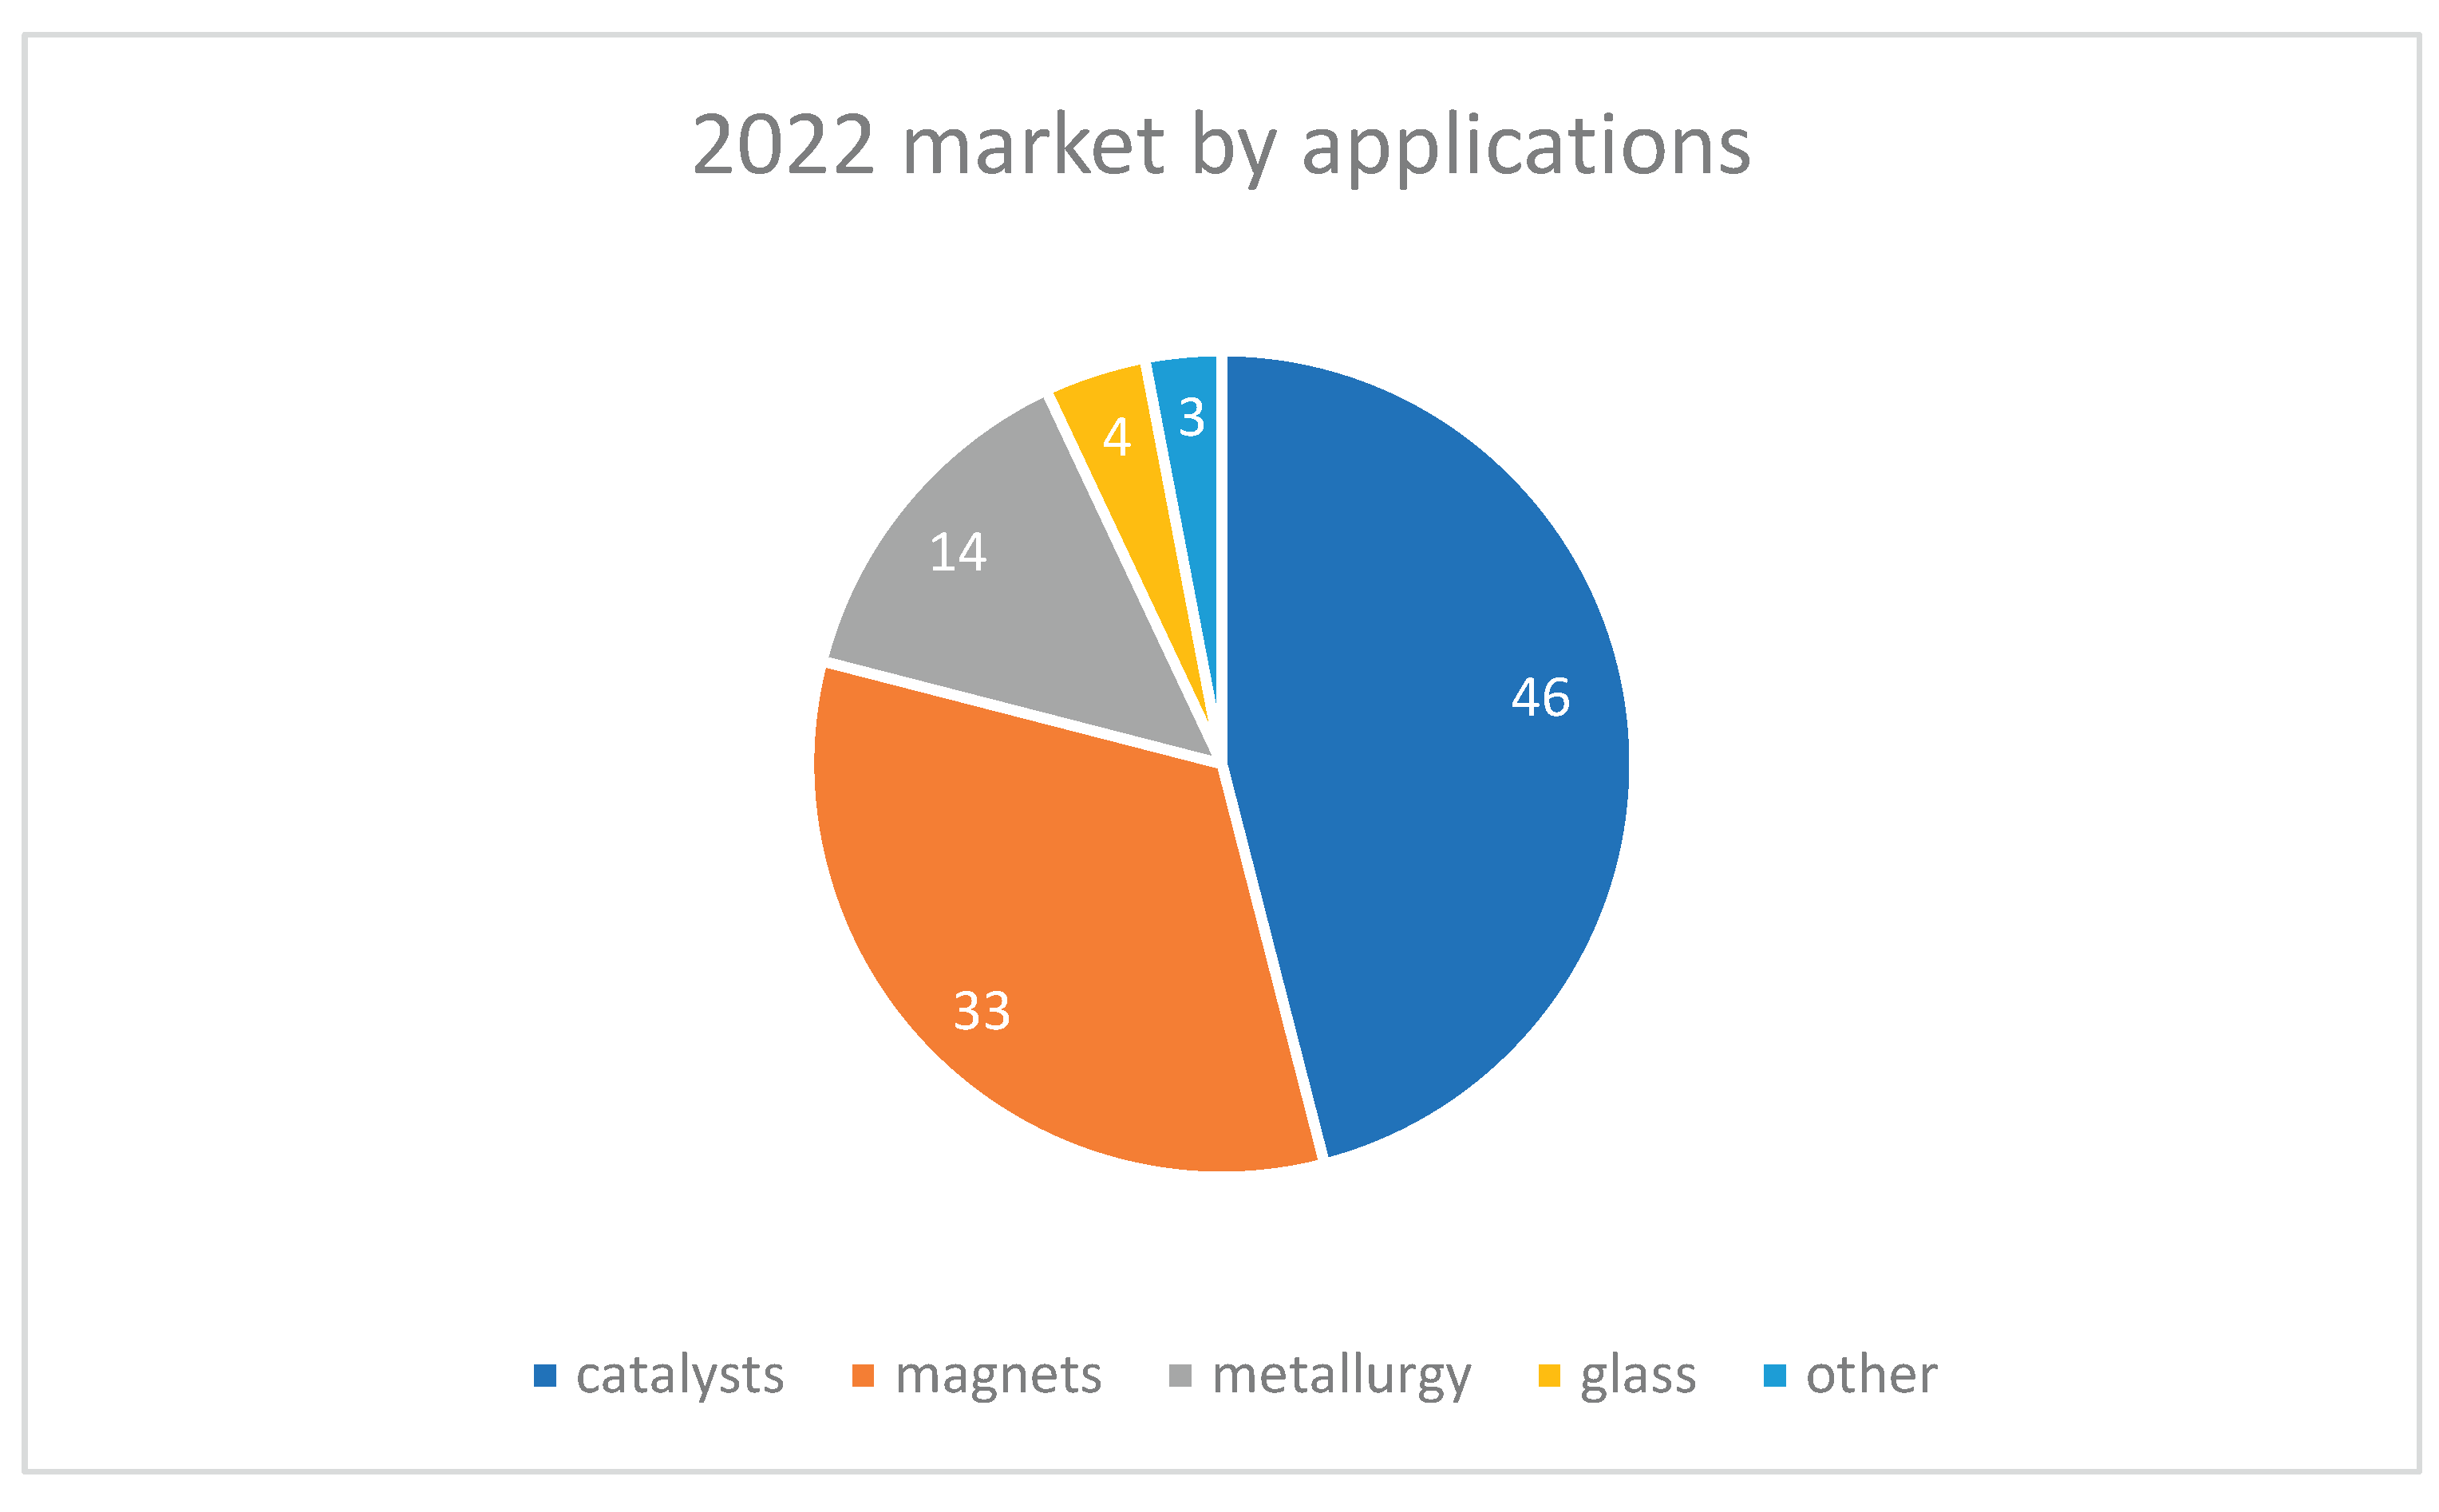
Figure 19.
- - Logistic fit of the world rare-earth production pointing out a ceiling (green line) of about 3,300 thousand tons in 2060.
Figure 19.
- - Logistic fit of the world rare-earth production pointing out a ceiling (green line) of about 3,300 thousand tons in 2060.
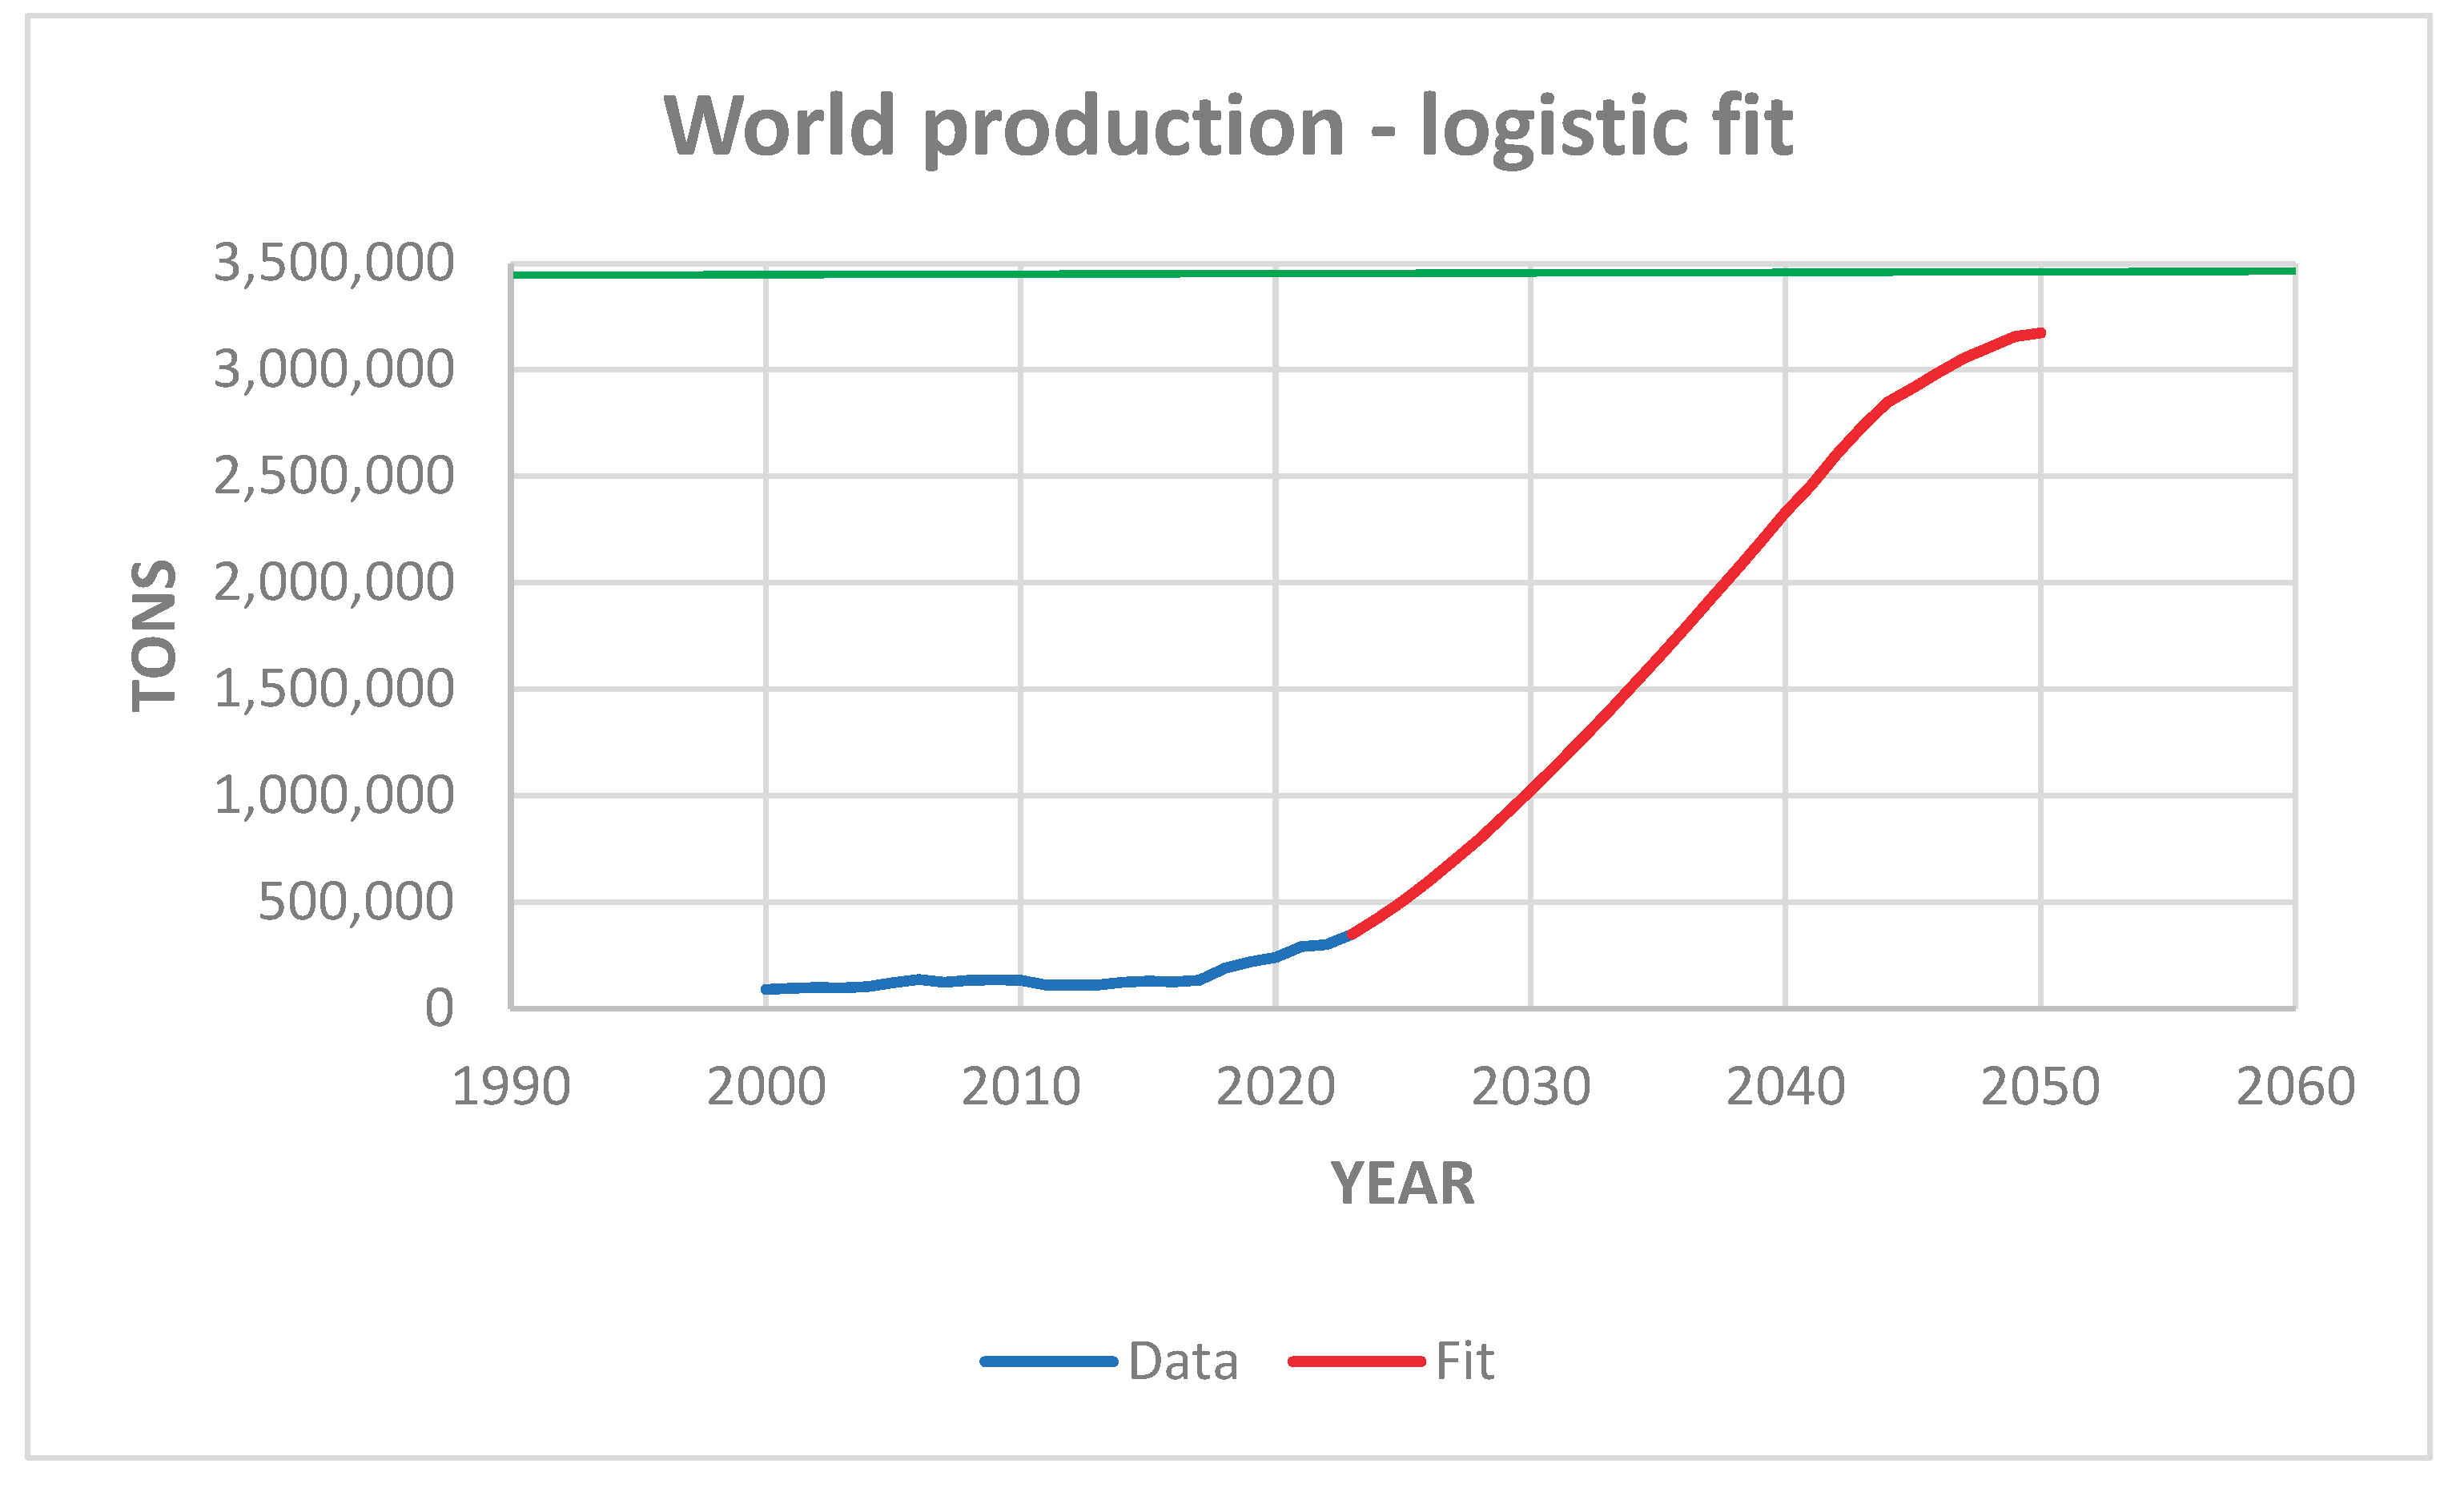
Figure 20.
- Cumulative world production of rare-earth metals until 2050 resulting from the application of the integral logistic model. The dotted red line indicates the currently estimated conservative rare-earth reserves (USGS, 2023).
Figure 20.
- Cumulative world production of rare-earth metals until 2050 resulting from the application of the integral logistic model. The dotted red line indicates the currently estimated conservative rare-earth reserves (USGS, 2023).

Disclaimer/Publisher’s Note: The statements, opinions and data contained in all publications are solely those of the individual author(s) and contributor(s) and not of MDPI and/or the editor(s). MDPI and/or the editor(s) disclaim responsibility for any injury to people or property resulting from any ideas, methods, instructions or products referred to in the content. |
© 2025 by the authors. Licensee MDPI, Basel, Switzerland. This article is an open access article distributed under the terms and conditions of the Creative Commons Attribution (CC BY) license (http://creativecommons.org/licenses/by/4.0/).
Copyright: This open access article is published under a Creative Commons CC BY 4.0 license, which permit the free download, distribution, and reuse, provided that the author and preprint are cited in any reuse.


