
Submitted:
10 June 2025
Posted:
16 June 2025
You are already at the latest version
Abstract
Polylactic acid (PLA) is a renewable biopolymer that has attracted considerable interest due to its ability to replace petroleum-based synthetic polymers, offering a more 2 sustainable alternative to global environmental problems. The present study focused on evaluating the effect of catalyst concentration and reaction time on the efficiency of 4 PLA synthesis using the ROP (Ring-Opening Polymerization) technique. The process included a lactic acid esterification stage (88%) to obtain lactide, using sulfuric acid in 6 concentrations of 40% and 60%, followed by polymerization under different times (10, 15, 20, and 30 minutes). The results of the analysis of variance (ANOVA) revealed that the 8 40% catalyst concentration had a statistically significant effect on polymer yield (p = 0.032), while reaction time showed no statistical significance (p = 0.196), although the highest yields were recorded at 10 and 15 minutes. FTIR analysis confirmed the presence of the characteristic functional groups of PLA, and DSC tests showed a semi-crystalline structure with a high melting temperature, indicating good thermal stability. These results validate the viability of PLA as a functional and sustainable biopolymer.

Keywords:
polylactic acid
; polymerization
; lactic acid
; analysis
; biopolymer
1. Introduction
In recent decades, concerns about the environmental impact of petroleum-based plastics have led to an active search for alternative materials that are undoubtedly sustainable, biodegradable, and have a low ecological impact. In this context, polylactic acid (PLA) has proven to be one of the most promising biopolymers due to its biodegradability, biocompatibility and excellent mechanical and barrier properties [1]. This has allowed its application in various industries, such as food packaging, medicine, and agriculture [2,3,4,5,6,7].
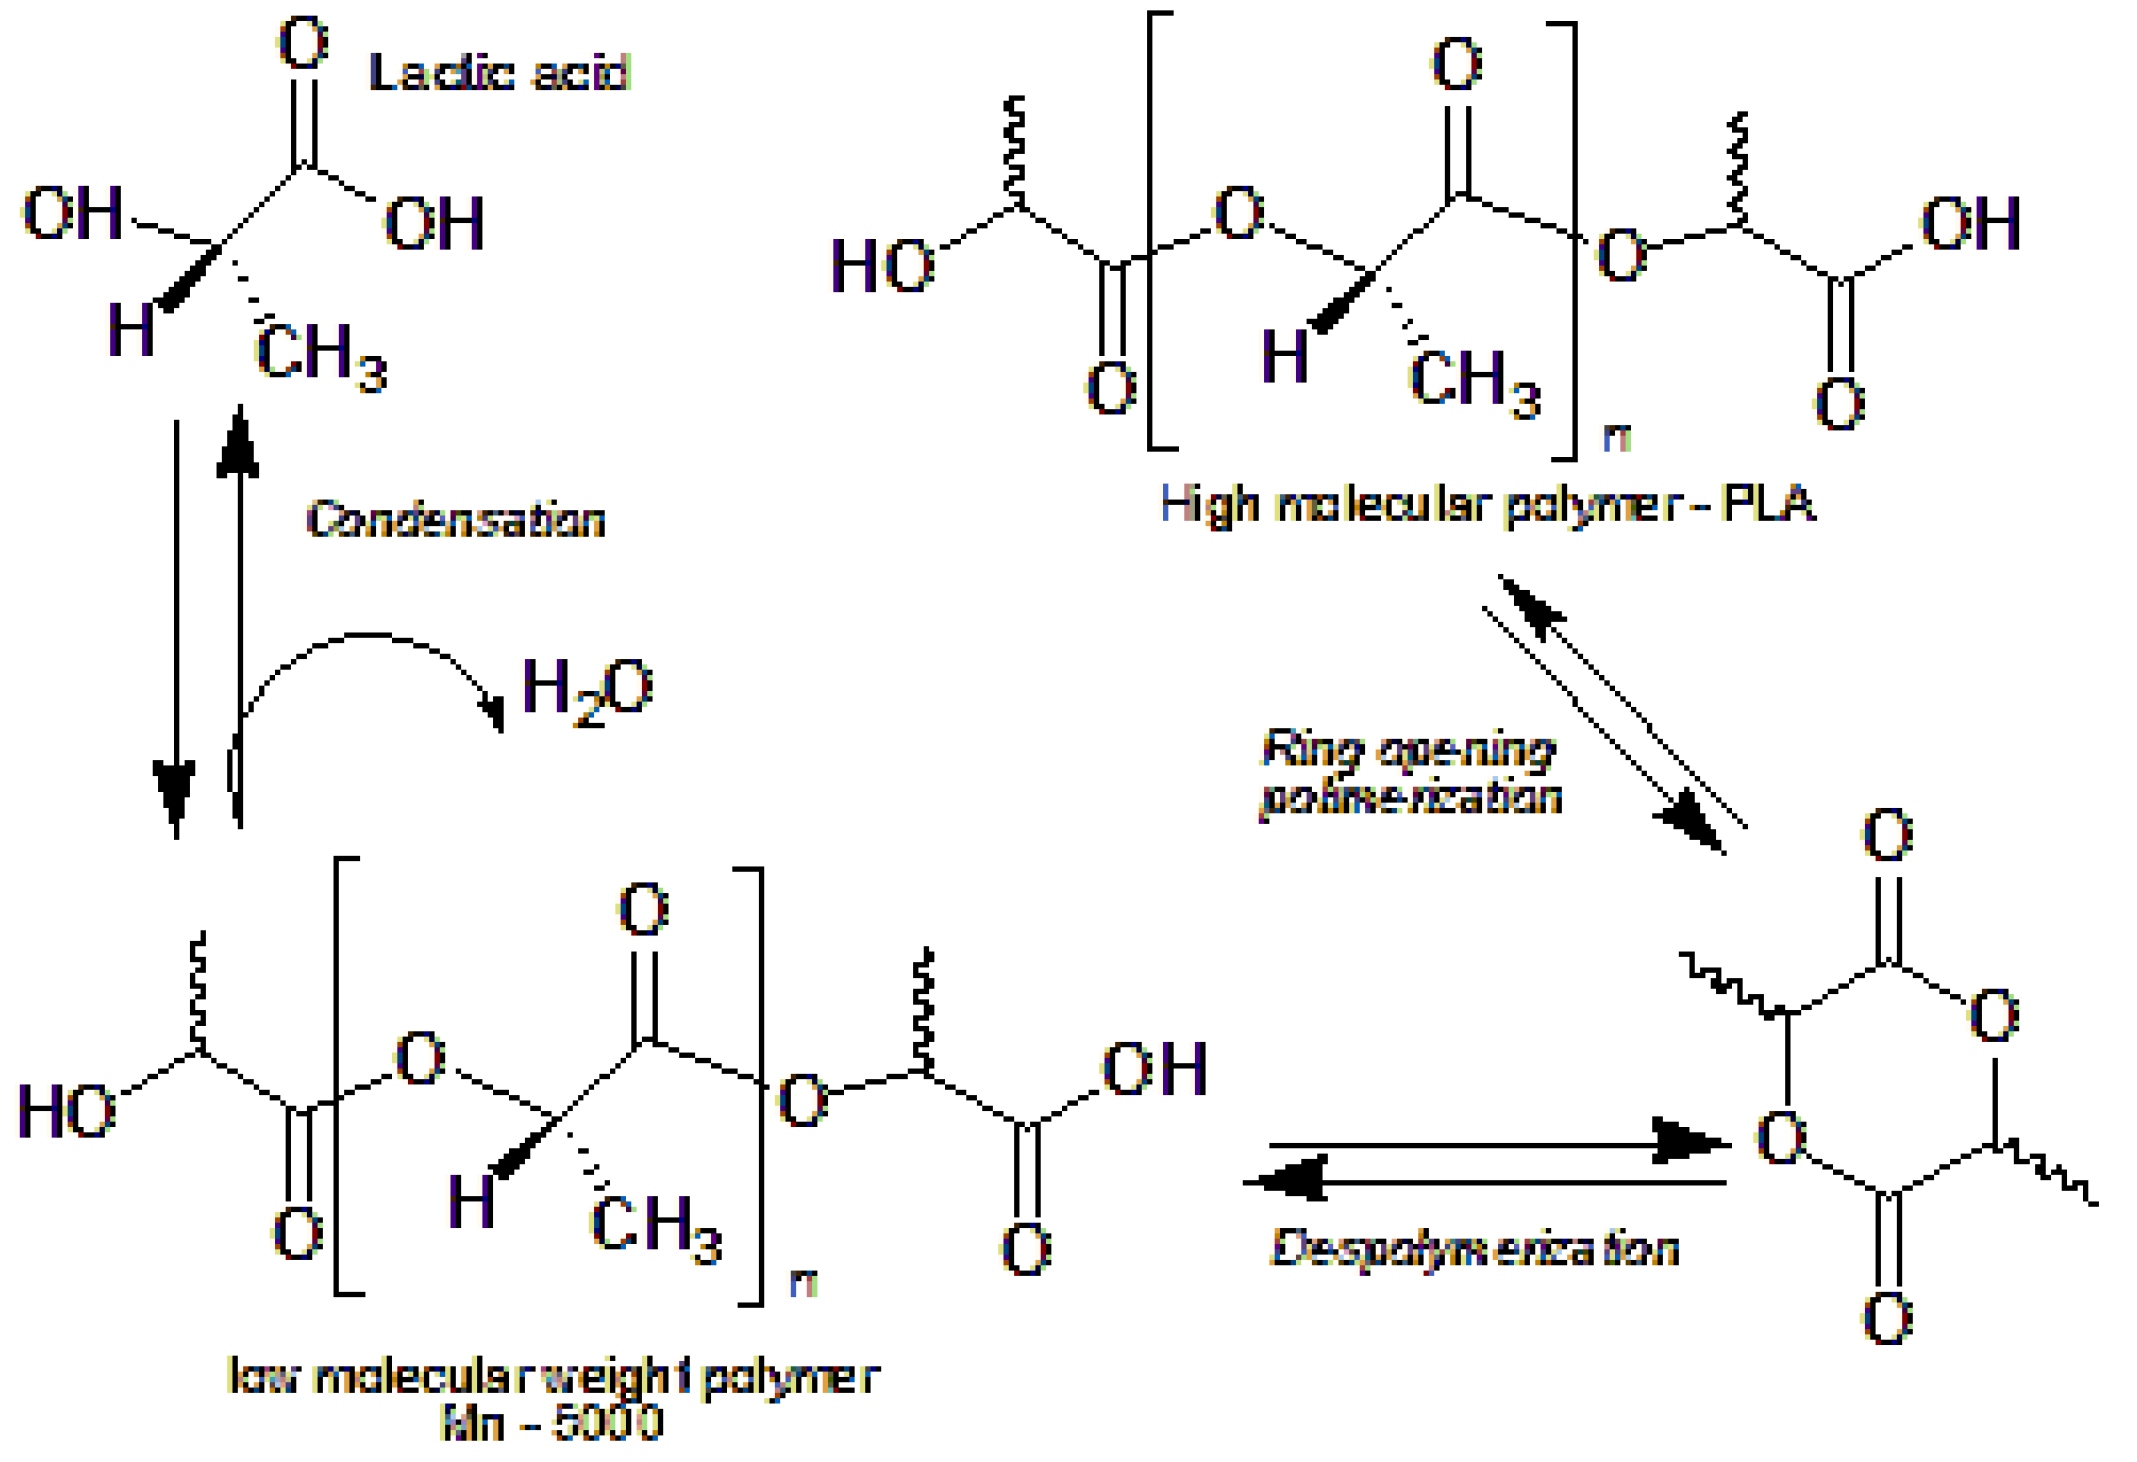
PLA is an aliphatic polyester obtained by ring-opening polymerization of lactide monomer as seen in Figure 1, which comes from lactic acid generated by fermentation of renewable resources such as corn or sugarcane. Its structure gives it exceptional transparency, adjustable molecular weight, recyclability and compostability [2,7]. These characteristics make it a viable alternative to conventional plastics such as polypropylene, polystyrene, and polyethylene terephthalate [8,9,10,11].
Figure 1.
Polymerization reaction of PLA by ROP ring opening, *Source: Adapted [12].
Figure 1.
Polymerization reaction of PLA by ROP ring opening, *Source: Adapted [12].
Despite its many advantages, the efficient synthesis of PLA remains a challenge, especially when seeking to maximize its quality and reduce production costs. The nature of the catalysts, reaction time, temperature, pressure, and concentration of the reagents are determining factors in obtaining a polymer with the desired properties. Previous research has shown that the control of these variables can significantly impact the molecular weight and stability of the final product [13,14,15,16]. For example [17,18,19] was able to synthesize PLA with a molecular weight of 30,000 g/mol by optimizing time and catalyst concentration, while [20,21,22] concluded that an appropriate combination of pressure, temperature and catalyst type significantly improves the polymer properties.
However, these studies have been developed mainly in contexts where there are greater technological resources, which leaves a gap in terms of the adaptability of these processes in developing countries such as Ecuador. Despite having renewable raw materials and regulatory frameworks that promote the circular economy [23,24,25], the problem of plastic pollution remains critical. In 2022, Ecuador produced about 490 million tons of plastic products and a continuous increase is projected [5,25,26]. In light of this situation, the development of bioplastics such as PLA represents a key strategy to reduce dependence on non-degradable materials [23,27].
Furthermore, recent research has revealed that it is possible to modify PLA properties by incorporating additives such as lignin, which can improve its degradation rate [28,29] or its thermal stability [9,30], although they can also negatively affect other characteristics, such as crystallinity. These observations open new questions on the optimization of PLA synthesis for specific applications, based on a balance between performance, cost, and sustainability [31,32,33,34,35].
In this framework, the present work aims to analyze how variables such as reaction time and concentration influence PLA synthesis, with the purpose of determining the most suitable conditions to obtain a quality, economically viable, and environmentally sustainable biopolymer that can be implemented locally in Ecuador. This research seeks to provide evidence on the efficiency of the PLA production process under conditions adapted to the capabilities of the national environment, and thus contribute to the progress towards a more sustainable economy.
2. Materials and Methods
The present investigation was developed under an experimental approach, whereby independent variables were deliberately manipulated with the purpose of analyzing their effect on a dependent variable, specifically the final mass of polylactic acid (PLA). The independent variables evaluated were the sulfuric acid concentration, set at two levels (40 % and 60 % v/v), and the reaction time, considered in four intervals (10, 15, 20 and 30 minutes). For data collection, firstly, an exhaustive literature review was used to contextualize and theoretically support the production and yield of PLA. Additionally, detailed records of the experimental conditions, the results obtained and possible anomalies that arose during the process were implemented, which contributed to a more rigorous and comprehensive analysis of the experimental data.
The experimental design consisted of three replicates, both of the concentration 40% and 60%. The Figure 2 shows the procedure mentioned in which the conditions required for each sample are specified.
Figure 2.
Experimental design Source: The Authors.
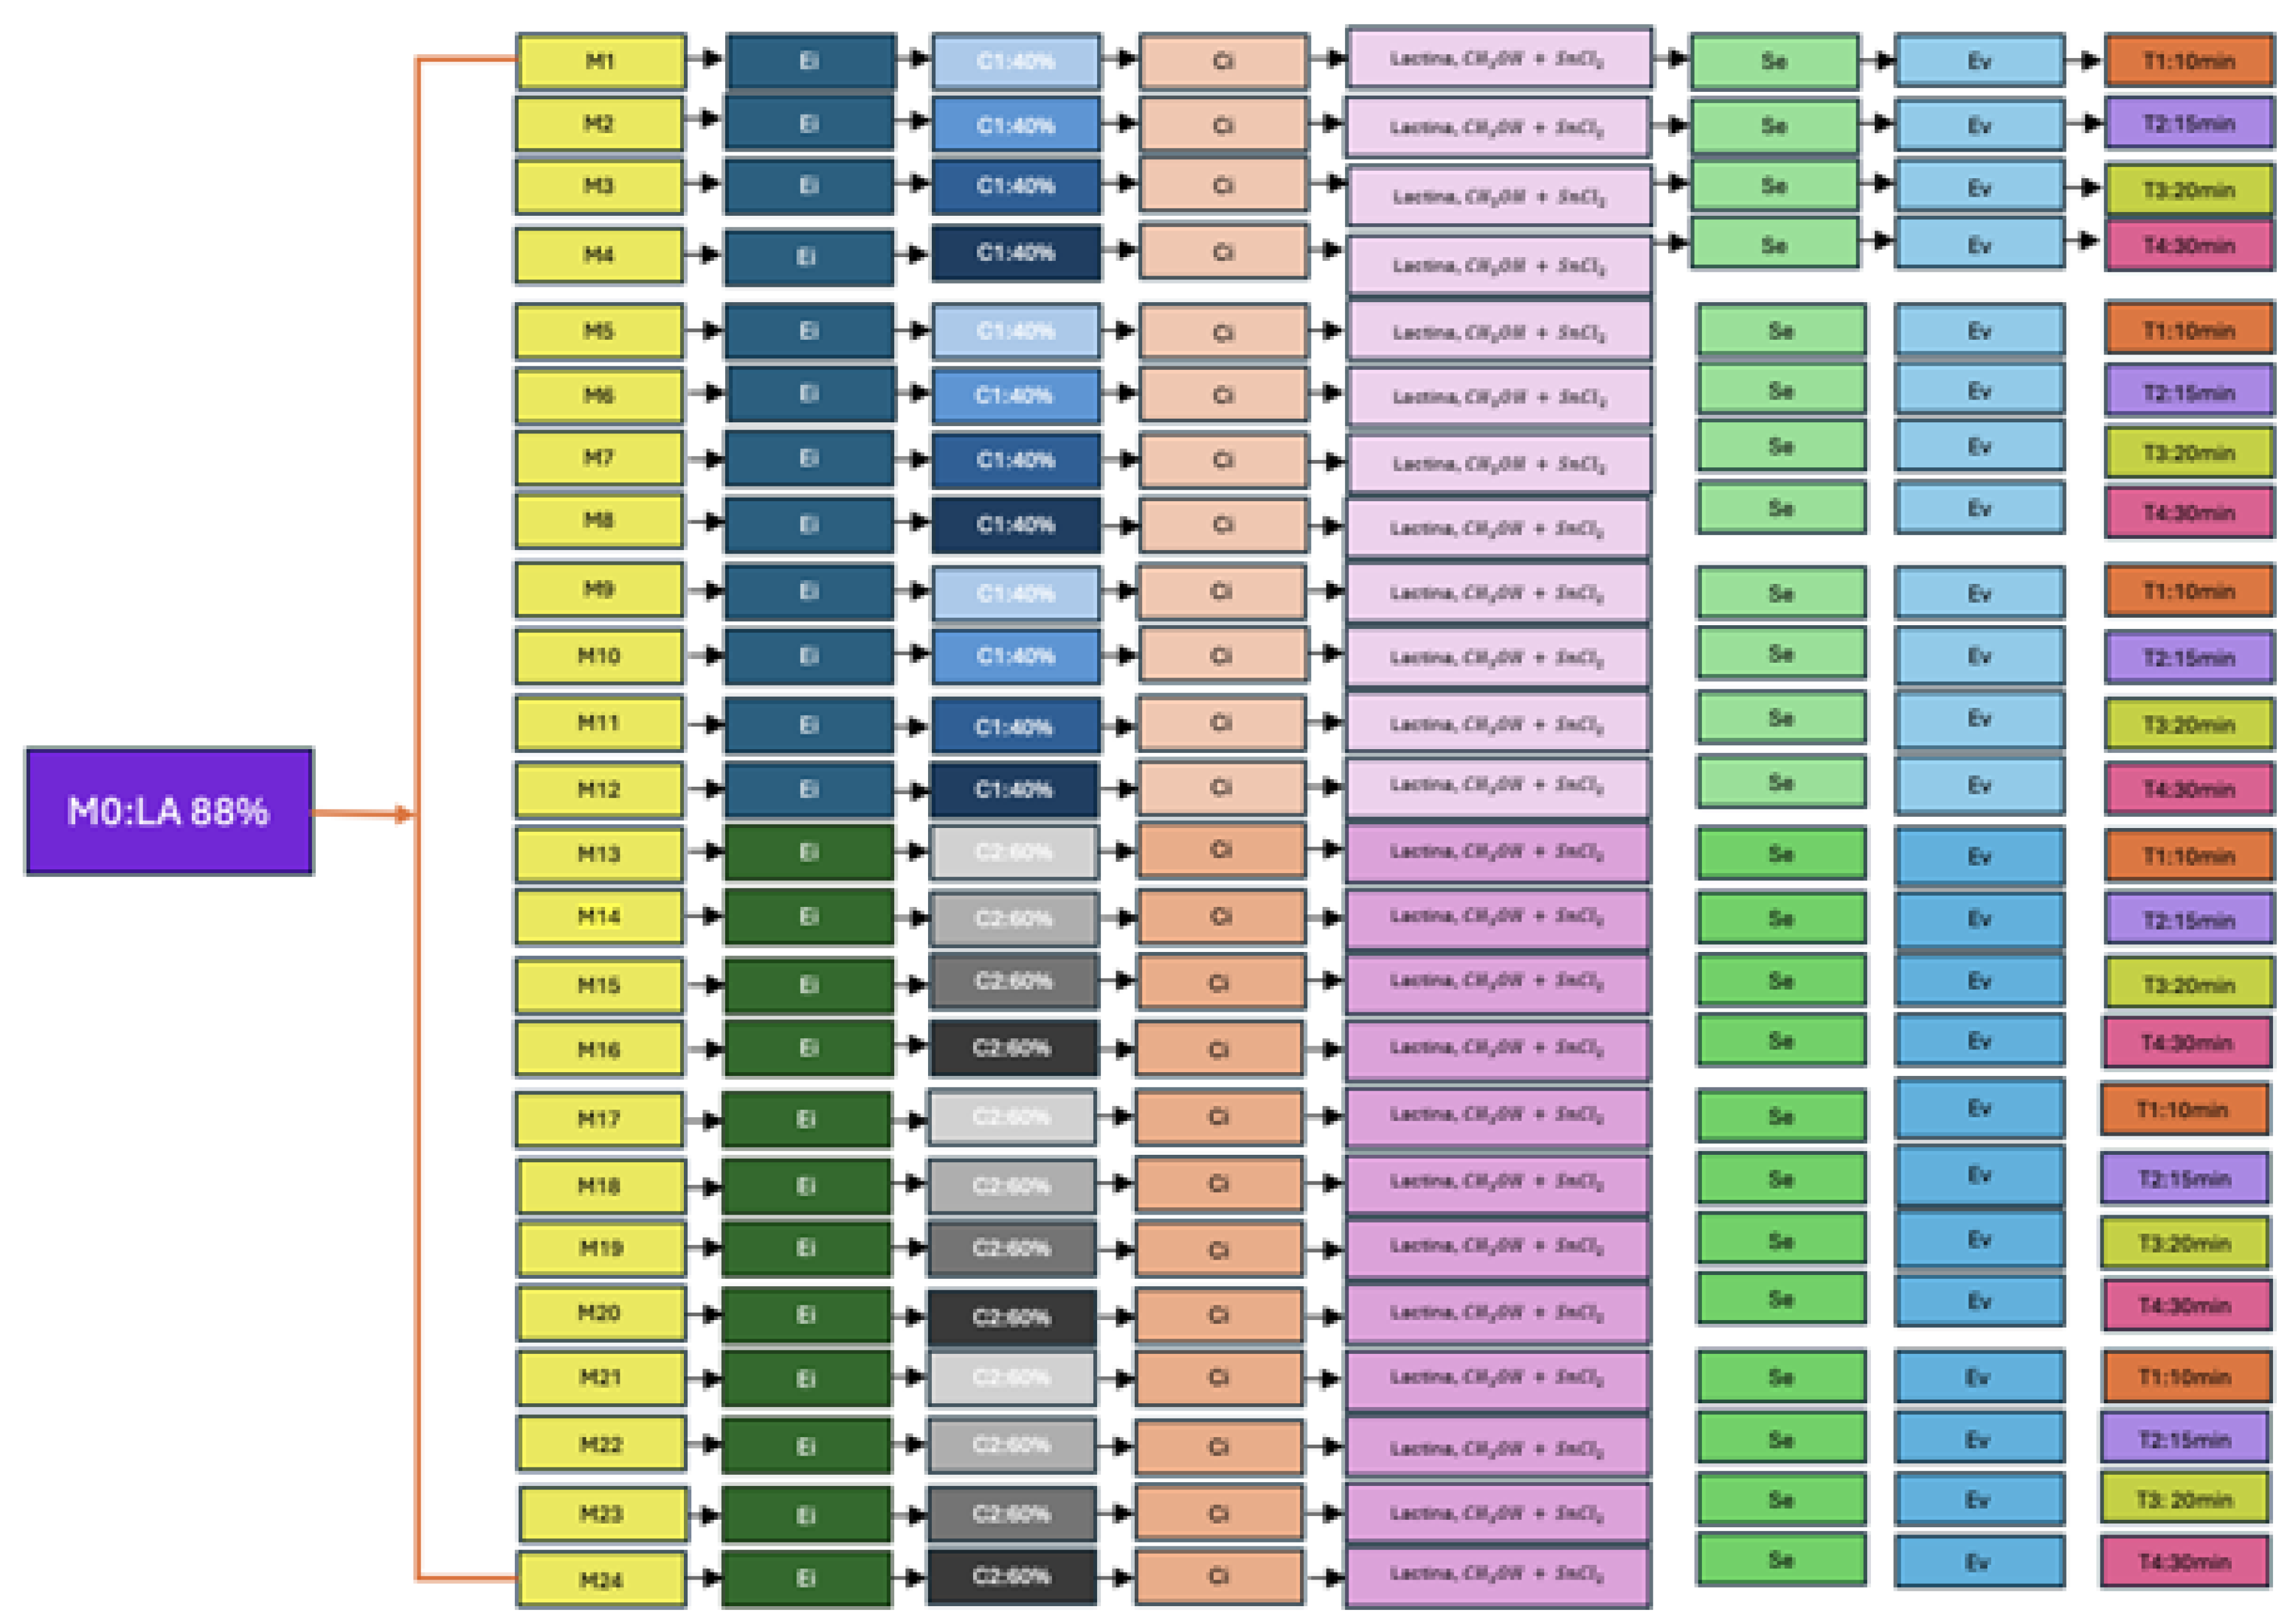
Where: M0: Lactic Acid 88 %, Ei: Esterification, C1: Concentration 1: 40% v/v, C2: Concentration 2: 60% v/v, Ci: Heating, Se: Sedimentation, Ev: Evaporation, T1: Time 1: 10 min, T2: Time 2: 15 min, T3: Time 3: 20 min, T4: Time 4: 30 min
The experimental process begins with the stage called M0, corresponding to the use of 88% lactic acid, which constitutes a fundamental component for the development of the following phases. The esterification reaction is identified as Ei, the heat treatment is identified as Ci, the sedimentation stage is identified as Se, and the evaporation process is identified as Ev. For the independent variables, two sulfuric acid concentration levels were established: C1 (40% v/v) and C2 (60% v/v). Likewise, four reaction times were considered: T1 (10 minutes), T2 (15 minutes), T3 (20 minutes) and T4 (30 minutes), in order to evaluate their influence on the behavior of the system.
2.1. Synthesis of Polylactic Acid (PLA) from Lactic Acid by Ring Opening Polymerization (ROP)
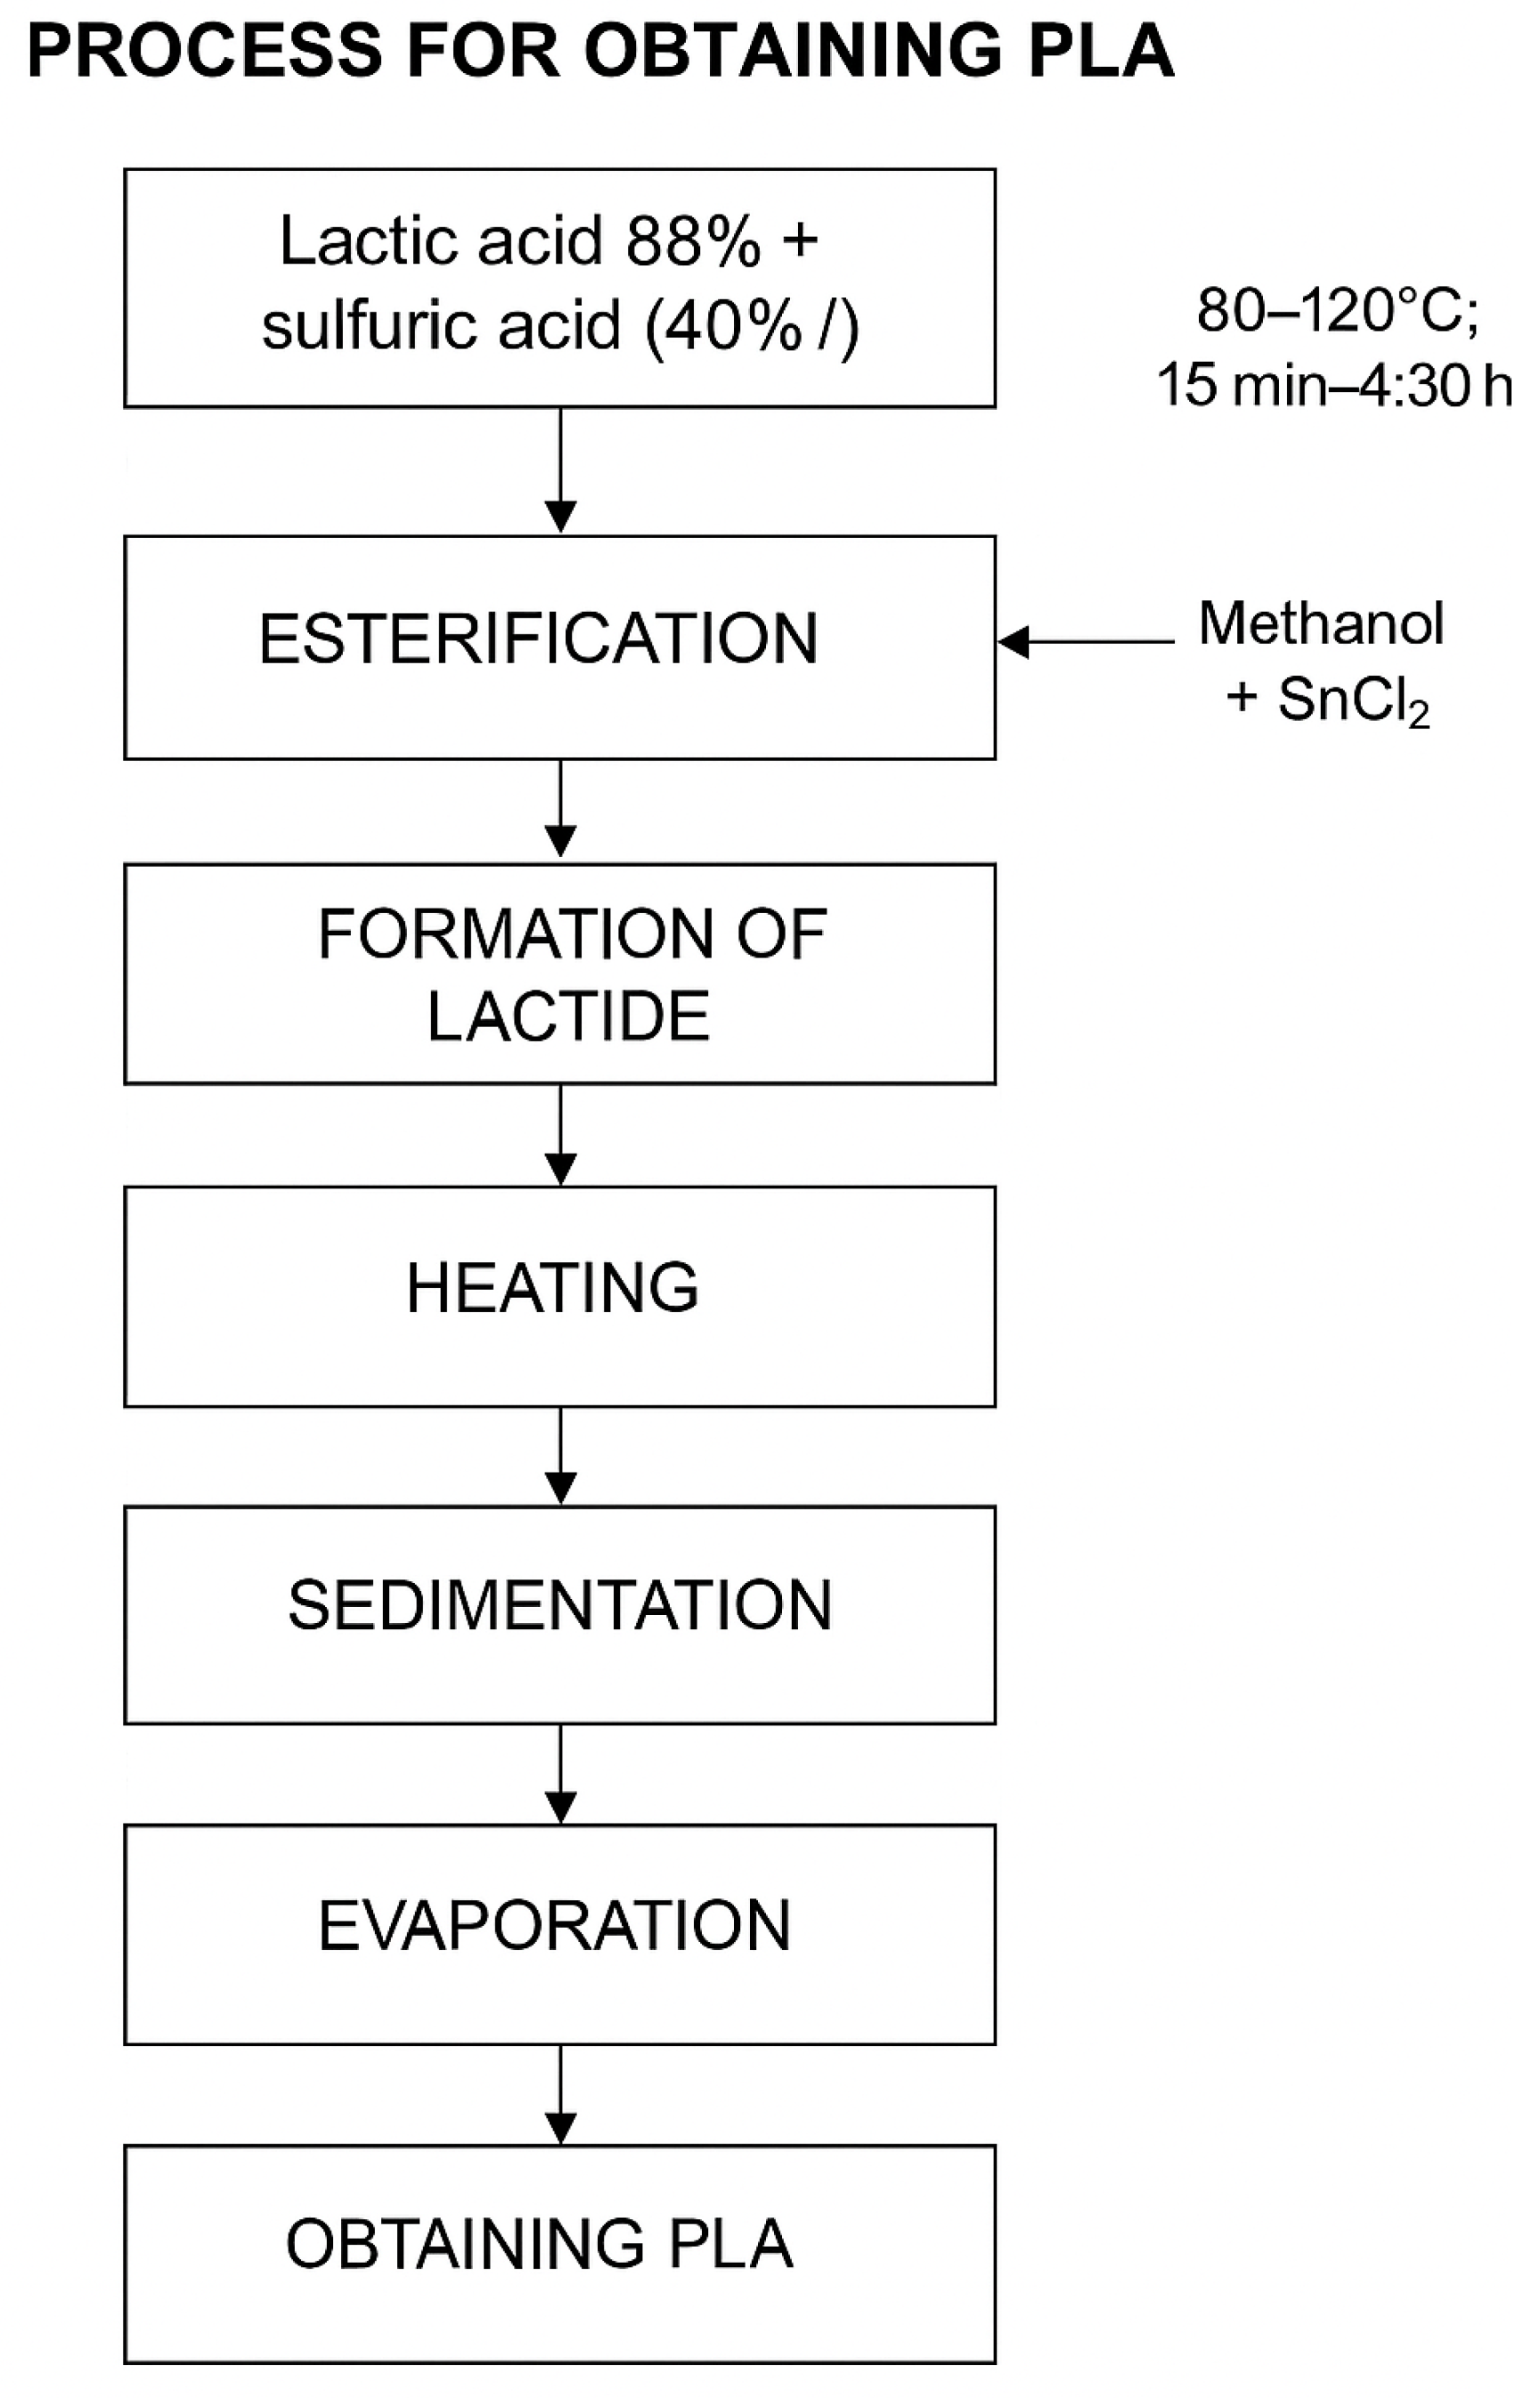
The synthesis of polylactic acid (PLA) from lactic acid initially involves a polycondensation process, whereby water molecules are removed to form linear oligomers. Subsequently, these oligomers can be transformed into lactide, a cyclic dimer of lactic acid, which is used in ring-opening polymerization (ROP) to obtain high molecular weight PLA [8]. In this method, lactic acid first undergoes catalyzed esterification, where the elimination of water favors the formation of ester bonds, a key step for obtaining lactide [12,36]. In the experimental stage, lactic acid (88%) was subjected to a polycondensation process in the presence of sulfuric acid as catalyst. Two concentrations of the catalyst were evaluated: 40% and 60% v/v. For each experimental condition, three replicates were performed, resulting in a total of 24 samples. In each test, 50 ml of lactic acid was mixed with 2.5 ml of sulfuric acid (according to the corresponding concentration), carrying out the reaction in a thermoagitator plate for 15 minutes. The dehydration process was carried out by continuous application of heat at a temperature of 120 °C, during periods of 30 minutes, 3 hours and 30 minutes, and 4 hours and 30 minutes, according to established experimental conditions. At this stage, 2.5 ml of sulfuric acid was added as catalyst, with the objective of favoring the elimination of water generated during the reaction [12,31,37]. This step is essential to promote efficient polycondensation, an indispensable condition for the subsequent formation of the lactide in an adequate manner, This procedure is shown in the Figure 3
Figure 3.
PLA obtaining process, Source: The Authors.
2.1.1. Heating Process
This stage is crucial, since the heat treatment allows the effective activation of the catalyst, which facilitates the opening of the lactide ring and, with it, the formation of the polymeric chains characteristic of polylactic acid (PLA) [36]. In this phase, 5 g of lactide was added, followed by the addition of 50 ml of reagent grade methanol (GR) and 3 g of stannous (II) chloride, used as catalyst. The mixture was subjected to a constant temperature of 60 ° C for different time intervals (10, 15, 20 and 30 min). This procedure was repeated in three replicates for each of the concentrations evaluated (40% and 60%). To facilitate the understanding of the procedure.
2.2. Sedimentation Process
The mixture was left to stand for a period of 10 minutes, which allowed, by sedimentation, the polylactic acid (PLA) particles to agglomerate at the bottom of the flask [38]. This step is essential for the separation of the solid polymeric fraction from the supernatant.
2.3. Evaporation Process
In order to eliminate the residual methanol, the recovered product was subjected to a heat treatment in an oven at a constant temperature of 70 °C for one hour. As a result, PLA was obtained in the form of a white powder, a physical characteristic that evidences its solid and dehydrated state. Finally, the material was reserved under controlled conditions for further analysis and characterization.
2.4. Final Yield Calculation of Polylactic Acid (PLA)
To determine the percentage yield of PLA obtained, equation (1) was applied:
and to calculate the initial mass of initial lactic acid, equation (2) was used.
In this study, the following experimental data were considered: - Volume of lactic acid: 50 ml. - Lactic acid concentration: 88 % (equivalent to 0.88 g / ml). Therefore, the mass of lactic acid used in each sample was 44 g, calculated as: Mass = 50 mL × 0.88 g/mL = 44 g
Finally, to calculate the average yield of the three best samples corresponding to catalyst concentrations 40 % and 60 %, equation (3) was used:
2.5. Polylactic Acid Identification
For quantitative chemical analysis, an FTIR spectrophotometer available in the Chromatography laboratory, belonging to the ”Life Sciences” laboratories, will be used. This technique allows characterizing the compounds both at chemical and structural level, in a non invasive way [39]. On the other hand, the physical characterization will be carried out by Differential Scanning Calorimetry (DSC) method [40,41], which provides detailed information about the thermal properties of PLA.
2.6. Differential Scanning Analysis DSC of the Obtained PLA
Differential scanning thermal analysis (DSC) was performed using samples of approximately 5 mg. The samples were placed in hermetically sealed aluminum cells, and the analysis was carried out under an inert atmosphere of dry nitrogen, with a constant flow rate of 50 mL/min to avoid oxidation processes during the assay. The thermal protocol employed consisted of three successive stages: First heating: samples were heated from 30 °C to 250 °C at a heating rate of 10 °C/min. The purpose of this stage was to eliminate the thermal history of the polymer, ensuring standardized conditions for subsequent thermal characterization. Cooling: After reaching 250 °C, the samples were cooled again to 30 °C, at a controlled rate of -10 °C/min, allowing a homogeneous recrystallization of the material. Second heating: Finally, the samples were subjected to a second heating cycle from 30 °C to 250 °C, maintaining the same heating rate of 10 °C/min, in order to determine the thermal transition temperatures of the material. The glass transition temperatures (Tg) were identified at the midpoint of the specific heat increment, while the melting temperatures (Tm) were determined from the maximum of the endothermic peak corresponding to the PLA melting process [20,40,42,43].
3. Results
3.1. Analysis of the Results of the Yields Obtained from the PLA
Under experimental conditions and applying equation (1), it was found that at a concentration of 40 % sulfuric acid as catalyst, the sample that presented the highest recovered mass of PLA was sample 11 (M11), which, after a reaction time of 20 minutes, produced 0.65 g of PLA, representing a yield of 1.47 %. The second highest recovery was obtained in sample 5 (M5), with 0.56 g of PLA and a yield of 1. 27 %, with a reaction time of 10 min. Finally, in the Table 1, it is shows that the third sample with the highest product mass was sample 10 (M10), which achieved a recovery of 0.45 g PLA, corresponding to a yield of 1.02 %, under a reaction time of 15 minutes. In all cases, the independent variable controlled was the catalyst concentration (40 %), while different time intervals were evaluated as experimental variable. These values are detailed in the following table number

Table 1.
Determination of the final mass obtained from PLA from sample 1 to sample 12 corresponding to a concentration of 40%.
Table 1.
Determination of the final mass obtained from PLA from sample 1 to sample 12 corresponding to a concentration of 40%.
| SAMPLE | TIME (min) |
WEIGHT PLA (g) |
FINAL YIELD (%) |
| M1 | 10 | 0.32 | 0.72 |
| M2 | 15 | 0.32 | 0.72 |
| M3 | 20 | 0.36 | 0.81 |
| M4 | 30 | 0.43 | 0.97 |
| M5 | 10 | 0.56 | 1.27 |
| M6 | 15 | 0.38 | 0.72 |
| M7 | 20 | 0.27 | 0.61 |
| M8 | 30 | 0.38 | 0.86 |
| M9 | 10 | 0.37 | 0.84 |
| M10 | 15 | 0.45 | 1.02 |
| M11 | 20 | 0.65 | 1.47 |
| M12 | 30 | 0.33 | 0.75 |
Under the experimental conditions corresponding to a concentration of 60 % sulfuric acid, the sample that presented the highest mass of PLA recovered was sample 14 (M14), obtaining 0.45 g and a yield of 1.02 %. The second sample with the highest mass was sample 16 (M16), which achieved a recovery of 0.44 g of PLA, corresponding to a yield of 1.00 %, under a reaction time of 30 minutes. Finally, the third sample with the highest recovery was sample 20 (M20), with 0.33 g of PLA and a yield of 0.75 %. These results are summarized in the corresponding Table 2. To calculate the average of the yields obtained, Equation (3) was used obtaining a value of 1.25%.
Table 2.
Determination of the final mass obtained from PLA from sample 13 to sample 24 corresponding to a concentration of 60%.
Table 2.
Determination of the final mass obtained from PLA from sample 13 to sample 24 corresponding to a concentration of 60%.
| SAMPLE | TIEMPO (min) |
WEIGHT PLA (g) |
FINAL YIELD (%) |
| M13 | 10 | 0.22 | 0.5 |
| M14 | 15 | 0.45 | 1.02 |
| M15 | 20 | 0.25 | 0.56 |
| M16 | 30 | 0.44 | 1 |
| M17 | 10 | 0.27 | 0.61 |
| M18 | 15 | 0.28 | 0.63 |
| M19 | 20 | 0.11 | 0.25 |
| M20 | 30 | 0.33 | 0.75 |
| M21 | 10 | 0.07 | 0.15 |
| M22 | 15 | 0.21 | 0.47 |
| M23 | 20 | 0.08 | 0.18 |
| M24 | 30 | 0.17 | 0.38 |
3.2. ANOVA Analysis
The analysis of variance (ANOVA) performed to evaluate the effect of reaction time, sulfuric acid concentration and their interaction on the yield in obtaining polylactic acid (PLA), reveals the following results, reveals the following results as seen in Table 3. The concentration variable showed a statistically significant effect on the yield, with a value of p = 0.032 (< 0.05), and a value of F = 5.314, indicating that there are significant differences in the yields depending on the concentrations evaluated (40 % and 60 %). In contrast, the reaction time variable did not present a significant effect (p = 0.196; F = 1.786), as did the time:concentration interaction, which was also statistically non-significant (p = 0.175; F = 1.976). These results suggest that, within the experimental conditions studied, the catalyst concentration is the factor with the greatest influence on the amount of PLA obtained, while the reaction time and its interaction with the concentration do not generate a statistically relevant effect on the yield of the process.
Table 3.
Analysis of variance (ANOVA).
| DF | Sum Sq | Mean Sq | F value | Pr (>F) | |
| Time | 1 | 0.0350 | 0.03497 | 1.786 | 0.196 |
| Concentration | 1 | 0.1040 | 0.10402 | 5.314 | 0.032 * |
| Time: Concentration | 1 | 0.0387 | 0.03868 | 1.976 | 0.175 |
| Residuals | 20 | 0.3915 | 0.01958 |
In the study developed by [36], it is pointed out that the variables concentration and time are determining factors in the process of obtaining polylactic acid (PLA). When contrasting the results obtained in that research with those of the present one, it is observed that, although the catalyst concentration has a statistically significant effect on the PLA yield, the reaction time does not present a relevant influence. This discrepancy can be attributed to several experimental variables, among them, the specific operating conditions of each study, such as the differences in the reaction times used for lactide formation, which could have directly affected the efficiency of the polymerization process in both investigations.
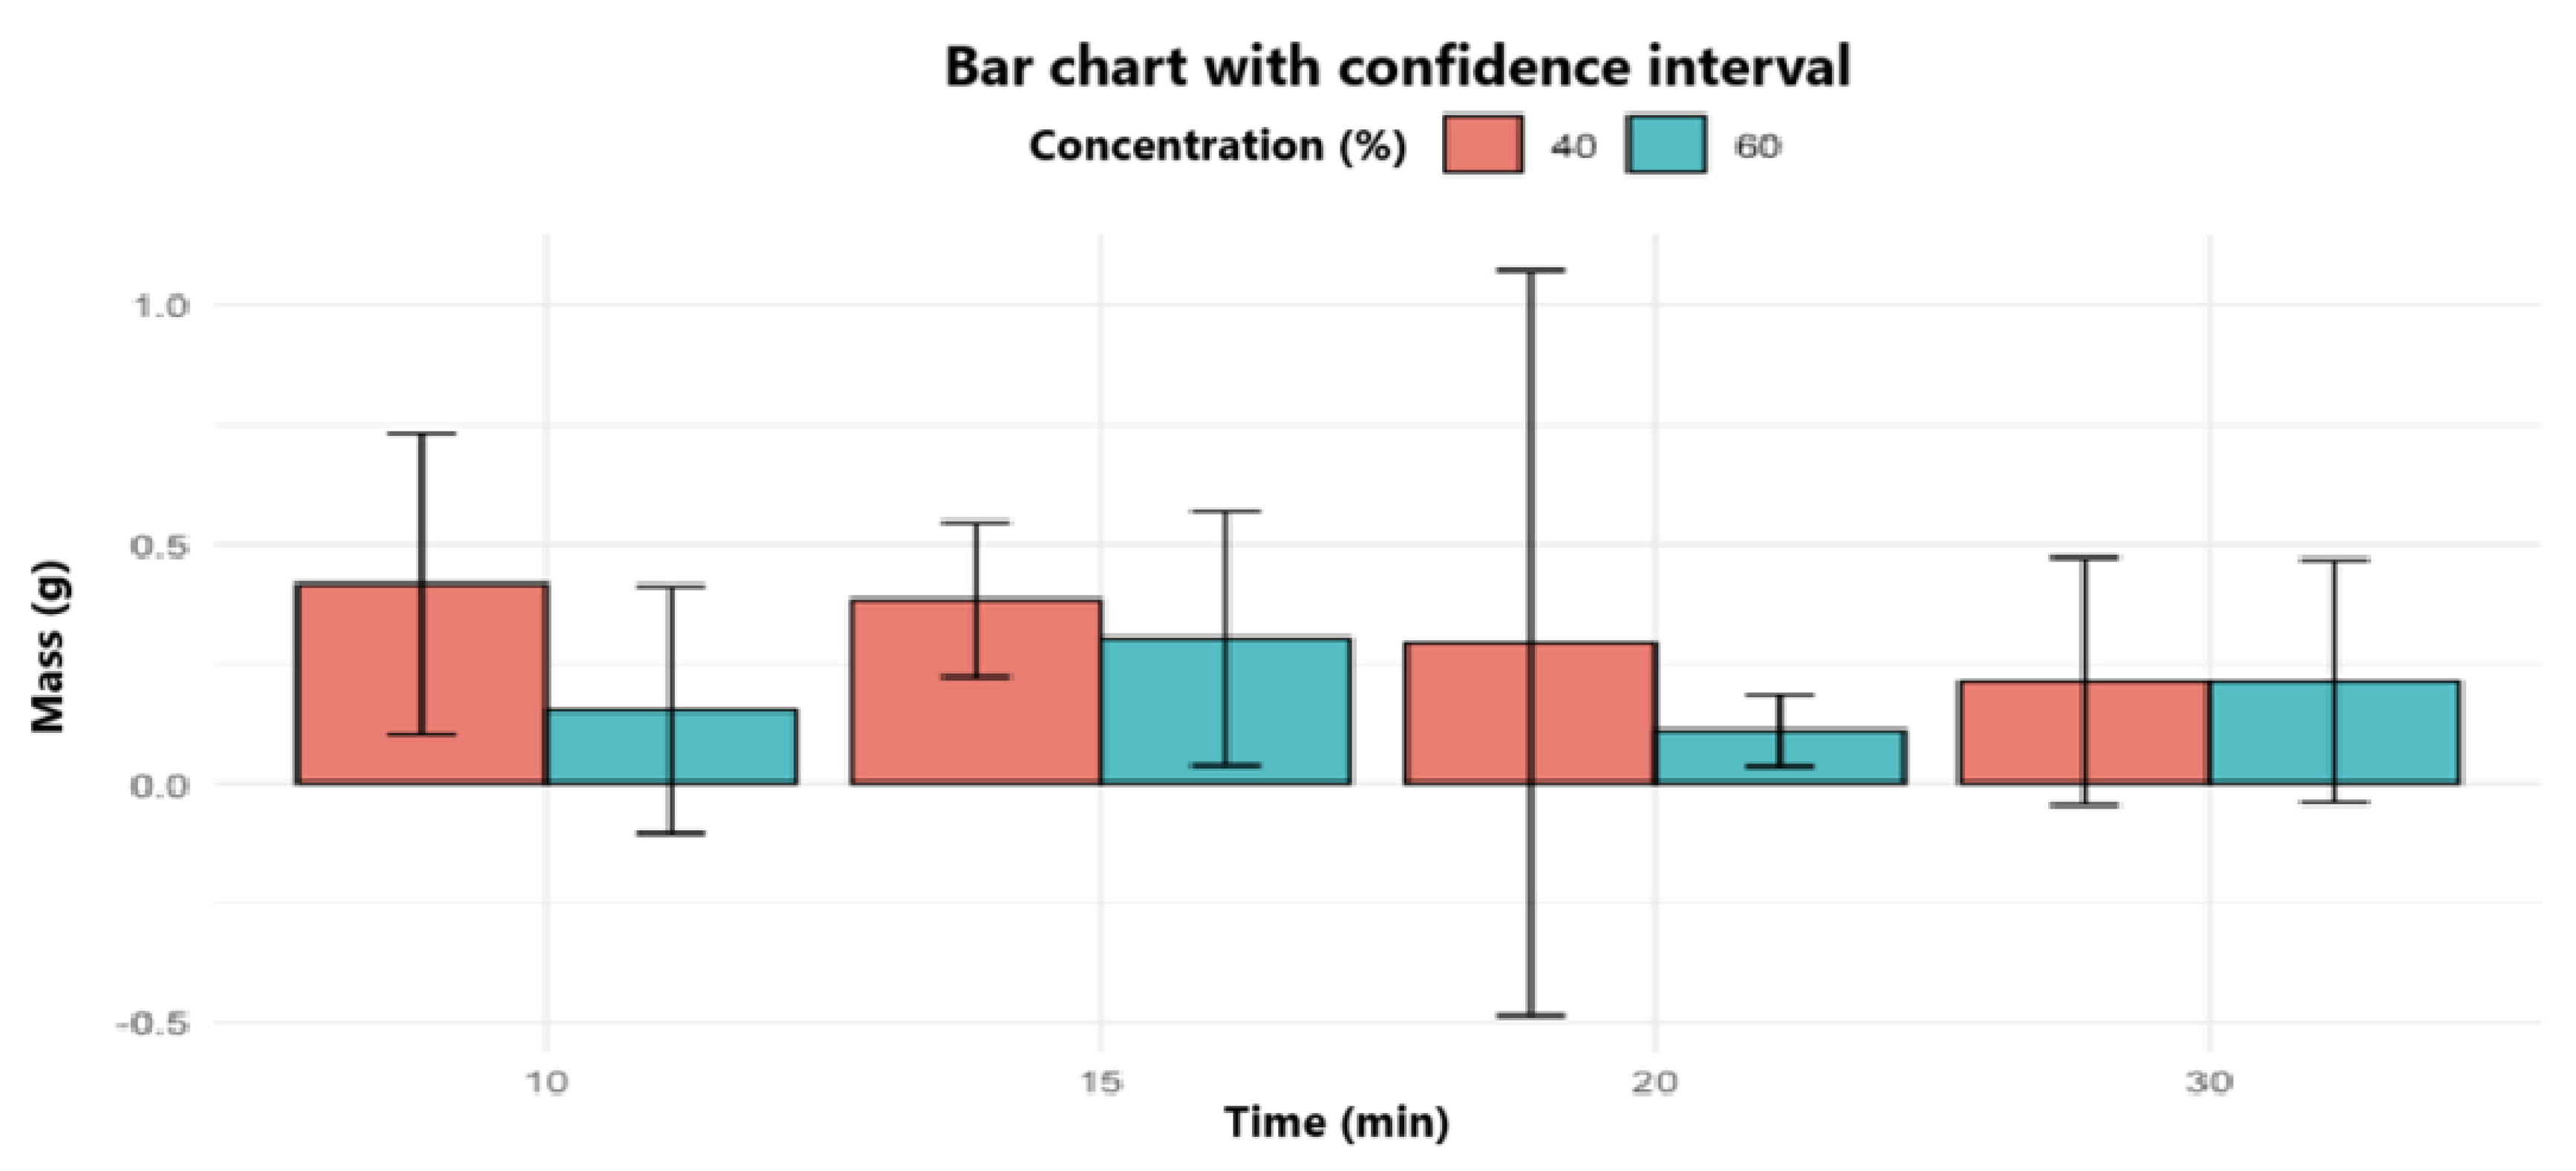
The Figure 4 illustrates the average mass of polylactic acid (PLA) obtained as a function of reaction time in which it can be observed that, in general terms, the 40% concentration tends to generate higher masses of PLA compared to that of 60%, especially at times of 10, 15 and 20 minutes. The highest average mass is recorded with the 40% concentration at 10 minutes, which could indicate that a short time favors polymerization under this concentration. In contrast, at 20 minutes a greater variability in the results is evident, particularly for the 40% concentration, suggesting a lower reproducibility under these conditions. Overall, the graph supports the hypothesis that catalyst concentration is a determinant factor in PLA yield, while reaction time, over the range evaluated, does not exert a consistent or significant effect.
Figure 4.
Bar Chart with confidence intervals.
3.3. Qualitative Analysis of PLA
3.3.1. FTIR Spectrum and Analysis DSC of PLA Obtained
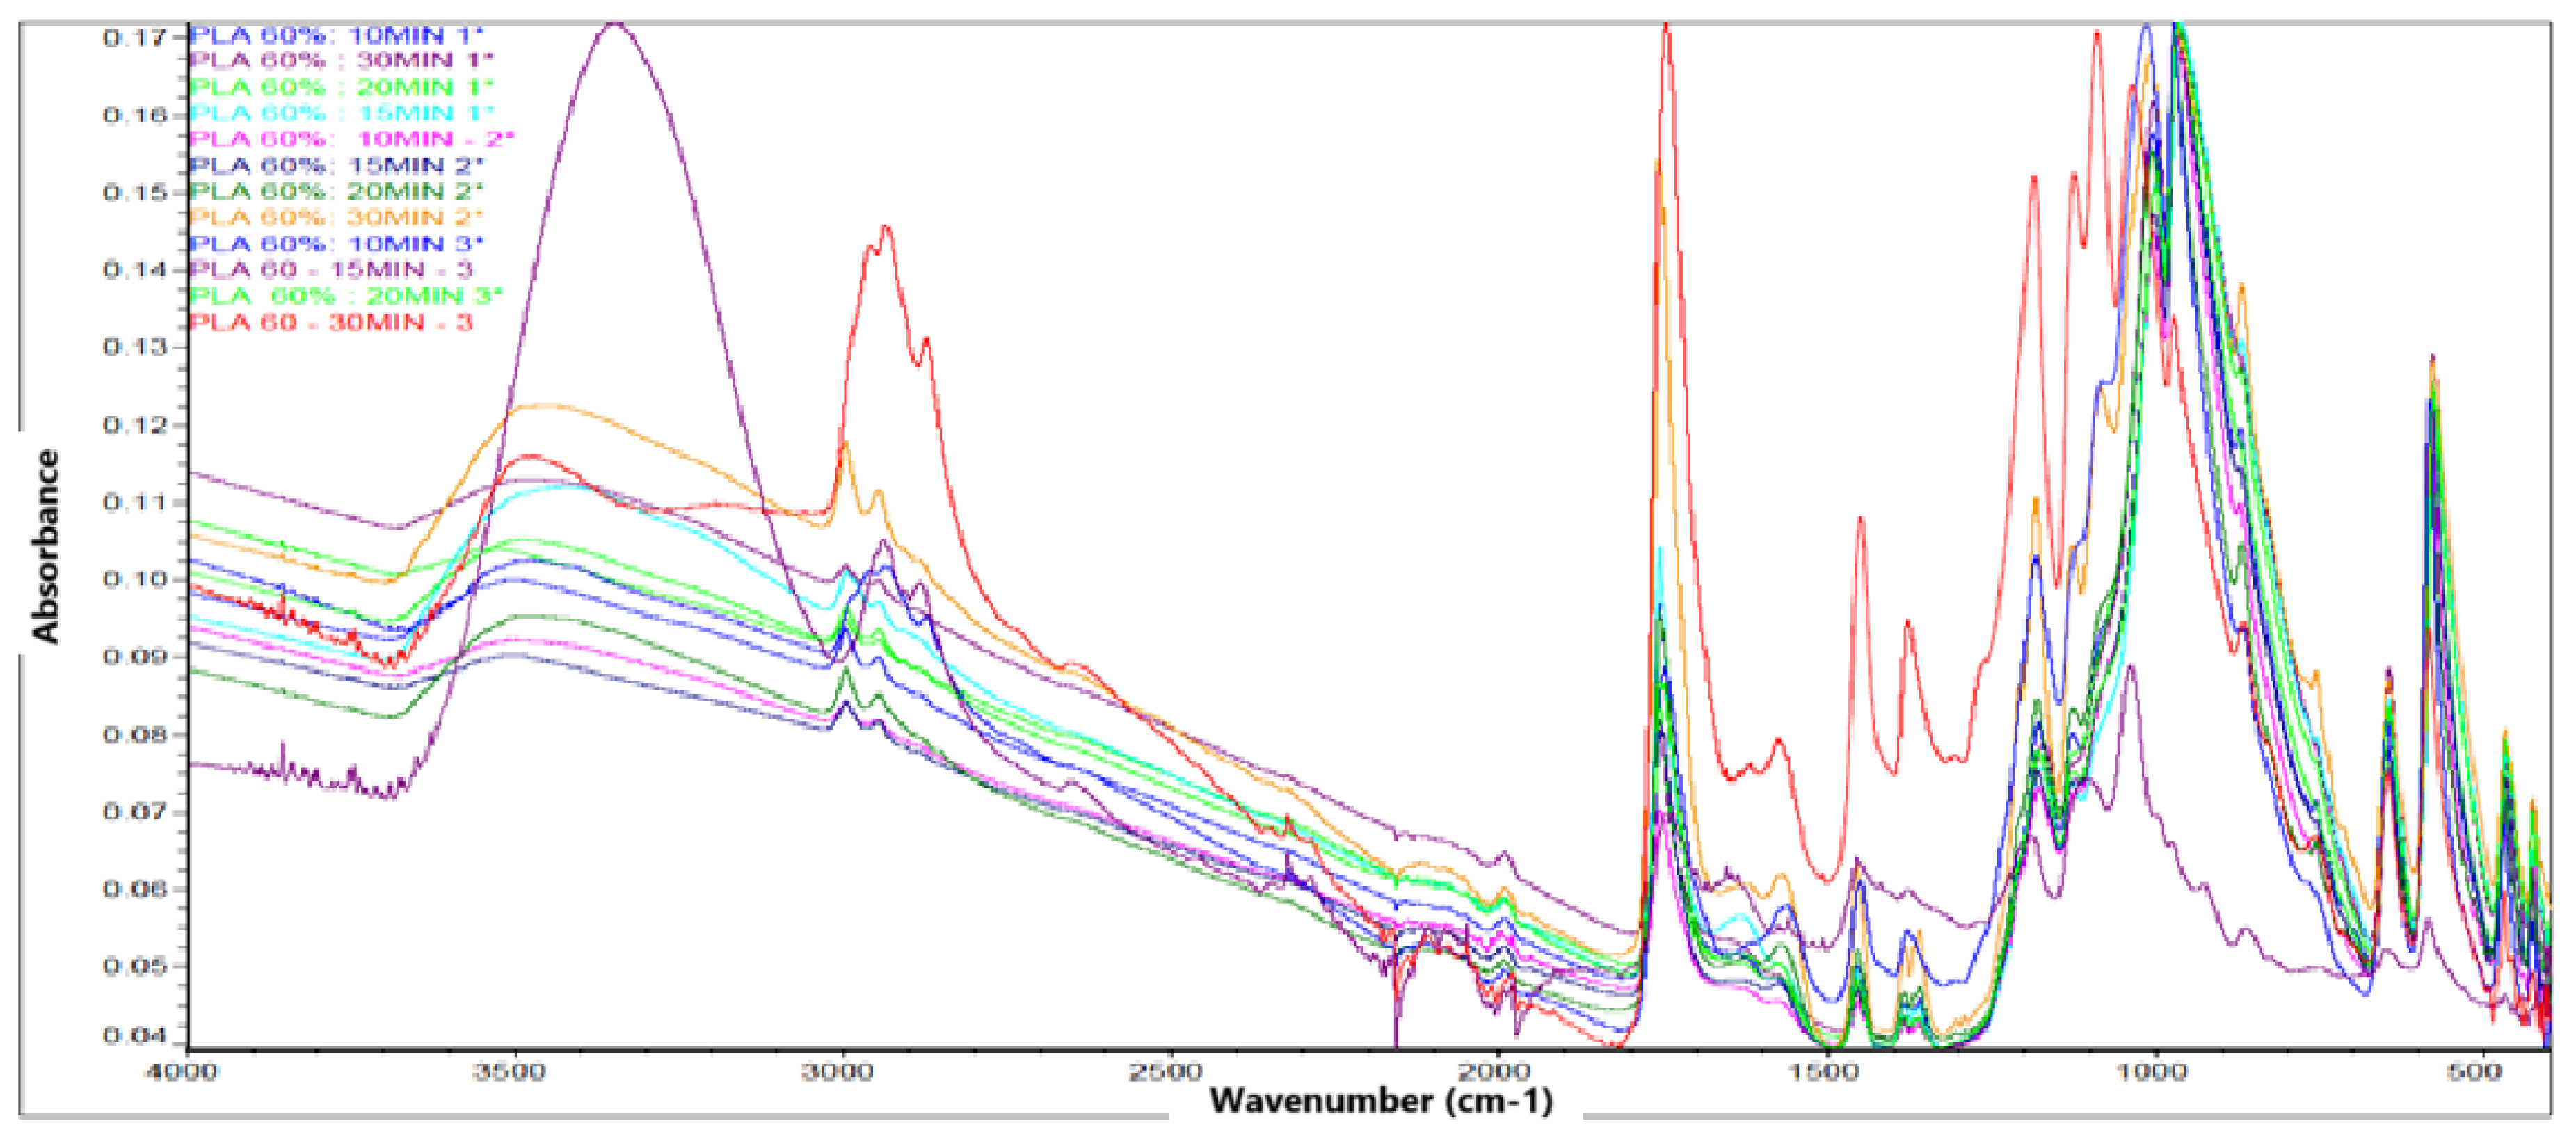
The FTIR spectrum obtained for PLA samples synthesized under 60% concentration conditions and different reaction times (10, 15, 20 and 30 minutes) evidences the presence of the characteristic bands associated with the functional groups characteristic of polylactic acid, which confirms the formation of this biopolymer.
The Figure 5 show that in the 3000-2800 region, a set of bands attributed to the stretching vibrations of the methyl () and methylene (-) group, commonly present in the main chain of PLA, is observed. These bands are indicative of the aliphatic structure of the polymer. The presence of an intense and well-defined band in the 1750-1735 region confirms the stretching vibration of the carbonyl (C=O) group of the ester, which is a distinctive sign of the PLA structure. This band is clearly identifiable in all samples, which supports the effective formation of the polymer. Signals are also identified in the 1180-1080 region, corresponding to the asymmetric and symmetric stretching vibrations of the C-O-C bond, characteristic of the ester group. These bands, together with those observed around 1450 (bending of the group), consolidate the spectroscopic evidence of the presence of PLA in the analyzed samples. The reproducibility of the spectra over different reaction times and replicates indicates that, despite variations in experimental conditions, the chemical structure of PLA is conserved. No extraneous signals or bands attributable to impurities or unwanted intermediates are observed, suggesting an adequate synthesis of the polymer under the established parameters.
Figure 5.
FTIR spectrum of PLA.
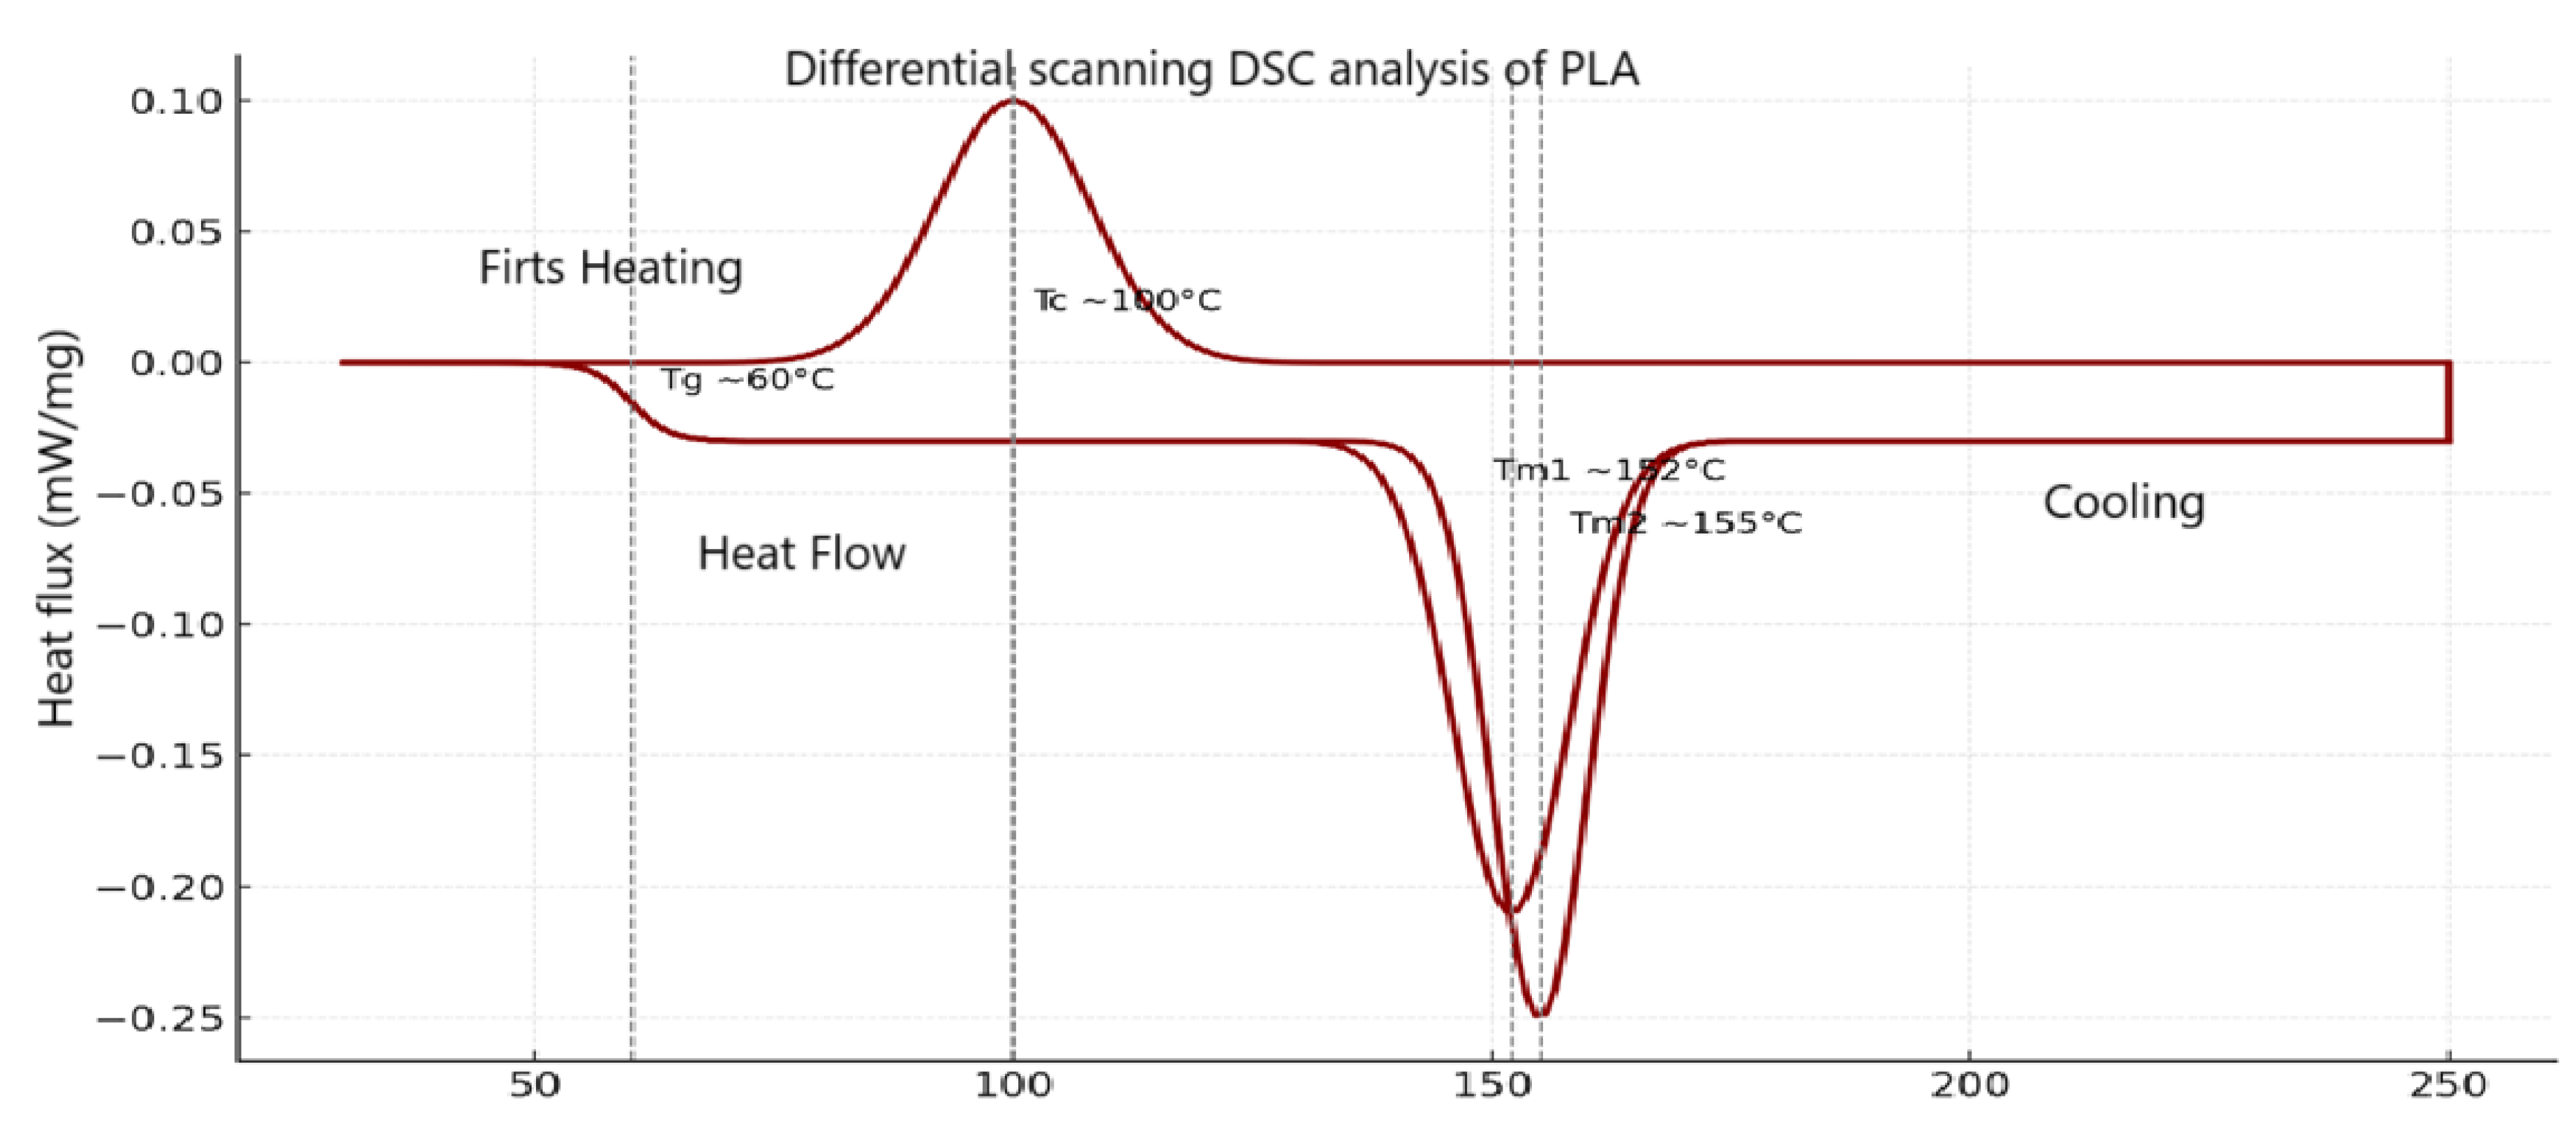
In the differential thermal analysis (DSC) of PLA under different experimental conditions of concentration (40% and 60%) and reaction time (10, 20 and 30 minutes). The Figure 6 shows the following observations: Glass Transition Temperature (Tg): a characteristic drop near 60 °C is observed, which is consistent with the thermal behavior of polylactic acid, indicating the onset of molecular mobility in the amorphous phase. Cold Crystallization Temperature (Tc): The treatment at lower concentration and time, present an exothermic peak around 100 °C, signaling the structural reorganization of the polymer. Melting Temperature (Tm): Endothermic peaks are detected between 152 °C and 155 °C, corresponding to the melting of the PLA crystalline phase. The “60% - 30 min” condition presented a higher melting point, which could be related to a higher crystallinity induced by the thermal and catalytic treatment. This analysis suggests that both catalyst concentration and reaction time affect the thermal structure of the synthesized PLA, evidenced by shifts in Tg, Tc and Tm.
Figure 6.
Differential scanning DSC analysis of PLA.
4. Discussion
The results obtained indicate that the concentration of sulfuric acid used in the synthesis of polylactic acid (PLA) significantly influences the performance of the polymer. Two-factor analysis of variance (ANOVA) revealed that the concentration variable had a p-value of 0.032 (Table 3), indicating a statistically significant difference in the final PLA mass between the concentration levels evaluated (40% and 60%). In contrast, reaction time, with a p = 0.196, did not show a statistically significant effect on the yields obtained. This finding suggests that, within the range studied (10 to 30 minutes), variation in time is not a determining factor in increasing PLA production.
The literature supports the importance of controlling catalyst concentration during PLA synthesis. [36,44,45] also identified concentration as a critical variable in polymer yield; however, in their study, reaction time had a significant impact. This discrepancy could be attributed to differences in experimental conditions, such as the synthesis method used or the stage of lactide obtaining, which can modify the overall kinetics of the process.
From a quantitative approach, the 40% concentration allowed a higher average yield (1.25%) to be achieved compared to the 60% concentration (0.923%). Among the most notable samples are M11 (1.47%), M5 (1.27%), and M10 (1.02%). The trend observed in the bar chart with confidence intervals (Figure 4) reinforces this observation, showing a clear superiority in yields under the 40% condition, especially in short reaction times (10 and 15 minutes). This difference could be explained by more efficient formation of reactive intermediates and less degradation of intermediate products, a phenomenon that usually occurs at excessively high acid concentrations, as pointed out by Hoyos (2012).
FTIR spectroscopic analysis confirmed the presence of the main functional groups characteristic of PLA, such as carbonyl (C=O), methyl (), ether (C–O), and hydroxyl (OH), in accordance with the chemical structure reported by [30,46]. It is important to note that, under the condition of 40% concentration, the absorption bands were sharper and more intense, suggesting greater purity or better structural definition of the synthesized polymer.
The DSC curve of PLA shows a glass transition temperature (Tg) close to 60°C, a crystallization peak around 100°C during cooling, and endothermic melting between 152 and 155°C during the second heating. These thermal events are characteristic of the semi-crystalline behavior of PLA and are consistent with values reported in previous studies by [42,47,48]; where Tg varies between 55 and 65 °C and Tm between 150 and 160 °C, depending on the degree of crystallinity and the thermal conditions applied. These results confirm the ability of PLA to reorganize its structure under controlled thermal cycles.
Taken together, the experimental results allow us to establish a clear correlation between the acid concentration and the structural and thermal quality of the PLA obtained. Although the reaction time did not show a statistically significant effect, the thermal and structural behavior of the polymer seems to benefit from moderate times and controlled concentrations. These findings are fundamental for optimizing the PLA synthesis process in future research.
5. Conclusions
The ANOVA statistical analysis revealed that the concentration of sulfuric acid used during polymerization is the only variable with significant effect on obtaining polylactic acid (PLA), with a value of Pr(>F) = 0.032, being the 40 % concentration the most efficient by reaching an average yield of 1.23 %, compared to 0.92 % recorded with 60 %. In contrast, the heating time variable (10, 15, 20 and 30 minutes) did not present significant influence (Pr(>F) = 0.196), although the data suggest that times of 10 and 15 minutes could slightly favor PLA production. Similarly, the interaction between time and concentration did not show statistical significance (Pr(>F) = 0.175), ruling out a synergistic effect between both conditions. On the other hand, structural analysis by FTIR confirmed the presence of functional groups characteristic of PLA, while differential scanning calorimetry (DSC) allowed identifying a glass transition temperature (Tg) between 60-65 °C, a melting temperature (Tm) of 247.00 °C, and a cold crystallization temperature (Tcc) of 130.23 °C with a crystallization enthalpy of 28.83 J/g, indicating that the material obtained has a semi-crystalline nature and good thermal stability.
Author Contributions
Conceptualization: Jorge Amaya. and Y.Y.; methodology: Jorge Amaya.; software: Jorge Amaya; validation, Jorge Amaya; formal analysis: Jorge Amaya; investigation: Gabriela Vaca; resources: Gabriela Vaca.; data curation: Gabriela Vaca.; writing—original draft preparation: Gabriela Vaca.; writing—review and editing: Jorge Amaya.; visualization: Jorge Amaya; supervision: Jorge Amaya.; project administration: Jorge Amaya. All authors have read and agreed to the published version of the manuscript.
Funding
This research was funded by Salesian Polytechnic University, Cuenca Campus grant number XXX. and The APC was funded by Biodiversity Research and Assessment Group (GIVABI) of the Salesian Polytechnic University, Cuenca Campus.
Informed Consent Statement
Not applicable.
Acknowledgments
During the preparation of this study, the authors used the facilities of the Life Sciences Laboratory of the Universidad Politecnica Salesiana, Cuenca, for which they offer their sincere thanks to the university and the GIBAVI research group for the help provided The authors have reviewed and edited the results and assume full responsibility for the content of this publication.
Conflicts of Interest
Los autores declaran no tener ningún conflicto de intereses y Los financiadores no tuvieron ningún papel en el diseño del estudio; en la recopilación, análisis o interpretación de los datos; en la redacción del manuscrito; o en la decisión de publicar los resultados.
Abbreviations
| PLA | Polylactic acid |
| DSC | Differential Scanning Calorimetry |
| ANOVA | Analysis of Variance |
| Tg | Glass transition Temperature |
| Tm | Melting Temperature |
| FTIR | Fourier Transform Infrared Spectroscopy |
| GR | Reagent grade methanol |
| ROP | Ring-opening polymerization |
References
- Castro, M. Bioplásticos ganan fuerza en las estrategias de sustentabilidad; Pt-Mexico.com; Plastics Technology México, 2015.
- L, S.C.; A, R.S.; F, A.A. Ácido Poliláctico (PLA): Propiedades y Aplicaciones. inycomp [Internet]. 4 de enero de 2003 [citado 13 de octubre de 2024];5(1):16-2. Disponible en.
- Valerini, D.; Tammaro, L.; Benedetto, F.; Vigliotta, G.; Capodieci, L.; Terzi, R.; Rizzo, A. Aluminum-doped zinc oxide coatings on polylactic acid films for antimicrobial food packaging. Thin Solid Films 2016, 645, 187–192. [Google Scholar] [CrossRef]
- Dechy-Cabaret, O.; Martin-Vaca, B.; Bourissou, D. Controlled ring-opening polymerization of lactide and glycolide. Chemical Reviews 2022, 104, 6147–6176. [Google Scholar] [CrossRef] [PubMed]
- Flores, P. La problemática del consumo de plásticos durante la pandemia de la covid-19». South Sustainability 2021, 1, 16. [Google Scholar] [CrossRef]
- Jesus. PLA y PLLA: Actualidad y casos de uso.
- Singla, P.; Mehta, R.; Upadhyay, S.N. Clay modification by the use of organic cations. Green and sustainable chemistry 2021, 2, 21–25. [Google Scholar] [CrossRef]
- Mendoza, I.R.C.; Riera, M.A. Ácido poliláctico: una revisión de los métodos de producción y sus aplicaciones. Publicaciones en Ciencias y Tecnología 2023, 16, 42–53. [Google Scholar]
- Gordobil, O.; Delucis, R.; Egüés, I.; Labidi, J. Lignina kraft como relleno en PLA para mejorar la ductilidad y las propiedades térmicas. Cultivos y Productos Industriales 2020, 72, 46–53. [Google Scholar] [CrossRef]
- Cárdenas, H.T. Obtención de Ácido Poliláctico (PLA) Utilizando Ácido Láctico de Origen Biológico Fermentado por Cepas de Lactobacillus Casei y Staphylococcus Aureus en un Biorreactor PFTR, 2019.
- Tawakkal, I.S.; Cran, M.J.; Miltz, J.; Bigger, S.W. A review of poly (lactic acid)-based materials for antimicrobial packaging. Journal of food science 2021, 79, 1477–1490. [Google Scholar] [CrossRef]
- Schaller, C. Polimerización con apertura de anillo. LibreTexts Español.https://espanol.libretexts.org/Quimica/Qu2022.
- Fang, Y.; Zhang, Y.; Zhou, W.; Qiu, F. Synthesis of Poly(L-lactide) via Solvothermal Method. International Journal of Polymer Science 2009, 2009, 1–6. [Google Scholar] [CrossRef]
- Ibrahim, N.; Shamsuddin, A.N. High molecular weight of polylactic acid (PLA): A review on the effect of initiator. Malaysian Journal of Chemical Engineering and Technology 2020, 3, 22–29. [Google Scholar] [CrossRef]
- Singhvi, M.S.; Gokhale, D.V. Polylactic acid: Synthesis and biomedical applications. Journal of Applied Microbiology 2019, 127, 1612–1626. [Google Scholar] [CrossRef]
- Kucharczyk, P.; Matysiak, W.; Rydz, J.; Wolna, R.; Janeczek, H.; Musioł, M. Poly(lactic Acid): A Versatile Biobased Polymer for the Future with Multifunctional Properties—From Monomer Synthesis, Polymerization Techniques and Molecular Weight Increase to PLA Applications. Polymers 2021, 13, 1822. [Google Scholar] [CrossRef]
- Pinzón, M.N.M. Optimización del proceso de síntesis de ácido poliláctico (PLA) mediante polimerización por apertura de anillo (ROP) de lactida asistida por extrusión reactiva (REX; Universitat Politècnica de València, 2024.
- Ma, X.; Wu, N.; Liu, P.; Cui, H. Fabrication of highly efficient phenylphosphorylated chitosan bio-based flame retardants for flammable PLA biomaterial. Carbohydrate Polymers 2022, 287, 119317. [Google Scholar] [CrossRef] [PubMed]
- Achmad, F.; Yamane, T.; Quan, S.I.; Tsutsumi, Y. Synthesis of polylactic acid by direct polycondensation under vacuum without catalysts, solvents and initiators. Macromolecular Research 2009, 17, 935–939. [Google Scholar] [CrossRef]
- Jiménez-Sánchez, A.; Cumbe-Gordillo, D.; Herrera-Cortés, M.; Hernández-Gil, L.; Rodríguez-Larraburu, E.; Gutiérrez-Quiroz, C. Determinación de las condiciones óptimas en la obtención de ácido poliláctico para la elaboración de biomateriales. Identidad Bolivariana 2021, 1. [Google Scholar] [CrossRef]
- Marra, A.; Silvestre, C.; Duraccio, D.; Cimmino, S. Películas biocompuestas de ácido poliláctico/óxido de zinc para aplicaciones de envasado de alimentos. Revista internacional de macromoléculas biológicas 2022. [Google Scholar]
- Mallegni, N.; Phuong, T.V.; Coltelli, M.B.; Cinelli, P.; Lazzeri, A. flexibles biodegradables y resistentes al desgarro basadas en ácido poliláctico (PLA) mediante extrusión de película soplada. Materials 2024, 11, 148. [Google Scholar] [CrossRef]
- Jiménez, P.; Gabriela, J. Análisis del Marco Normativo de Economía Circular en Ecuador Orientado al Sector de los Plásticos. FIGEMPA: Investigación y 2022, Desarrollo,13, 37–47. [Google Scholar] [CrossRef]
- Laura, P. Por qué la contaminación por plásticos se convirtió en una crisis mundial. National Geographic 2018. [Google Scholar]
- Izaguirre, J. Bioplásticos, no todos son biodegradables Cuaderno de Cultura Científica, 2014.
- La industria plástica en Ecuador tiene un crecimiento sostenido; Plastiflan. 2023.
- Mülhaupt, R. Green polymer chemistry and bio-based plastics: Dreams and reality. Macromolecular Chemistry and Physics 2017, 214, 159–174. [Google Scholar] [CrossRef]
- Chaudhary, V.; Thakur, N.; Chaudhary, S.; Bangar, S.P. , Remediation plan of nano/microplastic toxicity in food. In Advances in Food and Nutrition Research; Özogul, E.F., Ed.; Academic Press, 2021; Vol. 103, pp. 397–442. [CrossRef]
- Chuensangjun, C.; Pechyen, A.; Sirisansaneeyakul, S. Degradation Behaviors of Different Blends of Polylactic Acid Buried in Soil. Energy Procedia 2023, 34, 73–82. [Google Scholar] [CrossRef]
- Hoyos, S. Síntesis y Caracterización de Ácido Poli l-láctico de bajo peso molecular para aplicaciones biomédicas.
- Barba, V. Obtención de Poli(Ácido Láctico) a partir de lactosuero de quesería asistido por microondas.
- Zhang, Y.; Li, X.; Wang, Y.; Liu, J.; Wang, H. Development of PLA/Lignin Bio-Composites Compatibilized by Ethylene Glycol Diglycidyl Ether and Poly (ethylene glycol) Diglycidyl Ether. Polymers 2023, 15, 4049. [Google Scholar] [CrossRef]
- Xie, Y.; Zhang, J.; Li, Y.; Wang, Q.; Li, J. Polylactic acid-based wood-plastic 3D printing composite and its properties. BioResources 2023, 18, 1234–1245. [Google Scholar]
- Kim, S.; Lee, J.; Park, H.; Choi, Y.; Kim, H. Multifunctional lignin-poly (lactic acid) biocomposites for packaging applications. Frontiers in Bioengineering and Biotechnology 2022, 10, 1025076. [Google Scholar] [CrossRef]
- Wang, L.; Zhao, Y.; Chen, X.; Liu, Z.; Li, M. Effect of desulfonation of lignosulfonate on the properties of poly(lactic acid)/lignin composites. BioResources 2023, 18, 2345–2356. [Google Scholar]
- Imbago, M.A.R. Evaluación de la polimerización del ácido láctico en ácido poliláctico, mediante el método apertura de anillo (ROP) para establecer su comportamiento como un biopolímero, 2020.
- Giaroli, G.N.; Maggioni, A.A. Producción de poliacidoláctico por rop en la provincia de buenos aires. estudio de prefactibilidad, universidad nacional de cuyo facultad de ciencias aplicadas a la industria, 2021. recuperado de.
- Zych, A.; Perotto, G.; Trojanowska, D.; Tedeschi, G.; Bertolacci, L.; Francini, N.; Athanassiou, A. Ácido poliláctico superresistente plastificado con éster metílico de aceite de soja epoxidado para envases flexibles de alimentos. ACS Applied Polymer Materials 2019, 3, 5087–5095. [Google Scholar] [CrossRef]
- Mata-Miranda, M.M.; Guerrero-Robles, C.I.; Rojas-López, M.; Delgado-Macuil, R.J.; González-Díaz, C.A.; Sánchez-Monroy, V.; Pérez-Ishiwara, D.G.; Vázquez-Zapién, G.J. Componentes principales mediante espectroscopia FTIR como técnica de caracterización innovadora durante la diferenciación de células madre pluripotentes a células pancreáticas. Revista Mexicana de Ingeniería Biomédica 2021, 38, 25–32. [Google Scholar] [CrossRef]
- Schick, C. Calorimetría diferencial de barrido (DSC) de polímeros semicristalinos. Química analítica y bioanalítica 2020, 395, 1589–1611. [Google Scholar]
- Kricheldorf, H.R. Syntheses and application of polylactides. Chemistry and Biochemistry of Polymers 2017, 1–42. [Google Scholar] [CrossRef]
- Auras, R.A.; Harte, B.; Selke, S.; Hernandez, R. Propiedades mecánicas, físicas y de barrera de películas de poli(lactida. Journal of plastic film & sheeting 2022, 19, 123–135. [Google Scholar]
- Campaña, O.; Guerrero, V. Caracterización Mecánica y Térmica de Ácido Poliláctico (PLA. Reforzado con Polvo de Bambú (PB).
- Vert, M.; Schwach, G.; Engel, R.; Coudane, J. Something new in the field of PLA? Journal of Controlled Release 2020, 72, 31–38. [Google Scholar]
- Asadi, S.; Pirsa, S. Production of biodegradable film based on polylactic acid, modified with lycopene pigment and TiO2 and studying its physicochemical properties. Journal of Polymers and the Environment 2019, 28, 433–444. [Google Scholar] [CrossRef]
- Albertsson, A.C.; Varma, I.K. Recent developments in ring opening polymerization of lactones for biomedical applications. Biomacromolecules 2020. [Google Scholar] [CrossRef] [PubMed]
- Jamshidian, M.; Tehrany, E.A.; Imran, M.; Jacquot, M.; Desobry, S. Poly-Lactic Acid: Production, applications, nanocomposites, and release studies. Comprehensive Reviews in Food Science and Food Safety 2010, 9, 552–571. [Google Scholar] [CrossRef] [PubMed]
- Nampoothiri, K.M.; Nair, N.R.; John, R.P. An overview of the recent developments in polylactide (PLA) research. Bioresource Technology 2010, 101, 8493–8501. [Google Scholar] [CrossRef]
Disclaimer/Publisher’s Note: The statements, opinions and data contained in all publications are solely those of the individual author(s) and contributor(s) and not of MDPI and/or the editor(s). MDPI and/or the editor(s) disclaim responsibility for any injury to people or property resulting from any ideas, methods, instructions or products referred to in the content. |
© 2025 by the authors. Licensee MDPI, Basel, Switzerland. This article is an open access article distributed under the terms and conditions of the Creative Commons Attribution (CC BY) license (https://creativecommons.org/licenses/by/4.0/).
Copyright: This open access article is published under a Creative Commons CC BY 4.0 license, which permit the free download, distribution, and reuse, provided that the author and preprint are cited in any reuse.


