Submitted:
03 June 2025
Posted:
16 June 2025
You are already at the latest version
Abstract
Process validation is a critical element in pharmaceutical manufacturing, ensuring consistent product quality and regulatory compliance. This paper examines these guidelines in detail and highlights the transition from traditional validation methods to Quality by Design (QbD)-driven strategies. By integrating QbD principles with digital tools and lifecycle management, pharmaceutical manufacturers can enhance process understanding, reduce variability, and achieve higher product quality. This technical review highlights the critical role of Quality by Design (QbD) methodologies in enhancing pharmaceutical process validation. QbD employs Design of Experiments (DOE) and Multivariate Data Analysis (MVA) to develop predictive models that improve product and process understanding throughout the product lifecycle. DOE systematically investigates the influence of process variables on critical quality attributes, enabling optimization and robust control strategy development, as demonstrated by case studies in crystallization and blending processes. MVA techniques further support process optimization by analyzing complex multi-parameter data to identify critical process parameters and predict product quality. The integration of digital tools and electronic data platforms facilitates efficient data collection and analysis, enhancing continuous process verification and control. This review underscores the transformative impact of digital QbD applications in achieving consistent, high-quality pharmaceutical manufacturing compliant with evolving regulatory expectations.
Keywords:
process validation
; regulatory guidelines
; quality by design (QbD)
; design of experiments (DOE)
1. Introduction
Process validation is a fundamental requirement in pharmaceutical manufacturing, ensuring that products are consistently produced with the desired quality. Regulatory bodies, including the FDA, EMA, TGA and China’s CDE, have established guidelines for process validation to safeguard public health. Quality by Design (QbD) approach to pharmaceutical manufacturing is intended to increase process capability and reduce product variability and defects by enhancing product and process design, understanding, and control. This article breaks down the key aspects of process validation, covering regulatory guidance, lifecycle stages and digital QbD approach for validation.
2. Regulatory Definitions and Guidelines
Quality assurance in pharmaceutical manufacturing is not limited to in-process and finished-product testing. Instead, a holistic approach is required to control the entire manufacturing process. Process validation ensures that the production process is reliable, predictable, and maintains product integrity. Regulatory agencies advise validating all critical processing steps in a manufacturing step including weighing, measuring, mixing, blending, filling, packaging and labelling. Different regulatory agencies provide definitions and expectations for process validation. A comparison of regulatory agency guidance on process validation from key regulatory agencies is given in Table 1 [1,2,3,4,5,6].
FDA proposes a lifecycle and risk-based approach to process validation, encouraging QbD, PAT, and continuous monitoring [1]. EMA closely aligns with FDA but emphasizes clear documentation and regulatory submission data [2].TGA follows PIC/S guidance, aligning with FDA/EMA best practices, with some regional flexibility [4]. CDE (China) has traditionally emphasized pre-approval commercial-scale validation but is shifting toward more science- and lifecycle-based principles [6].
The implementation of QbD is described through the International Conference on Harmonization Technical Requirements for Pharmaceuticals for Human Use Guidance documents Q8, Q9, and Q10 [7,8,9]. Regulatory agencies have recognized that, not increased testing, but science and risk-based approach built through the life cycle of the product brings quality to product [10].
3. Life Cycle Approach
The Lifecycle Approach to Process Validation is a modern, science- and risk-based strategy endorsed by regulatory agencies, aiming to ensure consistent product quality throughout a product’s commercial life. Lifecycle appraoch enhances process understanding and helps with proactive risk management. It also provides regulatory flexibility for post approval changes and encourages continuous improvement. The life cycle approach to process validation consists of three stages [10]:
3.1. Stage 1: Process Design
This phase involves defining the product and the process based on thorough understanding of the customer needs and product efficacy. Key activities include:
- Determining Critical Quality Attributes (CQAs) and Critical Material Attributes (CMAs) through product knowledge and process understanding.
- Defining the commercial process through establishing process steps, identifying equipment, and conditions.
- Identifying critical process parameters (CPPs) by defining acceptable ranges such as Proven Acceptable Ranges (PAR) and Normal Operating Ranges (NOR).
- Defining the In-Process Controls (IPCs) and incorporating real-time monitoring during manufacturing to detect deviations early.
- Documenting the control strategy through Process Development Report (PDR) or Process Design Document (PDD) to outline manufacturing controls.
3.1.1. Control Strategy
A robust control strategy ensures that process parameters remain within acceptable limits which identifies a Design Space (Combination of CPP limits ensuring CQAs remain within specifications through Desing of Experiments, Fate and Purge studies, PAR (Proven Acceptable Range) and NOR (Normal Operating Range) studies) and a Control Space (Narrower NORs established to maintain process consistency) [11,12,13].
For example, a Design Space can be Temperature range of 50°C–70°C ensures acceptable product and a Control Space will be Narrowed to 55°C–65°C to reduce variability.
3.2. Stage 2: Process Qualification
This phase ensures that the manufacturing process performs as expected on a commercial scale. Process Qualification consists of:
- Process Risk Assessments Utilizing tools such as Failure Modes and Effects Analysis (FMEA) and Cause-Effect Matrices to identify risks.
- Qualification of all facility, utility, equipment and methods designed and developed for the manufacturing of the product.
- Identifying the number of batches and defining the validation acceptance criteria and delivering process performance qualification (PPQ)
Examples of documents produced during this stage includes, Risk Assessments, Process Validation Master Plan (PVMP), PPQ protocols, and reports. Process Performance Qualification (PPQ) demonstrates reproducibility and consistency across batches, defining the number of batches, sample sizes and proper sampling techniques.
3.2.1. Number of Validation Batches
Justification for the number of batches in a validation study is a requirement as the three batches approach does not satisfy the current regulatory expectations. Manufacturers should base their decision on a risk-based approach, considering factors like product and process knowledge, control strategy, and overall process risk, aiming for a statistically robust demonstration of reproducibility and consistent performance [1].
Statistical methods, such as tolerance intervals and process capability indices, can be used to determine the required number of batches to achieve a desired level of confidence. A QbD approach, which focuses on understanding the process and product, can lead to a more robust process and potentially reduce the number of batches required for validation. A Failure Mode and Effects Analysis (FMEA) or other Quality Risk Management (QRM) tools can help identify potential risks and inform the number of batches needed [14,15,16].
3.2.2. Acceptance Criteria
A successful Process Performance Qualification (PPQ) establishes the reliability of the commercial-scale manufacturing process and demonstrates that all manufacturing conditions and controls are in place through scientifically driven acceptance criteria. The following criteria should be included to demonstrate the consistency and robustness of the process during a PPQ execution [16,17].
- Enough batches are manufactured consecutively, meeting the analytical acceptance criteria
- All CPPs meet the established process range
- All IPCs meet the pre-defined acceptance criteria
- All homogeneity samples meet the acceptance criteria to prove the intra batch and inter batch consistency
- No critical or major deviations impacting the validation criteria occurred during execution
3.2.3. Sample Size
Determining sample size for process validation involves using statistical methods, considering risk, and ensuring the sample is representative of the population being studied. The number of samples should be adequate to provide sufficient statistical confidence of quality both within a batch and between batches. The confidence level selected can be based on risk analysis as it relates to the attribute under examination.
3.2.4. Considerations for Sample Selection
When selecting a sample, several key factors should be considered to ensure it accurately represents the target population and allows for meaningful statistical analysis [19,20].
- Random Sampling: Ensure that each sample has an equal chance of being selected.
- Stratified Sampling: Select samples from different strata or groups within the population to ensure representation.
- Periodic Sampling: Select samples at regular intervals during the process.
- Sampling Location: Consider areas of poor blending, corners, and discharge points when sampling.
- Lot Sizes: Ensure that lot sizes used for validation activities are consistent with the lot sizes anticipated for production
3.3. Stage 3: Continued Process Verification (CPV)
The third stage of process validation is called continued process verification [1,14,16]. CPV ensures ongoing control of the validated process during routine production. Key Aspects of CPV includes;
- Risk-Based Monitoring through evaluating variability in raw materials and process parameters and establishes alert limits.
- Data Collection & Statistical Analysis using control charts, process capability analysis, and trend analysis.
- Conduct annual reviews and identifies when process changes require revalidation.
4. QbD Approach to Process Validation
The Quality by Design (QbD) methodology starts with the design of experiments (DoEs) and multivariate data analysis (MVDA) approaches to build predictive models based on available technology and analytical tools throughout the life cycle of a product [14]. Inclusion of QbD principles results in increased knowledge and understanding of the product and process which helps in specification setting (stage 1), also wealth of knowledge gained during development can result in improved control strategy (stage 2) which will help to reduce variability in routine manufacturing (stage 3) to enable consist of and robust product supply12.
Digital applications of QbD in validation relieve data collecting and evaluating data using electronic platforms to understand and improve the process validation and documentation. Vast amount of data collected throughout the lifecycle of the product when evaluated using data analysis tools can be used to improve the capability of the process. The evolution in the past decade in digital technology is revolutionizing how we can address the challenges of manufacturing complex drug substances and drug products. Several statistical software packages excel in Design of Experiments (DOE) and other statistical analysis. The best software choice depends on the specific needs and requirements of the user, including the complexity of the experiment, the type of data, and the desired level of analysis.
4.1. Design of Experiments (DOE) in Process Validation
Design of Experiments (DOE) is a structured statistical approach used to study and optimize manufacturing processes. DOE helps identify relationships between process variables and their impact on Critical Quality Attributes (CQAs) and Critical Process Parameters (CPPs).
For any DOE study the following concepts are to be defined13;
- Factors, Levels, and Responses
Factors are independent variables (e.g., temperature, pressure, mixing speed). Levels are the range of values at which factors are tested (e.g., 50°C, 60°C, 70°C). Responses are the dependent variables or outcomes (e.g., product yield, impurity levels).
- 2.
- Full Factorial vs. Fractional Factorial Designs
Full Factorial Design uses all possible combinations of factors at different levels which provides a complete interaction analysis, however, requires more resources and runs. Fractional Factorial Design uses only a subset of possible combinations which reduces resource consumption while capturing key interactions but missing some interactions.
DOE in Process Validation Stages is summarized in Table 2.
- Case Study: Application of DOE and Control Strategy for Desirable Particle Size
Objective: Optimize the crystallization procedure to obtain desirable particle size through impinging technique. The particle size requirement is very tight with D90 limited to 8-12 µm. Impinging uses the collision of high-velocity liquid jets to achieve rapid and homogeneous mixing, leading to the formation of smaller, more uniform crystals.
- Step 1: DOE Execution
The first step in a DoE study is to identify or short list the variables which could impact the response most. This study used response surface methodology using Solvent, Anti-Solvent, Pressure of application of the solution as Factors and D90 Particle size (µm) as Response. Full factorial design with 3 factors at 2 levels and three replicates at the middle point was used. The experimental design matrix is given in Table 3.
- Step 2: Data Analysis
Analysis performed using Modde DoE software has identified that parameters, anti-solvent volume, application pressure, interaction between anti solvent and pressure have significant effect on the particle size. The signicance of effect of all the three parameters on D90 particle size is shown below in Figure 1. Optimal conditions to meet the particle size criteria for D90 were identified and shown using contour plots (Figure 2).
The X-axis represents Pressure Normalized ranging from -1 to 1and the Y-axis is anti solvent normalized from -1 to 1. The Color gradient (Contour levels) represents the D90 [μm] values, with a scale from about 8 to 28 μm. Lower D90 values (8–12 μm) are observed in the bottom-right region, where Pressure is high (closer to +1) and anti Solvent is low (closer to -1)The "Target" marker (where the dashed black line intersects) indicates the optimum operating conditions to achieve a desired D90.This optimal region lies approximately at Pressure ≈ +0.3 to +0.8 and anti solvent (Reagent 2) ≈ -0.6 to -1.0.
- Step 3: Control Strategy Implementation
The third step is to define the normal operating range by tightening the solvent and anti-solvent amount within the design space to control variability. From the profile the control space identified as a region where the presure is between +0.3 to +0.6 of the normalized value and anti solvent is between -0.7 to -0.9.
In Summary, DOE and Control Strategy are integral to process validation to ensure robust and reproducible manufacturing processes. By applying DoE manufacturers can optimize processes and establish a scientifically justified control strategy by which regulatory expectations can be met while improving product consistency.
4.2. Multivariate Data Analysis
Multivariate analysis (MVA) in process validation leverages statistical techniques to analyze complex, multi-variable data, helping to understand and optimize processes, identify critical process parameters (CPPs), and ensure consistent product quality 17,18. Multivariate analysis enables root cause analysis by identifying correlation between variables.It is useful to build predictive models to forecast product quality based on process parameters.MVA models can monitor processes to detect potential deviations and out of control situations during CPV.
- Case Study: Application of Multivariate Analysis
Objective: Optimize the parameter to meet the Blend Uniformity (BU) criteria of RSD < 3.4 for a blending process (wet mix) in Rotocube, studying six parameters with only twelve experiments.
Rotocube wet mix process has multiple unit operations, namely liquid addition, wet mixing and vacuum drying in the same equipment controlled by a set recipe where each cycle has different parameters to monitor. The study included;
- Parameters: Impeller speed, Chopper Speed, Liquid addition rate, Jacket Temperature, Tilt, Mixing time
- Attributes tested: BU and LOD
Analysis performed using JMP software is given below. A predictive model with all the six parameters did not reveal significance to any of the parameters due to lack of fit. A model is as good as data or the understanding of it. Therefore, further optimization was done using the minimum Bayesian Information Criterion (BIC). The minimum BIC value indicates the best-fitting model when comparing different statistical models. A smaller BIC value suggests a better model, meaning it balances goodness of fit with model complexity to predict the responses.
Longer mixing time would impact the BU negatively. Therefore, controlling the total mixing time which is determined by the product temperature and LOD % complicate the optimization of the process to obtain desirable BU. Monitoring of the temperature of the product and the vaccum using Distributed Control System (DeltaV DCS) as shown in Figure 3 is used to determine the mixing time for an optimum value of BU. The optimal mixing time was identified as the time in Figure 3 when bowl vaccum start to decrease and product temperature increases. Further analysis was done by monitoring the Loss on Drying for the sample collected with different mixing time to verify the adequacy of the drying cycle. Installation of a Near-Infrared Spectroscopy (NIR) in-situ monitoring of the LOD had enabled effective determination of the mixing time as shown in Figure 4 which improved both BU and LOD prediction as well as control of these critical qualtiy atttributes without necessarily stopping the run for sample collection.
Therefore, the feedback obtained from the DCS analysis and PAT was used in re-evaluating the model to decide significant factors and parameters require monitoring for process validation.
The prediction profiles from the fitted model are given in Figure 5 and Figure 6. The analysis confirmed that Chopper speed did not impact the BU, however impeller speed and mixing time along with tilt seem to be significant.
In conclusion, better control for BU was established through in-situ monitoring of LOD to determine appropriate mixing time at a specific jacket temperature. Multivariate analysis and PAT tools help to identify optimal process conditions with minimal resources and establish a scientific basis for process control.
4.3. Statistical Process Controls
Process Capability Analysis, Hypothesis testing, and Statistical Process Control (SPC) are tools used in Stage 3: Continued Process Verification (CPV) to monitor and control the manufacturing process. These tools help detect variations, identify trends, and ensure the process remains within established limits 16, 17, 18.
Control charts are graphical tools used to monitor process stability over time. They help to determine whether a process is in control or if corrective actions are needed. X̄-R (Mean-Range) Chart and X̄-S (Mean-Standard Deviation) Chart are commonly used for process parameter monitoring.
- Case Study: Application of SPC
Objective: Monitoring the variability of Quality Attribute (QA) of an excipient.
This quality attribute property is considered critical to ensure the dissolution profile of a modified release drug product. Though the raw material test results were within the release criteria initially established for this raw material, a root cause analysis identified that the lots which were out of trend noted in the SPC chart has resulted in an out of specification limit for the dissolution profile in the finished good testing. Therefore, trending data and evaluating data using digital statistical tools connected to Laboratory Information Management Systems (LIMS) would enable identification of shift in the CMAs over time before its use in manufacturing thereby, saving money and time by eliminating usage of material which are trending differently, and we can avoid non-conformance.
Figure 6.
Prediction Profiler.
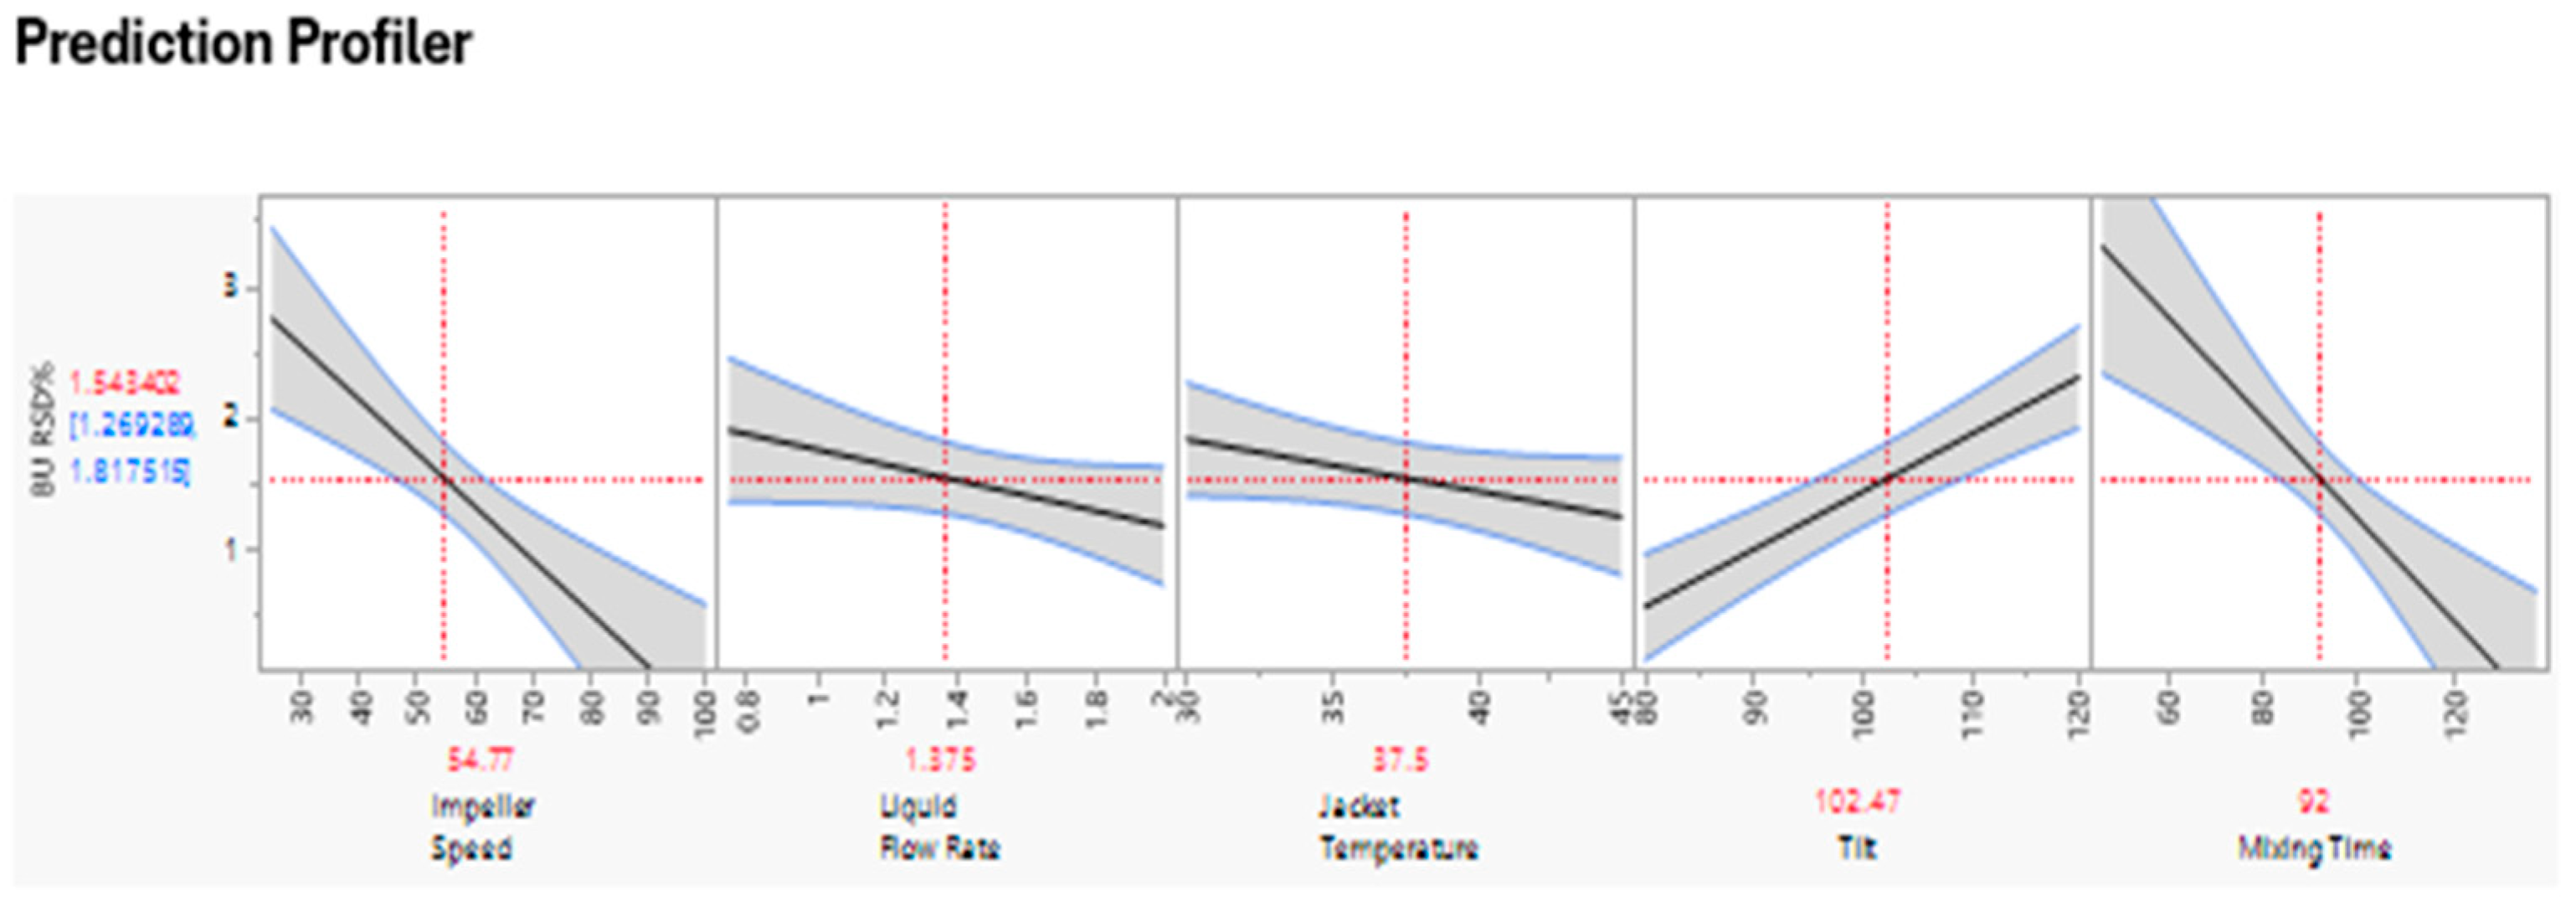
Figure 6.
IR Chart for monitoring Critical Raw Material Quality Attributes.
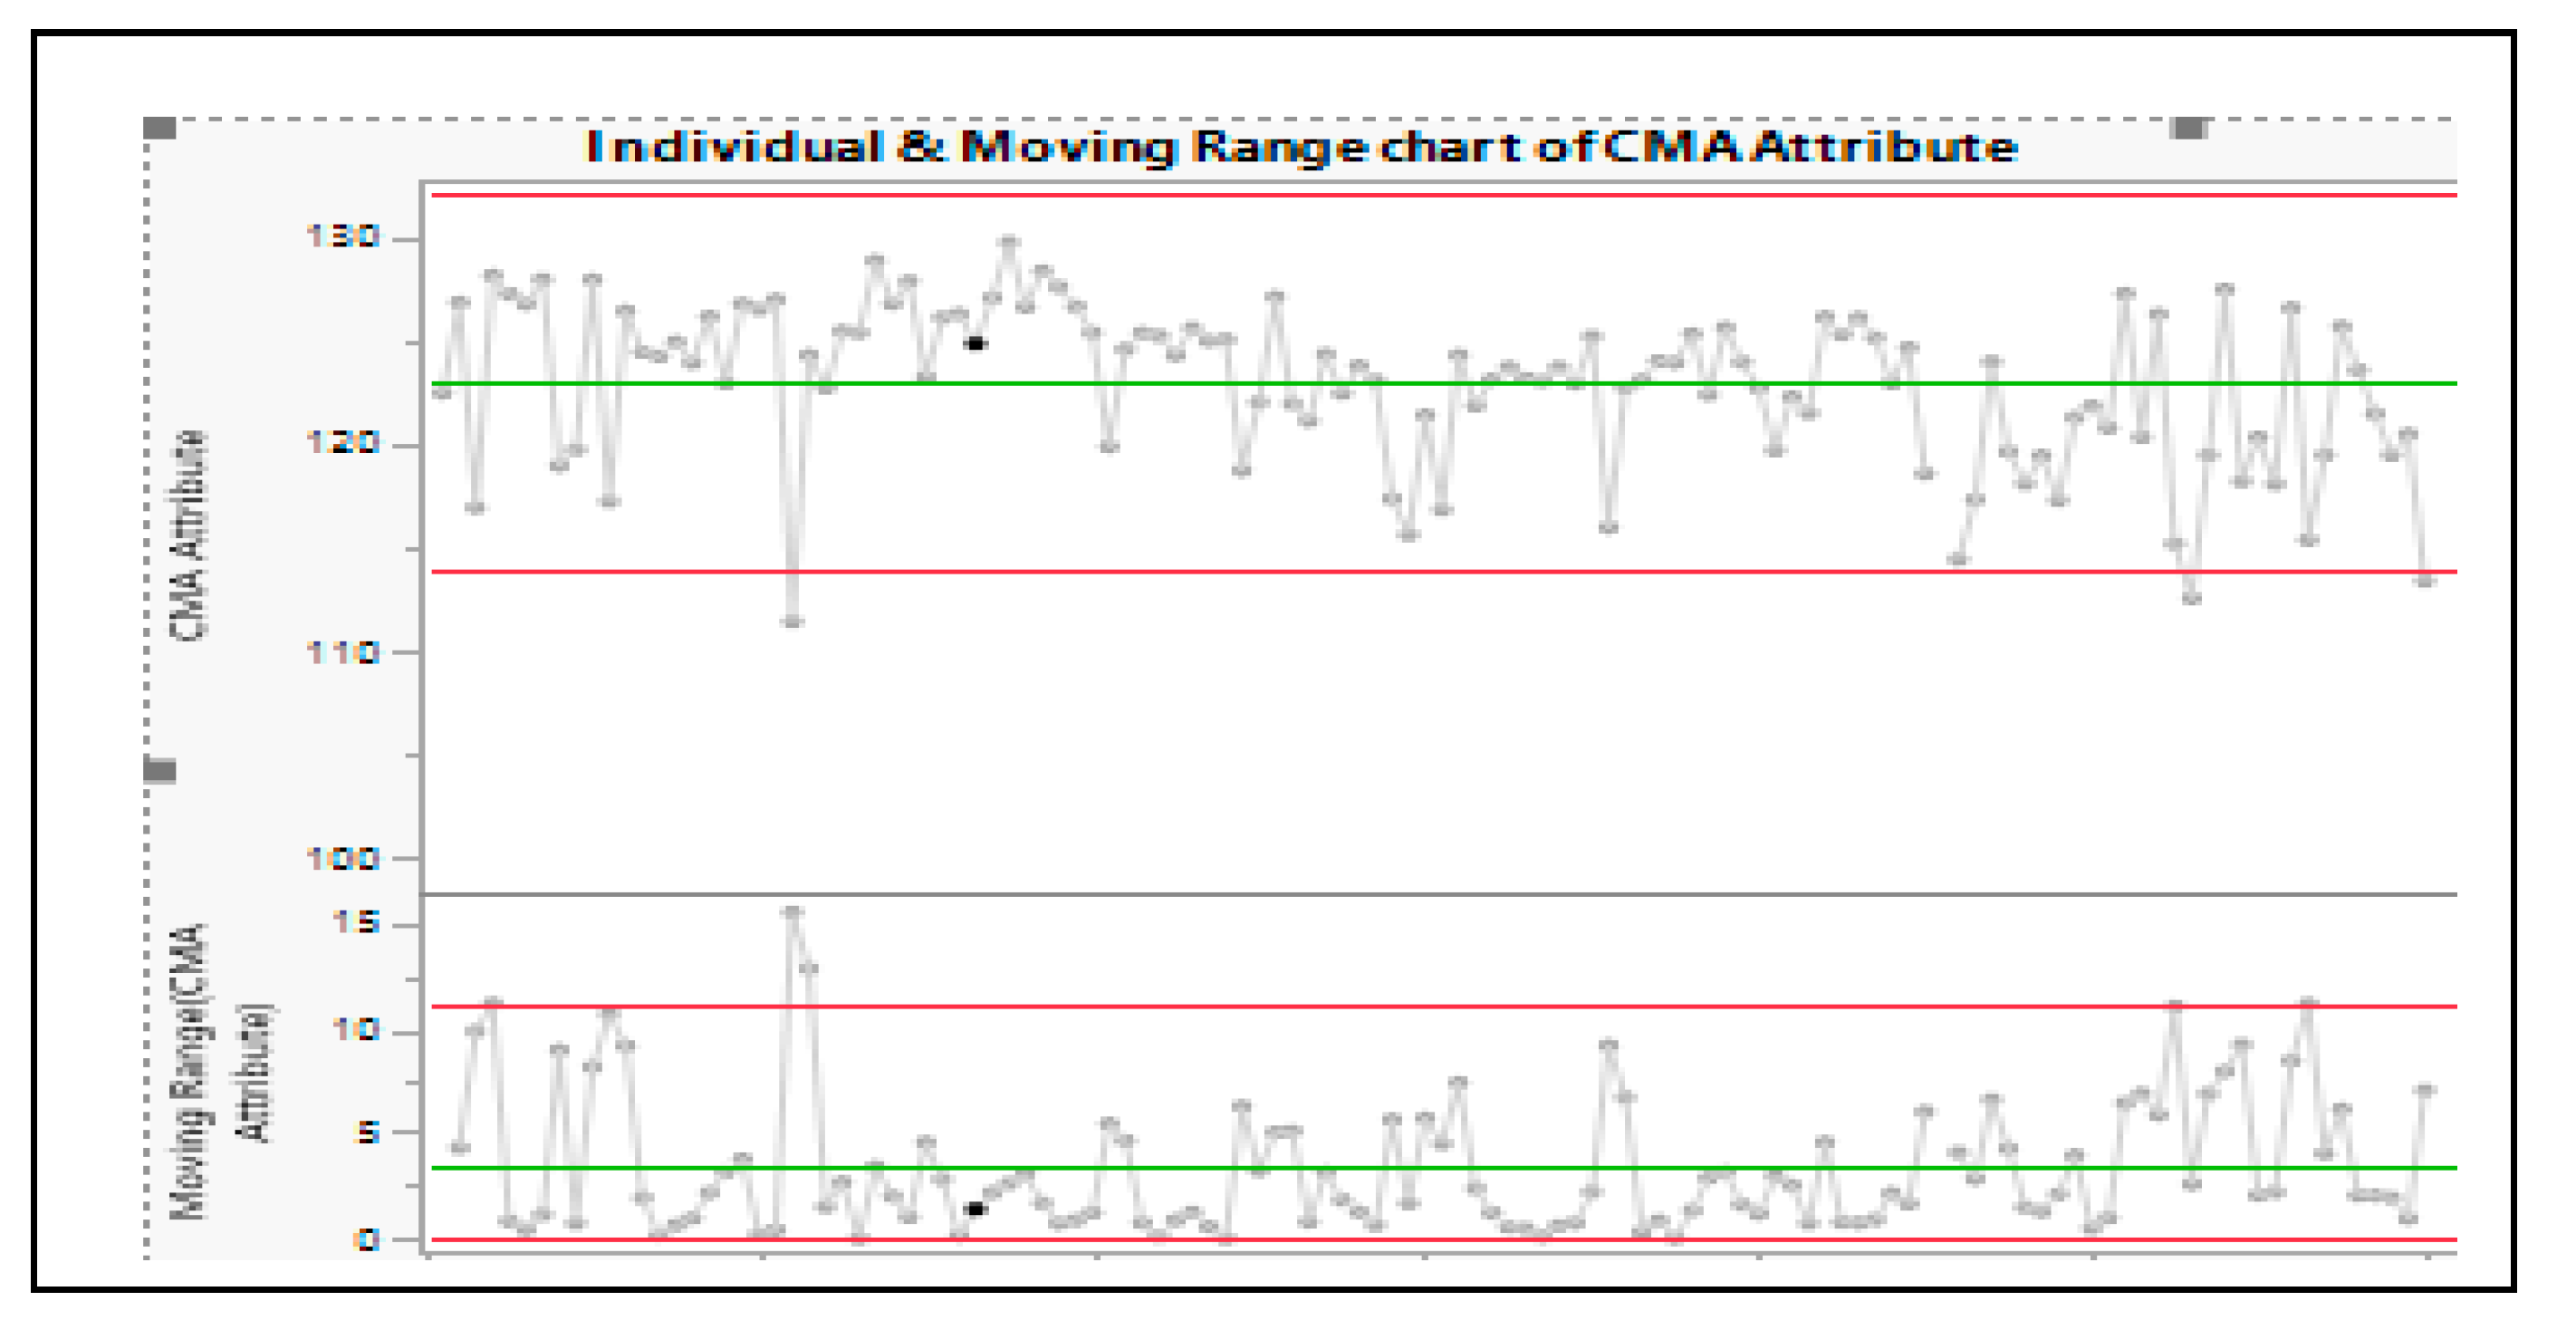
Monitoring of this critical attribute and identifying the correlation enabled tightening of the specification to ensure control of variability and quality of the product. Several other statistical tools including Hypothesis Testing (ex. t-test, Chi-Square test, ANOVA etc.) and Process Capability monitoring (Cpk and Ppk) can be used to analyze the consistency between manufacturing batches and to ensure that raw material and process variability are within acceptable limits. In general, the control charts help the in-line, on-line or at-line monitoring and when used for continuous process verification provides substantially more information and knowledge about the process and might facilitate process improvements.
In Summary, various digital tools can be employed at each stage of the life cycle approach. DoE softwares, QbD platforms, Modeling and Simulation tools are useful for modeling and understanding the process before commercial production. Laboratory Information Management Systems, Manufacturing Execution Systems, Distributed Control System etc can demonstrate that process performs reliably at scale. Statistical Process Controls, Advanced Analytics, Process Analytical Technology Tools are useful for continuous monitoring and control of process performance.
5. Conclusion
Process validation is a fundamental requirement in pharmaceutical manufacturing, ensuring that drugs meet regulatory and quality standards. A lifecycle-based approach, incorporating risk assessments and statistical analysis, helps manufacturers maintain product consistency while minimizing variability. By following FDA, EMA, TGA and other guidelines, companies can ensure compliance and achieve successful regulatory approvals. The successful implementation of QbD in pharmaceuticals ensures controlled manufacturing operations and predictable product outcomes by identifying optimal process conditions with minimal resources, establishing a scientific basis for process control and reducing process variability and improving product quality. Digital tools are increasingly integral to process validation, enabling smarter, faster, and more compliant manufacturing decisions.
Disclaimer
This technical paper is the result of independent research and does not include or rely on any proprietary, confidential, or unpublished data from the author’s current or former employers. All data, examples, and case studies presented are either publicly available, simulated, or generated for illustrative purposes only. The views and conclusions expressed are solely those of the author and do not reflect the policies, practices, or positions of any past or present affiliated organizations.
Acknowledgements
I would like to express my sincere gratitude to John. S for his invaluable guidance, insightful feedback, and unwavering support throughout the preparation of this manuscript. His mentorship greatly enhanced the quality and clarity of the work, and his encouragement played a key role in the successful completion of this article.
References
- Guidance for Industry: Process Validation: General Principles and Practices. U.S. Department of Health and Human Services, Food and Drug Administration, 2011 https://www.fda.gov/files/drugs/published/Process-Validation--General-Principles-and-Practices.pdf.
- European Medicines Agency's (EMA) guideline on process validation for finished products https://www.ema.europa.eu/en/process-validation-finished-products-information-data-be-provided-regulatory-submissions-scientific-guideline.
- Eudralex V.3 Guidelines on Process Validation for finished products https://www.gmp-compliance.org/files/guidemgr/WC500162136.pdf.
- Good Manufacturing Practice Requirements for Medicinal Products:PIC/S Guide to GMP PE009-16. https://www.tga.gov.au/resources/guidance/good-manufacturing-practice-gmp-requirements-medicinal-products-pics-guide-gmp-pe009-16.
- International Society for Pharmaceutical Engineering (ISPE) Good Practice Guide: Practical Implementation of the Lifecycle Approach to Process Validation https://ispe.org/publications/guidance-documents/good-practice-guide-process-validation.
- China Center for Drug Application (CDE) Q&A on Drug Application. https://resource.chemlinked.com.cn/baipharm/file/china-center-for-drug-evaluation-cde-qa-on-drug-application-baipharm.pdf.
- ICH (2005) ICH HarmonisedTripartite Guideline – Q9 Quality Risk Management. https://database.ich.org/sites/default/files/Q9_Guideline.pdf.
- ICH (2008) ICH HarmonisedTripartite Guideline – Q10 Pharmaceutical Quality System. https://database.ich.org/sites/default/files/Q10%20Guideline.pdf.
- ICH (2009) ICH HarmonisedTripartite Guideline - Q8(R2) Pharmaceutical Development. https://database.ich.org/sites/default/files/Q8_R2_Guideline.pdf.
- ICH (2019) ICH HarmonisedGuideline – Q12 Technical and Regulatory Considerations for PharmaceuticalProduct Lifecycle Management. https://www.fda.gov/regulatory-information/search-fda-guidance-documents/ich-q12-implementation-considerations-fda-regulated-products.
- R.A.Nash and A.H Wachter, Pharmaceutical Process Validation an International Third Edition. Revised and expanded, Marcel Dekkar, Inc., New York, 2003; 47 – 122 https://www.scribd.com/document/614228251/Pharmaceutical-Process-Validation.
- J. C. Menezes and C. Y. Yamakawa et.al, AAPS (2021) An industrial case study: QbD to accelerate time -to-market of a drug product. [CrossRef]
- Montgomery DC (2020) Design and analysis of experiments. 10th edn. John Wiley & Sons, New York. ISBN 978-1119722106 https://scribblitt.com/HomePages/Resources/442414/Design_And_Analysis_Of_Experiments_Montgomery_10th_Edition.pdf.
- International Society for Pharmaceutical Engineering (ISPE) (2011) Part1 - Product Realization using Quality by Design (QbD): Concepts and Principles. In: ISPE Guide Series: Product Quality Lifecycle Implementation(PQLI®) from Concept to Continual Improvement. https://ispe.org/publications/guidance-documents/pqli-qbd-illustrative.
- International Society for Pharmaceutical Engineering (ISPE) (2017) Volume7 – Risk-based manufacture of pharmaceutical products. 2nd ed.. https://ispe.org/publications/guidance-documents/risk-mapp-management-plan.
- PDA Technical Report No. 60 Process Validation: A lifecycle Approach. https://www.pda.org/bookstore/product-detail/1931-tr-60-process-validation.
- ISPE Evaluation of Impact of Statistical Tools on Process Valdiation-Discussion Paper https://ispe.org/sites/default/files/concept-papers/eva/statistical-tools-ppq-outcomes.pdf.
- X.Wang, A.Germansderfer, J.Harms, A.S. Rathore, Using Statistical Analysis for Setting Process Validation Acceptance Criteria for Biotech Products, Biotechnology Progress, V41. [CrossRef]
- Standard Practice for Demonstrating Aapability to Comply with a Lot Acceptance Procedure, ASTM E2709-11, 2011.
- Standard Practice for Demonstrating Capability to Comply with the Test for Uniformity of Dosage Units, ASTM E2810-11, 2011.
- Bergum JS, Utter ML. Process validation, encyclopedia of bio-pharmaceutical statistics. 3rd ed. New York: Marcel Dekker; 2010. p. 1070–82.
- Standard Guide for Specification, Design, and Verification of Pharmaceutical and Biopharmaceutical Manufacturing Systems and Equipment, ASTM-E2500-20.
Figure 1.
Significance of Effects
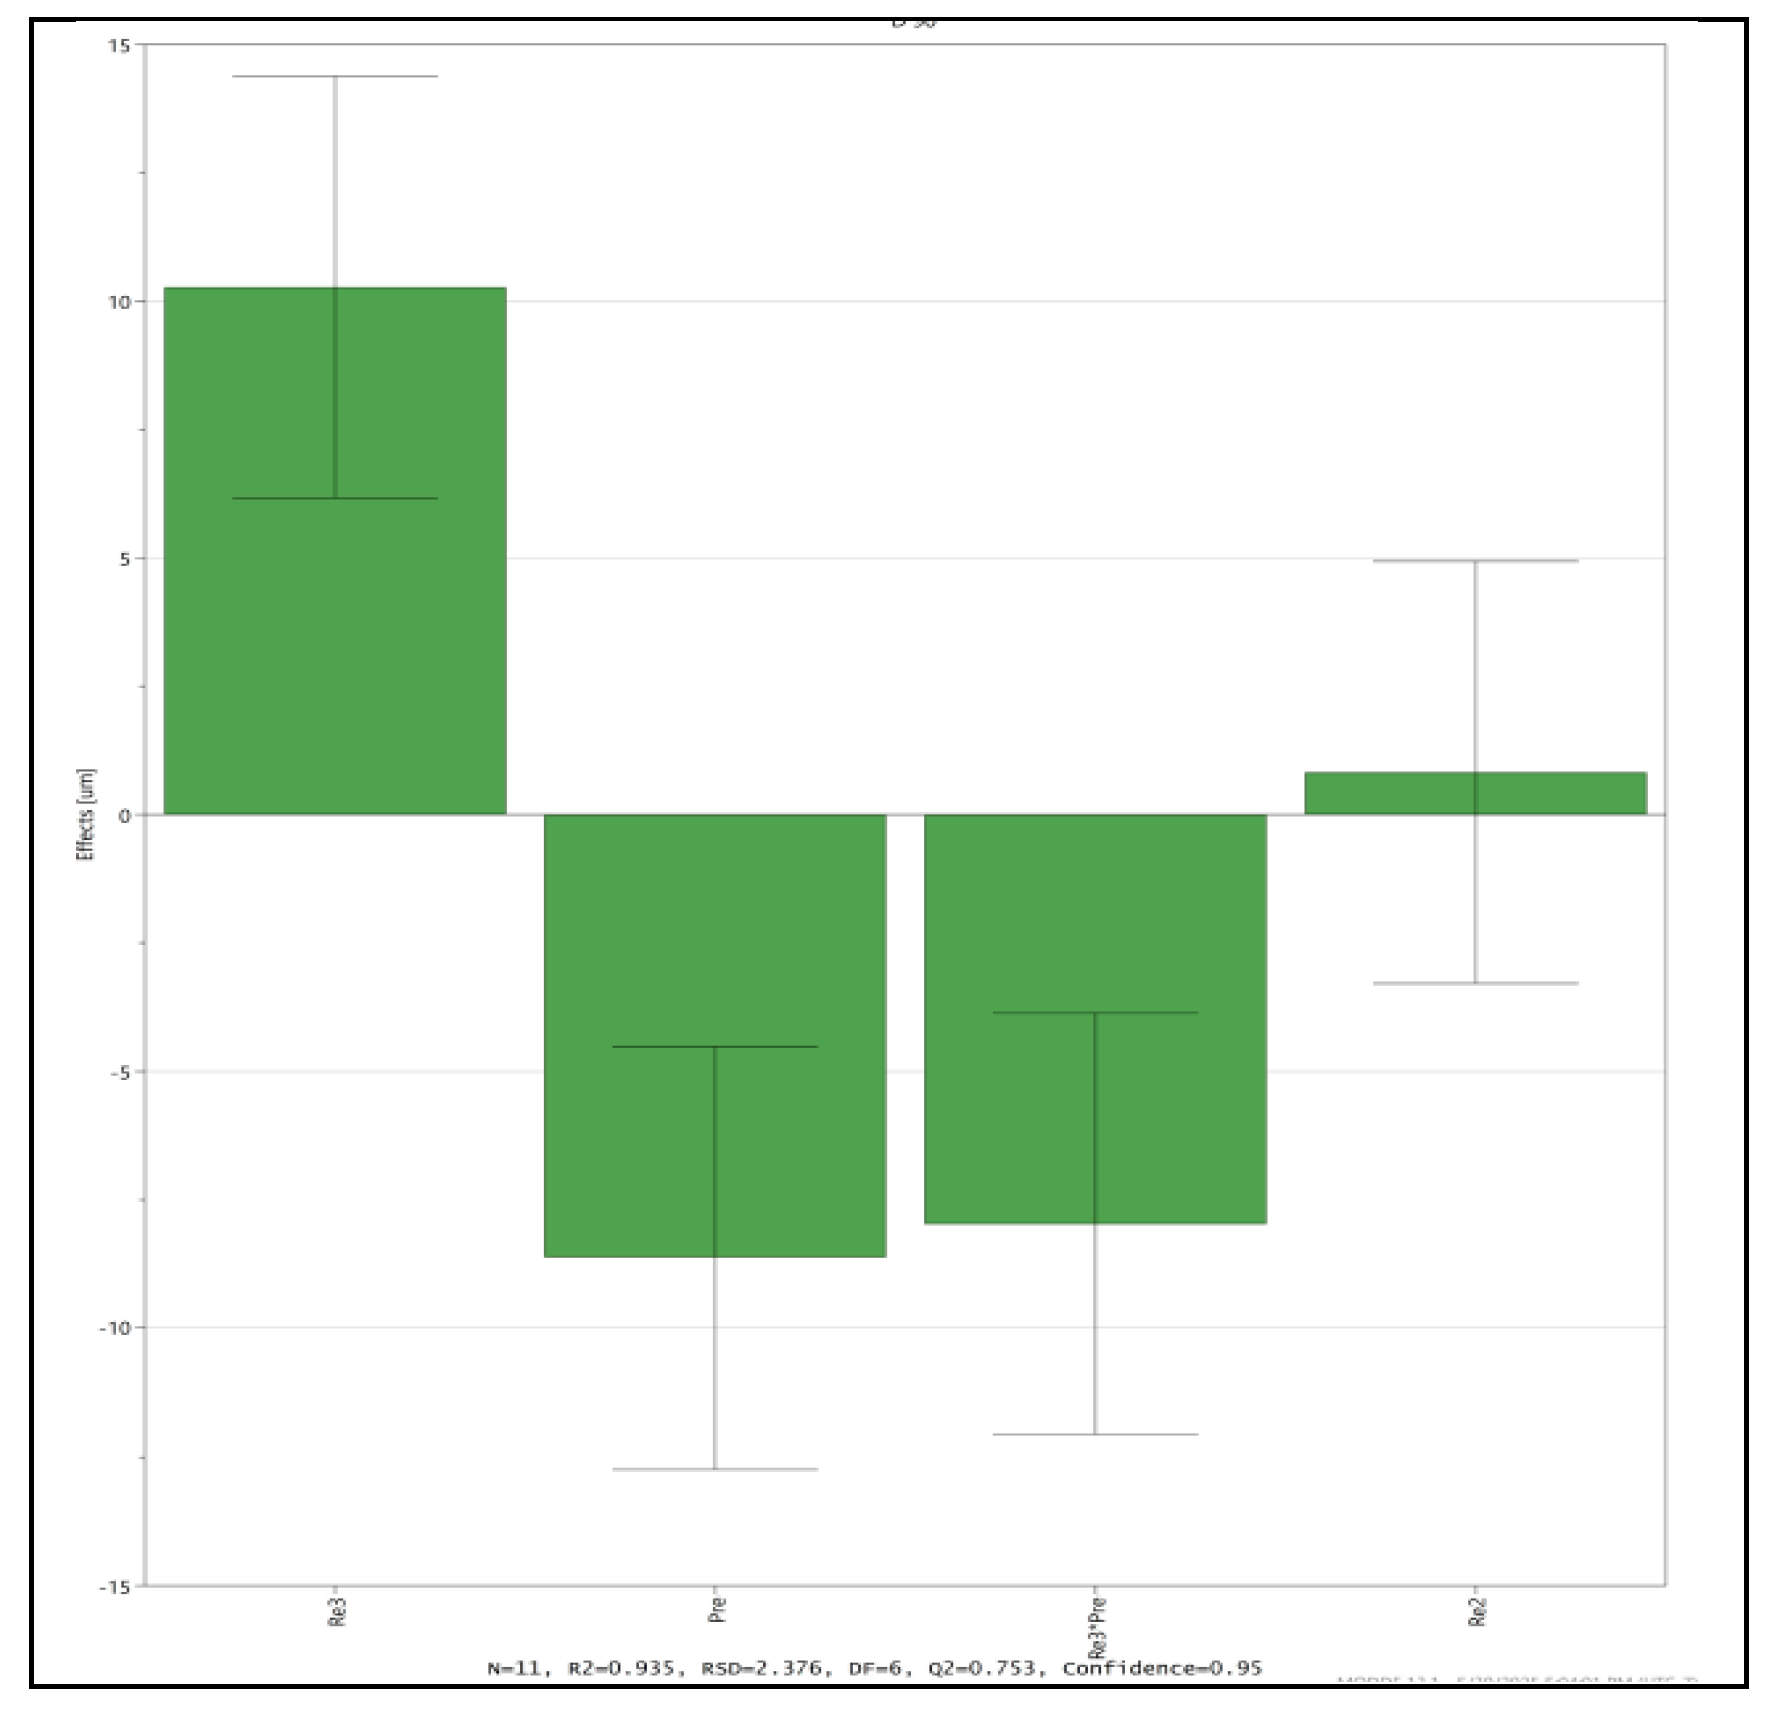
Figure 2.
Contour profile for optimum parameters.
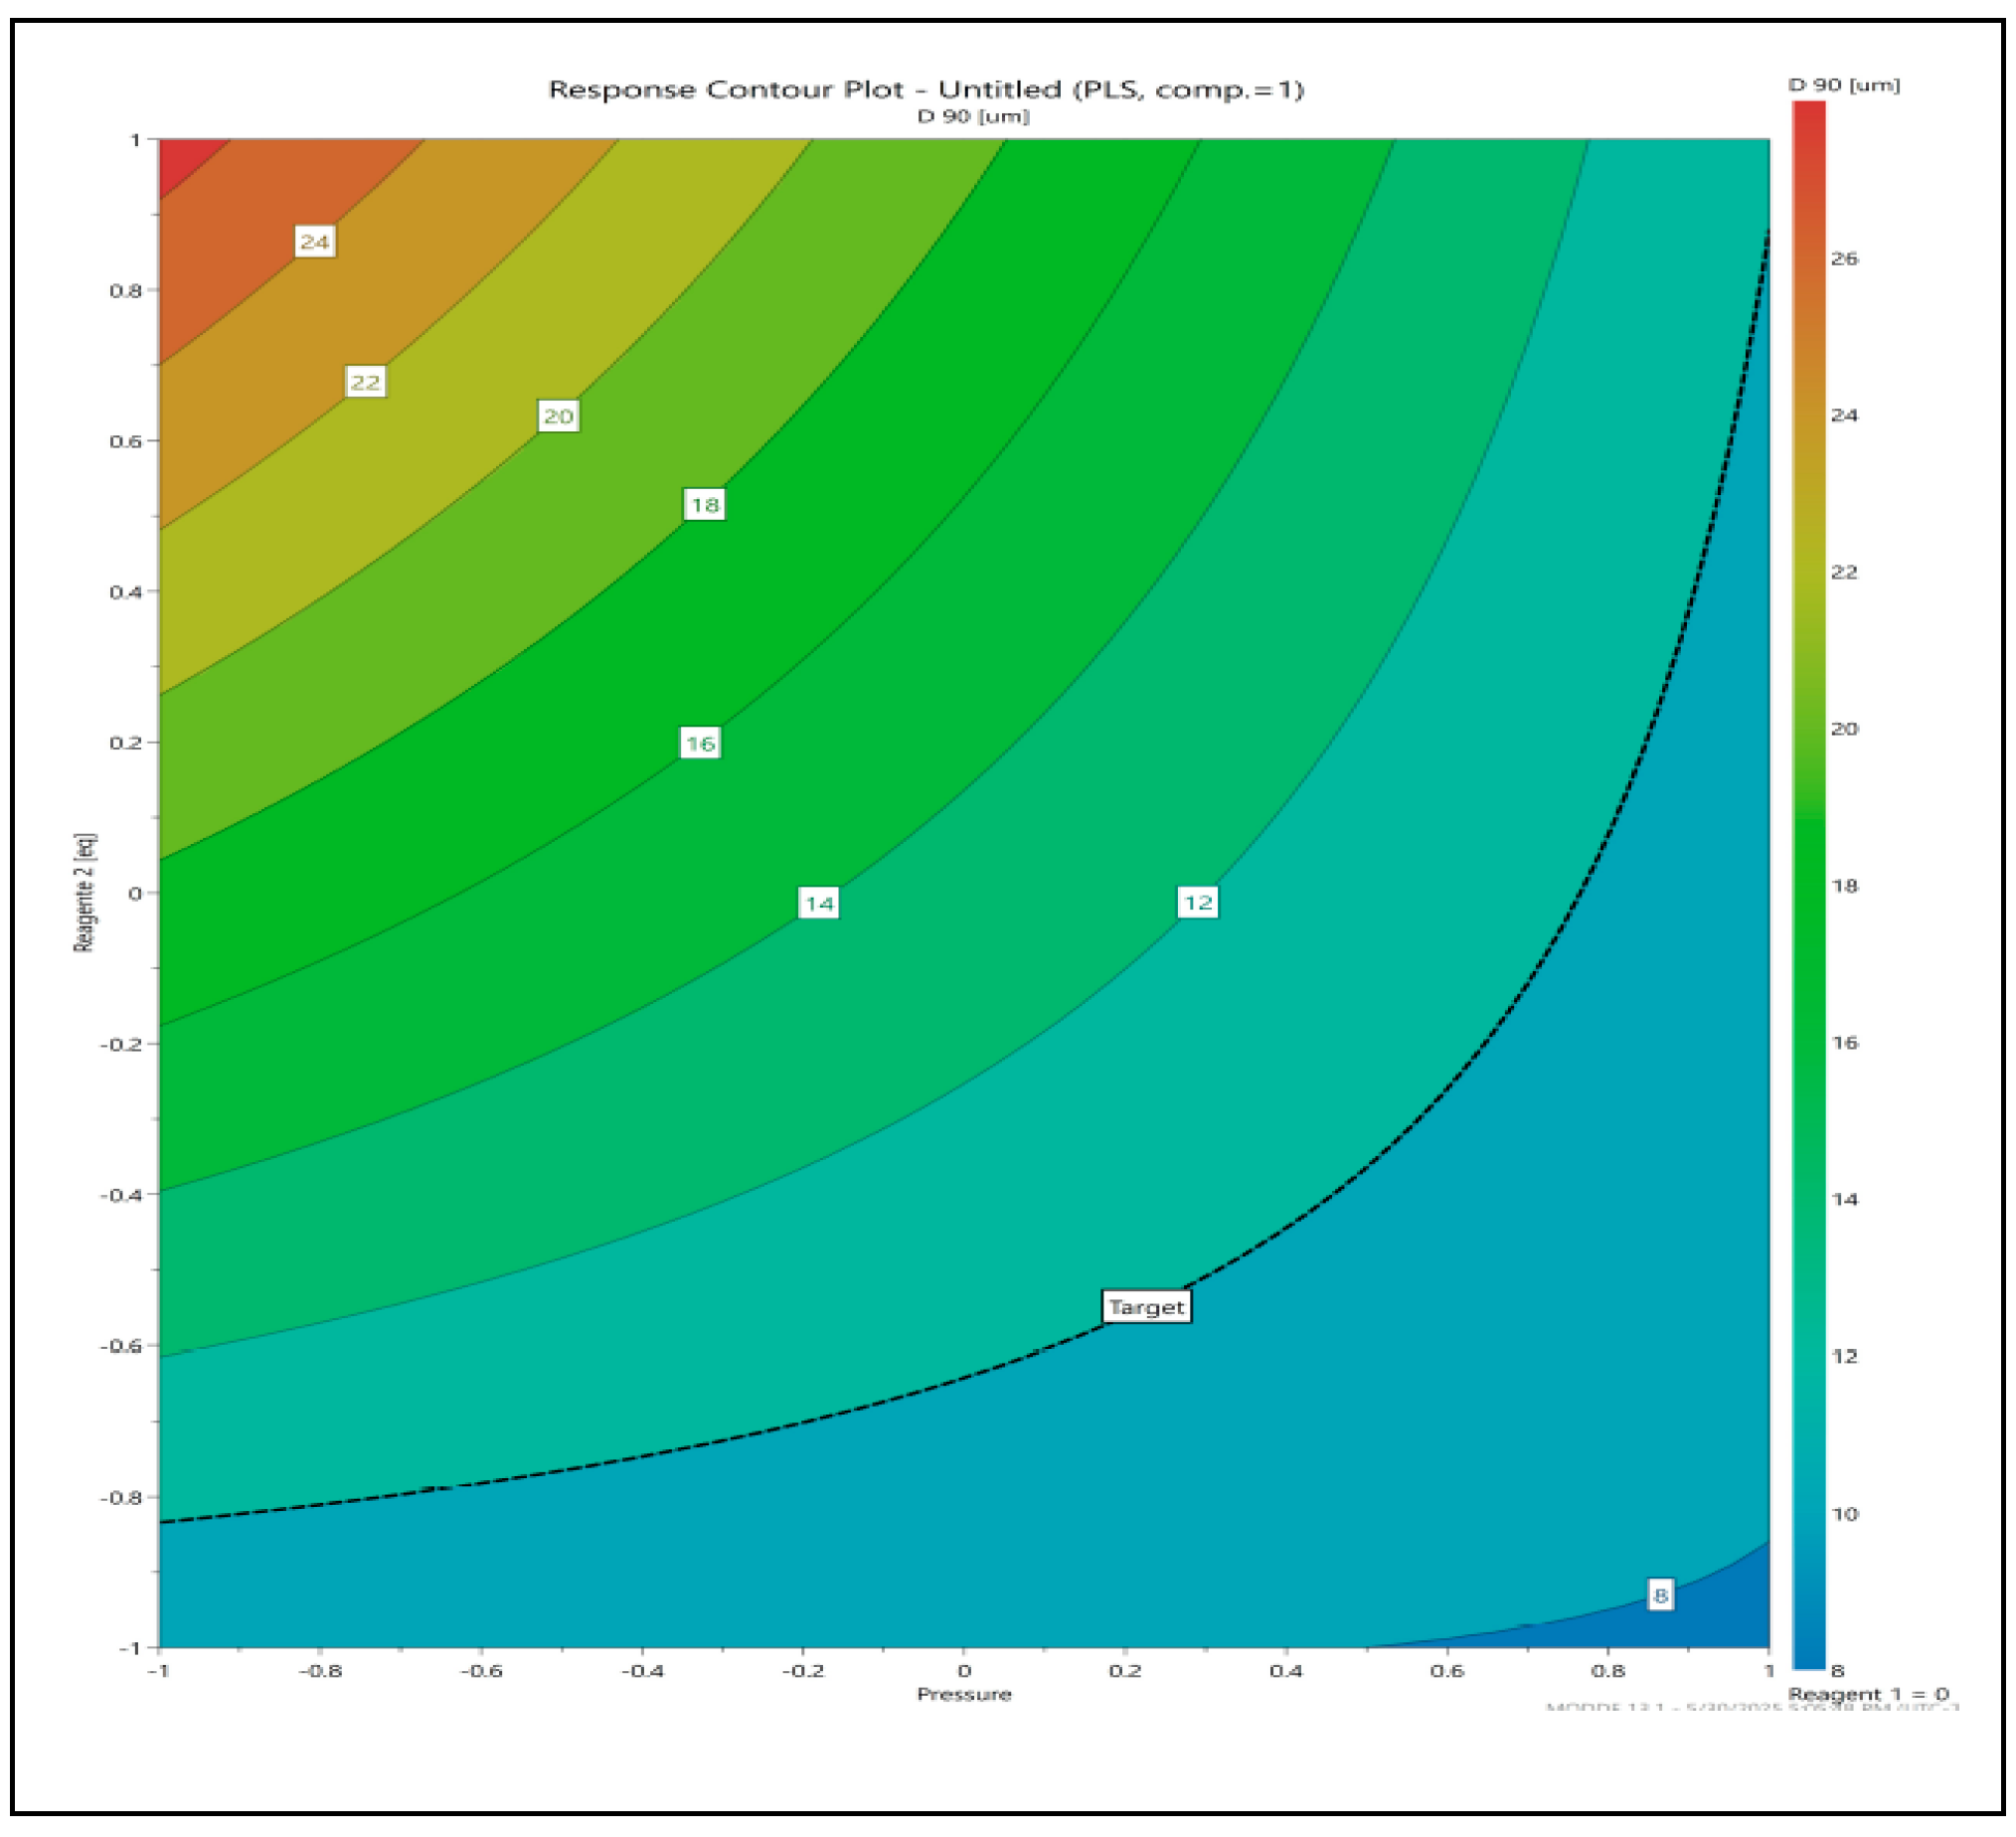
Figure 3.
DCS Plot for mixing time.
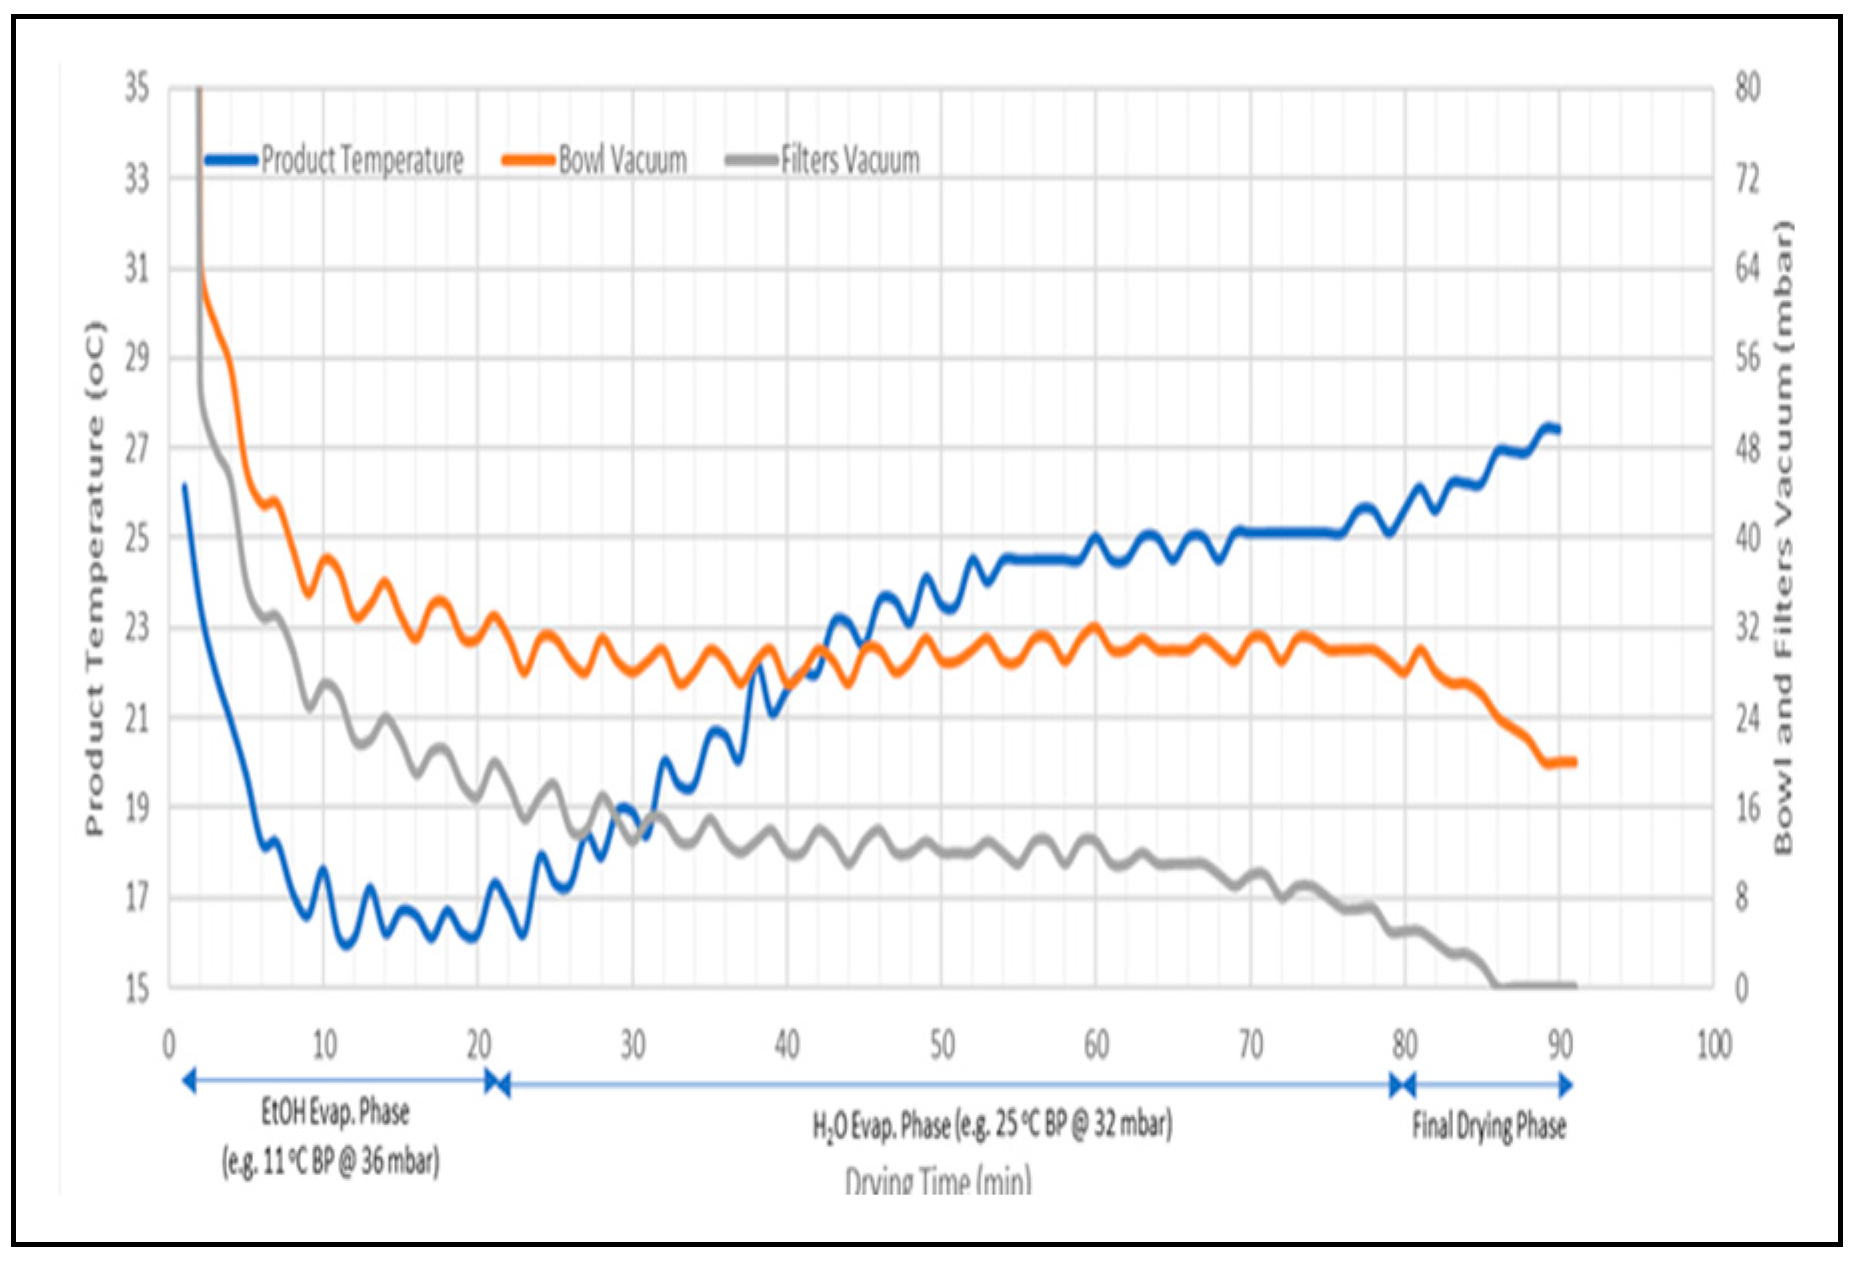
Figure 4.
PAT monitoring for LOD.
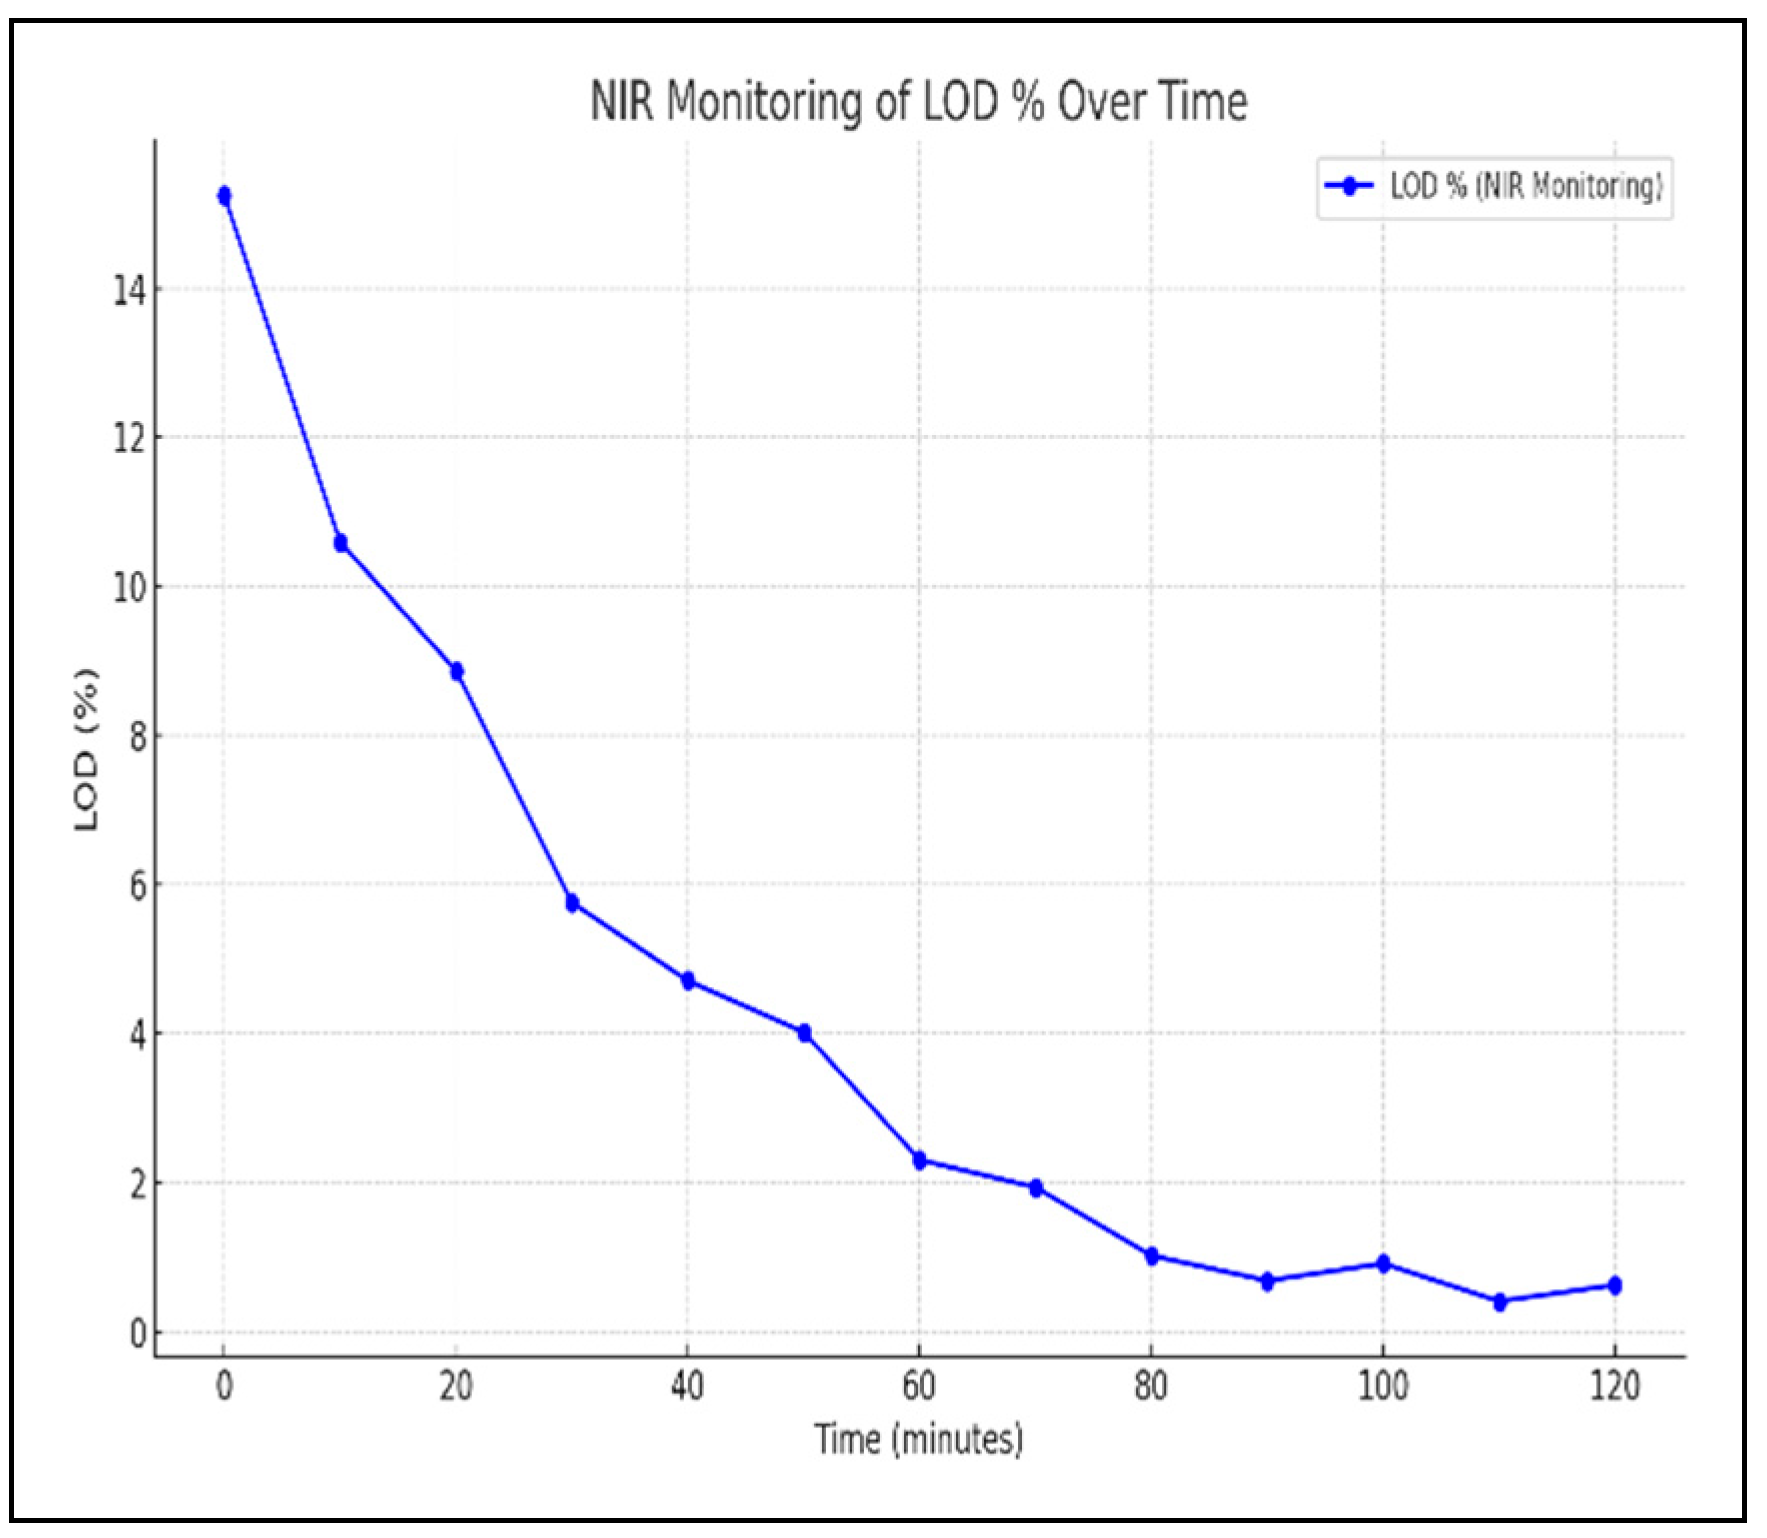
Figure 5.
Model Fit Analysis.
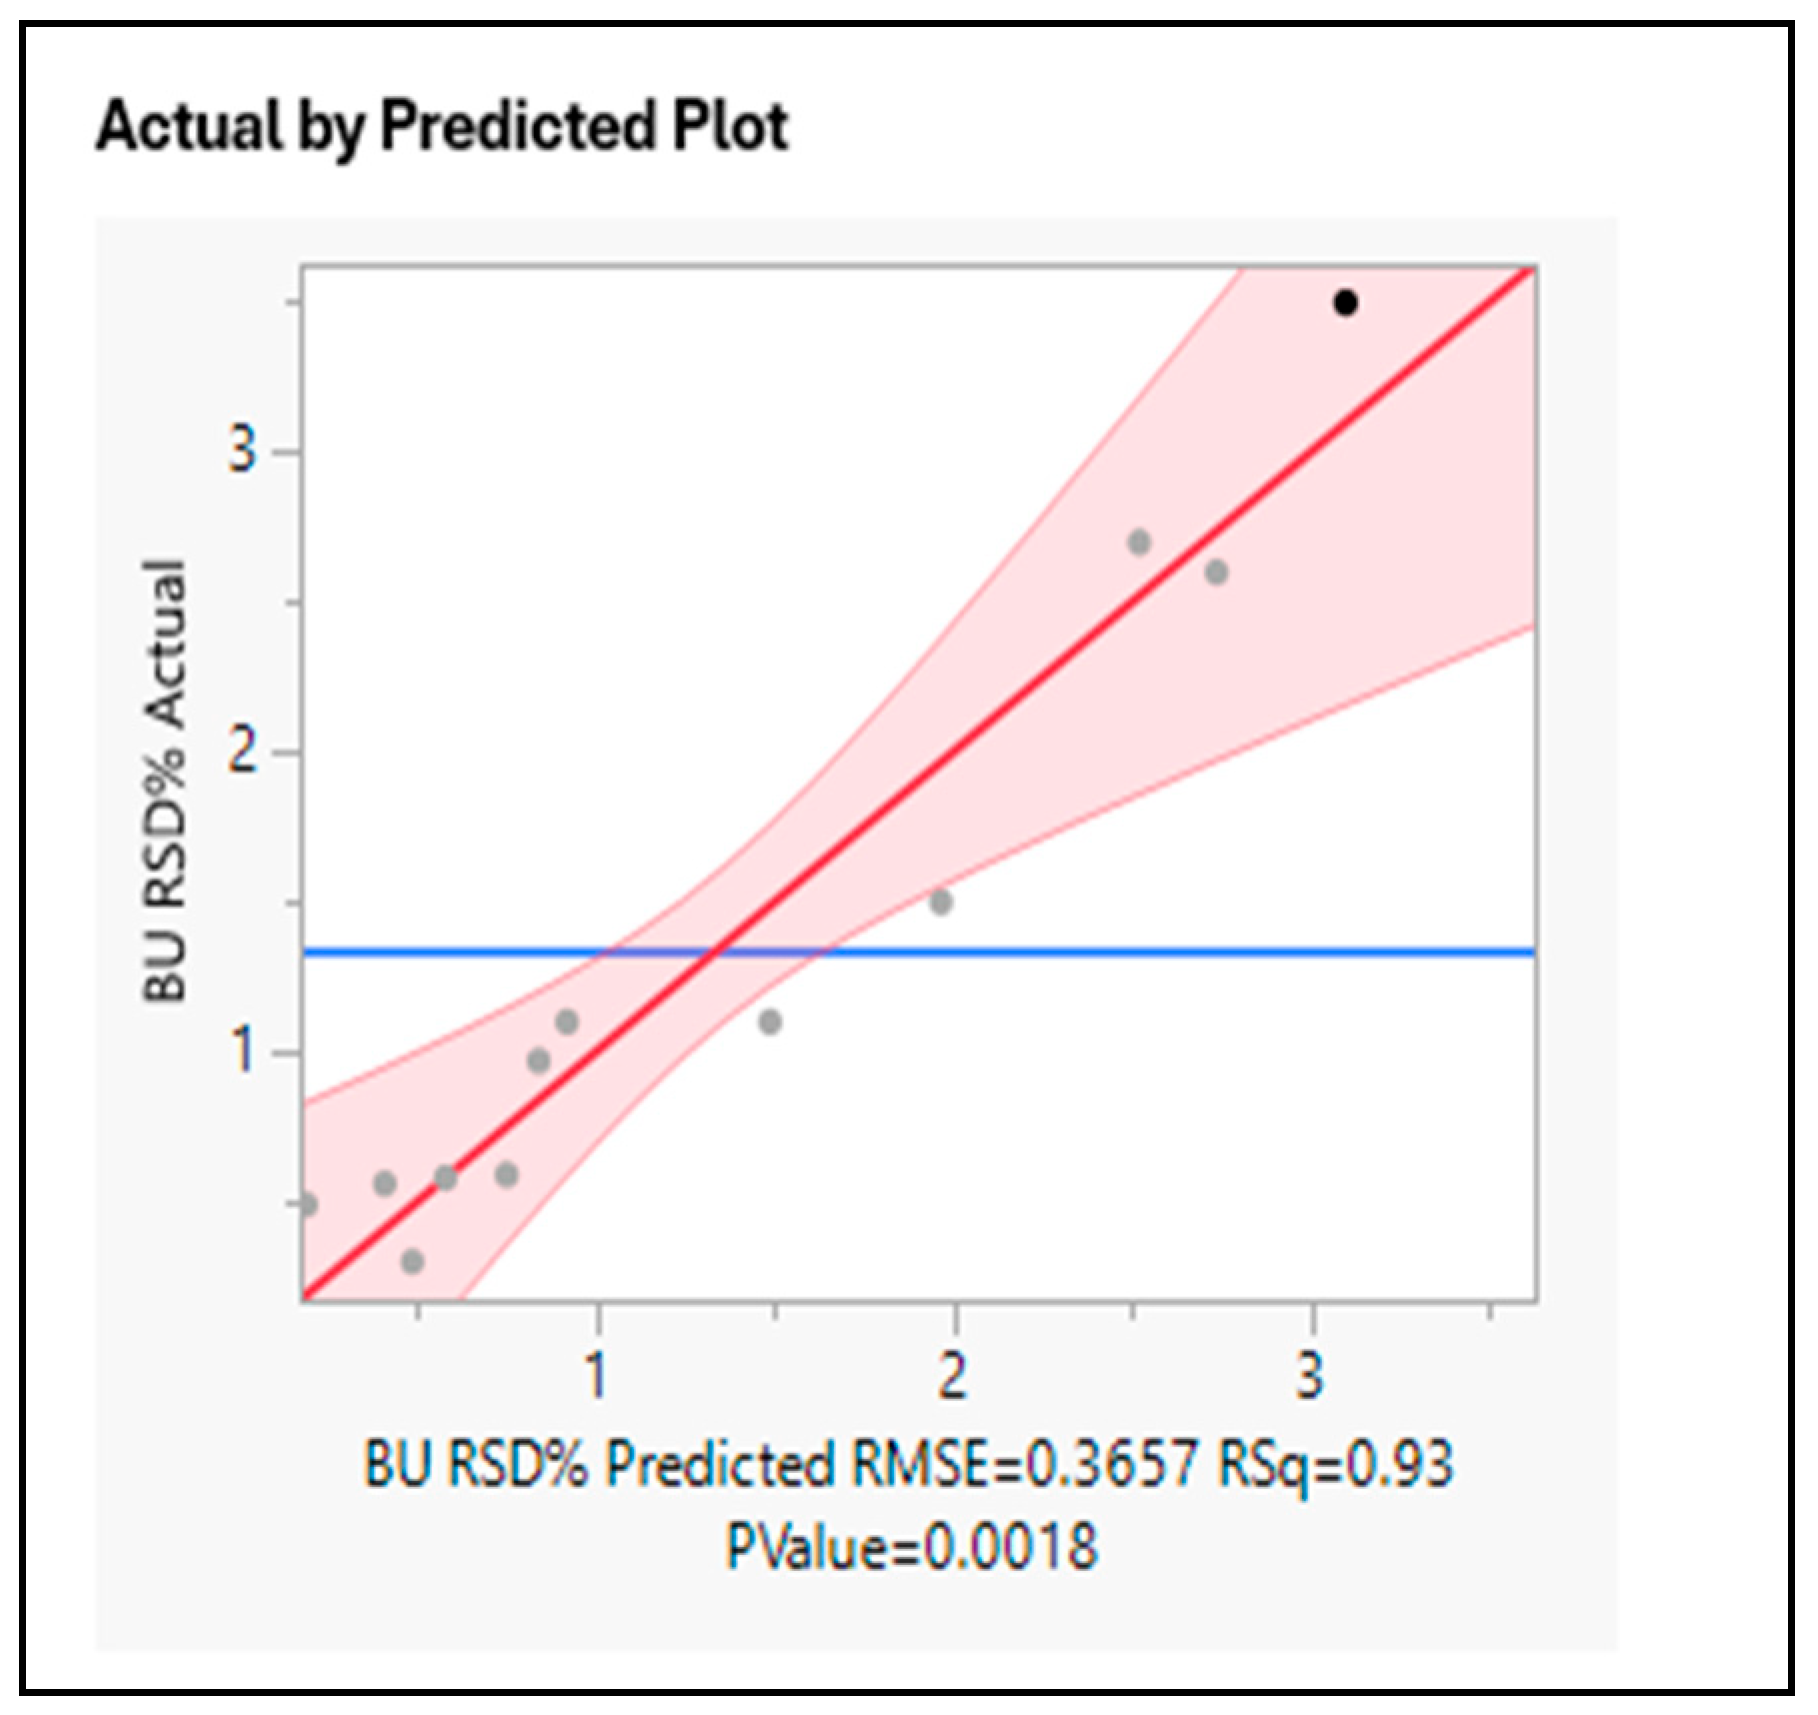

Table 1.
Comparison of Different Regulatory Agencies on Process Validation.
| Aspect | FDA (US) | EMA (Europe) | TGA (Australia) | CDE (China) |
| Definition of Process Validation | A collection and evaluation of data from the process design stage through production to establish scientific evidence that a process consistently delivers quality product | Evidence that a process operates effectively and reproducibly | Aligned with PIC/S: Establishing documented evidence for consistent performance | Emphasizes the need for validation at commercial scale before approval |
| Lifecycle Approach | Strong emphasis – 3-stage approach: Design, Qualification, and Continued Process Verification (CPV) | Lifecycle-based model, with focus on continuous verification | Lifecycle approach aligned with FDA and EMA | Emphasizes full validation before approval but evolving toward lifecycle thinking |
| Risk-Based Approach | Encouraged – use of QRM tools like FMEA, Ishikawa | Expected – integration with QRM (ICH Q8–Q10) | Expected – through Quality Risk Management (QRM) per ICH | Emerging – Quality Risk Management is recommended but not always fully integrated |
| Focus on QbD | Strong – QbD principles encouraged | Strong – aligned with ICH Q8, Q9, Q10 | Adopted through PIC/S – encourages science- and risk-based approach | Recognizes QbD; implementation varies among manufacturers |
| Data Expectations for Submission | Emphasizes real-time and retrospective data, analytical justification, and scientific rationale | Requires detailed validation protocols and outcome data in submissions | Like EMA – detailed data required per PIC/S standards | Requires commercial batch validation data pre-approval |
| Continued Process Verification (CPV) | Mandatory – integral to lifecycle validation | Expected – part of ongoing process verification | Encouraged under PIC/S framework | Less explicitly defined; post-approval monitoring evolving |
| Validation Batches | No fixed number; risk-based justification required (not always “3 batches”) | Typically, 3 batches, with scientific justification for deviations | Aligns with EMA – 3 batches standard unless justified | Emphasizes minimum of 3 commercial batches before approval |
| Use of PAT & Digital Tools | Encouraged for real-time monitoring and control | Encouraged where applicable | Adopted in practice; encouraged for continuous improvement | Adoption is growing but implementation varies widely |
Table 2.
DOE in Process Validation.
| Stage | DOE Application |
| Process Development | Identifies CPPs and CMAs affecting CQAs. |
| Process Qualification | Establishes acceptance criteria for validation batches. |
| Continued Verification | Monitors process variability over time and refine control strategies. |
Table 3.
Experimental Design Matrix.
| Factor 1 | Factor 2 | Factor 3 |
| -1 | -1 | -1 |
| 1 | -1 | -1 |
| -1 | 1 | -1 |
| 1 | 1 | -1 |
| -1 | -1 | 1 |
| 1 | -1 | 1 |
| -1 | 1 | 1 |
| 1 | 1 | 1 |
| 0 | 0 | 0 |
| 0 | 0 | 0 |
| 0 | 0 | 0 |
Disclaimer/Publisher’s Note: The statements, opinions and data contained in all publications are solely those of the individual author(s) and contributor(s) and not of MDPI and/or the editor(s). MDPI and/or the editor(s) disclaim responsibility for any injury to people or property resulting from any ideas, methods, instructions or products referred to in the content. |
© 2025 by the authors. Licensee MDPI, Basel, Switzerland. This article is an open access article distributed under the terms and conditions of the Creative Commons Attribution (CC BY) license (http://creativecommons.org/licenses/by/4.0/).
Copyright: This open access article is published under a Creative Commons CC BY 4.0 license, which permit the free download, distribution, and reuse, provided that the author and preprint are cited in any reuse.


