
Submitted:
12 June 2025
Posted:
13 June 2025
You are already at the latest version
Abstract
Often, neoadjuvant therapy, which relies on the induction of double-strand breaks (DSBs), is used to shrink tumor by cell apoptosis, before surgery to trigger cancer cell apoptosis. However, recent studies have suggested that this treatment may also induce a fluctuating state between senescence and stemness in PA-1 embryonal carcinoma cells, potentially affecting therapeutic outcomes. Thus, the respective epigenetic pathways are up or downregulated over a time period of days. These fluctuations go hand in hand with changes in the spatial DNA organization. By means of Single Molecule Localization Microscopy in combination with mathematical evaluation tools for pointillist data sets, we investigated the organization of euchromatin and heterochromatin on the nano-scale on the third and fifth day after the etoposide treatment. Using fluorescently labeled antibodies against H3K9me3 (heterochromatin tri-methylation sites) and H3K4me3 (euchromatin tri-methylation sites), we found that the induction of DSBs led to de-condensation of heterochromatin and compaction of euchromatin, with a peak effect on day 3 after the treatment. On day 3 we also observed co-localization of euchromatin and heterochromatin marks which usually occur in exclusive low-overlapping network-like compartments. The evaluation of the SMLM data by topological tools (persistent homology and persistent imaging) and principal component analysis, as well as confocal microscopy analysis of H3K9me3 and H3K4me3 stained PA-1 cells supported the findings of distinct shifts in euchromatin and heterochromatin organization in a subpopulation of these cells during the days after the treatment. Furthermore, by means of flow cytometry, it was shown that the rearrangements in the chromatin organization coincided with simultaneous upregulation of OCT4A and SOX2, stemness promoters, and p21Cip1 and p27, senescence promoters. Our findings suggest potential applications in improving cancer therapy by inhibiting chromatin remodeling and thus preventing therapy-induced senescence.
Keywords:
DNA damage by etoposide
; chromatin re-organization in tumor cells
; cell-fate
; senescence
; stemness self-renewal
; single molecule localization microscopy
; statistical and topological data evaluation
1. Introduction
Beyond the application of radio-therapy, a common way to treat cancer is to damage the DNA of cancer cells with chemo-therapeutics such as etoposide (ETO) [1]. ETO is used for the treatments of a number of cancer types including testicular cancer, lung cancer, lymphoma, leukemia, neuroblastoma, and ovarian cancer. This drug inhibits the ligation activity of topoisomerase II enzyme, which normally provides relaxation of supercoiled DNA. As a result, it leads to double-strand breaks (DSBs) in the DNA of tumor cells inhibiting DNA proliferation, forcing the cells to undergo apoptosis [2]. However, cancer cells often evade apoptosis and enter a different cell state called senescence [3,4,5]. In this state, the cells usually persist in cell cycle arrest as a cellular response to DNA damage [6]. So far many mechanisms behind senescence are insufficiently understood [7]. Until recently, senescence seemed to be involved in cases poorly responsive to neoadjuvant therapy [8]. Moreover, it has been found that senescence promotes in vivo reprogramming [8,9,10]. ETO-treatment in PA-1 cells can cause a paradox between self-renewal and senescence. Induced DNA damage causes a p53 dependent coupling of self-renewal and senescence pathways. Cells with sufficiently repaired DNA can enter mitosis while cells with persisting damages remain at the late-S-G2M arrest and senescence [11,12]. p53 reduction for instance prevents the up-regulation of OCT4A and p21Cip1 and senescence remains enhanced in combination with a loss of genome integrity. On the other hand, p53 enhancement safeguards DNA integrity and provides genome stability and self-renewal [11,12]. This is associated with OCT4A and p21Cip1 upregulation and changes in cell cycle regulation. Over several days the cells gain an ability to adapt to a stemness state and to restart their proliferation [12]. In other words cells must not persist in senescence but have the chance to escape into a self-renewal state [5] and this mechanism is conserved from cnidaria [10].
As the cell nucleus is a self-organizing system [13] that should react to any epigenetic changes by response of chromatin reorganization [14], it has been assumed that such epigenetic fluctuation as described above may be associated with fluctuations in the chromatin reorganization [15].
In this article, we used confocal microscopy and Single Molecule Localization Microscopy (SMLM) [16,17,18] in combination with mathematical evaluation tools of statistics and topology [19] to study chromatin organization in the embryonal PA-1 teratocarcinoma cell line treated with etoposide [20]. SMLM in combination with Ripley statistics [21], persistent homology [22,23], persistent imaging [24] and after principal component analysis (PCA) [25] has been successfully applied to discriminate cell types according to their chromatin organization [19,26] to measure radiation treatment effects on heterochromatin [27,28] or to analyze HUVEC cells after exposure to peritoneal dialysis liquids [29].
Here, the cells were treated with ETO inducing DSBs [1]. Heterochromatin, transcriptionally silent chromatin, was marked with anti-H3K9me3 antibodies [30] and euchromatin, transcriptionally active, was marked with anti-H3K4me3 antibodies [31]. In non-treated control specimens, both components are compartmentalized, while after ETO treatment we identified spatial dissemination of heterochromatin, as well as an increase in euchromatin density; thereby a heterochromatin-euchromatin co-localization was found as a topological feature of senescence and self-renewal bi-potentiality.
To further investigate the stemness and senescence induction after DNA damage, flow cytometry was conducted and it confirmed that ETO treatment has also induced overexpression of OCT4A and SOX2 stemness markers as well as p21Cip1 and p27 senescence markers in PA-1 cells.
2. Materials and Methods
2.1. Cell Line and Cell Preparation
The PA-1 cell line [20] is derived from ascitic fluid cells of a 12 year old Caucasian female with a teratocarcinoma of the ovary. The cells are characterized by wild-type p53, diploidy and a stable karyotype with one permanent translocation. The PA-1 cells (ATCC, Manassas, VA, USA) cells were cultivated in Dulbecco’s Modified Eagle Medium (DMEM) containing 10 % fetal bovine serum (FBS, Sigma, St. Louis, MO, USA). The cells were maintained in a 5% CO incubator at 37 °C without antibiotics. During the exponential growth phase, they were treated with 8 µM etoposide (ETO) for 20 hours. Following drug removal, the culture medium was refreshed every 48 hours, and cells were collected for analysis on day 3 and 5 after ETO treatment. As shown previously [11], a proportion of cells survived this treatment and restored the clonogenic growth from day 7. In parallel non-treated (NT) control cells were cultured. Cytospins were prepared as described in detail elsewhere [32]. The cells were fixed in cold methanol followed by three quick dips in acetone and labeled by the following antibody system: As primary antibodies the mouse monoclonal anti-H3K4me3 (ab1012, Abcam, Cambridge, UK) was used for euchromatin and the rabbit polyclonal anti-H3K9me3 (ab8898, Abcam) was used for heterochromatin. As secondary antibodies the following combination was used: Euchromatin was stained with a goat anti-mouse IgG (H+L) AlexaFluor488 cross-adsorbed antibody (A11001, Invitrogen, Thermo Fisher Scientific, Waltham, MA, USA) and heterochromatin with goat anti-rabbit IgG (H+L) AlexaFluor594 highly cross-adsorbed antibody (A11037, Invitrogen). The cell nuclei were counterstained with DAPI.
2.2. Confocal Microscopy
Samples were analyzed with a confocal laser scanning microscope LSM710 (Carl Zeiss AG, Oberkochen, Baden-Württemberg, Germany), using a 63×/NA1.3 objective with appropriate filter settings for the Alexa dyes used (see 4.1.). The images obtained were analyzed with the commercially available ZEN2011 software (blue edition) (Carl Zeiss AG).
2.3. Single Molecule Localization Microscopy (SMLM)
SMLM makes use of stochastic blinking of dye molecules for precise localization of single antibodies. Dye molecules stochastically switch between two states, fluorescing and non-fluorescing. The SMLM setup is described in detail in [33,34]. For the acquisition of the data sets used in this article, the 405 nm laser (120 mW) was used for DAPI widefield control. For the euchromatin and heterochromatin marks the 491 nm (200 mW) and 568 nm (200 mW) illumination lasers were used. Blinking events were recorded by an Andor Ultra EMCCD camera via appropriate filter settings.
Settings for heterochromatin imaging were: EMCCD gain of 120, 30 ms exposure time, 561 nm laser at 80 % power and flash at 90 % for 20,000 ms, i.e., for 4,000 frames. Only the last 2,000 frames were used for analysis, since the first 2,000 frames showed signal overexposure. Settings for euchromatin imaging were: EMCCD gain of 120, 30 ms exposure time, 491 nm laser at 80 % power and flash at 80 % for 10,000 ms, i.e., for 2,030 frames. Here, only the first 30 frames were not considered for the analysis because of possible signal overexposure. The software Omicron and Live Acquisition were used for standard microscopy imaging.
Non-apoptotic cells, fitting within the microscope’s field of view, and single nuclei without visible nonspecific fluorescent aggregates around were selected for SMLM data acquisition. This excluded a considerable amount of cell nuclei especially in the cases after ETO treatment. However, such exclusion appeared to be acceptable since all cells did not react synchronically. Therefore only those cells were picked out that were about homogenously in size and shape.
2.4. Data Processing of SMLM Data Sets
Using an in-house software package, super-resolution signal coordinates were calculated according to an algorithm subtracting the brightness values of two successive image frames. Dark states over more than two successive frames were registered and the bary-centers were calculated [35]. Finally, the coordinates and localization precision of the loci of all blinking molecules were registered in the 'orte-matrix' which was used as the basis for further mathematical calculations [19].
For the one channel analysis Ripley statistics [21] was applied to the coordinates of the points and point-to-point distances were calculated and normalized. Peaks in Ripley distance frequency histograms indicate point clustering. For topological analysis, persistent homology [22,23], persistent imaging [24] and principal component analysis [25] were applied as described in detail in [19]. A transformation into the topological space was obtained by two parameters: the number of “components” and “holes” in the detected point pattern. Each component was represented by a bar starting at 0 (i.e., the given point) and ending at the radius value where two artificial increasing circles around the points attach and the two components merge into one. Since enlarged components could arise, forming a closed structure with “free” space inside uncovered by the circles, holes were born. If such a hole was completely covered by the increasing virtual circles, also this bar for a hole ends. By this process the point pattern recorded was transferred in an equivalent bar code pattern [19,22,23].
The bar-codes of the holes were transferred into a graph of “bar life-time” vs. “bar birth”. Then this graph was overlaid by a pixel scan of equally sized pixels. This is called persistent image [24,29]. In this persistent image, the intensity of each pixel directly correlates to the number of points in the given pixel. In that way persistent images were created for each cell nucleus and each type of labelling. These persistent image values were finally transferred into an n-dimensional orthogonal vector space. Pixel by pixel the intensity values were transferred into this vector space; i.e., all values of the 1st pixels were transferred on the first dimension, all values of the 2nd pixels were transferred on the second dimension and so on. Finally, the result was subjected to principal component analysis (PCA) [25], by which the multi-dimensional feature space was reduced to a 2D latent space of the two largest variations in topology. Thus, only two principal components describe the main features and their changes. Small variations (“biological noise”), i.e., the other higher dimensions, were neglected.
2.5. Flow Cytometry
For flow cytometry, PA-1 cells were harvested at the indicated time points and washed with PBS. Cells were then fixed with BD Cytofix Fixation Buffer and permeabilized with BD Phosflow Perm Buffer III, as recommended by the manufacturer. Cells were incubated with the anti-Oct3/4 AlexaFluor647-conjugated antibody (Santa Cruz Biotechnology, Catalog No sc-5279 AF647), anti-Sox2 V450 (BD Horizon™, Catalog No 561610), anti-p21/CIP/CDKN1A AlexaFluor 750-conjugated antibody (R&D Systems, Catalog No IC1047S-100UG), the p27/Kip1 Alexa Fluor 488-conjugated antibody (R&D Systems, Catalog No IC2256G-100UG) and the PE mouse anti-γH2AX (BD Biosciences, Catalog No 562377), all diluted in BD Pharmingen Stain Buffer for 30 min at +4 °C. Flow cytometry was performed on a FACSAria II cytometer (BD Biosciences), using the 633 nm laser to detect SOX2 and p27, with APC and APC-Cy7 fluorescence channels, respectively. The 488 nm laser was used to detect γH2AX in the PE fluorescence channel. We used the FACSDiva v. 6.1.3 software (BD Biosciences) on the cytometer, and analyzed the data using the FlowJo v10 software.
3. Results
To investigate the spatial organization of euchromatin and heterochromatin, the PA-1 teratocarcinoma cells were treated with etoposide, cultured a given period of days, cytospun onto glass slides, fixed in cold methanol with short dips in acetone and stained with anti-H3K9me3 (heterochromatin) and anti-H3K4me3 (euchromatin) antibodies as described above. The controls were not treated with etoposide but cultured in parallel.
To examine the heterochromatin and euchromatin compartmentalization confocal microscopy was applied. In Figure 1, two typical examples are shown. Heterochromatin and euchromatin seemed to be strictly separated from each other in the non-treated control sample (Figure 1A). The intensity curves indicate a clustering of heterochromatin in the regions of low euchromatin and vice versa while the DAPI intensity curve represents a fluctuating DNA distribution. Obviously heterochromatin is localized around NORs. Further images are shown in the supplement (Figure S1).
After the ETO-treatment on day three, heterochromatin seems to be fragmented (smaller peak structures) and intermingles with EC on day three (Figure 1B). This loss of compartmentation between heterochromatin and euchromatin supports the assumption that the ETO-treatment causes pulsing of heterochromatin into euchromatin regions. In addition euchromatin in part seems to surround NORs.
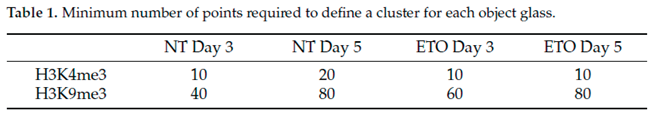
In order to further study the effects of EPO-treatment in more detail, further specimens were analyzed by super-resolution SMLM. After optimizing the detection parameters for the given specimens, super-resolution SMLM was performed for non-treated and ETO-treated cell nuclei on day three and five. The data were quantitatively evaluated [19] by means of Ripley statistics and DBScan clustering evaluation. The results of each color were evaluated separately using in-house made program tools described above. For the identification of the molecule clusters in euchromatin and heterochromatin by DBScan, the minimum numbers of points located within a minimum cluster radius of 200 nm were chosen considering the concentration of fluorophores on the slides and blinking events measured (Table 1).
In Figure 2 the statistical data are summarized: A clear difference in size of the nuclei (given by the mask size) of the ETO-treated and non-treated cell nuclei was found (Figure 2A). ETO-treated cells showcased an increase in their nuclear size on both days analyzed, as compared to non-treated control samples cultivated until the same days. This increase was more pronounced on day three than on day five. This effect was true for cells of both types of chromatin labeling. This result might be biased in some way because only those cell nuclei were chosen for SMLM that showed an average size with some variability, while extremely big (often polyploid) examples were excluded from the evaluation due to limitations of the microscope's field of view.
Clusters of labeling points were determined according the parameters described in Table 1. The ETO-treated cells displayed a steep increase of the average cluster area of the heterochromatin clusters and reached a value which was multiple times higher than the area of euchromatin clusters (Figure 2B). In contrast to heterochromatin, the average area of euchromatin clusters on day three was comparable to those of the non-treated samples and on day 5 it is even lower. For both heterochromatin and euchromatin, a cluster size decrease was observed between day three and day five. During this time period, the area of euchromatin clusters dropped below the level of non-treated cells on day three.
The relative signal density inside clusters (= the amount of signals detected inside the given clusters compared to those outside of them) showed constant low values for heterochromatin in treated and non-treated samples (Figure 2C) while they changed for euchromatin in the ETO-treated samples. A considerable rise was noticed on day three continuing to further increase on day five. However, these values showed a large SD, i.e., the numbers between different cell nuclei showed a large variation. This indicates different activities of individual cell nuclei) Nevertheless, the data across all cells measured indicate that euchromatin was forming variable clusters during treatment.
Along with the increase of the cluster areas (Figure 2B) the number of clusters per cell also showed a significant increase for the treated cells, reaching its maximum on day three and having been decreased on day five (Figure 2D). Here, an interesting trend was revealed: The non-treated samples always showed a higher number of euchromatin clusters than heterochromatin clusters. At a first glimpse, this might be reasoned by the labelling efficiency of the antibodies used. However this did not seem to explain the effect, because this trend was reversed for the treated cells where a higher number of heterochromatin clusters than euchromatin clusters was found for both days three and five. Also a significant decrease was observed between day three and day five for both, euchromatin and heterochromatin; thereby the amount of euchromatin was significantly dropping below the level of the NT cells (Figure 2D).
Furthermore the acquired data were used to create a relative pairwise distance frequency histogram (Ripley curve), from which information about the structures formed by the chromatin were extracted (Figure 2E). The Ripley curves showed distinct peaks in the regime of 20 nm to 160 nm for all samples, reflecting the presence of some non-random structures in a random environment. All evaluated slides showed a similar behavior in the formation of those structures with two slightly deviating exceptions: Heterochromatin on day three after ETO-treatment had the most relaxed organization which was more compacted on day five, while euchromatin on day five showed the most clusters. Heterochromatin on day three showed a lower and more spread out accumulation of clusters lacking a distinctive peak. This indicated a change in chromatin structures by chromatin fluctuations. This demonstrates a more prominent formation of structure and thus organization of the euchromatin unusual under normal (proliferating) cell conditions.
The two-channel analysis program was used to further extrapolate information about the co-localization of heterochromatin and euchromatin. In contrast to standard light microscopy were two “co-localizing”, red and green signals form a yellow one, co-localization in SMLM means that the distances between the two signals were ≤ 95 nm. For physical reasons two antibodies can never occupy the same place simultaneously. Thus, this value considers the size of the two antibody labelling complexes of primary and secondary antibodies each (see for details [36]). From the extracted SMLM data (“orte”-matrix), co-localization overview images were created in order to obtain a visual impression how organized and non-organized chromatin looks like (Figure 3). Here, it is also noteworthy that in the non-treated control cells euchromatin tends to be located in the middle of the nucleus surrounded by heterochromatin (Figure 3A) as it is expected under usual conditions. After the ETO-treatment, however, euchromatin is often found near the nuclear membrane (Figure 3B) while heterochromatin was found everywhere including the nuclear center. It seems to be co-localizing everywhere in the nucleus especially at the nuclear boundary instead of being focused to the center.
Euchromatin (anti H3K4me3 tags) co-localized most strongly with heterochromatin (anti-H3K9me3 tags) and vice versa on day three after ETO-treatment (Figure 4). Here the euchromatin clusters cover 5 % (with high variability) of the heterochromatin cluster areas (Figure 4A), while the heterochromatin clusters cover approximately 30 % of the euchromatin cluster areas (Figure 4B). In contrast on day five post ETO-treatment, there was nearly no co-localization between the two cluster types. Furthermore, the data also showed little co-localization for the NT cells especially on day five. Only a significant co-localization between hetero- and euchromatin occurred on day three after ETO-treatment.
Also the percentage of the two tags, anti-H3K4me3 and anti-H3K4me3 that co-localize with the signals within the clusters of their respective counterparts was calculated. Regarding co-localization within euchromatin clusters (Figure 4C) and within heterochromatin clusters (Figure 4D), it was found that the non-treated controls on day five and the ETO-treated cells on day three showed a significantly higher co-localization of signals compared to those on day five post ETO-treatment. However, only about half as many H3K4me3 signals co-localized within euchromatin clusters compared to H3K4me3 in heterochromatin clusters. Furthermore, co-localization on day three after ETO-treatment was slightly lower (or equal within the error margins) than that of the day-five control with day five post treatment showing the lowest value.
For both, the non-treated controls on day five and the ETO-treated cells on day three, most euchromatin signals co-localize with the cluster signals of heterochromatin (Figure 4D). On day five after ETO-treatment, the co-localization of these signals dropped significantly and reached the lowest values. This showed that the distances between the different tags increased compared to the other samples indicating a reduced interaction between the structures marked by these two tags. On day three post ETO-treatment, nearly every euchromatin signal within heterochromatin clusters was close enough to co-localize with them while on day five quite the opposite seemed to be true (compare Figure 4C,D).
In summary, the data indicate a significant overlap of hetero- and euchromatin clusters only on day three post ETO-treatment, while it is nearly absent by day five. Furthermore, in general the co-localization of H3K4me3- (euchromatin) tags in heterochromatin clusters was about twice as likely as the reverse. This suggests that euchromatin and heterochromatin were closer together within the heterochromatin clusters than within euchromatin clusters. By day five post ETO-treatment, co-localization with signals of the other channel was significantly reduced, indicating that even if these signals were within a cluster of the other type, they were farther apart from each other as compared to day three.
Topological properties of the examined chromatin organization were identified after persistent homology and persistent imaging using PCA on the persistent images of the holes (Figure 5). The latent space of the first two components (0 and 1) revealed the basic changes of the organizational structures of H3K4me3 tags and H3K9me3 tags, i.e., of eu- and heterochromatin, which were differing fundamentally along the 0-component. This already demonstrates a fundamental difference in the topological properties between eu- and heterochromatin across all examined samples, including the controls.
The PCA of the two controls showed that they share similar properties in case of H3K4me3 as indicated by their close proximity in component 1 in the latent space. In contrast to the non-treated controls, the values of the ETO-treated samples deviated significantly from the non-treated controls on day 3. For euchromatin, the data showed a significant change in the component 1 on day three returning to a state comparable to the NT-controls on day five. Euchromatin only deviates slightly in component 0 for both measured time points post ETO-treatment.
For heterochromatin, on day three the ETO-treatment led to a substantial change in both the component 0 as well as the component 1 representing a greater deviation from the topological properties of the non-treated controls as can be observed for euchromatin. On day five the deviation in component 0 is reversed but a topological state close to the non-treated controls was not fully approached. Component 1 deviated from the non-treated controls even more than on day three post ETO-treatment. Considering the development of these values, it was concluded that euchromatin changed its structural properties on day three and returned to a state close to its original non-treated state even though deviating slightly. Compared to this, heterochromatin underwent a drastic change regarding its structure on day three not returning to its original properties on day five.
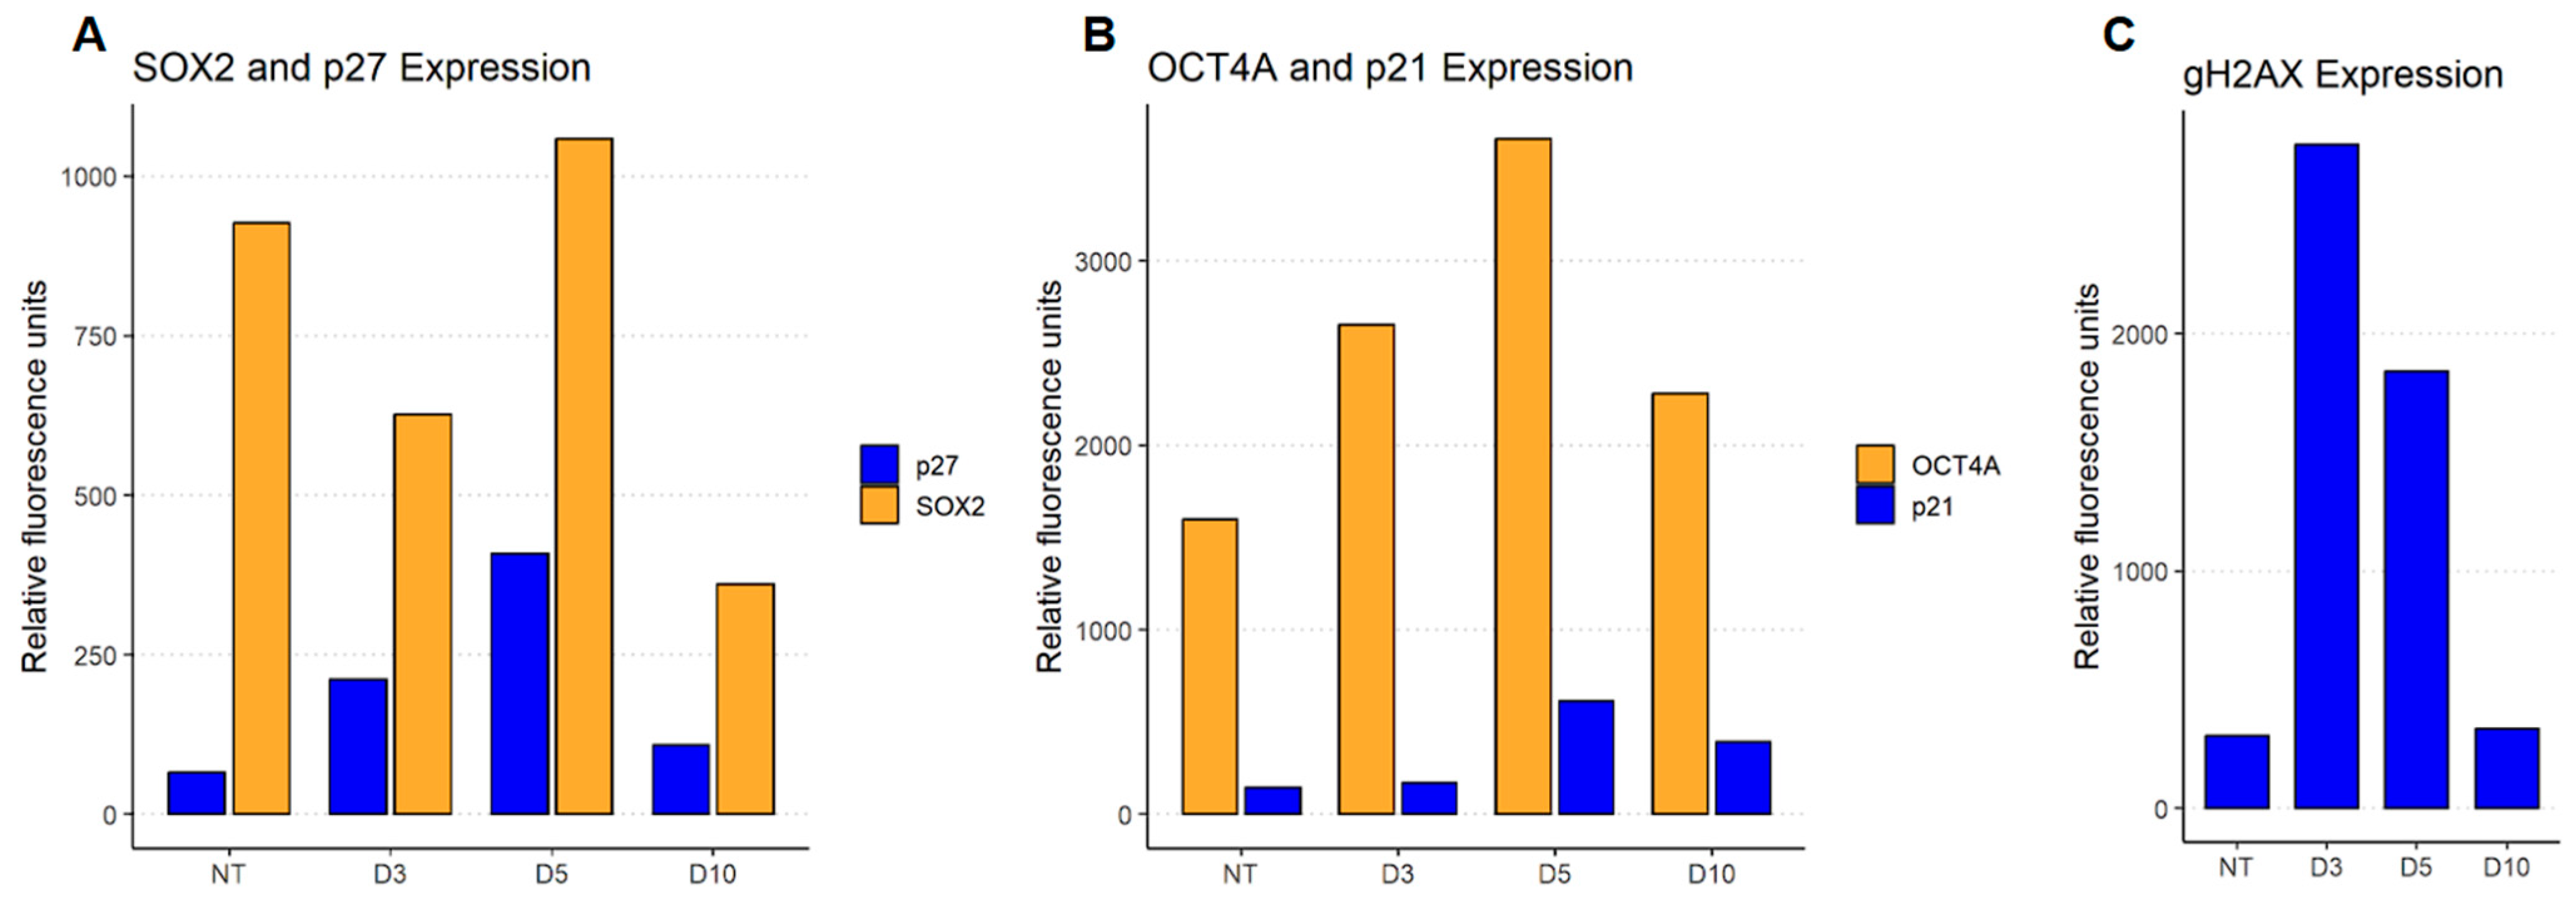
To check the balance of senescence (p27 and p21Cip1) and stemness (SOX2 and OCT4A) drivers expression in ETO-treated cells, flow cytometry was performed (Figure 6A,B). Both senescence drivers p27 and p21Cip1 got upregulated after ETO-treatment. The stemness driver OCT4A was also upregulated following ETO-treatment, whereas another stemness driver's SOX2 expression although being up-regulated shrank due to inhibition from p27, but on day five it got overexpressed. On day ten all of the factors reversed close to their control state with the exception of SOX2, which was down-regulated in comparison to control.
The γH2AX expression increased on day three after ETO-treatment and decreased by one third on day five and finally back to the control level on day 10 (Figure 6C). This indicated the occurrence of double strand breaks (DSBs) on day three and a running repair over day five up to day ten. This shows a compatible trend as was observed for hetero- and euchromatin, when organizational changes started to reverse to a control-like state between day three and five corresponding to a return to G1-state in a proportion of cells indicating a release of the G2M-arrest and restart of the cell cycle [12].
4. Discussion
Recently, it has been described that cellular senescence occurring in development and under different kinds of stress, including cancer chemo-radiotherapy can promote in vitro and in vivo reprogramming [10,30]. The induction of DSBs either chemically or by irradiation could be the reason for a paradox between self-renewal and senescence where cells are able to again enter mitosis or remain at the G2/M checkpoint which prompts either state [5,12]. It was also shown that a p53 dependency of OCT4A (stemness driver) and p21Cip1 (senescence driver) exists [3,4,9]. Furthermore it was revealed that this was associated with p53 and its induced OCT4A and p21Cip1 competitive upregulation enables an ability of the cell to adapt to a stemness state and to restart their proliferation [11].
Using SMLM and novel data computing tools [16,18,19], distinct and reversible changes in the organization of euchromatin and heterochromatin were observed in ETO-treated PA-1 cells, reflecting the role of H3K9me3 heterochromatin in cell identity establishment and maintenance and in regulation of gene expression through the silencing position variegation effect [15,31]. It was seen in response to ETO-mediated DNA damage, where cellular senescence was also previously stated on days three to five by sa-β-galactosidase reaction [11]. ETO induced DSBs as indicated by a γH2AX increase led to significant heterochromatin relaxation and dissemination. In contrast, euchromatin showed a density increase and condensation. On day three after treatment, heterochromatin showed a dispersed structure, indicated by increased cluster areas and reduced cluster density. This relaxation may influence accessibility of repair proteins to DNA [14,15]. Such relaxation could be induced by the mechanical unfolding of heterochromatin, resulting from the release of folding tension after the introduction of DSBs.
Euchromatin condensation could be associated with transcriptional silencing, a protective response to prevent the transcription of damaged genes. Specifically de-methylation of heterochromatin, in particular, nucleolar-associated and methylation of euchromatin found previously [32]. The euchromatin condensation peaked on day five, which means that transcription was suppressed. It is possibly linked to G2M cell-cycle arrest that may have taken place and reasons the changes on the mask/nucleus size (see Figure 2A) and observations of bigger cells that were also described in previous studies [12]. It was found that the co-localization of H3K4me3 and H3K9me3 signals significantly increased on day three after ETO-treatment followed by a state below the level of the non-treated control state on day five.
This implies a much lower phase separation of euchromatin and heterochromatin on day three contrasting the strict phase separation on day five again. A possible cause for this co-localization is the dissemination of heterochromatin with a following overlap with euchromatin regions. For the presence of bivalent chromatin regions further research may be required.
The process of epigenetic fluctuations is accompanied by a change of the eu- and heterochromatin distribution within the nuclei. The treatment induced a reversal of this chromatin distribution. Euchromatin predominantly occupied the edge of the nuclei leaving heterochromatin in the center. This stands in contrast to the distribution measured for normal cells and especially the non-treated controls where euchromatin can preferentially be found in the center of the nucleus. This relocation of euchromatin from the nucleus center to the edge reinforces the possibility of transcriptional silencing of euchromatin while enhancing accessibility to heterochromatin. This also might indicate a conversion of euchromatin into facultative, inactive heterochromatin where it might be compacted by H3K27me3 histone state.
Flow cytometry showed increased expression of both stemness and senescence markers after ETO-treatment, which could be due to the transitional stage of the cells in which they oscillate between stemness and senescence fate decision [5]. γH2AX foci expectedly increased after ETO-treatment, peaking on day 3 and declining by day five. This is typical for successful repair of DNA damage in a proportion of cells as shown earlier by the reduction of CHK2 signaling [11].
PCA highlighted topological differences in general between eu- and heterochromatin, as well as their responses to DNA damage. In contrast to heterochromatin, euchromatin returned in component 1 to a level close to the control on day five.
Regarding limitations and improvements, the SMLM analysis was limited to nuclei that fit within the microscope’s field of view, potentially introducing selection bias.
Nonetheless the findings show a mode of behavior of embryonic stem cells reflecting a reprogramming associated with considerable cellular senescence. Regarding that, our findings reveal the dual state and pulsing of heterochromatin into and out of euchromatin which in turn implies the loss of the heterochromatin silencing effect variegations throughout these fluctuations. The position-effect variegations observed, show heterochromatin packaging spreading across the transitional border between hetero- and euchromatin which in turn was shown to cause transcriptional silencing in a stochastic pattern [37].
Although the study focuses on one cancer cell line only, these findings can be generalized for the nuclear regulation of function by the structure in development. The use of multiple cell lines and advanced imaging techniques in future studies would make the conclusions more reliable and enable better understanding of chromatin dynamics. To study the bivalency of the chromatin after ETO-treatment, also other markers specific to bivalent chromatin, such as H3K27me3, could be used for further research.
The presentation of chromatin re-organizations by SMLM and novel mathematical tools is to our best knowledge the first approach to quantify chromatin changes over days on the nano-scale. The feasibility of such experiments offers new perspectives in senescence research as well as providing insight into position-effect variegation connected to the dual state of stemness and senescence for future investigations and further individualized cancer research.
5. Conclusions
Using SMLM in combination with novel mathematical tools for the first time to investigate stemness and senescence related chromatin re-organisation, this study revealed distinct structural responses of hetero- and euchromatin to ETO-treatment. Heterochromatin became more disseminated after ETO-treatment, whereas euchromatin became more condensed. Regarding that we showed a fundamentally different chromatin distribution on day three post ETO-treatment: While showing a lowered phase separation of hetero- and euchromatin on day three as indicated by an elevated co-localization rate, an increased phase separation of hetero- and euchromatin followed on day five. These findings were accompanied by an increase of the opposite regulator OCT4, SOX2 and p27 with p21Cip1, the promoters for stemness and senescence. Furthermore, changes in the topological characteristics of both hetero- and euchromatin on day three were measured, differently returning on day five for euchromatin and heterochromatin. In conclusion, the results indicated that by the fluctuations of chromatin organization considerable epigenetic changes are possible transferring the senescent state to the stemness state and vice versa.
Supplementary Materials
The following supporting information can be downloaded at the website of this paper posted on Preprints.org.
Author Contributions
Conceptualization, J.E. and M.H.; methodology, M.S., K.S. and F.R.; software, J.J. and M.H.; validation, M.B., J.Z., M.S. and J.J.; formal analysis, M.B., J.Z. and F.R.; investigation, J.E. and M.H.; resources, K.S., J.J. and F.B.; data curation, M.B. and M.S.; writing—original draft preparation, M.B., J.Z. and M.H.; writing—review and editing, M.B., J.Z., M.S., K.S., F.R., J.J., F.B., R.K., J.E. and M.H.; visualization, M.B., J.Z. and F:R.; supervision, J.E. and M.H.; project administration, R.K.; funding acquisition, R.K., J.E. and M.H. All authors have read and agreed to the published version of the manuscript.
Funding
The funding lzp-2022/1-0114 and support of the Baltic-German University Liaison with funds from the Foreign Office of the Federal Republic Germany are gratefully acknowledged.
Institutional Review Board Statement
Not applicable.
Informed Consent Statement
Not applicable.
Data Availability Statement
Data and software are part of the KIP SMLM data archive and can be obtained upon request from the corresponding author.
Acknowledgments
The authors thank all the members of the German-Latvian-Estonian collaboration for fruitful discussions and support. Special thanks to Alessandro Giuliani, Rome.
Conflicts of Interest
The authors declare no conflicts of interest.
Abbreviations
The following abbreviations are used in this manuscript:
| HC | Heterochromatin |
| EC | Euchromatin |
| ETO | Etoposide |
| NT | Non-treated |
| T | Treated |
| SMLM | Single Molecule Localization Microscopy |
References
- Meresse, P.; Dechaux, E.; Monneret, C.; Bertounesque, E. Etoposide: discovery and medicinal chemistry. Curr. Med. Chem. 2004, 11, 2443–2466. [Google Scholar] [CrossRef] [PubMed]
- Karpinich, N.O.; Tafani, M.; Rothman, R.J.; Russo, M.A.; Farber, J.L. The course of etoposide-induced apoptosis from damage to DNA and p53 activation to mitochondrial release of cytochrome c. J Biol Chem. 2002, 277, 16547–16552. [Google Scholar] [CrossRef] [PubMed]
- Muñoz-Espin, D.; Serrano, M. Cellular senescence: From physiology to pathology. Nat. Rev. Molec. Cell Biol. 2014, 482–496. [Google Scholar] [CrossRef]
- Xiao, S.; Qin, D.; Hou, X.; Tian, L.; Yu, Y.; Zhang, R.; Lyu, H.; Guo, D.; Chen, X.-Z.; Zhou, C.; Tang, J. Cellular senescence: a double-edged sword in cancer therapy. Front. Oncol. 2023, 13, 1189015. [Google Scholar] [CrossRef] [PubMed]
- Erenpreisa, J.; Salmina, K.; Anatskaya, O.; Cragg, M.S. Paradoxes of cancer: Survival at the brink. Seminars in Cancer Biology 2022, 81, 119–131. [Google Scholar] [CrossRef]
- Di Micco, R.; Krizhanovsky, V.; Baker, D.; d’Adda di Fagagna, F. Cellular senescence in ageing: From mechanisms to therapeutic opportunities. Nat. Rev. Mol. Cell. Biol. 2021, 22, 75–95. [Google Scholar] [CrossRef]
- Abd Al-razaq, M.A.; Freyter, B.M.; Isermann, A.; Tewary, G.; Mangelinck, A.; Mann, C.; Rübe, C.E. Role of Histone Variant H2A.J in Fine-Tuning Chromatin Organization for the Establishment of Ionizing Radiation-Induced Senescence. Cells.
- Gerashenko, B.I.; Salmina, K.; Eglitis, J.; Huna, A.; Grjunberga, V.; Erenpreisa, J. Disentangling the aneuploidy and senescence paradoxes: a study of triploid breast cancers non-responsive to neoadjuvant therapy. Histochem. Cell Biol. 2016, 145, 497–508. [Google Scholar] [CrossRef]
- Mosteiro, L.; Pantoja, C.; de Martino, A.; Serrano, M. Senescence promotes in vivo reprogramming through p16INK4a and IL-6. Aging Cell 2018, 17, e12711. [Google Scholar] [CrossRef]
- Salinas-Saavedra, M. ; Febrimarsa; Krasovec, G.; Horkan, H.R.; Baxevanis, A.D.; Frank, U. Senescence-induced cellular reprogramming drives cnidarian whole-body regeneration. Cell Reports, 1126. [Google Scholar]
- Jackson, T.R.; Salmina, K.; Huna, A.; Inashkina, I.; Jankevics, E.; Riekstina, U.; Kalnina, Z.; Ivanov, A.; Townsend, P.A.; Cragg, M.S.; Erenpreisa, J. DNA damage causes TP53-dependent coupling of self-renewal and senescence pathways in embryonal carcinoma cells. Cell Cycle 2013, 12, 430–441. [Google Scholar] [CrossRef]
- Huna, A.; Salmina, K.; Erenpreisa, J.; Vazquez-Martin, A.; Krigerts, J.; Inashkina, I.; Gerashchenko, B.I.; Townsend, P.A.; Cragg, M.S.; Jackson, T.R. Role of stress-activated OCT4A in the cell fate decisions of embryonal carcinoma cells treated with etoposide. Cell Cycle 2015, 14, 2969–2984. [Google Scholar] [CrossRef]
- Erenpreisa, J.; Salmina, K.; Vainshelbaum, N.M.; Inashkina, I.; Freivalds, T. Self-organization of early stress response in the biology of cancer. Postepy Biochemii 2024, 70, 33–38. [Google Scholar] [CrossRef]
- Schäfer, M.; Hildenbrand, G.; Hausmann, M. Impact of gold nanoparticles and ionizing radiation on whole chromatin organization as detected by Single-Molecule Localization Microscopy. Int. J. Mol. Sci. 2024, 25, 12843. [Google Scholar] [CrossRef] [PubMed]
- Elgin, SC.; Reuter, G. Position-effect variegation, heterochromatin formation, and gene silencing in Drosophila. Cold Spring Harb. Perspect Biol. 2013. [Google Scholar] [CrossRef] [PubMed] [PubMed Central]
- Lelec, M.; Gyparaki, M.T.; Beliu, G.; Schueder, F.; Griffie, J.; Manley, S.; Jungmann, R.; Sauer, M.; Lakadamyali, M.; Zimmer, C. Single-Molecule localization microscopy. Nat. Rev. Methods Primers 2021, 1, 39, Erratum in Nat. Rev. Methods Primers 2022, 2, 70. [Google Scholar] [CrossRef] [PubMed]
- Deschout, H.; Cella Zanacchi, F.; Mlodzianoski, M.; Diaspro, A.; Bewersdorf, J.; Hess, S.T.; Braeckmans, K. Precisely and accurately localizing single emitters in fluorescent microscopy. Nat. Methods 2014, 11, 253–266. [Google Scholar] [CrossRef]
- Lemmer, P.; Gunkel, M.; Weiland, Y.; Muller, P.; Baddeley, D.; Kaufmann, R.; Urich, A.; Eipel, H.; Amberger, R.; Hausmann, M.; Cremer, C. Using conventional fluorescent markers for far-field fluorescence localization nanoscopy allows resolution in the 10-nm range. J. Microsc. 2009, 235, 163–171. [Google Scholar] [CrossRef]
- Weidner, J.; Neitzel, C.; Gote, M.; Deck, J.; Küntzelmann, K.; Pilarczyk, G.; Falk, M.; Hausmann, M. Advanced image-free analysis of the nano-organization of chromatin and other biomolecules by Single Molecule Localization Microscopy (SMLM). Comput. Struct. Biotechnol. J. 2023, 21, 2018–2034. [Google Scholar] [CrossRef]
- Gao, C.; Miyazaki, M.; Li, J.W.; Tsuji, T.; Inoue, Y.; Namba, M. Cytogenetic characteristics and p53 gene status of human teratocarcinoma PA-1 cells in 407-445 passages. Int. J. Cell Biol. 1999, 4, 597–600. [Google Scholar] [CrossRef]
- Ripley, B.D. Modelling Spatial Patterns. J. R. Stat. Soc. Ser. B 1977, 39, 172–192. [Google Scholar] [CrossRef]
- Máté, G.; Heermann, D.W. Statistical analysis of protein ensembles. Front. Phys. 2014, 2, 20. [Google Scholar]
- Ghrist, R. Barcodes: The persistent topology of data. Bull. Am. Math. Soc. 2008, 45, 61–75. [Google Scholar] [CrossRef]
- Adams, H.; Chepushtanova, S.; Emerson, T.; Hanson, E.; Kirby, M.; Motta, F.; Ziegelmeier, L. Persistence images: A stable vector representation of persistent homology. J. Mach. Learn. Res. 2017, 18, 1–35. [Google Scholar]
- Pearson, K. On lines and planes of closest fit to systems of points in space. Lond. Edinb. Dublin Philos. Mag. J. Sci. 1901, 2, 559–572. [Google Scholar] [CrossRef]
- Erenpreisa, J.; Krigerts, J.; Salmina, K.; Gerashchenko, B.I.; Freivalds, T.; Kurg, R.; Krufczik, M.; Winter, R.; Zayakin, P.; Hausmann, M.; Giuliani, A. Heterochromatin networks: topology, dynamics, and function (a working hypothesis). Cells 2021, 10, 1582. [Google Scholar] [CrossRef]
- Falk, M.; Hausmann, M.; Schäfer, M.; Falková, I.; Toufar, J.; Toufarová, L. Deciphering chromosomal translocation mechanisms: The influence of tadiation type and chromatin architecture. In: Soloneski, S., ed., Chromosomal Abnormalities - From DNA Damage to Chromosome Aberrations. 2025. [Google Scholar] [CrossRef]
- Solov’yov, A.V.; Verkhovtsev, A.V.; Mason, N.J.; Amos, R.A.; Bald, I.; Baldacchino, G.; Dromey, B.; Falk, M.; Fedor, J.; Gerhards, L.; Hausmann, M.; Hildenbrand, G.; Hrabovský, M.; Kadlec, S.; Kočišek, J.; Lépine, F.; Ming, S.; Nisbet, A.; Ricketts, K.; Sala, L.; Schlathölter, T.; Wheatley, A.E.H.; Solov’yov, I.A. Condensed Matter Systems Exposed to Radiation: Multiscale Theory, Simulations, and Experiment. Chemical Reviews 2024, 124, 8014–8129. [Google Scholar] [CrossRef]
- Bartosova, M.; Saleem, A.; Schäfer, M.; Messerschmidt, G.; Schmitt, C.P.; Hausmann, M. 2025.
- Nicetto D, Zaret KS. Role of H3K9me3 heterochromatin in cell identity establishment and maintenance. Curr. Opin. Genet. Dev. 2019, 55, 1–10. [Google Scholar] [CrossRef]
- Beacon, T.H.; Delcuve, G.P.; López, C.; Nardocci, G.; Kovalchuk, I.; van Wijnen, A.J.; Davie, J.R. The dynamic broad epigenetic (H3K4me3, H3K27ac) domain as a mark of essential genes. Clin. Epigenet. 2021, 13, 138. [Google Scholar] [CrossRef]
- Salmina, K.; Huna, A.; Inashkina, I.; Belyayev, A.; Krigerts, J.; Pastova, L.; Vazquez-Martin, A.; Erenpreisa, J. Nucleolar aggresomes mediate release of pericentric heterochromatin and nuclear destruction of genotoxically treated cancer cells. Nucleus 2017, 8, 205–221. [Google Scholar] [CrossRef]
- Hausmann, M.; Wagner, E.; Lee, J.-H.; Schrock, G.; Schaufler, W.; Krufczik, M.; Papenfuß, F.; Port, M.; Bestvater, F.; Scherthan, H. Super-resolution localization microscopy of radiation-induced histone H2AX-phosphorylation in relation to H3K9-trimethylation in HeLa cells. Nanoscale 2018, 10, 4320–4331. [Google Scholar] [CrossRef]
- Scherthan, H.; Lee, J.-H.; Maus, E.; Schumann, S.; Muhtadi, R.; Chojowski, R.; Port, M.; Lassmann, M.; Bestvater, F.; Hausmann, M. Nanostructure of clustered DNA damage in leukocytes after in-solution irradiation with the alpha emitter Ra-223. Cancers 2019, 11, 1877. [Google Scholar] [CrossRef]
- Gruell, F.; Kirchgessner, M.; Kaufmann, R.; Hausmann, M.; Kebschull, U. Accelerating Image Analysis for Localization Microscopy with FPGAs. In Proceedings of the 2011 International Conference on Field Programmable Logic and Applications (FPL), Chania, Greece, 5–7 September 2011; pp. 1–5. [Google Scholar]
- Jahnke, K.; Struve, N.; Hofmann, D.; Gote, M.J.; Bach, M.; Kriegs, M.; Hausmann, M. Formation of EGFRwt/EGFRvIII homo- and hetero-dimers in glioblastoma cells as detected by single molecule localization microscopy. Nanoscale, 1524. [Google Scholar]
- Vogel, M.J.; Pagie, L.; Talhout, W.; Nieuwland, M.; Kerkhoven, R.M.; van Steensel, B. High-resolution mapping of heterochromatin redistribution in a Drosophila position-effect variegation model. Epigenet. Chromatin 2009, 2, 1. [Google Scholar] [CrossRef]
Figure 1.
Examples of confocal images of PA-1 cell nuclei. (A) non-treated cell nucleus. The intensity lines along the green line are shown on the right: Heterochromatin (red curve) shows increased density values where euchromatin (green curve) is reduced and vice versa. The blue curve shows the DAPI intensity. (B) EPO- treated cell nucleus (day three). The intensity lines along the green line are shown on the right: Heterochromatin (red curve) and euchromatin (green curve) maxima are not always separated or opposing, indicating an intermingling of heterochromatin and euchromatin in at least a part of the cell nucleus. The blue curve shows the DAPI intensity.
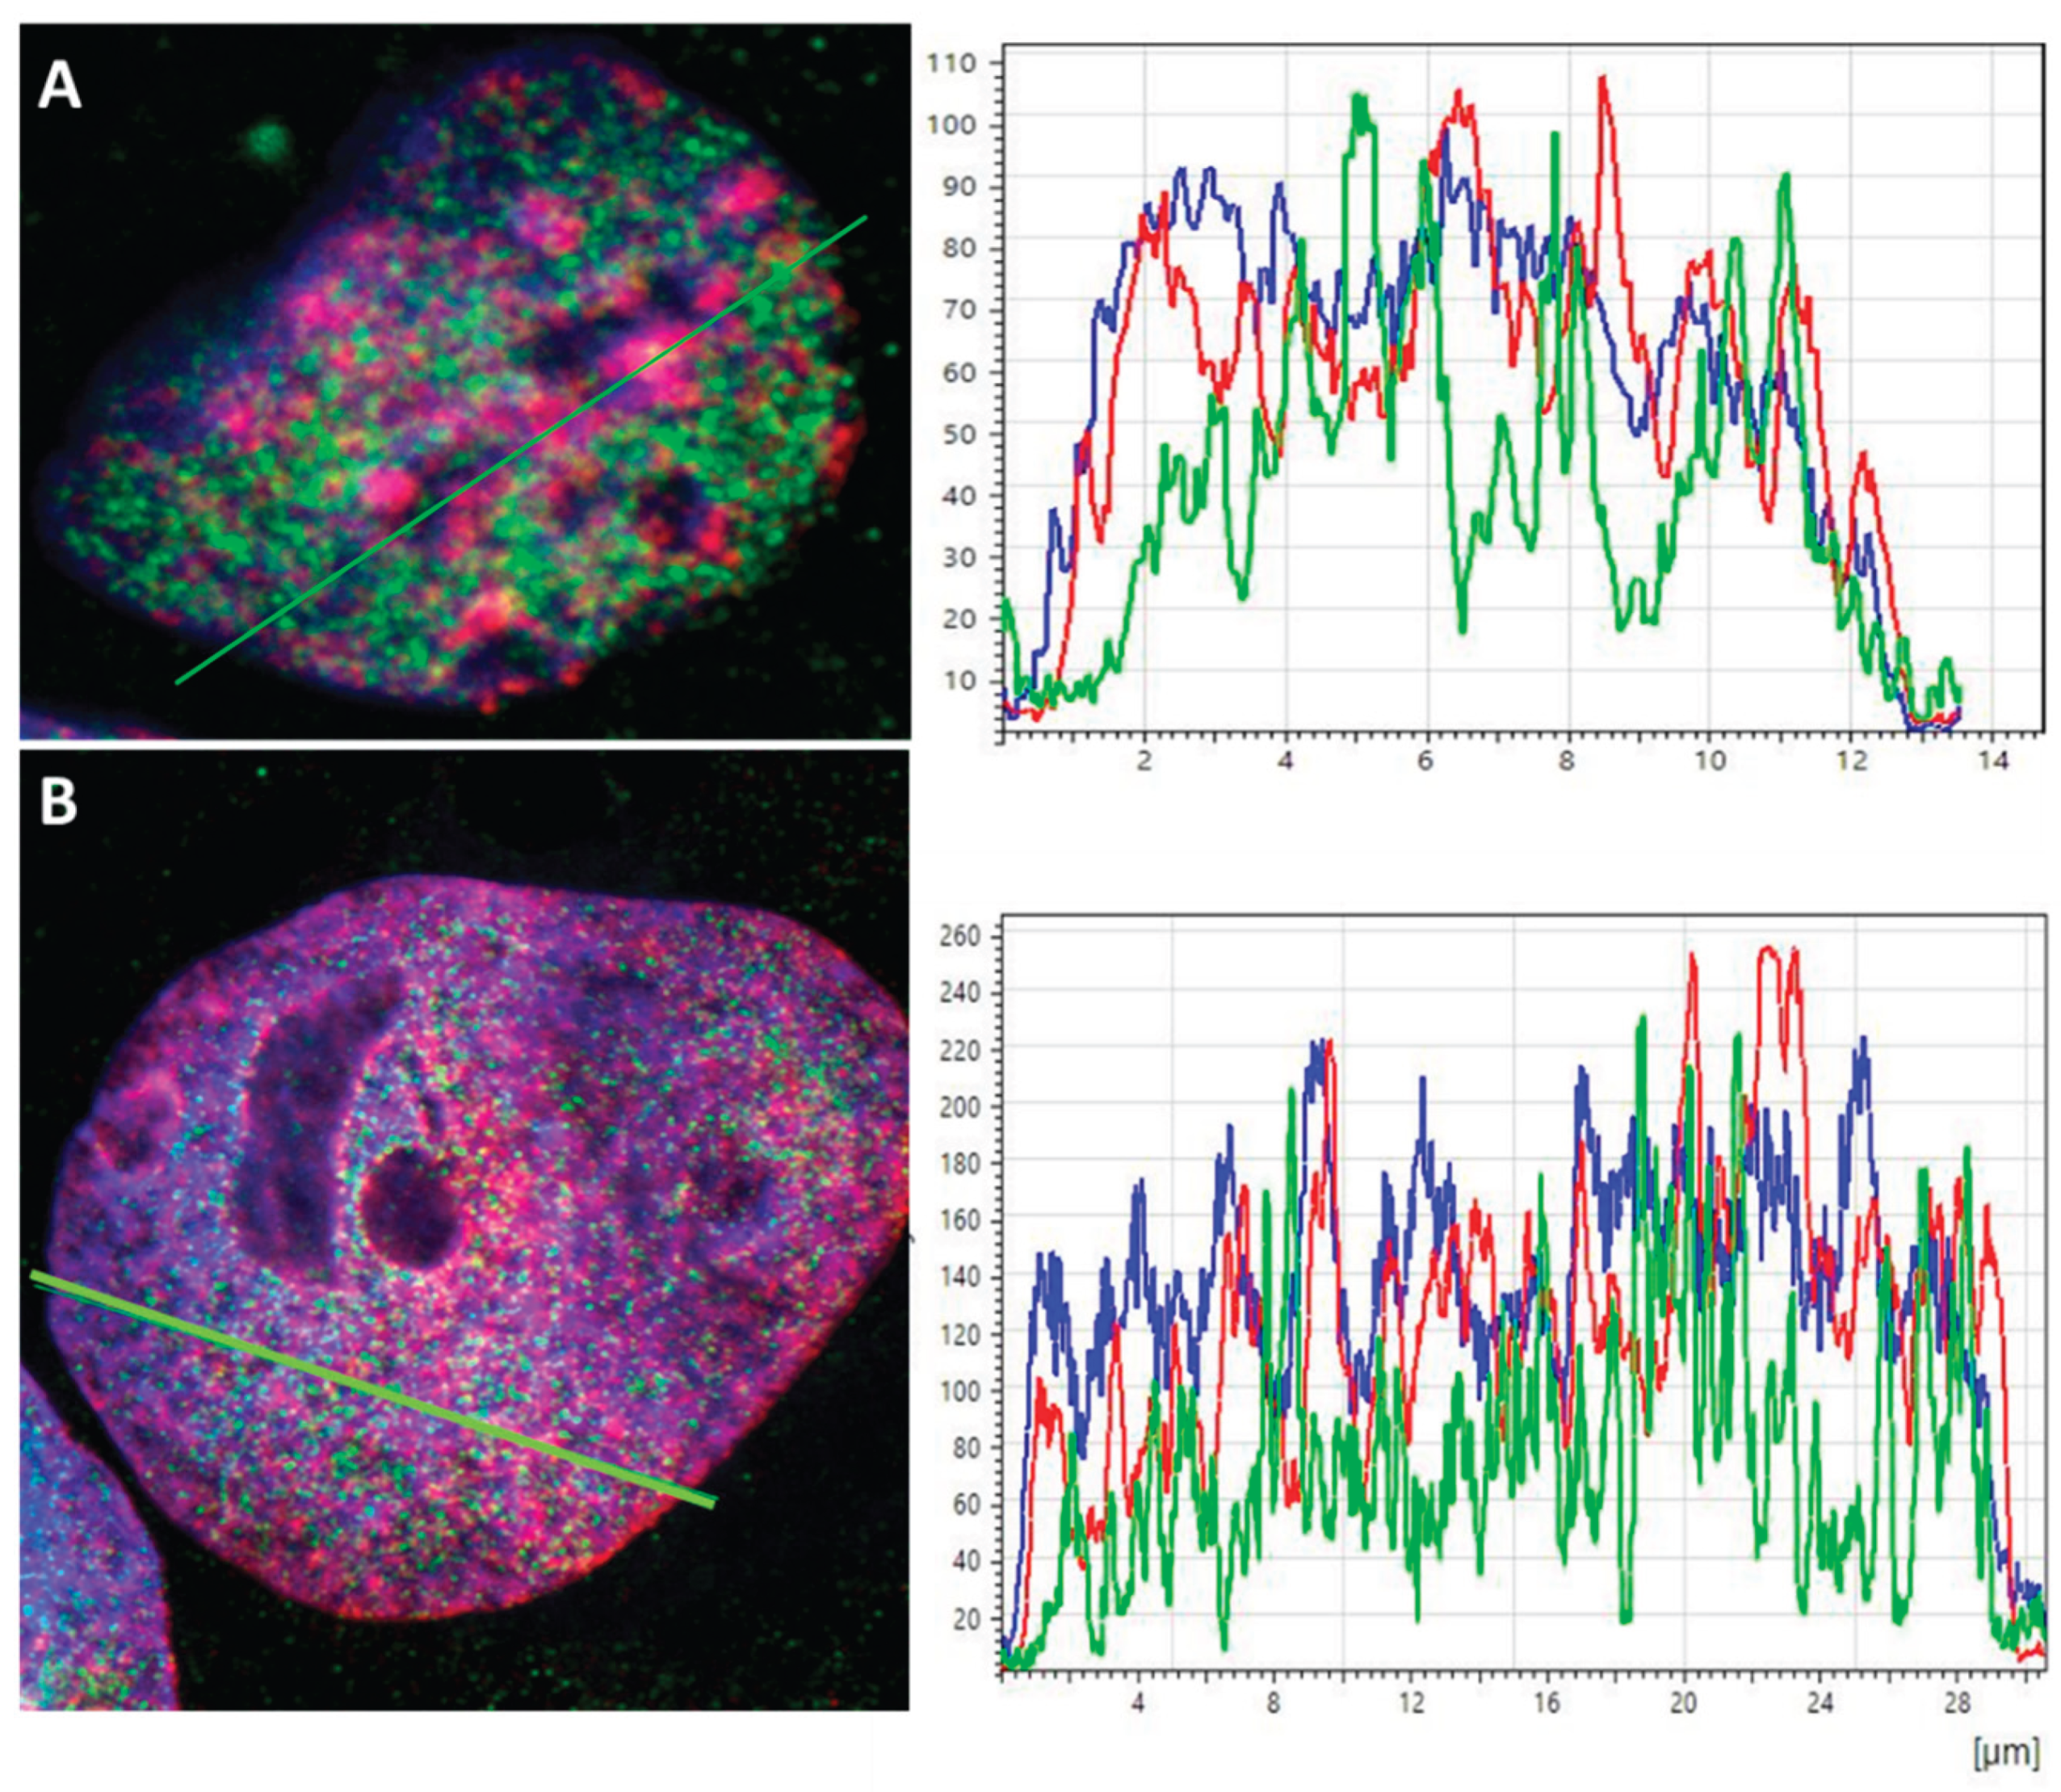
Figure 2.
Statistics of euchromatin and heterochromatin organization in PA-1 cells and their changes after etoposide treatment. Euchromatin (EC), marked by H3K4me3 (yellow), and heterochromatin (HC), marked by H3K9me3 (blue), were analyzed under different conditions: non-treated (NT) at days 3 and 5, and etoposide treated (T or ETO) at days 3 and 5. (a) Mask size represents total nuclear area of PA-1 cells. (b) Average cluster area for euchromatin and heterochromatin. (c) Relative density inside chromatin clusters. (d) The amount of chromatin clusters per cell. (e) Distance frequency histogram of the pairwise distances between measured signals within nuclei (Ripley statistics). The peaks on the left represent cluster formation in the size of about 160 nm in diameter. The follow-up linear increase is compatible with a random distribution. Error bars in (a) – (d) represent the SD.
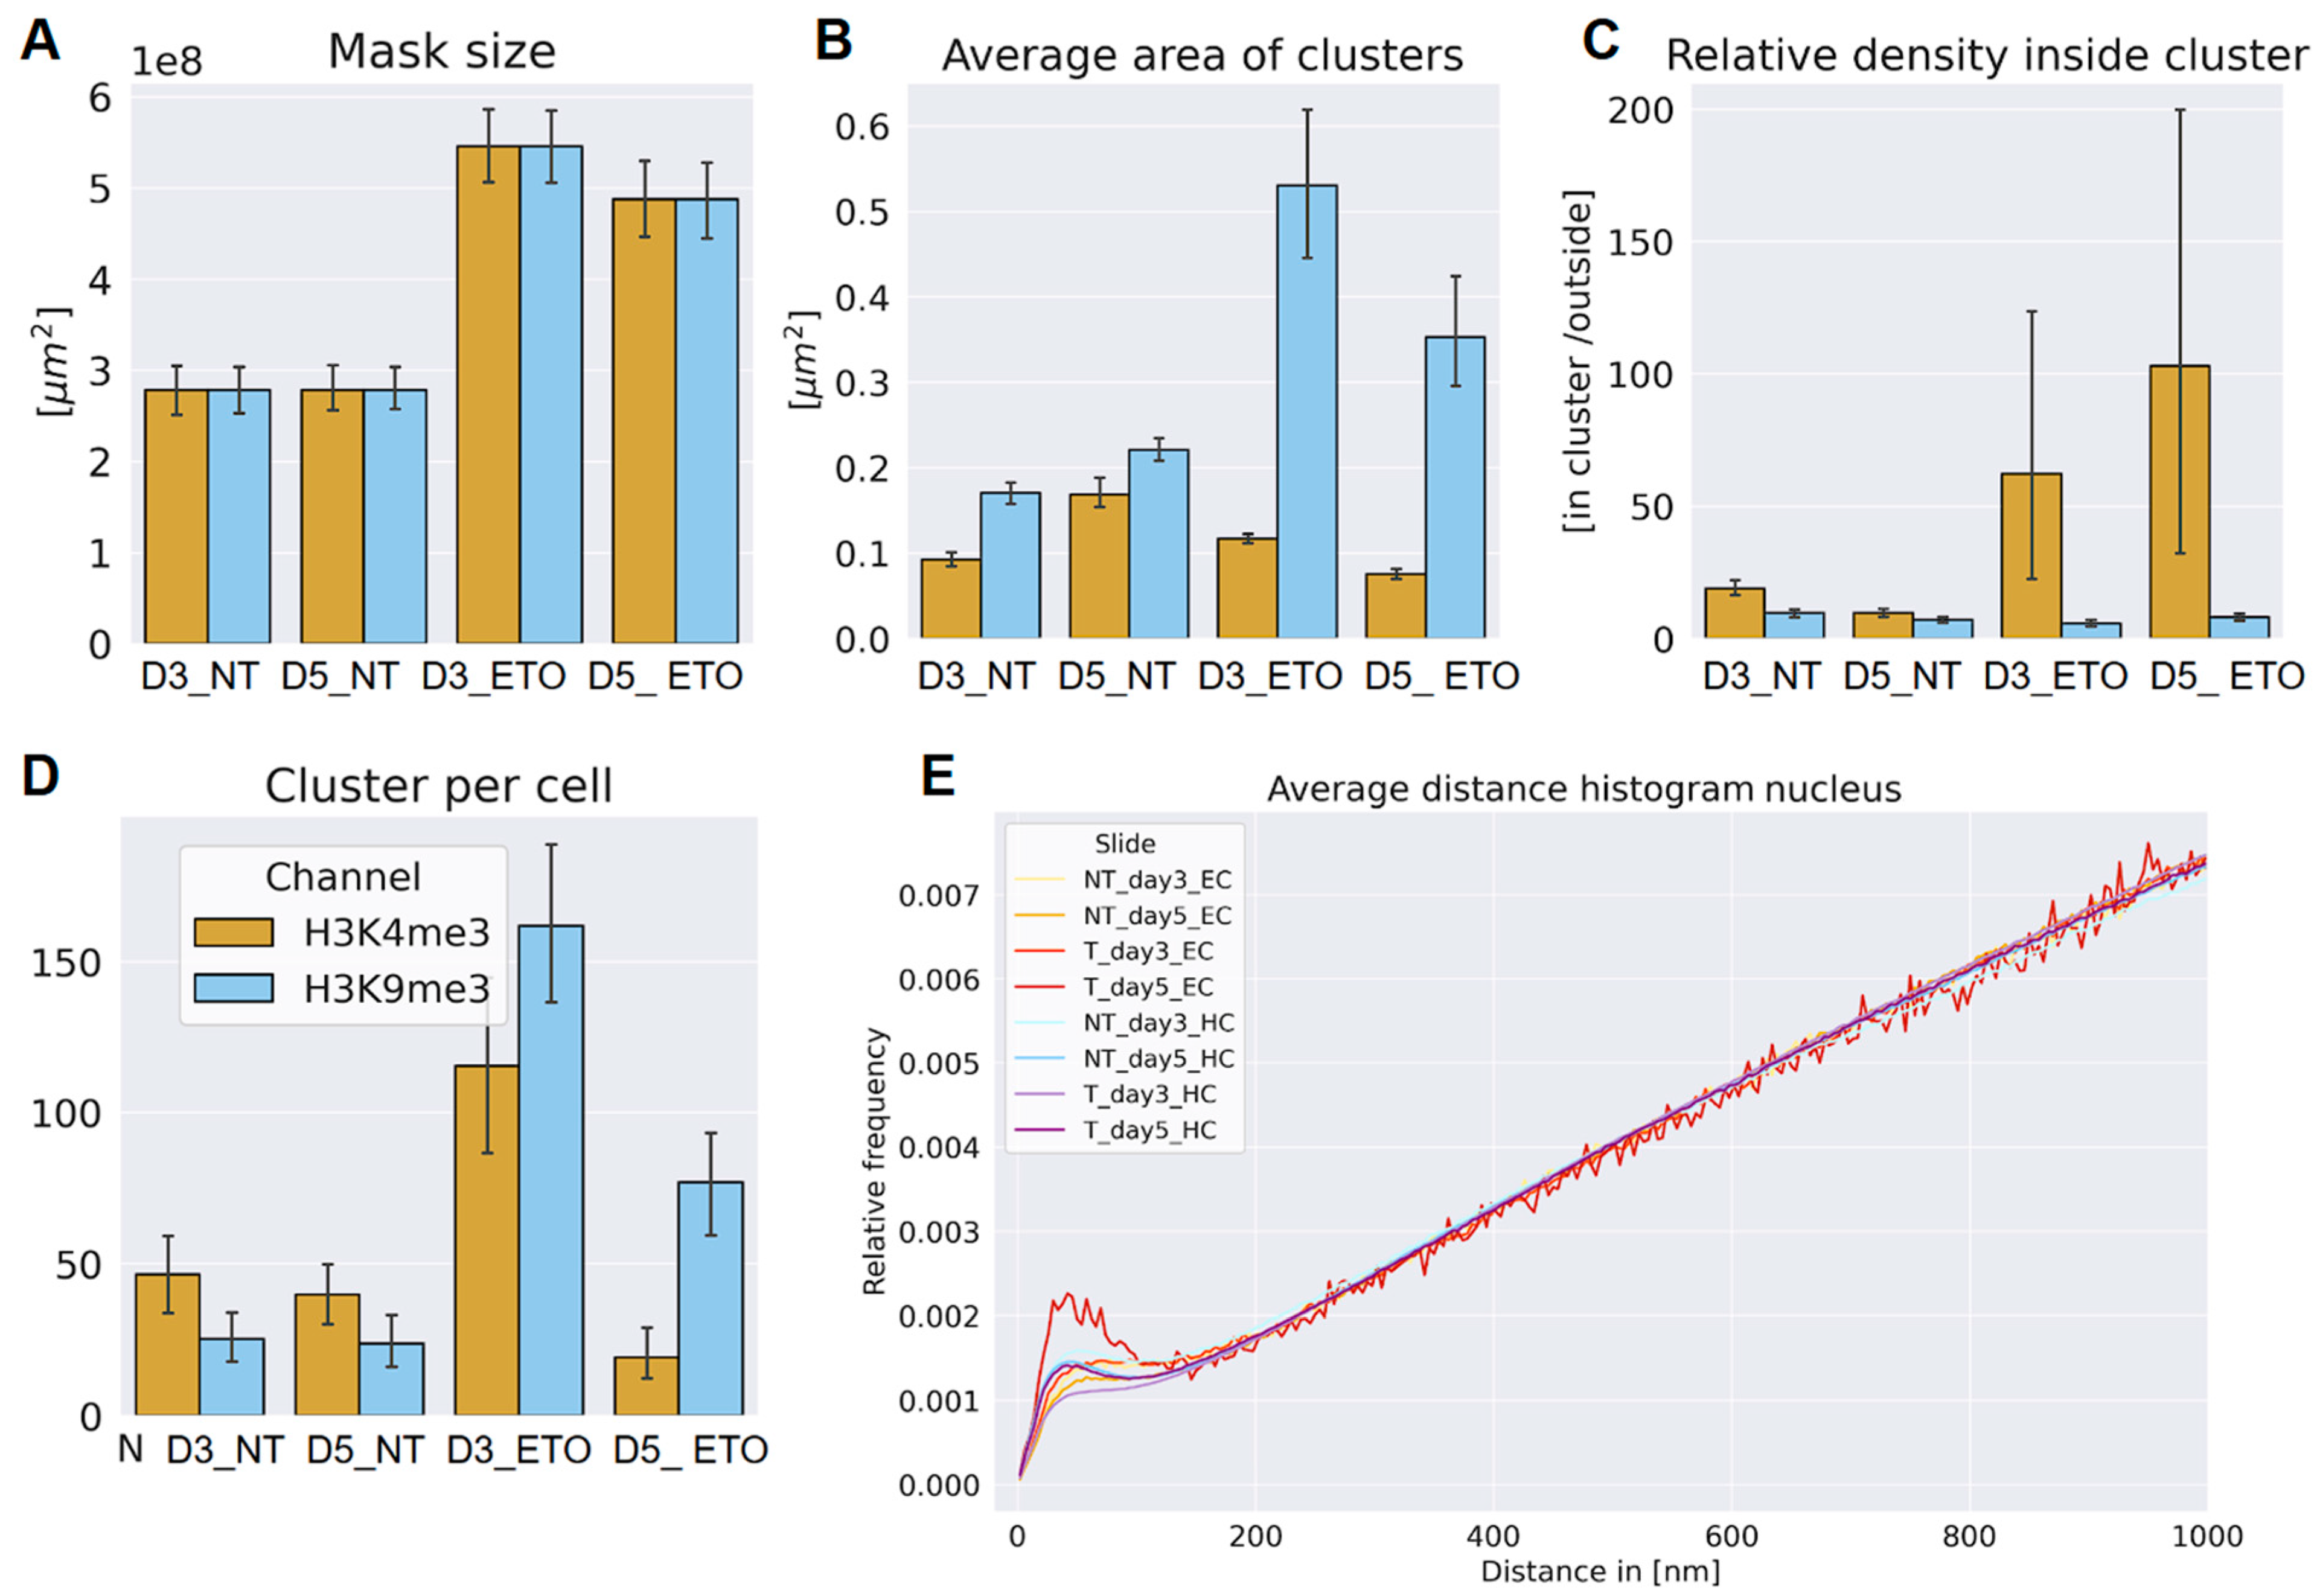
Figure 3.
Co-localization example images of non-treated (NT) and ETO-treated cells: red signals represent co-localization between euchromatin and heterochromatin tags (distance ≤ 95 nm), blue signals euchromatin (H3K4me3) and green signals heterochromatin (H3K4me3). (a) colocalization in a non-treated cell (NT) on day five (b) co-localization in a treated cell on day three (D3).
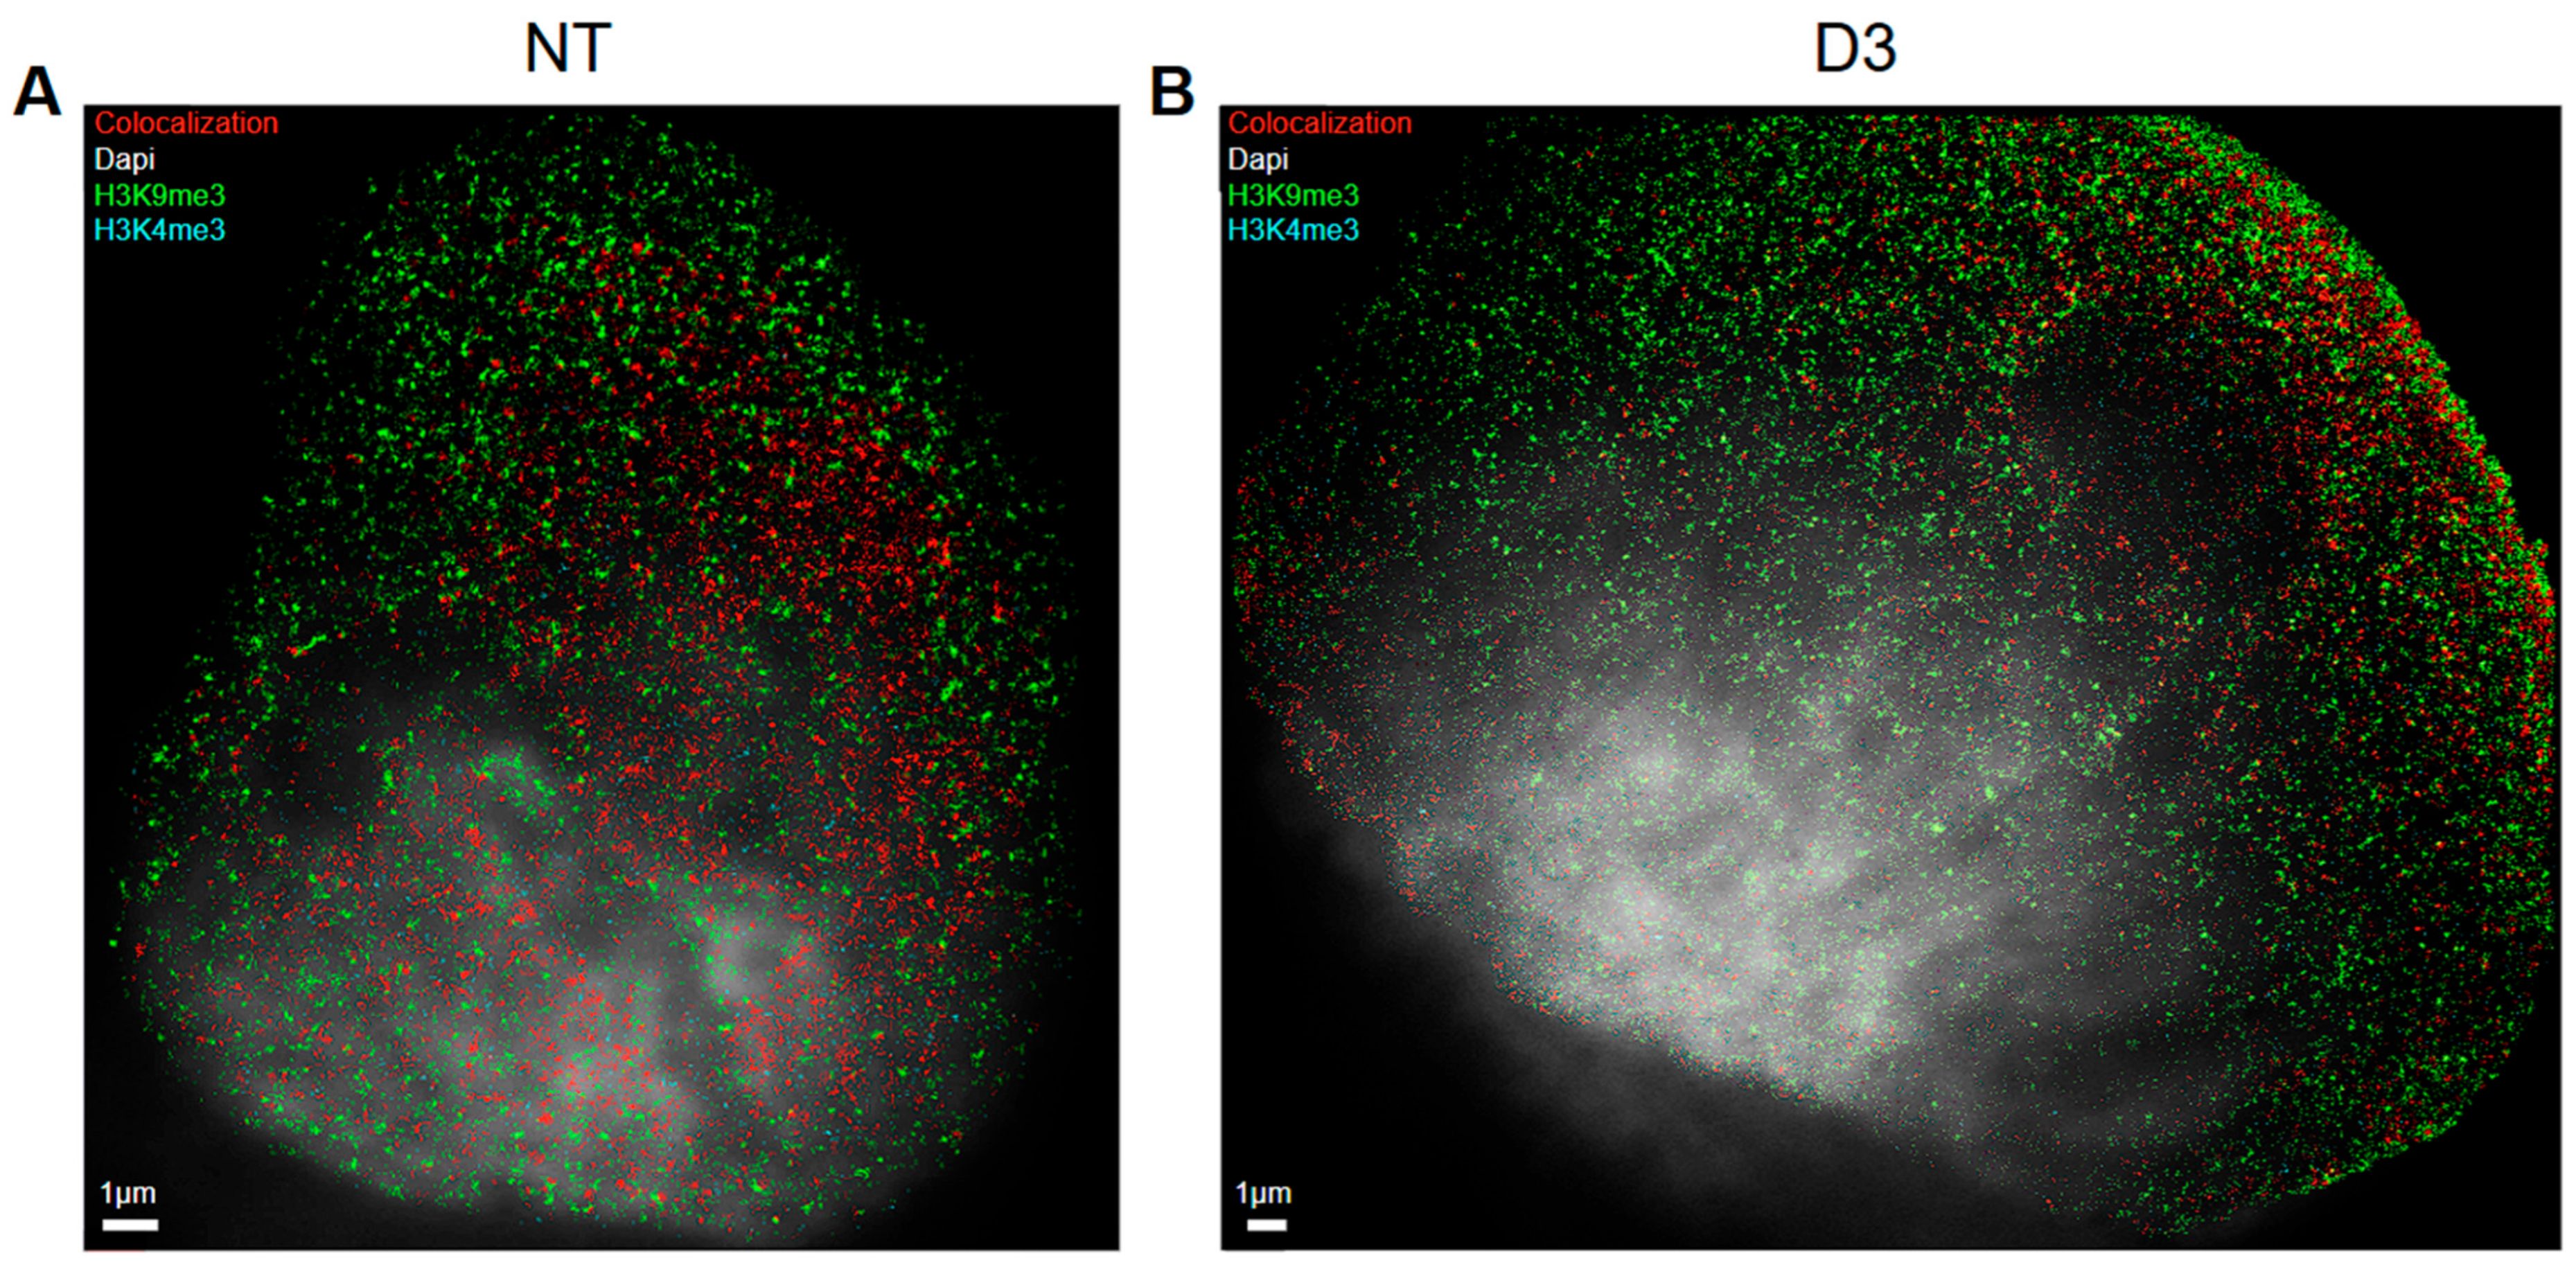
Figure 4.
Percentage of overlap in cluster area between hetero- (HC) and euchromatin (EC) in ETO-treated (T) cells in comparison to non-treated (NT) cells. Error bars show the standard deviation. (a) percentage of H3K9me3 clusters (HC) that overlap with H3K4me3 clusters (EC). (b) percentage of H3K4me3 clusters (EC) that overlap with H3K9me3 clusters (HC). (c) percentage of H3K9me3 fluorescent signals (HC) in H3K4me3 clusters (EC) that co-localize with H3K4me3 (EC) fluorescent signals. (d) percentage of H3K4me3 fluorescent signals (EC) in H3K9me3 clusters (HC) that co-localize with H3K9me3 fluorescent signals (HC). Note that all figures have a different scaling!
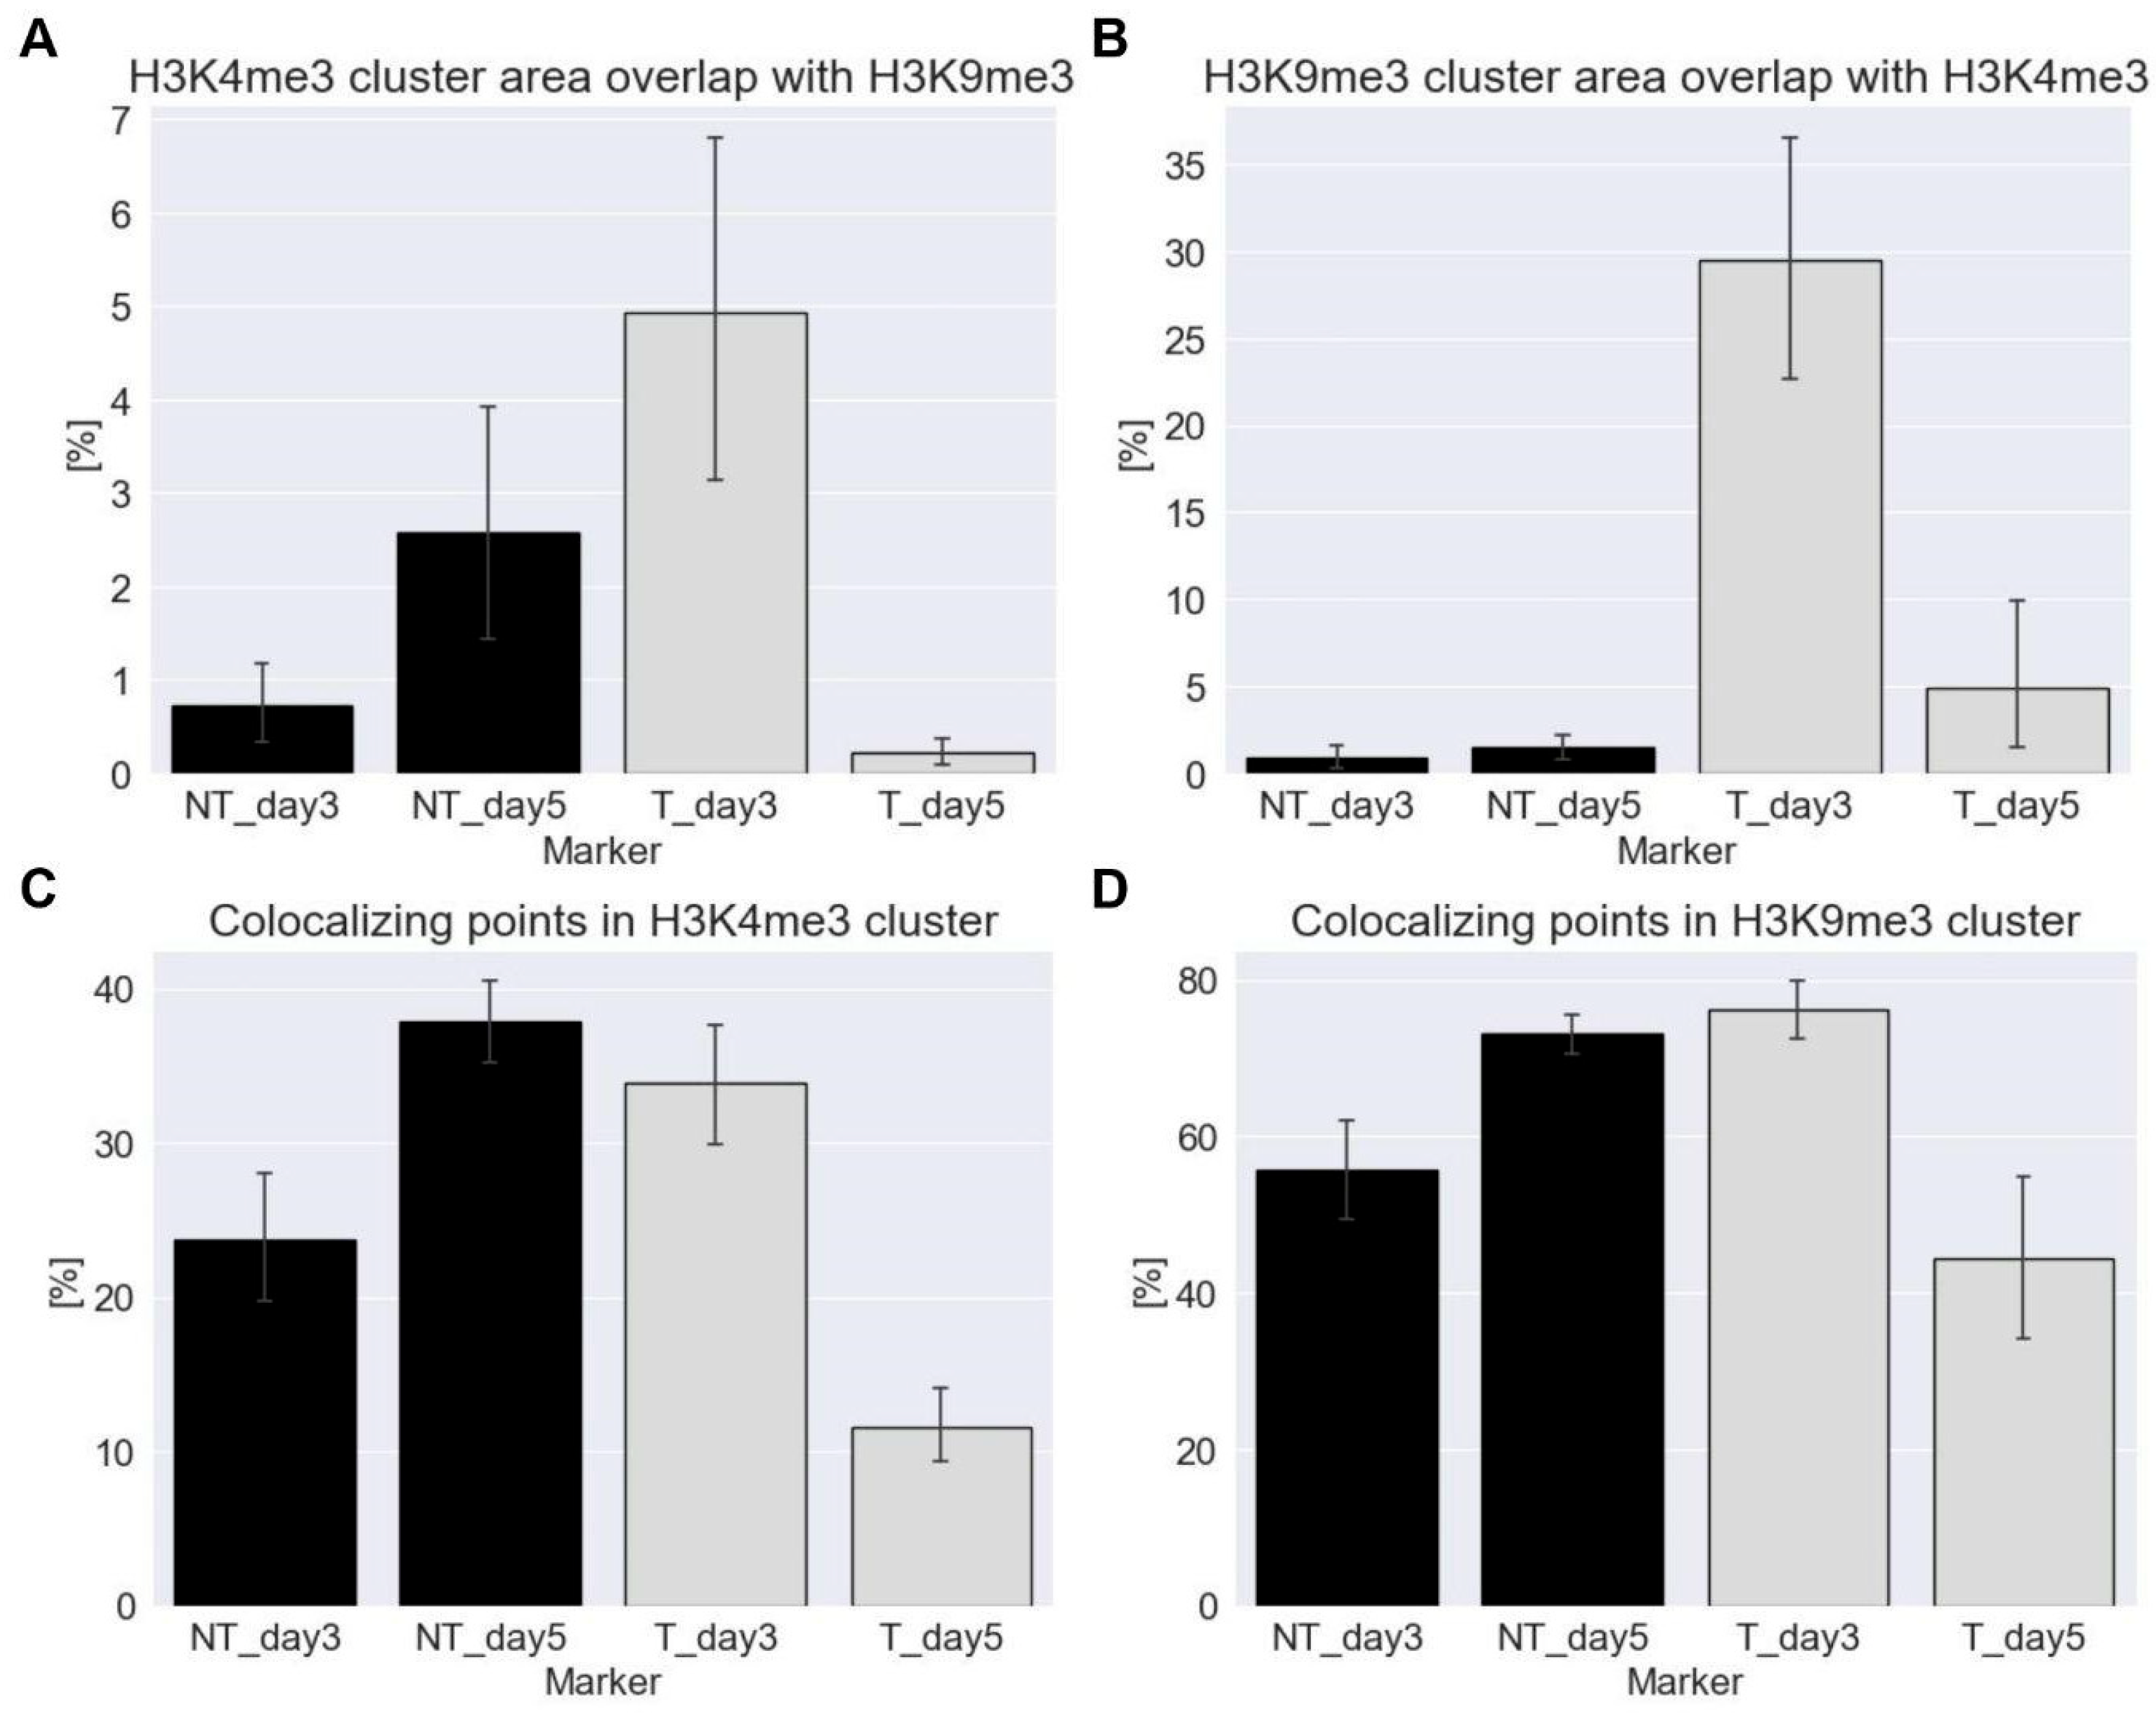
Figure 5.
Principal Component Analysis (PCA) of the chromatin topology of ETO-treated PA-1 cells in comparison to non-treated control cells. Component 0 in the latent space represents a clear distinction between euchromatin and heterochromatin features while component 1 indicates the fluctuation of euchromatin (day 3 to day 5 vs. control) and heterochromatin (day 3 AND day 5 vs. control) of the ETO-treated samples during the time period of day three and five. The differences in the non-treated control cells might be due to chromatin organization changes during the cell cycle.
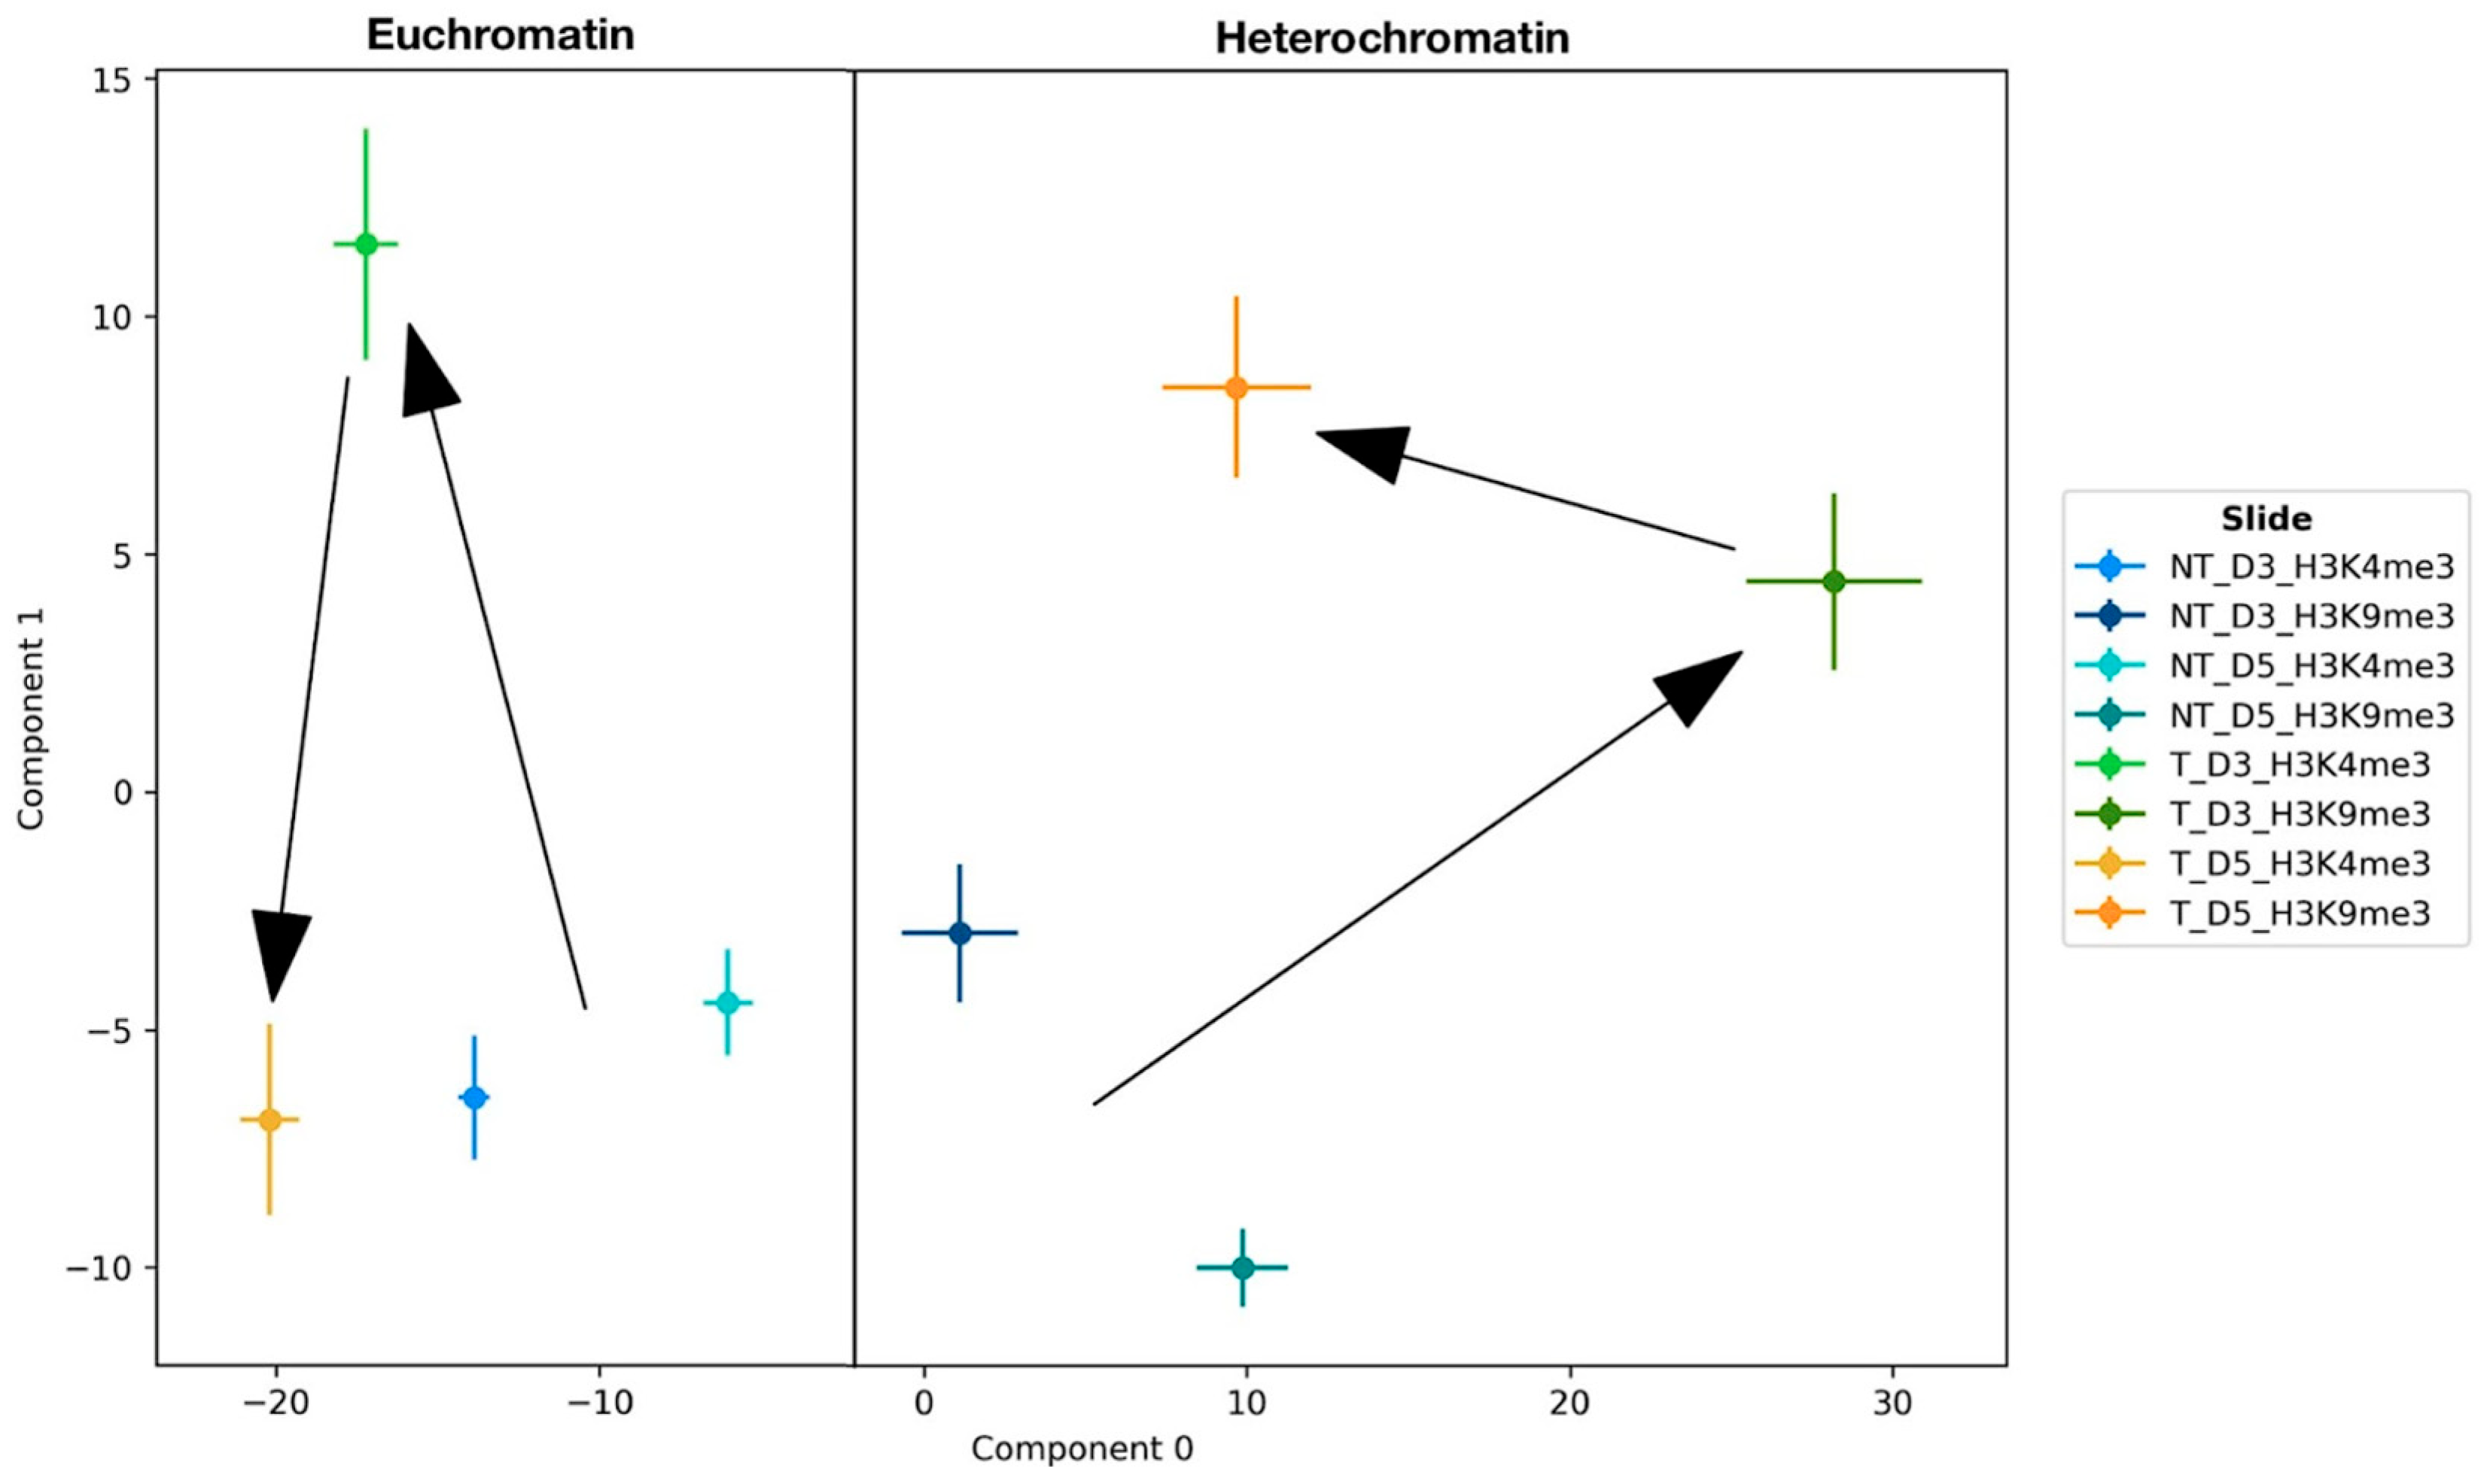
Figure 6.
Flow cytometry of cell cycle checkpoint regulator expression after ETO-treatment. (a) Analysis of SOX2 and p27 on days three, five and ten after ETO-treatment compared to the non-treated (NT) control. (b) Analysis of OCT4A and p21Cip1 on days three, five and ten after ETO-treatment compared to the non-treated (NT) control. [Note: The abscissa in (a) and (b) are given in relative fluorescence since a flow cytometer does not measure absolute intensity values] (c) Analysis of γH2AX expression in ETO-treated cells on days three, five and ten compared to the non-treated (NT) control indicating a considerable amount of double strand breaks after ETO-treatment.
Disclaimer/Publisher’s Note: The statements, opinions and data contained in all publications are solely those of the individual author(s) and contributor(s) and not of MDPI and/or the editor(s). MDPI and/or the editor(s) disclaim responsibility for any injury to people or property resulting from any ideas, methods, instructions or products referred to in the content. |
© 2025 by the authors. Licensee MDPI, Basel, Switzerland. This article is an open access article distributed under the terms and conditions of the Creative Commons Attribution (CC BY) license (http://creativecommons.org/licenses/by/4.0/).
Copyright: This open access article is published under a Creative Commons CC BY 4.0 license, which permit the free download, distribution, and reuse, provided that the author and preprint are cited in any reuse.


