
Submitted:
20 January 2023
Posted:
24 January 2023
You are already at the latest version
Abstract
Increased mitotic activity is associated with the genesis and aggressiveness of many cancers. To assess the clinical value of mitotic activity as prognostic biomarker, we performed a pan-cancer study on the mitotic network activity index (MNAI) constructed based on 54-gene mitotic apparatus network. Our pan-cancer assessment on TCGA (33 tumor types, 10,061 patients) and validation on other publicly available cohorts (23 tumor types, 9,209 patients) confirmed the significant association of MNAI with overall survival, progression-free survival and other prognostic endpoints in multiple cancer types, including Lower-Grade Gliomas (LGG), Breast Invasive Carcinoma (BRCA) and many others. We also showed significant association of MNAI with genetic instability, which provides a biological explanation of its prognostic impact at pan-cancer landscape. Futhermore, we found that patients with high MNAI benefit more from anti-PD-1 and Anti-CTLA-4 treatment. In addition, we demonstrated on LGG and BRCA that the multimodal integration of MNAI and the AI-empowerd Cellular Morphometric Subtypes (CMS) significantly improved the predictive power of prognosis compared to MNAI and CMS alone. Our results suggest that MNAI can be used as a potential prognostic biomarker for different tumor types toward different clinical endpoints, and multimodal integration of MNAI and CMS exceeds individual biomarker for precision prognosis.
Keywords:
pan-cancer
; mitotic network activity index
; prognostic biomarker
; genetic instability
; immunotherapy
; multimodal biomarker
; cellular morphometric subtype
1. Introduction
A high proliferation rate is one of the hallmarks of cancer (1). Cancer cells acquire the capability to enable chronic proliferation through genetic and epigenetic alterations (2). A few methods have been developed for clinical use to assess proliferative activity, such as the Ki-67 nuclear antigen and mitotic index. The mitotic index, the ratio of the number of cells undergoing mitosis to the total number of cells in a population, has been widely used in clinical practice for tumor grading and staging (3-5). Moreover, the mitotic index has been successfully demonstrated to associate with patient survival in many cancer types (3,6-8). In clinical practice, mitotic activity was typically evaluated as the number of mitotic figures in the high-power field or per fixed number of tumor cells through immunohistochemical (IHC) staining. With biotechnique advances, we seek a new approach to assess proliferative activity for prognostic impact.
Cell proliferation, the increase in cell numbers resulting from cell division, is tightly regulated by an intricate network of structural proteins, molecular motors, regulatory kinases, and phosphatases for error-free chromosome segregation. The ensemble of such upregulated genes that encode these proteins forms the mitotic apparatus network (9) and shows biological and clinical associations with cancer (6,10-13). Furthermore, the association of elevated mitotic activity with the genesis and progression of many cancers encourages the development and evaluation of small molecule inhibitors of mitotic apparatus proteins as anticancer agents (6,14). Despite the clinical trials on cancer treatment, it is also essential to evaluate the prognostic value of mitotic activity in different tumor types for potential clinical implications.
In this study, we define the mitotic network activity index (MNAI) as the sum of the expression of 54 genes pre-identified in the mitotic apparatus network (9), which can potentially overcome the inter-observer variations due to labor-intensive human counting, and provides an efficient and effective prognostic biomarker with clinical utility. Our previous study has shown that higher MNAI is significantly associated with poor overall survival in breast cancer (9). To further assess the clinical value of MNAI as a prognostic biomarker, we performed a pan-cancer study on MNAI. We demonstrated the association of MNAI with genetic instability at the pan-cancer level; and confirmed its prognostic value across tumor types, which covers the major cancers, including carcinoma, leukemia, lymphoma, melanoma, and tumors related to the central nervous system. Our results suggest that MNAI can be used as a potential prognostic biomarker for different tumor types toward different clinical endpoints.
2. Materials and Methods
2.1. Definition of Mitotic Network Activity Index (MNAI)
MNAI is defined as the sum of the expression of 54 genes pre-identified in the mitotic apparatus network (9), including AURKA, AURKB, BUB1, CENPE, CHEK1, FOXM1, MELK, PBK, PLK1, TTK, TYMS, ASPM, BUB1B, CCNA2, CCNB1, CCNB2, CDC20, CDCA3, CDCA8, CENPA, CENPN, CEP55, DDX39A, DEPDC1, DLGAP5, EXO1, EXOSC9, FAM64A1, HJURP, KIF14, KIF18B, KIF20A, KIF23, KIF2C, KIF4A, LMNB2, MAD2L1, MCM10, MKI67, NCAPD2, NCAPG, NCAPG2, NCAPH, NDC80, PRC1, PTTG1, RFC3, RRM2, SMC4, STIL, TEX10, TPX2, UBE2S.
2.2. Datasets
MNAI was assessed on 10,061 patients in 33 tumor types from The Cancer Genome Atlas (TCGA) project (https://www.cbioportal.org/), including ACC, BLCA, BRCA, CESC, CHOL, COAD, DLBC, ESCA, GBM, HNSC, KICH, KIRC, LAML, LGG, LIHC, LUAD, LUSC, MESO, OV, PAAD, PCPG, PRAD, READ, SARC, SKCM, STAD, TGCT, THCA, THYM, UCEC, UCS and UVM (Supplementary Table 1); and validated on 28 published datasets on 23 tumor types (Supplementary Table 2), including three brain tumor cohorts from the Chinese Glioma Genome Atlas (CGGA) project (http://www.cgga.org.cn/); and 5 tumor types from the Kaplan-Meier Plotter database (https://kmplot.com/analysis/).
2.3. Biological Evaluation of MNAI
The difference in MNAI between tumor and normal samples was evaluated in 25 tumor types using TNMplot (https://tnmplot.com/analysis/). Alternation frequency of genetic variants, including mutation, chromosome structural variant, amplification, deep deletion, and multiple alternations, were evaluated in 32 tumor types in TCGA using cBioPortal. Also, the aneuploidy score, mutation count, fraction genome altered, and tumor mutation burden (TMB) were compared between altered and unaltered groups using cBioPortal.
2.4. Clinical Evaluation of MNAI
The patients in each cohort were stratified into low-/high-MNAI groups using surv_cutpoint function in survminer R package based on overall survival (OS) or progression-free survival (PFS). The prognostic value of MNAI in terms of low and high categories was evaluated using univariate Cox Proportional-Hazards Model (CoxPH) and Kaplan-Meier survival curves towards different prognostic outcomes, including OS, PFS, disease-free survival (DFS), event-free survival (EFS), metastasis-free survival (MFS), relapse-free survival (RFS) and biochemical failure-free survival (BFFS). KMPLOT (http://kmplot.com/analysis/) was used to assess the association of MNAI with beneficiaries from different immunotherapies in pan-cancer patients.
2.5. Multimodal Integration and Evaluation of MNAI and Cellular Morphometric Subtype
The patient Cellular Morphometric Subtype (CMS) was defined by AI-empowered technique based on whole slide images of tissue histolgogy, which has been detaily describled in (15). In this study, CMSs in TCGA-LGG and TCGA-BRCA cohorts were pre-established in our previous studies (15-17). And the multimodal integration and evaluation was based on multivariate CoxPH model (17). Specifically, concordance index (C-index) were used to evaluate the performance of the CMS, MNAI and integrated models, with 1000 bootstrapping iterations and an 80% sampling rate per iteration. Mann-Whitney non-parametric test was used for the comparison across models.
2.6. Statistical Analysis
All statistical analyses were performed in R (version 3.6.0). The univariate and multivariate CoxPH model (survival package in R, version 3.2-7) and Kaplan-Meier analysis (survminer package in R, version 0.4.9) was used to assess the prognostic value of MNAI. Mann-Whitney nonparametric test was used to test the statistical difference for continuous variables with a significant threshold at p<0.05.
3. Results
3.1. MNAI is Signficantly Elevated in Tumors compared to Normal Samples
One of the major characteristics of cancerous tissue is rapid proliferation, where an increased proportion of cells undergo mitosis compared to normal ones. To confirm the power of MNAI in differentiating cancerous tissues from normal tissues, we evaluated the MNAI abundance among 25 different tumor types (Figure 1). Unsurprisingly, our results indicated significantly elevated MNAI in cancerous tissues among all tumor types (p < 0.0001).
3.2. The MNAI Significantly Associates with Genetic Instability
Genomic instability is a common characteristic of most cancers, as reflected by the increased tendency of genome alteration during cell division, and is associated with increased mitotic activity (10). Our thorough evaluation based on 32 tumor types in TCGA revealed a dynamic genetic alternation frequency in MNAI genes per tumor type (ranging from ~80% in lung squamous cell carcinoma (LUSC) to less than 10% in thyroid carcinoma (THCA) (Figure 2A), including mutation, chromosome structural variant, amplification, deep deletion, and multiple alternations. Not surprisingly, MNAI in altered samples is signficantly higher than in unaltered samples (Figure 2A, inserted panel), suggesting genetic alteration is one possbile mechanism for alevated MNAI. Furthermore, significantly different aneuploidy scores (p<1.0E-15, Figure 2B), mutation count (p<1.0E-15, Figure 2C), fraction genome altered (p<1.0E-15, Figure 2D), and tumor mutation burden (TMB, p<1.0E-15, Figure 2E) were detected at the pan-cancer level between altered and unaltered patient groups with respect to MNAI genes. Such signficant difference were also observed between high and low MNAI groups within both althered and unaltered patients (Supplementary Figure 1), where the MNAI high/low stratfication was optmized towards overall survial (OS) at pan-cancer level. These findings indicate that alteration in MNAI genes leads to genomic instability in human cancer.
3.3. MNAI Signficantly Associates with Prognosis
Increased mitotic activity is a hallmark of cancer aggressiveness (9), and therefore associated with the prognosis of cancer patients. The evaluation and validation of MNAI on 32 different tumors confirm its significant prognostic value in the pan-cancer landscape. Specifically, in TCGA pan-cancer cohort (Supplementary Table 1), at pan-cancer level, both genetic alteration within MNAI genes (Figure 3A) and MANI (Figure 3B) are signficantly associated with PFS and OS. Imporantly, MNAI overrided genetic alteration (Figure 3C) in pan-cancer prognosis. Therefore, our remaning study focused on MNAI. Consistent with previous studies, genomic instability factors signfiantly correlated with prognosis (Supplmentary Figure 2), and our multivairate analysis indicated the indepdent and superior prognostic power of MNAI compared with genomic instability factors (Figure 3D).
At tumor-type-specific level, MNAI is significantly associated with PFS (Figure 4A and 4B, Supplementary Figure 3) and OS (Figure 4C and 4D, Supplementary Figure 4) of multiple tumor types, including LGG (Figure 3B, p<0.0001 on PFS; Figure 3D, p<0.0001 on OS), COAD (Figure 4B, p=0.0057 on PFS; Figure 4D, p=0.0057 on OS), LUAD (Figure 4B, p=0.0012 on PFS; Figure 4D, p=0.0035 on OS), and STAD (Figure 4B, p=0.0032 on PFS; Figure 4D, p=0.0012 on OS). Importantly, the pan-cancer prognostic value of MNAI was further confirmed on independent cohorts (Figure 5, Supplementary Figure 5, Supplementary Table 2), where the significant and consistent prognostic value of MNAI was observed on multiple tumor types, including LGG (Figure 5B, p<0.0001 on OS), COAD (Figure 5B, p=0.0057 on OS), LUAD (Figure 5B, p=4.4E-11 on OS), and Gastric (Figure 5B, p=1.7E-07 on OS). In addition, significant associations of MNAI with different prognostic endpoints were also observed (Supplementary Figure 5), including event-free survival (ACC on GSE76021, p<0.001), disease-free survival (CESC on GSE44001, p=0.0016), biochemical failure-free survival (PRAD on GSE116918, p<0.0001), metastasis-free survival (UVM on GSE22138, p=0.014), and relapse-free survival (BRCA, p<1.0E-16). Interestingly, although the high mitotic activity is typically associated with the genesis and progression of many cancers, resulting in unfavorable prognosis on, e.g., in TCGA datasets regarding OS (Figure 4A; LGG, HR=3.14, 95% CI: 2.20-4.48, p=3.0E-10; LUAD, HR=1.82, 95% CI: 1.30-2.54, p=0.00043), and PFS (Figure 4C; LGG, HR=2.38, 95% CI:1.79-3.16, p=2.68E-09; LUAD, HR=1.67, 95% CI: 1.22-2.29, p=0.0013), however, reversed prognosis impact of MNAI was also consistently observed on multiple tumors, including COAD and STAD with respect to both OS (Figure 4A; COAD, HR=0.57, 95% CI: 0.38-0.85, p=0.0064; STAD, HR=0.66, 95% CI: 0.48-0.91, p=0.012), and PFS (Figure 4C; COAD, HR=0.60, 95% CI: 0.41-0.86, p=0.0063; STAD, HR=0.60, 95% CI: 0.41-0.86, p=0.0035) on TCGA database; as well as on independent cohorts concerning OS (Figure 5A; COAD, HR=0.65, 95% CI: 0.48-0.88, p=0.0061; STAD, HR=0.55, 95% CI: 0.43-0.69, p=1.7E-07). Such difference possibly originated from the difference in cancer biology and treatment across tumor types (18).
3.4. MNAI Predicts the Beneficial Effects of Immunotherapy
An increasing number of studies show that tumor mutation burden (TMB) is a predictive biomarker for immunotherapy (19,20). Therefore, we assessed whether MNAI predicts the beneficial effects of immunotherapy. KMPlot analysis showed that cancer patients with high MNAI significantly prolonged PFS after anti-PD-1 (p = 0.00021, Figure 6A) and anti-CTLA-4 (p = 0.00071, Figure 6B) treatment but not after anti-PD-L1 treatment (p = 0.22, Figure 6C). Similar observations were found for OS (Figure 6D-6F). These findings suggest that MNAI can potentially serve as a predictive biomarker for selecting patients for certain types of immunotherapy.
3.5. Multimodal integration of MNAI and CMS significantly improve the predictive power of prognosis
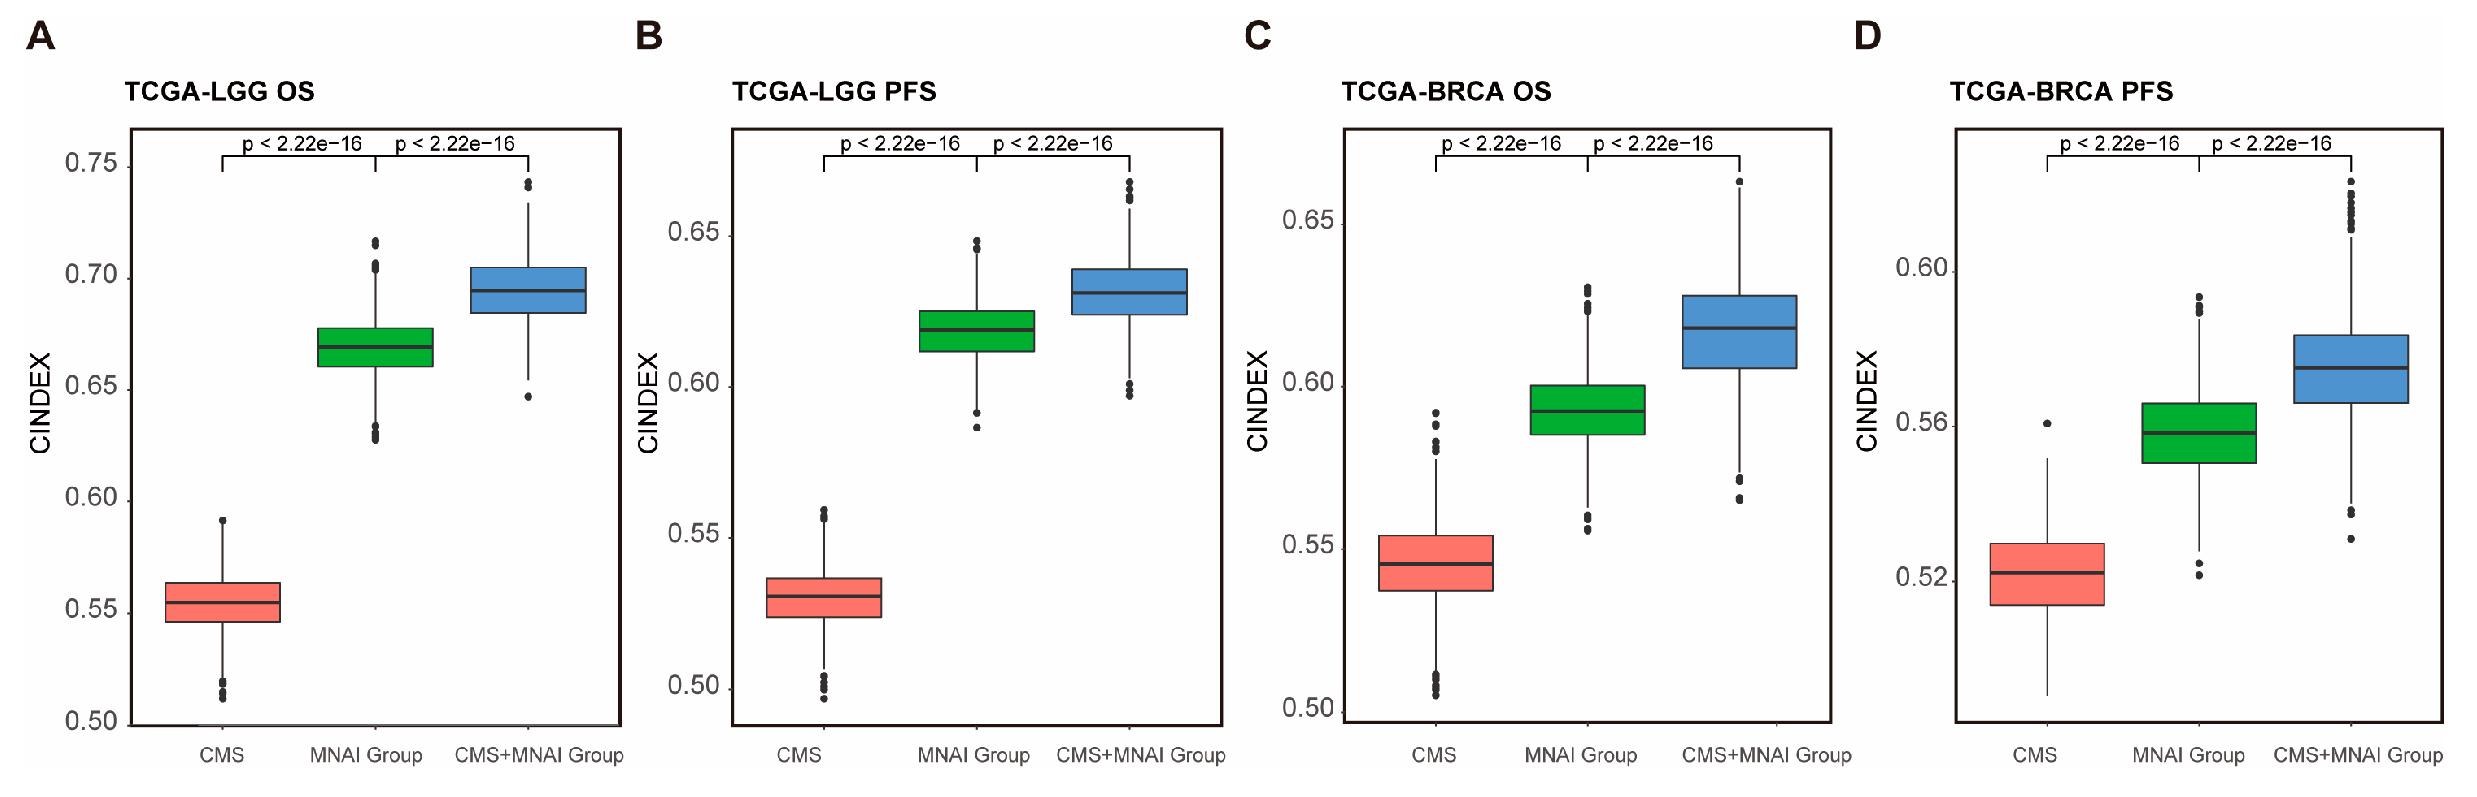
CMS derived from whole slide images of tissue histology has demonstrated significant and independent prognosis value in various tumors (15,16). Therefore, we assessed whether the multimodal integration of MNAI and CMS further improves the predictive power of prognosis. Multivariate Cox Proportional-Hazards Model showed that the combination of CMS and MNAI signfiantly improved the precision prognosis in both TCGA-LGG (Figure 7 A-B, p <2.22E-16) and TCGA-BRCA (Figure 7 C-D, p <2.22E-16) cohorts towards both OS and PFS. These findings suggest that MNAI and CMS can potentially serve as a multimodal biomarker for patient risk stratification.
4. Discussion
In this study, we assess the prognostic and predictive value of MNAI across multiple types of human cancer. Our results showed that MNAI is consistently overexpressed in all types of cancer in comparison to their corresponding normal tissues, consistent with one of the most prominent characteristics of a cancer cell - constant proliferation. The previous study in breast cancer has shown that the upregulation of MNAI is controlled by transcription factors, including MYC (9), which may hold true over a broad range of tumors. Additionally, high MNAI values significantly correlate with increase in genome instability (aneuploidy score, fraction genome alteration, mutation count, and tumor mutation burden). It is possible that high MNAI causes mitotic errors in cell divisions, leading to the loss or gain of chromosomes and, consequently, to aneuploidy. Moreover, many MNAI genes are included in the chromosomal instability gene signature (13). These results elucidate mitotic genes' potential role in genome instability and subsequent contribution to cancer development and progression.
We showed that high MNAI value in human tumors predicts poor patient outcomes, including DFS and OS in the majority of cancer types. However, we also found a favorable prognosis associated with high human tumor MNAI values in a few types of cancer. This is probably due to those different first-line chemotherapies were used in different cancer types, and patients with high MNAI only benefit from certain kinds of chemotherapies. For example, aneuploidy can make cells sensitive to certain chemotherapies but also resistant to others (21,22). Thus, we propose that clinical implementation of the MNAI could contribute to precision cancer medicine by choosing more effective therapeutic regimens.
In recent years, immunotherapy has raised tremendous attention. Many clinical studies have shown that immune checkpoint blockade therapy can significantly improve the OS rates of patients in many types of cancer, but only in a subset of patients with cancer (23). As a result, predictive biomarkers for checkpoint inhibitor-based immunotherapy have been extensively studied, including tumor-infiltrating lymphocytes, mutational burden, immune gene signatures, and multiplex immunohistochemistry (24). In this study, we found that patients with high MNAI benefit significantly more from anti-PD-1 and Anti-CTLA-4 treatments but not from anti-PD-L1 treatment. The resistance of patients with high MNAI to anti-PD-L1 treatment is possibly due to the contribution of mitosis in cancer cells to the high expression of PD-L1 (25). These patients may potentially benefit from combined anti-mitotic and anti-PD-L1 treatments. Thus, we suggest that MNAI could serve as a novel predictive biomarker for specific checkpoint inhibitor-based therapies. Furthermore, our analysis using CancerDR database (26) revealed signficant association (Supplementary Figure 6 lower pane, spearman correlation |R|>0.3 and p value < 0.05) between MNAI and many molecular targets, indicating MNAI is a pontential biomarker for predicting the response to more cancer treatment targets besides PD-1 and CTLA-4.
In addition, CMS extracted from whole slide images of tissue histology through advanced machine learning techniques (27) has emerged as a novel imaging biomarker in various tumor types, providing independent clinical values (15,16). In this study, we found that the multimodal integration of MNAI and CMS exceeds the individual biomarker in precision prognosis. Thus, we suggest that MNAI and CMS could serve as a novel multimodal prognostic biomarker for improved patient risk stratification.
5. Conclusions
In conclusion, through pan-cancer assessment, we demonstrated the prognostic and predictive power of MNAI in patients with different types of cancer and its association with genetic instability. Moreover, we believe that the clinical implication of MNAI and its multimodal integration with CMS will contribute to the precision prognosis and personalized treatment of cancer patients.
Supplementary Materials
The following supporting information can be downloaded at: www.mdpi.com/xxx/s1, Figure S1: Pan-cancer prognostic value of MNAI on PFS in TCGA; Figure S2: Pan-cancer prognostic value of MNAI on OS in TCGA; Figure S3: Pan-cancer prognostic value of MNAI on different prognostic endpoints in validation cohorts; Table S1: Information on TCGA datasets used in the study; Table S2: Datasets used in validation study.
Author Contributions
Perez-Losada J, Mao JH, and Chang H planned the project; Chang H, Mao XY, Perez-Losada J, and Mao JH wrote the manuscript; Mao XY, Chang H, Mao JH, Cai Y, and Long S performed the bioinformatics analyses and conducted statistical tests. All authors have read and edited the manuscript.
Funding
This work was supported by the Department of Defense (DoD) BCRP, No. BC190820; and the National Cancer Institute (NCI) at the National Institutes of Health (NIH), No. R01CA184476. Lawrence Berkeley National Laboratory (LBNL) is a multi-program national laboratory operated by the University of California for the DOE under contract DE AC02-05CH11231. Perez-Losada’s lab is sponsored by Grant PID2020-118527RB-I00 funded by MCIN/AEI/10.13039/501100011039; Grant PDC2021-121735-I00 funded by MCIN/AEI/10.13039/501100011039 and by the “European Union Next Generation EU/PRTR”, the Regional Government of Castile and León (CSI144P20).
Institutional Review Board Statement
Not applicable.
Informed Consent Statement
Not applicable.
Data Availability Statement
TCGA data used in this study are publicly available at cBioportal (https://www.cbioportal.org/); Data related to 17 published microarray datasets are publicly available at NCBI website (https://www.ncbi.nlm.nih.gov/gds). Data related to CGGA brain tumor cohorts are publicly available CGGA website (http://www.cgga.org.cn/); Data related to 5 datasets assessed by Kaplan-Meier Plotter are available at Kaplan-Meier Plotter (https://kmplot.com/analysis/). Data related to molecular targets are publicly available at CancerDR website (http://crdd.osdd.net/raghava/cancerdr/).
Acknowledgments
Not applicable.
Conflicts of Interest
The authors declare no conflict of interest.
References
- Hanahan, D.; Weinberg, R.A. Hallmarks of cancer: the next generation. Cell 2011, 144, 646–74. [Google Scholar] [CrossRef]
- Takeshima, H.; Ushijima, T. Accumulation of genetic and epigenetic alterations in normal cells and cancer risk. npj Precision Oncology 2019, 3, 7. [Google Scholar] [CrossRef]
- Ha, S.Y.; Choi, M.; Lee, T.; Park, C.K. The Prognostic Role of Mitotic Index in Hepatocellular Carcinoma Patients after Curative Hepatectomy. Cancer Res Treat 2016, 48, 180–9. [Google Scholar] [CrossRef]
- Philips, P.; Kooby, D.A.; Maithel, S.; Merchant, N.B.; Weber, S.M.; Winslow, E.R.; et al. Grading Using Ki-67 Index and Mitotic Rate Increases the Prognostic Accuracy of Pancreatic Neuroendocrine Tumors. Pancreas 2018, 47, 326–31. [Google Scholar] [CrossRef]
- Russell, W.O.; Cohen, J.; Enzinger, F.; Hajdu, S.I.; Heise, H.; Martin, R.G.; et al. A clinical and pathological staging system for soft tissue sarcomas. Cancer 1977, 40, 1562–70. [Google Scholar] [CrossRef]
- Medri, L.; Volpi, A.; Nanni, O.; Vecci, A.M.; Mangia, A.; Schittulli, F.; et al. Prognostic relevance of mitotic activity in patients with node-negative breast cancer. Mod Pathol 2003, 16, 1067–75. [Google Scholar] [CrossRef]
- Romansik, E.M.; Reilly, C.M.; Kass, P.H.; Moore, P.F.; London, C.A. Mitotic Index Is Predictive for Survival for Canine Cutaneous Mast Cell Tumors. Veterinary Pathology 2007, 44, 335–41. [Google Scholar] [CrossRef]
- Kim, Y.-J.; Ketter, R.; Steudel, W.-I.; Feiden, W. Prognostic Significance of the Mitotic Index Using the Mitosis Marker Anti–Phosphohistone H3 in Meningiomas. American Journal of Clinical Pathology 2007, 128, 118–25. [Google Scholar] [CrossRef]
- Hu, Z.; Mao, J.H.; Curtis, C.; Huang, G.; Gu, S.; Heiser, L.; et al. Genome co-amplification upregulates a mitotic gene network activity that predicts outcome and response to mitotic protein inhibitors in breast cancer. Breast Cancer Res 2016, 18, 70. [Google Scholar] [CrossRef]
- Gaillard, H.; García-Muse, T.; Aguilera, A. Replication stress and cancer. Nature Reviews Cancer 2015, 15, 276–89. [Google Scholar] [CrossRef]
- Vader, G.; Lens, S.M. The Aurora kinase family in cell division and cancer. Biochim Biophys Acta 2008, 1786, 60–72. [Google Scholar] [CrossRef]
- Curtis, C. Genomic profiling of breast cancers. Curr Opin Obstet Gynecol 2015, 27, 34–9. [Google Scholar] [CrossRef]
- Carter, S.L.; Eklund, A.C.; Kohane, I.S.; Harris, L.N.; Szallasi, Z. A signature of chromosomal instability inferred from gene expression profiles predicts clinical outcome in multiple human cancers. Nat Genet 2006, 38, 1043–8. [Google Scholar] [CrossRef]
- Strebhardt, K.; Becker, S.; Matthess, Y. Thoughts on the current assessment of Polo-like kinase inhibitor drug discovery. Expert Opin Drug Discov 2015, 10, 1–8. [Google Scholar] [CrossRef]
- Liu, X.-P.; Jin, X.; Seyed Ahmadian, S.; Yang, X.; Tian, S.-F.; Cai, Y.-X. Clinical significance and molecular annotation of cellular morphometric subtypes in lower-grade gliomas discovered by machine learning. Neuro-Oncology 2022, noac154. [Google Scholar] [CrossRef]
- Chang, H.; Yang, X.; Moore, J.; Liu, X.-P.; Jen, K.-Y.; Snijders, A.M.; et al. From Mouse to Human: Cellular Morphometric Subtype Learned From Mouse Mammary Tumors Provides Prognostic Value in Human Breast Cancer. Frontiers in Oncology 2022, 11. [Google Scholar] [CrossRef]
- XY M, J P-L, M A, M R-G, CA R, JH M, et al. iCEMIGE: Integration of CEll-morphometrics, MIcrobiome, and GEne biomarker signatures for risk stratification in breast cancers. World Journal of Clinical Oncology 2022, 13, 616–29. [CrossRef] [PubMed]
- Sun, Y.; Liu, Y.; Ma, X.; Hu, H. The Influence of Cell Cycle Regulation on Chemotherapy. Int J Mol Sci 2021, 22. [Google Scholar] [CrossRef] [PubMed]
- Strickler, J.H.; Hanks, B.A.; Khasraw, M. Tumor Mutational Burden as a Predictor of Immunotherapy Response: Is More Always Better? Clin Cancer Res 2021, 27, 1236–41. [Google Scholar] [CrossRef]
- Cristescu, R.; Aurora-Garg, D.; Albright, A.; Xu, L.; Liu, X.Q.; Loboda, A.; et al. Tumor mutational burden predicts the efficacy of pembrolizumab monotherapy: a pan-tumor retrospective analysis of participants with advanced solid tumors. J Immunother Cancer 2022, 10. [Google Scholar] [CrossRef] [PubMed]
- Janssen, A.; Kops, G.J.; Medema, R.H. Elevating the frequency of chromosome mis-segregation as a strategy to kill tumor cells. Proc Natl Acad Sci U S A 2009, 106, 19108–13. [Google Scholar] [CrossRef] [PubMed]
- Ippolito, M.R.; Martis, V.; Martin, S.; Tijhuis, A.E.; Hong, C.; Wardenaar, R.; et al. Gene copy-number changes and chromosomal instability induced by aneuploidy confer resistance to chemotherapy. Dev Cell 2021, 56, 2440–54. [Google Scholar] [CrossRef] [PubMed]
- Sharma, P.; Pachynski, R.K.; Narayan, V.; Fléchon, A.; Gravis, G.; Galsky, M.D.; et al. Nivolumab Plus Ipilimumab for Metastatic Castration-Resistant Prostate Cancer: Preliminary Analysis of Patients in the CheckMate 650 Trial. Cancer Cell 2020, 38, 489–99. [Google Scholar] [CrossRef] [PubMed]
- Gibney, G.T.; Weiner, L.M.; Atkins, M.B. Predictive biomarkers for checkpoint inhibitor-based immunotherapy. Lancet Oncol 2016, 17, e542–e51. [Google Scholar] [CrossRef] [PubMed]
- Ullah, M.; Aoudjeghout, W.; Pimpie, C.; Pocard, M.; Mirshahi, M. Mitosis in Cancer Cell Increases Immune Resistance via High Expression of HLA-G and PD-L1. Cancers (Basel) 2020, 12. [Google Scholar] [CrossRef] [PubMed]
- Kumar, R.; Chaudhary, K.; Gupta, S.; Singh, H.; Kumar, S.; Gautam, A.; et al. CancerDR: cancer drug resistance database. Sci Rep 2013, 3, 1445. [Google Scholar] [CrossRef]
- Chang, H.; Zhou, Y.; Borowsky, A.; Barner, K.; Spellman, P.; Parvin, B. Stacked Predictive Sparse Decomposition for Classification of Histology Sections. International Journal of Computer Vision 2014, 13, 3–18. [Google Scholar] [CrossRef]
Figure 1.
MNAI abundance is significantly elevated in cancerous tissues compared to normal tissues across different tumor types.
Figure 1.
MNAI abundance is significantly elevated in cancerous tissues compared to normal tissues across different tumor types.
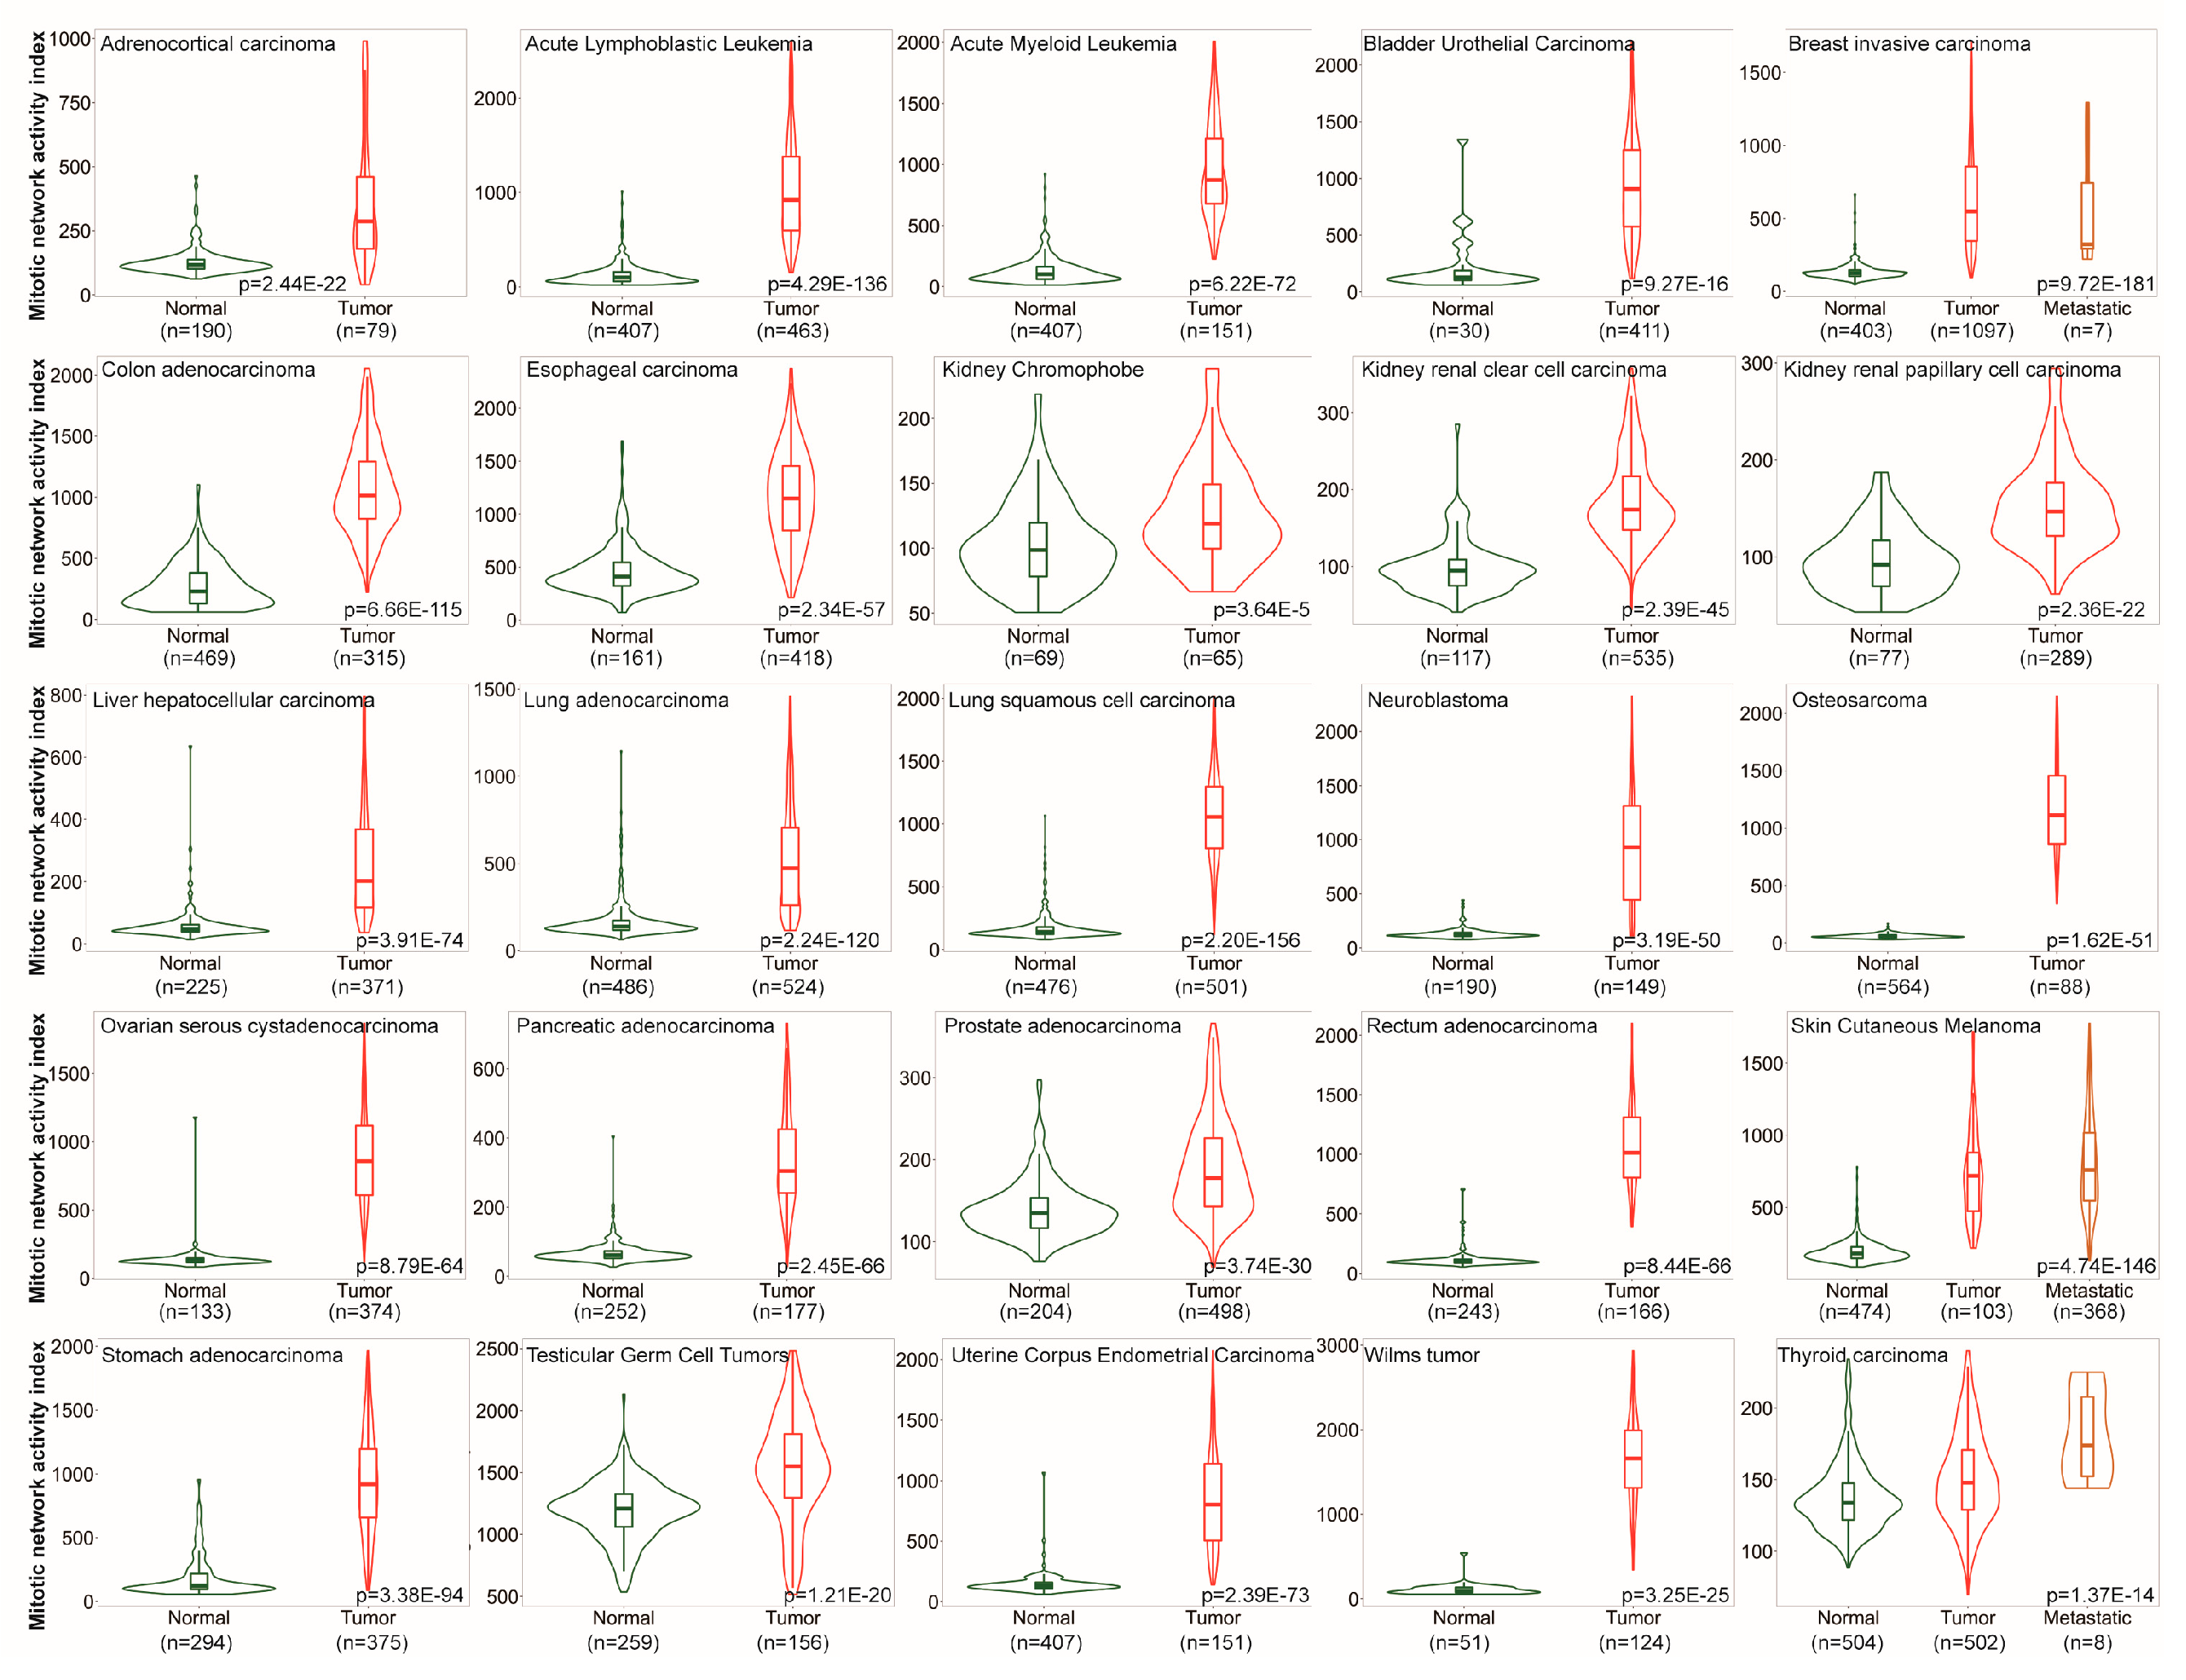
Figure 2.
Association of MNAI with genomic instability. (A) Dynamic genetic alternation frequency in MNAI genes per tumor type in TCGA, including mutation, chromosome structural variant, amplification, deep deletion, and multiple alternations, where patient with any of above changes with at least one MNAI gene was classified into altered group, otherwise the patient was classified into unaltered group; (B) Association between patient groups with respect to altered and unaltered MNAI genes with aneuploidy score, mutation count, fraction genome altered and tumor mutation burden.
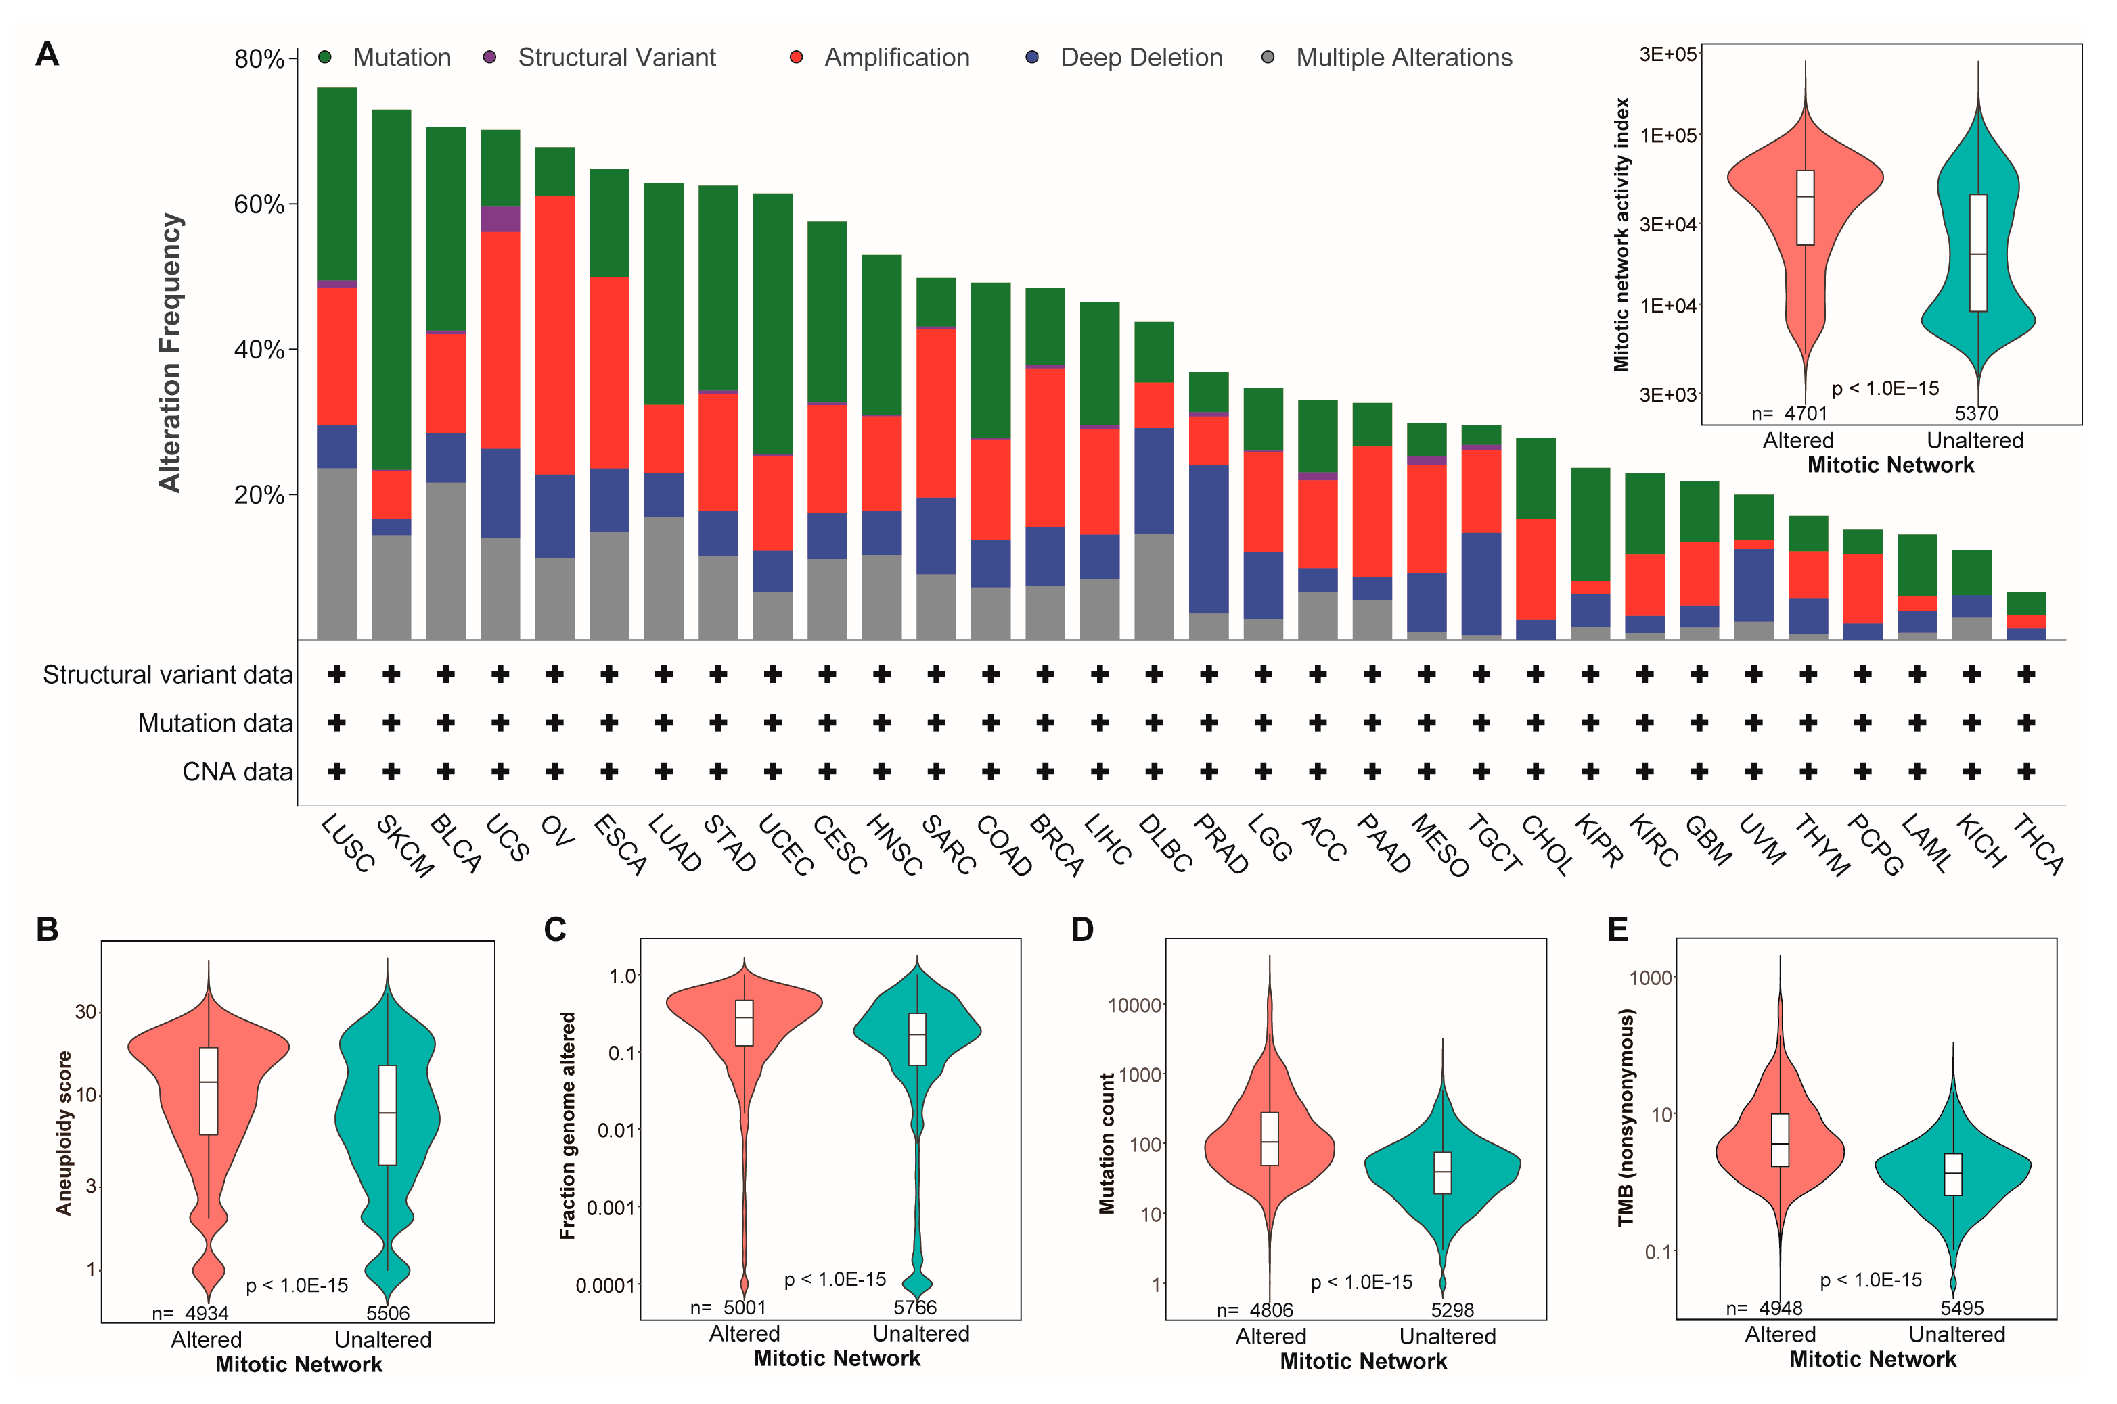
Figure 3.
Pan-cancer prognostic value of MNAI in TCGA. (A-B) Kaplan-Meier plots for TCGA Pan-cancer on OS and PFS based on (A) genetic alteration within MNAI genes and (B) MANI; (C) Hazard ratios of MNAI, Aneuploidy score, Fraction genome altered, Mutation count and TMB via multivariate CoxPH analysis.
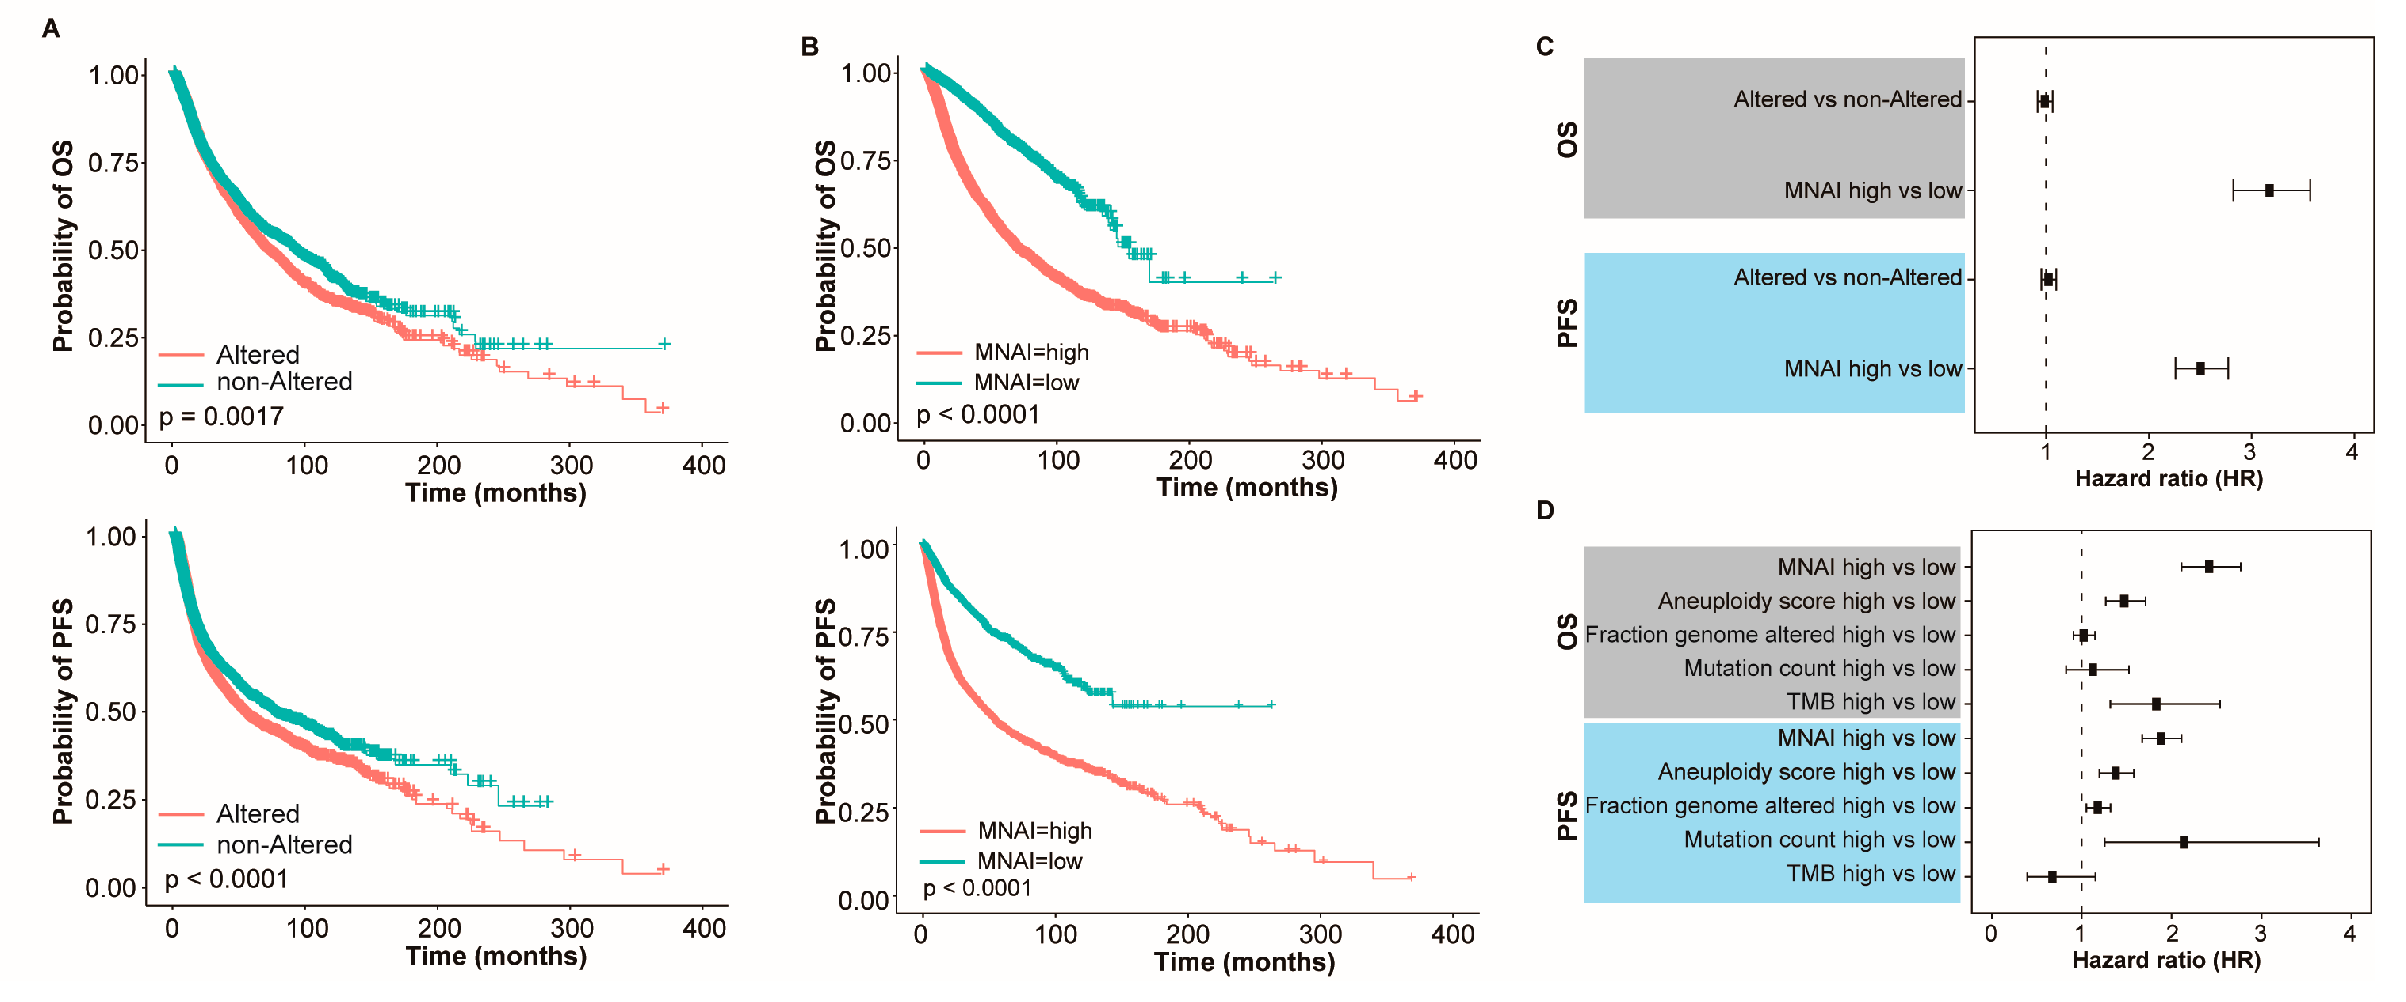
Figure 4.
Pan-cancer prognostic value of MNAI in TCGA. (A) Hazard ratio of MNAI on PFS across tumor types in TCGA; (B) Kaplan-Meier plots of representative tumor types on PFS between high-/low-MNAI patient groups; (C) Hazard ratio of MNAI on OS across tumor types in TCGA; (B) Kaplan-Meier plots of representative tumor types on OS between high-/low-MNAI patient groups.
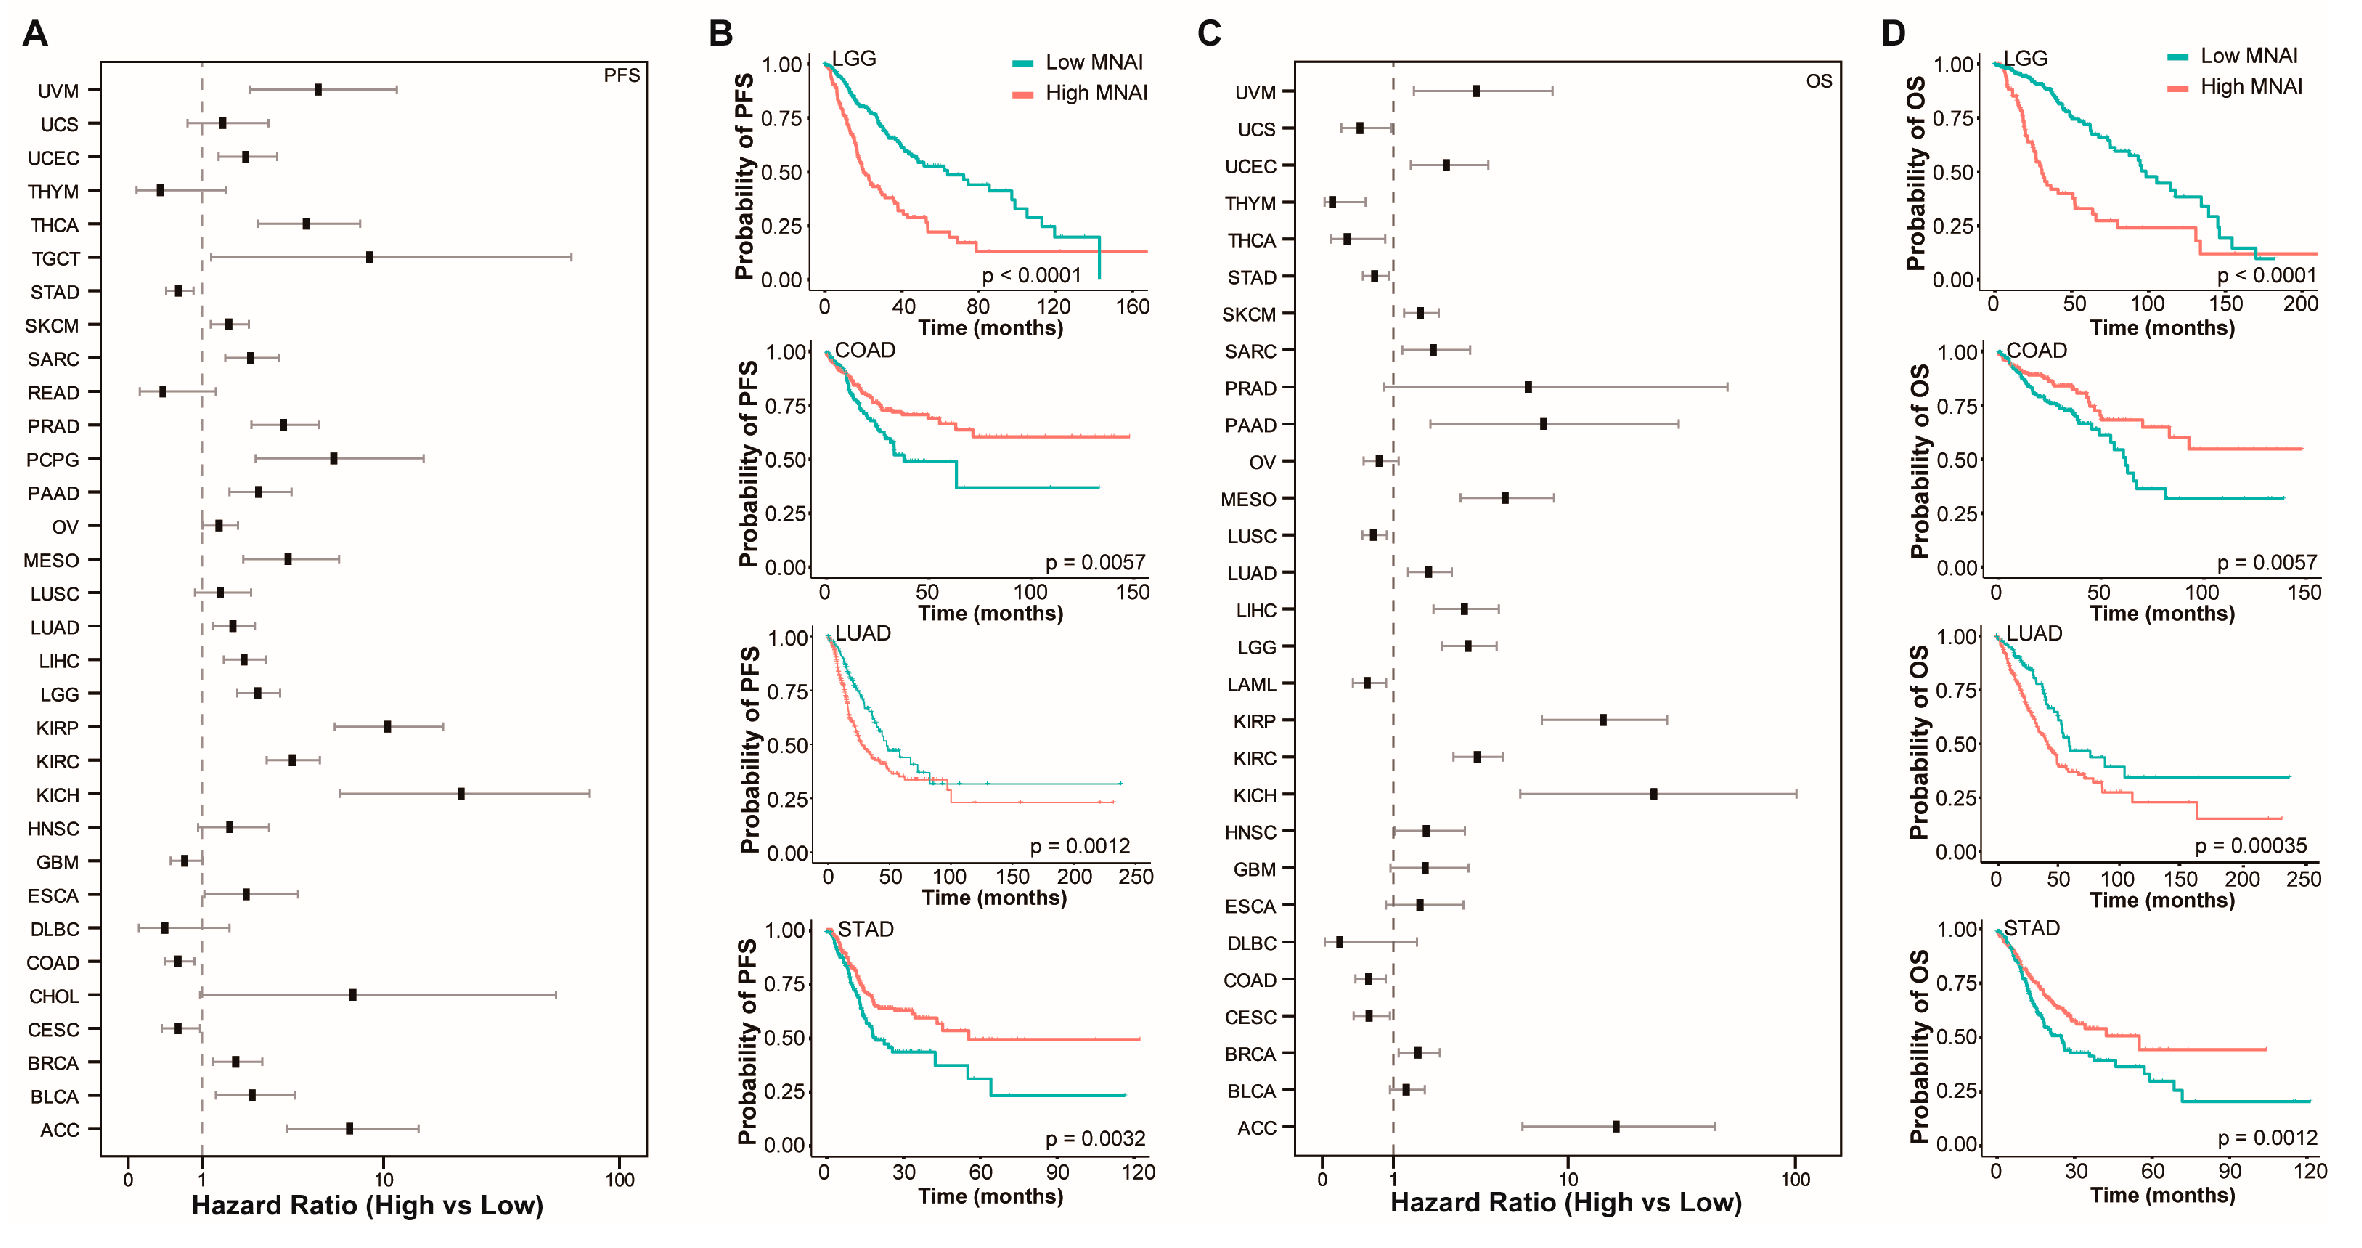
Figure 5.
Pan-cancer prognostic value of MNAI in validation cohorts. (A) Hazard ratio of MNAI on different prognostic endpoints in validation cohorts; and (B) Kaplan-Meier plots of representative tumor types on OS between high-/low-MNAI patient groups.
Figure 5.
Pan-cancer prognostic value of MNAI in validation cohorts. (A) Hazard ratio of MNAI on different prognostic endpoints in validation cohorts; and (B) Kaplan-Meier plots of representative tumor types on OS between high-/low-MNAI patient groups.
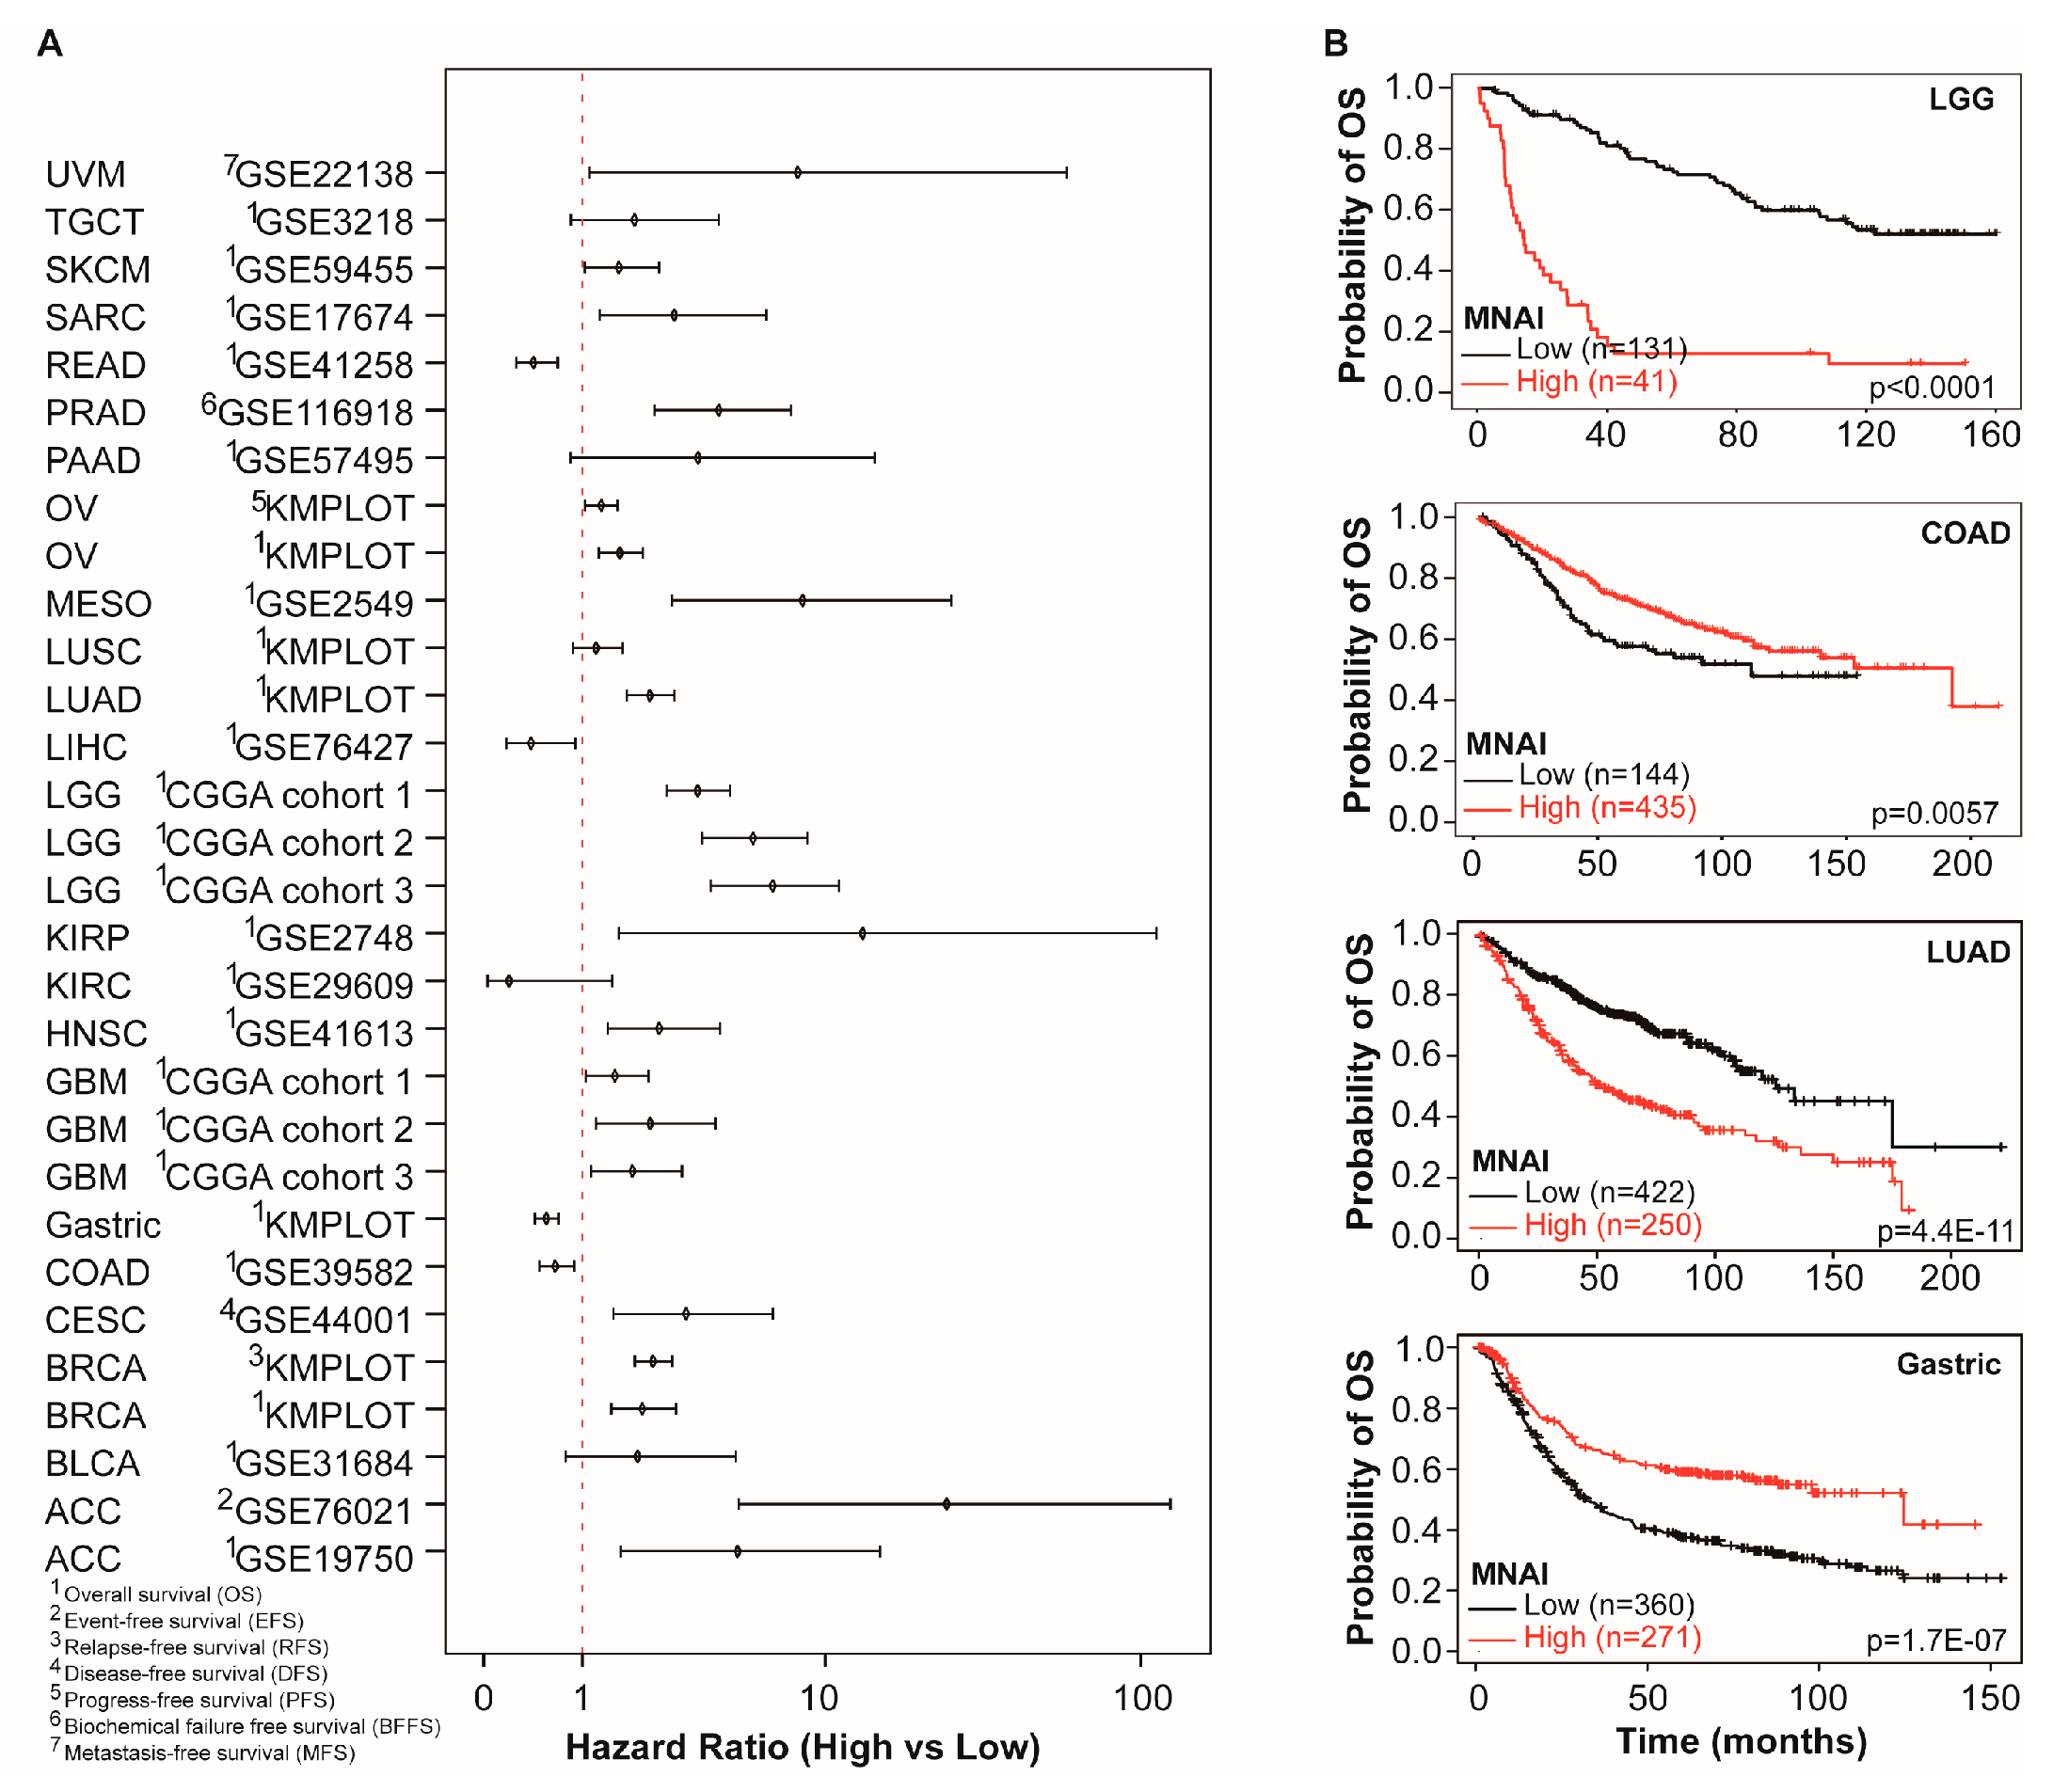
Figure 6.
Pan-cancer predictive value of MNAI towards checkpoint inhibitor-based immunotherapy. (A) anti-PD-1 treatment of pan-cancer patients. (B) anti-CTL4-A treatment of patients. (C) anti-PD-L1 treatment. All analyses were conducted using KMPLOT (http://kmplot.com/analysis/).
Figure 6.
Pan-cancer predictive value of MNAI towards checkpoint inhibitor-based immunotherapy. (A) anti-PD-1 treatment of pan-cancer patients. (B) anti-CTL4-A treatment of patients. (C) anti-PD-L1 treatment. All analyses were conducted using KMPLOT (http://kmplot.com/analysis/).
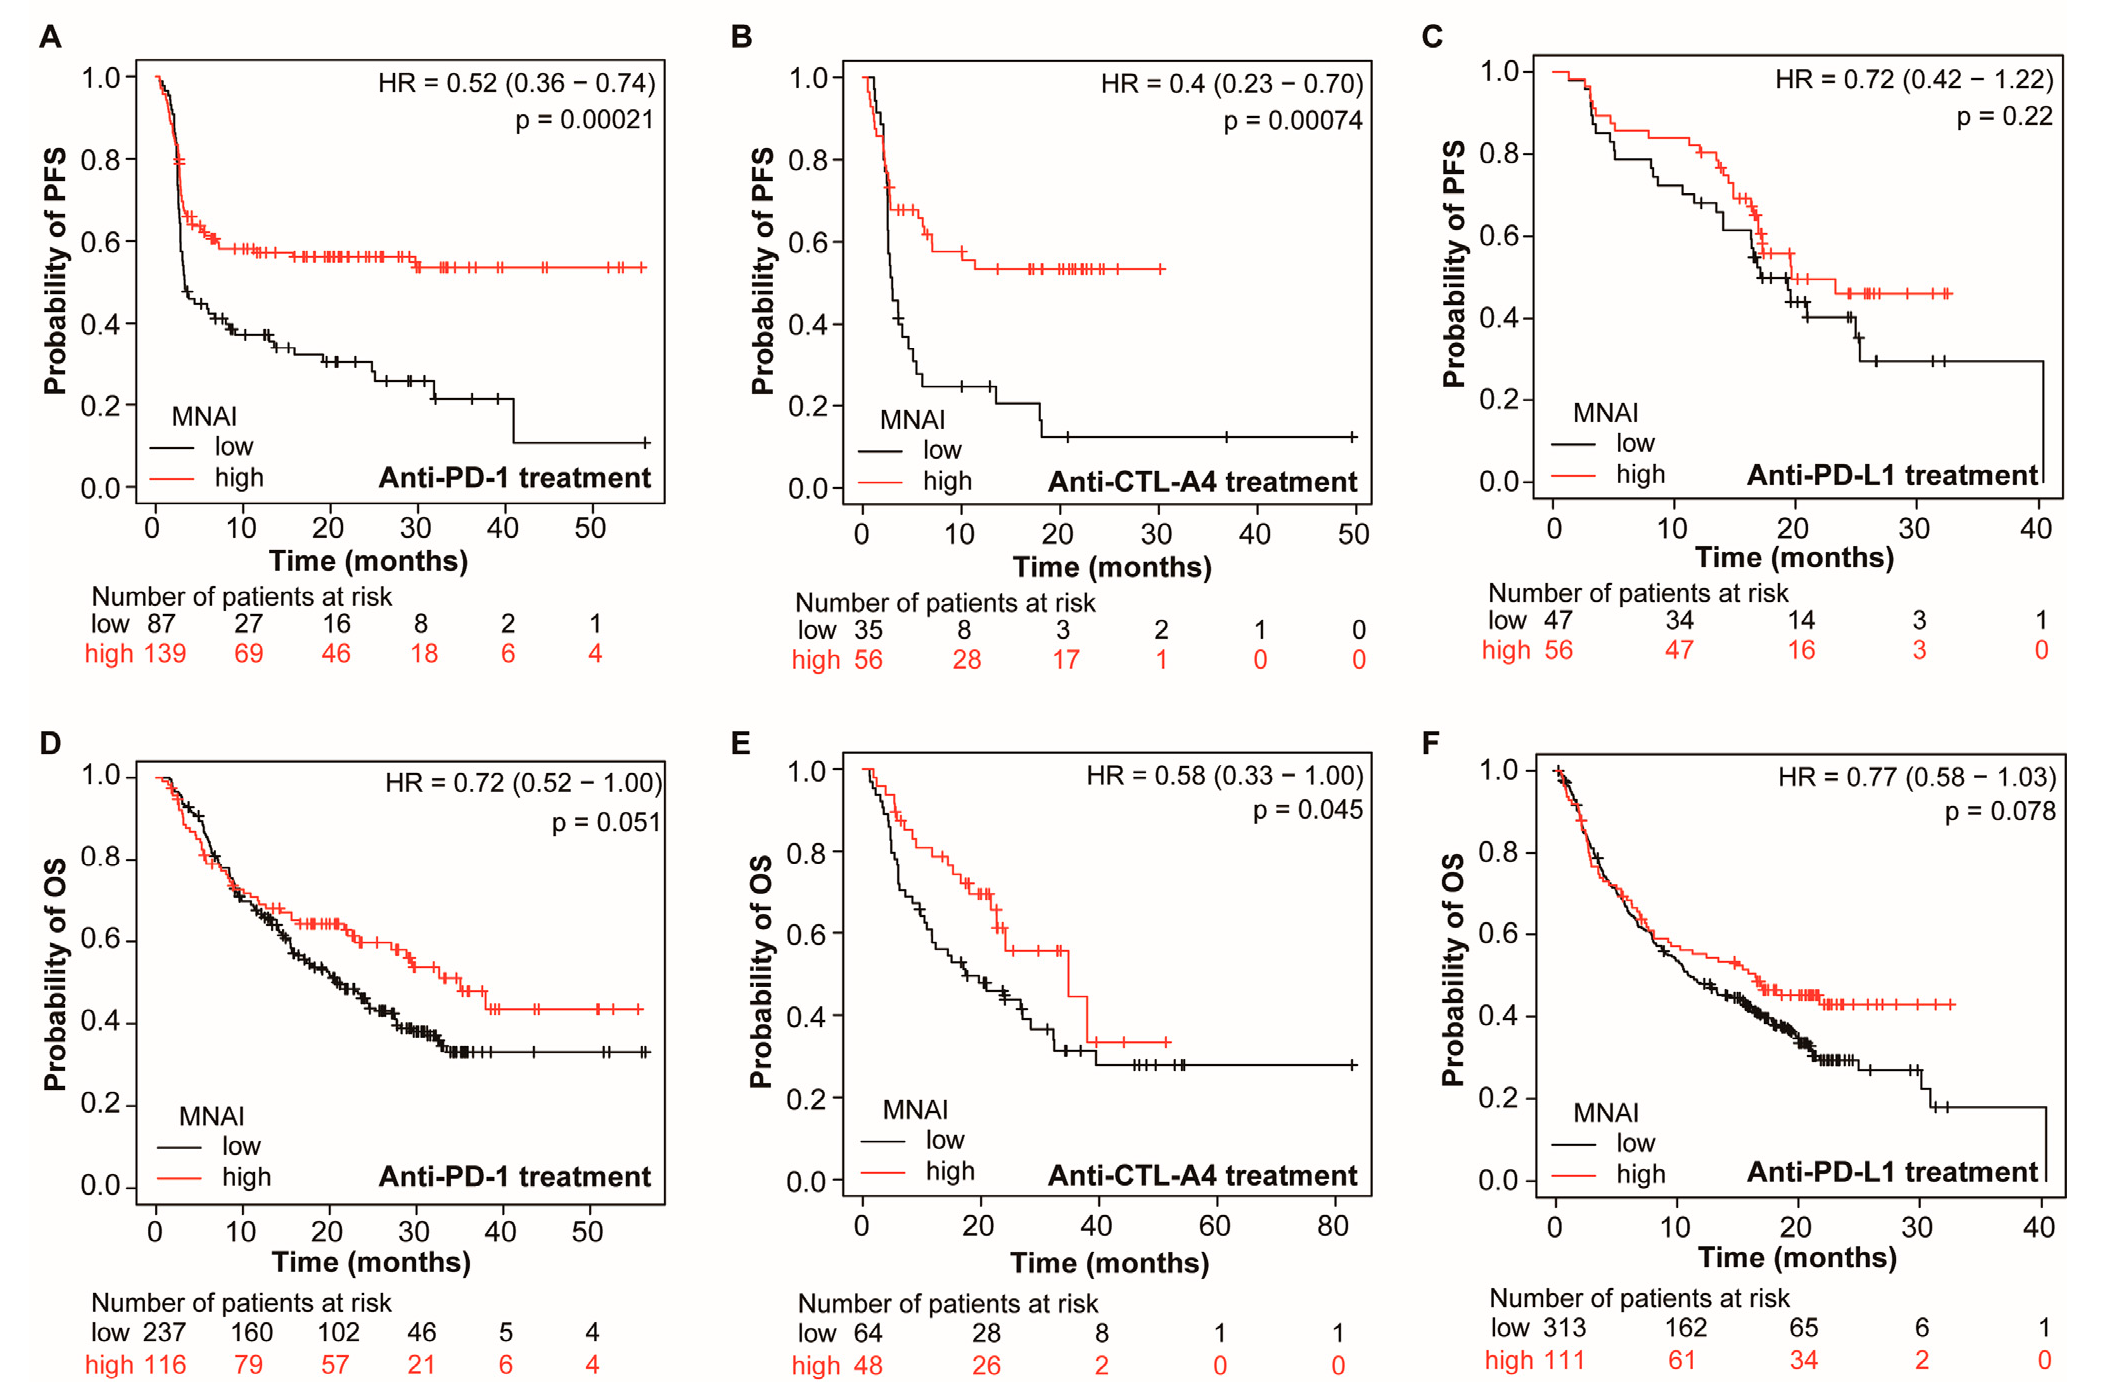
Figure 7.
Multimodal integration of MNAI and CMS exceeds individual models towards precision prognosis in TCGA-LGG (A-B) and TCGA-BRCA (C-D) cohorts.
Figure 7.
Multimodal integration of MNAI and CMS exceeds individual models towards precision prognosis in TCGA-LGG (A-B) and TCGA-BRCA (C-D) cohorts.
Disclaimer/Publisher’s Note: The statements, opinions and data contained in all publications are solely those of the individual author(s) and contributor(s) and not of MDPI and/or the editor(s). MDPI and/or the editor(s) disclaim responsibility for any injury to people or property resulting from any ideas, methods, instructions or products referred to in the content. |
© 2024 by the authors. Licensee MDPI, Basel, Switzerland. This article is an open access article distributed under the terms and conditions of the Creative Commons Attribution (CC BY) license (https://creativecommons.org/licenses/by/4.0/).
Copyright: This open access article is published under a Creative Commons CC BY 4.0 license, which permit the free download, distribution, and reuse, provided that the author and preprint are cited in any reuse.


