Submitted:
12 June 2025
Posted:
13 June 2025
You are already at the latest version
Abstract
A single paragraph of about 200 words maximum. For research articles, abstracts should give a pertinent overview of the work. We strongly encourage authors to use the following style of structured abstracts, but without headings: (1) Background: Place the question addressed in a broad context and highlight the purpose of the study; (2) Methods: briefly describe the main methods or treatments applied; (3) Results: summarize the article’s main findings; (4) Conclusions: indicate the main conclusions or interpretations. The abstract should be an objective representation of the article and it must not contain results that are not presented and substantiated in the main text and should not exaggerate the main conclusions.
Keywords:
richness
; abundance
; chiroptera
; forest cover
; forest structure
; pastures
1. Introduction
Over the last century, anthropogenic disturbances such as deforestation, agricultural expansion, and pasture establishment have been recognized as major drivers of biodiversity loss, leading to habitat fragmentation and population declines across multiple taxa [1,2,3]. The conversion of natural habitats into agricultural systems has resulted in mosaic landscapes characterized by remnants of forests interspersed with anthropogenic habitats [4,5]. Within these fragmented systems, researchers have explored strategies to mitigate the negative effects of land-use change, with increasing attention to agroforestry systems (e.g., shade-grown cocoa and coffee) as potential biodiversity refuges that harbor diverse faunal and floral communities while maintaining ecosystem services [6,7].
The broader landscape context is critical in shaping biodiversity patterns within fragmented ecosystems. Forest cover at the landscape scale is a key predictor of habitat quality and connectivity, influencing local vegetation structure and the diversity of sensitive species such as bats, birds, and small mammals [5,8,9,10]. In highly fragmented landscapes, reduced forest cover leads to degraded vegetation structure, often favoring generalist species while driving declines in habitat specialists [10,11,12,13]. Moreover, landscapes retaining less than 40% forest cover show marked reductions in ecological processes and species interactions, highlighting the need for targeted conservation efforts to maintain forest remnants [14,15].
Phyllostomid bats, one of the most ecologically diverse mammalian families, play critical roles in tropical ecosystems, including seed dispersal, pollination, and arthropod population regulation [16,17]. These ecological functions are essential for maintaining forest regeneration and ecosystem stability, as bats disperse seeds of over 500 plant species and contribute to pest control in agricultural systems [18,19,20]. Due to their wide range of habitat use and trophic diversity, phyllostomid bats are considered bioindicators of habitat quality and ecosystem integrity, with their populations responding to changes in forest structure and landscape composition [21,22,23].
The Atlantic Forest of Brazil, a global biodiversity hotspot, has experienced extensive deforestation, with around 23% of its original cover remaining as small, isolated fragments embedded in human-modified landscapes [24,25]. In southern Bahia, one of the biome's centers of endemism, forest loss has significantly impacted ecological processes and biodiversity, including birds, mammals, and bats [9,11,12,26]. Agroforestry systems, particularly shade-grown cocoa, have been identified as valuable landscapes for conserving biodiversity in this region, although their effectiveness depends on the surrounding landscape matrix and forest cover [15,27,28].
Bats exhibit contrasting responses to habitat loss and landscape composition, influenced by factors such as species guilds and mobility. For example, frugivorous bats are often resilient to habitat loss due to their ability to exploit resources across fragmented landscapes [29,30]. In contrast, nectarivorous and carnivorous bats are more sensitive to forest loss, showing declines in abundance and activity [29,31]. Recent research in southern Bahia indicates that insectivorous bats are more affected by the configuration and composition of the landscape, highlighting the importance of understanding species-specific responses to anthropogenic disturbances [32]. However, similar studies focusing on phyllostomid bats remain scarce, despite their critical ecological roles.
To address these gaps, we used structural equation models (SEM) to investigate the direct and indirect effects of landscape factors (forest cover and pasture) and local factors (forest structure) on the diversity of phyllostomid bats across 20 forest fragments in the Atlantic Forest of southern Bahia, Brazil. Our conceptual model proposed that forest cover positively and directly influences forest structure and bat diversity, while also exerting an indirect effect on bat diversity via forest structure [9,33]. Conversely, pasture was hypothesized to negatively affect forest structure and bat diversity, both directly and indirectly [34,35] (Figure 1).
By integrating landscape and local factors, this study aimed to elucidate the mechanisms driving phyllostomid bat diversity in fragmented tropical landscapes, with implications for conservation strategies in the Atlantic Forest.
2. Materials and Methods
The Study area
The study area is comprised by two sub-regions in the Atlantic Forest domain in the state of Bahia, northeastern Brazil. The sampling sites are located predominantly in the municipalities of Una and Mascote, separated by approximately 40 km, (Figure 2).
The vegetation of both areas is classified as Dense Ombrophilous Forest [36], with canopy layers (25–30 m) and emergent trees (up to 40 m), with abundant epiphytes, ferns, bromeliads and lianas [37]. Temperature ranges in average 24°C and rainfall 1500 mm year, with no clear seasonality [38].
To categorize the different vegetational formations present in the study area we used high-resolution satellite images (RapidEye, from 2009 to 2010, QuickBird and WordView, from 2011) [39]. Both regions are characterized by agricultural land uses such as pastures; shade cacao agroforests; and eucalyptus and rubber tree plantations. In Mascote, approximately 34% of the land is occupied by native vegetation, with pastures as the dominant land use occupying 60% of the region. Una region has the higher amount of forest cover, including shade cacao agroforests and rubber tree plantations representing approximately 54% of its area. We selected 20 sampling sites in each region totaling 40 study sites [39]. Sites represented a gradient of forest cover ranging from 5.4 to 85.1% and were located at least 1 km from each other.
Landscape variables
We quantified the amount of forest cover around the sampling site within multiple spatial scales starting from 100m into 100m up to 2000m radius using QGis [40]. We decide to not use larger scales because would imply a significant increase in the overlapping of buffers, which leads to non-independence between the observations, compromising our analyses [41]. For each sampling site, we calculated the amount of forest cover and the proportion of matrix occupied by pastures. Forest cover was calculated as the total amount of forest (initial, intermediate and advanced) divided by the buffer size. The proportion of pastures in landscape was calculated by pasture area/(buffer area—forest area). We used this metric to quantify matrix composition because pastures are a dominant land use in the area (40.4%) and the main land use with a non-forest structure compared to shade cocoa, eucalypt, and rubber tree plantations. Additionally, we test the appropriate spatial scale with a ‘multifit’ package in R, by AIC criteria [42]. The best spatial scale was 800 m radius.
Forest structure
The forest structure used in this study was calculated from SISBIOTA project, were established 260 forest plots (with two different sizes, 155 of 20 × 4 m and 105 of 25 x 4 m), covering 2.29 ha, in all 40 forest patches (see Rocha-Santos et al. 2016). All sampling plots were placed in the center of each patch to minimize edge effects, maintaining a minimum distance of 50 m between plots. Within each plot, we sampled all trees with the diameter at breast height (DBH) ≥ 5 cm, measured the heights and DBH, and considered large trees as those with a DBH ≥ 30 cm. Also were measured the foliage vertical stratification profile by using a technique adapted from Malcolm (1995); the vertical profiles were recorded in three points that were randomly located within each plot by estimating the length (cm) occupied by foliage in a vertical line in six forest strata (each 5 m interval until 30 m height). Were used the mean length value occupied by foliage in each stratum for later analyses. In this study we use only the forest structure values from our 20 sampled sites.
Bat sampling
Phyllostomidae bats were sampling through 20 previously selected sites between March and November 2018. The Phyllostomidae bats were captured using mist nets, a more effective methodology for capturing leaf-nosed bats (Phyllostomid Family) [34,43]. At each site a transact of 120 m was allocated at least 40 m from the edge of the fragment. The sites were sampled in two sessions comprising two days per session. Ten mist nets (12 m long x 2.5 m length) were used on each sample site, following the protocol to increase the possibility of capturing more species [44]. Mist nets were open at dusk, 17h and closed at 22h, being exposed for five hours every night, being checked at intervals of 15-30 minutes. The captured specimens were removed from the mist nets, packaged cotton bags to identify each one. The species identification followed the criteria of Vizotto and Taddei (1973), Simmons and Voss (1998) and Gardner (2008) [45,46,47], while the nomenclature and taxonomy followed Simmons (2005), Gardner (2008) and Nogueira et al. (2014) [47,48,49]. All procedures described above were authorised by licence issued by the Chico Mendes Institute for Biodiversity Conservation - ICMBio - through the Sisbio licence No. 53792-1.
Data Analysis
We used richness and abundance as components of phyllostomid bat diversity in the analyses. For the sampling sites we test spatial autocorrelation between the studied fragments using the Mantel Test [50]. To analyze the vegetation structure, we performed a Principal Component Analysis (PCA), using the values of the first axis for the analyses. For forest cover we use the percentage amount of forest in the landscape cover by 800 m radius following the previous studies [10] around the sampling site and the same method was used to calculate the amount of pasture in the landscape.
We used structural equation modeling (SEM) to investigate the direct and indirect factors influencing local phyllostomid bat diversity. SEM is a flexible method that facilitates causal understanding by incorporating multiple independent and dependent variables. It was employed to assess the effects of forest cover on components of community structure. We ran the SEM analysis with 10,000 bootstrap resamples to estimate path coefficients and assess model fit. To identify the best-fitting models, we applied model selection using the Akaike Information Criterion (AIC) and its corrected version (AICc), with the best model being the one with the lowest ΔAIC value. The GLMs were run using the ‘bbmle’ package [51], while the ‘segmented’ package [52]was used for model selection. All analyzes were performed in the R Studio software [53], using vegan packages [54], nlme [55], plspl [56] and devtools [57].
3. Results
This We comprise an effort of 6,000 m².h were 596 phyllostomid bats were captured, belonging to six subfamilies, 15 genera and 20 species. The Phyllostominae followed by Stenodermatinae were the most richness subfamilies, with seven and six species, respectively. The frugivorous group was the most captured with 570 captures, and presented the higher richness, ten species. The most abundant species were Carollia Perspicillata following by Rhinophylla Pumillio and Artibeus obscurus with 268 and 142 captures, and 57 captures, respectively. These three species of bats, together accounted for 78.36% of the total catch (Table 1).
On species richness, forest cover has a significant direct positive effect (ß=0.50), as well forest structure (ß=0.45) and this implies that areas with higher forest cover directly support greater phyllostomid bat species richness. Nonetheless, forest cover also has a positive indirect effect on richness through forest structure (ß=0.31) and together, forest cover contributes to improved forest structure, which enhances species richness. On the other hand, pasture area negatively affects forest structure (ß= -0.38). The direct effect of pasture on richness is positive but nonsignificant (ß= 0.11). The SEM explains 35% of the variance in forest structure (R²=0.35) and 58% of the variance in species richness (R²=0.58) and this indicates that the model provides a good explanation of the factors affecting richness and forest structure (Figure 3).
On species abundance, forest cover has a strong significant direct positive effect (ß=0.60), however, forest structure has nonsignificant direct effect on bat abundance (ß=004). This highlights that greater forest cover is directly associated with increased bat abundance. On the other hand, forest cover also has a positive effect on forest structure (ß=0.31), but forest structure does not mediate the relationship between forest cover and abundance. Pasture area negatively affects forest structure (ß= -0.38), suggesting that increasing pasture areas reduces forest structure. Also pasture has a negative but nonsignificant direct effect on bat abundance (ß= -0.19), indicating a weak negative impact of pasture on abundance that is not statistically robust. The SEM explains 35% of the variance in forest structure (R²=0.35) and 54% of the variance in bat abundance (R²=0.54) and these values suggest the model provides a moderate-to-good explanation of the factors driving forest structure and phyllostomid bat abundance (Figure 4).
4. Discussion
Using structural equation models (SEM), we found that forest cover had a significant positive direct effect on bat diversity (both richness and abundance), supporting our predictions. Additionally, forest cover positively influenced forest structure, which in turn showed a weaker direct effect on bat diversity. Conversely, pasture negatively affected forest structure and had weaker, non-significant direct and indirect effects on bat diversity. These findings emphasize the importance of preserving forest cover in maintaining bat diversity while underscoring the ecological risks posed by land-use intensification.
Our first prediction, that forest cover positively affects forest structure, was supported by our findings. Forest cover promotes structural complexity by retaining vegetation layers and habitat features critical for many forest-dependent species [33]. In cocoa agroforestry systems, forest remnants surrounded by high forest cover often exhibit better connectivity and less edge effect, allowing for a more stable and diverse forest structure. This structural complexity is vital for phyllostomid bats, which rely on understory vegetation and canopy layers for foraging, roosting, and commuting.
The direct and positive effect of forest cover on bat diversity (richness and abundance) aligns with earlier studies highlighting the role of forested habitats in maintaining bat populations in tropical landscapes [10,58]. Forests provide essential resources such as fruit, nectar, and insect prey, as well as roosting sites in hollow trees and dense vegetation. Cocoa agroforestry systems, which retain forest-like characteristics, serve as biodiversity-friendly landscapes, supporting species that are sensitive to habitat loss and fragmentation [9]. Thus, strategies to preserve forest cover in agroforestry-dominated regions are key to sustaining bat diversity.
We also observed a negligible direct effect of forest structure on bat diversity, contrary to our prediction. While structural complexity is often associated with species richness and ecological interactions, our results suggest that forest structure may act more as a mediating variable influenced by forest cover rather than a direct driver of bat diversity. This may be due to the dominance of generalist phyllostomid species (such as Carollia Perspicillata following by Rhinophylla Pumillio and Artibeus obscurus) in our study area, which can adapt to varying levels of structural complexity, as seen in other tropical regions [34]. Future studies should further investigate the role of specific forest structural elements, such as canopy cover and understory density, in shaping bat community dynamics.
Pasture, as predicted, negatively influenced forest structure, highlighting the detrimental impact of land-use intensification on local habitat features [35]. Pastures simplify the landscape, reducing vegetation complexity and connectivity, which, in turn, disrupts the ecological integrity of adjacent forest fragments. However, the direct and indirect effects of pasture on bat diversity were weaker than expected. This finding might reflect the resilience of generalist bat species to pasture-dominated landscapes or the mitigating influence of nearby forest patches. Nevertheless, reducing pasture expansion and promoting reforestation in degraded areas remain essential to conserving forest structure and biodiversity.
Our results further underscore the indirect role of forest cover in supporting bat diversity by maintaining forest structure, as predicted [10,58]. By promoting vegetation layers and connectivity, forest cover enhances habitat quality and foraging opportunities for bats. This indirect pathway emphasizes the interconnected nature of landscape and local factors in shaping biodiversity patterns. In contrast, the indirect negative effect of pasture on bat diversity through forest structure was weaker than anticipated, suggesting that landscape-level conservation strategies may have buffered these impacts.
5. Conclusions
Here, we highlight the critical role of forest cover in preserving phyllostomid bat diversity in Atlantic Forest remnants in southern Bahia. Sustainable land-use practices that maintain forest patches, reduce pasture expansion, and integrate forest restoration into agricultural mosaics can mitigate the negative impacts of deforestation and fragmentation. Given the ecological importance of phyllostomid bats as pollinators and seed dispersers, conserving their habitats is not only vital for biodiversity but also for ecosystem resilience and sustainability in this biodiversity hotspot.
Author Contributions
Conceptualization: DF, AQ; Methodology and Funding acquisition: DF, AQ; Methodology and Data collect: DF, AQ; Data analysis: RSB EM-N; Original draft: AQ, RSB; Writing, review and editing: AQ, RSB, DF, EM-N.
Funding
This research was funded by Conselho Nacional de Desenvolvimento Científico e Tecnológico (SISBIOTA project / CNPq; 563216/2010-7, 441278/2016-7, 69014416, 465767/2014, 426828/2016-0), Coordenação de Aperfeiçoamento de Pessoal de Nível Superior (CAPES, finance Code 001), Fundação de Amparo à Pesquisa do Estado da Bahia (FAPESB, 0848/2012, 0181/2012), Rufford Foundation (22333-1, 24655-1, 22426–1) and Universidade Estadual de Santa Cruz (UESC/PROPP; 00220-1100.1039, 00220-1100.1171, 00220.1100.1694, 00220.1100.1840, 00220.1100.1264, 00220.1100.1800, 073.6764.2019.000.2677-64).
Institutional Review Board Statement
All procedures described here authorised by licence issued by the Chico Mendes Institute for Biodiversity Conservation - ICMBio - through the Sisbio licence No. 53792-1.
Informed Consent Statement
Not applicable.
Data Availability Statement
Data will be made available on request.
Acknowledgments
We thank the reviewers and editor for all the suggestions and improvements on the manuscript. We thank the owners of the forest remnants for granting access to their properties. The SISBIOTA project received financial support from Conselho Nacional de Desenvolvimento Científico e Tecnológico (CNPq; 563216/2010-7, 441278/2016-7, 69014416, 465767/2014, 426828/2016-0), Coordenação de Aperfeiçoamento de Pessoal de Nível Superior (CAPES, finance Code 001), Fundação de Amparo à Pesquisa do Estado da Bahia (FAPESB, 0848/2012, 0181/2012), Rufford Foundation (22333-1, 24655-1, 22426–1) and Universidade Estadual de Santa Cruz (UESC/PROPP; 00220-1100.1039, 00220-1100.1171, 00220.1100.1694, 00220.1100.1840, 00220.1100.1264, 00220.1100.1800, 073.6764.2019.000.2677-64). This is the publication number 56 of the SISBIOTA project.
Conflicts of Interest
The authors declare that they have no known competing financial interests or personal relationships that could have appeared to influence the work reported in this paper.
Appendix A
Appendix A.1. The Script Models Used Structural Equation Models (SEM) to Investigate the Direct and Indirect Effects of Landscape Factors (Forest Cover and Pasture) and Local Factors (Forest Structure) on the Diversity (Richness and Abundance) of Phyllostomid Bats Across 20 Forest Fragments in the Atlantic Forest of Southern Bahia, Brazil
The Script Models
Richness
dados=read.table("R_auberico.csv",header=T,sep=";",dec=",")
head(dados)
install.packages("vegan")
install.packages("plspm")
library(vegan)
install.packages("devtools")
library(devtools)
install_github("gastonstat/plspm", force=T)
library(plspm)
path.riq=cbind(log(dados$R_800+1), log(dados$Pasture+1), dados$PC1.estr.vert,dados$species)
colnames(path.riq)=c("Forest_cover", "Pasture","Forest_structure","Richness")
path.riq=decostand(path.riq, "standardize")
pairs(path.riq)
forest_cover=c(0,0,0,0)
pasture=c(0,0,0,0)
forest_structure=c(1,1,0,0)
richness=c(1,1,1,0)
rich_path=rbind(forest_cover,pasture,forest_structure,richness)
colnames(rich_path)=rownames(rich_path)
rich_path
rich_blocks = list(1,2,3,4)
rich_modes=rep("B",4)
rich_pls = plspm(path.riq, rich_path, rich_blocks, modes =rich_modes,boot.val=T,br=10000,scaled=T)
rich_pls
summary(rich_pls)$boot$paths #individual coefficients
summary(rich_pls)$boot$rsq
summary(rich_pls) #individual coefficients
rich_pls$path_coefs
rich_pls$inner_model
paths.resize.rich = rich_pls$path_coefs
arrow_lwd = 10 * abs(round(paths.resize.rich, 2))
plot(rich_pls, arr.pos = 0.35, arr.lwd = arrow_lwd)
dev.off()
########
Script Models
Abundance
dados=read.table("R_auberico.csv",header=T,sep=";",dec=",")
head(dados)
library(vegan)
library(plspm)
path.abu=cbind(log(dados$R_800+1), log(dados$Pasture+1), dados$PC1.estr.vert,log(dados$individuals+1))
path.abu=decostand(path.abu1,"standardize")
colnames(path.abu)=c("Forest_cover", "Pasture","Forest_structure","Abundance")
pairs(path.abu)
colnames(path.abu)=c("Forest_cover", "Pasture","Forest_structure","Richness")
pairs(path.abu)#de um alt+tab aqui pra ver a janela externa
forest_cover=c(0,0,0,0)
pasture=c(0,0,0,0)
forest_structure=c(1,1,0,0)
abundance=c(1,1,1,0)
abund_path=rbind(forest_cover,pasture,forest_structure,abundance)
colnames(abund_path)=rownames(abund_path)
abund_path
innerplot(abund_path)
dev.off()
abund_blocks = list(1,2,3,4)
abund_modes=rep("B",4)
abund_pls = plspm(path.abu, abund_path, abund_blocks, modes =abund_modes,boot.val=T,br=10000,scaled=T)
abund_pls
summary(abund_pls)$boot$paths#individual coefficients
summary(abund_pls)$boot$rsq
summary(abund_pls) #individual coefficients
abund_pls$path_coefs
abund_pls$inner_model
paths.resize.abund = abund_pls$path_coefs
arrow_lwd = 10 * abs(round(paths.resize.abund, 2))
plot(abund_pls, arr.pos = 0.35, arr.lwd = arrow_lwd)
dev.off()
#######
References
- Maxwell, S.L.; Fuller, R.A.; Brooks, T.M.; Watson, J.E. Biodiversity: The ravages of guns, nets and bulldozers. Nature 2016, 536, 143–145. [CrossRef]
- Newbold, T.; Hudson, L.N.; Hill, S.; Contu, S.; Lysenko, I.; Senior, R.A.; Börger, L.; Bennett, D.; Choimes, A.; Collen, B. Global land-use impacts on local terrestrial biodiversity. Nature 2015, 520, 45–50.
- Sala, O.E.; Chapin, F.S., 3rd; Armesto, J.J.; Berlow, E.; Bloomfield, J.; Dirzo, R.; Huber-Sanwald, E.; Huenneke, L.F.; Jackson, R.B.; Kinzig, A.; et al. Global biodiversity scenarios for the year 2100. Science 2000, 287, 1770–1774. [CrossRef]
- Chazdon, R.L.; Lindenmayer, D.; Guariguata, M.R.; Crouzeilles, R.; Benayas, J.M.R.; Chavero, E.L. Fostering natural forest regeneration on former agricultural land through economic and policy interventions. Environmental Research Letters 2020, 15, 043002. [CrossRef]
- Arroyo-Rodríguez, V.; Fahrig, L.; Tabarelli, M.; Watling, J.I.; Tischendorf, L.; Benchimol, M.; Cazetta, E.; Faria, D.; Leal, I.R.; Melo, F.P. Designing optimal human-modified landscapes for forest biodiversity conservation. Ecology letters 2020, 23, 1404–1420. [CrossRef]
- Bhagwat, S.A.; Willis, K.J.; Birks, H.J.B.; Whittaker, R.J. Agroforestry: a refuge for tropical biodiversity? Trends in ecology & evolution 2008, 23, 261–267.
- Schroth, G.; Jeusset, A.; Gomes, A.d.S.; Florence, C.T.; Coelho, N.A.P.; Faria, D.; Läderach, P. Climate friendliness of cocoa agroforests is compatible with productivity increase. Mitigation and adaptation strategies for global change 2016, 21, 67–80. [CrossRef]
- Fahrig, L. Rethinking patch size and isolation effects: the habitat amount hypothesis. Journal of biogeography 2013, 40, 1649–1663. [CrossRef]
- Pardini, R.; Faria, D.; Accacio, G.M.; Laps, R.R.; Mariano-Neto, E.; Paciencia, M.L.B.; Dixo, M.; Baumgarten, J. The challenge of maintaining Atlantic forest biodiversity: A multi-taxa conservation assessment of specialist and generalist species in an agro-forestry mosaic in southern Bahia. Biological Conservation 2009, 142, 1178–1190. [CrossRef]
- Faria, D.; Morante-Filho, J.C.; Baumgarten, J.; Bovendorp, R.S.; Cazetta, E.; Gaiotto, F.A.; Mariano-Neto, E.; Mielke, M.S.; Pessoa, M.S.; Rocha-Santos, L.; et al. The breakdown of ecosystem functionality driven by deforestation in a global biodiversity hotspot. Biological Conservation 2023, 283. [CrossRef]
- Faria, D. Phyllostomid bats of a fragmented landscape in the north-eastern Atlantic forest, Brazil. Journal Of Tropical Ecology 2006, 22, 531–542. [CrossRef]
- Rocha-Santos, L.; Pessoa, M.S.; Cassano, C.R.; Talora, D.C.; Orihuela, R.L.; Mariano-Neto, E.; Morante-Filho, J.C.; Faria, D.; Cazetta, E. The shrinkage of a forest: Landscape-scale deforestation leading to overall changes in local forest structure. Biological Conservation 2016, 196, 1–9. [CrossRef]
- Bovendorp, R.S.; Brum, F.T.; McCleery, R.A.; Baiser, B.; Loyola, R.; Cianciaruso, M.V.; Galetti, M. Defaunation and fragmentation erode small mammal diversity dimensions in tropical forests. Ecography 2018, 42, 23–35. [CrossRef]
- Banks-Leite, C.; Pardini, R.; Tambosi, L.R.; Pearse, W.D.; Bueno, A.A.; Bruscagin, R.T.; Condez, T.H.; Dixo, M.; Igari, A.T.; Martensen, A.C.; et al. Using ecological thresholds to evaluate the costs and benefits of set-asides in a biodiversity hotspot. Science 2014, 345, 1041–1045. [CrossRef]
- Morante-Filho, J.C.; Arroyo-Rodríguez, V.; Faria, D. Patterns and predictors of β-diversity in the fragmented Brazilian Atlantic forest: a multiscale analysis of forest specialist and generalist birds. Journal of Animal Ecology 2016, 85, 240–250. [CrossRef]
- Kunz, T.H.; de Torrez, E.B.; Bauer, D.; Lobova, T.; Fleming, T.H. Ecosystem services provided by bats. In Year in Ecology and Conservation Biology, Ostfeld, R.S., Schlesinger, W.H., Eds.; Annals of the New York Academy of Sciences; 2011; Volume 1223, pp. 1–38. [CrossRef]
- Fleming, T.H.; Martino, A.M.; Dávalos, L.; Mello, M. Population biology; The University of Chicago Press Chicago and London: 2020.
- Bredt, A.; Uieda, W.; Pedro, W.A. Plantas e morcegos: na recuperação de áreas degradadas e na paisagem urbana; Rede de sementes do Cerrado: 2012.
- Cleveland, C.J.; Betke, M.; Federico, P.; Frank, J.D.; Hallam, T.G.; Horn, J.; López Jr, J.D.; McCracken, G.F.; Medellín, R.A.; Moreno-Valdez, A. Economic value of the pest control service provided by Brazilian free-tailed bats in south-central Texas. Frontiers in Ecology and the Environment 2006, 4, 238–243. [CrossRef]
- Cassano, C.R.; Silva, R.M.; Mariano-Neto, E.; Schroth, G.; Faria, D. Bat and bird exclusion but not shade cover influence arthropod abundance and cocoa leaf consumption in agroforestry landscape in northeast Brazil. Agriculture, Ecosystems & Environment 2016, 232, 247–253. [CrossRef]
- Medellín, R.A.; Equihua, M.; Amin, M.A. Bat diversity and abundance as indicators of disturbance in Neotropical rainforests. Conservation biology 2000, 14, 1666–1675.
- Meyer, C.F.; Kalko, E.K. Assemblage-level responses of phyllostomid bats to tropical forest fragmentation: land-bridge islands as a model system. Journal of Biogeography 2008, 35, 1711–1726. [CrossRef]
- Arroyo-Rodríguez, V.; Rojas, C.; Saldaña-Vázquez, R.A.; Stoner, K.E. Landscape composition is more important than landscape configuration for phyllostomid bat assemblages in a fragmented biodiversity hotspot. Biological Conservation 2016, 198, 84–92. [CrossRef]
- Rezende, C.L.; Scarano, F.R.; Assad, E.D.; Joly, C.A.; Metzger, J.P.; Strassburg, B.B.N.; Tabarelli, M.; Fonseca, G.A.; Mittermeier, R.A. From hotspot to hopespot: An opportunity for the Brazilian Atlantic Forest. Perspectives in ecology and conservation 2018, 16, 208–214. [CrossRef]
- Vancine, M.H.; Muylaert, R.L.; Niebuhr, B.B.; Oshima, J.E.d.F.; Tonetti, V.; Bernardo, R.; De Angelo, C.; Rosa, M.R.; Grohmann, C.H.; Ribeiro, M.C. The Atlantic Forest of South America: Spatiotemporal dynamics of the vegetation and implications for conservation. Biological Conservation 2024, 291. [CrossRef]
- Benchimol, M.; Talora, D.C.; Mariano-Neto, E.; Oliveira, T.L.; Leal, A.; Mielke, M.S.; Faria, D. Losing our palms: The influence of landscape-scale deforestation on Arecaceae diversity in the Atlantic forest. Forest Ecology and Management 2017, 384, 314–322. [CrossRef]
- Faria, D.; Paciencia, M.L.B.; Dixo, M.; Laps, R.R.; Baumgarten, J. Ferns, frogs, lizards, birds and bats in forest fragments and shade cacao plantations in two contrasting landscapes in the Atlantic forest, Brazil. Biodiversity And Conservation 2007, 16, 2335–2357. [CrossRef]
- Melo, R.S.; Alexandrino, E.R.; de Paula, F.R.; Boscolo, D.; de Barros Ferraz, S.F. Promoting bird functional diversity on landscapes with a matrix of planted Eucalyptus spp. in the Atlantic Forest. Environmental Management 2024, 73, 395–407. [CrossRef]
- GARCÍA-MORALES, R.; Badano, E.I.; Moreno, C.E. Response of Neotropical bat assemblages to human land use. Conservation Biology 2013, 27, 1096–1106. [CrossRef]
- Estrada, A.; Coates-Estrada, R. Bats in continuous forest, forest fragments and in an agricultural mosaic habitat-island at Los Tuxtlas, Mexico. Biological conservation 2002, 103, 237–245. [CrossRef]
- Quesada, M.; Stoner, K.E.; Rosas-Guerrero, V.; Palacios-Guevara, C.; Lobo, J.A. Effects of habitat disruption on the activity of nectarivorous bats (Chiroptera: Phyllostomidae) in a dry tropical forest: implications for the reproductive success of the neotropical tree Ceiba grandiflora. Oecologia 2003, 135, 400–406. [CrossRef]
- Falcão, F.; Dodonov, P.; Caselli, C.B.; dos Santos, J.S.; Faria, D. Landscape structure shapes activity levels and composition of aerial insectivorous bats at different spatial scales. Biodiversity and Conservation 2021, 30, 2545–2564. [CrossRef]
- Orihuela, R.L.; Peres, C.A.; Mendes, G.; Jarenkow, J.A.; Tabarelli, M. Markedly Divergent Tree Assemblage Responses to Tropical Forest Loss and Fragmentation across a Strong Seasonality Gradient. Plos One 2015, 10, e0136018. [CrossRef]
- Avila-Cabadilla, L.D.; Sanchez-Azofeifa, G.A.; Stoner, K.E.; Alvarez-Anorve, M.Y.; Quesada, M.; Portillo-Quintero, C.A. Local and landscape factors determining occurrence of phyllostomid bats in tropical secondary forests. Plos One 2012, 7, e35228. [CrossRef]
- Li, H.; Petric, R.; Alazzawi, Z.; Kauzlarich, J.; Mahmoud, R.H.; McFadden, R.; Perslow, N.; Rodriguez Flores, A.; Soufi, H.; Morales, K. Four years continuous monitoring reveals different effects of urban constructed wetlands on bats. Land 2021, 10, 1087. [CrossRef]
- Oliveira-Filho, A.T.; Fontes, M.A.L. Patterns of floristic differentiation among Atlantic forests in southeastern Brazil and the influence of climate. Biotropica 2000, 32, 793 – 810. [CrossRef]
- Thomas, W.W.; CARVALHO, A.M.D.; Amorim, A.M.; Garrison, J.; ARBELA´ EZ, A.L. Plant endemism in two forests in southern Bahia, Brazil. Biodiversity & Conservation 1998, 7, 311–322. [CrossRef]
- Mori, S.A.; Boom, B.M.; Decarvalho, A.M.; Dossantos, T.S. Southern Bahian Moist Forests. Botanical Review 1983, 49, 155–232. [CrossRef]
- Morante-Filho, J.C.; Faria, D.; Mariano-Neto, E.; Rhodes, J. Birds in Anthropogenic Landscapes: The Responses of Ecological Groups to Forest Loss in the Brazilian Atlantic Forest. Plos One 2015, 10, e0128923. [CrossRef]
- QGIS, D.T. QGIS, Geographic Information System, Open Source Geospatial Foundation: 2017.
- Eigenbrod, F.; Hecnar, S.J.; Fahrig, L. Sub-optimal study design has major impacts on landscape-scale inference. Biological Conservation 2011, 144, 298–305. [CrossRef]
- Huais, P.Y. multifit: an R function for multi-scale analysis in landscape ecology. Landscape Ecology 2018, 33, 1023–1028. [CrossRef]
- Muylaert, R.L.; Stevens, R.D.; Ribeiro, M.C. Threshold effect of habitat loss on bat richness in cerrado-forest landscapes. Ecological Applications 2016, 26, 1854–1867. [CrossRef]
- Bergallo, H.G.; Esberard, C.E.L.; Mello, M.A.R.; Lins, V.; Mangolin, R.; Melo, G.G.S.; Baptista, M. Bat species richness in Atlantic forest: What is the minimum sampling effort? Biotropica 2003, 35, 278–288. [CrossRef]
- Vizotto, L.; Taddei, V.A. Chave para determinação de quirópteros brasileiros; 1973.
- Simmons, N.B.; Voss, R.S. The mammals of Paracou, French Guiana, a Neotropical lowland rainforest fauna. 1998.
- Gardner, A. Mammals of South America, Volume 1: Marsupials, Xenarthrans, Shrews, and Bats; University of Chicago Press: Chicago, IL, USA, 2009; Volume Volume 1, pp. 1–690.
- Simmons, N.B. Order chiroptera. Mammal species of the world 2005, 1, 337.
- Nogueira, M.R.; Lima, I.P.d.; Moratelli, R.; Tavares, V.d.C.; Gregorin, R.; Lúcio, P. Checklist of Brazilian bats, with comments on original records. Volume 10, Número 4, Pags. 808-821 2014.
- Dale, M.R.; Fortin, M.-J. Spatial analysis: a guide for ecologists; Cambridge University Press: 2014.
- Bolker, B.; Skaug, H.; Magnusson, A.; Nielsen, A. Getting started with the glmmADMB package. 2012.
- Muggeo, V. segmented: an R package to fit regression models with broken-line relationships. R News, 2008; pp. 20–25.
- Team, R.C. R: a language and environment for statistical computing. Vienna, Austria: R Foundation for Statistical Computing. Retrived from http://www.R-project.org/, 2024.12.1; 2024.
- Oksanen, J.; Simpson, G.; Blanchet, F.; Kindt, R.; Legendre, P.; Minchin, P.; O’hara, R.; Solymos, P.; Stevens, M.; Szoecs, E. vegan: Community Ecology Package. R package version 2.6-4. 2022. 2023.
- Pinheiro, J.; Bates, D.; DebRoy, S.; Sarkar, D.; Team, R.C. nlme: linear and nonlinear mixed effects models. R package version 3. 2017, 1–131. https://CRAN.R–project.org/package=nlme.
- Sanchez, G. PLS path modeling with R. Berkeley: Trowchez Editions 2013, 383, 551.
- Wickham, H.; Bryan, J. R packages; " O'Reilly Media, Inc.": 2023.
- Faria, D. Phyllostomid bats of a fragmented landscape in the north-eastern Atlantic forest, Brazil. Journal of Tropical Ecology 2006, 22, 531–542. [CrossRef]
Figure 1.
Conceptual model to test the positive (in blue) and negative (in red) direct and indirect effects of landscape composition (i.e., forest cove and pastures) and local features (i.e., forest structure) on diversity (richness and abundance) of Phyllostomid bats.
Figure 1.
Conceptual model to test the positive (in blue) and negative (in red) direct and indirect effects of landscape composition (i.e., forest cove and pastures) and local features (i.e., forest structure) on diversity (richness and abundance) of Phyllostomid bats.
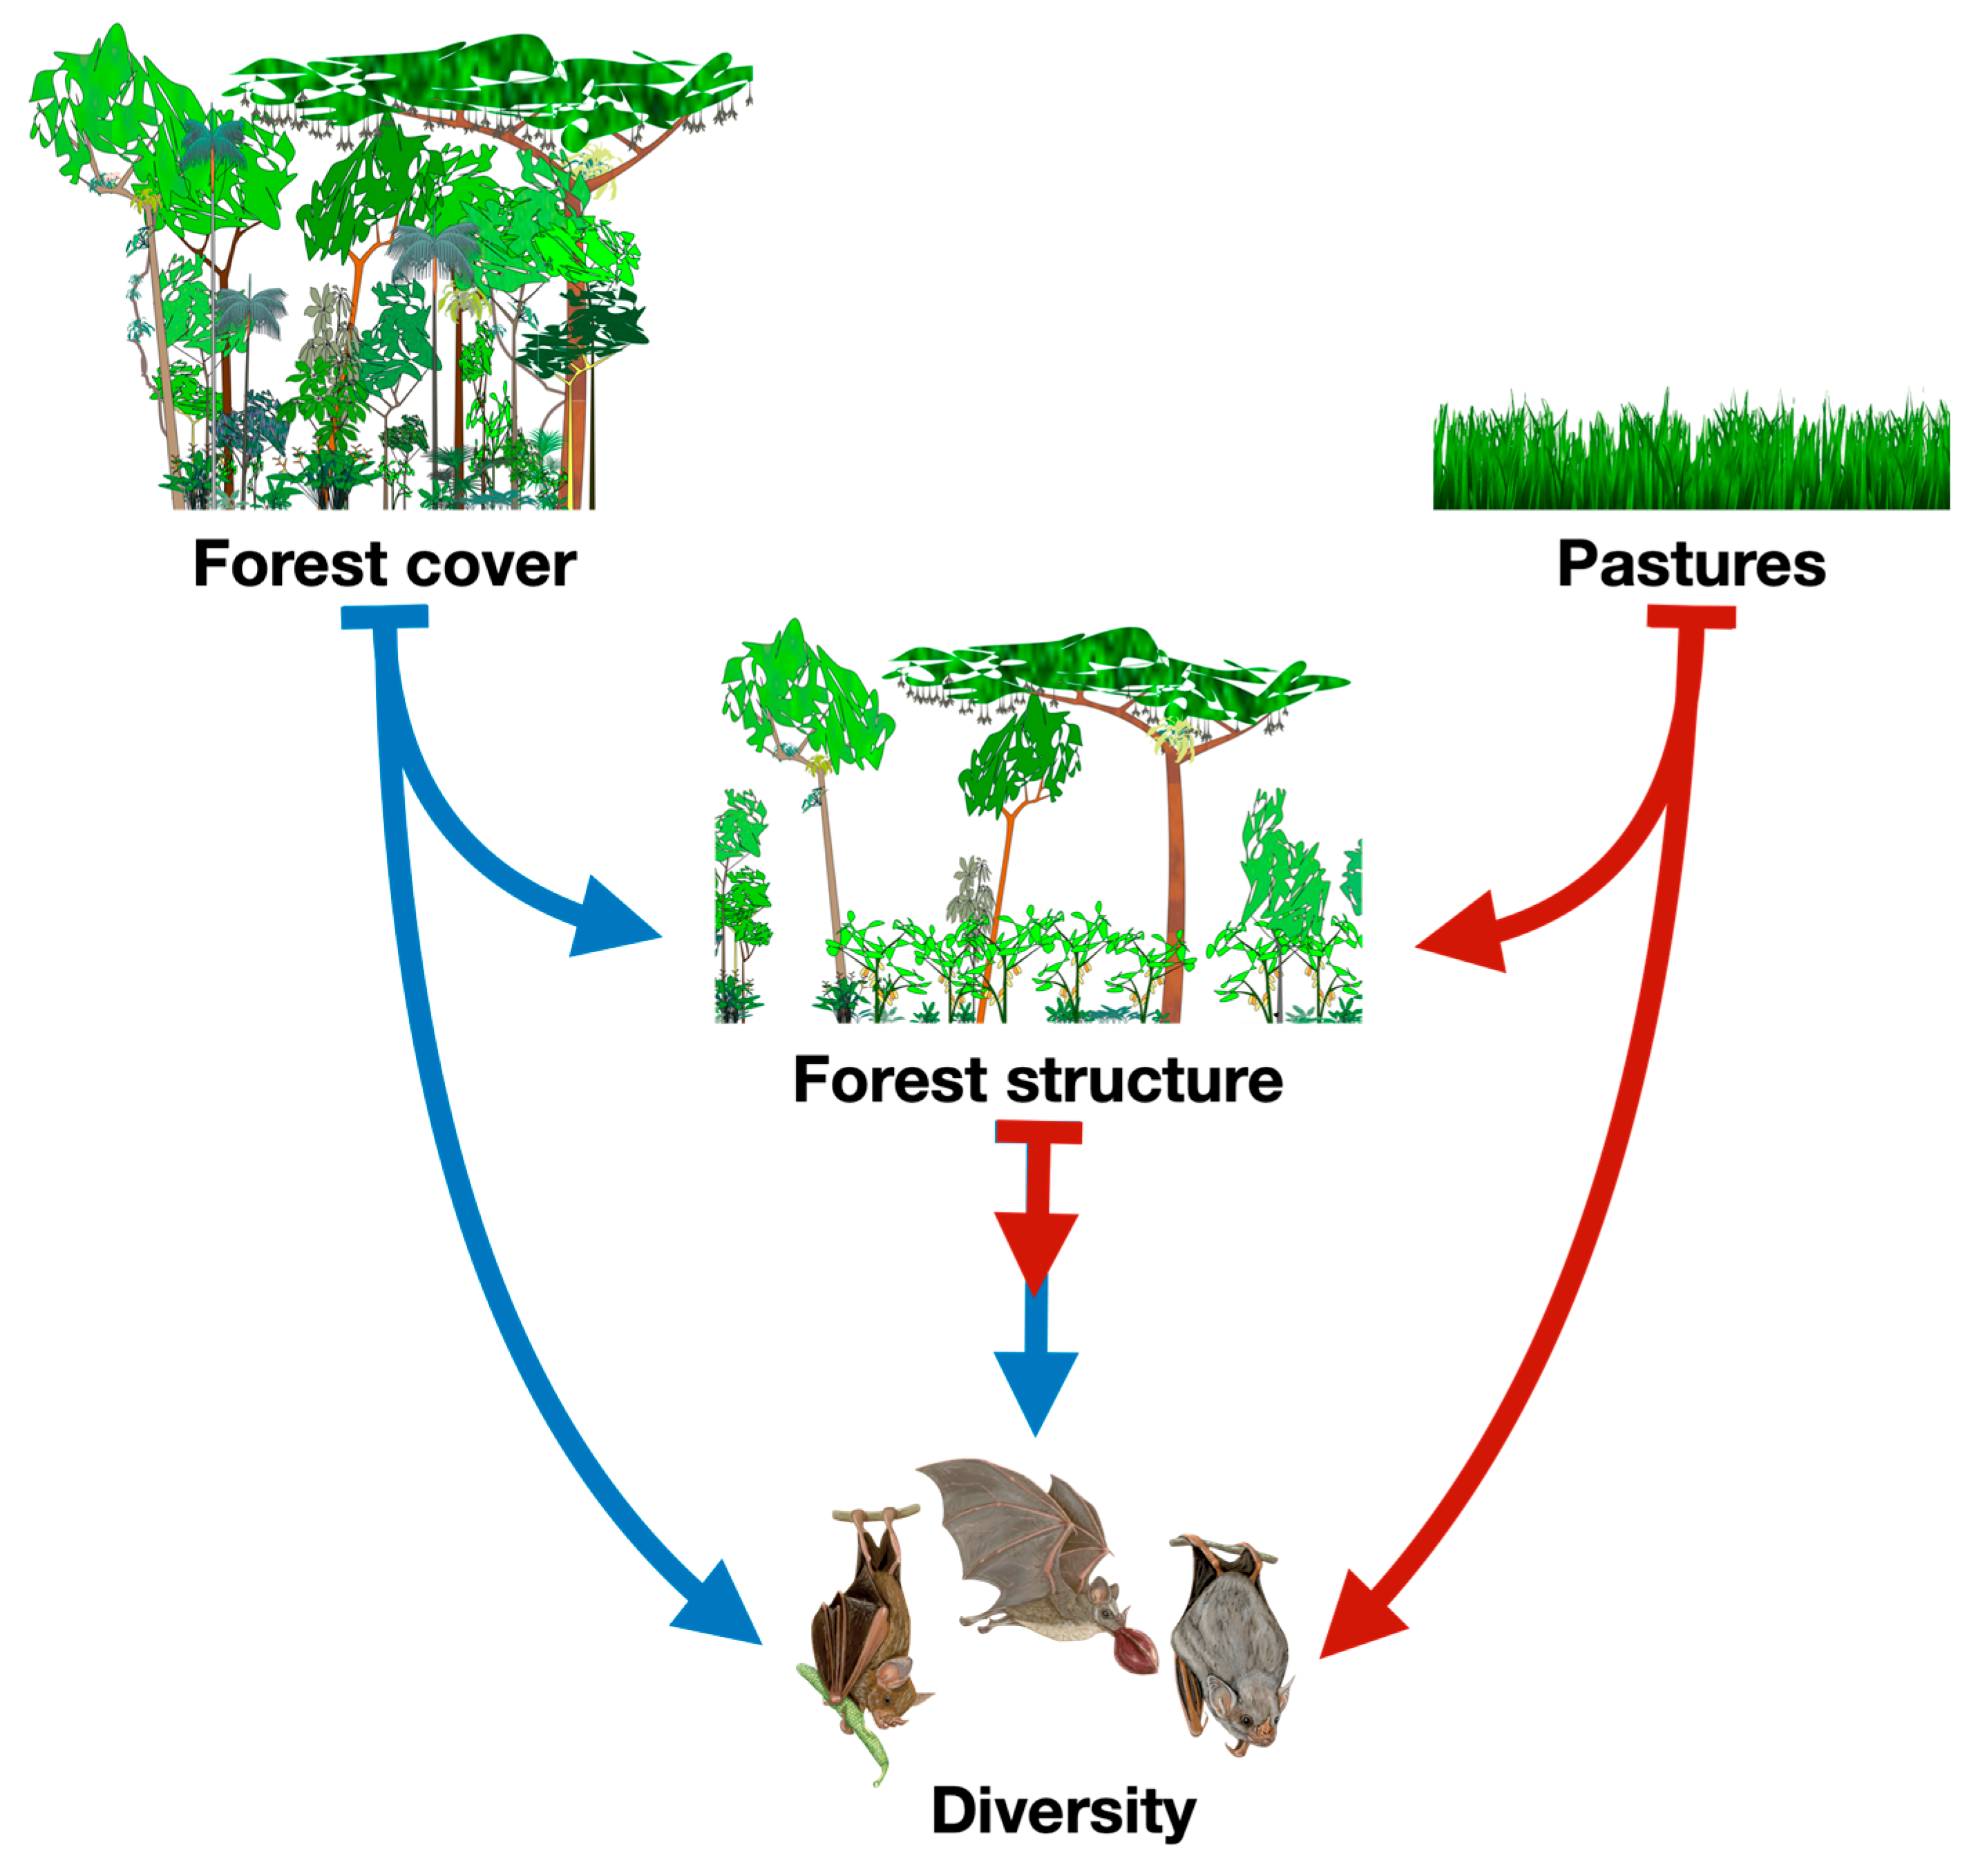
Figure 2.
Distribution of the 20 sampling sites located in Atlantic Forest remnants in southern Bahia, Brazil. We also present two landscapes (800m radius) to evidence the distinct amount and distribution of forest cover.
Figure 2.
Distribution of the 20 sampling sites located in Atlantic Forest remnants in southern Bahia, Brazil. We also present two landscapes (800m radius) to evidence the distinct amount and distribution of forest cover.
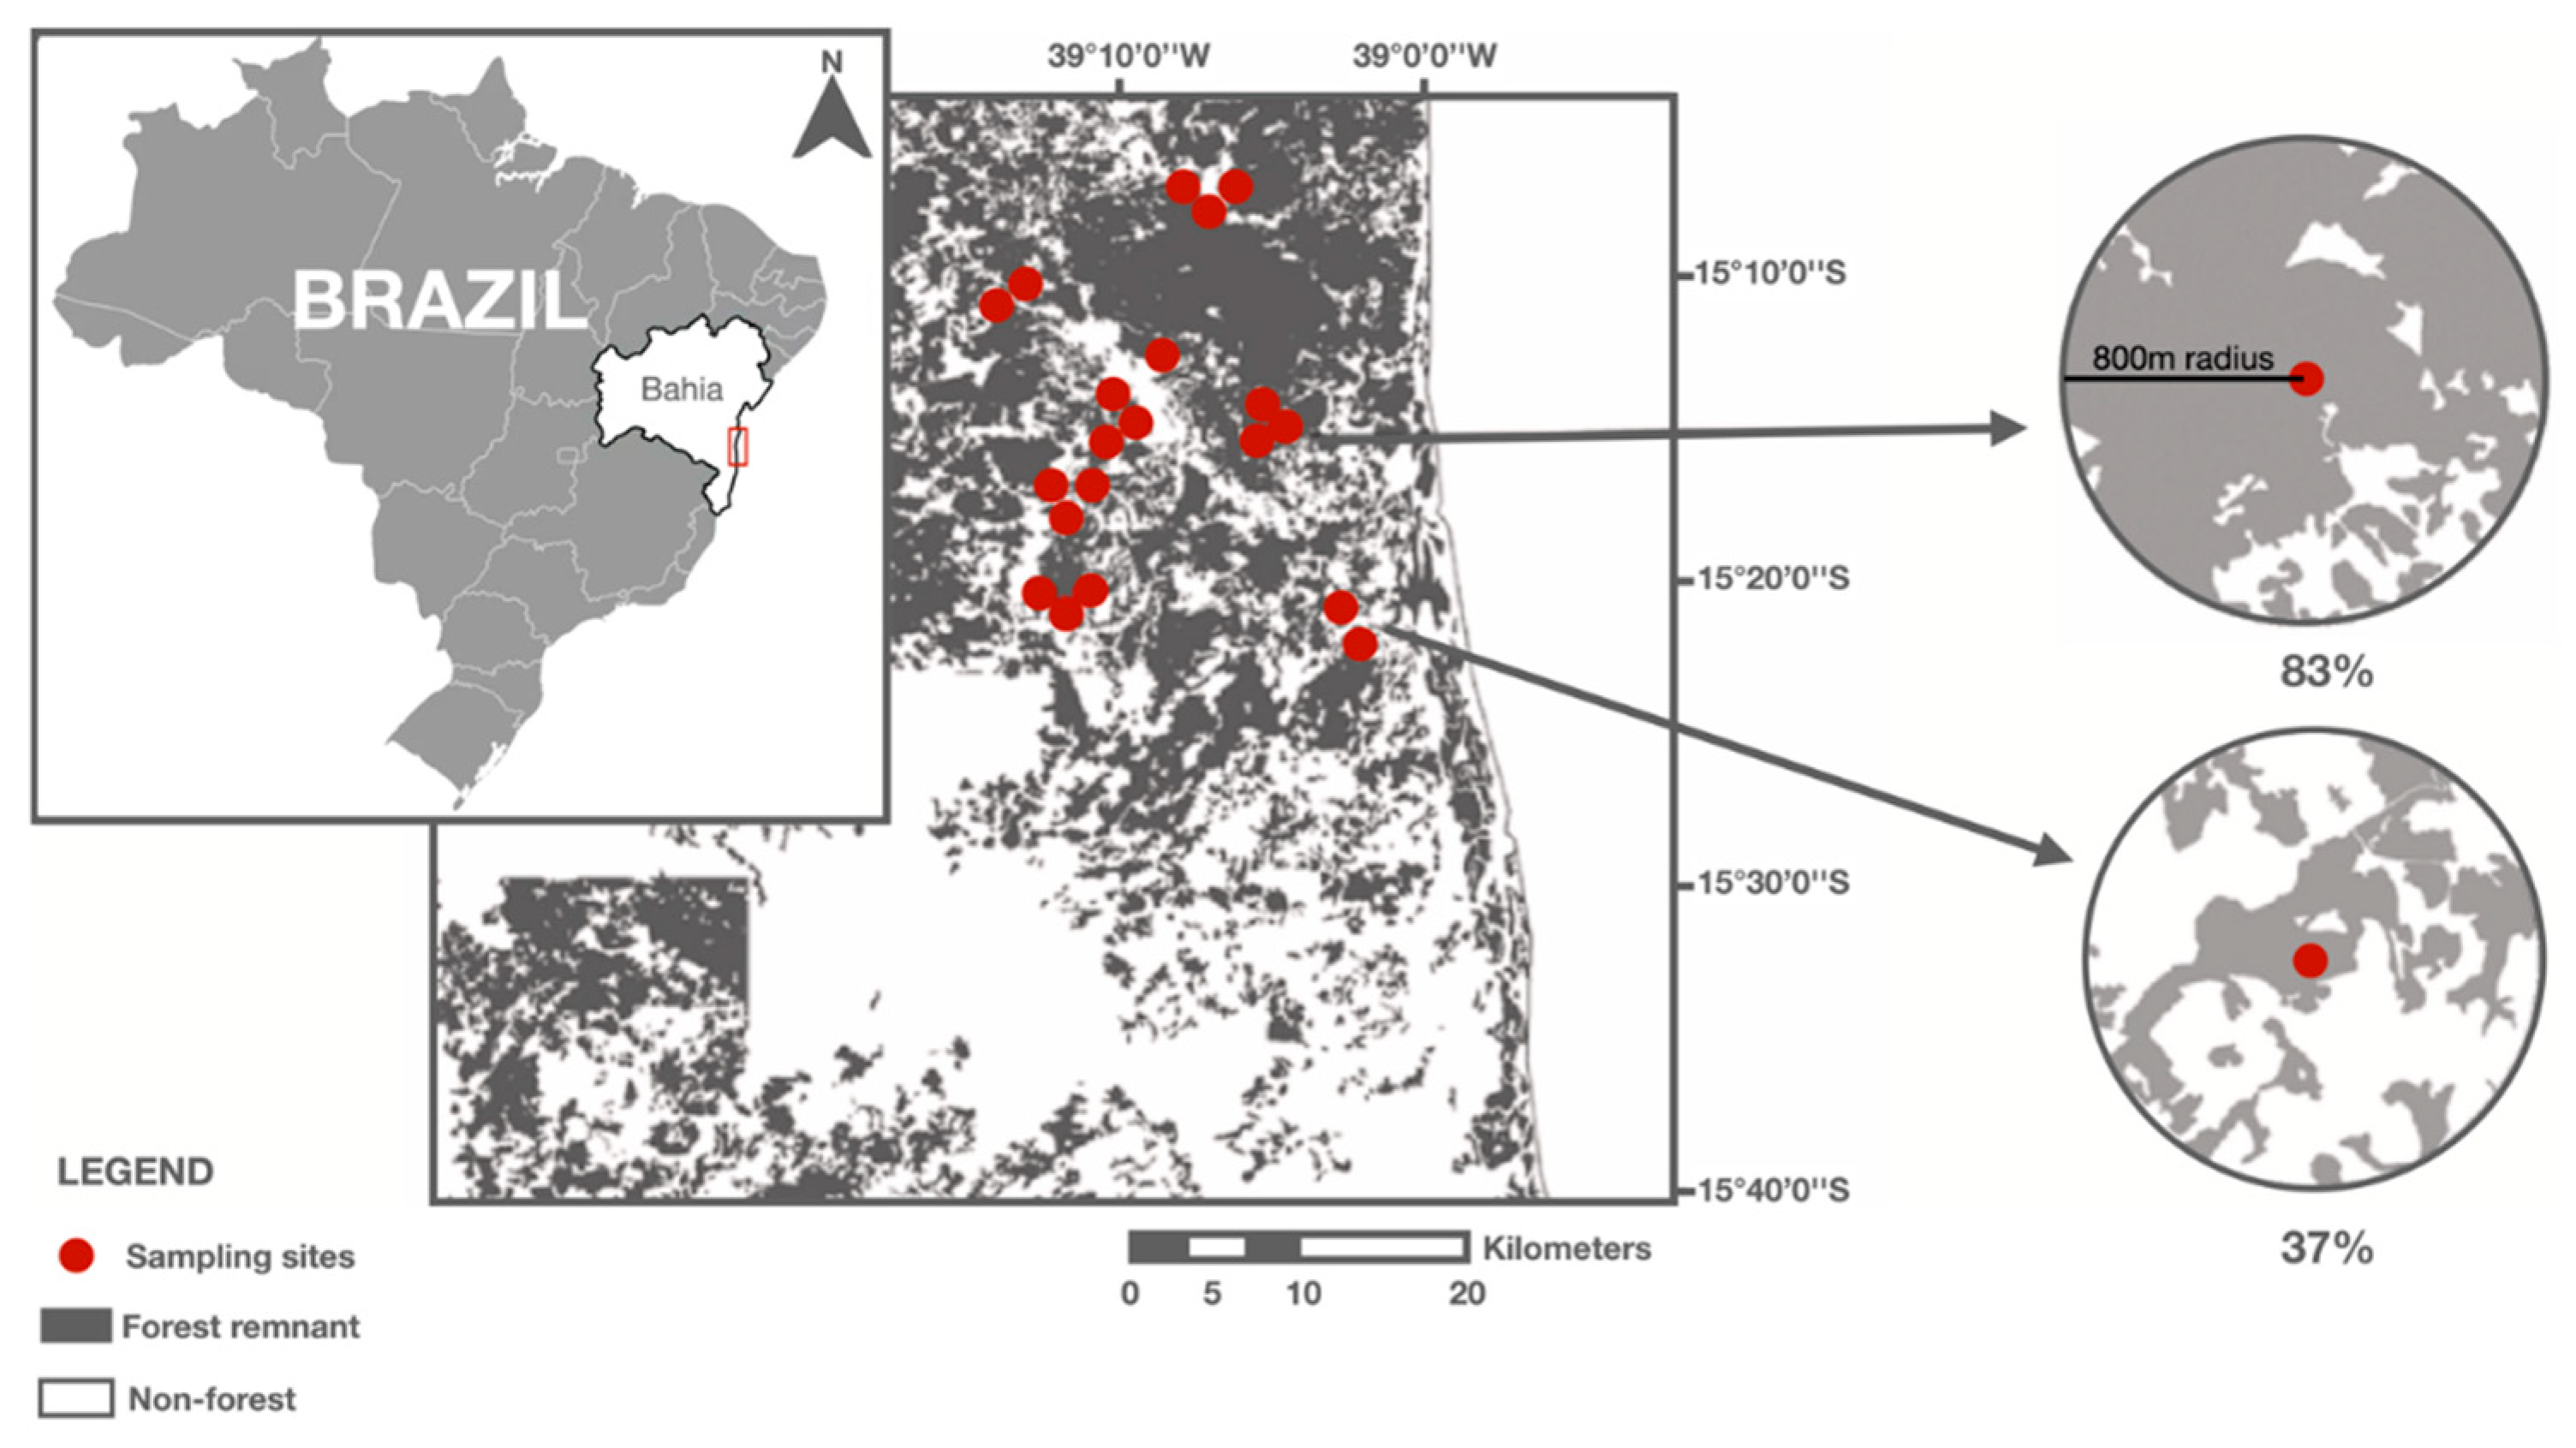
Figure 3.
Best-fitted path model showing the direct and indirect effects of landscape forest cover and local forest structure on the Phyllostomid bats richness collected in 40 forest remnants located in southern Bahia, Brazil. Arrow thickness exhibits the relative strength of effects, dashed lines exhibit no significant effect, and P-values of coefficients are indicated with asterisks (*P <0.10, **P<0.05, ***P <0.01). The black squares show the coefficient of determination (R2) for richness of Phyllostomid bats.
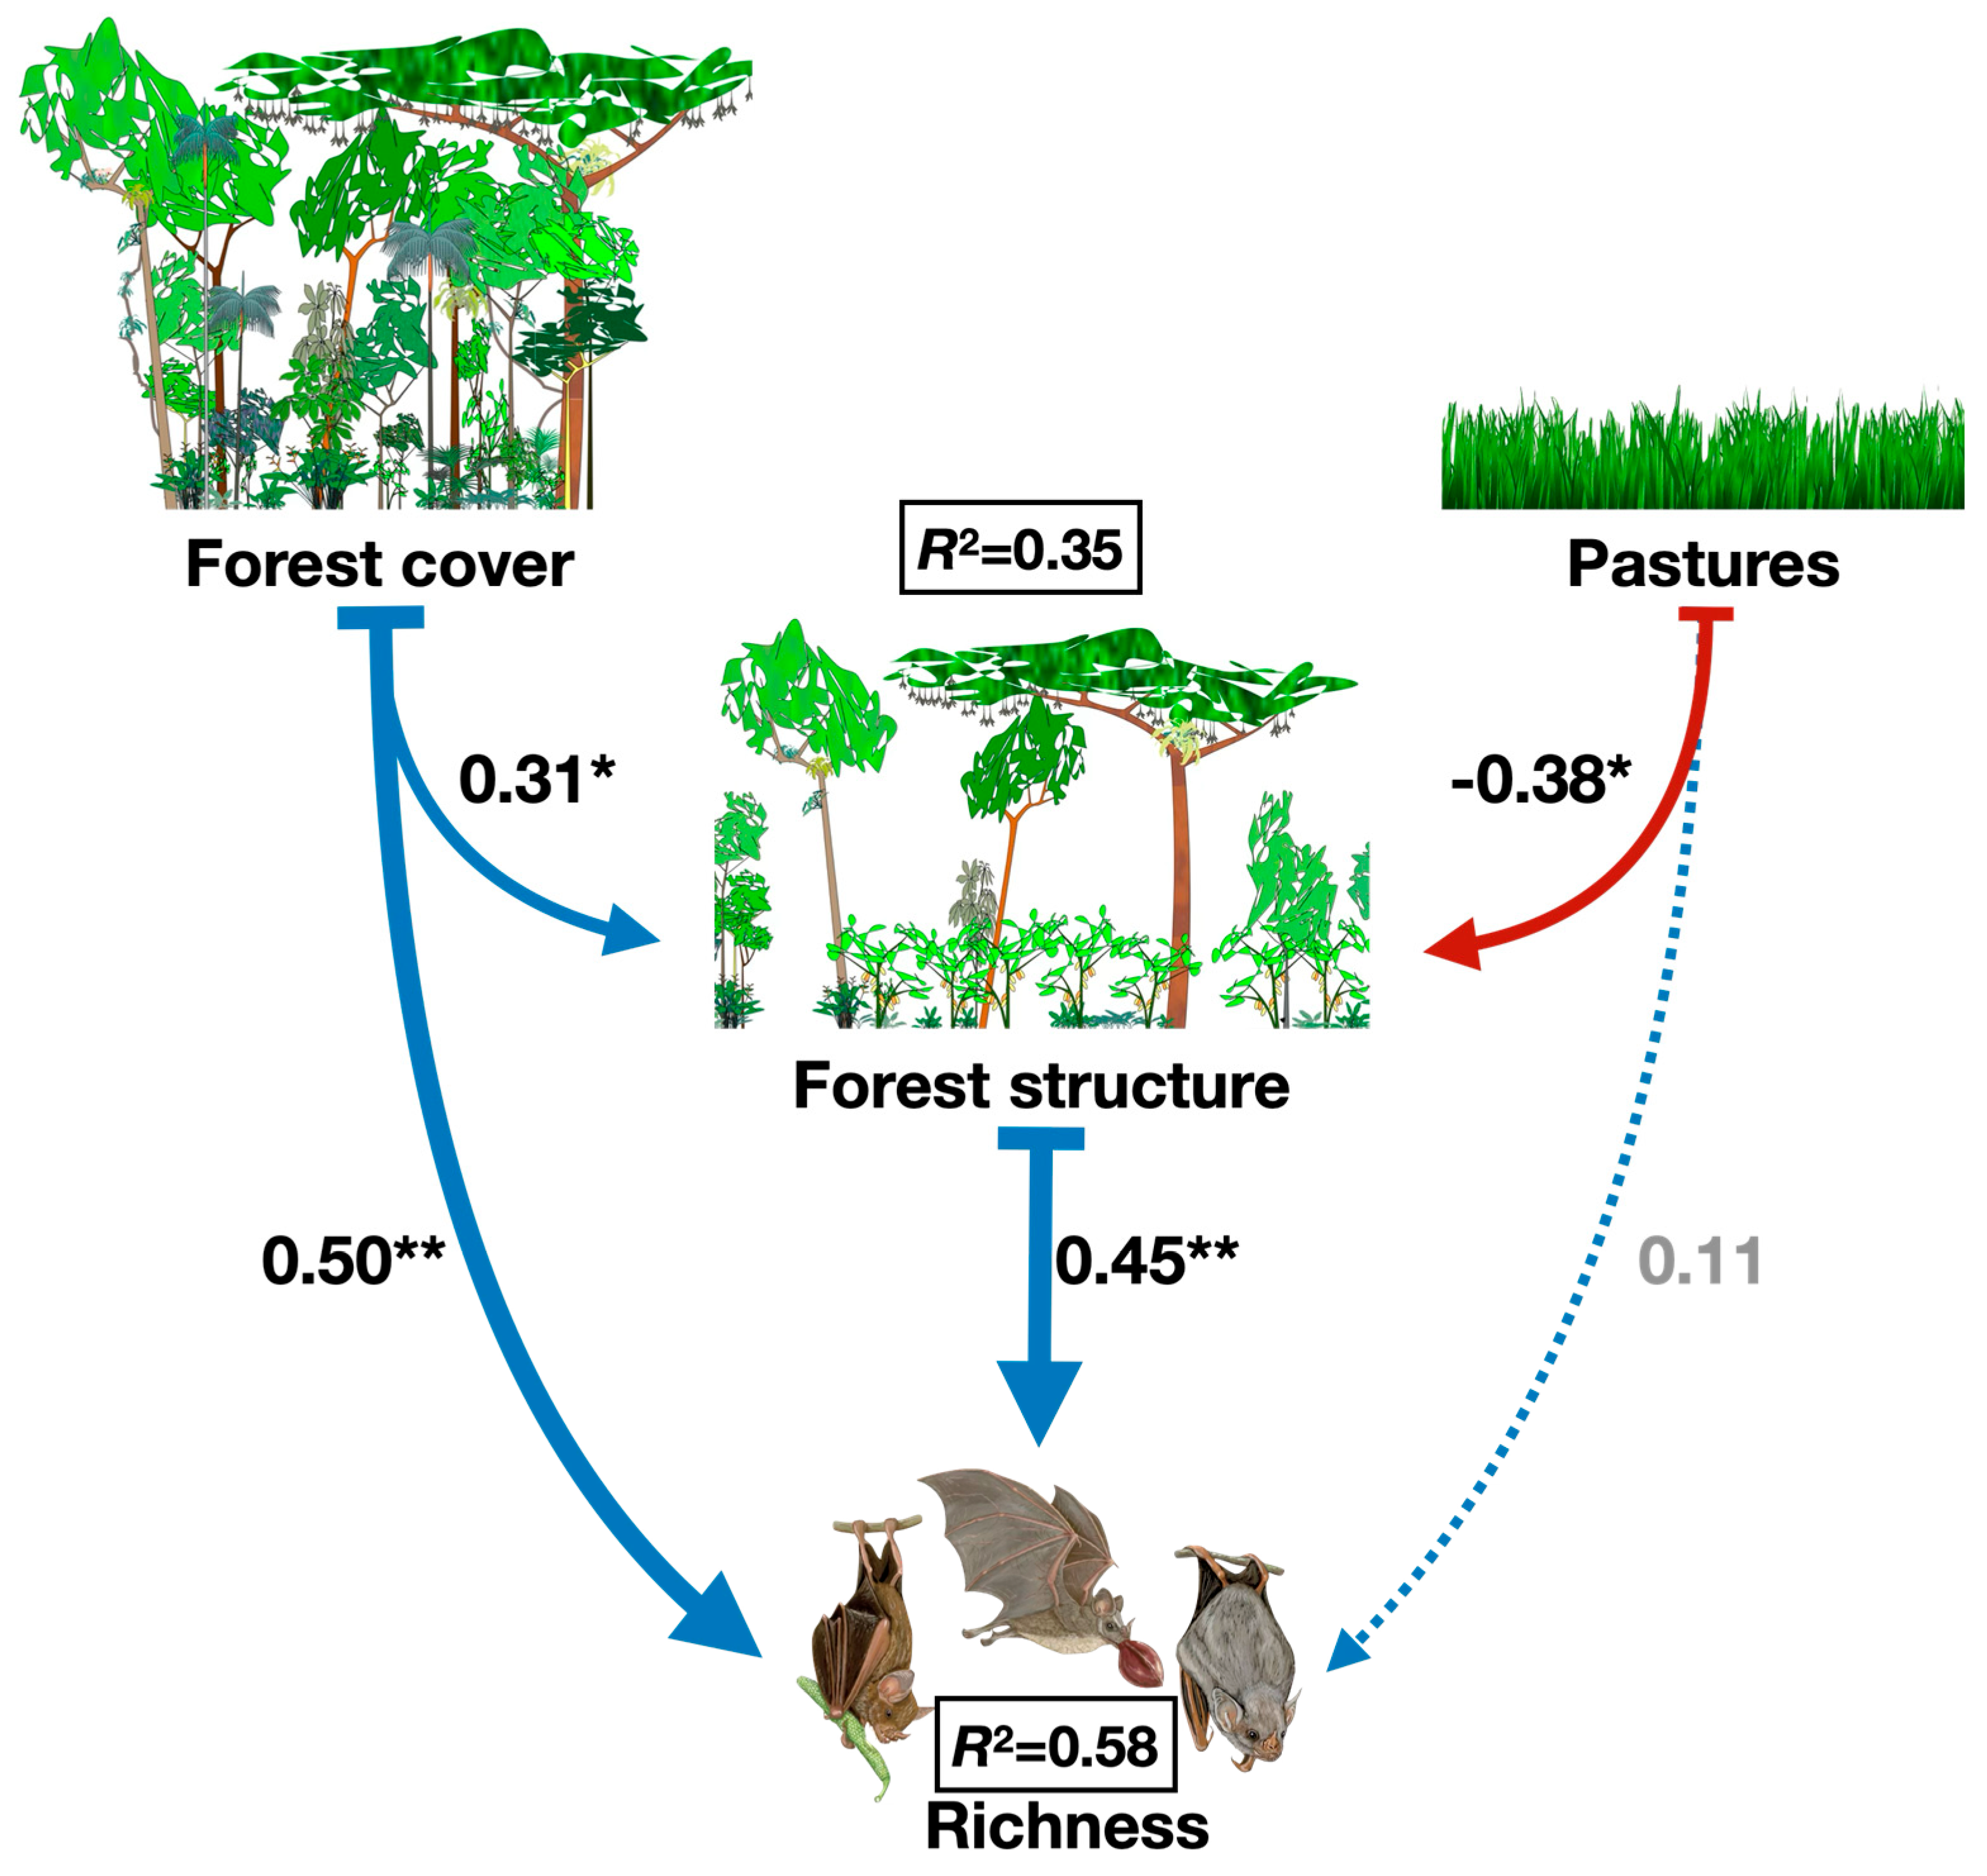
Figure 4.
Best-fitted path model showing the direct and indirect effects of landscape forest cover and local forest structure on the Phyllostomid bats abundance collected in 40 forest remnants located in southern Bahia, Brazil. Arrow thickness exhibits the relative strength of effects, dashed lines exhibit no significant effect, and P-values of coefficients are indicated with asterisks (*P <0.10, **P<0.05, ***P <0.01). The black squares show the coefficient of determination (R2) for abundance of Phyllostomid bats.
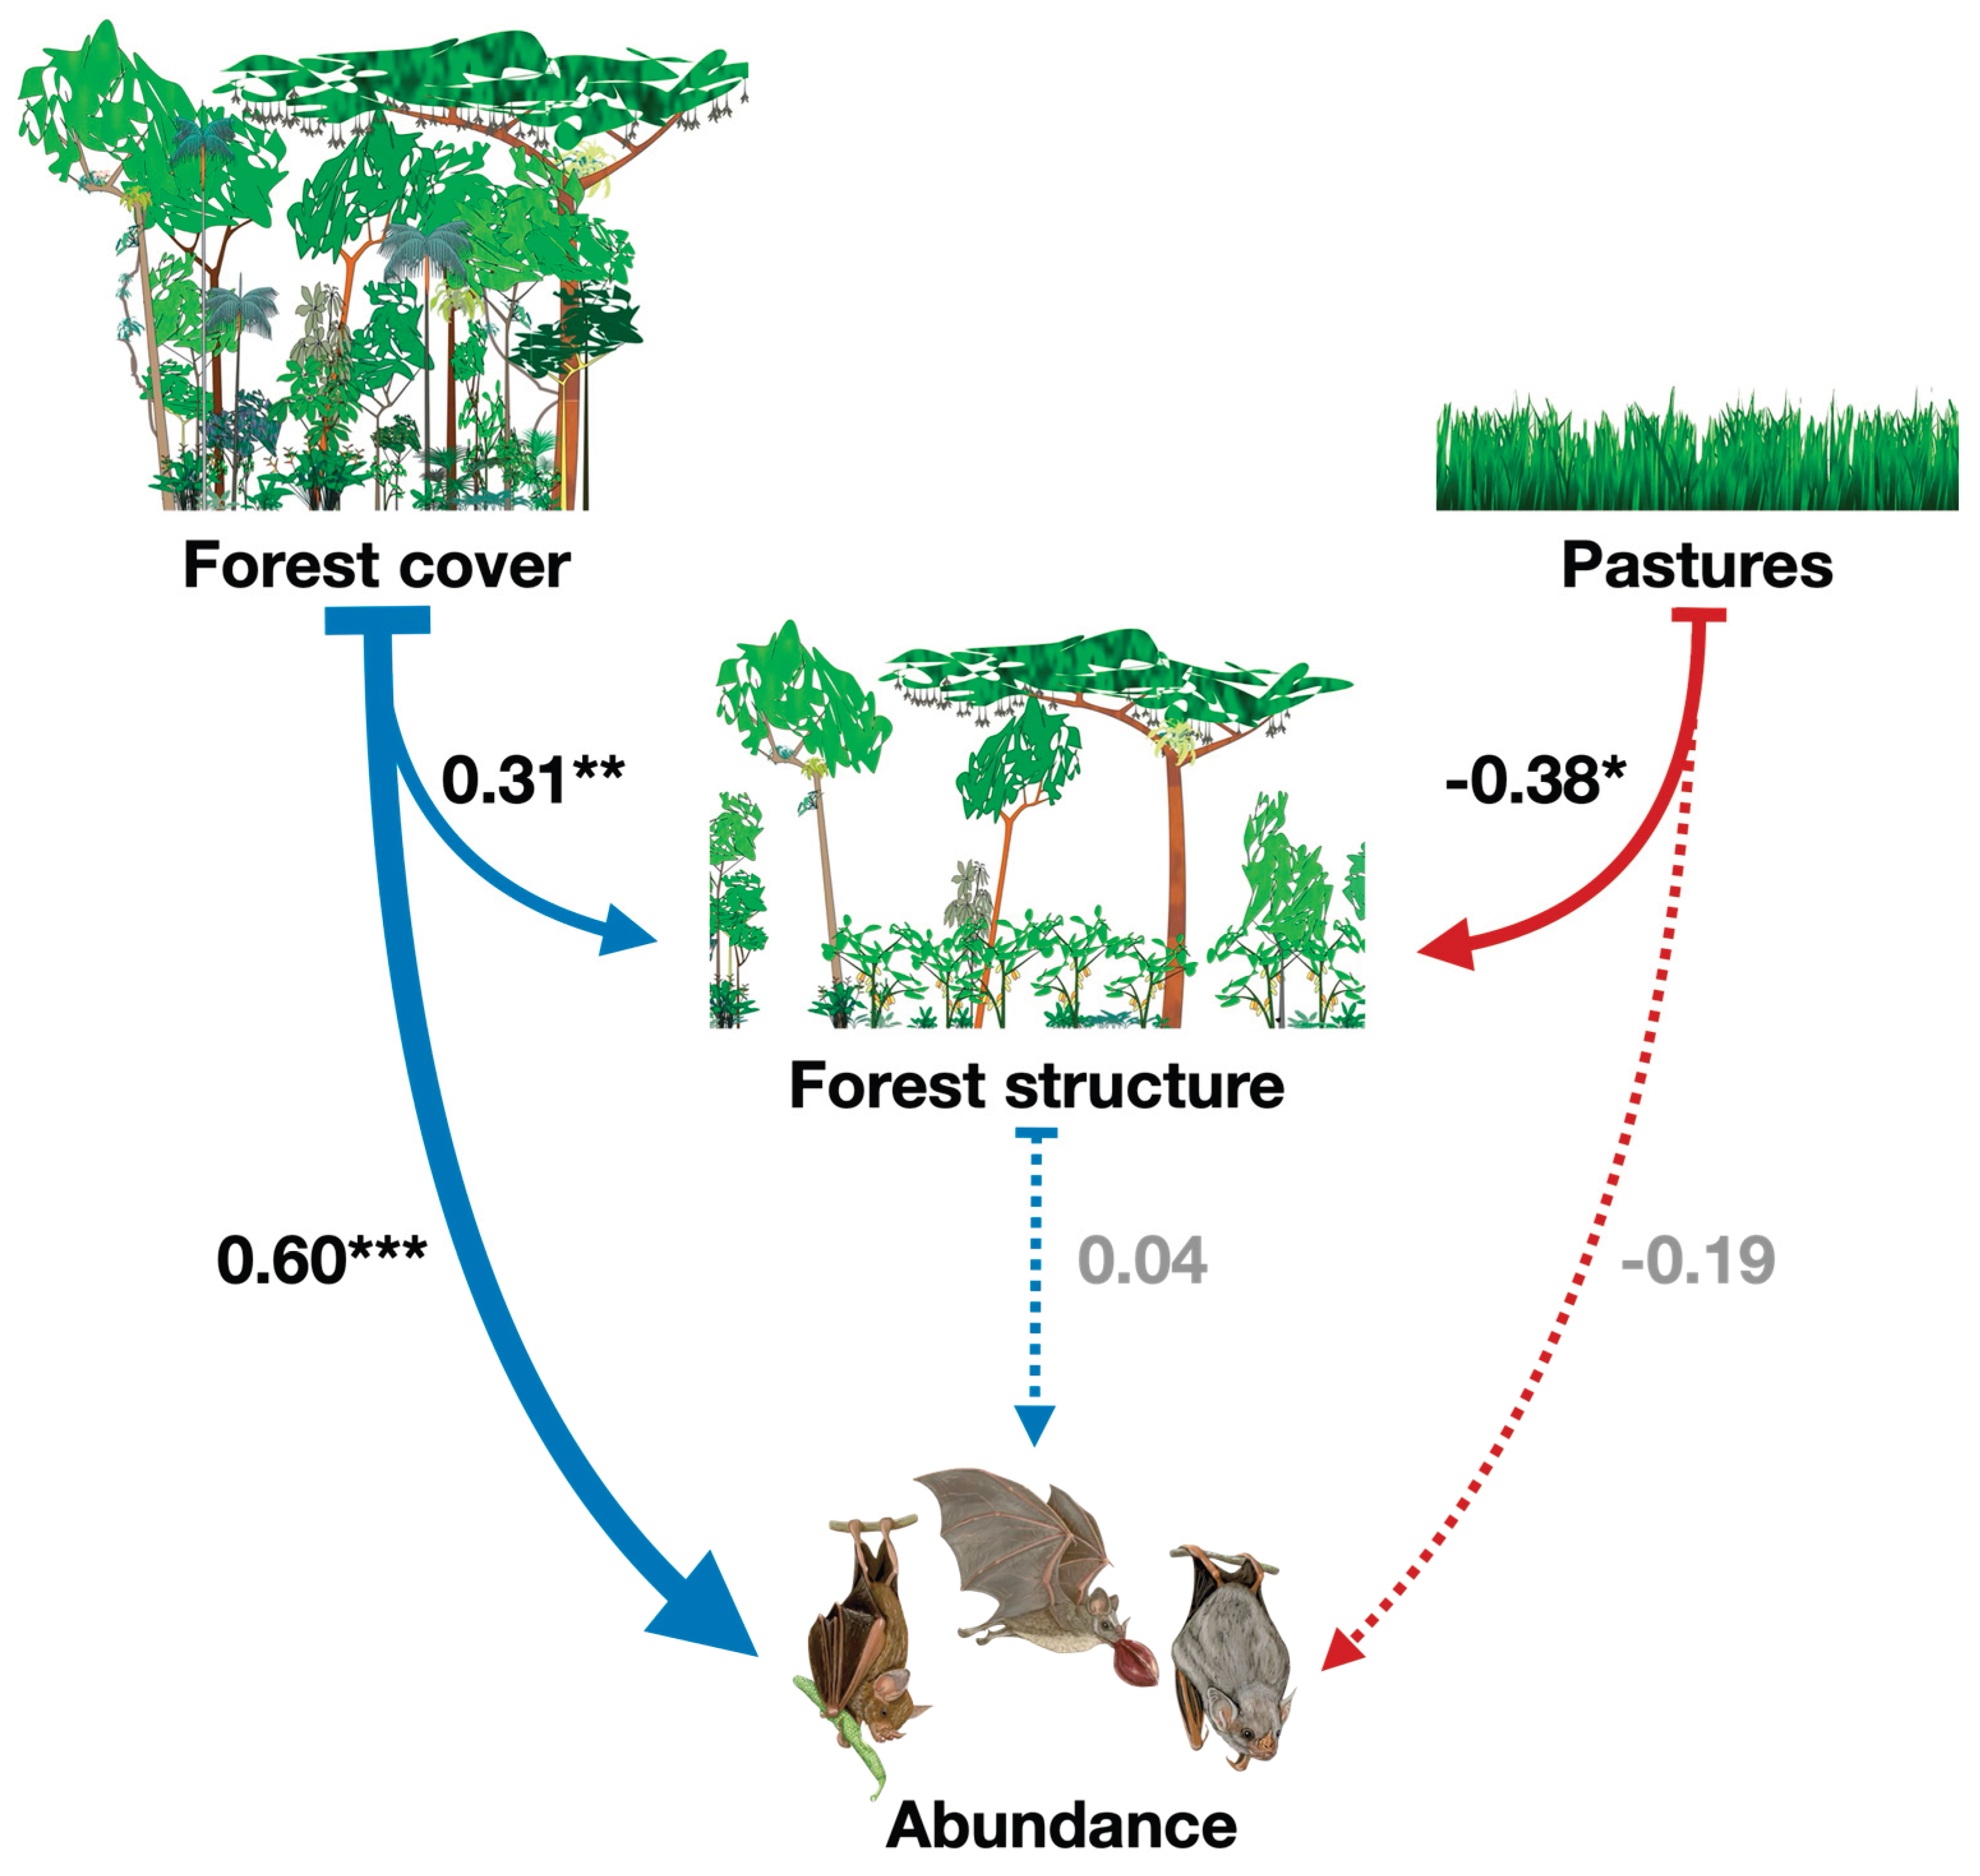

Table 1.
Richness, composition and abundance of Phillostomidae bats captured in the Atlantic Forest landscapes of Southern Bahia, Brazil. Trophic guilds: c = carnivore; H = hematophagous; N = Nectarivore; IC = insectivorous picker; O = omnivorous; F = frugivorous. Number of captures (N) and the Percentage of capture (%).
| Species | Trophic guilds | N | (%) |
|---|---|---|---|
| Family Phyllostomidae | |||
| Subfamily Desmodontinae | |||
| Desmodus rotundus (E. Geoffroy,1810) | H | 4 | 0.67 |
| Subfamily Glossophaginae | |||
| Glossophaga soricina (Pallas, 1766) | N | 7 | 1.17 |
| Lonchophyla sp. | N | 1 | 0.17 |
| Subfamily Phyllostominae | |||
| Chrotopterus auritus (Peters, 1856) | C | 3 | 0.50 |
| Micronycteris megalotis (Gray, 1842) | Ic | 1 | 0.17 |
| Micronycteris sp. | Ic | 1 | 0.17 |
| Phylloderma stenops (Peters 1865) | O | 3 | 0.50 |
| Phyllostomus discolor Wagner, 1843 | O | 3 | 0.50 |
| Gardenericterys crenulatum (É. Geoffroy, 1803) | Ic | 1 | 0.17 |
| Lophostoma brasiliensis Peters, 1866 | Ic | 2 | 0.34 |
| Subfamily Carolliinae | |||
| Carollia brevicauda (Linnaeus, 1758) | F | 12 | 2.01 |
| Carollia perspicillata (Linnaeus, 1758) | F | 268 | 44.97 |
| Subfamily Rhinophyllinae | |||
| Rhinophylla fischerae Carter, 1966 | F | 3 | 0.50 |
| Rhinophylla pumilio Peters, 1865 | F | 142 | 23.83 |
| Subfamily Stenodermatinae | |||
| Artibeus lituratus (Olfers, 1818) | F | 33 | 5.54 |
| Artibeus planirostris (Spix, 1823) | F | 10 | 1.68 |
| Artibeus obscurus (Schinz, 1821) | F | 57 | 9.56 |
| Dermanura cinerea (Gervais, 1856) | F | 40 | 6.71 |
| Platyrrhinus lineatus (É. Geoffroy, 1810) | F | 1 | 0.17 |
| Sturnira lilium (E. Geoffroy, 1810) | F | 4 | 0.67 |
| TOTAL: | 596 | 100 |
Disclaimer/Publisher’s Note: The statements, opinions and data contained in all publications are solely those of the individual author(s) and contributor(s) and not of MDPI and/or the editor(s). MDPI and/or the editor(s) disclaim responsibility for any injury to people or property resulting from any ideas, methods, instructions or products referred to in the content. |
© 2025 by the authors. Licensee MDPI, Basel, Switzerland. This article is an open access article distributed under the terms and conditions of the Creative Commons Attribution (CC BY) license (http://creativecommons.org/licenses/by/4.0/).
Copyright: This open access article is published under a Creative Commons CC BY 4.0 license, which permit the free download, distribution, and reuse, provided that the author and preprint are cited in any reuse.


