
Submitted:
10 June 2025
Posted:
12 June 2025
You are already at the latest version
Abstract
This applied study examines the Caribbean Lucky Pick 5/28 lottery using the Sirius Code framework and the Victoria-Nash Asymmetric Equilibrium (VNAE). By employing partial coverage with concentrated density and a strategically fixed subset of 11 numbers, the study demonstrates a mathematically positive expectation across 100 consecutive draws. Results reveal significant profitability even under conservative assumptions, reinforcing the replicability of the method. The findings challenge the conventional notion of lotteries as purely negative expectation games and invite the academic community to delve deeper into stochastic environments in which structured strategies can generate asymmetric advantages.
Keywords:
Randomness
; Lotteries
; Statistics
; Game Theory
; Behavioral Economics
; Victoria-Nash Asymmetric Equilibrium
1. Introduction
This study applies the theoretical foundations of the Sirius Code through the strategy of partial coverage with concentrated density, a statistical approach designed to optimize the selection of numerical subsets in lottery games. In addition, the Victoria-Nash Asymmetric Equilibrium (VNAE) is employed via the function fv(Xt) as a strategic decision-making resource, combining elements of game theory with “adverse probabilistic behavior” to maximize efficiency across temporal series of draws. The empirical focus is placed on the Lucky Pick 5/28 lottery, operated in the Caribbean. The probabilistic structure of the game, the presence of multipliers, and the high draw frequency provide a favorable environment for practical validation of the proposed methodology.
This paper is part of an ongoing series of studies in which the author has successfully applied the Sirius Code and the Victoria-Nash Asymmetric Equilibrium (VNAE) to various lottery formats, including Lotofácil with its 15/25 matrix, the UK’s Lotto 5/69, and the Oklahoma Cash 5 in the United States, among others. The purpose of this study is to contribute to the construction of a solid practical foundation for replicability transforming randomness from being merely a natural component of a stochastic environment into a partially ‘predictable’ and manageable phenomenon. This transformation ultimately provides an asymmetric advantage to players and, as a result, a strategically profitable position, theoretically supported by Feller’s paradox (1968), Chebyshev's inequalities, and the law of large numbers.
2. Methodology
As in previous papers presenting practical demonstrations of the Sirius Code, the present study analyzes a historical series of 100 consecutive lottery draws from a game with either similar or entirely distinct design compared to those previously examined by the author. The objective, further explored in the foundational paper by Pereira (2025c) is not necessarily to delve into detailed boundaries such as lower or upper limits of guaranteed matches as defined by the law of large numbers or Chebyshev’s inequalities. Rather, the emphasis lies in evaluating the cumulative sum of profits and losses across each individual draw within the sample, in order to reliably infer the existence of a positive mathematical expectation under specific conditions.
Given that this article belongs to a series of empirical studies applying the Sirius Code to various international lottery systems, the theoretical framework has been intentionally summarized. For a comprehensive understanding of the technical details, readers should refer to the foundational paper by Pereira (2025c).
3. Results and Discussions
3.1. Understanding the Lucky Pick Lottery
The Lucky Pick is a seven-day-a-week Lottery, operated across several Caribbean jurisdictions, is a widely played numerical lottery game characterized by its simple format and broad popular appeal. Each ticket costs $1. The game matrix follows a 5/28 format, meaning players must select 5 numbers from a pool of 28 possible balls. Additionally, the lottery incorporates multipliers ranging from 2x to 5x, which enhance the payout amounts for secondary prize tiers corresponding to matches of r = 3 and r = 4.
Accordingly, the maximum probability of winning the jackpot is 1 in 98,280 possible combinations. The following tables present the distinct prize structures for two major Caribbean regions, which, for technical and methodological purposes, will be referred to as Box 1 (Anguilla / Antigua / St. Kitts & Nevis) and Box 2 (St. Maarten / US Virgin Islands / Bermuda), respectively.

Table 1.
Anguilla / Antigua / St. Kitts & Nevis Payout.
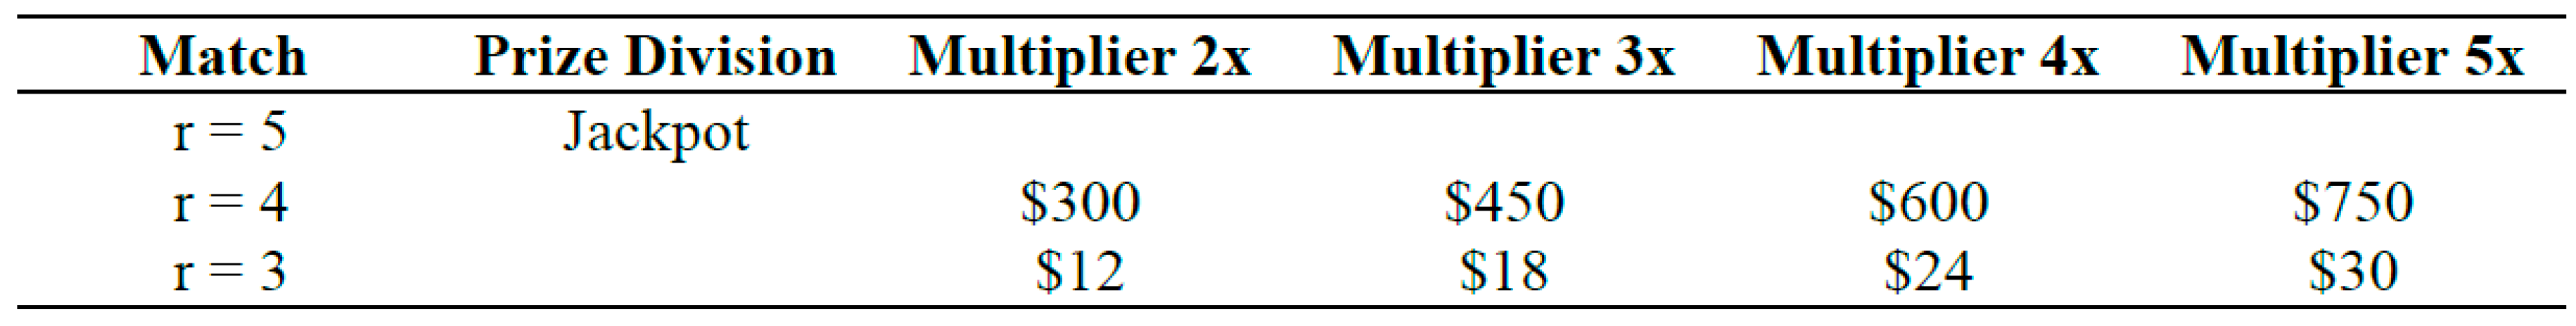 |
Table 2.
St. Maarten / US Virgin Islands / Bermuda Payout Table.
 |
In the context of the Sirius Code, this case study employs the method of partial coverage with concentrated density, using m = 11. That is, all possible combinations of a strategically optimized subset of numbers (from 1 to 11) are generated, with each ticket containing 5 numbers. This fixed set is repeatedly played across multiple draws. Applying basic combinatorial principles, this strategy requires the purchase of only 462 tickets, representing just 0.47% of the total 98,280 possible combinations in the full lottery matrix.
As shown in Table 3, within the 462 possible tickets derived from the selected subset, a total of 181 tickets would be winning entries assuming that the drawn numbers fall within the chosen range of 1 to 11. The following sections present the cost-benefit analysis, calculated as the aggregate value of prizes minus the total ticket expenses, across the different prize tiers for both Box 1 (Anguilla / Antigua / St. Kitts & Nevis) and Box 2 (St. Maarten / US Virgin Islands / Bermuda).
Table 3.
Expected winner tickets by prize tier (based on number of r matches) with m = 11.
| Matches | N° of Success Tickets |
|---|---|
| 5 | 1 |
| 4 | 30 |
| 3 | 150 |
Table 4.
Box 1 Cost-benefit analysis by match category under the partial coverage with concentrated density with m = 11.
Table 4.
Box 1 Cost-benefit analysis by match category under the partial coverage with concentrated density with m = 11.
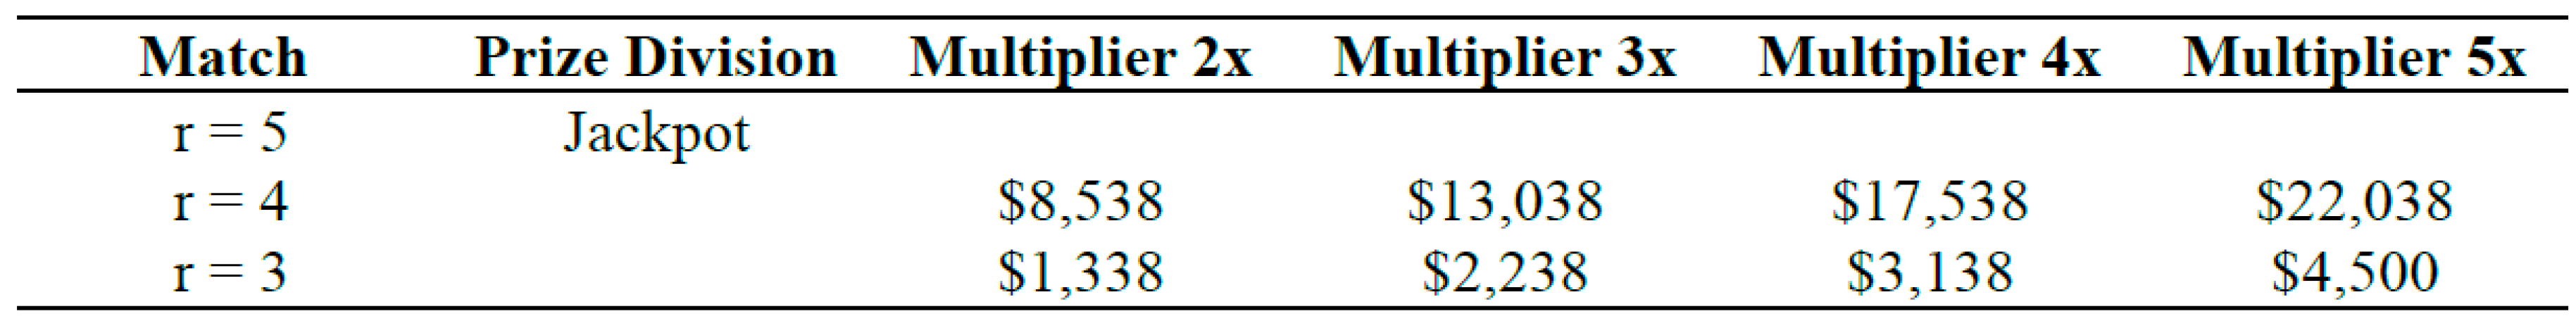 |
Table 5.
Box 2 Cost-benefit analysis by match category under the partial coverage with concentrated density with m = 11 As a complement to Table 4 and Table 5, it is worth noting that for the prize tiers corresponding to r = 2, r = 1, and r = 0 matches, the cumulative result yields a negative balance of -$462.
 |
3.2. An analysis of the Lucky Pick Historical Series
In the tables that follow, we present the historical series of 100 actual lottery draws, spanning from February 15, 2025, to May 27, 2025. In analogy with the Oklahoma Cash 5 example by Pereira (2025a), the use of symbols representing different match outcomes was also recommended and applied here, in order to enhance the visual interpretation of the results through the lens of convergence in probability.
Table 4.
Lucky Pick 5/28 Lotto results with m = 11 (Part I).
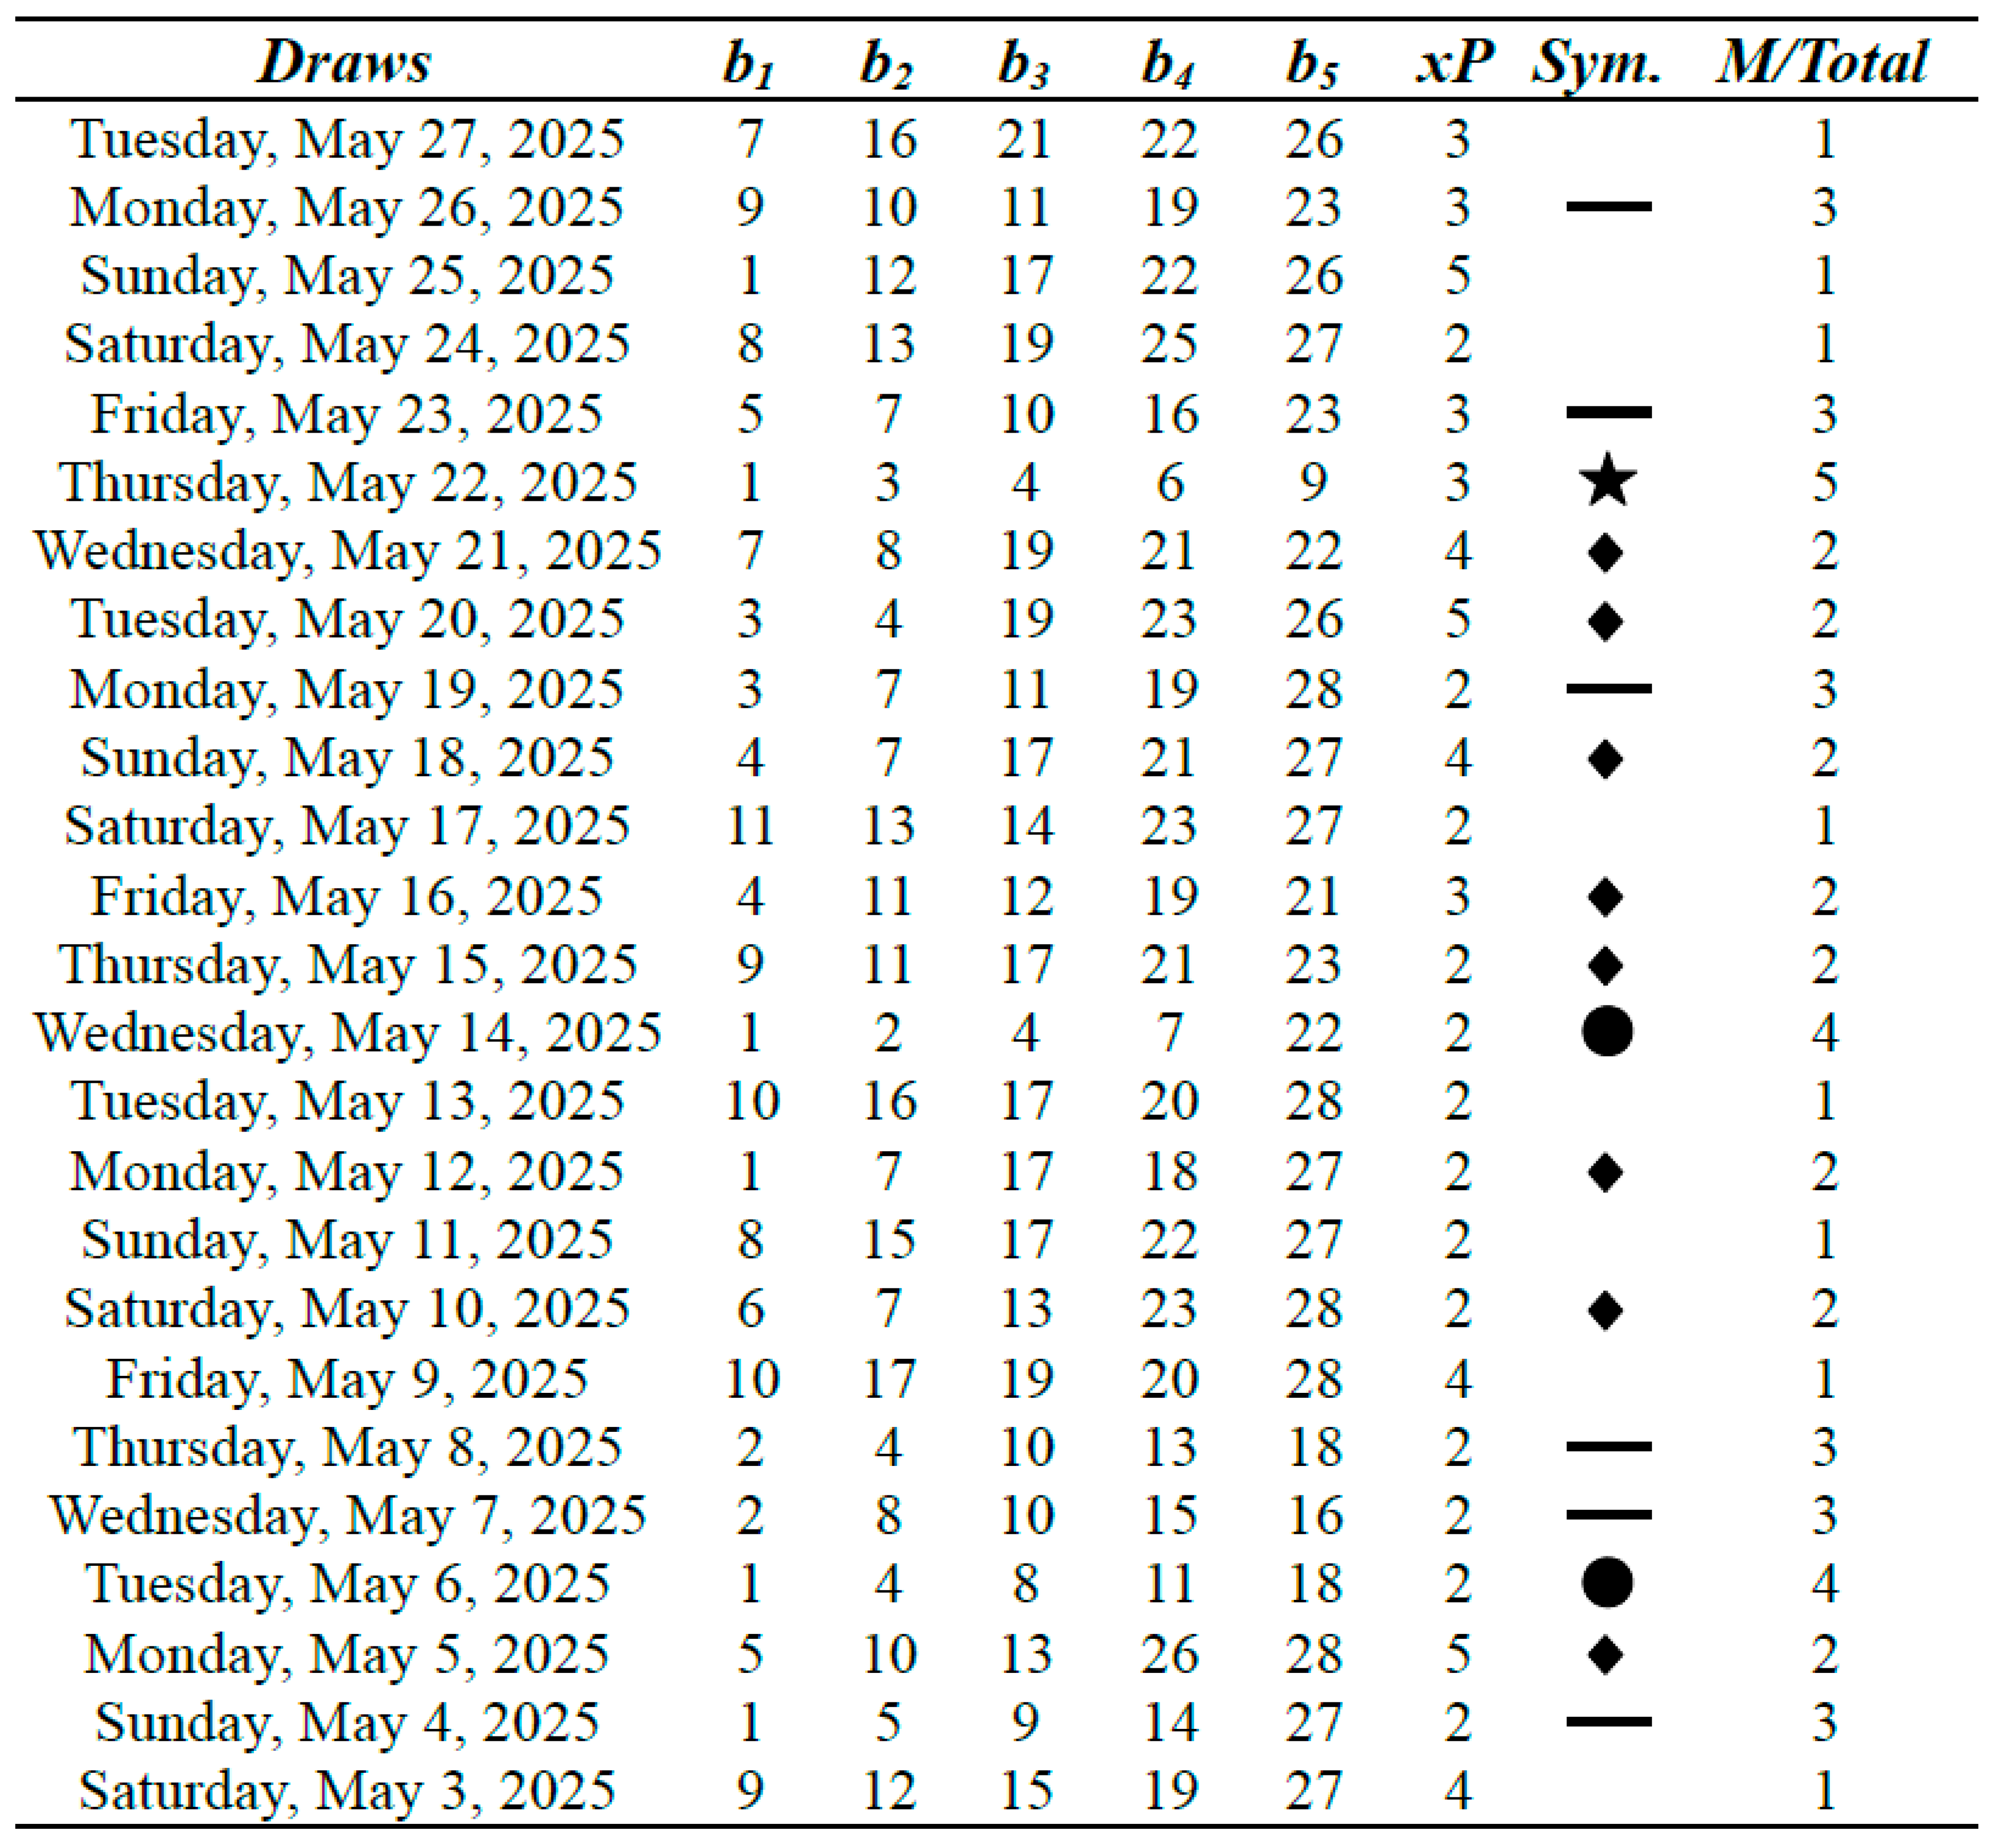 |
Table 5.
Lucky Pick 5/28 Lotto results with m = 11 (Part II).
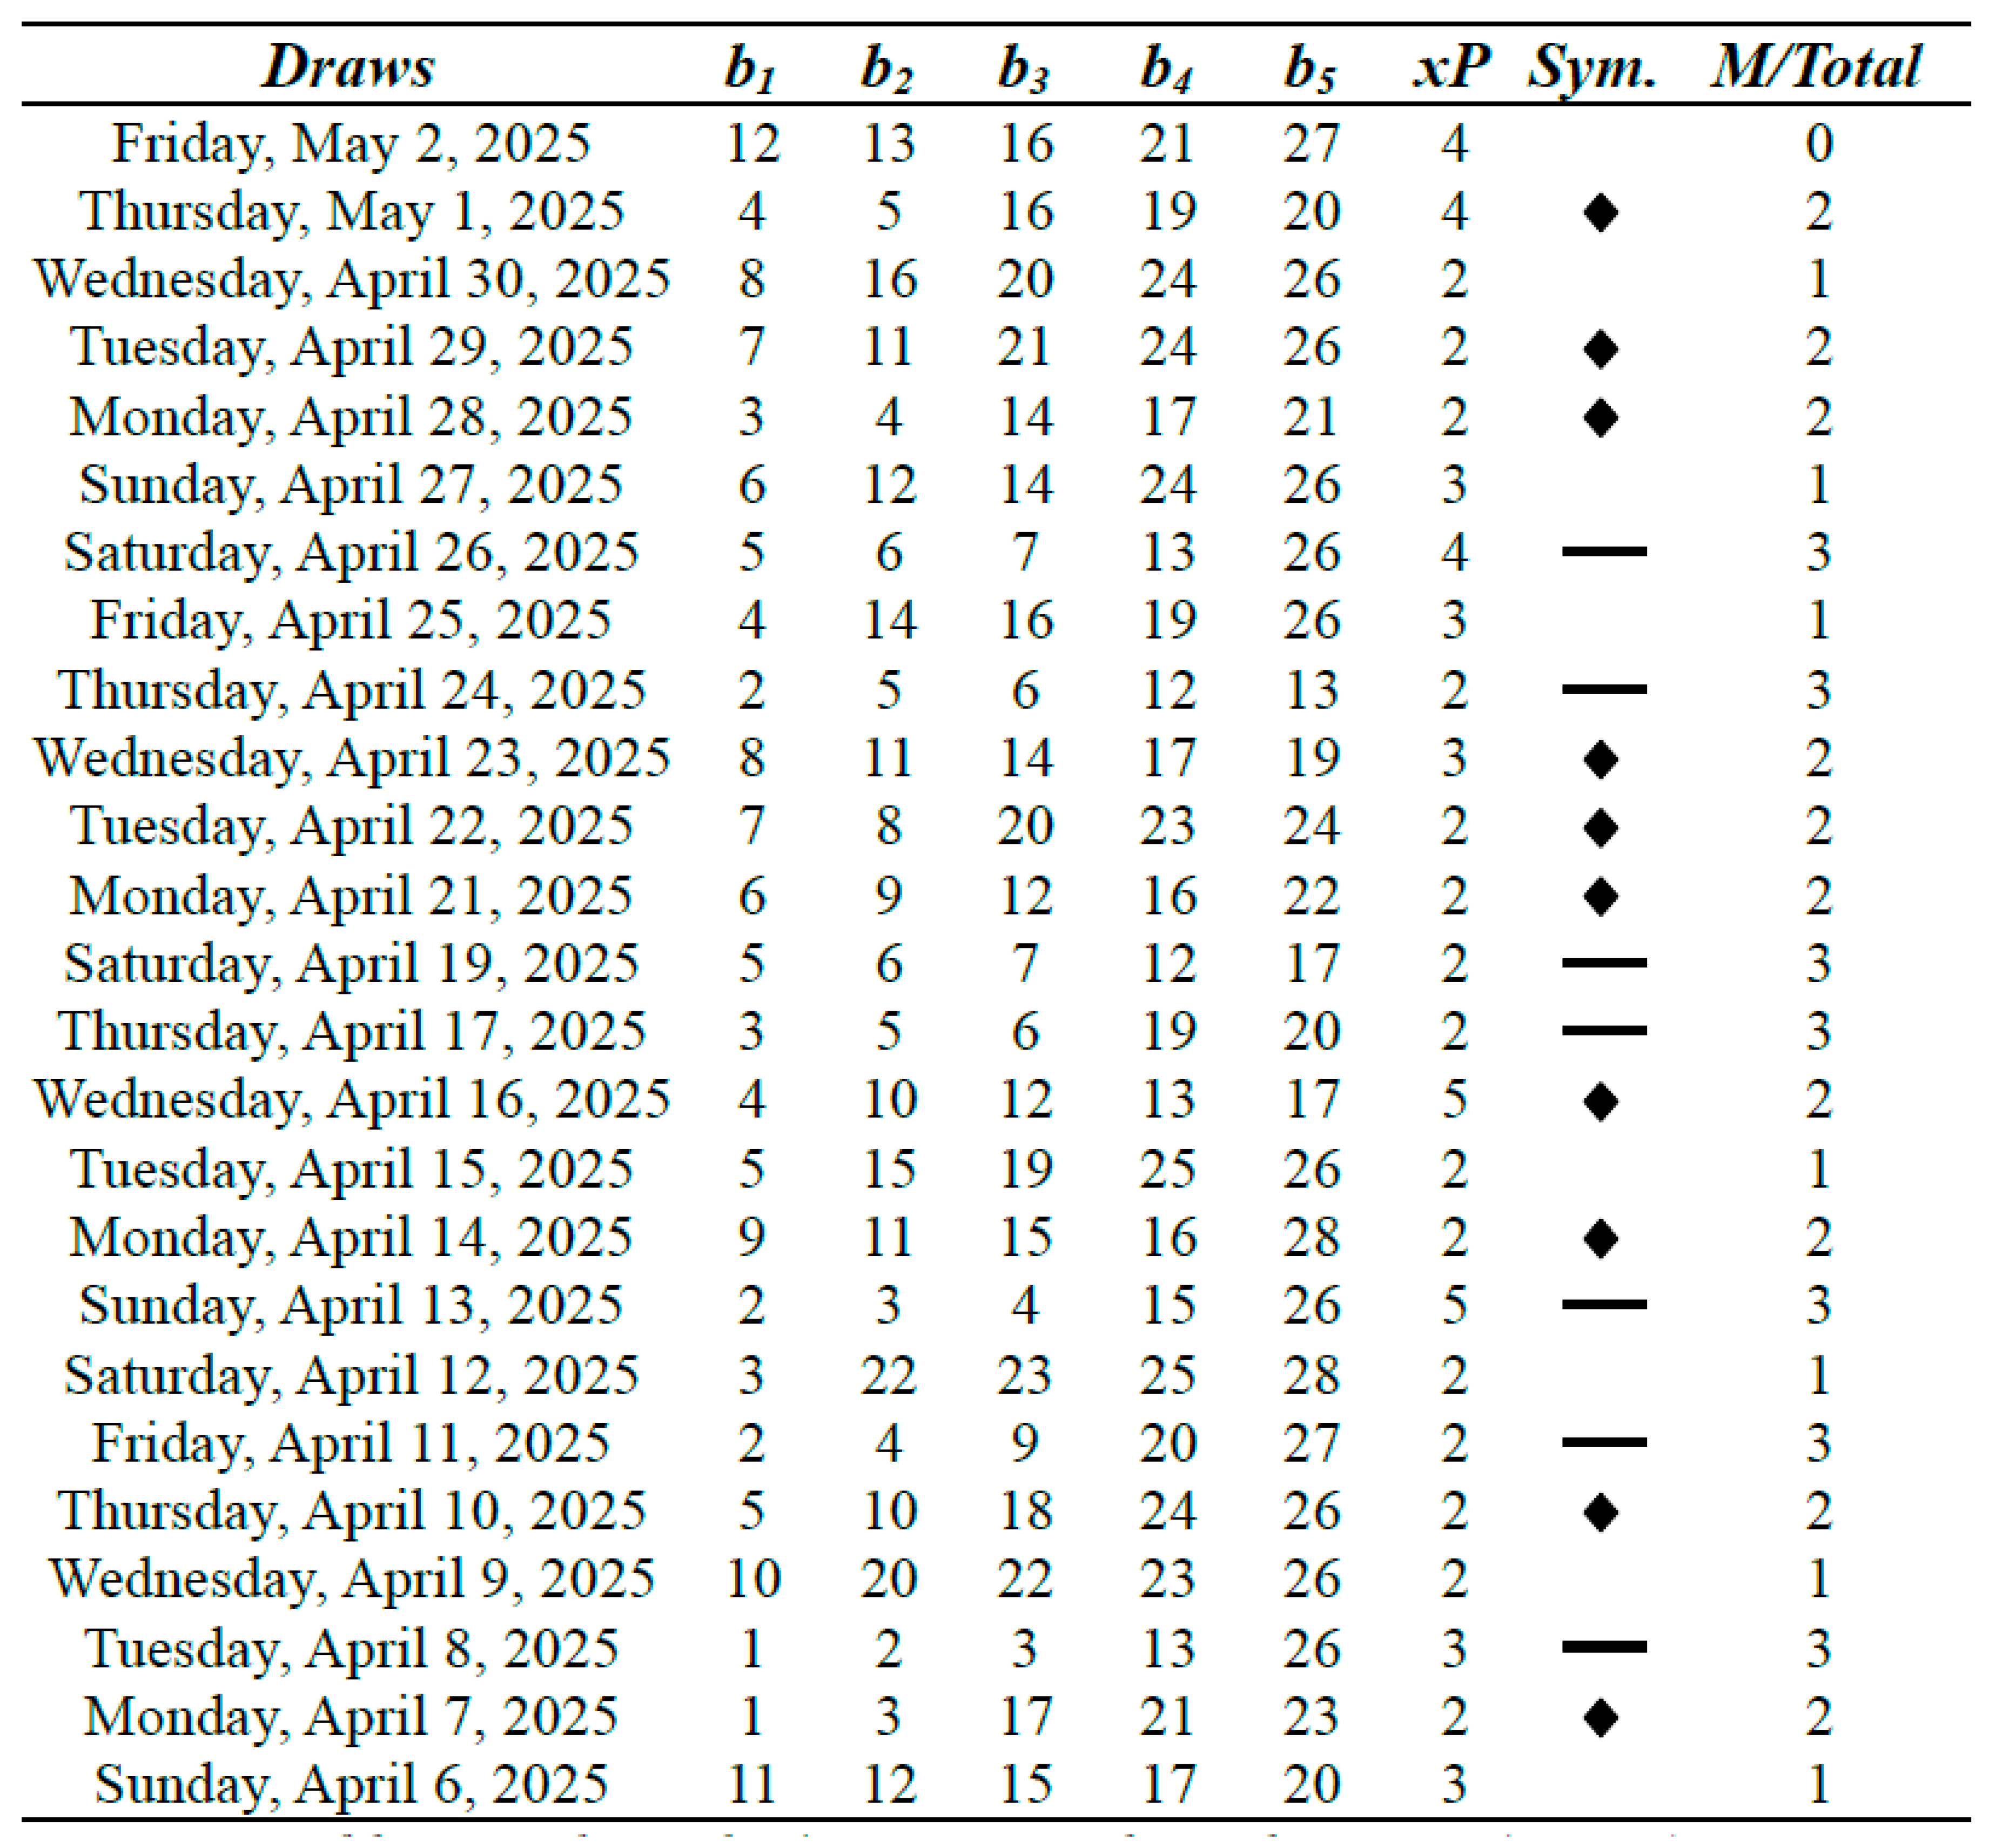 |
Table 6.
Lucky Pick 5/28 Lotto results with m = 11 (Part III).
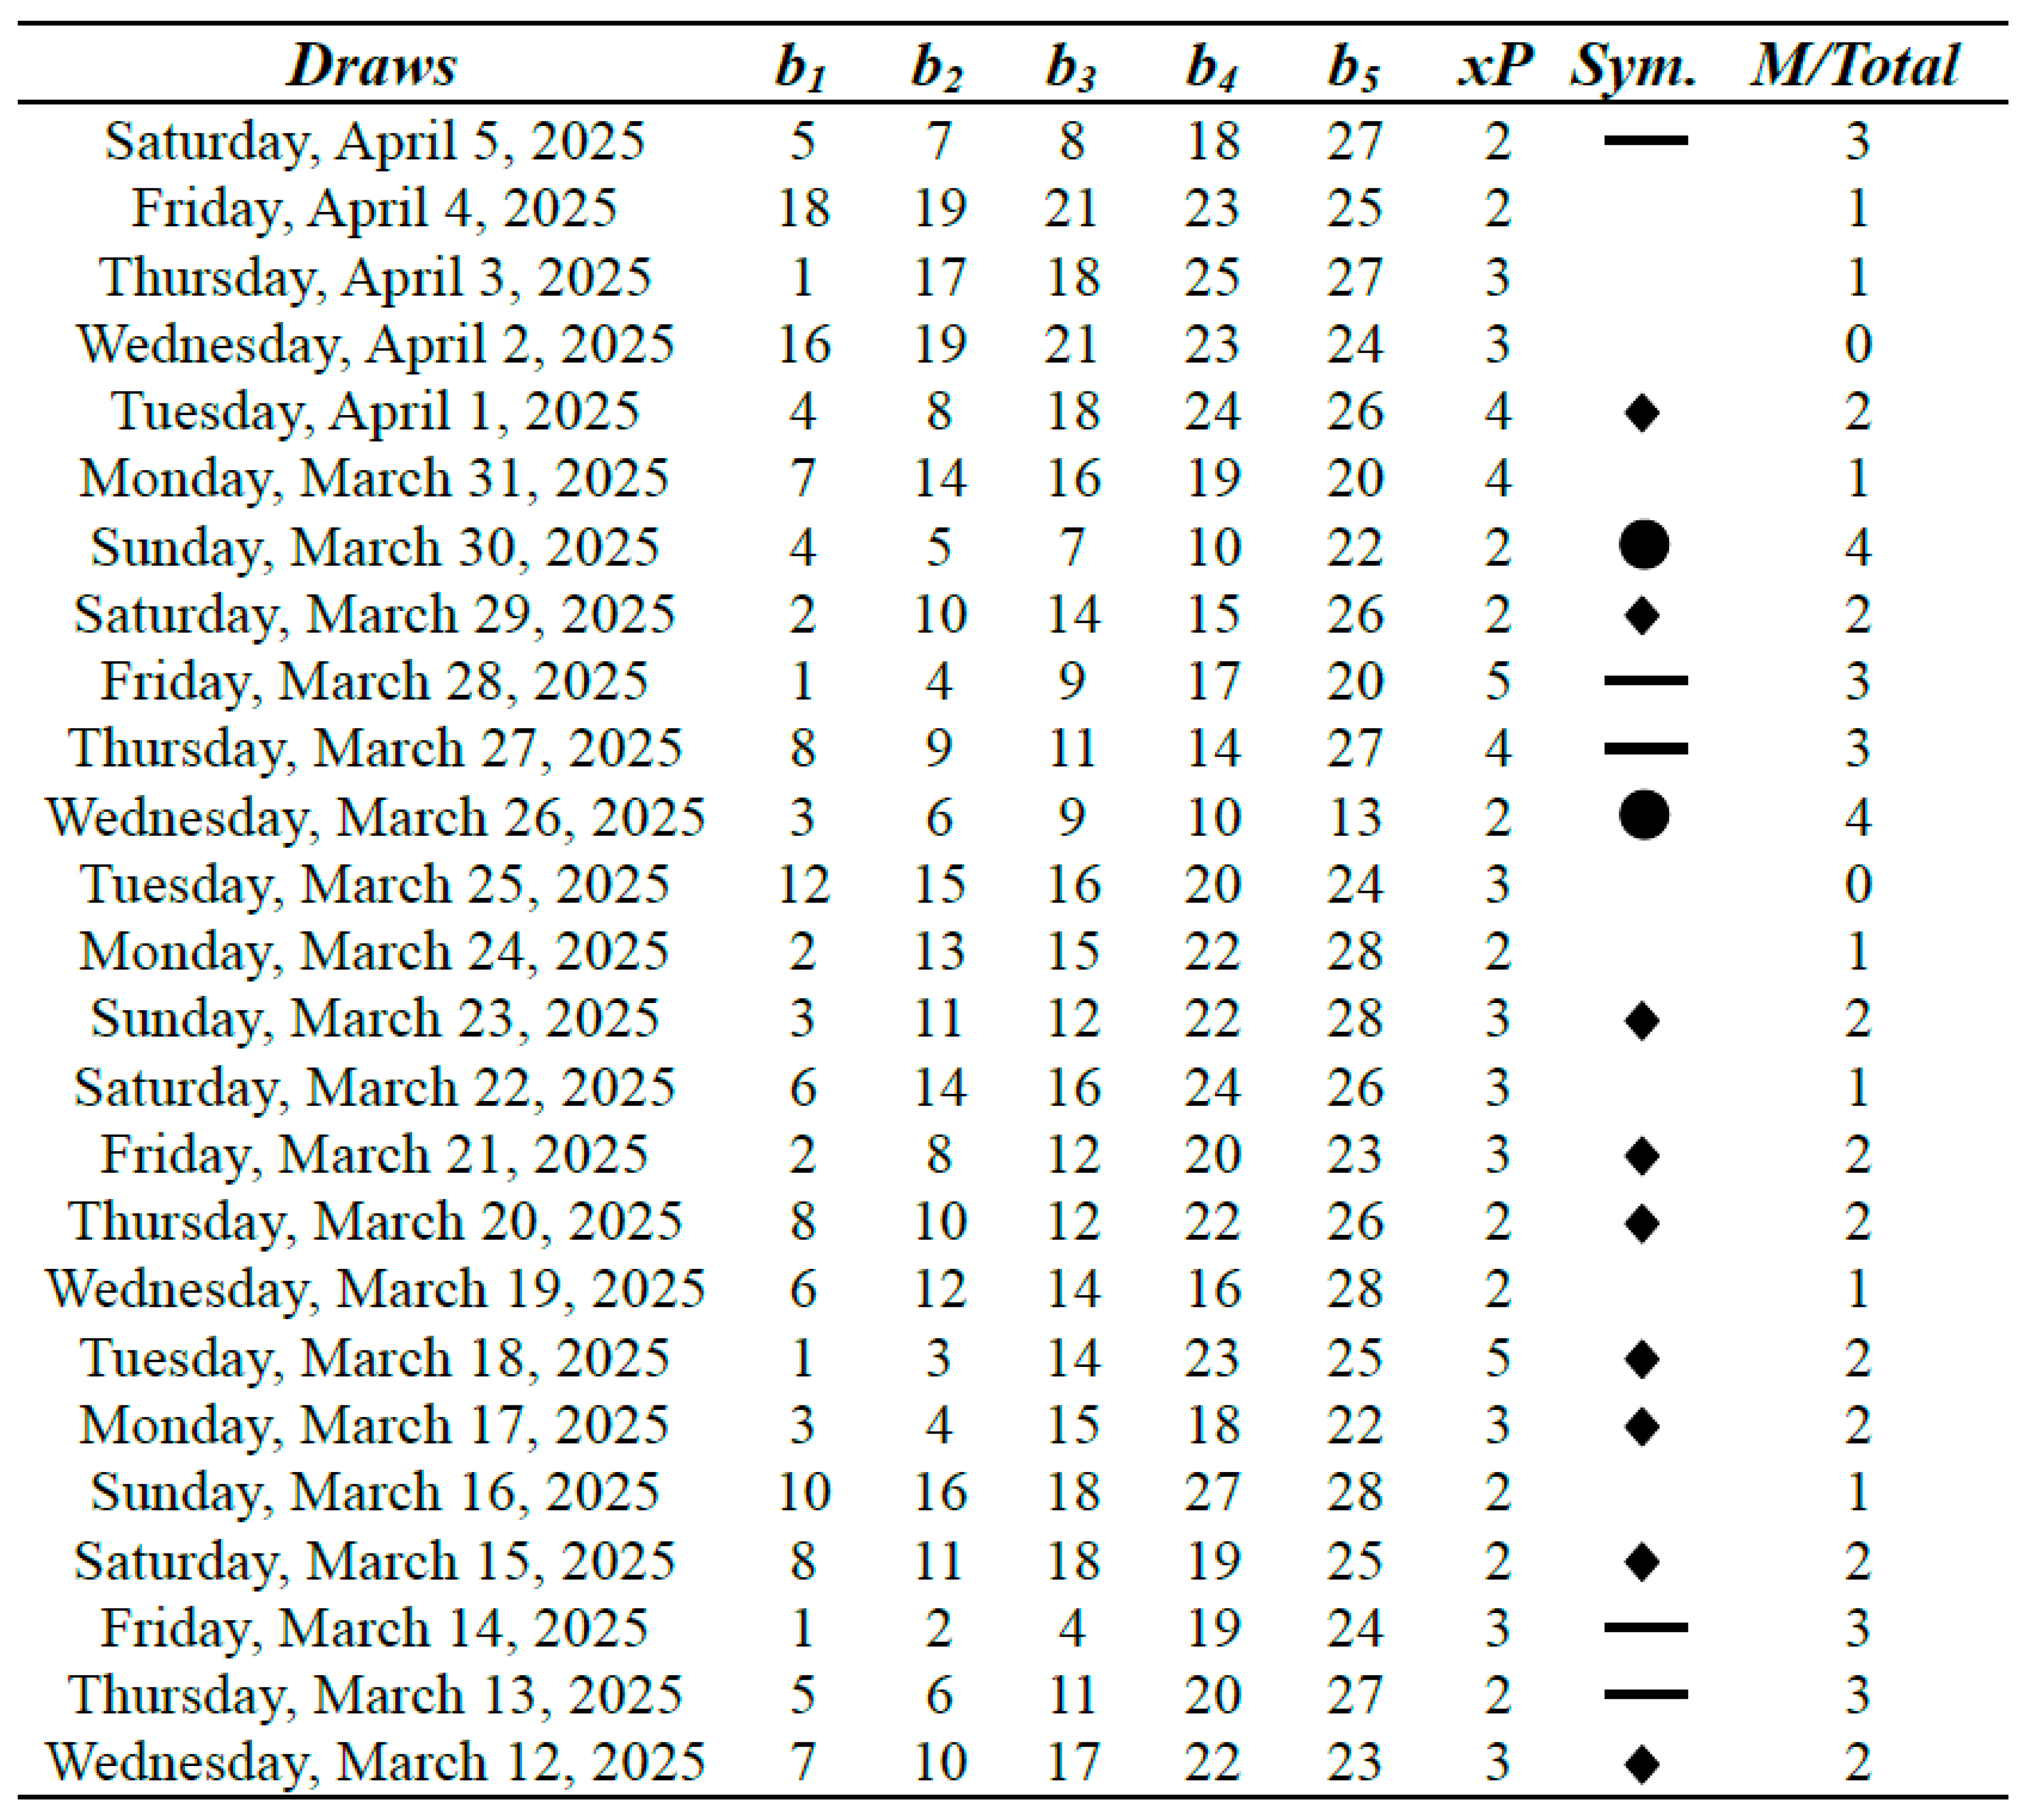 |
Table 7.
Lucky Pick 5/28 Lotto results with m = 11 (Part IV).
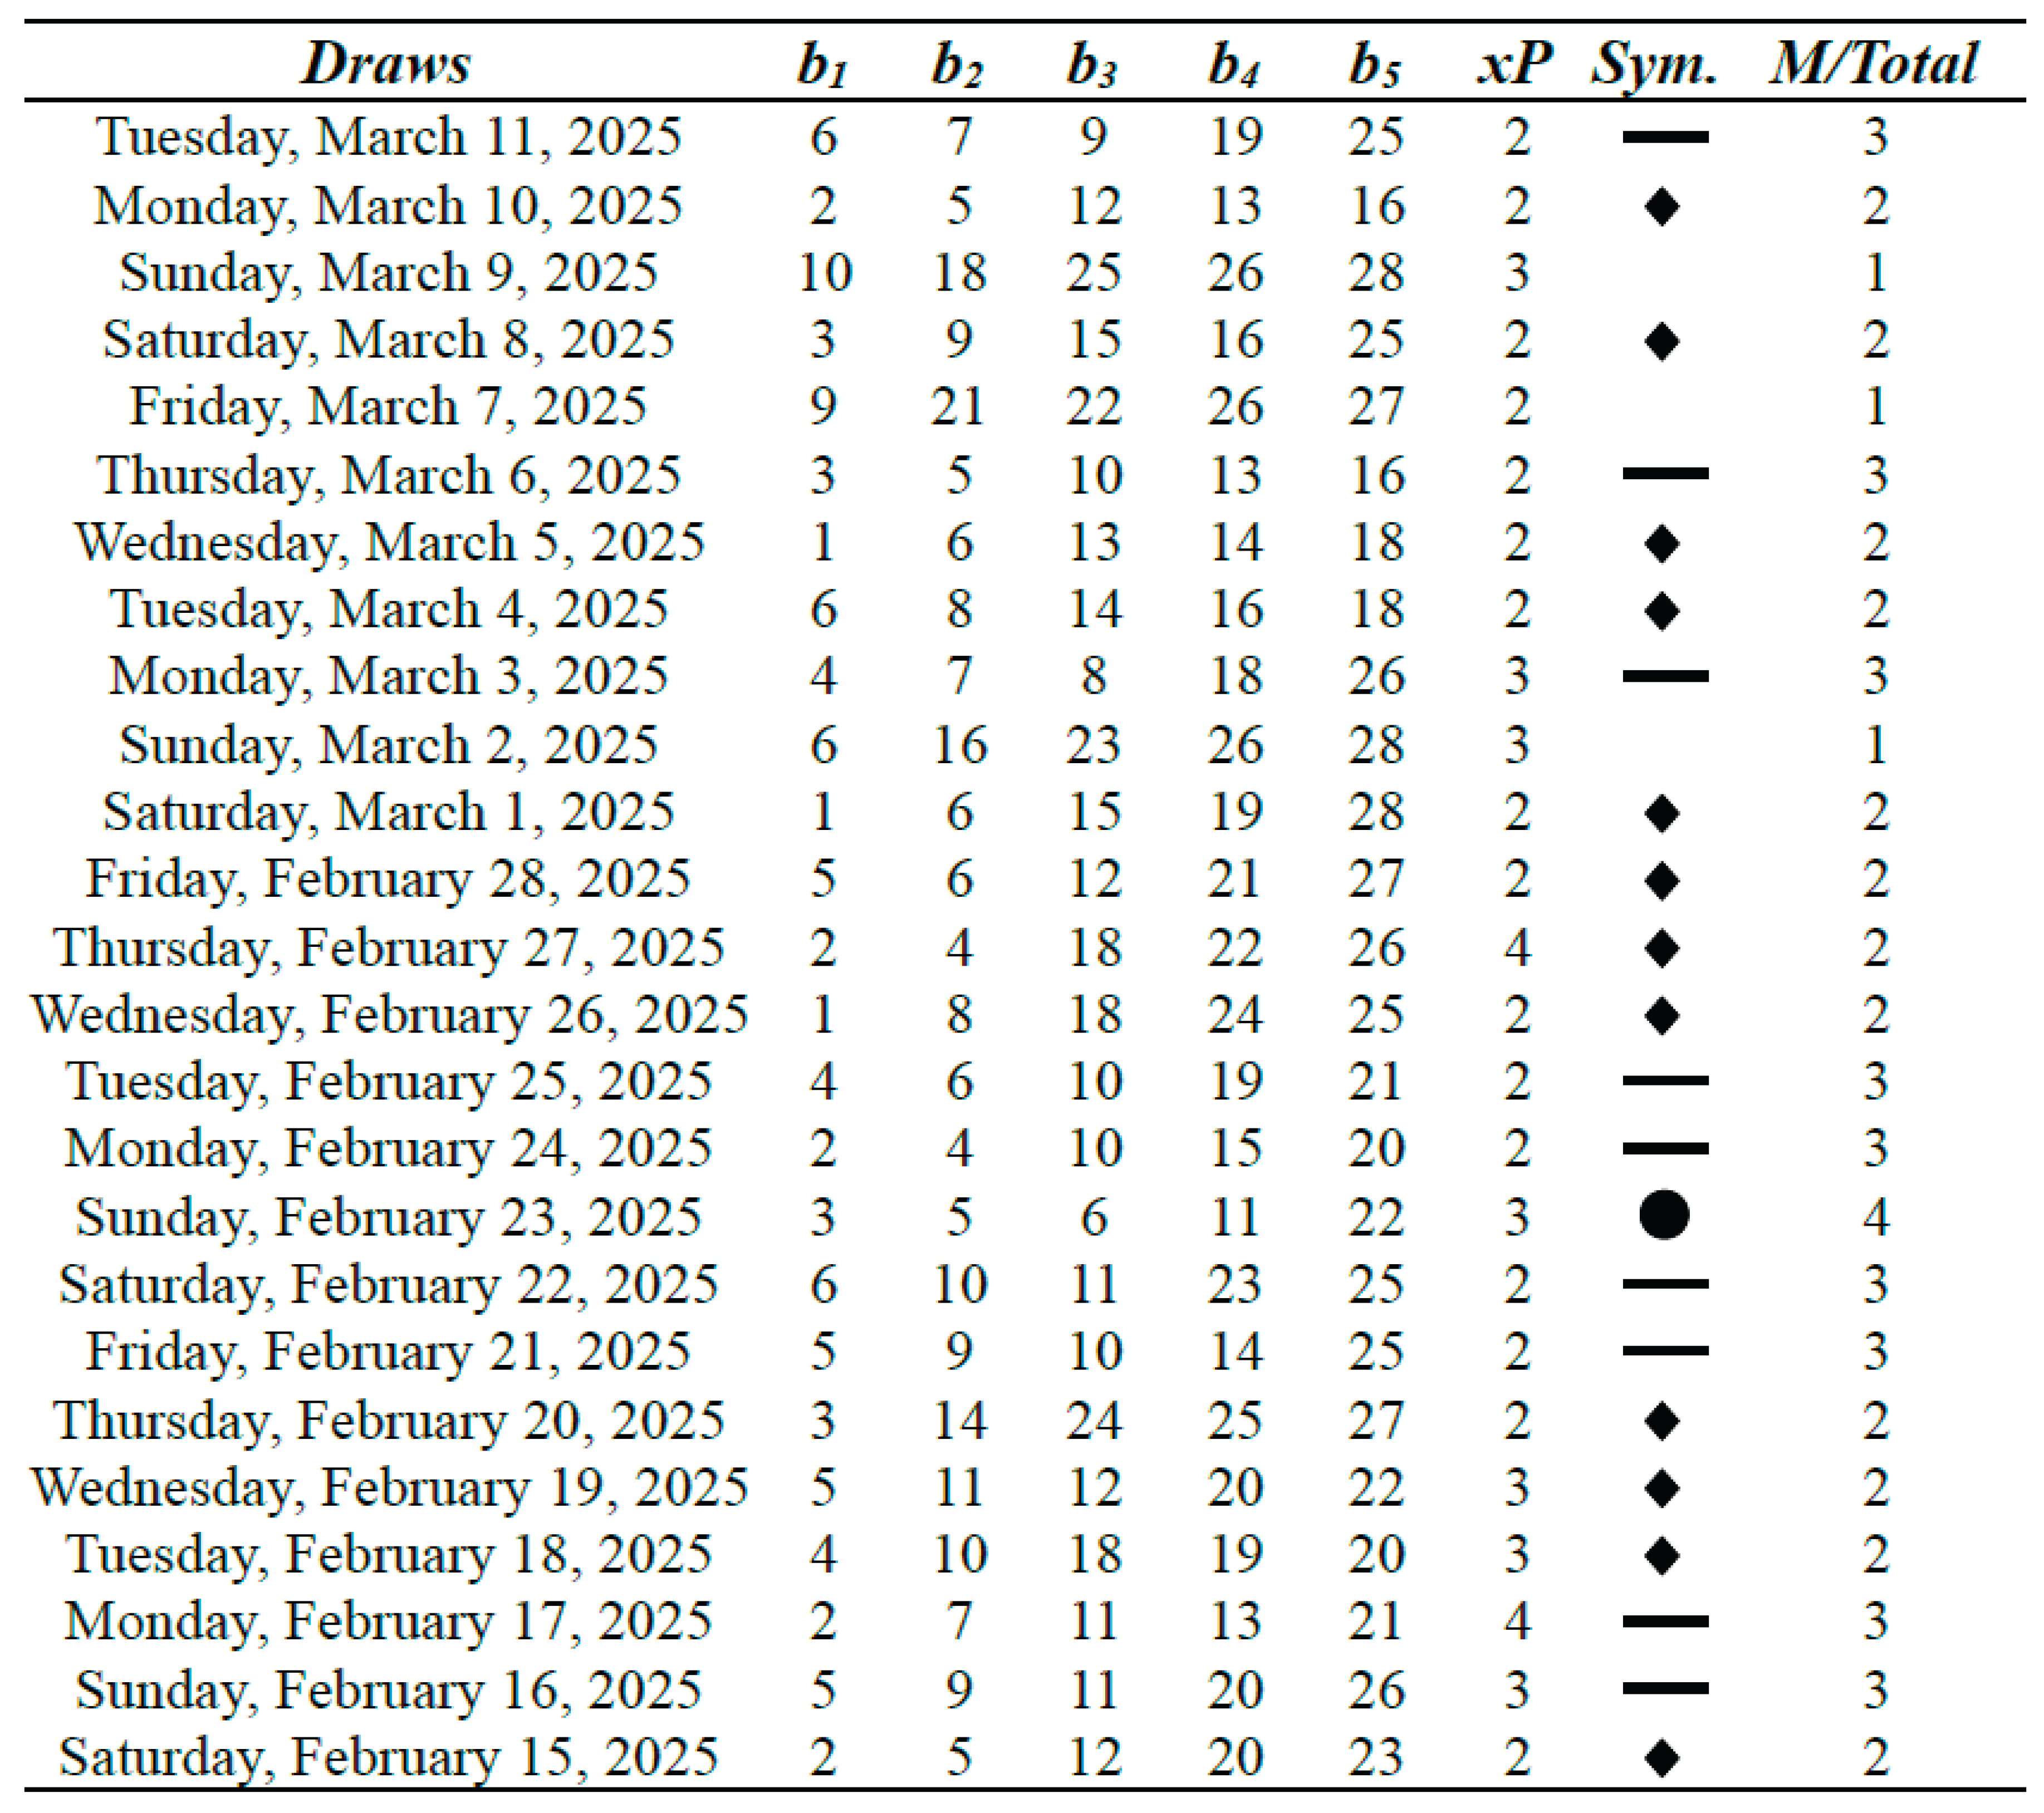 |
Table 8.
Analysis of 100 Lucky Pick 5/28 Lotto draws considering partial coverage with concentrated density with m = 11 (Box 1).
Table 8.
Analysis of 100 Lucky Pick 5/28 Lotto draws considering partial coverage with concentrated density with m = 11 (Box 1).
| Matches | 100 Last Draws | P/L |
|---|---|---|
| 5 | 1 | $37,000 |
| 5 | $47,190 | |
|
4 3 X≤2 |
27 | $53,250 |
| 67 | -$30,954 $106,486 |
Table 9.
Analysis of 100 Lucky Pick 5/28 Lotto draws considering partial coverage with concentrated density with m = 11 (Box 2).
Table 9.
Analysis of 100 Lucky Pick 5/28 Lotto draws considering partial coverage with concentrated density with m = 11 (Box 2).
| Matches | 100 Last Draws | P/L |
|---|---|---|
| 5 | 1 | $37,000 |
| 5 | $14,190 | |
|
4 3 X≤2 |
27 | $10,326 |
| 67 | -$30,954 $30,562 |
As observed in Box 1, a total positive return of $106,486 was achieved over the course of 100 Lucky Pick draws, yielding an average profit of $1,064.86 per draw while playing only 462 tickets. Even if the jackpot event were excluded from the calculation, the net result would still remain attractively positive for a game typically classified as one of negative expectation and pure chance.
Should a syndicate or individual player opt to reduce the number of tickets further - for instance, to 46 - it would be theoretically reasonable to anticipate a proportional return of approximately $10,648.60, in line with the linearity of expectation observed in this historical series. However, any such strategy must consider a more conservative assessment, excluding the jackpot from expected values, and account for the increased volatility in standard deviation prior to convergence. Nonetheless, as the number of participations grows and n → ∞, a mathematically secured trend of positive expectation becomes increasingly evident.
Regarding , despite the significantly lower payoffs from secondary prizes compared to those in Box 1, the overall financial outcome was, as expected, impacted. Nevertheless, a net profit of $30,562 was observed over 100 consecutive draws, demonstrating a positive trend and a viable longterm strategy for m = 11, which corresponds to 462 tickets. However, it's crucial to note that in a more conservative application for Box 2, one that disregards the jackpot entirely, this strategy does not tend to be viable for even greater reductions in the number of tickets (e.g., 231 or 46 tickets). In such cases, the positive mathematical expectation is predominantly achieved through the jackpot, rather than solely through secondary prizes, which is typically the core premise of the Sirius Code's proposed method.
Through this study, we can discern that the observed outcomes do not stem from overfitting or a subjective selection of a specific historical data series. It is clear and understandable that despite the natural volatility inherent in profits and losses, there is a strong tendency toward a positive mathematical expectation. This trend is directly attributable to the cost-benefit relationship derived from the partial coverage with concentrated density strategy, the systematic acquisition of tickets, and consequently, the results of the draws and the underlying combinatorial analysis. The academic community is cordially invited to scrutinize this study, as well as to apply the same proposed model to other data intervals and communicate their findings, highlighting both the strengths and any points requiring further attention.
Mathematically, we can confidently state that we have found a winning strategy. However, it is crucial to acknowledge certain limitations of the model. Firstly, access to the intricate details of this model may not be universally available to all players. Secondly, while the cost of ticket acquisition is substantially reduced, it might still present a limiting factor for numerous players. This inherent imbalance ultimately generates an asymmetric advantage for specific groups, which, indeed, lies at the heart of the Victoria-Nash Asymmetric Equilibrium (VNAE).
This aspect of the VNAE, when considered within social contexts, presents considerable ethical delicacy. However, despite the natural and/or created asymmetries within a stochastic environment, the new equilibrium proposed by Pereira (2025d), as the author points out, must not be utilized to justify social inequalities as inherent by nature. On the contrary, the proposed model, precisely by comprehending these disparities and irregularities in the natural world, has emerged as a means of mathematically representing these phenomena. This representation serves not merely as a practical demonstration but rather as a call to action for establishing a world in which the game of life is at least ‘less unjust’ for all, thereby offering improved basic conditions for players currently at a disadvantage to pursue their respective sets of strategies.
Denying these asymmetries means denying our own reality. Therefore, as Pereira discusses in Section 3.6.1 (2025d), new metrics in economic sciences could be developed to analyze these asymmetries and their impacts across various sectors of society. This includes areas such as income distribution, levels of education and opportunity, the quality of life, and economic development of a nation.
4. Conclusions
Over the course of 100 consecutive draws, the application of the Sirius Code and the VictoriaNash Asymmetric Equilibrium to the Lucky Pick 5/28 lottery in the Caribbean yielded remarkable results. In Box 1, the strategy generated a net profit of $106,486 using only 462 tickets, that is, an ‘investment’ equivalent to just 0.47% of all possible combinations. Even when excluding the jackpot prize, the method continued to deliver a strong positive return, revealing the cost-efficiency and structural resilience of the partial coverage with concentrated density. In Box 2, where secondary prize values are significantly lower, the net profit reached $30,562, also confirming a trend of profitability under less favorable payoff conditions.
These results consolidate yet another successful case in the empirical validation of the Sirius Code framework. The method has now demonstrated consistent statistical advantage across diverse lottery systems, ranging from the UK’s 5/69 format by Pereira (2025b) to the Oklahoma Cash 5 by Pereira (2025a), and now the Caribbean 5/28. The convergence toward positive expectation, combined with replicable structural logic and favorable cost-benefit dynamics, suggests that the Sirius Code is not only mathematically sound but also practically applicable in real-world stochastic settings. This reinforces its relevance as a strategic tool for transforming randomness into asymmetric opportunity.
References
- Pereira, D. H. (2025a). Application of the Sirius Code to Oklahoma Cash 5: An Empirical Analysis of the Victoria-Nash.
- Asymmetric Equilibrium and Sustainable Profitability. Cambridge Open Engage. [CrossRef]
- Pereira, D. H. (2025b). Application of the Sirius Code to UK 6/59 Lotto: An Empirical Analysis of Asymmetric Equilibrium and Sustainable Profitability. Cambridge Open Engage. This content is a preprint and has not been peer-reviewed. [CrossRef]
- Pereira, D. H. (2025c). Sirius Code: Leveraging the Victoria-Nash Asymmetric Equilibrium for Sustainable Lottery Profits. Cambridge Open Engage. [CrossRef]
- Pereira, D. H. (2025d). Victoria: Beating the House Using the Principles of Statistics and Randomness. Cambridge Open Engage. [CrossRef]
Disclaimer/Publisher’s Note: The statements, opinions and data contained in all publications are solely those of the individual author(s) and contributor(s) and not of MDPI and/or the editor(s). MDPI and/or the editor(s) disclaim responsibility for any injury to people or property resulting from any ideas, methods, instructions or products referred to in the content. |
© 2025 by the authors. Licensee MDPI, Basel, Switzerland. This article is an open access article distributed under the terms and conditions of the Creative Commons Attribution (CC BY) license (http://creativecommons.org/licenses/by/4.0/).
Copyright: This open access article is published under a Creative Commons CC BY 4.0 license, which permit the free download, distribution, and reuse, provided that the author and preprint are cited in any reuse.


