
Submitted:
01 June 2025
Posted:
04 June 2025
You are already at the latest version
Abstract
This study presents one of the many practical applications of the Sirius Code, this time implemented within the framework of the UK 6/59 lottery. Anchored in the principles of the Victoria-Nash Asymmetric Equilibrium (VNAE), the primary scenario analyzed involved partial coverage with concentrated density using a subset size of m = 16. This required only 8,008 tickets out of 45,057,474 possible combinations. Across 100 consecutive real draws (from draw 2069 to 3068), and accounting for free tickets, the strategy yielded a total net profit of £565,600, equivalent to an average of £5,656 per draw. In a more conservative scenario, excluding free tickets, the model still produced a net profit of £382,920, or approximately £3,829 per draw. Due to the linearity of expectation, even significant reductions in the number of tickets (e.g., 801 or 81) are expected to preserve a positive profit trend - albeit proportionally reduced - making the model potentially viable not only for syndicates but also for individual players. In this sense, lotteries may be reframed not merely as games of chance, but as strategic games in which elements of true randomness can be partially ‘tamed’ and shaped to one’s advantage through asymmetric structures.
Keywords:
Game Theory
; Randomness
; Statistics
; Lotteries
; Stochastic Games
; Victoria-Nash Asymmetric Equilibrium
; Behavioral Economics
Introduction
The persistent allure of lottery systems lies in their apparent randomness, which traditionally renders them resistant to formal predictive modeling. However, recent advances in mathematical modeling have sought to deepen the understanding of the underlying “architectures” of randomness and to identify potential inefficiencies in lottery markets. Notably, Cushing and Stewart (2023), using the same UK National Lottery (6/59), demonstrated that it is mathematically feasible to optimize ticket selection in such a way that the minimum prize tier is guaranteed with just 27 strategically chosen tickets.
The Sirius Code, introduced by Pereira (2025), offers a methodological lens for identifying “architectures” in ostensibly stochastic systems such as lotteries. It is mathematically grounded in the Victoria-Nash Asymmetric Equilibrium (VNAE) also introduced by Pereira (2025). Regarding the Sirius Code, a conceptual construction in which positive mathematical expectation are possible through partial coverage with concentrated density as a way of optimizing tickets, while at the same time anchored under convergences in probabilities, which in turn allows us to analyze and identify various “architectures” of randomness given a distribution of probabilities, among which we can mention the zones of local clusters vs global uniformity, a manifestation of what has become known as Feller’s Paradox (1968).
This paper applies the Sirius Code to the UK 6/59 Lotto, a well-established lottery with transparent historical data and consistent rule structure. Through the empirical examination of 100 consecutive draws, we investigate the manifestation of asymmetric equilibrium within the number space and assess the potential for sustainable profitability when strategic entry is guided by the Sirius framework. The analysis further incorporates a cost-benefit assessment over time, enabling a practical evaluation of return dynamics relative to participation frequency and positional targeting within the draw matrix.
1. METHODOLOGY
The methodology employed in this case study involved the analysis of 100 consecutive draws from the UK 6/59 Lotto, utilizing the Sirius Code, a mathematical framework developed by Pereira (2025), grounded in the principle of partial coverage with concentrated density, as derived from the Victoria-Nash Asymmetric Equilibrium (VNAE) within the broader context of Game Theory. In addition, at m = 13; m = 16 and m = 19, two scenarios were observed, one considering free tickets (with randomly generated tickets) as part of the prize tier as well as a more conservative analysis disregarding this prize tier. Furthermore, the cost-benefit dynamics of the proposed strategy were assessed by aggregating cumulative profits and losses across the observed sequence of draws.
Note: Given that this article is part of a series of 10 empirical studies applying the Sirius Code to various international lottery systems, the theoretical framework is intentionally summarized. Readers are encouraged to consult the foundational paper for full technical details.
2. Theoretical Framework
2.1. Sirius Code and the Victoria-Nash Asymmetric Equilibrium (VNAE)
The Sirius Code is a statistical methodology grounded in the principles of Game Theory and Decision Theory, encompassing elements of non-cooperative games, zero-sum games, imperfect information, stochastic, and repeated games, as discussed by Aumann (1981), among others. However, it is most directly linked to the Victoria-Nash Asymmetric Equilibrium (VNAE), as introduced by Pereira (2025). At its core, the Sirius Code operationalizes the concept of partial coverage with concentrated density, a strategy that restricts the combinatorial scope of lottery entries to a strategically chosen subset of the number space, within which full coverage is performed.
Furthermore, the term “concentrated density” refers to Feller’s paradox (1968) when analyzing local clustering and global uniformity within a stochastic system given a uniform distribution, for example, as we can see below:
“In this study of lotteries, through the uniform distribution of numbers we can see, as just one example, that although globally all the numbers converge in the long term with the same chances of coming out, in the short term, that is, in each draw, we can see that it is common for results to ‘disregard’ certain groups of numbers (e.g: in an X or Y column) and concentrating on certain groups of numbers, with the characteristic that they come out very close together rather than evenly distributed in each draw, for example resulting in 2, 9, 14, 23, 42, 56 instead of 6, 18, 32, 44, 48, 59 if we consider a lottery design of 6/59, for example” (Pereira, p. 25-26, 2025).
Pereira (2025) also argued that it is important not to confuse concentrated density with a higher probability of events occurring, since no probabilistic principle has been violated, only analyzed through their “architectures”:
“Through the lens of Feller’s Paradox (1991), it may be justifiable to use only certain sub-sets of numbers, focusing on secondary prizes as a way of making consistent profits over the long term (depending, of course, on the payoffs offered by the “Houses”). However, we should not confuse the fact that by employing these statistical regularities we are increasing the probability of the events in the “grouped” sub-set since, in principle, each number has the same probability of coming out” (Pereira, p. 26, 2025).
The Victoria-Nash Asymmetric Equilibrium (VNAE), first introduced in the paper “Victoria: Beating the House Using the Principles of Statistics and Randomness”, builds upon Nash’s (1951) seminal framework of non-cooperative games. VNAE departs from the traditional view by treating the inherent randomness of stochastic games not merely as background noise or an incidental feature of the environment, but as a strategic resource. In this formulation, randomness becomes a source of asymmetric advantage for the player capable of systematically harnessing and “taming” it. In the field of time series analysis, Pereira (2022) demonstrated that part of the noise, random fluctuations in this context, represented by the standard deviation can be applied strategically to improve forecasts by obtaining lower absolute and relative errors.
Historically, scholars have continuously sought methods to simulate randomness as a means of modeling phenomena and supporting decision-making processes. A significant milestone was the emergence of the field of pseudo-random number generation (PRNG), notably marked by the pioneering work of von Neumann (1946), who introduced one of the first algorithmic approaches to synthetic randomness. This was soon followed by a notable contribution from Lehmer (1951), whose development of the Linear Congruential Generator (LCG) laid the groundwork for a lineage of algorithms that would evolve over subsequent decades. More recently, this trajectory has been expanded by conceptual explorations such as the Itamaracá PRNG proposed by Pereira (2022), which introduced a novel “mirroring” mechanism based on the absolute value function as an alternative structural approach to randomness generation. In parallel to the deliberate simulation of randomness, there has also been a longstanding intellectual effort to understand the very nature of randomness itself.
The endeavor to tame randomness has long been a subject of intense discussion within the academic community, with notable prominence in the fields of ergodic theory in pure mathematics and dynamical systems in physics. Itô’s seminal contributions (1941) and (1951) particularly the Itô integral and Itô’s Lemma, established rigorous frameworks for modeling systems influenced by random noise. His work enabled the precise analysis of stochastic differential equations (SDEs), transforming fields such as financial mathematics (e.g., option pricing) and statistical mechanics. By formalizing the interplay between deterministic trends and random fluctuations, Itô’s theory provided tools to decompose, predict, and optimize complex dynamical systems subject to uncertainty.
Potential applications of the Victoria-Nash Asymmetric Equilibrium (VNAE) extend well beyond the domains of entertainment and games of chance, such as sports betting (as explored in the original study) and lottery systems. VNAE may also serve as a valuable framework for modeling complex social dynamics, offering insights into social inequalities, romantic relationships, and cultural behaviors. Its applicability further encompasses corporate environments (e.g., interactions between firms and stakeholders), geopolitical strategies, cybersecurity protocols, artificial intelligence systems, and dynamic systems in physics. In addition, it is promising in other areas within the economic sciences such as behavioral economics, studying how rational players will make decisions given a scenario in which true randomness can be partially predicted and shaped in our favor. In the biological sciences, especially in process optimization and the deliberate identification of disease treatments, among other prospective fields.
We posit that players who possess asymmetric information or conditions regarding a given phenomenon intrinsic to the game as well as advanced knowledge in randomness may, through mathematical, statistical, physical operations, or other cognitive strategies, render part of true randomness partially predictable or even tamed. In this context, randomness ceases to be merely a component of an “optimal strategy” within systems traditionally deemed “unpredictable,” “immutable,” or “untameable.” Rather, it emerges as a proposed function within the portfolio of Game Theory, capable of influencing outcomes in a non-cooperative game.
The mathematical formulation according to the Sirius founding paper is summarized below.
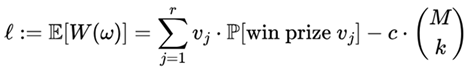
Let S⊂Ω ={1,..., N}, with ∣S∣= M, and k ≤ M. Suppose that in each draw the player bets on all  possible combinations within S. Let W(ω) be the net profit corresponding to a draw ω∈
  considering prizes vj and cost c. Then:
 where,
possible combinations within S. Let W(ω) be the net profit corresponding to a draw ω∈ considering prizes vj and cost c. Then:
ℓ: is the expected net profit per draw;
vj: is the monetary value of the jth
prize tier;
prize P[win prize vj]: is
the probability of winning prize vj;
c: is the cost per ticket;
 is the number of tickets being purchased from the subset S⊂Ω of size M.
Lottery Framework. Let Ω ={1, ..., N}
be the number space. A player selects k numbers per ticket. Each draw
uniformly selects ω*∈  Prizes
vr are awarded for matching r∈{r0, ..., k} numbers.
Prizes
vr are awarded for matching r∈{r0, ..., k} numbers.
Prizes
vr are awarded for matching r∈{r0, ..., k} numbers.
Definition 1
(Partial Coverage
with Concentrated Density). A strategy choosing a subset S⊂Ω (∣S∣= m < N) and betting on all T =  combinations within S.
combinations within S.
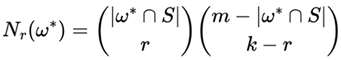
Definition 2
(Winning Tickets Distribution). For a draw ω*, the number of winning tickets with exactly r matches is:
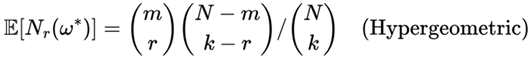
 with expectation:
Theorem
(VNAE-Aligned Long-Term Profitability). Let 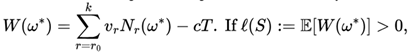 then:
then:
then:
Proof:
I. VNAE connection: The predictable random component fv(Xt) optimizes S*= argmaxS ℓ(S) by exploiting local deviations from uniformity as we can see in Feller’s paradox, and also due to probability convergences that we can verify in different ways from Kolmogorov’s axioms to Chebyshev’s inequalities.
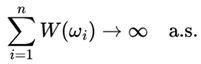
II. SLLN: Apply Strong Law of Large Numbers to i.i.d. W(ωi).
Corollary
(General Profitability Threshold).
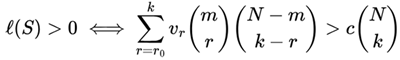
This condition naturally leads to two key implications: first, the Victoria-Nash Asymmetric Equilibrium (VNAE) optimization reduces to finding the optimal subset size m* that maximizes ℓ(S) for given lottery parameters (N, k, vr, c); second, as demonstrated empirically by Pereira (2025) for Lotofácil in Section 4, this framework identifies m* = 19 as the most cost-efficient coverage for balancing ticket expenditure against secondary prize returns.
A comprehensive treatment of the mathematical formulation can be found in Section 3.2 of Pereira (2025), the foundational publication on the Sirius Code. Furthermore, on specifically obtaining an asymmetric advantage through convergence in probabilities in the sense of “waiting for certain moments” to enter a sequence of draws in a lottery, we recommend reading section 3.5 of this same paper.
Instead of trying to predict the exact winning numbers, the method identifies and exploits local statistical asymmetries, the “architectures” in which Pereira (2025) formalizes through the predictable random component function fv(Xₜ). This function captures latent regularities within the randomness, allowing the bettor to optimize the allocation of tickets to certain randomly chosen regions and, therefore, a level of subjectivism (concentrated density), favoring cost optimization in the acquisition of all possible combinations of tickets in the subset as well as winning secondary prizes. This behavior of “clustering” in certain locations at random, even though in a uniform distribution, was also addressed by Feller (1968).
Crucially, the Sirius Code shifts focus from jackpot-centric strategies to profitability through secondary prize tiers, a move that renders the method both cost-efficient and scalable. The strategy (as presented in the VNAE) is further underpinned by some classical probabilistic guarantees, such as the Kolmogorov’s axioms (1933); Law of Large Numbers, Markov’s processes (1906); Stirling Numbers (1730); Central Limit Theorem by Moivre (1730), Laplace (1812) Lindeberg (1922), and Lévy (1939); Chebyshev’s inequalities (1867), and with Renewal Theory by Cox (1962) ensuring long-term convergence toward a positive expected value under rational and repeatable application.
As an analogy, the conceptual basis of the Sirius Code and the Victoria-Nash Asymmetric Equilibrium (VNAE) resonates with key ideas from ergodic theory. As outlined by Viana and Oliveira (2016) in Foundations of Ergodic Theory, ergodicity characterizes the long-term statistical behavior of dynamical systems through the equivalence between time and space averages. The Sirius Code and VNAE, however, exploit the observation that real-world stochastic systems, such as lotteries or social games, may exhibit weak or partial non-ergodicity, particularly in short-term analyses (e.g., local clustering phenomena). This allows for the identification of structural asymmetries, which can be strategically leveraged over time to achieve sustainable advantages.
Originally validated on Brazil’s Lotofácil (15/25), where it achieved a net profit of over $190,000 across 100 draws using optimized subsets, the Sirius Code is designed to be generalizable to a wide variety of lottery formats, including 6/59 structures such as the UK Lotto. Its application herein to the UK Lotto seeks to evaluate whether the same strategic asymmetry and cost-benefit dynamics observed in prior implementations hold under a distinct lottery architecture.
2.2. The UK 6/59 Lotto
UK 6/59 Lotto is a combinatorial lottery operated by Camelot Group under license from the UK National Lottery. In each draw, which takes place twice a week, usually on Wednesdays and Saturdays, six different numbered balls are drawn from a set ranging from 1 to 59, without replacement. In addition, a seventh ball, called the “bonus ball”, is drawn from the remaining 53 balls and is only used to determine secondary prizes in five-hit combinations. The theoretical probability of matching all six main numbers is 1 in 45,057,474. The results of the draws, including those mentioned in this study, and the historical archives are publicly available through the National Lottery’s official website and other independent databases.
It is known that, until the given study, the unit price of each standard ticket is £2 to play. Below, in Figure 1, we can see the distribution and value of the prizes as well as their respective probabilities:
3. Results and Discussions
3.1. Another Dice in the Roll
In the present study, as in the original presentation of the model, an analysis was conducted over a sequence of 100 consecutive draws. However, instead of selecting a random starting point, only the most recent 100 draws available at the time the author began drafting this material were considered. As the primary focus of the Sirius Code is not, in principle, on matching the jackpot - which is regarded merely as a fortunate bonus if it occurs - the analysis excluded the prize tier corresponding to five correct numbers plus the bonus ball. Although this (matching 5 + 1 or 6 numbers) outcome remains theoretically possible within a selected subset of numbers, its probability is sufficiently low to warrant omission from the scope of the present evaluation.
With regard to partial coverage with concentrated density, three different scenarios were analyzed with m = 13; m = 16; and m = 19. However, in order to go into more detail, emphasis was placed on m = 16, which consists of buying all possible combinations within an “alternative lottery” in which 6 numbers are chosen from 1 to 16 possible, resulting in 8,008 tickets needed for complete coverage of this “optimized subset”. With this information, we realize that in each draw an individual player/lottery syndicate should expect a cost of £16,016. It may sound counterintuitive, but it will be seen later that yes, the mathematical expectation will be positive in order to “recover” all this fixed cost and come to offer consistent profitability over the long term using convergences in probabilities with the Law of Large Numbers and Game Theory itself, for example.
Table 1 below shows the different prize tiers and their respective UK National Lottery prizes:
Similarly, to determine the number of 8,008 tickets, we can use the following formula to determine the number of combinations for different match ranges:
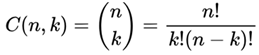
Table 3 shows the cost-benefit ratio of the number of winning tickets and their respective payoffs in their respective match ranges with the total cost of buying all possible combinations within the subset adopted to be fixed over n sequences rationally established by the player.
3.2. We don’t Need No Random Control
Hey! Probability! Leave the draws alone! Well, in this sense, Table 5, Table 6, Table 7 and Table 8 show a historical series of 100 draws of the 5/69 UK Lotto, analyzing partial coverage with concentrated density with m = 16.
When adopting a scenario in which free tickets (randomly generated) are treated as a positive outcome, that is, a form of “profit”, the overall losses incurred when matching only two numbers are mitigated. As a result, by summing the total profits obtained from the 4-match and 3-match tiers and subtracting the losses from the remaining tiers, we obtain a net profit of £565,600 across 100 draws, using only 8,008 tickets per draw. According to the linearity of mathematical expectation, this corresponds to an average net profit of £5,656 per draw within the analyzed historical series.
Analogously, one may consider playing only 10% or even 1% of the 8,008-ticket subset and still expect a proportional trend in average net profit per draw (e.g., £565.60 and £56.56, respectively). However, it is important to note that as the sample size decreases, the exposure to standard deviation increases, that is, greater volatility is expected across sequences of wins and losses until the stabilization period is reached, after which the trend toward sustainable net profit may begin to emerge.
In a more conservative analysis - and one particularly aligned with the structural characteristics of this lottery design - we considered a scenario in which randomly generated free tickets (drawn from the full 1-to-59 number space) were excluded from the profit calculation. Although such tickets may eventually yield additional prizes, including the jackpot, the proposed model is predicated on the principle that the syndicate or individual player retains full autonomy over number selection and the purchase of all possible combinations within the adopted subset. Under this more restrictive framework, the strategy still yielded a positive net result of £382,900 across 100 draws, corresponding to an expected average profit of approximately £3,829 per draw.
Based on the previous tables, one can observe naturally expected periods of volatility, which is to be anticipated when dealing with stochastic systems. It is important to emphasize that, although the 100-draw sequence yielded positive and reasonably substantial net profits in both scenarios (including and excluding free tickets) syndicates and individual players must remain aware of such volatility intervals before consistent net profitability begins to materialize. In the case study presented here, consistent profits were observed only after the initial seven draws, allowing for a partial reinvestment of gains to maintain strategic continuity.
As outlined in greater detail in Section 3.5 of the foundational paper by Pereira (2025), a rigorous statistical analysis - considering both lower and upper bounds of expected prize counts within specific match tiers, based on Chebyshev’s inequalities and the Law of Large Numbers - can offer players a data-driven framework to enter the game at statistically opportune moments. This approach may reduce the number of consecutive draws required to achieve profitability, potentially eliminating unnecessary effort and, in some cases, maximizing net gains over time.
As previously identified in the literature on lottery optimization theories, notably in the work of Moffitt and Ziemba (2018) a convex function exists wherein ‘optimal points’ can be identified to maximize expected net profitability, even as other points within the distribution retain positive mathematical expectation under partial coverage with concentrated density. While the primary focus of this study has been to demonstrate positive mathematical expectation in absolute terms, we may briefly illustrate this behavior through analyses of subset sizes m = 13 and m = 19 under the proposed framework of partial coverage with concentrated density.
For m = 13, i.e., in an alternative lottery (understood as a subset), the purchase of all possible combinations of 6 numbers between 1 and 13, using this same historical series gives us the following results of hits according to different prize ranges, as we can see in the table below:

Table 11.
Analysis of 100 UK 6/59 Lotto draws with m = 13 disregarding Free Tickets.
| Matches | 100 Last Draws | P/L |
|---|---|---|
| 6 | - | - |
| 5 | - | - |
| 4 | 2 | £81,336 |
| 3 | 18 | £316,224 |
| X ≤ 2 | 80 | -£274,560 |
| 100 | £123,000 |
If we consider a scenario with free tickets as part of the profit, the end result would be £150,300 profit after 100 draws, which would result in an average of £1,503 net profit for each draw. Note that if we do the same analysis using a share of 10% or 1% of all 1,716 possible tickets, resulting in only 172 and 17 tickets respectively, we would still tend to have a positive mathematical expectation with proportional results (net profit of £150.3 and £15.03 in each draw).
Although even smaller samples are subject to greater variation in standard deviation, which can lead to greater volatility in profits/losses, we can see that considering syndicates with less financial power and even individuals, this scenario may be more applicable with m = 13. As we can see, although the positive returns are much lower than with m = 16 (with £382,900), the fact that it requires an even smaller number of tickets makes this configuration even more attractive and realistic for the majority of players.
On the other hand, if we consider m = 19, that is, if we buy all the possible combinations in an “alternative lottery” and choose 6 numbers from 1 to 19, we would have obtained the following general results:
As shown in Table 12, under a conservative scenario with m = 19, a net loss of £512,400 was recorded over 100 UK 6/59 Lotto draws. However, when considering free tickets as part of the returns, the strategy would have resulted in a net profit of £216,900. Despite the reduction in the number of required tickets to 27,132, this configuration still does not prove to be viable in the long term. What must be made clear and understandable is that the cost-benefit relationship across different values of m (i.e., subset sizes) must be carefully assessed in order to ensure a positive expected value, while also maintaining economic and logistical feasibility, even considering the technological convenience offered by modern smartphone applications.
As discussed in Pereira (2025), one of the key limitations of the proposed model lies precisely in the necessity of evaluating the cost-benefit relationship across distinct subsets. Additionally, there exists the possibility of defensive measures being taken by lottery organizers, such as increasing ticket prices, reducing prize values, or even restricting or banning individuals or syndicates that consistently achieve positive outcomes.
However, any such actions should be preceded by careful analysis conducted by the relevant regulatory authorities. It is also important to note that the Victoria-Nash Asymmetric Equilibrium (VNAE) itself would not be invalidated under such circumstances. Rather, what would occur is a fundamental alteration of the game’s structure and rules. Therefore, the notion of asymmetric advantage within a shared environment, where a positive expected value is attainable, would remain theoretically intact within the framework of Game Theory, until a new game with new rules is established.
Conclusions
The empirical results presented in this study clearly demonstrate the feasibility of achieving sustainable net profits through the application of the Sirius Code to the structure of the UK 6/59 lottery. In scenarios involving partial coverage with concentrated density using a subset size of m = 16, the model yielded significant profits across 100 consecutive historical draws, averaging £5,656 per draw when free tickets are included, and £3,829 per draw when they are excluded. Even with a coverage of only 8,008 tickets (representing just 0.018% of the 45,057,474 possible combinations) the strategy exhibited resilience in the face of both significantly reduced ticket counts (e.g., 801 or 81) and the inherent volatility of stochastic systems. These findings underscore its potential applicability not only for lottery syndicates but also for individual players operating under statistical rationality.
This robustness becomes even more apparent when considering configurations such as m = 13, which require fewer tickets and may be more accessible for smaller-scale participants. The academic community is hereby invited to expand upon this study by analyzing additional historical sequences from the UK 6/59 Lotto, as well as by testing the Sirius Code framework across different lottery designs worldwide.
These results are anchored in the Victoria-Nash Asymmetric Equilibrium (VNAE) framework, which redefines the role of randomness as a strategic resource in a stochastic and non-cooperative game, capable of being partially predicted and exploited, for example, through local clustering as pointed out by Feller (1968).
Rather than aiming for the jackpot, the Sirius Code prioritizes ticket optimization by focusing on secondary prize tiers, grounded in robust theoretical foundations such as Game Theory, Decision Theory, the Law of Large Numbers, Chebyshev’s inequalities, and probabilistic convergence. Furthermore, the aspiration to ‘tame’ randomness has deep historical roots, spanning from Poincaré (1908), Itô (1941), and Cox (1962), to developments in ergodic theory and dynamical systems in physics, among other key contributions. However, this perspective is here applied specifically within the context of Game Theory. In this sense, the Sirius Code does not emerge as a promise of luck, but rather as a new paradigm of rationality, one that seeks to analyze the ‘architectures of randomness’ and support decision-making under uncertainty.
It needs to be clear and understandable that randomness cannot be seen as unmanageable, but also as “tameable” and an important function within a stochastic game to serve as a rational player’s decision-making tool. In this sense, lotteries and other stochastic games can be seen as more than just a game of chance, but as a strategic game.
Thus, in systems where randomness becomes structure, and strategy meets entropy, asymmetric advantage and long-term profitability ceases to be a myth, it becomes a measurable convergence. We have become statistically numb.
References
- Aumann, R. J. (1981). Survey of repeated games. In Essays in Game Theory.
- Cox, D. R. (1962). Renewal theory. Methuen & Co.
- Cushing, D., Stewart, D. I.: You need 27 tickets to guarantee a win on the UK National Lottery. ArXiv:2307.12430.
- Chebyshev, P. L. (1867). Des valeurs moyennes. J. Math. Pures Appl, 12(2), 177-184.
- Feller, W. (1968). An introduction to probability theory and its applications, Volume 2 (Vol. 2). John Wiley & Sons.
- Itô, K. (1941). On stochastic processes (I) Infinitely divisible laws of probability. In Japanese journal of mathematics: transactions and abstracts (Vol. 18, pp. 261-301). The Mathematical Society of Japan.
- Itô, K. (1951). On stochastic differential equations (No. 4). American Mathematical Soc.
- Kolmogorov, A. N. (1933). Grundbegriffe der Wahrscheinlichkeitsrechnung. Springer.
- Laplace, P. S. (1812). Théorie analytique des probabilités (Vol. 7). Courcier.
- Lehmer, D. H. (1951). Mathematical models in large-scale computing units. Ann. Comput. Lab.(Harvard University), 26, 141-146.
- Lévy, P. (1939). L’addition des variables aléatoires définies sur une circonférence. Bulletin de la Société mathématique de France, 67, 1-41. [CrossRef]
- Markov, A. A. (1906). Extension of the law of large numbers to dependent quantities. Izv. Fiz.-Matem. Obsch. Kazan Univ.(2nd Ser), 15(1), 135-156.
- Moffitt, S. D., & Ziemba, W. T. (2018). A Method for Winning at Lotteries. arXiv preprint arXiv:1801.02958.
- Moffitt, S., & Ziemba, W. T. (2018). Does It Pay to Buy the Pot in the Canadian 6/49 Lottery? Implications for Lottery Design. Implications for Lottery Design (May 5, 2018).
- Moivre, A. D. (1730). Miscellanea analytica de seriebus et quadraturis.... (No Title).
- Nash, J. Non-Cooperative Games. (1951). Annals of Mathematics, Vol. 54, September, pp. 286-295.
- Pereira, D. H. (2022). Itamaracá: A Novel Simple Way to Generate Pseudo-random Numbers: Cambridge Open Engage. doi:10.33774/coe-2022-zsw6t. [CrossRef]
- Pereira, D. H. (2022). ESBSD: An Essay on the New Exponential Smoothing Methodology Applied to the Projection of the Population of Belo Horizonte. Cambridge Open Engage. doi:10.33774/coe-2022-vz5v2-v2. [CrossRef]
- Pereira, D. H. (2025). Victoria: Beating the House Using the Principles of Statistics and Randomness. Cambridge Open Engage. doi:10.33774/coe-2025-2crkm. [CrossRef]
- Pereira, D. H. (2025). Sirius Code: Leveraging the Victoria-Nash Asymmetric Equilibrium for Sustainable Lottery Profits. Cambridge Open Engage. doi:10.33774/coe-2025-nfsck. [CrossRef]
- Poincaré, H., & Maitland, F. (2003). Science and method. Courier Corporation.
- Stirling, J. (1730). Methodus differentialis: sive tractatus de summatione et interpolatione serierum infinitarum.
- Viana, M., & Oliveira, K. (2016). Foundations of ergodic theory (No. 151). Cambridge University Press.
- Von Neumann, J. (1951). 13. various techniques used in connection with random digits. Appl. Math Ser, 12(36-38), 3.
Figure 1.
Value and distribution of prizes according to different match ranges via the UK National Lottery.
Figure 1.
Value and distribution of prizes according to different match ranges via the UK National Lottery.
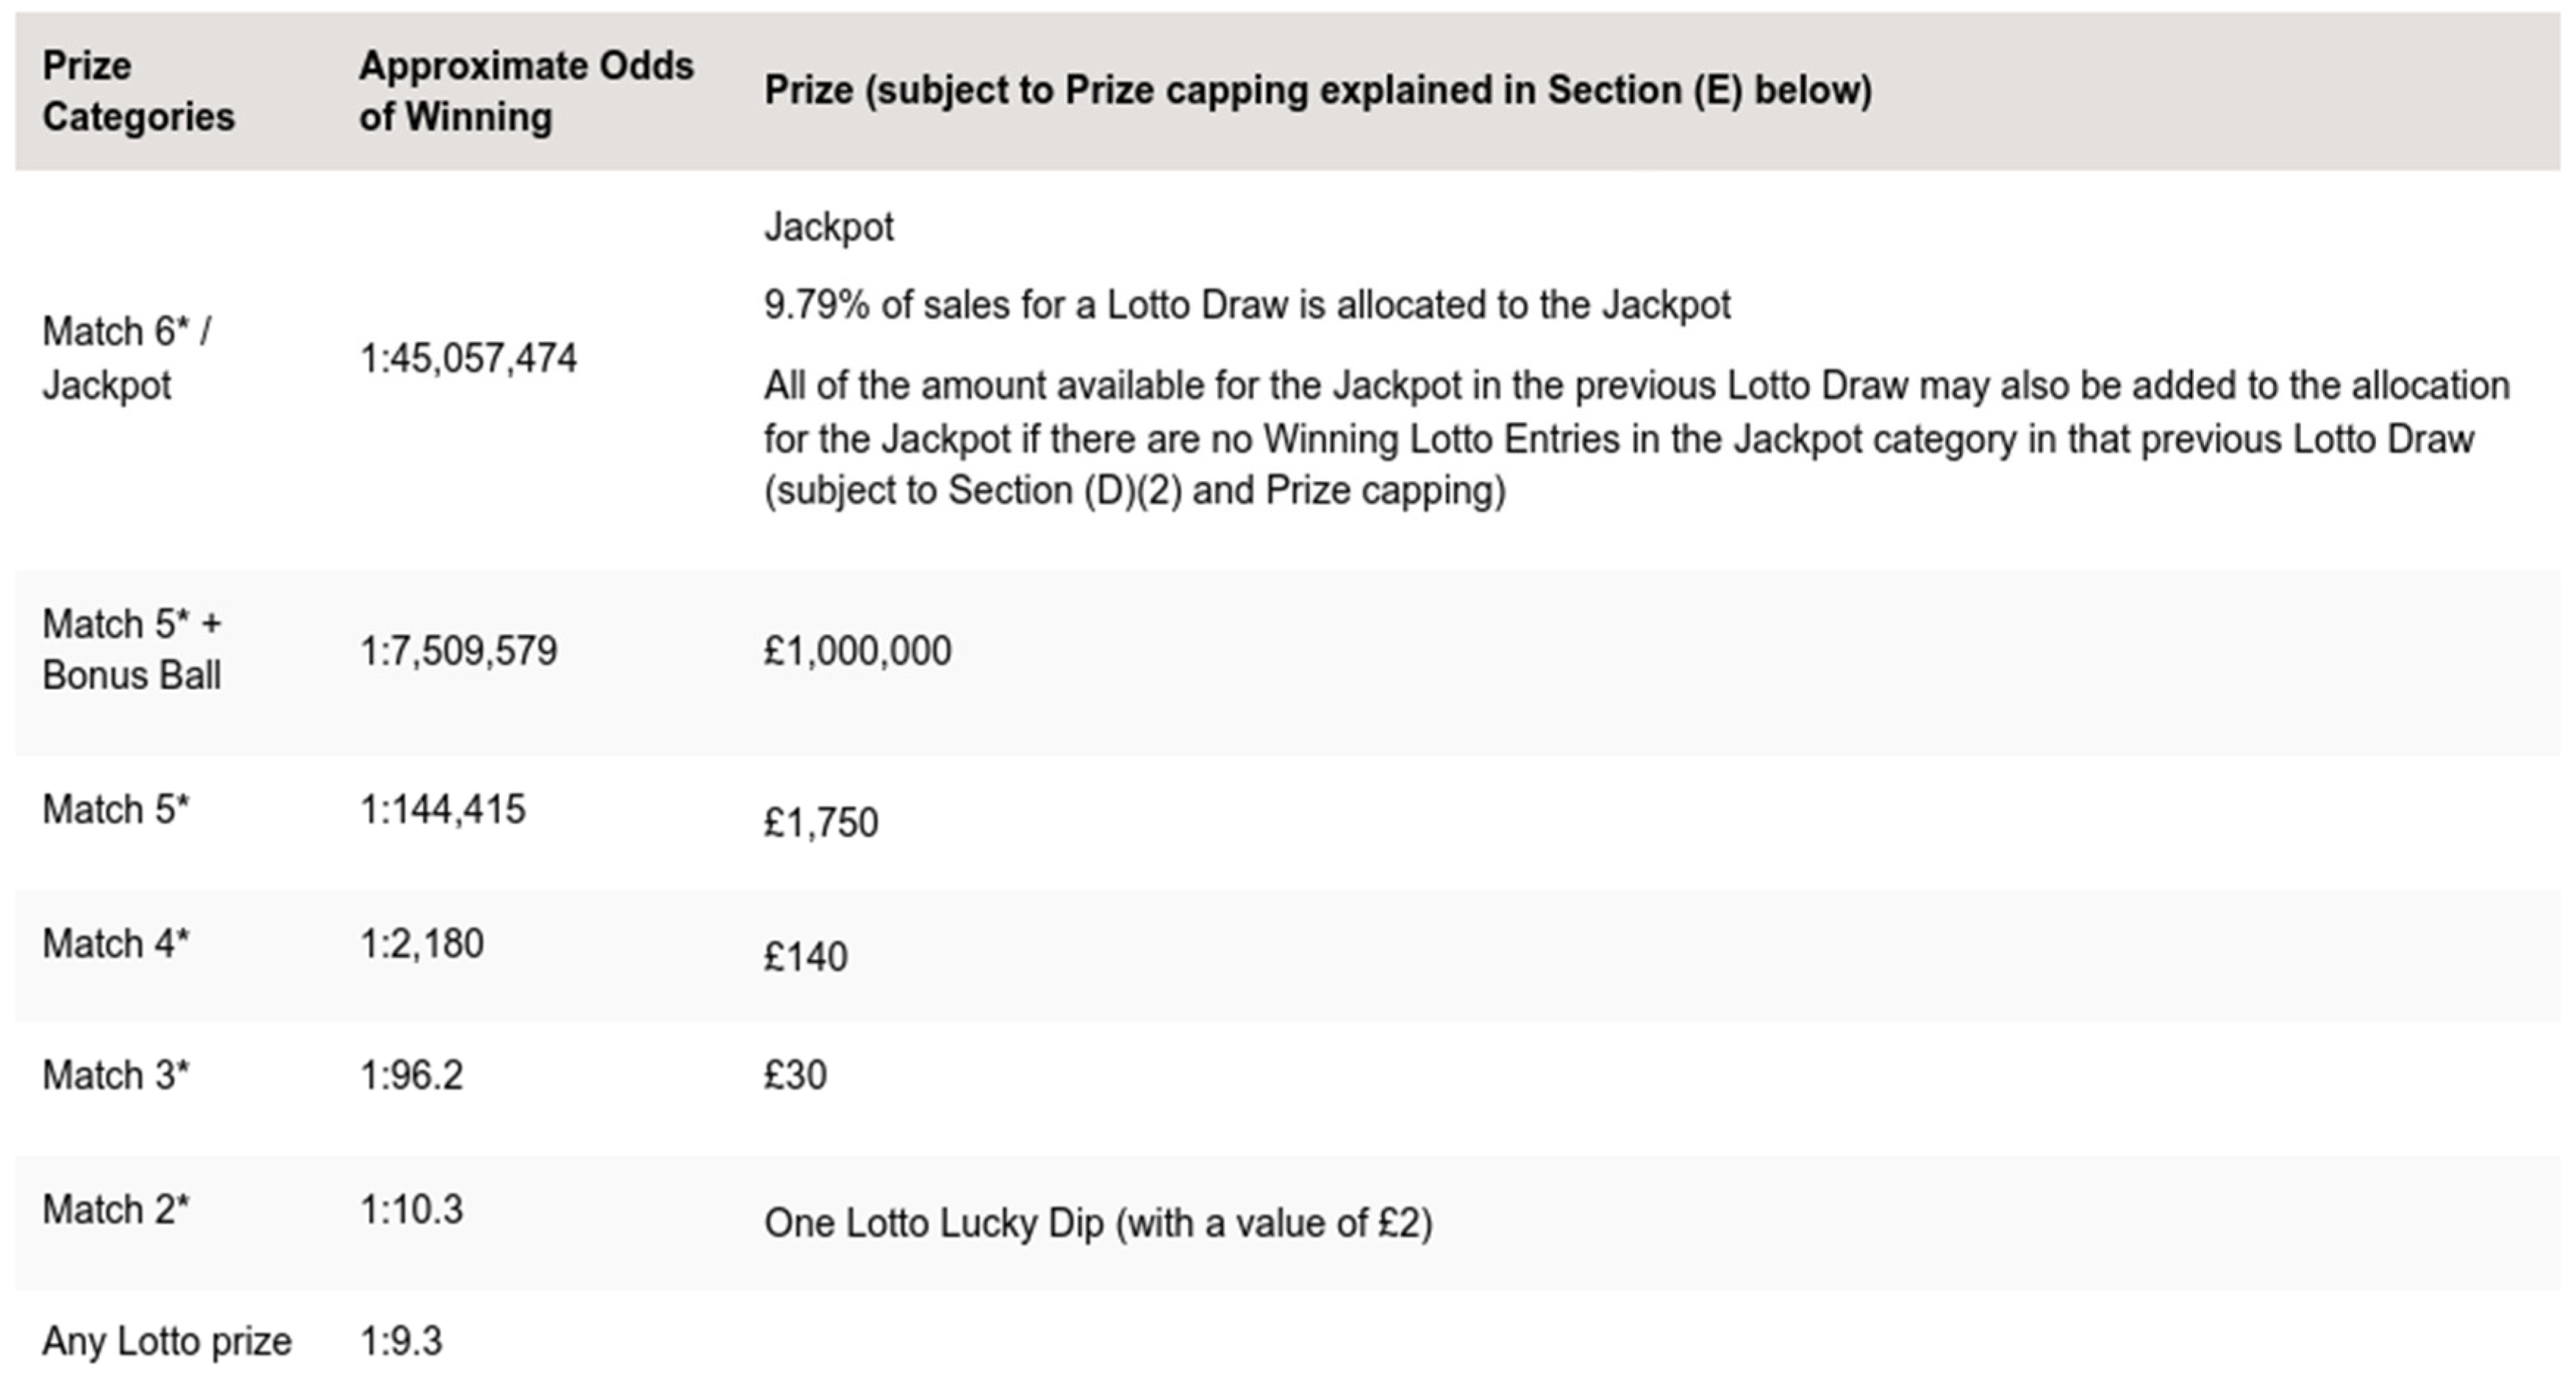
Table 1.
Expected prize values by prize tier (based on number of r matches).
| Matches | Expected Mean |
|---|---|
| r = 6 | Variable Prize |
| r = 5 | £1,750 |
| r = 4 | £140.00 |
| r = 3 | £30.00 |
| r = 2 | Free Ticket |
Table 2.
Number of winning tickets by match category under the partial coverage with concentrated density with m = 16.
Table 2.
Number of winning tickets by match category under the partial coverage with concentrated density with m = 16.
| Matches | N° of Success Tickets | Expected Prize |
|---|---|---|
| 6 | 1 | £13,000,000.00 |
| 5 | 60 | £1,750 |
| 4 | 675 | £140 |
| 3 | 2400 | £30 |
| 2 | 3150 | Free Ticket |
Table 3.
Cost-benefit analysis by match category under the partial coverage with concentrated density with m = 16 considering a scenario with free tickets.
Table 3.
Cost-benefit analysis by match category under the partial coverage with concentrated density with m = 16 considering a scenario with free tickets.
| Matches | Prizes - Costs |
|---|---|
| 6 | - |
| 5 | - |
| 4 | £78,484 |
| 3 | £55,984 |
| 2 | -£9,716 |
| X ≤ 1 | -£16,016 |
Table 4.
Cost-benefit analysis by match category under the partial coverage with concentrated density with m = 16 considering a scenario without free tickets.
Table 4.
Cost-benefit analysis by match category under the partial coverage with concentrated density with m = 16 considering a scenario without free tickets.
| Matches | Prizes - Costs |
|---|---|
| 6 | - |
| 5 | - |
| 4 | £78,484 |
| 3 | £55,984 |
| X ≤ 2 | -£16,016 |
Table 5.
UK 6/59 Lotto results with m = 16 (Part I).
| Draws | b1 | b2 | b3 | b4 | b5 | b6 | b7 | M/Total |
|---|---|---|---|---|---|---|---|---|
| 3068 | 18 | 24 | 34 | 35 | 47 | 51 | 26 | 0 |
| 3067 | 2 | 14 | 34 | 37 | 48 | 52 | 29 | 2 |
| 3066 | 13 | 14 | 15 | 27 | 33 | 36 | 18 | 3 |
| 3065 | 3 | 12 | 21 | 24 | 41 | 45 | 20 | 2 |
| 3064 | 17 | 18 | 23 | 38 | 41 | 47 | 9 | 0 |
| 3063 | 16 | 23 | 28 | 40 | 42 | 55 | 44 | 1 |
| 3062 | 7 | 8 | 11 | 32 | 36 | 59 | 21 | 3 |
| 3061 | 1 | 24 | 26 | 28 | 37 | 42 | 44 | 1 |
| 3060 | 1 | 2 | 11 | 13 | 30 | 37 | 33 | 4 |
| 3059 | 27 | 36 | 39 | 48 | 57 | 59 | 45 | 0 |
| 3058 | 4 | 10 | 12 | 22 | 53 | 55 | 31 | 3 |
| 3057 | 12 | 14 | 28 | 31 | 33 | 46 | 43 | 2 |
| 3056 | 10 | 26 | 33 | 53 | 57 | 59 | 18 | 1 |
| 3055 | 5 | 30 | 36 | 40 | 41 | 43 | 53 | 1 |
| 3054 | 1 | 7 | 17 | 35 | 43 | 57 | 19 | 2 |
| 3053 | 17 | 18 | 22 | 34 | 53 | 58 | 14 | 0 |
| 3052 | 10 | 11 | 34 | 38 | 54 | 55 | 26 | 2 |
| 3051 | 6 | 15 | 27 | 35 | 41 | 43 | 28 | 2 |
| 3050 | 4 | 5 | 6 | 20 | 31 | 33 | 28 | 3 |
| 3049 | 4 | 38 | 42 | 52 | 56 | 58 | 44 | 1 |
| 3048 | 1 | 19 | 29 | 33 | 42 | 44 | 21 | 1 |
| 3047 | 8 | 18 | 19 | 30 | 43 | 44 | 58 | 1 |
| 3046 | 6 | 11 | 14 | 19 | 41 | 43 | 53 | 3 |
| 3045 | 1 | 4 | 10 | 26 | 31 | 40 | 24 | 3 |
| 3044 | 3 | 7 | 9 | 29 | 33 | 51 | 5 | 3 |
Table 6.
UK 6/59 Lotto results with m = 16 (Part II).
| Draws | b1 | b2 | b3 | b4 | b5 | b6 | b7 | M/Total |
|---|---|---|---|---|---|---|---|---|
| 3043 | 5 | 7 | 37 | 39 | 40 | 43 | 8 | 2 |
| 3042 | 17 | 31 | 39 | 46 | 52 | 57 | 1 | 0 |
| 3041 | 8 | 33 | 34 | 50 | 56 | 59 | 17 | 1 |
| 3040 | 6 | 28 | 36 | 45 | 47 | 52 | 51 | 1 |
| 3039 | 26 | 27 | 34 | 41 | 51 | 54 | 52 | 0 |
| 3038 | 1 | 13 | 25 | 30 | 32 | 35 | 2 | 2 |
| 3037 | 7 | 14 | 29 | 31 | 38 | 39 | 56 | 2 |
| 3036 | 14 | 23 | 24 | 32 | 38 | 54 | 50 | 1 |
| 3035 | 2 | 5 | 12 | 20 | 47 | 57 | 43 | 3 |
| 3034 | 2 | 13 | 24 | 29 | 32 | 39 | 46 | 2 |
| 3033 | 11 | 33 | 34 | 38 | 55 | 57 | 20 | 1 |
| 3032 | 2 | 6 | 10 | 12 | 28 | 29 | 57 | 4 |
| 3031 | 7 | 17 | 20 | 24 | 27 | 46 | 21 | 1 |
| 3030 | 16 | 19 | 22 | 24 | 27 | 35 | 28 | 1 |
| 3029 | 18 | 31 | 35 | 38 | 42 | 54 | 41 | 0 |
| 3028 | 16 | 28 | 34 | 40 | 53 | 54 | 55 | 1 |
| 3027 | 9 | 15 | 17 | 35 | 47 | 51 | 31 | 2 |
| 3026 | 3 | 4 | 10 | 16 | 40 | 54 | 8 | 4 |
| 3025 | 18 | 20 | 28 | 39 | 52 | 58 | 38 | 0 |
| 3024 | 1 | 11 | 12 | 17 | 19 | 54 | 3 | 3 |
| 3023 | 2 | 32 | 35 | 36 | 49 | 52 | 19 | 1 |
| 3022 | 9 | 12 | 14 | 26 | 35 | 42 | 18 | 3 |
| 3021 | 12 | 19 | 25 | 35 | 37 | 39 | 3 | 1 |
| 3020 | 14 | 19 | 21 | 22 | 24 | 38 | 17 | 1 |
| 3019 | 15 | 31 | 35 | 38 | 42 | 59 | 6 | 1 |
Table 7.
UK 6/59 Lotto results with m = 16 (Part III).
| Draws | b1 | b2 | b3 | b4 | b5 | b6 | b7 | M/Total |
|---|---|---|---|---|---|---|---|---|
| 3018 | 3 | 8 | 13 | 33 | 39 | 44 | 56 | 3 |
| 3017 | 2 | 7 | 27 | 33 | 37 | 56 | 30 | 2 |
| 3016 | 12 | 16 | 31 | 38 | 58 | 59 | 41 | 2 |
| 3015 | 11 | 12 | 28 | 29 | 41 | 54 | 17 | 2 |
| 3014 | 33 | 36 | 43 | 44 | 50 | 56 | 18 | 0 |
| 3013 | 3 | 6 | 14 | 19 | 32 | 35 | 17 | 3 |
| 3012 | 11 | 12 | 16 | 19 | 35 | 50 | 34 | 3 |
| 3011 | 27 | 36 | 41 | 43 | 54 | 57 | 7 | 0 |
| 3010 | 9 | 16 | 30 | 41 | 44 | 47 | 13 | 2 |
| 3009 | 6 | 9 | 23 | 27 | 45 | 51 | 47 | 2 |
| 3008 | 22 | 43 | 44 | 47 | 48 | 54 | 25 | 0 |
| 3007 | 9 | 11 | 29 | 41 | 42 | 48 | 43 | 2 |
| 3006 | 2 | 11 | 13 | 17 | 39 | 41 | 37 | 3 |
| 3005 | 4 | 7 | 20 | 41 | 55 | 56 | 48 | 2 |
| 3004 | 8 | 12 | 13 | 20 | 44 | 49 | 19 | 3 |
| 3003 | 4 | 5 | 6 | 20 | 21 | 59 | 2 | 3 |
| 3002 | 18 | 23 | 36 | 38 | 39 | 54 | 12 | 2 |
| 3001 | 1 | 3 | 4 | 14 | 55 | 57 | 2 | 4 |
| 3000 | 5 | 17 | 26 | 48 | 49 | 57 | 56 | 1 |
| 2999 | 7 | 20 | 33 | 50 | 51 | 57 | 44 | 1 |
| 2998 | 21 | 27 | 38 | 47 | 49 | 55 | 54 | 0 |
| 2997 | 3 | 10 | 23 | 41 | 53 | 57 | 28 | 2 |
| 2996 | 13 | 32 | 33 | 37 | 38 | 50 | 2 | 1 |
| 2995 | 3 | 6 | 15 | 25 | 29 | 41 | 17 | 3 |
| 2994 | 2 | 3 | 29 | 45 | 48 | 52 | 54 | 2 |
Table 8.
UK 6/59 Lotto results with m = 16 (Part IV).
| Draws | b1 | b2 | b3 | b4 | b5 | b6 | b7 | M/Total |
|---|---|---|---|---|---|---|---|---|
| 2993 | 4 | 10 | 25 | 29 | 49 | 53 | 30 | 2 |
| 2992 | 4 | 17 | 30 | 34 | 39 | 43 | 45 | 1 |
| 2991 | 9 | 23 | 37 | 42 | 53 | 57 | 58 | 1 |
| 2990 | 3 | 6 | 10 | 18 | 52 | 59 | 49 | 3 |
| 2989 | 7 | 15 | 30 | 36 | 45 | 48 | 27 | 2 |
| 2988 | 2 | 25 | 40 | 42 | 48 | 59 | 12 | 1 |
| 2987 | 10 | 11 | 22 | 42 | 49 | 56 | 58 | 2 |
| 2986 | 6 | 19 | 20 | 26 | 28 | 45 | 7 | 1 |
| 2985 | 12 | 16 | 21 | 33 | 52 | 58 | 37 | 2 |
| 2984 | 3 | 25 | 27 | 33 | 40 | 45 | 58 | 1 |
| 2983 | 3 | 17 | 23 | 29 | 31 | 34 | 46 | 1 |
| 2982 | 9 | 19 | 22 | 41 | 55 | 58 | 44 | 1 |
| 2981 | 2 | 7 | 32 | 44 | 45 | 49 | 39 | 1 |
| 2980 | 22 | 27 | 37 | 38 | 49 | 51 | 59 | 0 |
| 2979 | 8 | 9 | 13 | 19 | 26 | 48 | 54 | 3 |
| 2978 | 11 | 18 | 24 | 37 | 47 | 59 | 13 | 1 |
| 2977 | 1 | 8 | 42 | 46 | 50 | 58 | 51 | 2 |
| 2976 | 7 | 11 | 19 | 25 | 29 | 31 | 6 | 2 |
| 2975 | 8 | 27 | 34 | 36 | 37 | 56 | 54 | 1 |
| 2974 | 5 | 9 | 18 | 32 | 44 | 58 | 34 | 2 |
| 2973 | 3 | 7 | 13 | 15 | 21 | 52 | 23 | 4 |
| 2972 | 1 | 9 | 25 | 29 | 34 | 39 | 22 | 2 |
| 2971 | 13 | 40 | 41 | 42 | 51 | 59 | 5 | 0 |
| 2970 | 3 | 7 | 10 | 23 | 24 | 41 | 59 | 3 |
| 2969 | 1 | 9 | 13 | 21 | 33 | 58 | 28 | 3 |
Table 9.
Analysis of 100 UK 6/59 Lotto draws considering Free Tickets.
| Matches | 100 Last Draws | P/L |
|---|---|---|
| 6 | - | - |
| 5 | - | - |
| 4 | 5 | £392,420.00 |
| 3 | 21 | £1,175,664.00 |
| 2 | 29 | -£281,764.00 |
| X ≤ 1 | 45 | -£720,720.00 |
| 100 | £565,600.00 |
Table 10.
Analysis of 100 UK 6/59 Lotto draws disregarding Free Tickets.
| Matches | 100 Last Draws | P/L |
| 6 | - | - |
| 5 | - | - |
| 4 | 5 | £392,420.00 |
| 3 | 21 | £1,175,664.00 |
| X ≤ 2 | 74 | -£1,185,184.00 |
| 100 | £382,900.00 |
Table 12.
Analysis of 100 UK 6/59 Lotto draws with m = 19 disregarding Free Tickets.
| Matches | 100 Last Draws | P/L |
|---|---|---|
| 6 | - | - |
| 5 | - | - |
| 4 | 8 | £876,288 |
| 3 | 21 | £2,464,056 |
| X ≤ 2 | 71 | -£3,852,744 |
| 100 | -£512,400 |
Disclaimer/Publisher’s Note: The statements, opinions and data contained in all publications are solely those of the individual author(s) and contributor(s) and not of MDPI and/or the editor(s). MDPI and/or the editor(s) disclaim responsibility for any injury to people or property resulting from any ideas, methods, instructions or products referred to in the content. |
© 2025 by the authors. Licensee MDPI, Basel, Switzerland. This article is an open access article distributed under the terms and conditions of the Creative Commons Attribution (CC BY) license (http://creativecommons.org/licenses/by/4.0/).
Copyright: This open access article is published under a Creative Commons CC BY 4.0 license, which permit the free download, distribution, and reuse, provided that the author and preprint are cited in any reuse.


