
Submitted:
10 June 2025
Posted:
12 June 2025
You are already at the latest version
Abstract
Background and objectives: IL-6 is a cytokine that promotes the proliferation of can-cer cells by activating the JAK/STAT pathway via STAT3, which is expressed after methylation by NSD2. Furin, a pro-protein convertase responsible for the maturation of several precursor proteins such as pro-IGF-1R, involved in the activation of PI3K/AKT and the MAPK pathway, plays a crucial role in cancer proliferation. Our objective is to observe the impact of the overexpression of SERPINA-1, an an-ti-inflammatory and serine protease inhibitor, on cell proliferation and the genetic ex-pression of IL-6, Furin, and NSD2. Materials and Methods: In hetero-hybrid lympho-blastoid cells either transfected with the SERPINA-1 gene (JP7pSer+) or without the SERPINA-1 gene (JP7pSer-); we studied by qRT-PCR the genetic overexpression of the SERPINA-1 gene and the genetic expression of Furin, IL-6, and NSD2 genes. Cell pro-liferation was tested by colorimetric and enzymatic methods, and the membrane ex-pression of IGF-1R was measured by flow cytometry. Results: The proliferation of the JP7pSer+ cell line is decreased by 91% and 85% in both measurement methods on day 6 compared to JP7pSer- cells. The kinetics of the genetic expression of Furin, IL-6, and NSD2 show an increase in expression times in JP7pSer+ cells compared to JP7pSer- cells, but after three days, this ratio is reversed. The ratio of mean fluorescence intensi-ty shows that JP7pSer- cells express 1.33 times more IGF-1R than JP7pSer+ cells. Con-clusion: These results suggest promising therapeutic avenues for cancer, which should be complemented by advanced studies on the expression of SERPINA-1 and the inter-action with the expression of IL-6 and Furin.
Keywords:
SERPINA-1
; hetero-hybrid lymphoblastoid
; Furin
; IL-6
; NSD2
; IGF-1R
1. Introduction
Cancer is a complex disease characterized by uncontrolled cell proliferation, driven by a combination of genetic, environmental, and epigenetic factors [1]. The cellular signalling pathways are central to these events, which regulate cell growth, survival, and differentiation [2,3]. These pathways are complex networks of proteins involved in genetic and epigenetic regulation, as well as in modulating the cellular environment, influencing fundamental processes such as apoptosis, cell proliferation, and tissue invasion [3,4,5]. Prominent signalling pathways frequently deregulated in cancer development include the PI3K/AKT/mTOR, MAPK/ERK, and JAK/STAT pathways [6,7,8,9].
These pathways are often abnormally activated by genetic mutations or aberrant activation mechanisms, leading to excessive stimulation of proliferation and inhibition of apoptosis mechanisms [10,11,12]. Indeed, the JAK/STAT pathway, when activated by IL-6, a cytokine implicated in several cancer [9], induces the activation of the transcription factor Stat3 in tumor cells. The activation of the NF-κB and Stat3 signalling pathways promotes resistance to apoptosis, angiogenesis, and metastasis of tumor cells [13,14]. Furthermore, IL-6 contributes to the resistance of tumor cells to treatment, such as chemotherapy, by promoting survival and invasion and by inhibiting apoptosis of malignant cells [9,15].
IL-6 plays a role in modulating the tumor microenvironment, promoting inflammation and tumor growth, such as in multiple myeloma [16,17]. Song and colleagues demonstrated that NSD2 can methylate and activate STAT3, creating a potential positive feedback loop that amplifies IL-6 signalling [18]. NSD2 is a methyltransferase that plays a key role in the regulation of gene expression by methylating histones. This enzyme is responsible for the catalysis of mono- and di-methylation of lysine 36 on histone H3 [19]. This histone modification can recruit or exclude other chromatin-associated proteins, leading to either activation or repression of gene expression, depending on the cellular context [20]. NSD2 expression is frequently elevated in various types of cancers [18,21]. The evolution of cancer involves complex biological and environmental events that depend on the activity of various enzymes. Among these, proprotein convertases, particularly Furin, are involved in the maturation of numerous precursor proteins into their active forms, thereby promoting the progression of several cancers [22,23]. Furin, a subtilisin-like protease, cleaves precursor proteins at the consensus site of Arg - X - Lys/Arg - Arg or Arg - X - X - Arg, facilitating their maturation [24,25,26].
Furin is involved in the maturation of precursors such as pro-TNF-α, pro-TGF-β1, and pro-IGF-1R, as well as various growth factors. These molecules play important roles in diverse cellular processes, including inflammation, growth, and angiogenesis, which are frequently deregulated in cancer [26,27,28]. In the context of the tumor microenvironment, pro-inflammatory cytokines matured by Furin, such as pro-TNF-α and pro-TGF-β1, can induce the activation of IL-6 [29], which in turn promotes tumor growth, angiogenesis, and metastasis [13]. Indeed, IL-6 produced by tumor microenvironment cells induces the activation of the JAK/STAT3 pathway in tumor cells, stimulating their proliferation, survival, and invasion [9]. Furin, therefore, contributes to the regulation of several signalling pathways crucial for tumor progression, including the maturation of the pro-IGF-1R precursor into IGF-1R, enabling its expression on the cell surface [30,31]. By interacting with its ligands IGF1 and IGF2, IGF-1R activates cell proliferation and, in certain cancers, promotes tumor progression [32]. Furin is often overexpressed in various cancers, suggesting its potential role in the survival and proliferation of tumor cells [26].
Understanding the molecular mechanisms of signalling pathways involving inflammatory processes mediated by cytokines just like IL-6 and maturation by Furin, opens new avenues for the development of targeted therapies aimed at restoring the normal regulation of cellular processes. In doing so, it is essential to explore not only individual signalling pathways but also their interactions and their roles within the tumor microenvironment. Thus, the study of signalling pathways in the context of cancer is essential for the development of innovative diagnostic and therapeutic strategies. However, the involvement of Furin in different cancers, such as malignant haematological diseases, remains largely unknown, particularly regarding its potential interactions with IL-6 and NSD2. Studies on the links between these markers would help identify common mechanistic pathways and specificities in different cancer pathologies. To date, no study has established a definitive mechanistic link between these three players (Furin, IL-6 and NSD2) in cancer, which limits the understanding of their synergies or common regulatory pathways. One in vitro approach is to verify whether there are significant interdependencies or correlations between the expression of Furin, IL-6, and NSD2 by inhibiting one of the three elements. Alpha-1 antitrypsin (A1AT), encoded by the SERPINA1 gene, is an inhibitor of serine proteases, particularly neutrophil elastase, which is its main target [33]. Likewise, Alpha-1 PDX is a variant of A1AT, a serine protease inhibitor, targeting other proteases such as Furin, PACE4, and PC7 [34]. Our objective is to assess the effect of the SERPINA-1 overexpression on these Furin, IL-6, and NSD2 markers in a proliferative hetero-hybrid lymphoblastoid cell model.
2. Materials and Methods
2.1. Maintenance of the JP7 Cell Line
The JP7 cell line, established in our laboratory according to the protocol described by Tissent and al. [35], originated from the transformation of human lymphocytes by the Epstein-Barr virus. These transformed lymphocytes were then stabilized by fusion with the murine X63Ag8 myeloma cell line derived from BALB/c mice. The resulting hetero-lymphoblastoid cells are maintained in continuous culture through successive passages in RPMI 1640 culture medium supplemented with 10% foetal bovine serum (FBS), 200 mM glutamine, and 100 IU/ml penicillin and streptomycin. Cultures are maintained in sterile containers and incubated at 37°C in a humidified atmosphere with 5% CO2.
2.2. Establishment, Identification, and Selection of JP7pSer+ and JP7pSer- Cell Lines
JP7 cells were cultured in a 6-well plate at a density of 5 x 10⁵ cells/well in 3 ml of culture medium. After 24 hours, the cells were washed and supplemented with 1 ml/well of culture medium containing 1µg of either the pCMV6-SERPINA1-GFP or pCMV6-GFP plasmid vector, along with 8µl of transfection reagent (CANFAST, Canvaxbiotech). Cells transfected with pCMV6-SERPINA1-GFP were designated JP7pSer+, while cells transfected with pCMV6-GFP were designated JP7pSer-. Following a 5-hour incubation period, the cells were washed by centrifugation with RPMI medium without FBS and returned to culture as described above, with the addition of the selective antibiotic G418 at 400 µg/ml. After 48 hours, the cells were harvested for downstream assays. Cell condition and proliferation were monitored by microscopy (EVOS™ FL Digital Inverted Fluorescence Microscope). Under these selective conditions, only transfected cells that had integrated the G418 resistance gene and expressed GFP were able to proliferate, as indicated by green fluorescence. Transfection efficiency was assessed by determining the percentage of fluorescent cells using microscopy (EVOS™ FL Digital Inverted Fluorescence Microscope) at 200-x magnification, and SERPINA1 gene expression was confirmed by qRT-PCR.
2.3. Evaluation of the Effect of Serpina-1 Gene Transfection on Cell Lines in Culture
2.3.1. Cell Proliferation
The colorimetric study using Trypan blue exclusion, 20 x 103 cells/well were seeded into six 96-well plates. For the enzymatic study employing 3-(4,5-diméthyl-2-thiazolyl)-2,5-diphényl-2H-tétrazolium (MTT), 5 x 10³ cells/well were seeded into three 96-well plates. The JP7pSer+ and JP7pSer- cells were cultured for 6 days under standard conditions as previously described, but without the selective G418. The culture medium was not renewed during this period. Cell viability and proliferation were assessed daily and in parallel using both the Trypan blue exclusion and MTT assays. All tests were performed in triplicate across three independent experiments. The percentage of viable cells, as determined by Trypan blue exclusion, was quantified by microscopy using a Malassez counting chamber. The enzymatic activity of the cells was evaluated by spectrophotometric measurement at 570 nm, which quantifies the optical density of the formazan product resulting from the reduction of MTT by succinate dehydrogenase, a mitochondrial metabolic enzyme.
2.3.2. Gene Expression of Serpina-1, Furin, IL-6 and NSD2
The total RNA from the cell lines was extracted using the kit (PRImeZOL RNA Isolation, Canvaxbiotech), in accordance with the manufacturer's instructions, and quantified by spectrophotometry (MaestroNano). A quantity of 250 ng/μl of RNA was used for each qRT-PCR using the kit one-step (qMAXSen, Canvaxbiotech). The specific primers used for the genes, SERPINA-1 (Forward: 5′-GGCTGACACTCACGATGAAA-3’; Reverse: 5′-GTGTCCCCGAAGTTGACAGT-3′), FURIN (Forward: 5’-GCCCAGAATTGGACCACAGT-3’; Reverse: 5’-TCCCGATGTCTTTGGGCTC-3’), IL-6 (Forward: 5’-AGACAGCCACTCACCTCTTCAG-3’; Reverse 5’-TTCTGCCAGTGCCTCTTTGCTG-3’), NSD2 (Forward: 5’-AATATGACTCCTTGCTGGAGCAGG-3’; Reverse: 5’-ATTTCAACAGGTGGTCTTTGTCTC-3’) and Beta-actin (Forward: 5’-TGGAATCCTGTGGCATCCATGAAAC-3’; Reverse: 5’-TAAAACGCAGCTCAGTAACAGTCC-3’) provided and reconstituted according to the manufacturer's recommendations (NeoBiotech). Amplification in 35 cycles was performed in a thermocycler (BIO-RAD CFX 96, C1000) calibrated for SYBR Green fluorescence quantification. The qRT-PCR experiments were performed in triplicate daily for 5 days. The results obtained were normalized separately to the human beta-actin reference gene according to the Livak method before calculating the means of the observed expression ratios each day [36].
2.3.3. Membrane Expression of the IGF-1 Receptor
The membrane expression of IGF-1R was measured by flow cytometer (BD FACS Lyric Flow Cytometry System, BD Biosciences). For this purpose, the JP7pSer+ and JP7pSer- cells, suspended at 30x103 / 100 µl in RPMI-1640 medium without additives, were incubated in 5 ml tubes with 10 µl of the anti-CD221-PE monoclonal antibody (Clone IH7, Origène Technologie) or the non-specific anti-IgG1-PE isotype antibody (Clone HP6001, BD Pharmingen). After 30 minutes of incubation in the dark at room temperature, the cells were washed 3 times by centrifugation with RPMI-1640 medium and then suspended for flow cytometer analysis.
2.4. Statistical Analysis
The normality of the distribution of values was verified by the Shapiro-Wilcoxon test. Statistical differences according to the t test, Welch and Fisher tests were verified using Graph Pad Prism8 software.
3. Results
3.1. Establishment, Identification, and Selection of JP7pSer+ and JP7pSer- Cell Lines
The selection of transfected cell lines was based on observations from both fluorescence microscopy and the quantification of mRNA for A1AT. Culture wells containing fluorescent cells at greater than 95% and an SERPINA1 gene mRNA level at least equal to 1 relative to the beta-actin reference gene were selected.
3.1.1. Microscopy
To evaluate the stability of the JP7pSer- and JP7pSer+ model lines, the cells were observed under a fluorescence microscope and digitized to have more than 95% of the fluorescent cells, in order to perform the genetic expression and proliferation tests.
After 48 hours of culture with selective agent G418 to generate stable cell lines, more than 95% of JP7pSer+ and JP7pSer- cells emitted green fluorescence under excitation at 490 nm (blue light). These results show that JP7pSer+ are fluorescent and express GFP, this expression is indicative of A1AT expression in the JP7pSer+ line because the same cytomegalovirus promoter governs both the SERPINA-1 and GFP genes (Figure 1).
3.1.2. qRT-PCR
qRT-PCR analysis was performed on several wells of cells to measure SERPINA-1 gene expression in both JP7pSer+ and JP7pSer- cell clones in order to confirm SERPINA-1 overexpression by JP7pSer+ cells. Beta-actin was used as the housekeeping gene in this experiment.
The average expression of SERPINA-1 gene in JP7pSer- cells is 1.2, while that of JP7-pSer+ cells is 226, relative to the expression of the Beta-actin housekeeping gene (Figure 2). These results therefore confirm the overexpression of the SERPINA-1 in JP7pSer+ cells line.
3.2. Evaluation of the Effect of SERPINA1 Gene Transfection on Cultured Cell Lines
3.2.1. Cell Proliferation
The proliferation test was designed to determine whether the proliferative capacity of JP7pSer+ cells overexpressing SERPINA-1 is lower than that of JP7pSer- cells.
To confirm this, two proliferation tests were used: a colorimetric method based on counting viable cells with trypan blue (Figure 3-A), and an enzymatic method by MTT based on the metabolic activity of the cells (Figure 3-B).
The colorimetric proliferation assay of JP7pSer+ cells shows the same trends, with a decrease in proliferation of more than 64% in 4 days and more than 91% after 6 days (Figure 3-A) . The proliferation measured by MTT of JP7pSer+ cells decreases by 38% in 4 days and by more than 85% in terms of 6 days compared to JP7pSer- cells (Figure 3-B).
3.2.2. Kinetics of Gene Expression for Furin, IL-6, and NSD2
The kinetic study of the expression by qRT-PCR of Furin, IL-6 and NSD2 was designed to observe the inhibitor effect of the SERPINA1 gene on JP7pSer+ cells compared to JP7pSer- cells. These gene expressions of Furin, IL-6 and NSD2 were calculated using the Livak and Schmittgen method [36], relative to the expression of the Beta actin gene.
The qRT-PCR analysis revealed that the JP7pSer+/JP7pSer- ratio of Furin gene expression was 4.88 on the 1st day and became 1.01 on the 3rd day, decreasing to 0.37 on the 6th day of culture. However, the same cellular ratio of IL-6 gene expression was 3.07 on the 1st day and decreased to 0.74 on the 3rd day, reaching 0.47 on the 6th day. As for NSD2 expression, the JP7pSer+/JP7pSer- ratio was 1.59 on the 1st day and decreased to 0.7 on the 3rd day, continuing to decrease to 0.51 on the 6th day (Figure 4). Three experiments were conducted to study the effect of the SERPINA1 gene over-expression on the expression kinetics of the three genes encoding Furin, IL-6, and NSD2. All three experiments yielded reproducible and highly similar results.
These results indicate an influence of SERPINA-1 gene over-expression on the kinetics of Furin, IL-6, and NSD2 expression, with an initial increase in expression followed by a progressive decrease.
3.2.3. Membrane Expression of the IGF-1 Receptor (IGF-1R, CD221)
This section will likely examine the inhibitor effect of SERPINA1 gene on the surface expression of the Insulin-like Growth Factor 1 Receptor (IGF-1R), also known as CD221.
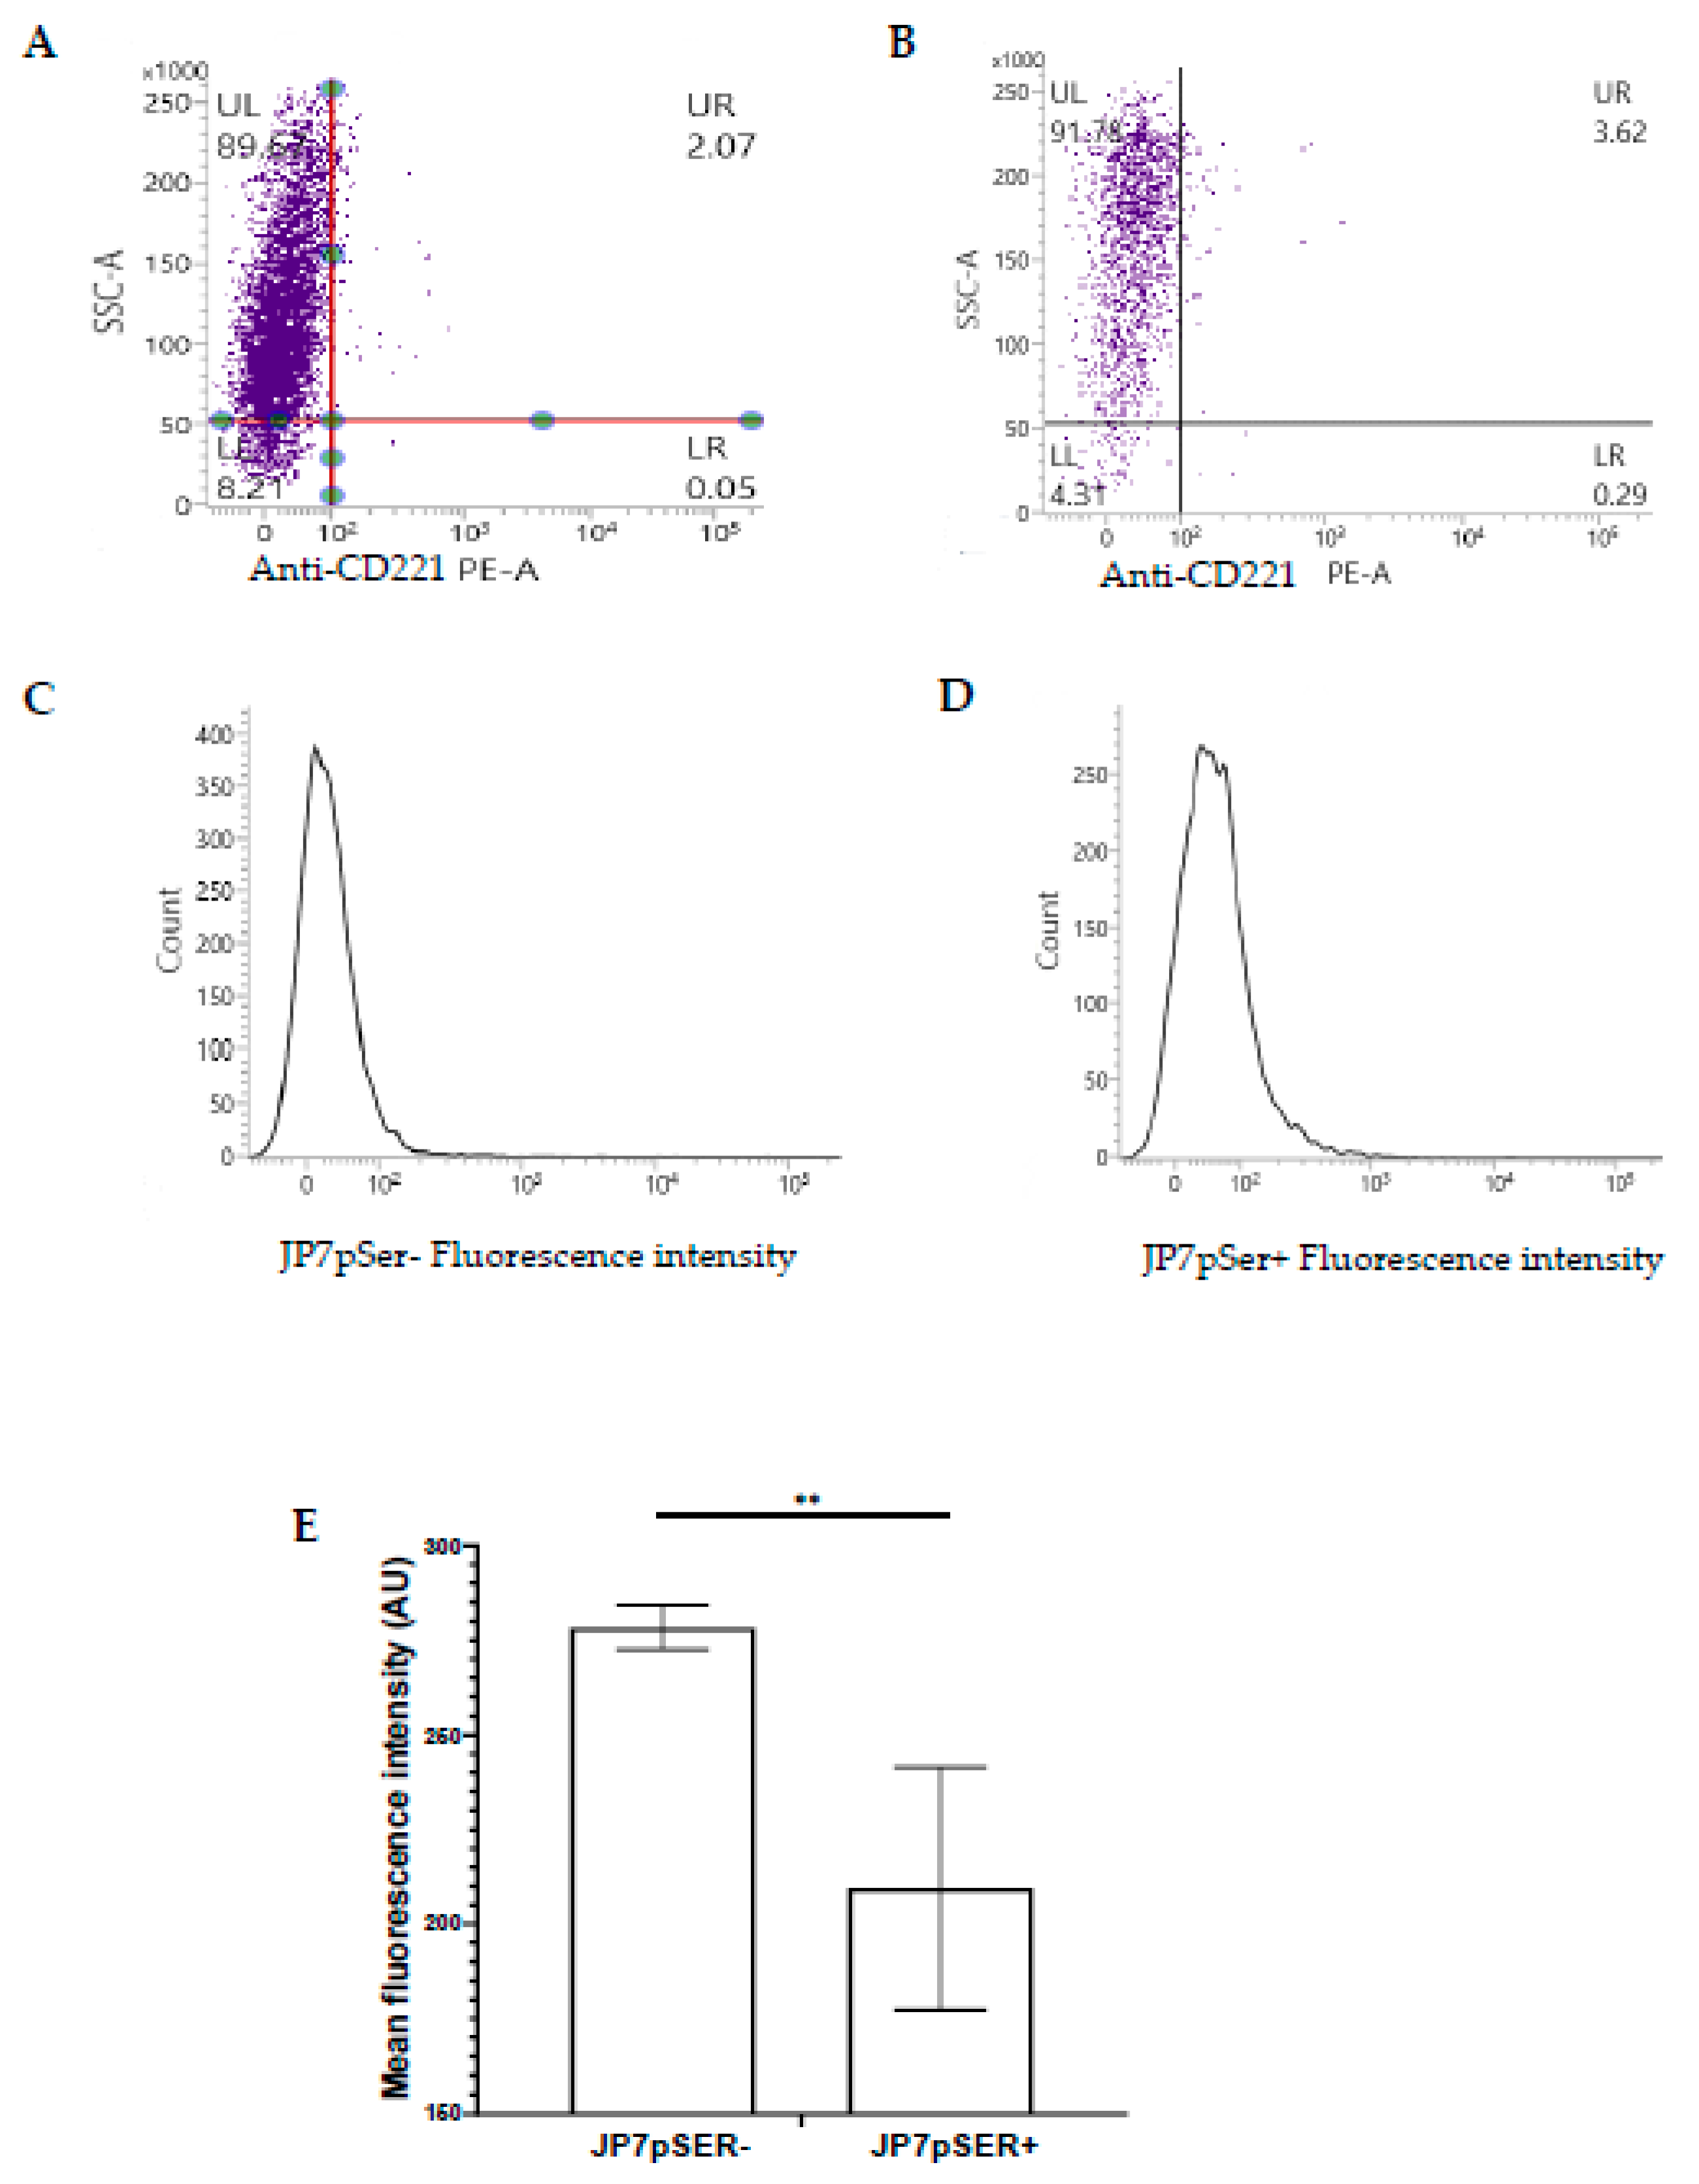
Cytofluorimetric analysis using anti-CD221-PE showed a near-absence of labelling in JP7 cells. The JP7pSer- and JP7pSer+ cell lines showed low and nearly similar percentages with JP7pSer- (3.9%) vs JP7pSer+ (3.46%), t-test = 1.2 with a p-value = 0.22 > 0.05, not significant. The average fluorescence intensity over three measurements for each cell line shows that JP7pSer- cells have an average MFI=278.33 AU, while for JP7pSer+ the average MFI=209.33 AU, with different confidence intervals CI99: [272.48; 284.17] for JP7pSer- and CI99: [177.31; 241.34] for JP7pSer+. The p-value < 0.01 with a significance threshold of 0.05. These results indicate that CD221 expression is globally very low in both JP7pSer- and JP7pSer+ cell lines, but with a 25% decrease in JP7pSer+ compared to JP7pSer- (Figure 5-E).
4. Discussion
The JP7 cell line, derived from a fusion between an EBV-transformed lymphocyte and a murine myeloma, was used to study the effects of SERPINA-1 gene expression and its product, alpha-1-antitrypsin (A1AT), on cell proliferation and the expression of Furin, IL-6, and NSD2 genes. JP7pSer+ cells, overexpressing SERPINA-1, but not JP7pSer- cells, were generated using the same plasmid under the control of the cytomegalovirus promoter. This approach allowed us to isolate the effect of SERPINA-1 overexpression while maintaining identical experimental conditions for both cell lines. This model helps to study the effect of A1AT, on different cellular processes. A1AT, a potent anti-inflammatory protein and a major serine proteinase inhibitor, is mainly synthesized by hepatocytes and highly expressed during inflammatory [37]. In our study, SERPINA-1 mRNA expression in JP7pSer+ cells, measured 48 hours after transfection several times, showed levels ranging from 208 to 240 times higher than those in the JP7pSer- cell line. Previous studies have reported that gene expression under the control of the CMV promoter can vary from 10 to 1000-fold depending on the cell type and the number of integrated promoters, as well as the number of plasmids transfected per cell [38,39,40]. However, in the JP7pSer- and JP7pSer+ cell lines, IGF-1R expression is present in nearly 3.9% on the cell surface, suggesting that this signalling pathway may not play a major role in cell proliferation [41], probably due to the activation of the CMV promoter, which increases Furin expression and allows for the cleavage of pro-IGF-1R. In contrast, in the JP7pSer+ cell line, the mean fluorescence intensity of IGF-1R expression was reduced by 25%, suggesting that SERPINA-1 overexpression inhibits Furin, thereby preventing the cleavage of pro-IGF-1R and reducing the availability of IGF-1R on the cell surface [42,43,44]. Thus, this reduction in IGF-1R expression on the surface of JP7pSer+ cells provides an indirect argument in favor of the biological activity of A1AT, demonstrating not only its impact on a specific signaling pathway but also on cell proliferation as assessed by enzymatic and colorimetric [45,46]. Indeed, after 72 hours, the proliferation of JP7pSer+ cells dropped by more than 50%, and then by more than 90% after 96 hours, while that of JP7pSer- cells remained stable at 90%. To understand the molecular effects during this progressive decrease in proliferation, we analyzed the mRNA expressions of Furin, IL-6, and NSD2. This study revealed a significant negative correlation between the gene expression ratios over time for the three genes of interest, Furin, IL-6, and NSD2. Initially high, these ratios decreased to levels close to one after 72 hours of culture, likely reflecting an initial adaptive response followed by a negative regulation of the Furin, IL-6, and NSD2 genes in the JP7pSer+ line. The indirect relationship between IL-6 and Furin observed in JP7pSer+ cells can be attributed to the role of IL-6 as an inflammatory mediator, which can induce Furin expression under certain conditions. This is consistent with studies demonstrating that IL-6 plays a dual role, both in pro-inflammatory and pro-tumorigenic processes, depending on the cellular context and the signaling pathways [47]. This regulation may also be involved in controlling the growth and survival of tumor cells, as shown by research on the role of IL-6 in the tumor [13].
In contrast, the JP7pSer- cell line maintained a more stable gene expression, highlighting the specific role of A1AT in the regulation of these genes. Furthermore, linear regression data showed strong and significant correlations between Furin and NSD2, as well as between Furin and IL-6, suggesting that Furin is a central point in the regulation of these genes. However, these correlations do not establish a direct causal relationship. The correlation between NSD2 and IL-6 indicates a potential interconnection between these pathways, involving epigenetic and inflammatory mechanisms.
5. Conclusion
The overexpression of the SETRPINA-1 gene inhibits cell proliferation and modulates the expression of NSD2, IL-6, and Furin. The reduction in CD221 expression in JP7pSer+ cells reinforces the hypothesis that Furin inhibition plays a central role in these effects. These results open avenues of research for potential therapeutic targets. However, further molecular studies are needed to confirm these hypotheses and explore the functional implications of these interactions.
Author Contributions
Conceptualization, NASSIM TASSOU, AHMED TISSENT and NORDDINE HABTI; Methodology, NASSIM TASSOU and NORDDINE HABTI; Validation, AHMED TISSENT and NORDDINE HABTI; Formal analysis, NASSIM TASSOU and NORDDINE HABTI; Resources, NASSIM TASSOU and HAJAR ANIBAT; Data curation, NASSIM TASSOU; Writing – original draft, NASSIM TASSOU; Writing – review & editing, NASSIM TASSOU and NORDDINE HABTI; Visualization, NASSIM TASSOU and AHMED TISSENT; Supervision, NORDDINE HABTI; Project administration, NORDDINE HABTI; Funding acquisition, HAJAR ANIBAT and NORDDINE HABTI.
Funding
This research received no external funding.
Data Availability Statement
The original contributions presented in this study are included in the article/supplementary material. Further inquiries can be directed to the corresponding authors.
Conflicts of Interest
The authors declare no conflict of interest.
Abbreviations
| IGF-1 | Insulin-like growth factor-1 |
| PI3K | Phosphatidylinositol 3-kinase |
| AKT | Protein kinase B |
| mTOR | Mammalian target of rapamycin |
| MAPK | Mitogen-activated protein kinase |
| ERK | Extracellular signal-regulated kinases |
| JAK | Janus kinases |
| STAT | Signal transducer and activator of transcription proteins |
| IGF-1R | Insulin-like growth factor-1 receptor |
| IL-6 | Interleukin 6 |
| TNF-α | Tumor necrosis factor |
| NSD2 | Probable histone-lysine N-methyltransferase |
| EBV | Epstein-Barr virus |
| STAT3 | Signal transducer and activator of transcription 3 |
| Lys | Lysine |
| Arg | Arginine |
| TGF-β1 | Transforming growth factor beta 1 |
| PC | Proprotein convertase |
| A1AT | Alpha-1 antitrypsin |
| Alpha- 1PDX | alpha-1 antitrypsin Portland variant |
| PACE4 | Proprotein convertase subtilisin/kexin type 6 |
| PC7 | Proprotein convertase subtilisin/kexin type 7 |
| CMV | Cytomegalovirus |
| GFP | Green fluorescent protein |
| mRNA | Messenger ribonucleic acid |
| qRT-PCR CI mRNA |
Quantitative Reverse Transcription – Poly Chain Réaction confidence interval messenger ribonucleic acid |
References
- M. C. Casotti et al., “Integrating frontiers: a holistic, quantum and evolutionary approach to conquering cancer through systems biology and multidisciplinary synergy,” Frontiers in Oncology, vol. 14. Frontiers Media, Aug. 19, 2024. [CrossRef]
- A. D. Gheorghe et al., “Epigenetic Symphony in Diffuse Large B-Cell Lymphoma: Orchestrating the Tumor Microenvironment,” Biomedicines, vol. 13, no. 4, p. 853, Apr. 2025. [CrossRef]
- T. C. Dakal et al., “Oncogenes and tumor suppressor genes: functions and roles in cancers,” MedComm, vol. 5, no. 6. Wiley, May 31, 2024. [CrossRef]
- S. Wang et al., “Cell death pathways: molecular mechanisms and therapeutic targets for cancer,” MedComm, vol. 5, no. 9. Wiley, Sep. 01, 2024. [CrossRef]
- S. Yuan et al., “Profiling signaling mediators for cell-cell interactions and communications with microfluidics-based single-cell analysis tools,” iScience, vol. 28, no. 1. Cell Press, p. 111663, Dec. 20, 2024. [CrossRef]
- Y. Peng and J. Tan, “The Relationship between IGF Pathway and Acquired Resistance to Tyrosine Kinase Inhibitors in Cancer Therapy,” Frontiers in Bioscience-Landmark, vol. 28, no. 8. IMR Press, Aug. 11, 2023. [CrossRef]
- Q. Luo, R. Du, W. Liu, G. Huang, Z. Dong, and X. Li, “PI3K/Akt/mTOR Signaling Pathway: Role in Esophageal Squamous Cell Carcinoma, Regulatory Mechanisms and Opportunities for Targeted Therapy,” Frontiers in Oncology, vol. 12. Frontiers Media, Mar. 22, 2022. [CrossRef]
- D. Fu, Z. Hu, X. Xu, X. Dai, and Z. Liu, “Key signal transduction pathways and crosstalk in cancer: Biological and therapeutic opportunities,” Translational Oncology, vol. 26, p. 101510, Sep. 2022. [CrossRef]
- B. Huang, X. Lang, and X. Li, “The role of IL-6/JAK2/STAT3 signaling pathway in cancers,” Frontiers in Oncology, vol. 12. Frontiers Media, Dec. 16, 2022. [CrossRef]
- A. Derakhshani et al., “An Overview of the Oncogenic Signaling Pathways in Different Types of Cancers,” Mar. 2020. [CrossRef]
- M. Aprile, S. Cataldi, C. Perfetto, A. Federico, A. Ciccodicola, and V. Costa, “Targeting metabolism by B-raf inhibitors and diclofenac restrains the viability of BRAF-mutated thyroid carcinomas with Hif-1α-mediated glycolytic phenotype,” British Journal of Cancer, vol. 129, no. 2, p. 249, May 2023. [CrossRef]
- F. Rascio et al., “The Pathogenic Role of PI3K/AKT Pathway in Cancer Onset and Drug Resistance: An Updated Review,” Cancers, vol. 13, no. 16. Multidisciplinary Digital Publishing Institute, p. 3949, Aug. 05, 2021. [CrossRef]
- L. Wang, T. Yi, M. Kortylewski, D. M. Pardoll, D. Zeng, and H. Yu, “IL-17 can promote tumor growth through an IL-6–Stat3 signaling pathway,” The Journal of Experimental Medicine, vol. 206, no. 7, p. 1457, Jun. 2009. [CrossRef]
- V. Krajka-Kuźniak, M. Belka, and K. Papierska, “Targeting STAT3 and NF-κB Signaling Pathways in Cancer Prevention and Treatment: The Role of Chalcones,” Cancers, vol. 16, no. 6. Multidisciplinary Digital Publishing Institute, p. 1092, Mar. 08, 2024. [CrossRef]
- J. Liu, X.-F. Geng, J. Hou, and G. Wu, “New insights into M1/M2 macrophages: key modulators in cancer progression,” Cancer Cell International, vol. 21, no. 1. BioMed Central, Jul. 21, 2021. [CrossRef]
- Tanaka T, Narazaki M, Kishimoto T. Interleukin (IL-6) Immunotherapy. Cold Spring Harbor Perspectives in Biology 2017;10. [CrossRef]
- Harmer D, Falank C, Reagan MR. Interleukin-6 Interweaves the Bone Marrow Microenvironment, Bone Loss, and Multiple Myeloma. Frontiers in Endocrinology 2019;9. [CrossRef]
- Song D, Lan J, Chen Y, Liu A, Wu Q, Zhao C, et al. NSD2 promotes tumor angiogenesis through methylating and activating STAT3 protein. Oncogene 2021;40:2952. [CrossRef]
- Li W, Tian W, Yuan G, Deng P, Sengupta D, Cheng Z, et al. Molecular basis of nucleosomal H3K36 methylation by NSD methyltransferases. Nature 2020;590:498. [CrossRef]
- Liu Q, Wang M. Histone lysine methyltransferases as anti-cancer targets for drug discovery. Acta Pharmacologica Sinica 2016;37. [CrossRef]
- Gao B, Liu X, Li Z, Zhao L, Pan Y. Overexpression of EZH2/NSD2 Histone Methyltransferase Axis Predicts Poor Prognosis and Accelerates Tumor Progression in Triple-Negative Breast Cancer. Frontiers in Oncology 2021;10. [CrossRef]
- Mehranzadeh E, Crende O, Badiola I, García-Gallastegui P. What Are the Roles of Proprotein Convertases in the Immune Escape of Tumors? Biomedicines 2022;10:3292. [CrossRef]
- Pratheeshkumar P, Siraj AK, Padmaja D, Parvathareddy SK, Diaz R, Thangavel S, et al. Overexpression of the pro-protein convertase furin predicts prognosis and promotes papillary thyroid carcinoma progression and metastasis through RAF/MEK signaling. Molecular Oncology 2023;17:1324. [CrossRef]
- Cevenini A, Orrù S, Mancini A, Alfieri A, Buono P, Imperlini E. Molecular Signatures of the Insulin-Like Growth Factor 1-Mediated Epithelial-Mesenchymal Transition in Breast, Lung and Gastric Cancers. International Journal of Molecular Sciences 2018;19:2411. [CrossRef]
- Ianza A, Sirico M, Bernocchi O, Generali D. Role of the IGF-1 Axis in Overcoming Resistance in Breast Cancer. Frontiers in Cell and Developmental Biology 2021;9. [CrossRef]
- Zhou B, Gao S. Pan-Cancer Analysis of FURIN as a Potential Prognostic and Immunological Biomarker. Frontiers in Molecular Biosciences 2021;8. [CrossRef]
- Fu J, Bassi DE, Zhang J, Li T, Nicolas É, Klein-Szanto AJ. Transgenic Overexpression of the Proprotein Convertase Furin Enhances Skin Tumor Growth. Neoplasia 2012;14:271. [CrossRef]
- Bassi D, Cicco RL de, Mahloogi H, Zucker S, Thomas G, Klein-Szanto AJ. Furin inhibition results in absent or decreased invasiveness and tumorigenicity of human cancer cells. Proceedings of the National Academy of Sciences 2001;98:10326. [CrossRef]
- Seong GJ, Hong S, Jung S, Lee JJ, Lim E, Kim SJ, et al. TGF-beta-induced interleukin-6 participates in transdifferentiation of human Tenon’s fibroblasts to myofibroblasts. PubMed 2009.
- Declercq J, Brouwers B, Pruniau VPEG, Stijnen P, Tuand K, Meulemans S, et al. Liver-Specific Inactivation of the Proprotein Convertase FURIN Leads to Increased Hepatocellular Carcinoma Growth. BioMed Research International 2015;2015:1. [CrossRef]
- He Z, Khatib A, Creemers JWM. Loss of Proprotein Convertase Furin in Mammary Gland Impairs proIGF1R and proIR Processing and Suppresses Tumorigenesis in Triple Negative Breast Cancer. Cancers 2020;12:2686. [CrossRef]
- Werner H, Meisel-Sharon S, Bruchim I. Oncogenic fusion proteins adopt the insulin-like growth factor signaling pathway. Molecular Cancer 2018;17. [CrossRef]
- Ercetin E, Richtmann S, Martínez-Delgado B, Gómez-Mariano G, Wrenger S, Korenbaum E, et al. Clinical Significance of SERPINA1 Gene and Its Encoded Alpha1-antitrypsin Protein in NSCLC. Cancers 2019;11:1306. [CrossRef]
- Izaguirre G, Arciniega M, Quezada A. Specific and Selective Inhibitors of Proprotein Convertases Engineered by Transferring Serpin B8 Reactive-Site and Exosite Determinants of Reactivity to the Serpin α1PDX. Biochemistry 2019;58:1679. [CrossRef]
- A. Tissent, N. Habti, F. Sadiq, N. El Amrani, N. Benchemsi, Production d'un réactif monoclonal anti-B humain pour la détection des groupes sanguins ABO,Immuno-analyse & Biologie Spécialisée,Volume 22, Issue 1, 2007, Pages 68-71,ISSN 0923-2532. [CrossRef]
- K. J. Livak and T. D. Schmittgen, “Analysis of Relative Gene Expression Data Using Real-Time Quantitative PCR and the 2−ΔΔCT Method,” Dec. 01, 2001, Elsevier BV. [CrossRef]
- A. Karadagi et al., “Exogenous alpha 1-antitrypsin down-regulates SERPINA1 expression,” PLoS ONE, vol. 12, no. 5, May 2017. [CrossRef]
- D. A. Dean, B. S. Dean, S. Müller, and L. C. Smith, “Sequence Requirements for Plasmid Nuclear Import,” Experimental Cell Research, vol. 253, no. 2, p. 713, Dec. 1999. [CrossRef]
- J. Vacik, B. S. Dean, W. E. Zimmer, and D. A. Dean, “Cell-specific nuclear import of plasmid DNA,” Gene Therapy, vol. 6, no. 6, p. 1006, Jun. 1999. [CrossRef]
- J. Y. Qin et al., “Systematic Comparison of Constitutive Promoters and the Doxycycline-Inducible Promoter,” PLoS ONE, vol. 5, no. 5, May 2010. [CrossRef]
- C. A. Stuart, R. T. Meehan, L. S. Neale, N. M. Cintrón, and R. W. Furlanetto, “Insulin-Like Growth Factor-I Binds Selectively to Human Peripheral Blood Monocytes and B-Lymphocytes*,” The Journal of Clinical Endocrinology & Metabolism, vol. 72, no. 5, p. 1117, May 1991. [CrossRef]
- Y. Ma, W. Fan, S.-M. Rao, G. Li, Z.-Y. Bei, and S. Xu, “Effect of Furin inhibitor on lung adenocarcinoma cell growth and metastasis,” Cancer Cell International, vol. 14, no. 1, May 2014. [CrossRef]
- D. Farhat et al., “Lipoic acid decreases breast cancer cell proliferation by inhibiting IGF-1R via furin downregulation,” British Journal of Cancer, vol. 122, no. 6, p. 885, Jan. 2020. [CrossRef]
- D. Bassi, H. Mahloogi, R. L. de Cicco, and A. J. Klein-Szanto, “Increased Furin Activity Enhances the Malignant Phenotype of Human Head and Neck Cancer Cells,” American Journal Of Pathology, vol. 162, no. 2, p. 439, Feb. 2003. [CrossRef]
- T. Basu, H. Bertrand, N. Karantzelis, A. Gründer, and H. L. Pahl, “Pharmacological Inhibition of Insulin Growth Factor-1 Receptor (IGF-1R) Alone or in Combination With Ruxolitinib Shows Therapeutic Efficacy in Preclinical Myeloproliferative Neoplasm Models,” HemaSphere, vol. 5, no. 5, Apr. 2021. [CrossRef]
- J. Tsui, S. Qi, S. Perrino, M. Leibovitch, and P. Brodt, “Identification of a Resistance Mechanism to IGF-IR Targeting in Human Triple Negative MDA-MB-231 Breast Cancer Cells,” Biomolecules, vol. 11, no. 4, p. 527, Apr. 2021. [CrossRef]
- J. Chen et al., “IL-6: The Link Between Inflammation, Immunity and Breast Cancer,” Frontiers in Oncology, vol. 12. Frontiers Media, Jul. 18, 2022. [CrossRef]
Figure 1.
JP7pSer- (A) and JP7pSer+ (B) cells observed under a microscope at 200x magnification. The majority of the cells under 490 nm excitation emits the green fluorescence of the GFP protein. Scale 200µm.
Figure 1.
JP7pSer- (A) and JP7pSer+ (B) cells observed under a microscope at 200x magnification. The majority of the cells under 490 nm excitation emits the green fluorescence of the GFP protein. Scale 200µm.
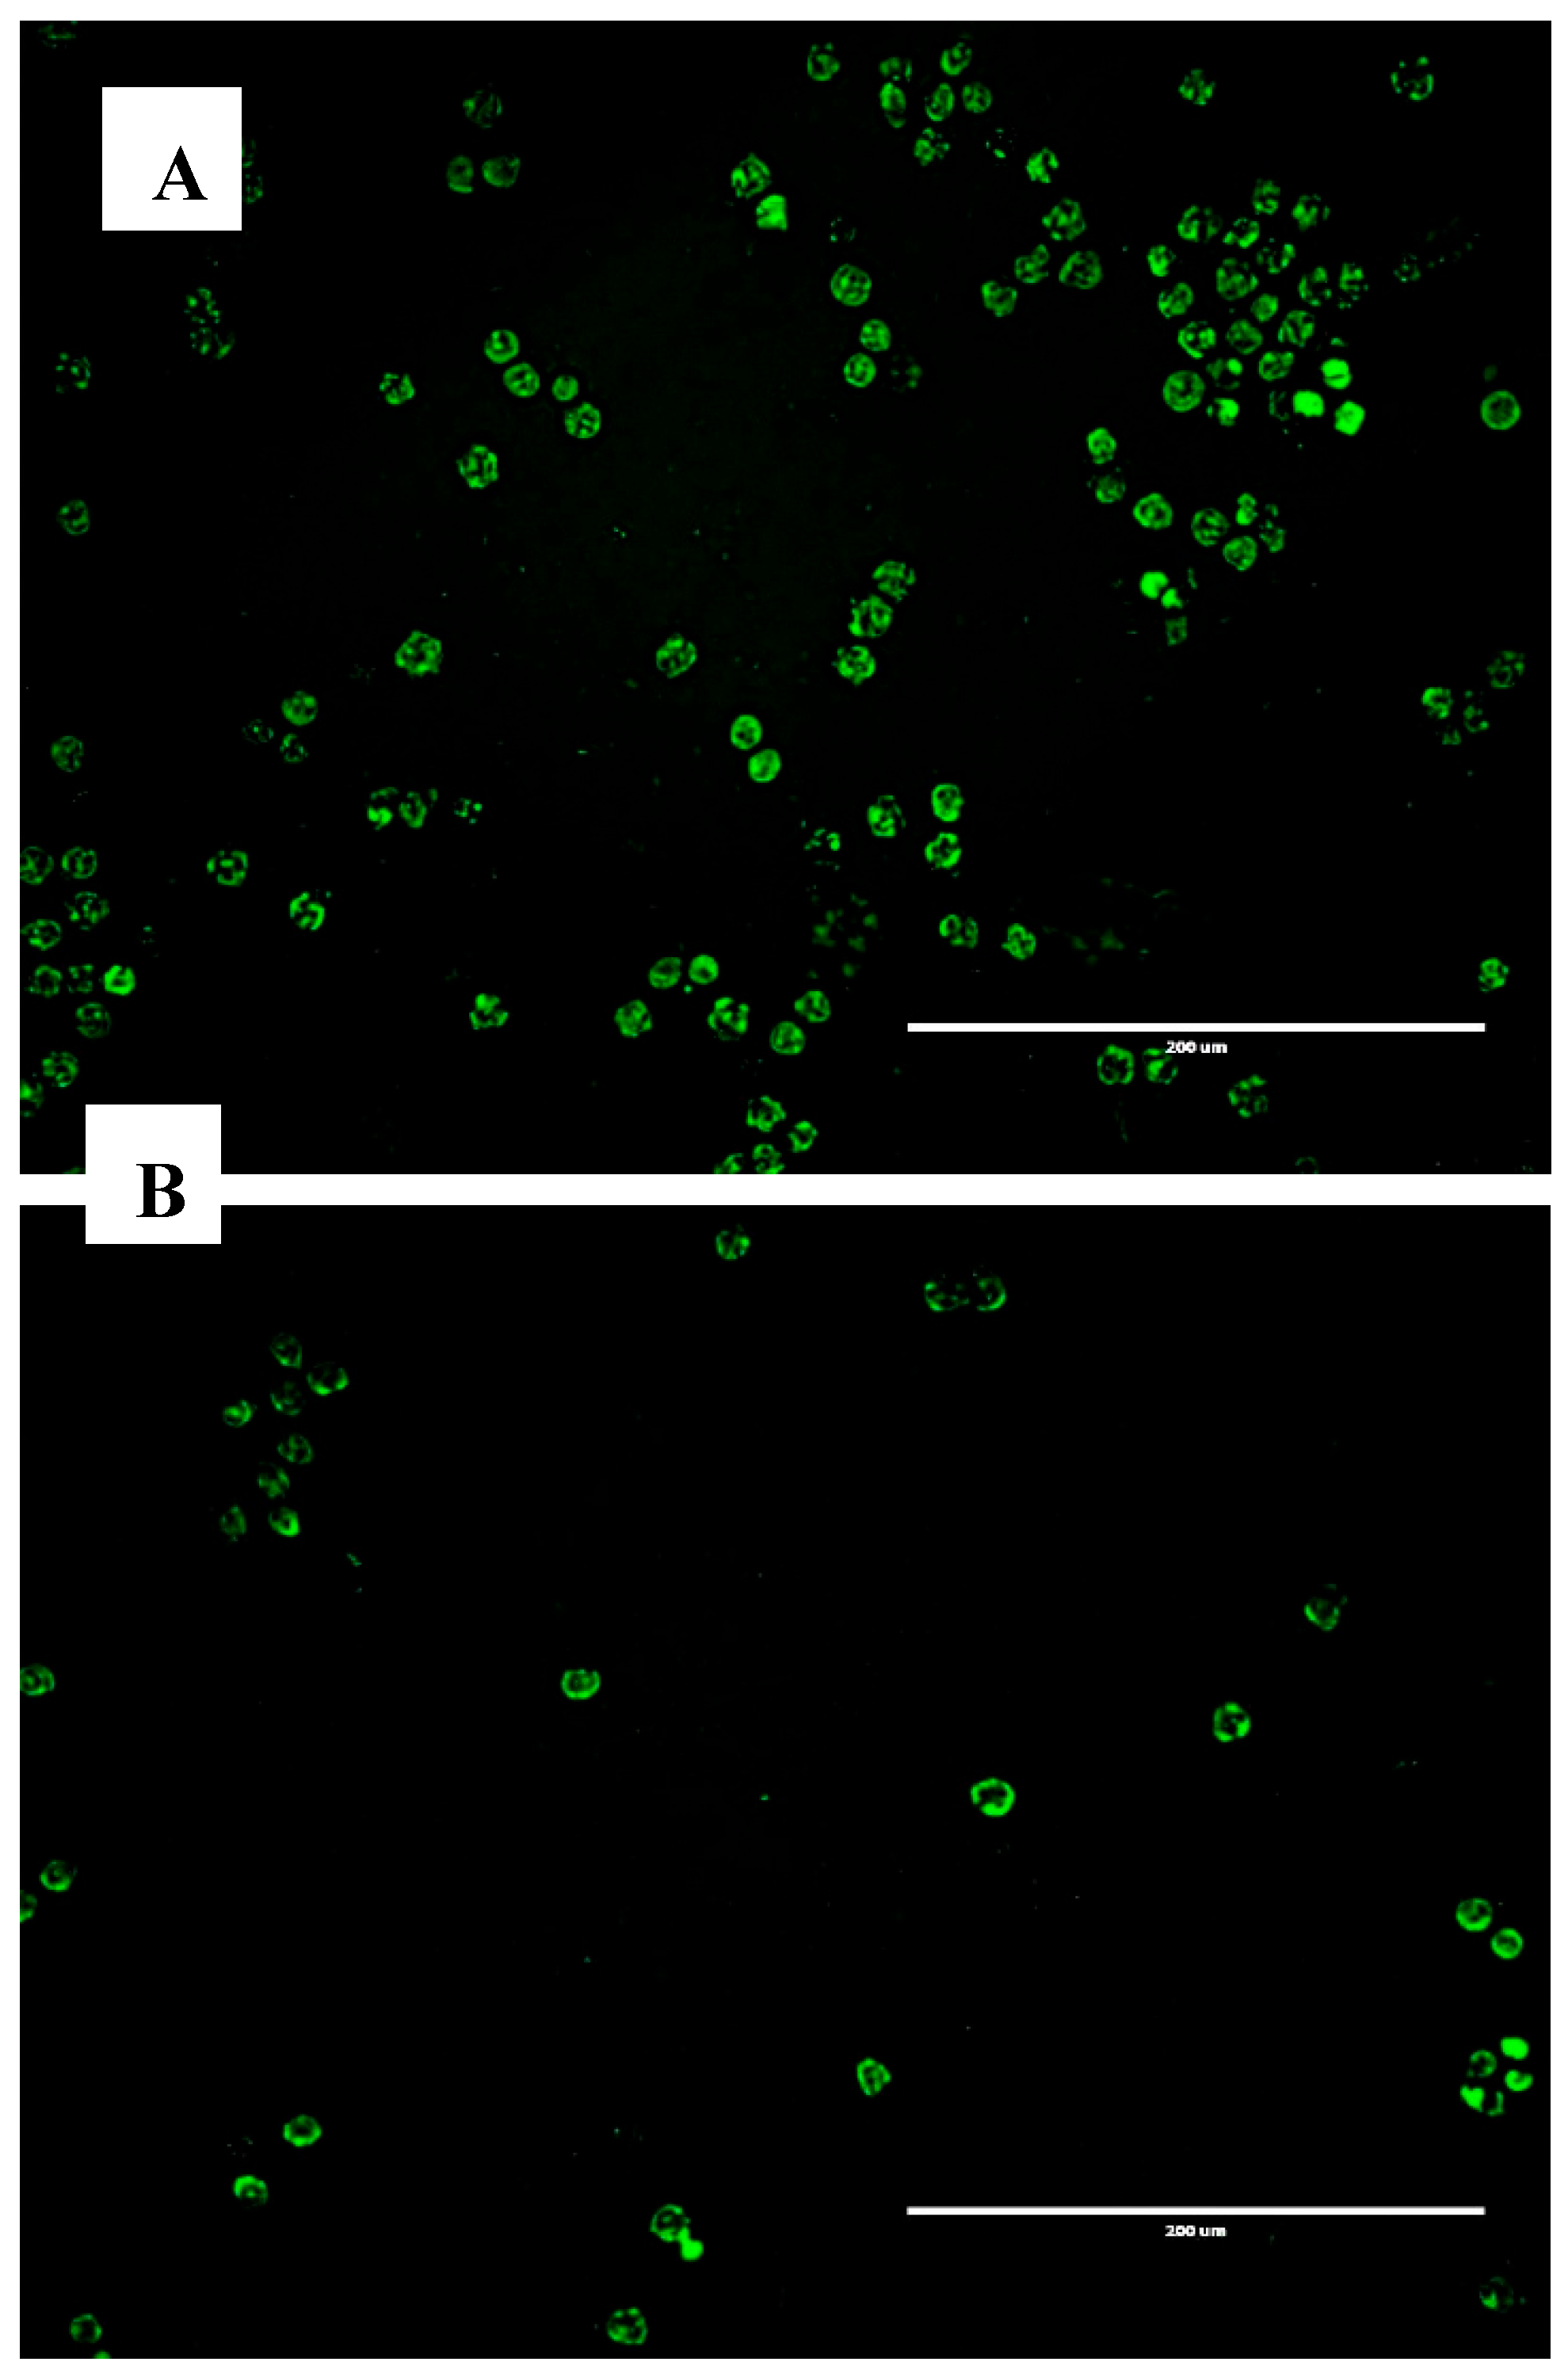
Figure 2.
Relative expression of the SERPINA-1 gene in JP7pSer- and JP7pSer+ cells referred to the expression of Beta-actin housekeeping gene. Data are mean ± SD of at least three independent experiments and significant differences between different groups were shown as **** p-value < 0.0001.
Figure 2.
Relative expression of the SERPINA-1 gene in JP7pSer- and JP7pSer+ cells referred to the expression of Beta-actin housekeeping gene. Data are mean ± SD of at least three independent experiments and significant differences between different groups were shown as **** p-value < 0.0001.
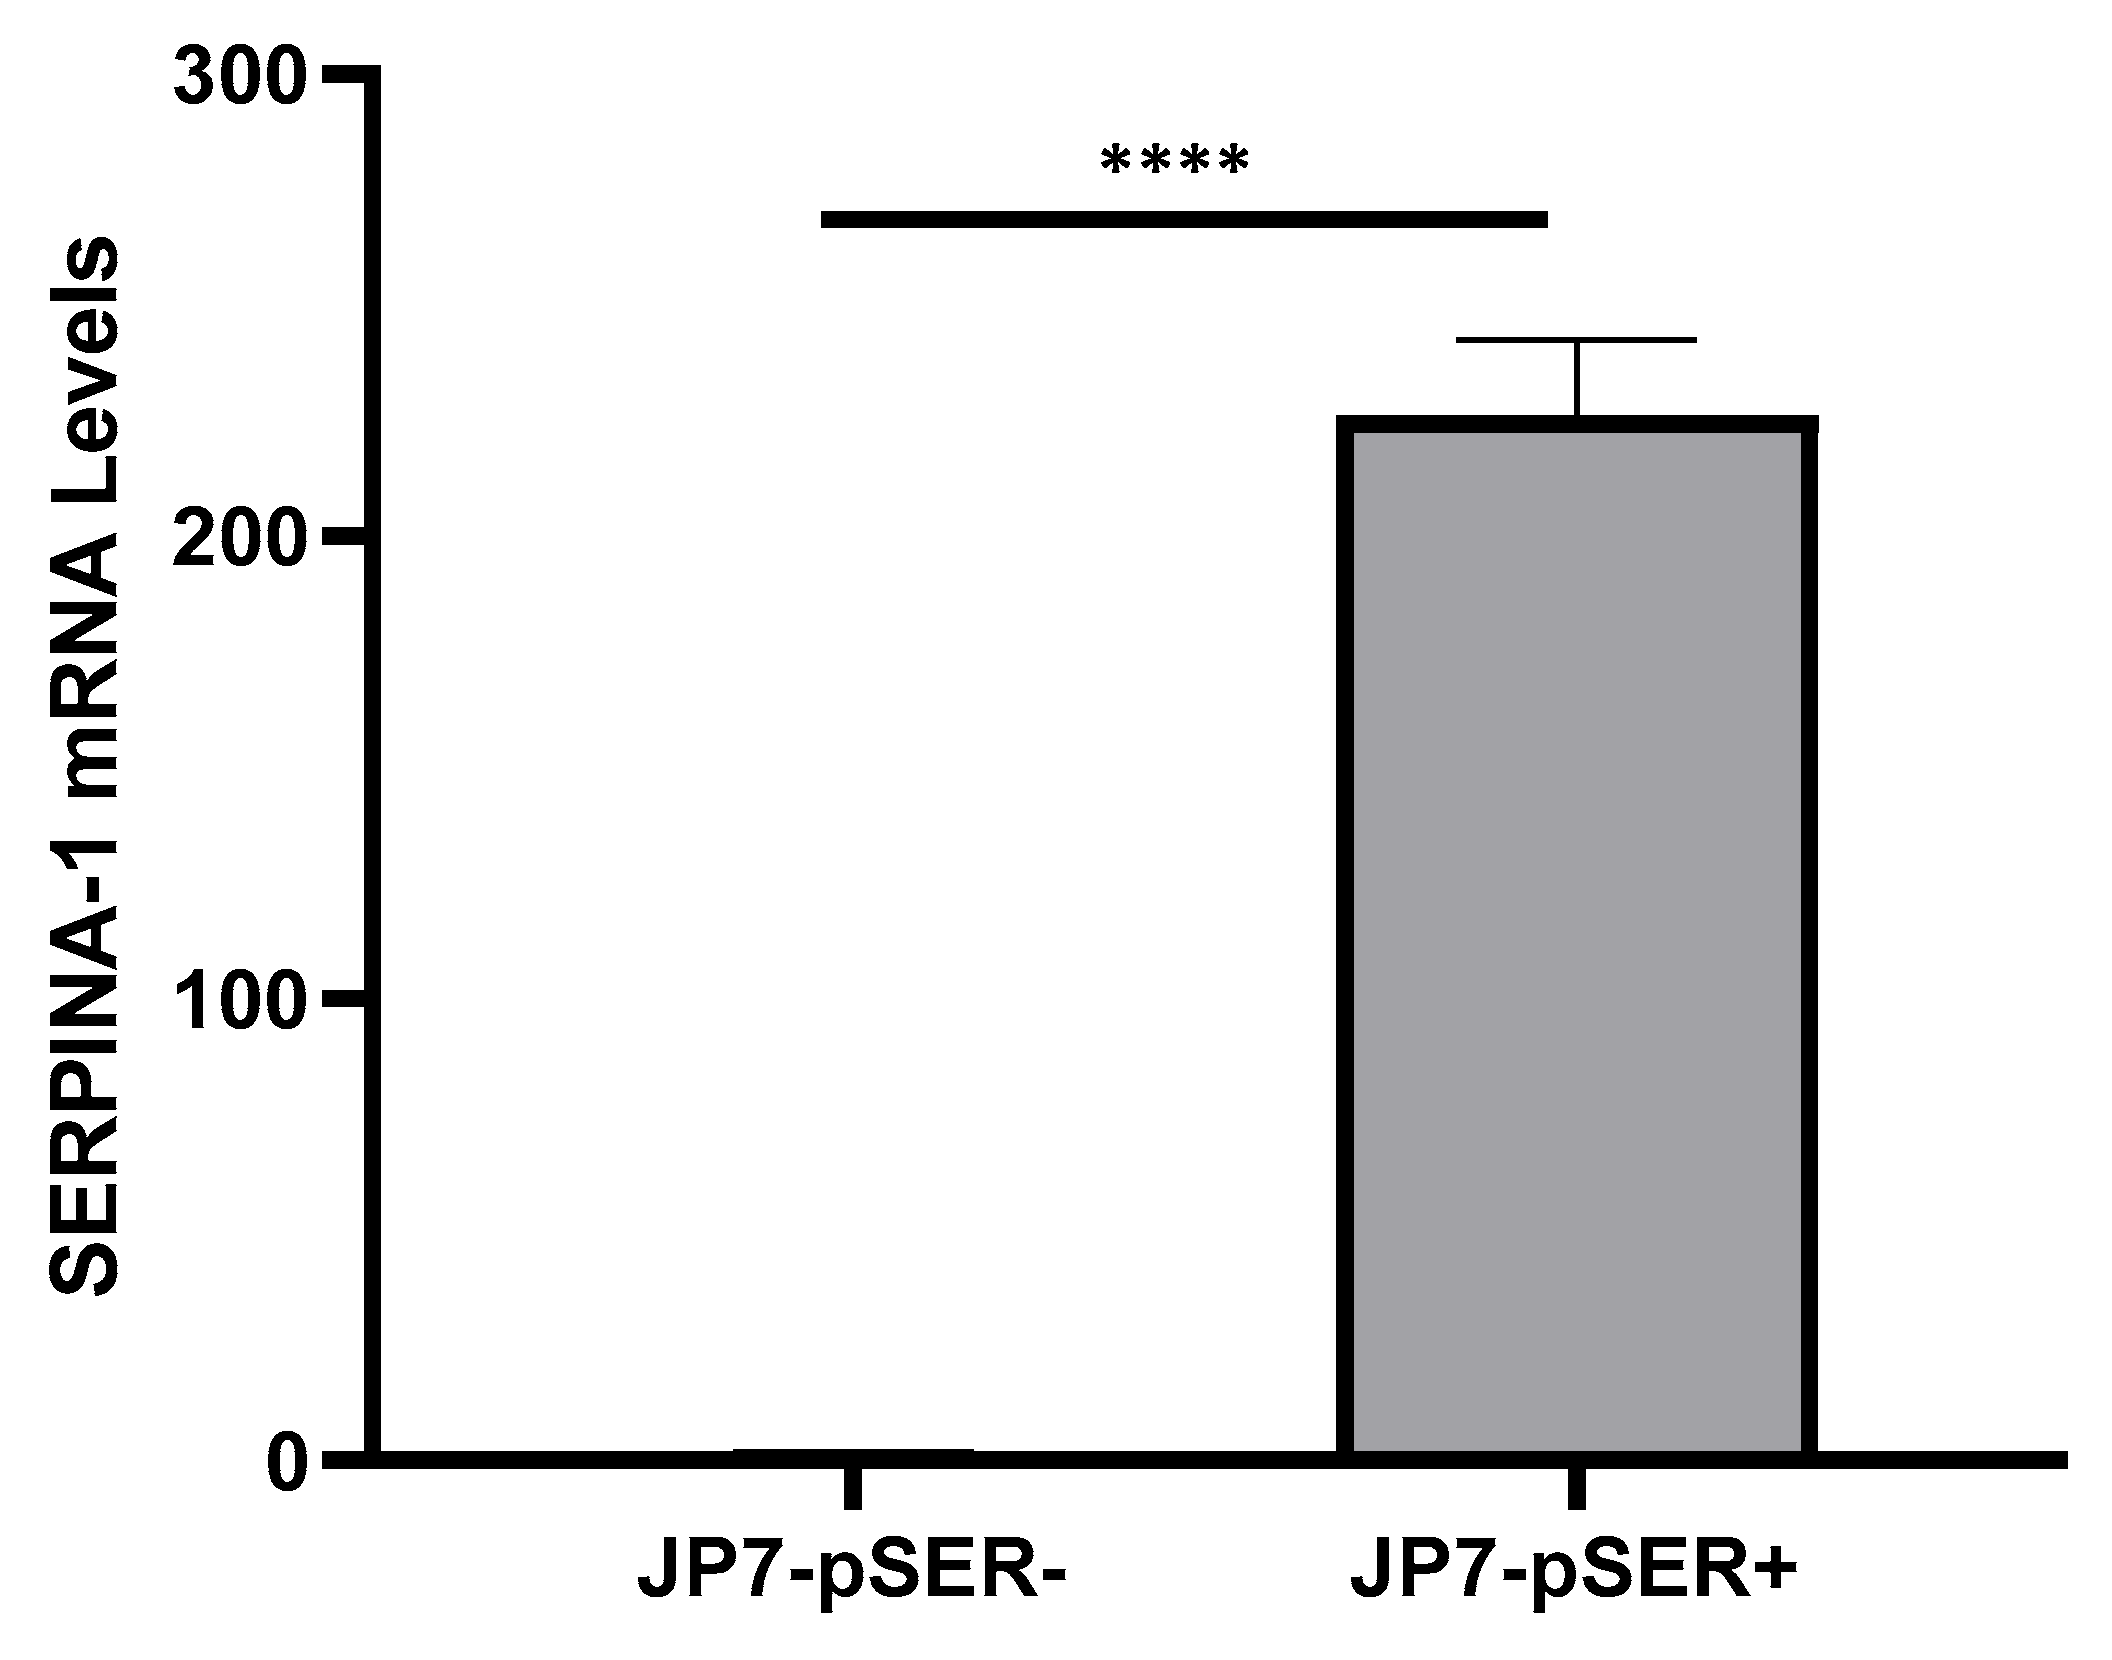
Figure 3.
(A) The proliferation of 20x103 cells/well of JP7pSer+ or JP7pSer- evaluated by the colorimetric Trypan blue method. (B) The proliferation of 5x10³ cells/well of the two cell lines, measured by enzymatic method (MTT). O.D: Optical density. Data are mean ± SD of at least three independent experiments and significant differences between different groups with p < 0.05 for both experiments.
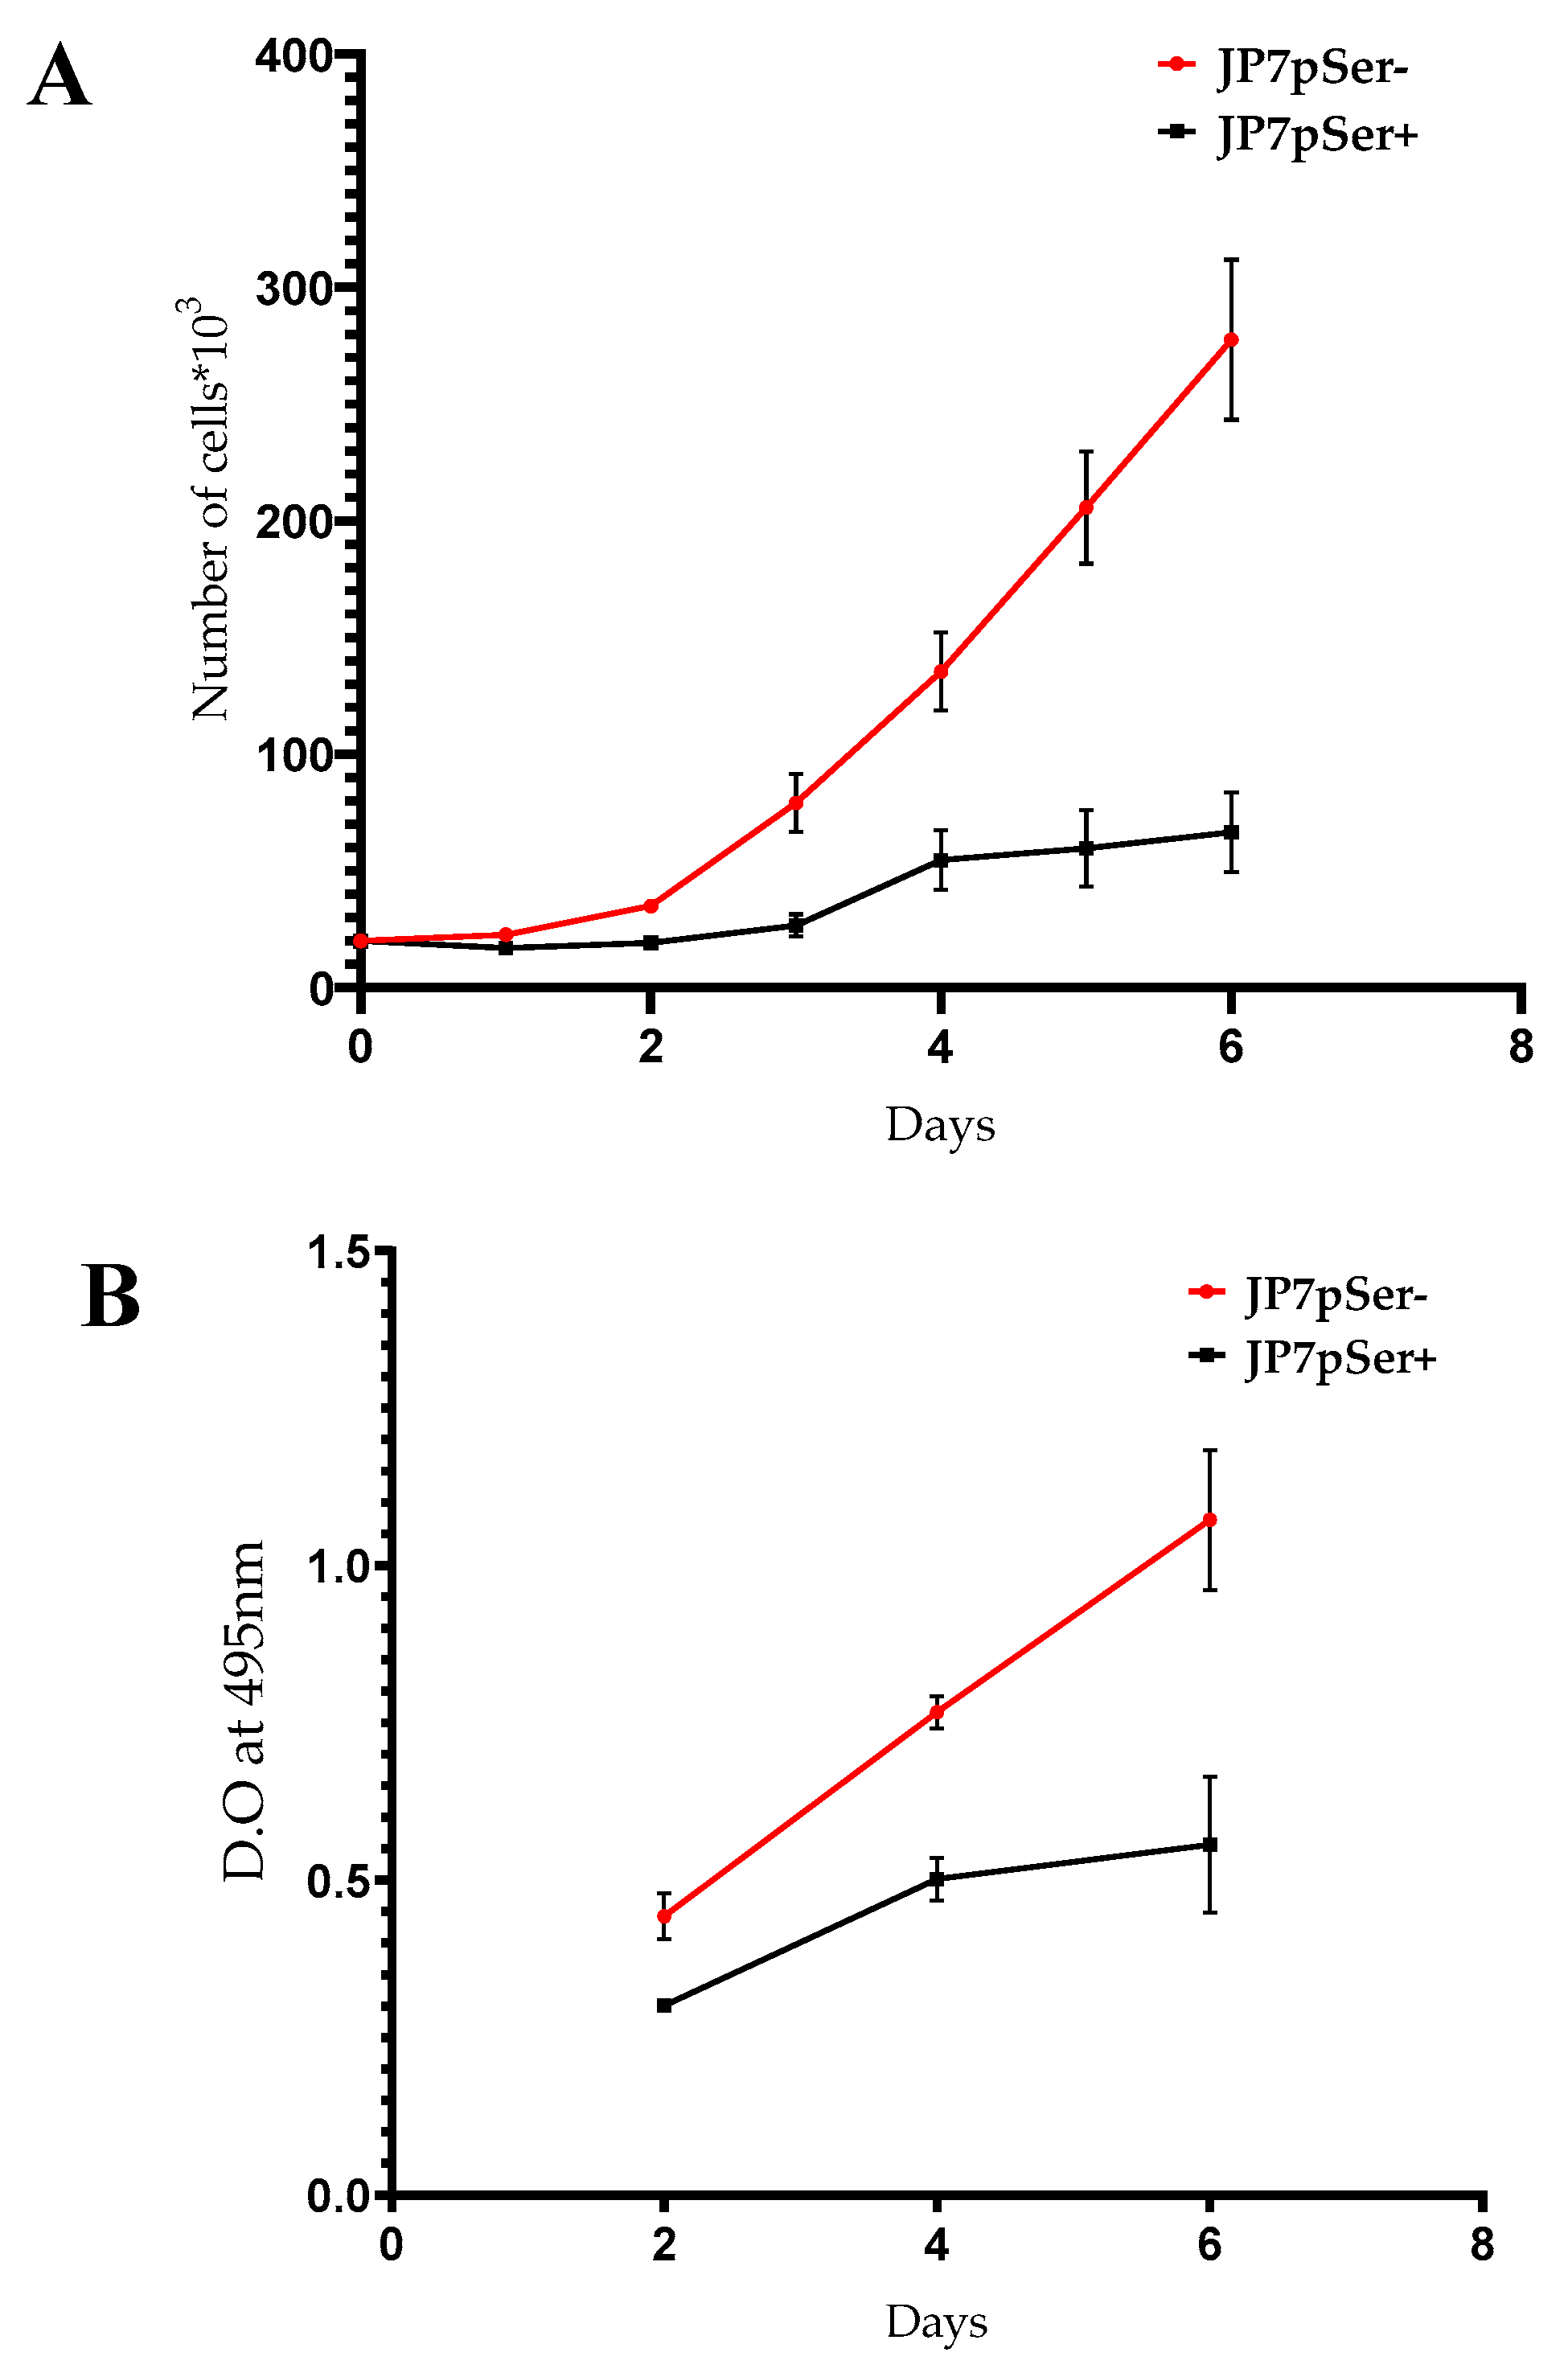
Figure 4.
Kinetics of the Furin, Il-6 and NSD2 gene expression measured by qRT-PCR in the JP7pSer+ line referred to that of the control line JP7pSer-. Data are mean ± SD of at least three independent experiments. Furin : Y = -0,04386X + 4,908 ; R² = 0,7251 ; r = -0.85 ∈ CI95 : p=0.0001. IL-6 : Y = -0,02834X + 3,404 ; R²= 0,7463 ; r = - 0,86∈ CI95 : p=0.0001. NSD2 : Y = -0,01150X + 1,661 ; R² = 0,6295 ; r = - 0,79∈ CI95 : p=0.0004.
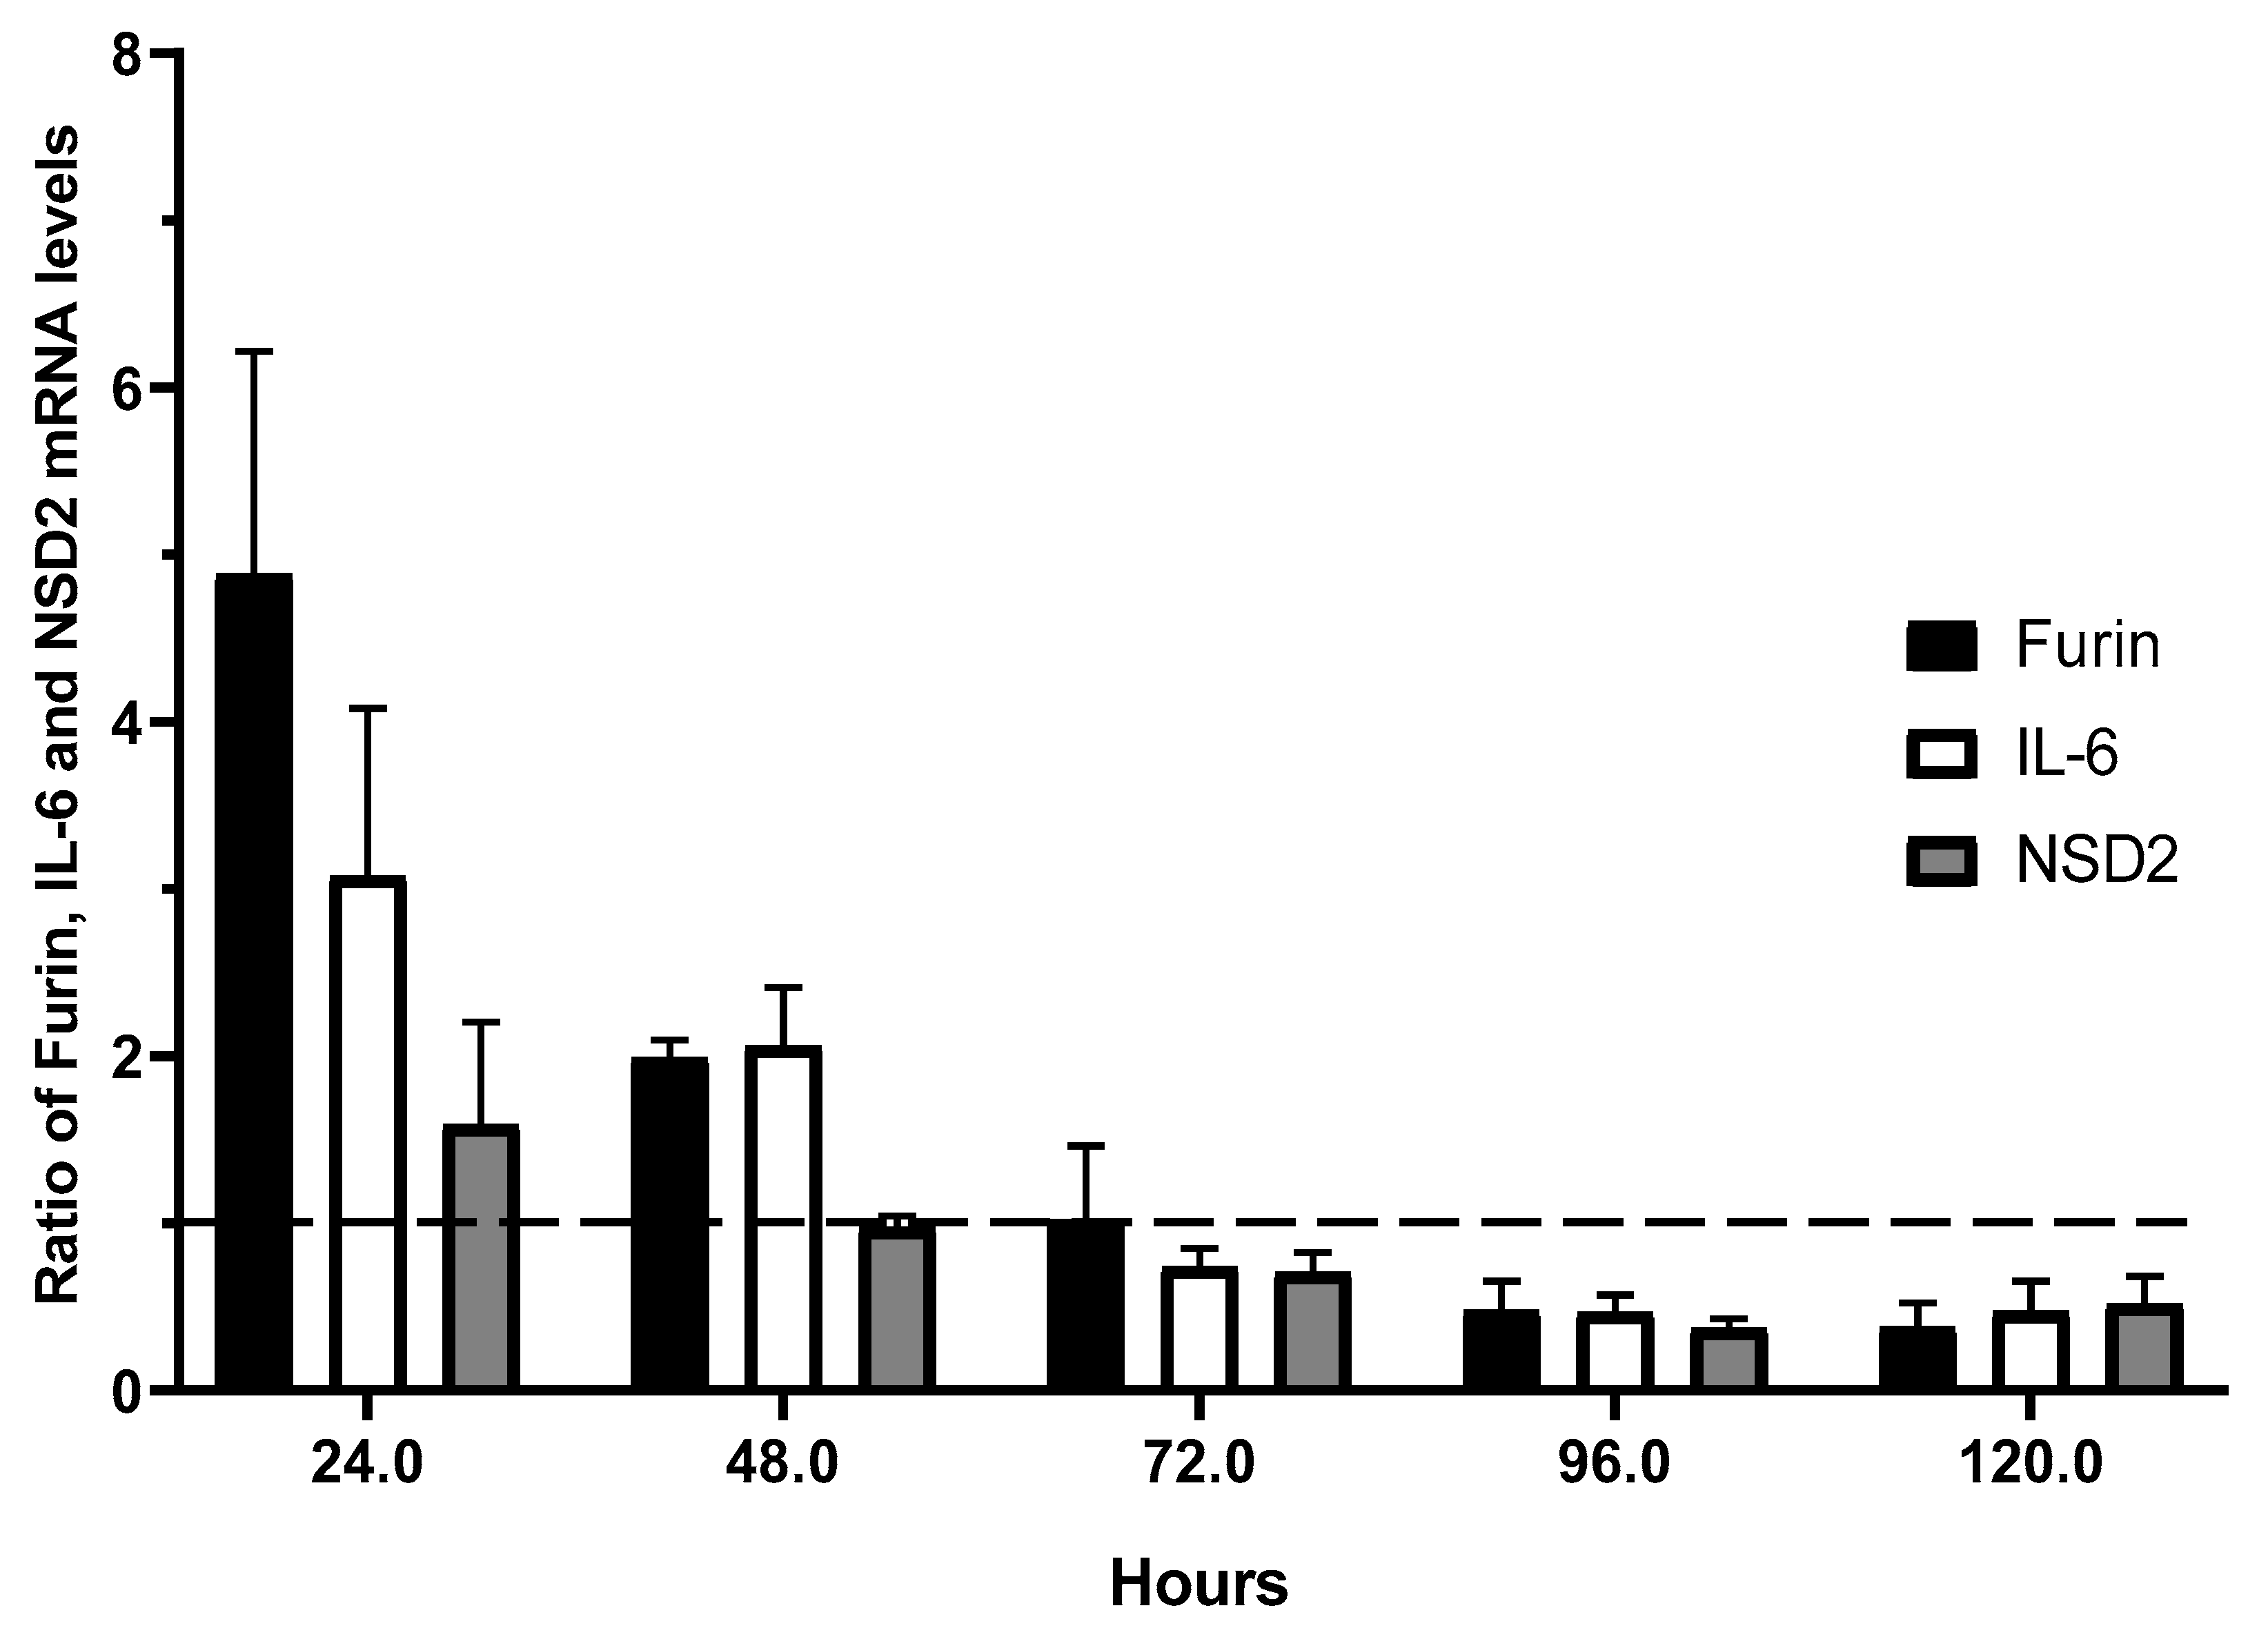
Figure 5.
Graphs of one of the three flow cytometry measurements analysis of membrane expression of IGF-1R by JP7pSer- (A) Vs JP7pSer+ (B) cells, and fluorescence intensity of JP7pSer- (C) Vs JP7pSer+ (D). Mean fluorescence intensity (MFI) was calculated from the three measurements (E), and the average MFI was 278.33 AU for JP7pSer- cells with a CI99: [272.48; 284.17], and an average MFI of 209.33 for JP7pSer+ cells with a CI99: [177.31; 241.34]. The **p-value < 0.01, with a significance threshold of 0.05.
Disclaimer/Publisher’s Note: The statements, opinions and data contained in all publications are solely those of the individual author(s) and contributor(s) and not of MDPI and/or the editor(s). MDPI and/or the editor(s) disclaim responsibility for any injury to people or property resulting from any ideas, methods, instructions or products referred to in the content. |
© 2025 by the authors. Licensee MDPI, Basel, Switzerland. This article is an open access article distributed under the terms and conditions of the Creative Commons Attribution (CC BY) license (http://creativecommons.org/licenses/by/4.0/).
Copyright: This open access article is published under a Creative Commons CC BY 4.0 license, which permit the free download, distribution, and reuse, provided that the author and preprint are cited in any reuse.


