
Submitted:
06 July 2025
Posted:
08 July 2025
You are already at the latest version
Preprints on COVID-19 and SARS-CoV-2
Abstract
Colonization of Legionella spp. in engineered water systems constitutes a major public health threat. In this study, a six-year environmental surveillance (2020–2025) of Legionella colonization in five different types of facilities in Crete, Greece, is presented, including hotels, passenger ships, and healthcare facilities with primary healthcare facilities, public hospitals, and private clinics. A total of 1,081 water samples were collected and analyzed, with the overall positivity calculated using culture-based methods. Only 16.46% of the samples exceeded the regulatory limit (>10³ CFU/L) in the total sample, with 44.59% overall Legionella positivity. Colonization by facility category showed higher rates in primary healthcare facilities with 85.96%, followed by public hospitals with 46.36%, passenger ships with 36.93%, and hotels with 38.08%, and finally private clinics. The association of environmental risk factors with Legionella positivity revealed a strong effect at hot water temperatures <50°C (RR = 2.05) and free chlorine residuals <0.2 mg/L (RR = 2.22) (p < 0.0001). Serotyping analysis revealed primarily an overall dominance of serogroups 2-15 of L. pneumophila; nevertheless, serogroup 1 was particularly prevalent in hospitals, passenger ships, and hotels. Based on these findings, the requirement for continuous environmental monitoring and risk management plans tailored to each facility with preventive thermochemical controls is highlighted. Finally, operational disruptions such as those experienced during the COVID-19 pandemic, especially in primary care facilities and marine systems, require special attention.
Keywords:
Legionella spp.
; Environmental surveillance
; Water safety plans
; Healthcare facilities
; Passenger ships
; Hotels
; Thermochemical disinfection
; COVID-19 pandemic
; Risk assessment
1. Introduction
Water distribution systems are important parts of public infrastructure because they provide clean drinking water and help stop the spread of waterborne diseases [1,2,3]. Nonetheless, under certain physicochemical and operational conditions, these engineered systems can unintentionally become breeding grounds for opportunistic pathogens like Legionella spp. (especially L. pneumophila), which are gram-negative bacteria that cause Legionnaires' disease, a severe form of atypical pneumonia that is very serious and causes a lot of illness and death, especially in older people and people with weakened immune systems [4,5,6,7,8,9]. According to the ECDC Legionnaires' Disease Annual Epidemiological Report for 2021, 29 countries reported 10,723 cases, of which 10,004 (93%) were confirmed [10]. The rate of notifications per 100,000 people increase to 2.4, which is higher than any other year that was looked at. Italy, France, Spain, and Germany together made up 75% of the recorded cases, even though their populations only made up about 50% of the EU/EEA population. In total, 704 of the 8,054 cases with a known outcome ended in death (9%) [11].
Legionella loves warm water and is quite good at living in constructed systems with stagnant water, not enough treatment, and the right temperature ranges [12]. Biofilms and host protozoa allow it to live longer and spread faster. Outbreaks often happen in places with high risk, such hospitals, hotels, and ships, because their plumbing is complicated, they don't use water all the time, and they have different ways of keeping things clean [13,14,15,16,17,18].
Studies have shown that water systems in buildings like hotels, hospitals, and ships are quite likely to be colonized by Legionella, making them high-risk potent places for Legionella colonization [19,20,21,22,23,24,25,26,27]. For instance, Alexandropoulou et al. found that L. pneumophila was quite common in Greek healthcare facilities and that temperature and system design affected its spread [20]. Naher also found that hotel hot water systems are high-risk places, and he pointed to bad temperature management and the lack of water safety plans (WSPs) as two of the main reasons why [21]. In our previous work, Papadakis et al. examined hotel water systems across Crete's island. Between 2000 and 2019, it was observed that about 63% of the hotels inspected, after a case notification of Legionnaires' disease, were found to be colonized with Legionella spp [22]. The study also highlighted the important things that need to be done to manage water distribution systems to remain clean and disinfected. One of these was the successful implementation of WSPs to improve hotel water supply and sanitation systems.
Long-term building closures and less water use during the COVID-19 epidemic made it easy for Legionella to grow [23,24,28,29]. Nationwide lockdowns were implemented in March 2020, November 2020 and January 2021, while in 2022 the measures were relaxed. These periods were characterized by limited access to healthcare and disorientation from the normal maintenance of public infrastructure, including water systems. It is therefore likely that the measures have had an impact on water use and stagnation patterns, particularly in the health and hospitality sectors [30]. Rhoads and Hammes pointed out that microbial growth increased during the lockdown-related standstill, which shows how important flushing measures can be [31]. During the pandemic, Kunz et al. sawed that U.S. hotels and motels were less likely to follow Legionella control strategies, which made the risk of outbreaks even higher [32].
Public health authorities are increasingly calling for integrated control measures, like WSPs that use Hazard Analysis and Critical Control Points (HACCP) principles, to help reduce the risk of legionellosis in complex healthcare and hospitality systems [33,34] and have demonstrated effectiveness in reducing Legionella risk in complex healthcare and hospitality systems [35,36]. Disinfection strategies involving the application of agents such as monochloramine, chlorine dioxide, and hydrogen peroxide have demonstrated efficacy in reducing Legionella colonization, particularly when embedded within comprehensive monitoring and maintenance frameworks [37,38]. Nevertheless, the dynamics of Legionella colonization remain highly context-dependent, necessitating localized risk assessments that consider building design, usage patterns, and endemic microbiological profiles.
To the best of our knowledge, this is the first environmental surveillance study in Greece to systematically assess Legionella colonization trends across multiple high-risk facility types—including hospitals, outpatient clinics, hotels, and passenger ships—during and after the COVID-19 pandemic.
The present study aims to evaluate and compare Legionella spp. colonization levels across these diverse facilities on Crete's island from 2020 to 2025. The goal is to identify facility-specific risk factors and assess the impact of pandemic-related disruptions on water system hygiene, thereby informing future prevention strategies and water safety policy implementation in complex aquatic environments.
2. Materials and Methods
2.1. Study Design and Sample Collection
From March 2020 to March 2025, this multiparametric environmental monitoring study was conducted covering the entire territory of the Region of Crete, Greece. The study was conducted by the Public Health Authority of the Region of Crete in collaboration with the Regional Public Health Laboratory and the Department of Clinical Microbiology and Microbial Pathogenesis. The aim of this study was to assess the prevalence of Legionella spp. colonization and risk factors in water distribution systems in complex infrastructures used by the public.
The sampling included five categories of facilities: (1) hotels, accommodation facilities; (2) passenger ships and three different health care facilities, including (3) primary care units; (4) public hospitals and (5) private clinics (Table 1). The five facility categories were selected on the basis of international guidelines from the European Center for Disease Prevention and Control (ECDC) and the World Health Organization (WHO), which classify healthcare facilities (hospitals, clinics, outpatient centers) and hospitality facilities (hotels, ships) as high-risk environments for Legionella propagation. In total, 41 facilities were included in the study, which were distributed as follows: 13 hotel units, 10 public hospitals, 6 primary care units, 6 passenger ships and 6 private clinics. The basic selection of facilities was carried out either (a) due to their inclusion in regular public health inspections and regional surveillance programs, or (b) after a reporting of a TALD case related to travel and identified through the European Legionnaires' Disease Surveillance Network (ELDSNet) (especially in hotels), or (c) as a random sampling carried out by public and environmental health officials of the Region of Crete for the needs of active surveillance following standardized procedures. In total, samples employed by the 41 different facilities were studied to ensure a wide spatial and typological distribution. to ensure a wide spatial and typological distribution. Supplementary Table S1 the annual distribution of samples by facility type for the monitoring period from 2020 to 2025 is showed. This allowed us to assess whether the temporal trends in Legionella positivity were influenced by the sampling intensity across years and facility categories.
The systematic sample collection included 1,081 water samples from multiple points in the water distribution network for each facility. The sampling points are listed in Table 1 and comprise municipal pipe inlets, water storage tanks and hot water boilers and heaters, terminal outlets (showers, faucets and taps in patient or visitor rooms), swimming pools and hot tubs, where applicable, and outlets proximal or peripheral to the facility’s primary water source. The strategy intentionally targeted high-risk nodes within the facility’s plumbing systems, with an emphasis on aerosol-generating outlets as well as known outlets based on temperature profiles or user reports associated with colonization. Their grouping based on sampling characteristics was direct vs. indirect flow paths; cold vs. hot water; proximal (close) vs. distal (far) outlet locations.
The samples were taken following international and European standards, namely ISO 5667-1:2020 and ISO 5667-1:2023 as well as the European Technical Guidelines for the Prevention, Control and Investigation of Infections Caused by Legionella spp. (ECDC) [39,40,41].
Briefly, the sample collection procedure was as follows: a sterile 1-liter container containing 20 mg of sodium thiosulfate was used to neutralize the presence of disinfectant residues. The samples were stored at a temperature of 5 ± 3 °C in shaded conditions, and their transport to the regional microbiology laboratory for analysis was carried out within 24 h under controlled conditions. The measurements of the physicochemical parameters were made directly on site using calibrated portable devices. Measurements included: Free residual chlorine concentration (mg/L), Water temperature (°C) after 2 min of rinsing, pH levels, Turbidity where applied, Sampling point type (direct vs. indirect; hot vs. cold; near vs. far), Facility metadata (disinfection method, capacity, water source, and presence or absence of a documented Water Safety Plan (WSP)).
These environmental parameters were measured on site at the time of sampling using calibrated portable instruments. For the analysis, these variables were categorized according to internationally accepted limits. Specifically for hot water <50°C, free chlorine <0.2mg/L and cold water >20°C.
The relationship between environmental exposure and temporal variation in Legionella colonization was studied by monitoring three key physicochemical parameters for each sample: hot water and old water temperature (°C) and free residual chlorine (mg/L). Annual noncompliance was measured and compared with the positivity rates to identify associations. These variables were also included in the multivariate logistic regression model to assess their independent predictive value during the surveillance period.
2.2. Microbiological Analysis
Microbiological testing for the detection and quantification of Legionella spp. from water samples was performed by culture according to the International Standard method ISO 11731:2017 [42].
Briefly, water samples were concentrated by filtration and re-suspended in Distilled Deionized water. A volume of the suspension (200 μL) was spread on (BCYE), Buffered Charcoal Yeast extract without l-cysteine (BCY), and Glycine Vancomycin Polymyxin Cycloheximide (GVPC) agar (Biomérieux, France). For the Petri dishes (Culture plates): (a) directly after filtration; (b) after incubation at 50 °C for 30 min and (c) after the addition of an acid buffer (0.2 mol/L solution of HCL, pH 2.2). The detection limit of the procedure was 50 CFU/L. The inoculated plates were incubated for up to 10 days at 36 ± 1 °C in a 2.5% CO₂ atmosphere with increased humidity. The suspected colonies were randomly chosen for subculture on BCY, BCYE and GVPC agar.
A matrix-assisted laser desorption ionization time-of-flight mass spectrometer (MALDI-TOF MS, Bruker Microflex LT) equipped with a micro-SCOUT ion source was used for the identification of individual Legionella colonies against its microbial database (v 3.1.2.0). Spectra were recorded using the flex Control software with the default parameters for optimization set by the manufacturer (Bruker Daltonics, Leipzig, Germany). For each spectrum, 240 laser shots were collected and analyzed (6 × 40 laser shots from 120 different positions of the target spot). All identifications were evaluated according to the manufacturer’s scoring scheme.
Acid and heat pretreatment steps were employed to reduce the background flora and enhance the Legionella recovery. The detection limit of the method was 50 CFU/L, allowing for reliable quantification within the regulatory action range. The confirmed colonies were further serotyped to distinguish L. pneumophila serogroups (especially SG1 vs. SG2–15) and identify non-pneumophila species, providing key epidemiological insights into pathogen virulence and potential disease risk.
2.3. Risk Assessment and Statistical Analysis
To better calculate the risk, we used two different approaches. The first one was in accordance with the recommendations of the European Legionnaires’ disease Surveil-lance Network (ELDSNet), at which the microbiological results of the water samples were analytically and statistically analyzed according to the number of Legionella bacteria in the water sample, which could represent a particular risk to human health. An insignificant risk was noted at ≤103 CFU/L, medium risk at >103 CFU/L but <104 CFU/L, and high risk at ≥104 CFU/L .
All statistical analyses were conducted using the IBM SPSS Statistics Version 30 statistical package, the Epi Info 2000 version 7.2.0.1 (Centers for Disease Control and Pre-vention, Atlanta, GA, USA) and the MedCalc relative risk calculator statistical software free online version [43,44,45]; Descriptive statistics included frequencies, proportions, and Wilson 95% confidence intervals. Relative Risks (RR) with 95% confidence intervals were calculated for key non-compliant conditions, and logistic regression was applied to identify independent predictors of positivity. The analyses were calculated to assess the categorical risk variables from the water distribution systems and faculty characteristics associated with the Legionellae-positive test results. Linear regression was used to explore trends and quantify associations between Legionella concentrations and physicochemical parameters. The results were considered statistically significant when the p value was <0.05 and highly significant when the p value was p <0.0001.
2.4. Multivariate Logistic Regression
A multivariate logistic regression model was developed to evaluate the independent predictors of Legionella spp. positivity (culture based, ≥50 CFU/L). Specifically, (a) the presence of Legionella spp. ≥50 CFU/L was used as the dependent variable and (b) facility type, sample type (hot vs. cold), sampling year, hot water temperature (<50°C vs. ≥50°C), and free residual chlorine (<0.2 mg/L vs. ≥0.2 mg/L) were used as independent variables.
Private clinics from the facility categories under study, the year 2020, cold water from the sample type, temperatures ≥50°C and ≥0.2 mg/L chlorine residual were selected as reference. The selection criteria were public health standards or the lowest observed risk: Among the facility types, private clinics had the lowest observed Legionella positivity rate, with zero high-positive samples. Next, 2020 was used as a reference value due to the lowest annual positivity, since it marks the beginning of the pandemic. In the sample types, the choice of cold water is necessary as it is generally associated with a lower risk of Legionella compared to hot water. Finally, the limits for the hot water temperature (≥50°C) and free residual chlorine (≥0.2mg/L) are standards for the WHO and ECDC and thus were selected as the protective reference levels. Odds ratios (ORs), 95% confidence intervals (CIs), and p-values were reported for all predictors. SPSS v30.0 and the MedCalc Relative Risk Calculator were used to conduct the analysis.
3. Results
3.1. Sampling Scope and Facility Comparison
Between 2020 and 2025, a total of 1081 water samples were collected at 5 high-risk facilities on Crete, namely public hospitals, private clinics, primary healthcare units, hotels and passenger ships (Table 1). Most samples were performed in public hospitals (40.70%, 440 samples), which comprise complex and significant infrastructures, with elevated risks for Legionella colonization and possibly outbreak sites, according to the literature[46,47]. On the contrary, the other two healthcare facilities—primary healthcare units (114 samples) and private clinics (112 samples) – contribute around 12 % each. Finally, the sampling of hotels and passenger ships comprised 22 %, 239 samples, and 17%, 176 of the datasets, respectively. All facility types were sufficiently covered with water samples to ensure a profound comparative analysis.
The sampling strategy included 1,081 samples from several places of the internal water systems of each facility type, including municipal inlets, storage tanks, hot water heaters and boilers, taps that were close to and far away from the water source, and, if there were any, showers and recreational water systems like pools, saunas or jacuzzi (Table 1). Specifically, 600 (57.92%) samples came from direct outlets, and 436 (42.08%) came from indirect or distal plumbing locations. In terms of temperature division, 600 samples (55.50%) were from cold water systems and 481 samples (44.50%) were from hot water systems. This enabled a comprehension of the effect of temperature on Legionella colonization. Also, spatial stratification was used based on how far the water had to travel from the point of entry. A total of 66 samples (40.74%) were obtained from proximal (close) points and 96 samples (59.26%) from distal (far) points, which provided insights into the consequences of standstill and the potential for biofilm development.
3.2. Legionella Positivity and Temporal Trends
Out of 1,081 samples from all five types of facilities, 482 (44.59%) tested positive for Legionella spp. with concentration levels varying from 50 to more than 10,000 CFU/L. The positive results are listed in Table 2, divided into three groups according to: low concentration levels (<10³ CFU/L), medium (≥10³ to <10⁴ CFU/L), and high (≥10⁴ CFU/L). An enhanced positivity rate of samples was found for the primary healthcare units, with 85.96% testing positive and a large 20.17% placed into the high-risk category (≥10⁴ CFU/L). In contrast, public hospitals showed a lower overall positivity rate of 46.36%, with only 1.81% of the samples exceeding the higher threshold. Private clinics had the lowest overall positivity rate at 21.42%. No samples had more than 10⁴ CFU/L, and only 6.25% of them were in the medium-risk group level. Next, samples from passenger ships showed a positivity rate of 36.93%, with 6.25% of them exceeding the 10⁴ CFU/L threshold. Finally, hotels had a moderate positivity rate of 38.08%, and most of the positive samples were below the 10³ CFU/L threshold. Still, 10.04% were in the medium-risk range and 4.60% were over 10⁴ CFU/L. According to the European Drinking Water Directive (EU) 2020/2184, Legionella spp. concentrations equal to or surpassing 10³ CFU/L require immediate remedial actions [48]. Based on this standard, 178 samples (16.46%) from all types of facilities exceeded this legal limit.
Figure 1 shows the positivity rate on the legal limit threshold of ≥10³ CFU/L as a function of the different facility types. The primary healthcare units showed an enhanced level of contamination with 36.83% of total samples above the threshold, while a very moderate positivity rate was shown for public hospitals, at 17.94%, and hotels, at 14.64%. Passenger ships and private clinics showed a much lower level of contamination at 8.52% and a minimal positivity rate at 6.25%.
In order to elucidate further, the positivity rate for the surveillance of Legionella spp. for a six-year period between 2020 and 2025 was studied. The temporal analysis shown in Figure 2 shows a profound variation in the positivity rates of Legionella over the predetermined period. The positivity rate in 2020 was found to be 14.75%, referring to a period before the onset of the C0VID-19 pandemic. An abrupt increase was observed in 2021, with 58.82% positivity, followed by a sharp reduction in 2022 at 14.71%. In the following years 2023 and 2024, the positivity rates decreased gradually to 11.76% and 15.15%, respectively, with the standardization of the operating regulations. Nevertheless, in 2025, an almost 4-fold increase in the positivity rate at 57.53% is observed, which is comparable to the post-lockdown period. Furthermore, Table S1 presents the annual distribution of samples for the monitoring period from 2020 to 2025, to account for possible biased unequal sampling for each year in each facility type. In addition, to explore potential justifications for these temporal variations and recognize the environmental factors that contributed to the positive trends, the percentage of samples with thermal and chemical non-compliance was tracked annually and is further analyzed in section 3.4 (Figure 4).
Next, analysis of the sample types revealed a higher presence of Legionella species in the hot water systems than in the cold water systems. Table 3 summarizes the Legionella-positive samples by sample type and collection point. Overall, 252 samples tested positive out of 481 hot water samples in total, which is ascribed to 52.28%, whereas 230 samples tested positive in Legionella, at 47.42% among 600 cold water samples in total. For hot water samples, the positivity rates found a negligible difference between the direct outlets and indirect outlets, 50.71% and 50%, respectively. Nevertheless, the distal sampling points demonstrated a lower positivity rate at 48% than the proximal sampling points at 34.37%, potentially reflecting thermal decay and sediment buildup at the terminal points. For cold water samples, again a negligible difference between direct outlets and indirect outlets, while far away points showed a slightly lower positivity rate of 23.80% than the close points at 28%.
3.3. Serogroup Distribution and Facility Colonization Risks
To determine the distribution of Legionella species and serogroups for all facilities, 482 Legionella-positive samples were serotyped. As shown in Figure 3 and listed in Table 4, most isolates (65.35%) were serogroups 2–15 of L. pneumophila. Serogroup 1 of L. pneumophila, which is often associated with clinical diseases, accounted for 36.09% of the positive samples. Only 2.70% were associated with species other than pneumophila. Serogroup 3 (11.38%) was the dominant serogroup among the serogroups 2–15 of L. pneumophila. Next, serogroup 8 accounted for 7.49%, serogroup 6 covered 5.00%, serogroup 2 represented 1.57%, serogroup 7 represented 0.65%, serogroup 9 accounted for 0.37%, and serogroup 4 formed 0.19%. Public hospitals recorded the highest number of positive samples (204·42.32%), with the distribution of serogroups favoring sg2–15 (54.41%) over sg1 (46.56%). Out of 98 samples from the primary care units (20.33%), sg2–15 was the predominant type, constituting 81.63%. This suggests that the strains are spreading in the environment and may exhibit reduced pathogenicity. Next, passenger ships (13.49%) and hotels (18.88%) exhibited similar serogroup patterns, mainly consisting of sg2–15. In contrast, private clinics represented only 4.98% of all positive samples, with 70.83% of these classified as sg2–15. Non-pneumophila species were not detected.
L. pneumophila serogroup 1 was mainly found in public hospitals (95 isolates; 46.56% of positives in hospitals), followed by passenger ships (36.92%) and hotels (38.59%).
3.4. Temporal Evolution, Positivity Trends and Post-COVID Risk Profile
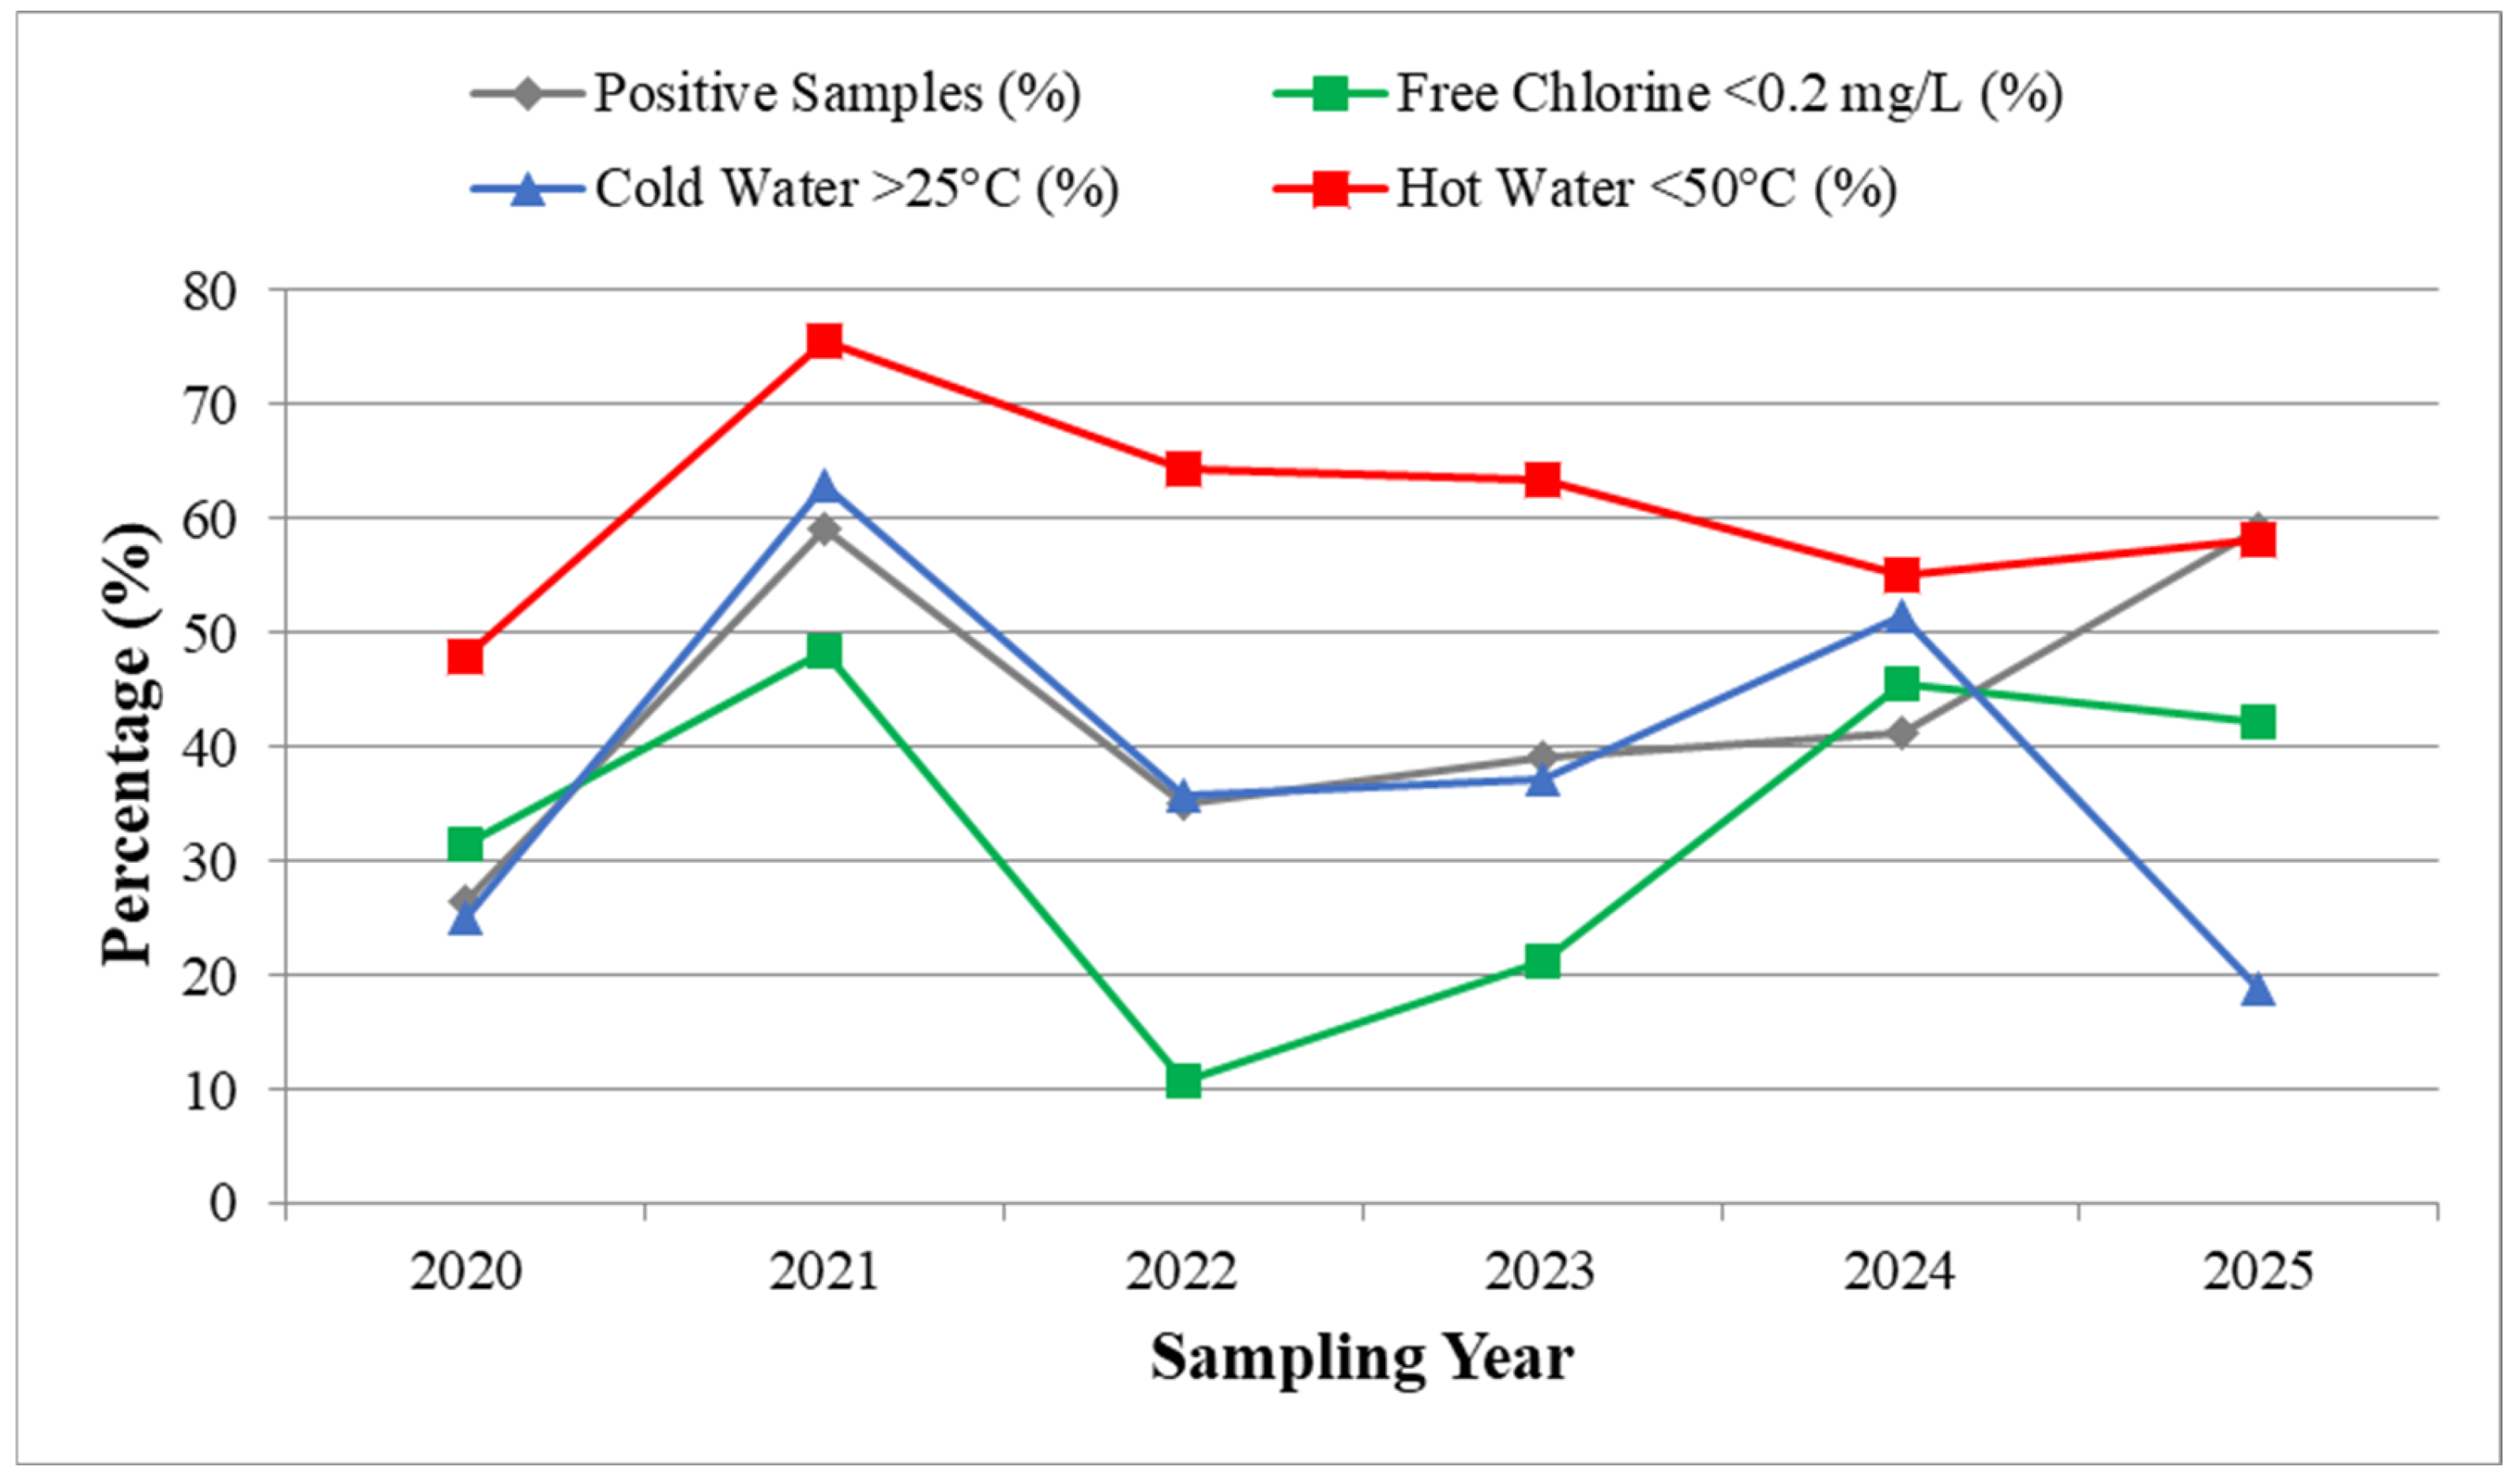
The temporal trend among Legionella positivity and the environmental non-compliances was determined from 2020 to 2025. Figure 4 presents the annual Le-gionella positivity in relation to the percentage of environmental samples that did not comply with the parametric values set by public health authorities and were consistently monitored at each sampling point. More specifically, the hot water non-compliance (<50 °C), low free chlorine levels (<0.2 mg/L), and cold water >20 °C, present peaks with highly increased positivity rates and especially in 2021 and 2025. In 2025, the decrease in thermal non-compliance along with the steady increase in posi-tivity and chemical deviation suggests that there are possible malfunctions in operating systems or maintenance processes.
Furthermore, Figure 4 shows the decline in the water quality and Legionella proliferation between 2020 and 2025. It should be noted that 2020 is the initial pandemic year. A relatively low positivity rate, 26.42%, was observed in 2020. Nonetheless, the chlo-rine levels (<0.2 mg/L) was 31.58% of the samples and extensive hot water temperatures below the 50 °C safety standard. In 2021, there will be an extensive increase in Legionella positivity with its value rising to 59.17%. This rise coincides with a significant increase in water quality violations since the chlorination and temperature parameters showed chlorine insufficiency (<0.2 mg/L) and temperature noncompliance in the hot 75.53% and cold 63.04% samples, respectively.
On the other hand, in 2022 and 2023, the positivity rates exhibited a modest level compared to the 2021 year, with values dropping to 34.97% and 39.22%, respectively. The samples obtained in these years showed better chlorine levels compliance, mainly due to the strict regulations during COVID-19. Nevertheless, in 2024, non-compliances and violations re-emerged, with 45.56% of the samples not meeting the chlorine criteria and 51.48% of the cold-water samples exceeding 25°C. In 2025, there was a significant improvement with only 18.75% of the samples above the limit; however, the remaining parameters remained suboptimal, with the overall positivity increasing again to 59.23%.
Figure 4.
Temporal comparison of Legionella positivity and physicochemical non-compliance (2020–2025). Yearly percentages of positive samples (gray), free chlorine levels <0.2 mg/L (green), cold water >25 °C (blue), and hot water <50 °C (red) across all facilities.
Figure 4.
Temporal comparison of Legionella positivity and physicochemical non-compliance (2020–2025). Yearly percentages of positive samples (gray), free chlorine levels <0.2 mg/L (green), cold water >25 °C (blue), and hot water <50 °C (red) across all facilities.
3.4.1. Hotels: Post-COVID Risk Profile
A focused analysis of hotel establishments (n = 9) from 2020 to 2025 and their comparison with the pre-pandemic era demonstrates the impact of the pandemic on water system hygiene. Table S2 lists the rates of Legionella positivity in hotels for the period 2020-2025. In 2020, Legionella positivity in hotels was at a level of 26.42%, which was slightly lower than the national average of positivity in hotels for the period 2000-2019 of 38.08% reported in our previous study [22]. However, a rapid increase in positivity was observed during and after the COVID-19 pandemic, reaching 59.17% in 2021 and again 59.23% in 2025, values that far exceed both the 2020 baseline and the national average of positivity in hotels for the period 2000-2019. The 2021 peak coincided with the widespread reopening of facilities after a prolonged period of inactivity. Partial improvement was noted in 2022 and 2023 with positivity falling to 34.97% and 39.22%, respectively, but levels increased again in 2024 with values of 41.19% reaching a second peak in 2025.
In Addition, Table S2 lists the environmental risk factors monitored alongside positivity. In 2021, 48.45% of the hotel samples with Legionella detections had free chlorine levels below 0.2 mg/L, 75.53% of the hot water samples were below 50°C. and 63.04% of the cold water samples exceeded 25°C. These non-compliances aligned with periods of higher colonization and corresponded to a more than two-fold increased risk of positivity (Table 5). Thermal and chemical instability remained problematic throughout 2025, while there were compliances for cold water (18.75% >25°C).
A comparative analysis of the concentration zones (Table S3) also showed a shift from high risk (>10⁴ CFU/L) to more persistent low and medium risk colonization in the post-COVID years,
3.5. Environmental Risk Factors and Relative Risk Analysis
The environmental and operational risk factors are then presented in Table 5. Hot water temperatures below 50°C emerged as the most critical with a relative risk (RR) of 2.05 and odds ratio (OR) of 6.54 for Legionella positivity (p < 0.0001). Also striking was the effect of hot water below 35°C, which showed an RR of 3.58 and an OR of 4.74, reflecting a significantly increased colonization potential in hypothermophilic conditions. Free residual chlorine concentrations below 0.2 mg/L were also significantly associated with colonization (RR = 2.22, p < 0.0001), demonstrating the importance of continuous chemical disinfection (Table 5).
A weak but statistically significant association (RR = 2.53, p = 0.04) was found with increased turbidity levels, which is likely due to the support provided by the sediment and biofilm for microbial growth (Table 5). As expected, no significant association was found between Legionella positivity and cold-water temperatures above 25 °C (RR = 1.12, p = 0.1), sampling locations in remote areas (RR = 1.11, p = 0.22) or direct water outlets (RR = 0.96, p = 0.29).
Statistical analysis can highlight which parameter plays a critical role in Legionella proliferation. Table 5 shows the relative risk (RR) of Legionella positivity in relation to three important physicochemical factors of non-compliance: cold water temperature >25°C, free residual chlorine <0.2mg/L and hot water temperature <50°C. An RR greater than 1 means that the specified condition makes contamination more likely. The strongest association is seen with non-compliance with the hot water rules (RR > 2), which is due to low chlorine levels. Weak - non-significant association is shown for high values of non-compliance for cold water temperatures.
Linear regression supported these results, showing a strong association between non-compliance with hot water regulations and Legionella detection (β = 3578.0, p < 0.0001), with a moderate explanatory power (r² = 0.07). There was a weak association between the lack of free chlorine (β = 366.5, p = 0.0897) and cold water temperature that had no statistically significant predictive value (β = 245.4, p = 0.2056). Spearman's rank correlation supported these patterns by showing a strong unidirectional association between Legionella detection and non-compliance with hot water regulations (ρ = 0.42, p < 0.0001).
Systemic vulnerabilities can be identified by the correlation of physicochemical parameters with non-compliances by facility type (Table S4). A total of 61.06% of all samples were found to be non-compliant for hot water temperatures (<50 °C). Passenger ships and private clinics showed the highest rate with 92.31% and 65.78%, respectively. In advance, passenger ships were found to present low residual chlorine (<0.2 mg/L) with 63.33% and primary healthcare units with 42.19%. 36.34% of all samples displayed low residual chlorine (<0.2 mg/L), while non-conformities on cold water temperature violations (>25 °C) were found in 44.14% of cases, mostly 59.55% of cases attributed to hotel samples. Finally, the pH values were observed with no deviations, implying that the chemical buffering systems remained within acceptable ranges across all facilities.
Table S2 presents the temporal trends in the prevalence of risk factors among the Legionella-positive samples. In 2021 and 2025, years characterized by increased positivity, there were simultaneous peaks of non-compliance with thermal and chlorinated requirements. Linear regression confirmed the predictive power of suboptimal hot water temperatures for colonization (β = 3578.0, p < 0.0001; r² = 0.07), while chlorine deficiency showed a weaker association (β = 366.5, p = 0.0897). The cold water temperature did not show a significant predictive value (p = 0.2056).
Finally, the risk assessment of positive samples based on CFU/L specifications (Figure 5) showed that high-risk samples (≥10⁴ CFU/L) comprised a larger percentage of samples in primary care units (20.17%) and on passenger ships (6.25%). Private clinics did not have any high-concentration samples, whereas public hospitals and hotels had a lot less (1.81% and 0.57%, respectively).
3.6. Multivariate Analysis Results
A logistic regression model was used to evaluate the independent predictors of Legionella positivity. The adjusted odds ratios (AOR), 95% confidence intervals (CI), and p-values for all included variables are summarized in Table S5. Private clinics, 2020 reference year, water temperatures <50 °C, chlorine levels <0.2 mg/L and cold water sample type were used as reference points for comparison. The probability of positivity was significantly higher in primary care units (AOR = 17.50), followed by public hospitals (AOR = 3.21), hotels (AOR = 2.34), and passenger ships (AOR = 2.09) compared with the reference category. In addition, the sampling years 2021 and 2025 are associated with significantly increased odds of positivity relative to the reference year 2020. Hot water temperatures <50°C (AOR = 2.88) and free chlorine levels <0.2mg/L (AOR = 1.92) were associated with an increased risk of positivity. Finally, the sample type (hot vs. cold) had a marginal but significant effect (AOR = 1.35, p = 0.045).
4. Discussion
This 6-year large-scale study analyzed the presence of Legionella spp. colonies in water distribution systems from 5 different high-risk facilities in Crete, Greece, covering the period before, during, and after the COVID-19 pandemic. The findings highlight specific environmental and critical operational factors that influence Legionella proliferation and its footprint in water distribution systems.
4.1. Facility-Specific Colonization Patterns
In this study, an overall positivity rate of 44.59% for all Legionella species colonizing the water supply systems of the facilities was revealed. This is in agreement with the corresponding surveillance studies across Europe. However, our analysis shows that there is a different risk profile per facility. The highest positivity rate of 85.96% was presented in primary healthcare units with a parallel presence of a high percentage of samples ≥10⁴ CFU/L at 20.17%. In similar findings, Whiley et al. previously showed that decentralized healthcare settings are more susceptible to Legionella contamination [49].
Public hospitals showed a positivity rate at lower levels of 46.36%, although significant. In these facilities, the positive fact is that only 1.81% of the samples exceeded 10⁴ CFU/L. However, the presence of widespread levels of serogroup 1 of L. pneumophila with 46.56% of the positive samples comprise a crucial risk factor, as serogroup 1 has been recognized for its virulence and its involvement in epidemics of hospital infections. These results are consistent with the study by Buse et al., which examined large water tanks in large plumbing systems where persistent Legionella colonization occurred in healthcare settings [50]. Public health authorities should promote the adoption of such innovations—with the aim of saving energy, maintaining water infrastructure, and ensuring the hygiene and integrity of the water supply [50,51,52].
On passenger ships, the overall positivity was 36.93% but showed a high concentration of samples ≥10⁴ CFU/L at 6.25% and the highest frequency of non-compliance with hot water temperature at 92.31%. Previous studies by Leoni et al. highlighted the high risk of Legionella colonization on ships due to the lack of ample space for some redesign of systems and the difficulty in maintaining a continuous water flow [53] . This poses a unique challenge for microbial control on passenger ships; therefore, coordination between the central and local authorities is essential to ensure preparedness and develop targeted risk assessments and contingency plans and to inform national strategies for water safety in maritime infrastructure [54,55].
The hotels exhibited a moderate positivity rate of 38.08%. Nevertheless, further analysis revealed fluctuations in the Legionella infection risk over time between 2020 and 2025 (Figure 3, Supplementary Table S2). Positivity rates experienced two peaks, one in 2021 at 59.17% and the second in 2025 at 59.23%, with exceedances well above the baseline level in hotel facilities before the pandemic [22].
A notable difference was in the non-compliance with the high cold water temperature, which was found at 59.55%. A significant percentage of samples at 13.29% presented a medium load rate (within 10³–10⁴ CFU/L) with a small presence above 10⁴ CFU/L, which predisposes to low-level colonization.
The positivity rates from hotels, where visitors were reported as a TALD case in ELDSNet, (n=13) and the visitor’s room was known (n=6), was found to be 55% over the total 40 samples with the majority belonging to L. pneumophila serogroup 2 at 22.73% [56]. The risk in accommodation facilities such as guest rooms, bungalows, and hotel units has been attributed to complex plumbing infrastructure, intermittent water use, and features such as saunas and hot tubs [57,58].
The association of peak values between these temporal and functional factors is supported by the observed increase in environmental non-compliance in the same years, particularly for subcritical hot water temperatures and inadequate chlorine levels. As shown in Figure 4, the years with higher positivity rates corresponded to an increased relative risk. This relationship was further confirmed by multivariate logistic regression (Section 3.6), which identified hot water temperatures <50°C (AOR: 2.88) and low chlorine levels <0.2 mg/L (AOR: 1.92) as significant independent predictors of Legionella colonization. These findings reinforce the fact that the temporal evolution of positivity reflects real changes in exposure conditions and not sampling bias.
In addition, both facility type and sampling year comprised significant predictors of positivity, confirming the interaction between facility characteristics and changes in their operation during the pandemic (Table 7).
In contrast to the phenomena of increased positivity rate and non-compliance observed in the remaining health and non-health facilities that we mentioned, private clinics presented the lowest rates in all parameters. For the entire reporting period, the analysis included zero high-load samples. The image reflected for private clinics is that they have an advantage due to newer infrastructure and plumbing networks, but they also operate under strict accreditation standards with high compliance with cleaning and disinfection protocols. Nevertheless, there is a possibility of colonization even in low-risk environments, as shown by the presence of serogroups 2-15 of L. pneumophila in a percentage of 70.83% of positive samples.
4.2. Serogroup Distribution and Environmental Risk Indicators
Seroepidemiology in all facilities revealed the predominant presence of serogroups 2-15 of L. pneumophila in 63.83% of the positive samples. This is fully in line with the rules of environmental surveillance, where it is common to find the presence of serogroups 2-15 in environmental isolates, compared to sg1, which appears less frequently and mainly in clinical cases [19]. Nevertheless, in the present study, a high prevalence of sg1 was observed in public hospitals, hotels and passenger ships, which reinforces the requirement for the use of seroepidemiological study and the necessity of regular serogroup typing during environmental surveillance.
The study of physicochemical parameters identified suboptimal hot water temperature (<50°C) and low free residual chlorine (<0.2mg/L) as statistically significant risk factors. Multivariate logistic regression confirmed hot water non-compliance as the strongest independent predictor (AOR: 2.88; β = 3578.0; p < 0.0001), followed by inadequate chlorine levels (AOR: 1.92). The relative risk of colonization was more than doubled (RR = 2.05) in association with hot water systems maintained below 50°C, while even higher values (RR = 3.58) were observed when temperatures fell below 35°C. According to the WHO and the CDC, thermal control is a cornerstone of Legionella prevention and is confirmed by the findings of this study [59,60].
In contrast, the analysis of physicochemical parameters in all samples showed that cold water temperatures >20°C, remote sampling locations and direct versus indirect exits were not statistically significant factors for the prediction of colonization. Although these factors may influence risk under certain conditions, they appear secondary to the thermal and chemical controls in this dataset.
4.3. Temporal Trends and the COVID-19 Effect
Temporal trend studies provided interesting information on the impact of operational disruptions on water safety. In 2021, which is the year after the first lockdown related to the COVID-19 pandemic, the highest positivity rate was recorded. According to international studies, water stagnation, maintenance suspension and generally reduced use of facilities in the reference facilities contributed to a trend of proliferation of all microbes including those of Legionella spp. [61,62].
A secondary peak in 2025 suggests that the temporary improvements implemented during the pandemic may have faded over time, underscoring the need for institutionalized, not reactive, water safety protocols. These findings are consistent with the study by Kunz et al., which reported a lack of Legionella transmission control in US hotels during the pandemic [32]. The present study suggests a similar vulnerability in hotels in Crete during 2021 and 2025.
4.4. Strengths and Limitations
This study was conducted in an analysis based on a large sample size, a longitudinal 624 design and typological diversity. The geographical restriction to a single island region 625 as well as the plate counting method for Legionella detection constitute the limitations of the 626 study. Future studies should incorporate molecular diagnostics, such as qPCR and se- 627 quence-based typing (SBT), to enhance detection sensitivity and monitor strain evolution.
4.5. Public Health Implications
In summary, this study highlights the need to develop and implement risk management strategies that are differentiated and adapted to each facility. There is a requirement for targeted surveillance in both public hospitals and primary care settings, considering vulnerable patient populations. Seasonal risk assessments and planning of a water safety plan on board are priorities for passenger ships. Hotel operators should emphasize thermal controls even during off-season periods with low occupancy and ensure continuity in water use. Finally, in private clinics, the appearance of low risk may be a positive sign but should not be overlooked as minimal colonization can present serious risks for immunocompromised patients and vulnerable groups.
5. Conclusions
Legionella colonization in hotel water systems increases during the COVID-19 pandemic and remained elevated post-COVID. We concluded that infection rates, bacterial loads and environmental risk factors vary significantly per facility, with primary healthcare units being the most vulnerable. This highlights the complexity of the water system design, operational practices, and public health outcomes. Moreover, our findings indicate systemic deficiencies in water safety monitoring, thermal regulation, and disinfection practices, particularly in smaller outpatient clinics. Our findings also demonstrate the need for the implementation of maritime-specific protocols since passenger ships have traditionally not been included in water safety frameworks. The implication of inappropriate temperatures and hypochlorination in the presence of Legionella in water distribution systems, urges toward the proper implementation of the guidelines proposed by ESGLI.
Facilities should apply individualized risk assessment approaches, and one such approach is the implementation of integrated WSPs. WSPs should emphasize regular monitoring, automated thermal control, and remedial disinfection protocols.
National and regional public health agencies should integrate Legionella risk management into broader water safety and civil protection policies. Investments in infrastructure modernization—particularly in primary healthcare and maritime transport—alongside regulatory enforcement and workforce training will be essential to reduce the risk of colonization and prevent outbreaks.
Future research should incorporate molecular diagnostics, strain typing, and digital monitoring tools to improve detection sensitivity and enable early warning systems. Enhancing the resilience of engineered water systems against Legionella and other microbial threats will depend on the integration of microbiological surveillance, engineering design, and adaptive governance.
Supplementary Materials
The following supporting information can be downloaded at the website
of this paper posted on Preprints.org, Table S1. Number of water samples collected from 2020 to 2025 per facility, Table S2. Year-by-Year Legionella Positivity and Water Quality Indicators in Hotel Water Systems (2020–2025), Table S3. Comparative Distribution of Legionella-Positive Samples by CFU/L Concentration Band, Table S4. Frequency and percentage of non-compliance with physicochemical parameters by facility type and year of monitoring (2020–2025), Table S5. Multivariate Logistic Regression Results for Legionella Positivity.
Author Contributions
For conceptualization, methodology, and validation, A.P. (Antonios Papadakis), E.K., D.C. and P. A. (Psaroulaki Anna) are responsible; formal analysis, investigation, and data curation, was conducted by A.P., E.K., E.A.C., D.C. and P.A.; writing—original draft preparation, A.P. and E.K.; writing—review and editing, A.P. and P. A.; supervision, and project administration A..P, D.C. and P. A. All authors have read and agreed to the published version of the manuscript.
Funding
This research received no external funding.
Data Availability Statement
Not applicable.
Acknowledgments
We would like to thank all the environmental health inspectors of the Local Public Health Authorities of Crete Island who collected the environmental samples during all these years.
Conflicts of Interest
The authors declare no conflict of interest.
References
- Renwick, D.V.; Heinrich, A.; Weisman, R.; Arvanaghi, H.; Rotert, K. Potential Public Health Impacts of Deteriorating Distribution System Infrastructure. J Am Water Works Assoc 2019, 111, 42–53. [CrossRef]
- Public Water Supply Distribution Systems Assessing and Reducing Risks | National Academies Available online: https://www.nationalacademies.org/our-work/public-water-supply-distribution-systems-assessing-and-reducing-risks (accessed on 6 June 2025).
- Public Water Supply Distribution Systems: Assessing and Reducing Risks—First Report; National Academies Press: Washington, D.C., 2005; ISBN 978-0-309-09628-7.
- LeChevallier, M.W.; Prosser, T.; Stevens, M. Opportunistic Pathogens in Drinking Water Distribution Systems—A Review. Microorganisms 2024, 12, 916. [CrossRef]
- Brady, M.F.; Awosika, A.O.; Nguyen, A.D.; Sundareshan, V. Legionnaire's disease. In StatPearls; StatPearls Publishing: Treasure Island (FL), 2025.
- Rello, J.; Allam, C.; Ruiz-Spinelli, A.; Jarraud, S. Severe Legionnaires’ Disease. Ann Intensive Care 2024, 14, 51. [CrossRef]
- Papageorgiou, K.; Chronis, E.; Tzouanopoulos, A.; Steris, V.; Koutsopoulos, D.; Tzavaras, I.; Paraskevopoulos, K.; Karolidis, S. Prevalence of Legionella Spp. in the Water Distribution Systems of Northern Greece. EUR J ENV PUBLIC HLT 2023, 7, em0147. [CrossRef]
- Papadakis, A.; Chochlakis, D.; Sandalakis, V.; Keramarou, M.; Tselentis, Y.; Psaroulaki, A. Legionella Spp. Risk Assessment in the Recreational and Garden Areas of Hotels. International Journal of Environmental Research and Public Health 2018, 15, 598. [CrossRef]
- Mnisi, Z.F.; Delair, Z.; Singh, A. Legionella in Urban and Rural Water: A Tale of Two Environments. Water 2025, 17, 1491. [CrossRef]
- Legionnaires’ Disease-Annual Epidemiological Report for 2021 Available online: https://www.ecdc.europa.eu/en/publications-data/legionnaires-disease-annual-epidemiological-report-2021 (accessed on 5 June 2025).
- Legionnaires’ Disease-Annual Epidemiological Report for 2021 Available online: https://www.ecdc.europa.eu/en/publications-data/legionnaires-disease-annual-epidemiological-report-2021 (accessed on 3 June 2025).
- Hoge, C.W.; Breiman, R.F. Advances in the Epidemiology and Control of Legionella Infections. Epidemiologic Reviews 1991, 13, 329–340. [CrossRef]
- van Hoof, J.; Hornstra, L.M.; van der Blom, E.; Nuijten, O.W.; van der Wielen, P.W. The Presence and Growth of Legionella Species in Thermostatic Shower Mixer Taps: An Exploratory Field Study. Building Services Engineering Research & Technology 2014, 35, 600–612. [CrossRef]
- Laganà, P.; Gioffrè, M.E.; Delia, S.A.; Facciolà, A. Legionella Spp. in Thermal Facilities: A Public Health Issue in the One Health Vision. Water 2023, 15, 689. [CrossRef]
- Kyritsi, M.A.; Mouchtouri, V.A.; Katsioulis, A.; Kostara, E.; Nakoulas, V.; Hatzinikou, M.; Hadjichristodoulou, C. Legionella Colonization of Hotel Water Systems in Touristic Places in Greece: Association with System Characteristics and Physicochemical Parameters. International Journal of Environmental Research and Public Health 2018, 15, 2707. [CrossRef]
- Taylor, M.; Ross, K.; Bentham, R. Legionella, Protozoa, and Biofilms: Interactions within Complex Microbial Systems. Microb Ecol 2009, 58, 538–547. [CrossRef]
- Lau, H. y.; Ashbolt, N. j. The Role of Biofilms and Protozoa in Legionella Pathogenesis: Implications for Drinking Water. Journal of Applied Microbiology 2009, 107, 368–378. [CrossRef]
- Valster, R.M.; Wullings, B.A.; van der Kooij, D. Detection of Protozoan Hosts for Legionella Pneumophila in Engineered Water Systems using a Biofilm Batch Test. Appl Environ Microbiol 2010, 76, 7144–7153. [CrossRef]
- Vincenti, S.; Nurchis, M.C.; Boninti, F.; Sapienza, M.; Raponi, M.; Pattavina, F.; Pesaro, C.; D’Alonzo, C.; Damiani, G.; Laurenti, P. An Innovative Device for the Hot Water Circuit in Hospitals to Save Energy Without Compromising the Safety and Quality of Water: Preliminary Results. Water 2025, 17, 692. [CrossRef]
- Alexandropoulou, I.G.; Ntougias, S.; Konstantinidis, T.G.; Parasidis, T.A.; Panopoulou, M.; Constantinidis, T.C. Environmental Surveillance and Molecular Epidemiology of the Waterborne Pathogen Legionella Pneumophila in Health-Care Facilities of Northeastern Greece: A 4-Year Survey. Environ Sci Pollut Res 2015, 22, 7628–7640. [CrossRef]
- Naher, N.; Bari, M.L.; Ahmed, S. Risk Assessment and Detection of Legionella Species in the Water System of A Luxury Hotel in Dhaka City, Bangladesh. Bangladesh Journal of Microbiology 2023, 40, 33–39. [CrossRef]
- Papadakis, A.; Keramarou, M.; Chochlakis, D.; Sandalakis, V.; Mouchtouri, V.A.; Psaroulaki, A. Legionella Spp. Colonization in the Water Systems of Hotels Linked with Travel-Associated Legionnaires’ Disease. Water 2021, 13, 2243. [CrossRef]
- Mellou, K.; Mplougoura, A.; Mandilara, G.; Papadakis, A.; Chochlakis, D.; Psaroulaki, A.; Mavridou, A. Swimming Pool Regulations in the COVID-19 Era: Assessing Acceptability and Compliance in Greek Hotels during Two Consecutive Summer Touristic Periods. Water 2022, 14, 796. [CrossRef]
- Papadakis, A.A.; Tsirigotakis, I.; Katranitsa, S.; Donousis, C.; Papalexis, P.; Keramydas, D.; Chaidoutis, E.; Georgakopoulou, V.E.; Spandidos, D.A.; Constantinidis, T.C. Assessing the Impact of the COVID19 Pandemic Health Protocols on the Hygiene Status of Swimming Pools of Hotel Units. Medicine International 2023, 3, 1–10. [CrossRef]
- Arrigo, I.; Galia, E.; Fasciana, T.; Diquattro, O.; Tricoli, M.R.; Serra, N.; Palermo, M.; Giammanco, A. Four-Year Environmental Surveillance Program of Legionella Spp. in One of Palermo’s Largest Hospitals. Microorganisms 2022, 10. [CrossRef]
- Goutziana, G.; Mouchtouri, V.A.; Karanika, M.; Kavagias, A.; Stathakis, N.E.; Gourgoulianis, K.; Kremastinou, J.; Hadjichristodoulou, C. Legionella Species Colonization of Water Distribution Systems, Pools and Air Conditioning Systems in Cruise Ships and Ferries. BMC Public Health 2008, 8, 390. [CrossRef]
- Kourentis, L.; Anagnostopoulos, L.; Tsinaris, Z.; Galanopoulos, A.P.; Van Reusel, D.; Van den Bogaert, R.; Helewaut, B.; Steenhout, I.; Helewaut, H.; Damman, D.; et al. Legionella Spp. Colonization of Non-Passenger Ships Calling at Belgian Ports. Medical Sciences Forum 2022, 13, 15. [CrossRef]
- Proctor, C.R.; Rhoads, W.J.; Keane, T.; Salehi, M.; Hamilton, K.; Pieper, K.J.; Cwiertny, D.M.; Prévost, M.; Whelton, A.J. Considerations for Large Building Water Quality after Extended Stagnation. AWWA Water Sci 2020, 2, e1186. [CrossRef]
- Papadakis, A.; Chochlakis, D.; Koufakis, E.; Carayanni, V.; Psaroulaki, A. Recreational Water Safety in Hotels: Lessons from the COVID-19 Pandemic and the Way Forward for a Safe Aquatic Environment. Tourism and Hospitality 2024, 5, 1167–1181. [CrossRef]
- Kontis, V.; Bennett, J.E.; Rashid, T.; Parks, R.M.; Pearson-Stuttard, J.; Guillot, M.; Asaria, P.; Zhou, B.; Battaglini, M.; Corsetti, G.; et al. Magnitude, Demographics and Dynamics of the Effect of the First Wave of the COVID-19 Pandemic on All-Cause Mortality in 21 Industrialized Countries. Nat Med 2020, 26, 1919–1928. [CrossRef]
- Rhoads, W.J.; Hammes, F. Growth of Legionella during COVID-19 Lockdown Stagnation. Environ. Sci.: Water Res. Technol. 2021, 7, 10–15. [CrossRef]
- Kunz, J.M.; Hannapel, E.; Vander Kelen, P.; Hils, J.; Hoover, E.R.; Edens, C. Effects of the COVID-19 Pandemic on the Legionella Water Management Program Performance across a United States Lodging Organization. International Journal of Environmental Research and Public Health 2023, 20, 6885. [CrossRef]
- Water Safety Plan Manual: Step-by-Step Risk Management for Drinking-Water Suppliers, Second Edition Available online: https://www.who.int/publications/i/item/9789240067691 (accessed on 6 June 2025).
- Water Safety Planning: A Roadmap to Supporting Resources Available online: https://www.who.int/publications/m/item/water-safety-planning-a-roadmap-to-supporting-resources (accessed on 6 June 2025).
- Borella, P.; Bargellini, A.; Marchegiano, P.; Vecchi, E.; Marchesi, I. Hospital-Acquired Legionella Infections: An Update on the Procedures for Controlling Environmental Contamination. Ann Ig 2016, 28, 98–108. [CrossRef]
- Mentula, S.; Kääriäinen, S.; Jaakola, S.; Niittynen, M.; Airaksinen, P.; Koivula, I.; Lehtola, M.; Mauranen, E.; Mononen, I.; Savolainen, R.; et al. Tap Water as the Source of a Legionnaires’ Disease Outbreak Spread to Several Residential Buildings and One Hospital, Finland, 2020 to 2021. Euro Surveill 2023, 28, 2200673. [CrossRef]
- Donohue, M.J.; O’Connell, K.; Vesper, S.J.; Mistry, J.H.; King, D.; Kostich, M.; Pfaller, S. Widespread Molecular Detection of Legionella Pneumophila Serogroup 1 in Cold Water Taps across the United States. Environ. Sci. Technol. 2014, 48, 3145–3152. [CrossRef]
- Marchesi, I.; Ferranti, G.; Mansi, A.; Marcelloni, A.M.; Proietto, A.R.; Saini, N.; Borella, P.; Bargellini, A. Control of Legionella Contamination and Risk of Corrosion in Hospital Water Networks Following Various Disinfection Procedures. Appl Environ Microbiol 2016, 82, 2959–2965. [CrossRef]
- European Technical Guidelines for the Prevention, Control and Investigation of Infections Caused by Legionella Species Available online: https://www.ecdc.europa.eu/en/publications-data/european-technical-guidelines-prevention-control-and-investigation-infections (accessed on 6 June 2025).
- ISO 5667-1:2020 Available online: https://www.iso.org/standard/72369.html (accessed on 6 June 2025).
- ISO 5667-1:2023 Available online: https://www.iso.org/standard/84099.html (accessed on 6 June 2025).
- ISO 11731:2017 Available online: https://www.iso.org/standard/61782.html (accessed on 6 June 2025).
- Schoonjans, F. MedCalc’s Relative Risk Calculator. Available online: https://www.medcalc.org/calc/relative_risk.php (accessed on 9 June 2025).
- IBM SPSS Statistics Available online: https://www.ibm.com/products/spss-statistics?lot=5&mhsrc=ibmsearch_a&mhq=spss (accessed on 9 June 2025).
- Epi InfoTM | CDC Available online: https://www.cdc.gov/epiinfo/index.html (accessed on 9 June 2025).
- Buse, H.Y.; Schoen, M.E.; Ashbolt, N.J. Legionellae in Engineered Systems and the Use of Quantitative Microbial Risk Assessment to Predict Exposure. Water Res 2012, 46, 921–933. [CrossRef]
- Legionella Diversity and Spatiotemporal Variation in the Occurrence of Opportunistic Pathogens within a Large Building Water System Available online: https://www.mdpi.com/2076-0817/9/7/567 (accessed on 5 June 2025).
- Directive - 2020/2184 - EN - EUR-Lex Available online: https://eur-lex.europa.eu/eli/dir/2020/2184/oj/eng (accessed on 5 June 2025).
- Hayes-Phillips, D.; Bentham, R.; Ross, K.; Whiley, H. Factors Influencing Legionella Contamination in Domestic Household Showers. Pathogens 2019, 8, 27. [CrossRef]
- Buse, H.Y.; Morris, B.J.; Gomez-Alvarez, V.; Szabo, J.G.; Hall, J.S. Legionella Diversity and Spatiotemporal Variation in the Occurrence of Opportunistic Pathogens within a Large Building Water System. Pathogens 2020, 9, 567. [CrossRef]
- Vincenti, S.; Nurchis, M.C.; Boninti, F.; Sapienza, M.; Raponi, M.; Pattavina, F.; Pesaro, C.; D’Alonzo, C.; Damiani, G.; Laurenti, P. An Innovative Device for the Hot Water Circuit in Hospitals to Save Energy Without Compromising the Safety and Quality of Water: Preliminary Results. Water 2025, 17, 692. [CrossRef]
- Romano Spica, V.; Borella, P.; Bruno, A.; Carboni, C.; Exner, M.; Hartemann, P.; Gianfranceschi, G.; Laganà, P.; Mansi, A.; Montagna, M.T.; et al. Legionnaires’ Disease Surveillance and Public Health Policies in Italy: A Mathematical Model for Assessing Prevention Strategies. Water 2024, 16, 2167. [CrossRef]
- Leoni, E.; Catalani, F.; Marini, S.; Dallolio, L. Legionellosis Associated with Recreational Waters: A Systematic Review of Cases and Outbreaks in Swimming Pools, Spa Pools, and Similar Environments. Int J Environ Res Public Health 2018, 15, 1612. [CrossRef]
- Anagnostopoulos, L.; Kourentis, L.; Papadakis, A.; Mouchtouri, V.A. Re-Starting the Cruise Sector during the COVID-19 Pandemic in Greece: Assessing Effectiveness of Port Contingency Planning. International Journal of Environmental Research and Public Health 2022, 19, 13262. [CrossRef]
- Leaflet for Managers of Tourist Accommodation on How to Reduce the Risk of Legionnaires’ Disease Available online: https://www.ecdc.europa.eu/en/publications-data/leaflet-managers-tourist-accommodation-how-reduce-risk-legionnaires-disease (accessed on 10 June 2025).
- European Legionnaires’ Disease Surveillance Network (ELDSNet) - Operating Procedures Available online: https://www.ecdc.europa.eu/en/publications-data/european-legionnaires-disease-surveillance-network-eldsnet-operating-procedures (accessed on 10 June 2025).
- Yao, X.H.; Shen, F.; Hao, J.; Huang, L.; Keng, B. A Review of Legionella Transmission Risk in Built Environments: Sources, Regulations, Sampling, and Detection. Front. Public Health 2024, 12. [CrossRef]
- Buchholz, U.; Brodhun, B.; Lehfeld, A.-S. Incidence of Legionnaires’ Disease among Travelers Visiting Hotels in Germany, 2015–2019. Emerging Infectious Diseases 2024, 30, 13. [CrossRef]
- CDC Legionella (Legionnaires’ Disease and Pontiac Fever) Available online: https://www.cdc.gov/Legionella/index.html (accessed on 9 June 2025).
- Legionellosis (Legionnaires’ Disease) Available online: https://www.who.int/news-room/questions-and-answers/item/legionellosis-legionnaires-disease (accessed on 9 June 2025).
- Rhoads, W.J.; Hammes, F. Growth of Legionella during COVID-19 Lockdown Stagnation. Environ. Sci.: Water Res. Technol. 2021, 7, 10–15. [CrossRef]
- Martin, R.L.; Harrison, K.; Proctor, C.R.; Martin, A.; Williams, K.; Pruden, A.; Edwards, M.A. Chlorine Disinfection of Legionella Spp., L. Pneumophila, and Acanthamoeba under Warm Water Premise Plumbing Conditions. Microorganisms 2020, 8, 1452. [CrossRef]
Figure 1.
Legionella Positivity by Facility Type.
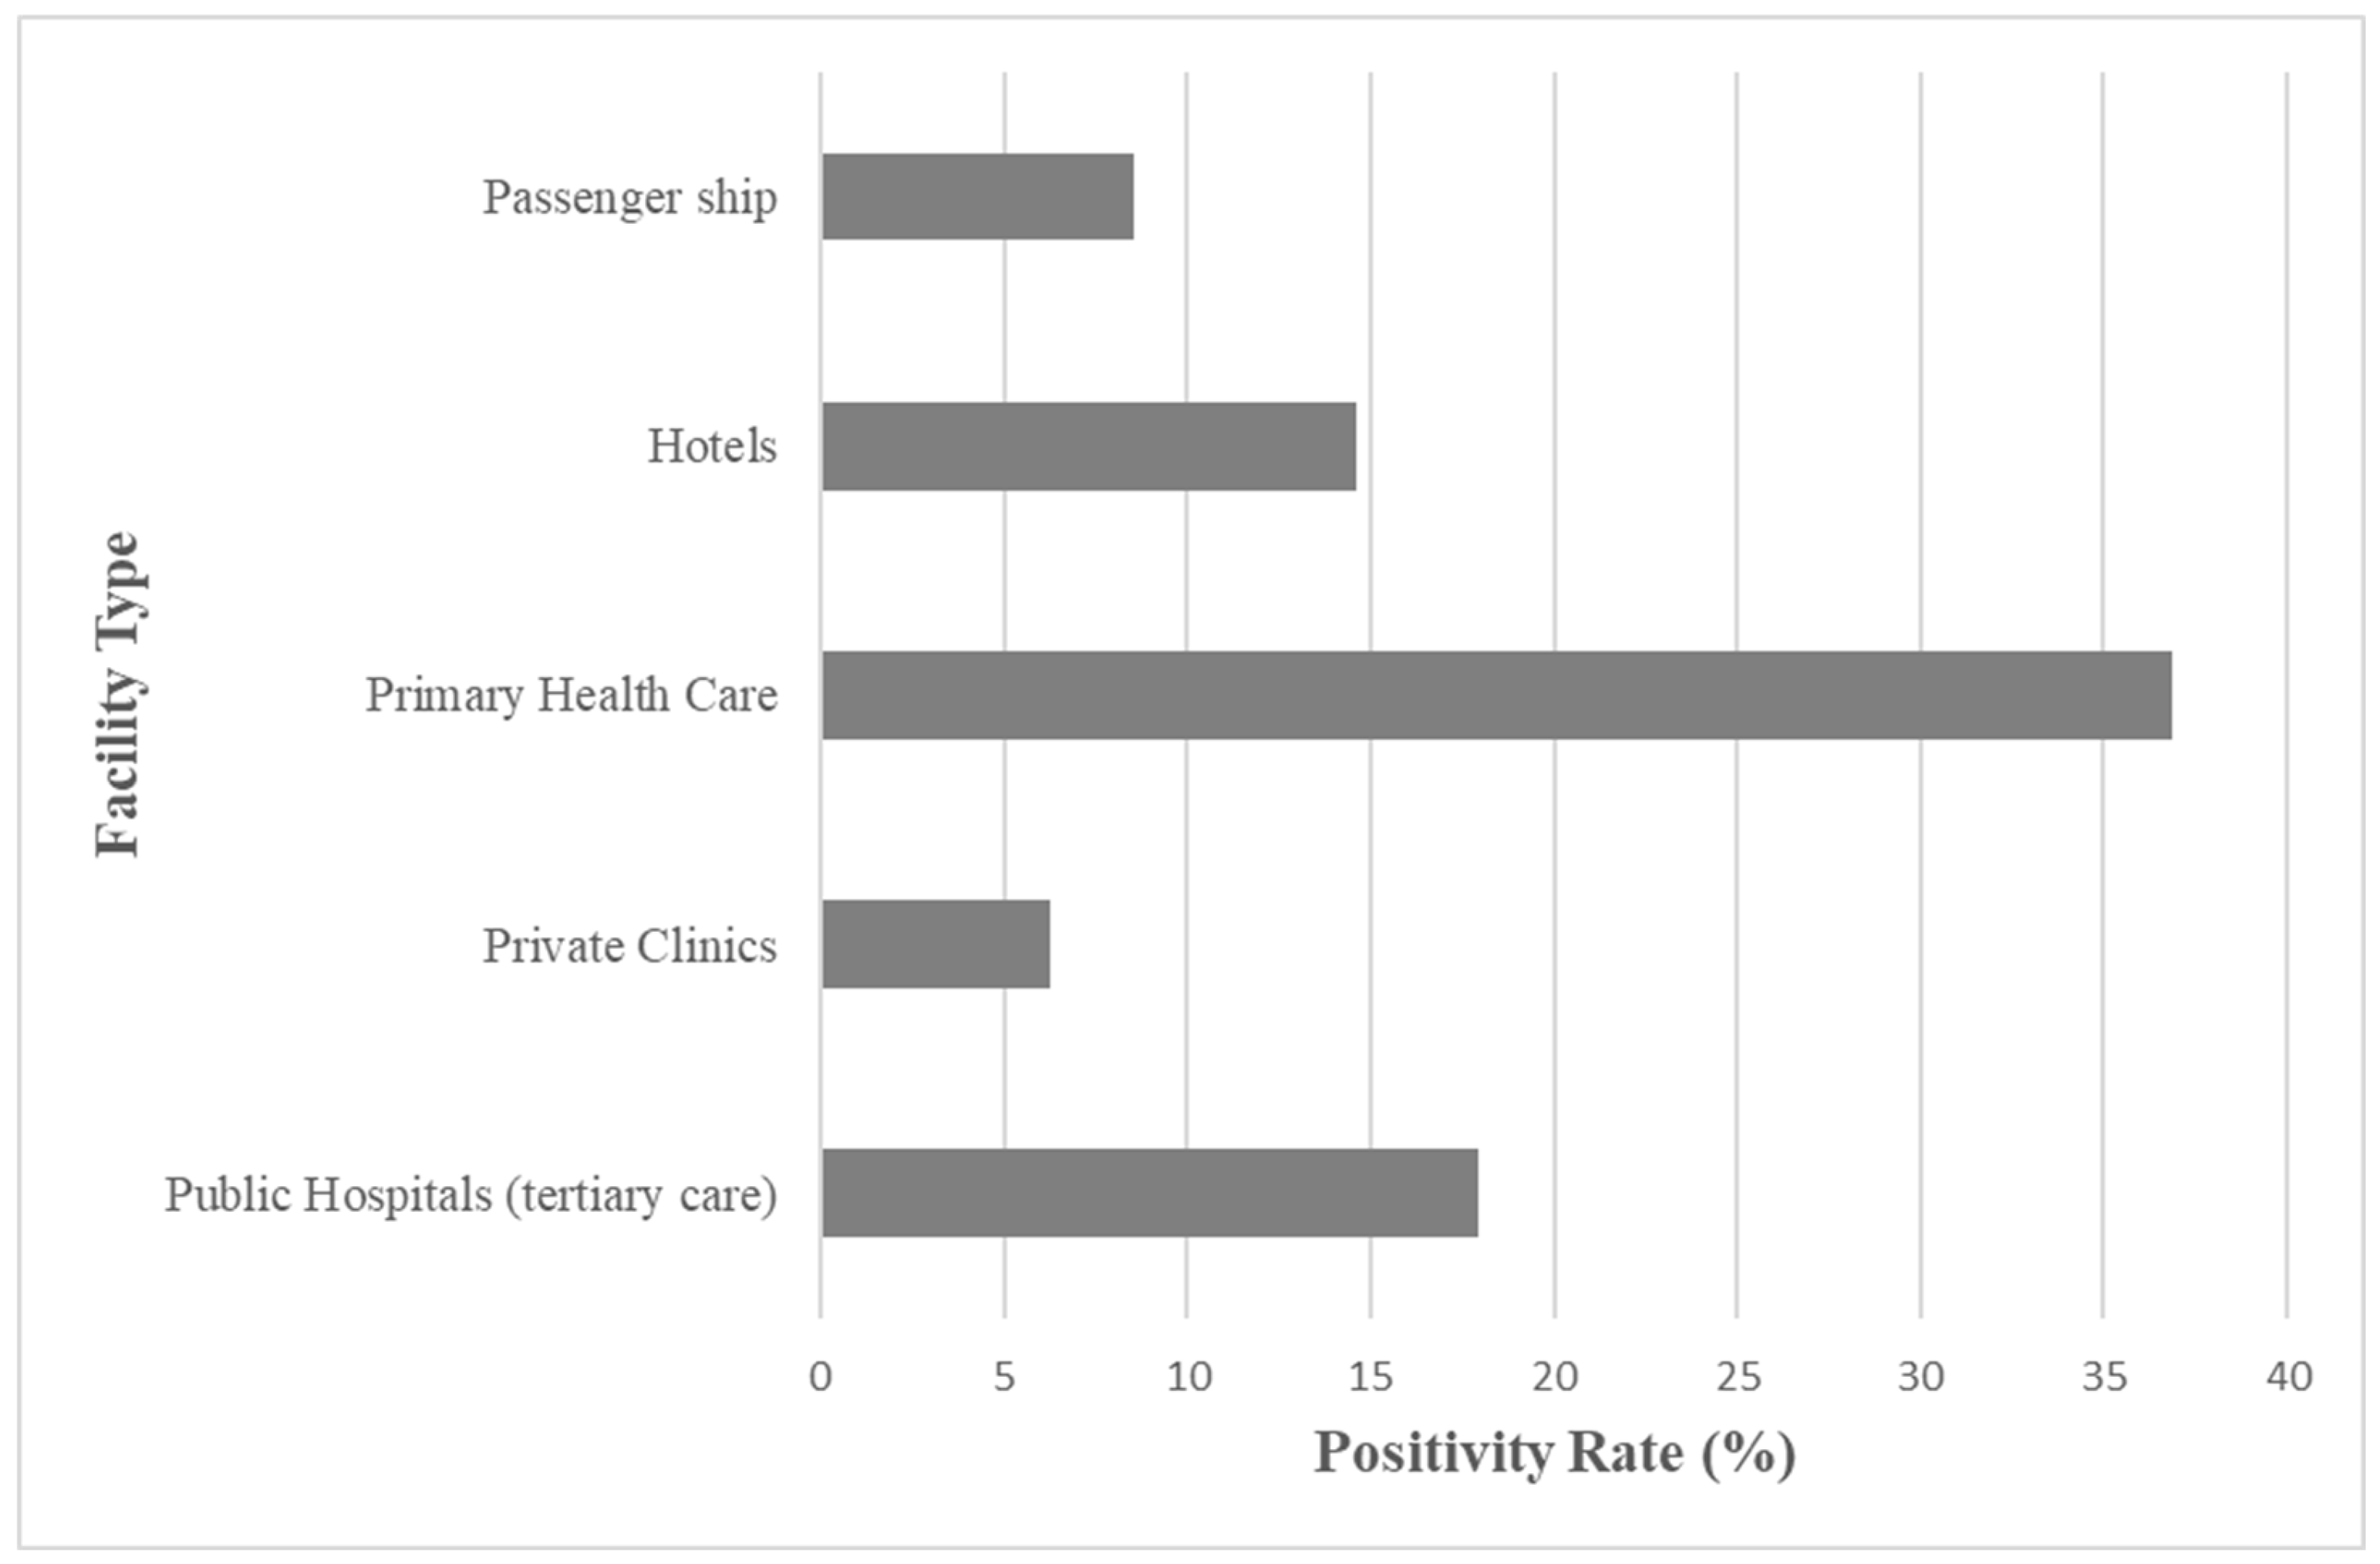
Figure 2.
Legionella Temporal Trends (2020-2025).
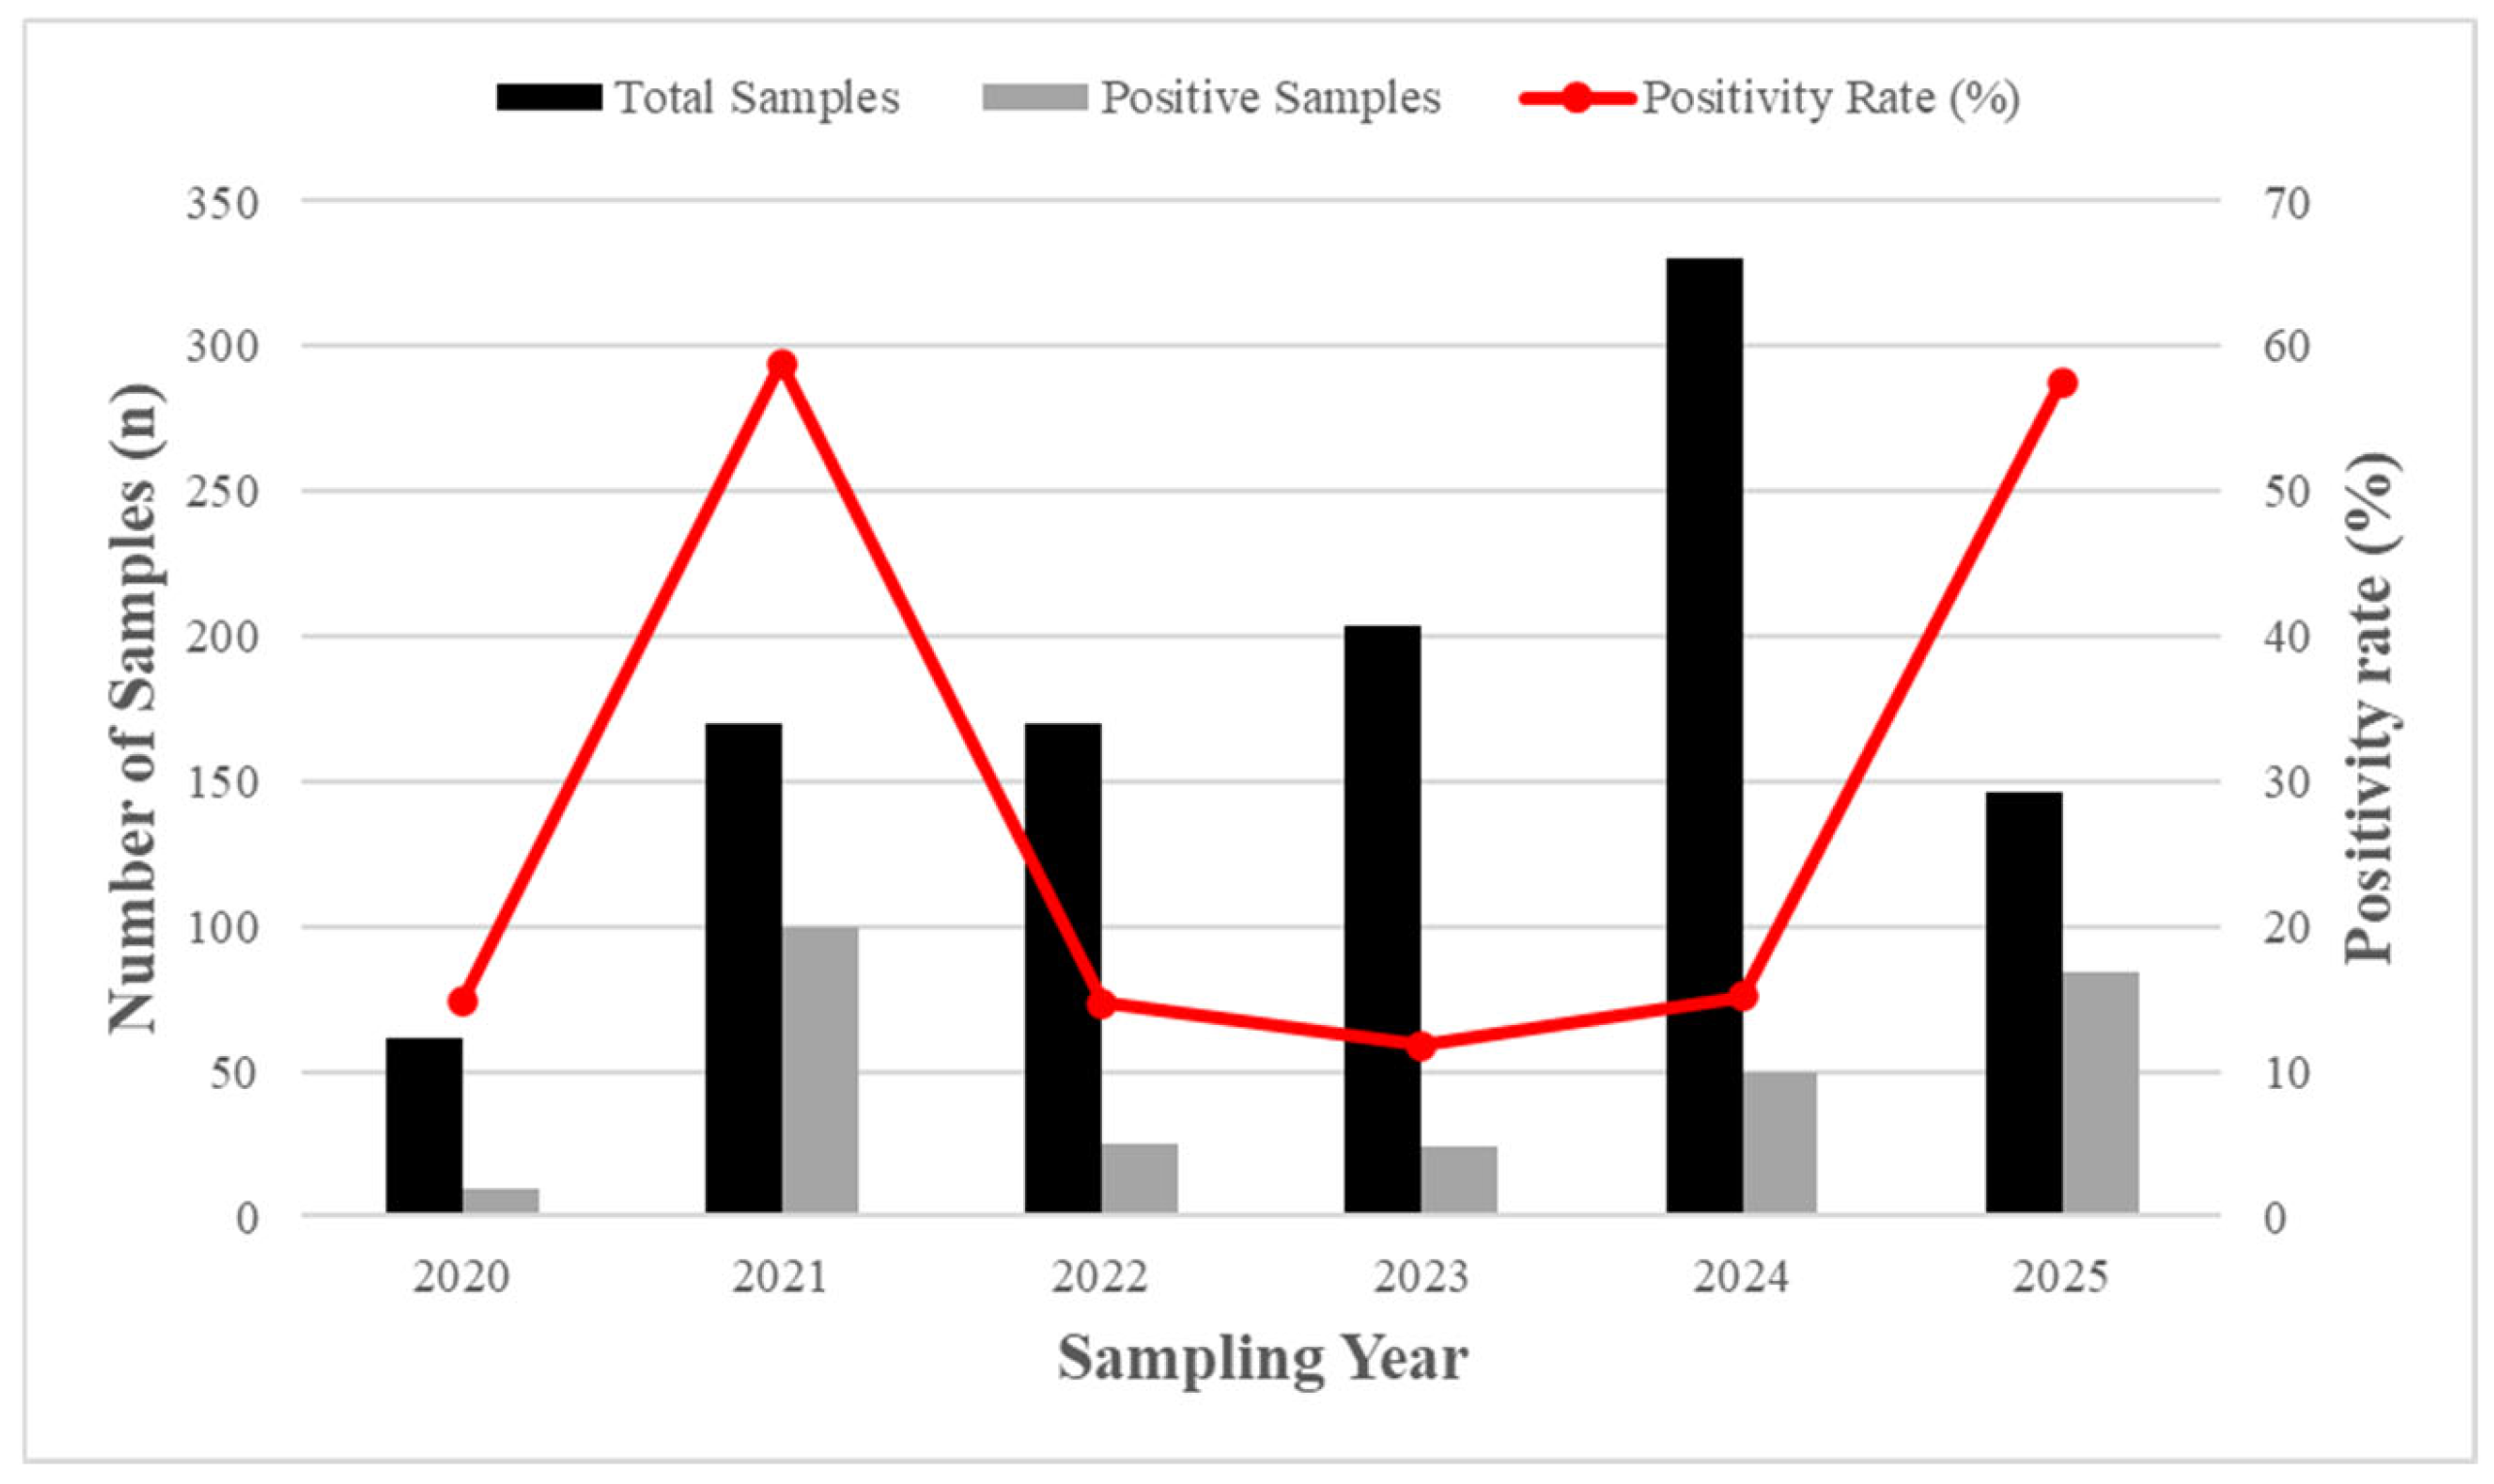
Figure 3.
Distribution of Legionella Serogroups in Positive Samples (n = 482).
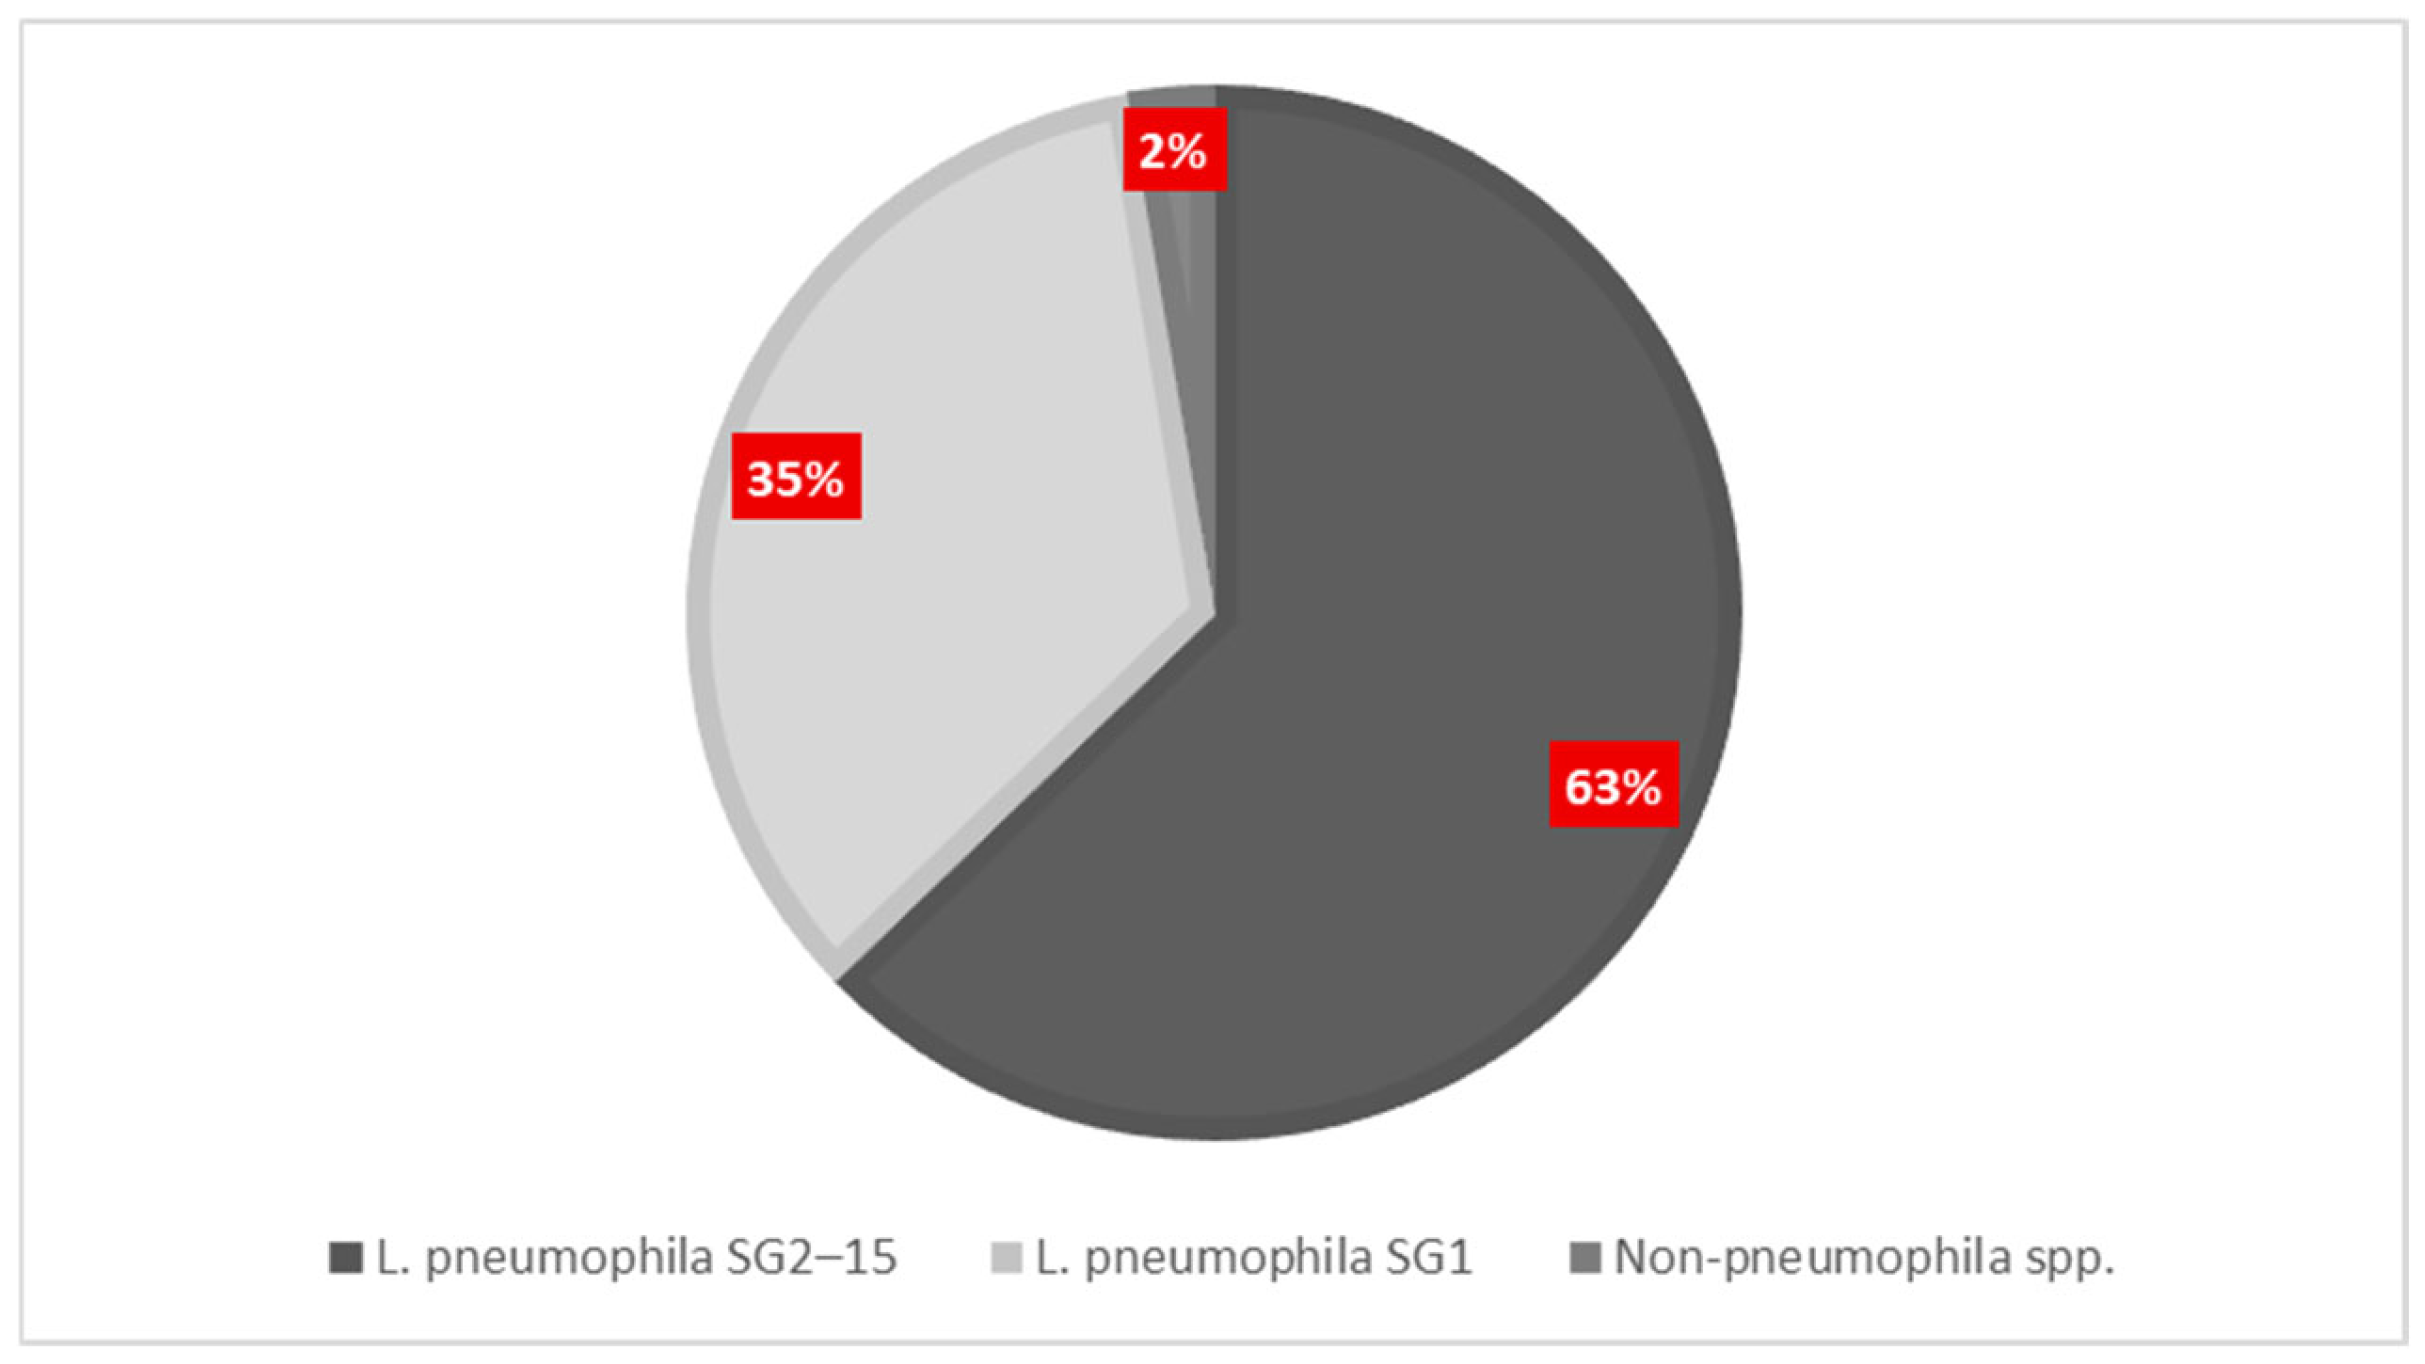
Figure 5.
Risk classification of Legionella spp. positive samples by facility type. Risk categories defined according to ELDSNet were low (<10³ CFU/L), medium (10³–<10⁴ CFU/L), and high (≥10⁴ CFU/L). Primary health care units exhibited the highest proportion of high-risk samples (20.17%), followed by passenger ships (6.25%) and hotels (4.60%).
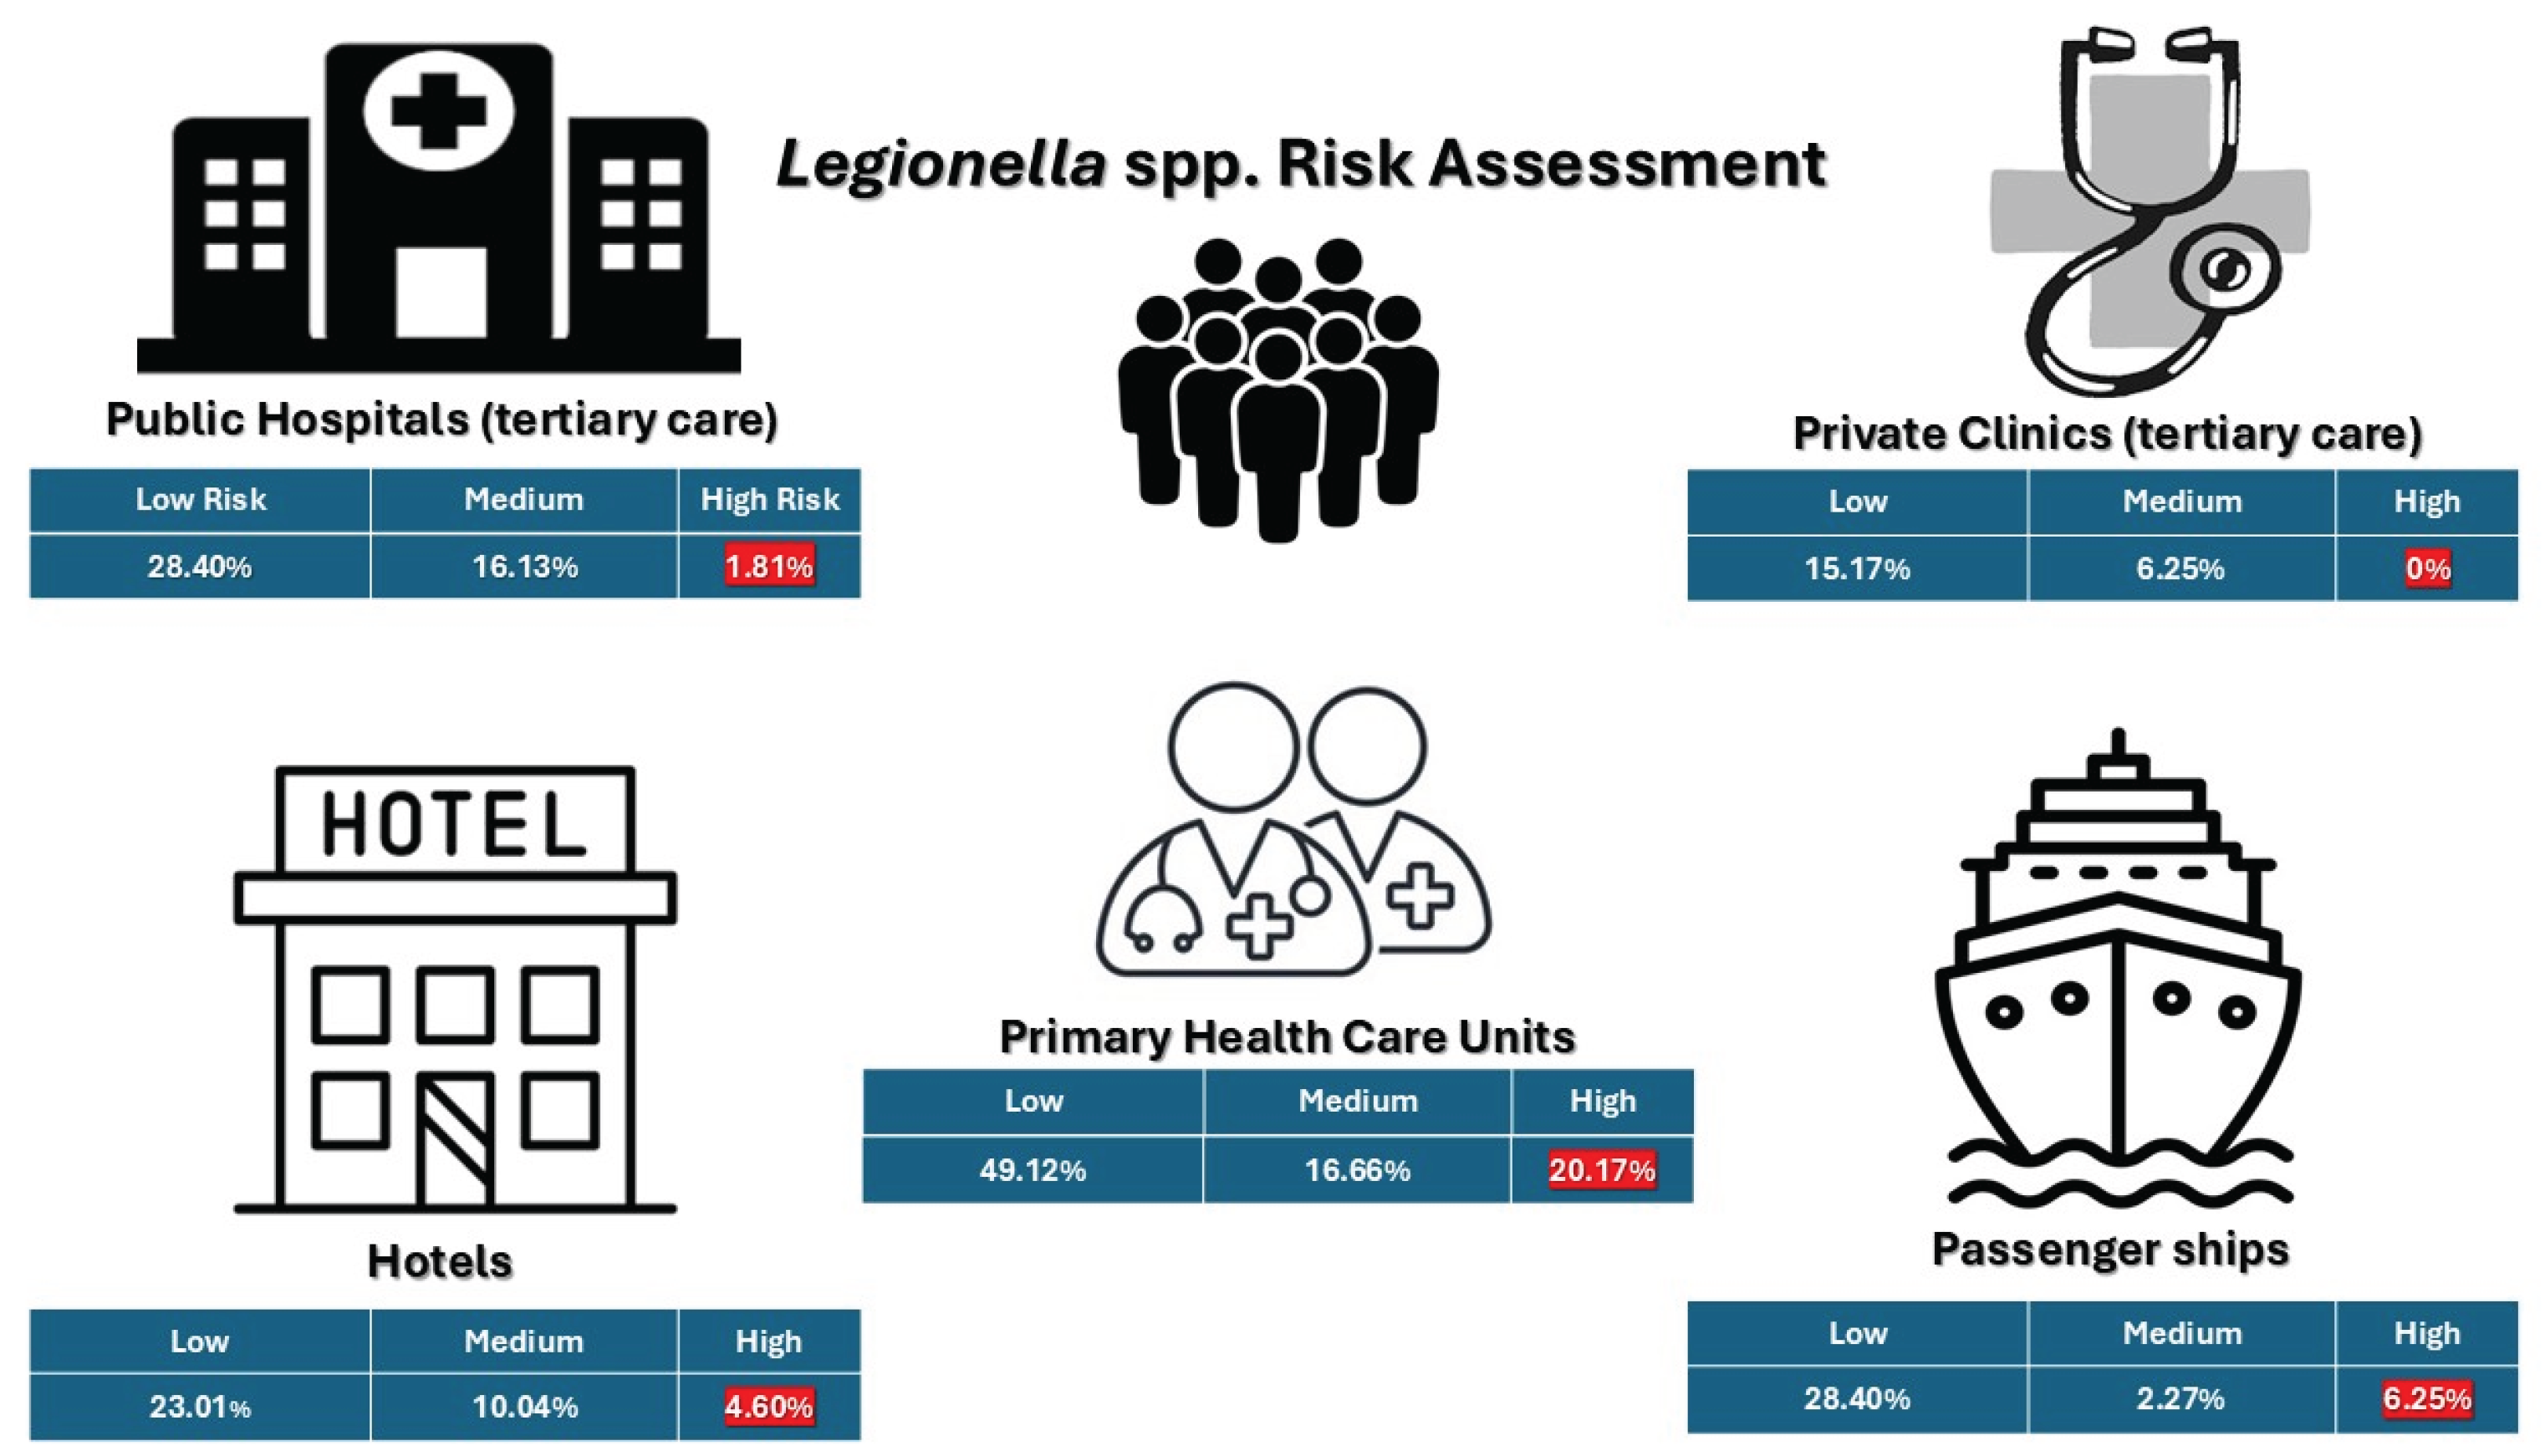

Table 1.
Distribution of water samples by facility type and number of samples collected from different sampling points. The description of the sampling sites does not correspond to the facilities present on each horizontal line.
Table 1.
Distribution of water samples by facility type and number of samples collected from different sampling points. The description of the sampling sites does not correspond to the facilities present on each horizontal line.
| Facilities sampled | Sampled sites | |||||||
|---|---|---|---|---|---|---|---|---|
| Facilities | Frequency | Percentage | Description | Frequency | Percentage | Description | ||
| Public Hospitals | 440 | 40.70% | Close point | 66 | 40.74% | Close point | ||
| Hotels | 239 | 22.11% | Far point | 96 | 59.26% | Far point | ||
| Passenger ships | 176 | 16.28% | Direct | 600 | 57.92% | Direct | ||
| Primary Healthcare units | 114 | 10.55% | Indirect | 436 | 42.08% | Indirect | ||
| Private Clinics | 112 | 10.36% | Cold water | 600 | 55.50% | Cold water | ||
| Total | 1081 | 100.00% | Hot water | 481 | 44,50% | Hot water | ||
Table 2.
Number of positive samples on Legionella concentration collected from different facilities.
Table 2.
Number of positive samples on Legionella concentration collected from different facilities.
| Facility | Number of samples | <103 cfu/L | >=103 and <104 cfu/L | >=104 cfu/L | Total positive samples (>50 cfu/L) |
|---|---|---|---|---|---|
| Public Hospitals (tertiary-level care) | 440 | 125 (28.40%) | 71 (16.13%) | 8 (1.81%) | 204 (46.36%) |
| Private Clinics | 112 | 17 (15.17%) | 7 (6.25%) | 0 | 24 (21.42%) |
| Primary Health Care | 114 | 56 (49.12%) | 19 (16.66%) | 23 (20.17%) | 98 (85.96%) |
| Hotels | 239 | 55 (23.01%) | 24 (10.04%) | 11 (4.60%) | 91 (38.08%) |
| Passenger ship | 176 | 50 (28.40%) | 4 (2.27%) | 11 (6.25%) | 65 (36.93%) |
| Total | 1081 | 303 (28.03%) | 125 (11.56%) | 53 (4.90%) | 482 (44.59%) |
Table 3.
Legionella-positive samples by sample type and collection point.
| Sample Type | Number of Samples (n) | Positive Samples (n, percentage) |
|---|---|---|
| Hot water (total) | 481 | 252 (52.28%) |
| └─ Direct outlet | 258 | 131 (50.71%) |
| └─ Indirect outlet | 206 | 103 (50%) |
| └─ Far away point | 50 | 24 (48%) |
| └─ Close point | 32 | 11 (34.37%) |
| Cold water (total) | 600 | 230 (47.72%) |
| └─ Direct outlet | 342 | 134 (39.18%) |
| └─ Indirect outlet | 230 | 83 (36.08%) |
| └─ Far away point | 46 | 12 (23.80%) |
| └─ Close point | 34 | 11 (28%) |
Table 4.
Distribution of Legionella serogroups detected across different facility types. The percentages for L. p. sg 1, ss 2-15 and L. species were calculated based on the positive samples.
Table 4.
Distribution of Legionella serogroups detected across different facility types. The percentages for L. p. sg 1, ss 2-15 and L. species were calculated based on the positive samples.
| Facility | Total Positive Samples (n, %) | L. pneumophila SG1 (n, %) | L. pneumophila SG2–15 (n, %) | Other Legionella spp. (n, %) |
|---|---|---|---|---|
| Hotels | 91 (18.88%) | 27 (29.60%) | 66 (72.5%) | 6 (6.59%) |
| Passenger ships | 65 (13.49%) | 24 (36.9%) | 41 (63.07%) | 0 (0.00%) |
| Primary Health Care | 98 (20.33%) | 21 (21.43%) | 80 (81.63%) | 0 (0.00%) |
| Private Clinics | 24 (4.98%) | 7 (29.17%) | 17 (70.83%) | 0 (0.00%) |
| Public Hospitals | 204 (42.32%) | 95 (46.57%) | 111 (54.41%) | 7 (3.43%) |
| Total | 482 (44.59%) | 174 (36.09%) | 315 (65.35%) | 13 (2.70%) |
Table 5.
Risk factors for Legionella colonization according to physicochemical parameters and water sampling sites.
Table 5.
Risk factors for Legionella colonization according to physicochemical parameters and water sampling sites.
| Risk Factor | Odds Ratio (Cross Product) | Odds Ratio (MLE) | Risk Ratio (RR) | Risk Difference (RD%) | p-V |
|---|---|---|---|---|---|
| Free residual chlorine < 0.2 mg/L | 2.2213 | 2.2175 | 2.2175 | 18.6545 | <0.0001 |
| Cold water temperature > 25 °C | 1.2380 | 1.2375 | 1.1252 | 5.2736 | 0.1 |
| Hot water temperature < 50 °C | 6.5394 | 6.5073 | 2.054 | 41.5504 | <0.0001 |
| Hot water temperature < 35 °C | 4.7365 | 4.7202 | 3.5792 | 22.3196 | <0.0001 |
| Turbidity (non-compliant) | 2.5662 | 2.5639 | 2.5313 | 1.3503 | 0.04 |
| Direct water sample (vs. outlet) | 0.9341 | 0.9342 | 0.9610 | -1.6562 | 0.29 |
| Sampling at the distal (far) outlet point | 1.3534 | 1.3504 | 1.1124 | 6.8915 | 0.22 |
Disclaimer/Publisher’s Note: The statements, opinions and data contained in all publications are solely those of the individual author(s) and contributor(s) and not of MDPI and/or the editor(s). MDPI and/or the editor(s) disclaim responsibility for any injury to people or property resulting from any ideas, methods, instructions or products referred to in the content. |
© 2025 by the authors. Licensee MDPI, Basel, Switzerland. This article is an open access article distributed under the terms and conditions of the Creative Commons Attribution (CC BY) license (http://creativecommons.org/licenses/by/4.0/).
Copyright: This open access article is published under a Creative Commons CC BY 4.0 license, which permit the free download, distribution, and reuse, provided that the author and preprint are cited in any reuse.


