
Submitted:
17 September 2025
Posted:
17 September 2025
You are already at the latest version
Abstract
Between April and May 2025, an outbreak of travel-associated Legionnaires’ disease (TALD) occurred, involving six cases at a hotel in Crete, Greece. Including two cases reported in 2023 and two additional cases from 2016 to 2017, 10 cases were associated with this accommodation site. All TALD cases were reported by the European Legionnaires’ Disease Surveillance Network (ELDSNet). In accordance with the surveillance and investigation protocols of the European Centre for Disease Prevention and Control (ECDC), local public health authorities immediately upon notification of the cases conducted on-site inspections at the hotel via the collection of water samples and conducting risk assessments, while simultaneously recording the required epidemiological, environmental, and physicochemical data. A total of 181 statistically analyzed water samples showed positive rates for Legionella spp. 13.81% (95% CI: 9.14–19.71) (≥50 CFU/L) and 7.73% (95% CI: 4.29–12.64) (≥1000 CFU/L). Risk assessments identified 18 stagnation points, systemic maintenance deficiencies, and high cumulative structural (30/52) and water (36/71) system risk scores. Low microbiological positivity of water samples does not necessarily equate to low risk, thus necessitating continuous risk assessment, implementation of Water Safety Plans, and integrated monitoring by accommodation facilities to prevent Legionnaires’ disease cases.
Keywords:
Legionella pneumophila
; environmental surveillance
; Legionnaires’ disease
; outbreak investigation
; risk assessment
; Water Safety Plan (WSP)
1. Introduction
Travel-associated Legionnaires’ disease (TALD) is defined as a clinical case of Legionnaires’ disease (LD) associated with travel and exposure to contaminated water systems in accommodation facilities such as hotels, resorts, and cruise ships [1,2,3,4,5,6,7]. In particular, according to the European Legionnaires’ Disease Surveillance Network (ELDSNet), the TALD case definition is “each case of a traveler who stayed at or visited a commercial accommodation site 2–10 days before clinical onset and has not been associated with other cases of LD in the last two years”. A cluster is identified when two or more travelers who have stayed at or visited the same commercial accommodation site within 2 to 10 days prior to the onset of illness and experience the onset of illness within the same two-year period. Similarly, according to European Union procedures, if “two or more travelers have stayed at the same accommodation within 14 days before the onset of symptoms”, this is considered relevant even if the illnesses are reported in Member States other than where the accommodation is located [8,9,10,11].
An outbreak is characterized by the occurrence of two or more cases of illness that are closely connected in time, typically within weeks rather than months, and in location. This is often accompanied by suspicion or evidence of a shared source of infection, which may or may not be supported by microbiological data, such as a common location indicated by travel history [2].
Travelers may encounter illness either during their journey or upon returning home, particularly when the travel duration exceeds one week. This is due to the incubation period, which ranges from 2 to 10 days, with an average of 5 to 6 days. During their travels, individuals may stay at multiple hotels across different cities or even countries according to their itinerary [8,9,10,11,12]. While a single case at a hotel does not confirm it as the infection source, multiple cases linked to the same accommodation within a short period suggest it as the likely source, warranting immediate investigation [2,13,14,15]. For rapid clusters, clinicians must monitor for Legionnaires’ disease symptoms such as myalgia, fatigue, cephalalgia, non-productive cough, and pyrexia, especially in patients who have recently traveled to affected areas [16,17].
The complexity of water distribution systems, characterized by intermittent flow and factors that contribute to water stagnation, such as variable water demand, aging infrastructure and piping, blind or dead legs, and insufficient residual disinfectants, constitutes the primary, though not exclusive, risk factors for the proliferation of Legionella [1,18,19]. Beyond the most common sources such as cooling towers and hot water systems, Legionella infections may also be linked to cold water systems and recreational areas (including pools and pool showers), water features, and hotel gardens [2,18,20,21].
To effectively reduce Legionella colonization, it is advised to maintain cold water temperatures under 20 °C, hot water temperatures above 50 °C, and free chlorine concentrations between 0.2 mg/L and 5 mg/L [22,23].
The chemical composition of the water intended for human consumption is of significant importance. Hard water facilitates the formation of deposits that protect biofilms. In contrast, mondarate water softening can reduce residual disinfectant levels, thus promoting the proliferation of opportunistic bacteria such as Legionella spp. and Pseudomonas aeruginosa [24,25,26,27].
Local public health authorities must monitor TALD cases by implementing simultaneous inspection, water sampling, and comprehensive risk assessment. This strategy is essential for identifying and managing the links between accommodation facilities and confirmed cases, clusters, or potential outbreaks. Recent studies have demonstrated that clusters associated with a particular hotel often reflect a larger community outbreak with extensive consequences [28,29,30,31].
A prior study utilizing surveillance data from Crete, Greece, spanning the years 2020 to 2025, identified persistent colonization in hotels, passenger ships, and healthcare facilities. Notably, hotels exhibited high positivity rates in 2025, despite the implementation of preventive measures [32,33,34]. Studies conducted in the post-COVID era at accommodation sites have revealed that following the initial three years of district-wide implementation of health protocols, there has been a relaxation in hotel hygiene standards. This has resulted in significant non-compliance with the mandated preventive measures and an increase in positivity rates [35,36,37,38].
In a review conducted in 2024, it was emphasized that the design of plumbing systems, water chemistry, and devices used for aerosol production significantly affect the persistence and risk of Legionella transmission [35].
A major concern is Legionnaires’ disease outbreaks, such as the outbreak in Spain in 2023, which was linked to outdoor hot tubs with evidence of aerosols spreading beyond intended users [18]. In 2025, the United States public health authorities recommended specific preventive measures, necessitating hotels and rental properties to implement or enhance water safety plans (WSP’s) prior to the peak tourist season [39]. Similarly, private hot tubs have been linked to an increase in Legionella infections on cruise ships from 2022 to 2024 [18].
In this study, TALD cases in a tourist facility in Crete, Greece (2016-2018 and 2023-2025) were examined. Six years after the initial Legionnaires’ disease cluster and routine self-monitoring, new clusters may arise without comprehensive risk-based controls. Moreover, the study showed that multiple confirmed cases can occur, even with low Legionella detection rates and partial control adherence. Microbiological, physicochemical, and structural risk factors were evaluated to determine whether the current surveillance thresholds prevent clusters in hotel water systems, comprising partial compliance in risk assessments and WSP’s.
2. Materials and Methods
2.1. Study Setting and Period
This case study investigates a three-star hotel in a small coastal municipality on Crete’s Island. The hotel operates seasonally from May to October, with a capacity of 94 rooms and 181 beds. The facility was built in 1982, with radical renovation around 2005. From the on-site inspection and the study of the architectural plans, the layout of the building was recorded, which included a basement, ground floor, and four upper floors intended exclusively for the accommodation of customers, as well as an outdoor recreational area.
The hotel infrastructure included a domestic hot water system, with three boilers of 2,000 L capacity, connected in series, heated by gas and solar panels, via heat exchangers and supported by a circulation pump and collector system. Fire protection relied on hose reels directly supplied from the potable water network, without a dedicated firefighting system, while climate control was provided by autonomous air conditioning units. Recreational water facilities comprised an outdoor swimming pool, supplied with municipal water, disinfected manually with sodium hypochlorite, and continuously recirculated through a sand filter, as well as two decorative fountains with recirculated but non-disinfected water. In addition, a separate reverse osmosis network with chlorine dioxide dosing supplied post-mix machines, kitchen appliances, and ice makers. Finally, irrigation was carried out via a drip system using water from the main supply. Moreover, the water was subjected to disinfection using hydrogen peroxide, which was subsequently replaced by chlorine dioxide in 2025 as a secondary to sodium hypochlorite disinfection method.
The environmental investigation and risk assessment period covers the timeline from to 2016-2018 to 2023,2025 and involves only the years in which TALD cases have been reported. During May 2025, extensive sampling was performed before the decision to close the facility by the local Public Health authority and after the implementation of control measures for the reopening of the facility.
2.2. Case Definition and Diagnostic Criteria
A confirmed case of Legionnaires’ disease was defined as a clinical or radiological diagnosis of pneumonia with laboratory confirmation of Legionella infection, consistent with international case definitions [40,41,42].
In this study, confirmed cases, as reported by ELSDNET, were identified either by urinary antigen detection of the L. pneumophila serogroup 1 or by PCR-based molecular detection of Legionella DNA in respiratory specimens. These criteria are in accordance with the Council of State and Territorial Epidemiologists (CSTE) 2020 definition for legionellosis surveillance and are fully aligned with the case definitions adopted by the European Centre for Disease Prevention and Control (ECDC), the World Health Organization (WHO), and the European Legionnaires’ Disease Surveillance Network (ELDSNet) for travel-associated Legionnaires’ disease (TALD)[40,43,44,45].
2.3. Sample Collection
A sampling plan was developed based on the architectural design of the hotel, encompassing both cold and hot water distribution networks, as well as recreational water facilities. The plan included storage tanks, boilers, recirculation lines, risers, outlets (such as showers and taps), and outdoor recreational water facilities. A total of 205 environmental samples were collected, comprising 174 bulk water samples and 7 swab samples for the enumeration of Legionella spp., 16 water samples for microbiological parameters (including Enterobacteriaceae), and 8 water samples for chemical parameters.
Microbiological sampling was performed according to the relevant ISO protocols implemented throughout the period 2016-2017 and 2023–2025, which included the selection of sampling points, rinsing procedures where required, and aseptic handling.
Water samples were collected for microbial analysis using sterile 1-liter bottles containing 20 mg/L sodium thiosulfate to neutralize the residual disinfectant. The samples were transported to the Regional Public Health Laboratory of the Crete Region and the Regional Public Health Laboratory of the Thessalia Region (samples in 2025) in insulated refrigerators at 5 ± 3 °C and were processed within 24 h of collection.
The temperature (°C), residual free chlorine (mg/L), and pH values were measured on-site at the time of sampling using calibrated portable instruments. The compliance limits for the physicochemical parameters were based on the accepted guidelines: hot water ≥50 °C, cold water ≤20 °C and free chlorine ≥0.2 mg/L.
2.4. Microbiological and Chemical Analysis
The detection and quantification of Legionella spp. in water samples followed ISO 11731-2 [46,47]. Water samples were concentrated by membrane filtration and resuspended in sterile distilled water. Aliquots (200 μL) were inoculated onto Buffered Charcoal Yeast Extract (BCYE) agar, BCYE without L-cysteine (BCY), and Glycine Vancomycin Polymyxin Cycloheximide (GVPC) agar. Inoculations were performed: (a) directly after filtration, (b) after heat treatment at 50 °C for 30 min, and (c) after acid treatment (0.2 mol/L HCl, pH 2.2). The detection limit was 50 CFU/L. The plates were incubated at 36 ± 1 °C in a 2.5% CO₂ atmosphere with increased humidity for up to 10 days. Suspected colonies were subcultured to confirm Legionella growth and identified using MALDI-TOF MS (Bruker Microflex LT) against the manufacturer’s microbial database, with confirmed L. pneumophila isolates serotyped to distinguish SG1 from SG2–15. Indicator bacteria (Enterobacteriaceae) were analyzed using ISO 9308-1:2014 [48], TVC@22°C ISO 6222:1999 [49], coliform bacteria ISO 9308-1:2014 [48], Amd1:2016, E. coli ISO 9308-1:2014 [48]& Amd1:2016, and intestinal enterococci ISO 7899-2:2000 [50].
Physicochemical parameters were determined according to Standard Methods for the Examination of Water and Wastewater and were validated in-house using HACH-based protocols, including calcium, magnesium, nitrates, nitrites, ammonium, sulfates, chlorides, pH, conductivity, total hardness, total alkalinity, and turbidity [51]. Physicochemical parameters were measured in situ: temperature (°C) after 2 min of flow, free residual chlorine (mg/L) using DPD colorimetry, and pH/conductivity using multiparameter probes.
2.4.1. Swab Samples
Swab samples were collected from faucets and shower outlets according to ISO 19458:2006 [52]. Sterile cotton swabs with sodium thiosulfate (20 mg/L) were inserted into the outlet surfaces, including aerators and showerheads. The swabs were placed in sterile tubes containing 10 mL of sterile water with sodium thiosulfate, stored at 2–8 °C, and processed within 24 h. Each swab was vortexed in transport fluid, and the suspension was concentrated and examined for Legionella spp., following ISO 11731:2017 [46,47] procedures, alongside water samples.
2.5. Risk Assessment (RA)
A combined risk assessment (RA) framework was applied to integrate international and national tools for Legionella control. The methodology incorporated the CDC Water Management Toolkit for developing a Water Management Program (WMP), the European Technical Guidelines 2017: minimizing the risk of Legionella infections in building water systems, and the national Greek NPHA checklist supported by structured scoring systems for building and water system characteristics [53].
RA was performed on-site at the investigated facility to systematically evaluate the potential for Legionella proliferation and exposure. The process involved step-by-step inspection and mapping of the entire water distribution system, with the identification of hazardous conditions (e.g., stagnation, suboptimal temperatures, inadequate disinfection, and external hazards) and corresponding control measures.
Overall, RA followed a multi-tool approach, integrating three standardized and internationally recognized checklists and scoring systems to ensure a comprehensive evaluation of system design, operation, maintenance, and verification practices.
2.5.1. ECDC Facility Inspection Tool for Travel-Associated Legionnaires’ Disease
This tool was applied to assess six main domains: (i) competence and training of personnel; (ii) domestic cold and hot water system control measures (temperature and biocide levels); (iii) other risk factors (e.g., stagnation and corrosion); (iv) cleaning and disinfection practices; (v) surveillance, monitoring, and recordkeeping; and (vi) additional water systems (e.g., spa pools, cooling towers, fountains). Each item was scored as “Yes,” “No,” or “Not applicable,” with accompanying comments. Noncompliance items were noted for corrective actions (Table S1) [54].
2.5.2. Greek National Public Health Authority (NPHA) Legionella Prevention and Management Checklist
This adapted checklist, originally developed for the 2004 Athens Olympic Games and subsequently incorporated into national guidelines, covers critical control points across the water network of the facility. It includes general infrastructure, cold- and hot-water systems, water-heating and storage appliances, faucets, and fire protection systems. Critical control points (CCPs) were weighed (3 points) and other non-compliance (−1 or −2 points), with the final score classified as satisfactory (A), relatively satisfactory (B), or unsatisfactory (C) (Table S2) [20].
2.5.3. Structural and Water System Risk Scoring Tables
These tables attribute quantitative risk scores to structural characteristics (e.g., facility classification, age, number of floors, seasonal use, and wellness facilities) and water system features (e.g., water source, recirculation type, storage tank use, temperature profile, and cleaning protocols). Scoring was based on published literature linking these parameters to Legionella colonization risk (Table S3-S4) [13].
All three checklists were completed during site inspection by trained public health officers in May 2025. Structural and operational data were cross-checked against maintenance logs, microbiological monitoring records, and direct physical inspections. The resulting risk scores and compliance ratings were later included as independent variables in preliminary multivariate logistic regression models to examine associations with three outcomes: (i) Legionella-positive samples (≥50 CFU/L), (ii) high-load Legionella-positive samples (≥1000 CFU/L), and (iii) occurrence of clinical LD cases linked to the facility.
All three checklists were completed during a site inspection by trained public health officers in May 2025. Structural and operational data were cross-checked against maintenance logs, microbiological monitoring records, and direct physical inspections. The resulting risk scores and compliance ratings were later included as independent variables in preliminary multivariate logistic regression models to examine associations with three outcomes: (i) Legionella-positive samples (≥50 CFU/L), (ii) high-load Legionella-positive samples (≥1000 CFU/L), and (iii) occurrence of clinical LD cases linked to the facility.
2.6. Risk Assessment and Statistical Analysis
Facility-specific risks were derived from the structural, operational, and physicochemical conditions. Data were analyzed using IBM SPSS Statistics v30.0 (IBM Corp., Armonk, NY, USA), Epi Info v7.2.7.0 (Centers for Disease Control and Prevention, Atlanta, GA, USA), and the MedCalc Relative Risk Calculator [55,56].
Descriptive statistics included frequencies, proportions, and 95% confidence intervals (CIs), using the Wilson score method. Associations between categorical variables were tested using Chi-square or Fisher’s exact test. Linear regression was used to examine trends in Legionella counts and physicochemical parameters. Relative risks (RRs) were calculated for noncompliance with temperature and chlorine thresholds. The proportion of Legionella-positive samples was estimated for each water source and outlet type using Wilson’s 95% CIs. CIs when n was small (e.g., single measurements). are exact Clopper–Pearson 95% intervals for proportions wide.
Multivariate logistic regression was applied to identify predictors for the following three outcomes: (i) environmental samples positive for Legionella spp. (≥50 CFU/L), (ii) samples with mean concentrations ≥1000 CFU/L, and (iii) confirmed Legionnaires’ disease cases linked to the facility. Independent variables included facility type, water system (hot vs. cold), sampling year, hot water temperature (<50 °C vs. ≥50 °C), and free residual chlorine (<0.2 mg/L vs. ≥0.2 mg/L). Odds ratios (ORs) with 95% confidence intervals (CIs) and p-values were reported.
Statistical significance was defined as p < 0.05, and highly significant results were defined as p < 0.0001.
3. Results
3.1. Descriptive Epidemiology of Confirmed Cases
3.1.1. Total Confirmed Cases in Crete (2025)
Considering all confirmed cases in Crete in 2025, the total number of confirmed LD cases was 16. Cases were associated to 14 hotels, three of which constituted clusters. The median age of patients was median 68.5 years (range 43–82), with 10 males (62.5%), 6 females (37.5%). Temporal distribution showed that cases occurred mainly in May–June, coinciding with the opening of the tourist season, when hotels resumed full operation after winter closures (May (11/16, 68.8%), April 2/16, June 2/16, and August 1/16). The median length of stay among cases was 7 days (range: 1–20), with females generally having slightly longer stays than males. The incubation period ranged from 6 to 18 days (median: 11.5 days). Overall, 10 patients recovered (81.25%), while 3 had unknown outcomes (18.75%). No fatalities were reported. Two cases had a history of staying in more than one accommodation site (three different hotels each) located in different regional units, which complicated the environmental investigation.
3.1.2. Case Study Hotel Confirmed Cases
A total of 10 confirmed cases of Legionnaires’ disease (LD) were linked to the investigated hotel between 2013 and 2025. The median age of the patients was 65.8 years (range: 43–81), with an equal sex distribution (5 males, 5 females) (Figure 1). The majority of cases occurred in 2025 (n = 6), with two cases in 2023 and single cases in 2017 and 2016. All patients were diagnosed using urinary antigen detection tests.
The mean incubation period was 13.0 days, while the mean exposure duration (i.e., length of stay) was 8.8 days. Eight patients recovered, whereas two had unknown outcomes due to lack of follow-up.
Analysis of exposure characteristics revealed sex-related differences (Figure 1). The median duration of stay was longer among females (12 days, IQR: 11–12, range: 5–21) than among males (7 days, IQR: 6–8, range: 0–10). Conversely, incubation periods were more variable in females (median: 12 days, IQR: 9–16, range: 7–27), whereas they were shorter and more consistent in males (median, 11 days; IQR, 11–12; range, 10–13).
Linear regression analysis indicated a weak positive association between the duration of stay and number of reported cases, suggesting that longer stays may increase cumulative exposure to aerosolized Legionella from showers, taps, or recreational water features. However, owing to the small sample size (n = 10) and limited variation in exposure duration, this association should be interpreted with caution.
3.2. Microbiological Results
The analysis of the temporal distribution of Legionella-positive samples between 2016 and 2025 demonstrated marked variability across the study period (Table 1). No positive samples were detected in 2016, 2023, or 2024, whereas sporadic detections occurred in 2018 (7.1% at both ≥50 CFU/L and ≥1000 CFU/L; 95% CI: 0.2–33.9). The highest positivity rates were recorded in 2017 (24.1% at ≥50 CFU/L, 95% CI: 12.1–49.4; 20.7% at ≥1000 CFU/L, 95% CI: 8.0–39.7) and again in 2025 (25.0% at ≥50 CFU/L, 95% CI: 15.6–36.6; 10.3% at ≥1000 CFU/L, 95% CI: 4.2–20.1).
In 2025, a notable reduction in positivity was evident after the implementation of corrective measures. Prior to the intervention, 17 out of 68 samples (25.0%; 95% CI: 15.6–36.6) surpassed the ≥50 CFU/L threshold, with 7 out of 61 (10.3%; 95% CI: 4.2–20.1) exceeding ≥1000 CFU/L. Following the intervention, all samples tested negative (0/32; 0.0–10.9%, 95% CI).
Overall, among the 181 samples collected during 2016–2025, 25% were positive at ≥50 CFU/L (95% CI: 15.6–36.6) and 7.7% at ≥1000 CFU/L (95% CI: 4.29–12.64). These findings underline both the temporal clustering of Legionella detection and effectiveness of corrective actions applied in 2025.
Among the 25 Legionella-positive samples identified between 2016 and 2025, L. pneumophila serogroup 1 (SG1) accounted for the majority, representing 68.0% (n = 17, 95% CI: 46.5–85.1), followed by L. pneumophila serogroup 3 at 16.0% (n = 4, 95% CI: 4.5–36.1) and non-pneumophila species at 16.0% (n = 4, 95% CI: 4.5–36.1) (Figure 2).
SG1 was detected in two different years, 2017 and 2025, with seven isolates recovered in 2017 and ten in 2025. Notably, SG1 was predominant during the outbreak year 2025, accounting for nearly 60% of all positive isolates.
Serogroup 3 was only sporadically detected, with a single isolate identified in 2018 and three additional isolates identified in 2025. Similarly, non-pneumophila species were rare, with one isolate detected in 2018 and three in 2025.
Overall, SG1 was the most frequently detected serogroup and exhibited temporal clustering, particularly during the outbreak year, whereas SG3 and the non-pneumophila isolates appeared sporadically and in lower proportions. This distribution underscores the epidemiological importance of SG1 as the predominant strain at the investigated facility.
Microbiological analysis of 16 water samples collected between April and June 2025 revealed variable total viable counts (TVC) at both 22 °C and 37 °C (Table S5). The highest heterotrophic bacterial loads at 22 °C were detected incoming municipal water supply (123 cfu/mL) and drinking water from a guest room tap (45 cfu/mL). At 37 °C, elevated counts were observed in the municipal supply inlet (108 cfu/mL) and indirectly at the incoming municipal supply (108 cfu/mL).
All samples tested negative for Escherichia coli, intestinal enterococci, and Pseudomonas aeruginosa. Nevertheless, the kitchen sink (vegetable processing/hand washing) exhibited extremely high levels of coliform bacteria (17,000 cfu/100mL), significantly surpassing acceptable limits and suggesting potential fecal contamination or biofilm formation. Conversely, Legionella spp. was identified at three sampling points: drinking water from a guest room tap (May 23, 2025), boiler outlet from the collector (June 22, 2025), and ice machine water (June 22, 2025). These positive detections, originating from both hot- and cold-water systems, indicate the potential for extensive colonization. Although the indicator organisms generally complied with standards, the presence of opportunistic pathogens at multiple outlets underscores the residual risk within the distribution system.
Association Between Total Coliforms and Presence of Legionella
Logistic regression analysis demonstrated a positive relationship between total coliform concentration and the probability of Legionella detection in environmental water samples (Figure 3). The predicted probability of Legionella presence increased with rising coliform counts, with the steepest slope observed at higher values. However, several Legionella-positive samples were identified at very low or undetectable coliform levels, indicating that the absence of coliforms does not guarantee the absence of Legionella. Detailed results of the combined physicochemical and microbiological analyses of the selected samples are provided in Table S5.
3.3. Physicochemical Parameters
On-site measurements of the water temperature and free residual chlorine were performed for all 181 samples at the time of collection (Figure 4).
Hot water temperature: The proportion of hot water samples below the recommended threshold of 50 °C was very low in most years (≤5%) but increased sharply in 2025, when almost all samples (>95%) failed to reach the required temperature. This represents a substantial deterioration in hot-water management and creates conditions that are highly conducive to Legionella proliferation. At the boiler outlet, 11 targeted measurements demonstrated that only two (18.2%; 95% CI: 2.3–51.8%) achieved ≥60 °C, while the majority (9/11; 81.8%; 95% CI: 48.2–97.7%) were non-compliant. In contrast, the return of hot water temperatures (n = 9) showed partial compliance, with five (55.6%; 95% CI: 21.2–86.3%) at ≥50 °C and four (44.4%; 95% CI: 13.7–78.8%) below this threshold. These findings indicate that although circulation and reheating are partially effective, insufficient boiler outlet temperatures represent the principal systemic weakness in hot water management.
Cold water temperature: In the early years (2016–2018), 5–15% of cold water samples exceeded 20 °C, and ≤10% exceeded 25 °C. After 2023, a marked increase was observed, with >50% of the samples in 2025 above 20 °C and nearly 70% exceeding 25 °C. These findings indicate a loss of cold water control and widespread thermal conditions within the optimal range for Legionella growth.
Free residual chlorine: Between 2016 and 2018, 30–50% of samples showed insufficient residual disinfectant (<0.2 mg/L), with wide annual variability. Although the levels improved after 2020, deficiencies persisted in 2023–2024, with up to ~10% of samples below the recommended threshold.
Association Between Physicochemical Non-Compliance and Legionella Positivity
Preliminary univariable analyses examined the relationship between physicochemical noncompliance and Legionella spp. positivity (≥50 CFU/L) (Table 2). Hot water below 55 °C was associated with a higher likelihood of positivity (RR = 1.81, 95% CI: 0.75–4.35), whereas cold water above 25 °C (RR = 0.55, 95% CI: 0.21–1.43) and free chlorine levels below 0.2 mg/L (RR = 0.33, 95% CI: 0.05–2.23) were associated with lower observed risk. None of these associations reached statistical significance, reflecting sparse data or wide confidence intervals.
Non-compliance was frequent: hot water <55 °C was recorded in 17/80 hot water measurements (21.3%), cold water >20 °C in 100/181 cold water measurements (55.2%), and free chlorine <0.2 mg/L in 21/80 measurements (11.6%).
These exploratory results suggest that suboptimal hot water temperatures (<55 °C) may increase the likelihood of Legionella colonization, consistent with the established risk mechanisms. The apparently “protective” associations observed for cold water >25 °C and low chlorine are likely due to the limited number of positive samples and confounding effects. Larger datasets are required to confirm or refute these associations (Table 2).
3.4. Chemical Composition of Selected Water Samples
Chemical analysis of eight selected sampling points conducted from April to June 2025 showed values largely within the international drinking water standards, with some notable elevations (Table S6). The pH ranged from 7.4 to 8.0, which is within the WHO guideline range. Chloride concentrations were elevated (350–371 mg/L), particularly at the cold tap in the departure area, whereas conductivity was consistently high (1050–1419 µS/cm) across all points tested. Water hardness ranged from 15 to 21.7 °dH, classifying the supply as moderately hard to hard. Turbidity reached 139 NTU at the cold tap in the departure area, although nitrates and nitrites remained well below the EU’s maximum permissible values.
The distributions of chloride, conductivity, and hardness values across the sampled outlets are shown in Figure 5. Overall, the results indicated a mineral-rich composition and uniformity in the quality of the municipal water supply across the distribution network. Elevated hardness and conductivity are of particular relevance to Legionella risk assessment, as they favor scale formation and biofilm development, conditions that may protect Legionella from disinfection, and promote persistence. Although only a limited number of water samples were subjected to chemical testing, their mean values were considered representative of the overall system, given a single, stable municipal source.
3.5. Dead Ends and Stagnant Lines Risk Assessment
Eighteen points with potential for water stagnation were identified within the hotel’s water distribution system, comprising five dead ends (27.8%) and 13 stagnant lines (72.2%). Spatial distribution: The majority of stagnation points were located on the ground floor (n = 11; 61.1%), followed by the basement (n = 3; 16.7%), fifth floor (n = 3; 16.7%), and terrace (n = 1; 5.6%). Ground-floor hotspots were primarily situated in restaurant, bar, and guest room areas, highlighting stagnation risks across both public and private water outlets. Fixture type distribution: Stagnant points were associated with fire hose reels (n = 2; 11.1%), both connected to the potable water supply; showers (n = 3; 16.7%), all in unused or under-construction areas; sinks/taps (n = 4; 22.2%), some of which were inaccessible due to equipment placement; and WCs/bidets (n = 4; 22.2%), all located in unused rooms. Additional isolated points include one washing machine, one post-mix beverage supply line, one solar panel supply line, and two kitchen connections without terminal fixtures.
3.6. Multiple Risk Assessment
3.6.1. ECDC Facility Inspection Tool for Travel-Associated Legionnaires’ Disease for Reducing Legionella Risk
A structured evaluation of the facility’s control practices was conducted using the European Technical Guidelines (2017) checklist (Table S1). Of the six assessed domains, four demonstrated complete noncompliance, while two showed only partial compliance. None of the domains achieved complete compliance.
Key deficiencies include the absence of a designated responsible person, lack of staff training, and absence of a written control program or logbooks. Preventive practices such as systematic flushing of outlets and maintenance of showerheads were not carried out, and stagnant pipework with visible corrosion was identified. Temperature monitoring of hot water systems only began in late May 2025, and thus did not represent continuous surveillance. Biocides were utilized (chlorine dioxide (obtained as a stabilized solution) in 2025, hydrogen peroxide previously), but no evidence of monitoring residuals at the distal outlets was available. The calorifiers and tanks were cleaned, but no standard operating procedures were documented. Although no spa pools or cooling towers were present, other secondary water systems (outdoor showers, irrigation, and decorative fountains) existed on site without evidence of routine monitoring.

Table 3.
Compliance with the European Technical Guidelines (2017) checklist for minimizing Legionella risk in building water systems at the investigated tourist facility.
Table 3.
Compliance with the European Technical Guidelines (2017) checklist for minimizing Legionella risk in building water systems at the investigated tourist facility.
| Domain | Key requirements | Compliance | Comments |
|---|---|---|---|
| 1. Personnel & responsibility | Appointed responsible person; staff training; external contractors competent | No | No designated person; no staff training |
| 2. Control measures | Potable supply; hot water 50–60 °C; cold water <25 °C; biocides monitored | Partial | Public water supply; chlorine dioxide in 2025; temperature monitoring only from late May 2025; no biocide monitoring |
| 3. Other risk factors | Flushing outlets; cleaning showerheads; no dead-legs; no corrosion | No | No flushing; no showerhead maintenance; stagnant pipework present; visible corrosion at outlets |
| 4. Cleaning & disinfection | Annual calorifier/tank cleaning; seasonal disinfection; filters/softeners maintained | Partial | Calorifiers and tanks cleaned; no filters; no written SOPs; incomplete network disinfection |
| 5. Surveillance & documentation | Written control programme; logbooks; risk assessment every 2 years; independent audit | No | No written programme, logbooks, or audit |
| 6. Particular water systems | Spa pools; cooling towers; other high-risk systems | Not applicable | No spa pools or cooling towers; outdoor showers, irrigation, fountains present but not monitored |
3.6.2. Greek National Public Health Authority (NPHA) Legionella Prevention and Management Checklist
The standardized checklist assessment (Table S1) yielded a total score of 38, corresponding to an unsatisfactory result (Category C) as it exceeded the >20% threshold of the maximum negative score and included multiple critical violations (Table S2). Key deficiencies in several domains have been identified.
Water storage and distribution: Sediments were present in the storage tanks, and annual cleaning/disinfection was not documented. Unused taps and stagnant piping without systematic removal or flushing were observed.
Fixtures and appliances: Showerheads and taps were not regularly descaled, and appliances were not consistently maintained under sanitary conditions.
Monitoring and record-keeping: No comprehensive logbooks were available for temperature, chlorine, or microbiological monitoring. Random water checks were not systematically performed, and there was no documented evidence of negative Legionella results in the preceding six months. Critical control points (CCPs): Cold water was not consistently maintained below 25 °C, hot water failed to reach >50 °C within 2 min at the outlets, and chlorine residuals were frequently <0.2 mg/L.
3.6.3. Structural and Water System Risk Scoring Tables
The structured risk assessment of the facility identified multiple vulnerabilities at both structural and water system levels (Tables S3 and S4).
Structural features (maximum score of 52): The facility reached a cumulative risk score of 30 points, reflecting several high-risk characteristics. Notably, no WSP was implemented and no designated personnel were responsible for Legionella control. The facility was classified as a <4–5 star hotel, >20 years old, >10 rooms per floor, and >40% of rooms with showers, all of which contributed to elevated scores due to increased building complexity and aged plumbing. Seasonal operation, absence of automated chlorination, and location in a small municipality (<10,000 residents) further increased structural risk.
Water system characteristics (maximum score of 71): The water system scored 36 points, indicating widespread deficiencies. Key factors included mixed water sources, partial recirculation, use of storage tanks, and absence of upstream treatment before water heaters. Preventive practices were limited; there was no formal cleaning and disinfection protocol, no systematic inspection or disinfection of storage tanks, and no registers, calendars, or checklists for documenting maintenance. The showerheads and taps were not replaced on a scheduled basis and microbiological monitoring for Legionella was not routinely performed.
Taken together, the combined total structural (30/52) and water system (36/71) risk scores highlight a facility operating at the maximum documented risk level with multiple overlapping deficiencies in design, operation, and maintenance that significantly increase the likelihood of Legionella colonization and transmission.
Finally, the facility’s water distribution system was mapped according to the CDC Water Management Toolkit methodology (Figure 6). The schematic highlights multiple risk points for Legionella growth and spread, including stagnation areas, storage tanks, solar water heaters, and recirculating loops within permissive temperature ranges. The absence of disinfectants and external hazards (e.g., main breaks and construction) was also noted. Control measures, such as disinfectant monitoring, temperature checks, and visual inspections, were embedded into the schematic to provide a comprehensive framework for prevention and mitigation. Together, the high risk scores and the measured deficiencies in temperature control, biocide residuals, and hydraulic design provide convergent evidence of a facility environment highly favorable for Legionella proliferation and persistence.
A heatmap summary of environmental non-compliance is shown in Figure 7, illustrating annual exceedances across microbiological (Legionella thresholds) and physicochemical parameters (temperature and free chlorine). Peaks in noncompliance were observed in 2017 and 2025, coinciding with the occurrence of clinical cases.
In line with the European Technical Guidelines, corrective measures were linked to predefined monitoring thresholds (Figure 8) [13]. Escalation was required when ≥10 LD cases occurred, ≥8 samples exceeded 1000 CFU/L, or ≥18 samples were positive, regardless of load. Actions included system-wide disinfection, replacement of terminal outlets, review of RA, and repeat monitoring. Lower-level detection (<8 samples ≥1000 CFU/L or <18 positives overall) required verification of existing control measures and targeted disinfection.
4. Discussion
This case study highlights a significant public health issue within hotel environments: the potential for outbreaks to occur in the absence of risk-based controls, even several years following the initial Legionnaires’ disease (LD) clusters. Our previous research also identified that environmental surveillance conducted in hotels in Crete from 2020 to 2025, particularly in the year 2025, confirmed the persistent colonization of Legionella. This was most frequently observed at hot water temperatures below 50 °C, and residual chlorine was measured below 0.2 mg/L [34,57].
In Mediterranean tourist areas, similar findings have been observed, for instance in Sardinia with colonization rates of 61.3% [58], in southern Italy during the period 2019–2021 with increased contamination [59,60], and 65.4% of the tourist facilities associated with suboptimal temperatures and chlorine levels [61].
Microbiological thresholds alone inadequately reflect Legionella infection risk. Resistance mechanisms, such as biofilm development and survival within amoebae, increase persistence despite disinfection [62]. Moreover, exposure can occur through both aspiration and inhalation pathways, which are not captured by culture thresholds [62,63]. Quantitative microbial risk assessment (QMRA) models show that concentration variability and exposure dynamics better explain transmission potential than absolute culture results [64,65,66].
4.1. Epidemiological Characteristics of Cases
4.1.1. Total Confirmed Cases in Crete (2025)
The epidemiological profile of Legionnaires’ disease (LD) cases in Crete from April to September 2025 reveals several critical patterns pertinent to public health surveillance. A total of 16 confirmed cases, distributed across 14 hotels—with three hotels experiencing clusters—illustrates that outbreaks can occur even when cases are dispersed across multiple facilities. The majority of cases were recorded in May, which coincides with the opening of hotels or the reduced occupancy at the start of the tourist season after the winter closure, since hotels do not remain in operation all year round. This is in agreement with other studies showing that stagnation in water systems during periods of non-operation or low occupancy promotes the colonization of Legionella. [66,67,68].
The median age of 68.5 years and the fact that most cases were male highlight the increased vulnerability of older men, which conforms to the European epidemiological patterns of LD. The incubation periods, ranging from 6 to 18 days, correspond to the expected variability of the TALD cases. No deaths were reported and most patients recovered, indicating effective case management and early diagnosis. However, the outcomes for several patients remain unknown, highlighting limitations in monitoring and surveillance as well as issues of privacy and medical confidentiality. These findings highlight the need for continuous monitoring of living spaces, early detection of clusters and implementation of preventive measures, particularly during seasonal resumption periods, when water system conditions may promote the proliferation of LD.
Two patients had a history of staying in multiple accommodation facilities in different regional units. This highlighted the need for molecular typing to confirm potential epidemiological identifications between clinical samples and environmental isolates. Furthermore, a detailed investigation of the symptom onset date is required to assess whether the incubation period corresponds to the days of stay in each hotel, as indicated in international guidelines. According to the European Legionnaires’ Disease Surveillance Network (ELDSNet) and ECDC case definitions, the incubation period for Legionnaires’ disease typically ranges from 2 to 10 days, most commonly 5–6 days, and careful alignment of exposure dates with symptom onset is critical to determine the most feasible site of infection [12,28,40,42,44,69].
4.1.2. Confirmed Cases in the Hotel Case Study
The 10 TALD cases reported from 2016 to 2025 exemplify well-documented interactions between host and exposure. The median age of 65.8 years corresponds with existing evidence indicating that older adults with comorbidities are particularly susceptible.[69,70,71]. Unlike the typical male predominance observed in Europe (male-to-female ratio >2:1) [72,73,74], the cases were equally distributed by sex. Female patients tended to have longer stays and more variable incubation periods, whereas male patients developed disease after shorter and more consistent exposures. These findings suggest that cumulative exposure during prolonged stay may increase the risk in women, whereas shorter, high-intensity exposures may be sufficient in men. These findings suggest that cumulative exposure during extended stays may increase the risk in females, whereas shorter, high-intensity exposures may suffice in males. Stay duration has been previously identified as a risk modifier [75,76,77]. The mean incubation period of 13.0 days falls within the expected 2–14-day range, although variability among females reflects reported outliers in travel associated cases [78,79]. Importantly, six cases in 2025 occurred within three weeks despite low environmental positivity, indicating that transient amplification events can trigger outbreaks be-yond what environmental data predict [80,81].
4.2. Environmental Positivity and Threshold Limitations
This investigation highlights that low culture-based positivity is not synonymous with a low transmission risk. Legionella spp. were detected in only 13.81% of the samples, with 7.73% above the ≥1000 CFU/L threshold (Table 1), yet a substantial 2025 cluster occurred. Similar patterns have been described in Greece and across southern Europe, where clusters emerged despite limited environmental positivity [80,81,82,83,84]. The temporal clustering of cases in May 2025, coinciding with rising temperatures and fluctuating water demands, supports a transient amplification event. Τaking immediate measures—including thermal disin-fection, chlorine dioxide dosing, and flushing—likely curtailed further cases in summer 2025. These findings restate the limitations of relying solely on microbiological thresholds as risk proxies.
4.3. Serogroup Distribution
The predominance of L. pneumophila serogroup 1 (SG1) (Figure 3) is consistent with its global epidemiological importance [85,86,87]. SG1 accounted for most positive samples during the outbreak year, coinciding with confirmed cases. The detection of SG3 and non-pneumophila species, though less frequent, underscores the diverse colonization potential of hotel water systems and the need for surveillance beyond SG1 [88,89].
4.4. Physicochemical and Structural Risk Factors
The statistical analysis of the physicochemical parameters indicated systemic deficiencies in the management of the required high water temperatures of the hotel’s water system, which contribute to its colonization by Legionella. The measurements of the temperatures of the hot water leaving the boiler for distribution were in the majority below 60 °C and the temperatures of the hot water returning to the engine room for reheating in the boiler were below 50 °C, this was a particularly worrying finding and in complete contrast to internationally accepted requirements. Boiler outlet temperatures are critical for thermal disinfection but also for ensuring that hot water, even to the most remote point of the installation, is delivered at at least 50 °C. Although the hot water circulation demonstrated partial compliance, these measures were insufficient to compensate for the low outlet efficiency. This finding is consistent with evidence that inadequate heating is a significant risk factor. Monitoring of cold water temperatures revealed non-compliances after 2023, with over half of the samples in 2025 exceeding 20 °C and 70% exceeding 25 °C. These temperatures fall within the optimal growth range for Legionella and indicate deficiencies in maintaining low temperatures, possibly due to inadequate insulation or stagnation and can also be partly attributed to the climate crisis affecting the Mediterranean basin with particularly high temperatures. The decline in cold water quality highlights the need for thermal control in both distribution networks, as failure in either facilitates colonization.
Free residual chlorine concentrations showed partial improvement after 2020 but remained intermittently deficient, with up to 10% of samples below 0.2 mg/L in 2023–2024. While disinfectant monitoring is an essential component of control, the present findings reinforce that chemical treatment alone cannot compensate for insufficient thermal management. Sustained microbial risk reduction requires both adequate disinfection and compliance with thermal thresholds. The exploratory risk analysis supports the established role of thermal conditions in Legionella ecology.
Elevated chloride, conductivity, and hardness levels indicated a mineral-rich groundwater supply (Tables S5,S6), favoring scale deposition and biofilm development that reduce disinfectant efficacy [90,91,92]. Consistent measurements across the outlets suggest systemic issues. Structural vulnerabilities, such as blind ends, stagnant lines, and complex recirculation loops, further promoted colonization despite generally low culture positivity. Seasonal operation exacerbates these risks, as prolonged stagnation during closure periods fosters microbial regrowth [19,67,93,94]. Low-star facilities may also face higher vulnerability owing to limited resources, outdated plumbing, and weaker WSP implementation [93,95]. In this case, the facility scored 30/52, indicating a moderate to high structural risk profile shaped by seasonal operation and organizational limitations.
4.5. Microbiological Indicators and Predictive Value
The detection of exceedingly high coliform levels (17,000 cfu/100mL) at the kitchen sink utilized for vegetable processing and hand washing presents significant concerns regarding hygiene and potential fecal contamination. This observation not only surpasses acceptable thresholds but also implies the possibility of biofilm formation or plumbing inadequacies. According to the results of the logistic regression analysis, a positive correlation between the total coliform concentration and the probability of Legionella detection was observed at elevated coliform counts. Nevertheless, the presence of Legionella in samples with low or undetectable coliform levels suggests that coliforms alone are not sufficient prognostic factors, highlighting the need for comprehensive monitoring that includes both microbiological and structural parameters.
4.6. Added Value of Structured Risk Assessment
The application of three structured risk assessment (RA) tools (Tables S1–S4), including the ECDC and Greek NPHA checklists, revealed consistent deficiencies in design, operation, and verification. Over 60% of the data in the inspection reports were non-compliant or partially compliant. Significant requirements that were not met concerned blind spots, hot water temperatures, inadequate flushing, incomplete records and absence of controls and finally the absence of a person responsible from the staff designated by the management for protection against Legionella and the training of staff directly related to this issue. Importantly, outlets with high-risk Priority Numbers overlapped with Legionella-positive sites, confirming the predictive value of RA, even when positivity rates were low. These findings support European evidence that RA reveals hidden vulnerabilities overlooked by culture alone [65,80,81,82]. The CDC Water Management Toolkit, combined with facility flowcharts and corrective action decision trees (Figure 7 and Figure 8), further illustrated how RA outputs can guide interventions and staff training in complex hotel water systems.
4.7. Comparison with Similar Cluster and Outbreak Investigations
Our findings align with European investigations showing that outbreaks can arise from either (i) localized, high-concentration sources (e.g., spas) or (ii) complex systems with intermittent colonization [72,84,96,97,98]. Borella et al. [99] linked structural complexity to risk regardless of culture results, while De Filippis et al. [100,101] highlighted the absence of WSPs and thermal control. In our case, only three samples (1.66%) exceeded 10,000 CFU/L, yet six cases occurred — in contrast to spa outbreaks, where counts exceeded 10⁶ CFU/L [102]. This suggests that even a few contaminated outlets, when combined with systemic risks, can sustain transmission.
4.8. Public Health Implications
This study demonstrates that clusters may occur in facilities that are compliant with microbiological thresholds. RA integration into surveillance and outbreak response provides a standardized evaluation, early hazard identification, and prioritization of remediation. In this case, RA findings directly informed corrective measures, such as removal of blind ends, chlorine dioxide dosing, and flushing protocols, aligning with European Technical Guidelines [2]. Notably, the facility lacked cooling towers or spas; however, a large cluster still occurred. This reinforces the fact that risk cannot be excluded in the absence of traditionally recognized high-risk systems and highlights the need for comprehensive guideline-based controls across all water systems.
4.9. Strengths and Limitations
The strengths of the study include the time span (2016–2018 and 2023–2025), the integration of microbiological, physicochemical and structural data, and the use of internationally recognized RA tools. The limitations include the fact that the study is based on a single facility, which may limit the generalizability of the findings. Moreover, the low levels of free chlorine observed in some samples may be attributable to the use of chlorine dioxide as a secondary disinfectant. Chlorine dioxide can react with or reduce free available chlorine (FAC), potentially leading to lower residual chlorine concentrations in the system. This interaction should be considered when interpreting chlorine measurements and assessing the disinfection effectiveness [103,104,105].
5. Conclusions
Minimizing the risk of Legionella in high-risk facilities, such as hotels, requires a comprehensive risk assessment approach that should not be based exclusively on the microbiological quality of water for human consumption, but should also include a continuous and systematic assessment of structural, operational, and epidemiological parameters. Preventive measures should focus on the removal of dead ends, isolation of fire extinguishing systems from water distribution networks, regular flushing of stagnant lines, and continuous verification of monitoring temperature and disinfectant residues. All written actions should be implemented systematically, particularly in the case of TALD. The designation and training of a personnel or external partner responsible for Legionella control, the implementation of a WSP, and continuous monitoring based on a documented risk assessment are essential prerequisites for compliance with European directives and national law and to minimize the risk of Legionnaires’ disease cases”.
6. Patents
This section is not mandatory but may be added if there are patents resulting from the work reported in this manuscript.
Supplementary Materials
The following supporting information can be downloaded at the website of this paper posted on Preprints.org. Table S1. Check List According to the European Technical Guidelines 2017: minimizing the risk from Legionella infections in building water systems, Table S2. Risk scores attributed to structural features of touristic-recreational facilities. The checklist has been adapted from the European Guidelines for Prevention and Control of Travel Associated Legionnaires’ disease and from the National School of Public Health 2004 Athens Olympic Games Checklist for building water systems, Table S3. Risk scores attributed to structural features of touristic-recreational facilities, Table S4. Risk scores attributed to water systems of touristic-recreational facilities, Table S5. Physicochemical and microbiological parameters of selected water samples collected from the hotel’s water distribution system, April–June 2025, Table S6. Results of chemical analyses of selected hotel water samples, April–June 2025.
Author Contributions
For conceptualization, methodology, and validation A.P. (Antonios Papadakis), E.K., D.C. and A.P. (Anna Psaroulaki) are responsible; formal analysis, investigation, and data curation, was conducted by A.P. (Antonios Papadakis), E.K., V.N., L.K., T.M., D.C. and A.P. (Anna Psaroulaki); writing—original draft preparation, A.P. (Antonios Papadakis) and E.K.; writing—review and editing, A.P. (Antonios Papadakis), L.K., T.M., D.C. and A.P. (Anna Psaroulaki); supervision, and project administration A.P. (Antonios Papadakis), D.C. and A.P. (Anna Psaroulaki) All authors have read and agreed to the published version of the manuscript.
Funding
This research received no external funding.
Institutional Review Board Statement
Not applicable.
Informed Consent Statement
Not applicable.
Data Availability Statement
The original contributions presented in the study are included in the article, further inquiries can be directed to the corresponding author.
Acknowledgments
We would like to thank all the environmental health inspectors of the Local Public Health Authorities of Crete Island who collected the environmental samples during all these years.
Conflicts of Interest
The authors declare no conflict of interest.
Abbreviations
The following abbreviations are used in this manuscript:
| LD | Legionnaires’ disease |
| ELDSNet | European Legionnaires’ Disease Surveillance Network |
| TALD | Travel-Associated Legionnaires’ Disease |
| ECDC | European Centre for Disease Prevention and Control |
| CFU | Colony-forming unit |
| WSP | Water Safety Plan |
| RA | Risk Assessment |
| RPN | Risk Priority Number |
| WMP | Water Management Program |
References
- Legionella (Legionnaires’ Disease and Pontiac Fever) | Legionella | CDC Available online: https://www.cdc.gov/legionella/index.html (accessed on 14 September 2025).
- European Technical Guidelines for the Prevention, Control and Investigation of Infections Caused by Legionella Species | Safety and Health at Work EU-OSHA Available online: https://osha.europa.eu/en/legislation/guidelines/european-technical-guidelines-prevention-control-and-investigation-infections-caused-legionella-species (accessed on 14 September 2025).
- Mouchtouri, V.A.; Rudge, J.W. Legionnaires’ Disease in Hotels and Passenger Ships: A Systematic Review of Evidence, Sources, and Contributing Factors. J. Travel. Med. 2015, 22, 325–337. [Google Scholar] [CrossRef] [PubMed]
- Doménech-Sánchez, A.; Laso, E.; Albertí, S. Determination of Legionella Spp. Prevalence in Spanish Hotels in Five Years. Are Tourists Really at Risk? Travel. Med. Infect. Dis. 2022, 46. [Google Scholar] [CrossRef]
- Anagnostopoulos, L.; Kourentis, L.; Papadakis, A.; Mouchtouri, V.A. Re-Starting the Cruise Sector during the COVID-19 Pandemic in Greece: Assessing Effectiveness of Port Contingency Planning. Int. J. Environ. Res. Public. Health 2022, 19, 13262. [Google Scholar] [CrossRef]
- Kourentis, L.; Anagnostopoulos, L.; Tsinaris, Z.; Galanopoulos, A.P.; Reusel, D. Van; Bogaert, R. Van den; Helewaut, B.; Steenhout, I.; Helewaut, H.; Damman, D.; et al. Legionella Spp. Colonization on Non-Passenger Ships Calling at Belgian Ports. Medical Sciences Forum 2022, Vol. 13, Page 15 2022, 13, 15. [Google Scholar] [CrossRef]
- Legionnaires’ Disease - Symptoms & Causes - Mayo Clinic Available online: https://www.mayoclinic.org/diseases-conditions/legionnaires-disease/symptoms-causes/syc-20351747 (accessed on 14 September 2025).
- Legionnaires’ Disease - Annual Epidemiological Report for 2021 Available online: https://www.ecdc.europa.eu/en/publications-data/legionnaires-disease-annual-epidemiological-report-2021 (accessed on 14 September 2025).
- Rota, M.C.; Bella, A.; Caporali, M.G.; Nicolau, A.; Drasar, V.; Ricci, M.L.; Scaturro, M.; Gumá, M.; Crespi, S. Travel-Associated Legionnaires’ Disease: Would Changing Cluster Definition Lead to the Prevention of a Larger Number of Cases? Epidemiol. Infect. 2018, 147. [Google Scholar] [CrossRef]
- Fields, B.S.; Benson, R.F.; Besser, R.E. Legionella and Legionnaires’ Disease: 25 Years of Investigation. Clin. Microbiol. Rev. 2002, 15, 506–526. [Google Scholar] [CrossRef] [PubMed]
- Phin, N.; Parry-Ford, F.; Harrison, T.; Stagg, H.R.; Zhang, N.; Kumar, K.; Lortholary, O.; Zumla, A.; Abubakar, I. Epidemiology and Clinical Management of Legionnaires’ Disease. Lancet Infect. Dis. 2014, 14, 1011–1021. [Google Scholar] [CrossRef]
- Chochlakis, D.; Sandalakis, V.; Keramarou, M.; Tselentis, Y.; Psaroulaki, A. Legionellosis: A Walk-through to Identification of the Source of Infection. Cent. Eur. J. Public. Health 2017, 25, 235–239. [Google Scholar] [CrossRef]
- De Giglio, O.; Napoli, C.; Diella, G.; Fasano, F.; Lopuzzo, M.; Apollonio, F.; D’Ambrosio, M.; Campanale, C.; Triggiano, F.; Caggiano, G.; et al. Integrated Approach for Legionellosis Risk Analysis in Touristic-Recreational Facilities. Environ. Res. 2021, 202, 111649. [Google Scholar] [CrossRef] [PubMed]
- Cowgill, K.O.; Lucas, C.E.; Benson, R.F.; Chamany, S.; Brown, E.W.; Fields, B.S.; Feikin, D.R. Recurrence of Legionnaires Disease at a Hotel in the United States Virgin Islands over a 20-Year Period. Clinical Infectious Diseases 2005, 40, 1205–1207. [Google Scholar] [CrossRef]
- Legionnaires’ Disease in the Caribbean. An Outbreak Associated with a Resort Hotel - PubMed Available online: https://pubmed.ncbi.nlm.nih.gov/4062461/ (accessed on 14 September 2025).
- Legionnaires’ Disease: Guidance, Data and Analysis - GOV.UK Available online: https://www.gov.uk/government/collections/legionnaires-disease-guidance-data-and-analysis (accessed on 14 September 2025).
- Leegionella Ltd. - Independent Public Health Microbiology Consultancy and Advisory Services Available online: https://leegionella.co.uk/ (accessed on 14 September 2025).
- Gumá, M.; Drasar, V.; Santandreu, B.; Cano, R.; Afshar, B.; Nicolau, A.; Bennassar, M.; Barrio, J. del; Crespi, P.; Crespi, S. A Community Outbreak of Legionnaires’ Disease Caused by Outdoor Hot Tubs for Private Use in a Hotel. Front. Microbiol. 2023, 14. [Google Scholar] [CrossRef] [PubMed]
- Nisar, M.A.; Ross, K.E.; Brown, M.H.; Bentham, R.; Whiley, H. Water Stagnation and Flow Obstruction Reduces the Quality of Potable Water and Increases the Risk of Legionelloses. Front. Environ. Sci. 2020, 8, 611611. [Google Scholar] [CrossRef]
- Papadakis, A.; Chochlakis, D.; Sandalakis, V.; Keramarou, M.; Tselentis, Y.; Psaroulaki, A. Legionella Spp. Risk Assessment in Recreational and Garden Areas of Hotels. Int. J. Environ. Res. Public. Health 2018, 15. [Google Scholar] [CrossRef]
- Mellou, K.; Mplougoura, A.; Mandilara, G.; Papadakis, A.; Chochlakis, D.; Psaroulaki, A.; Mavridou, A. Swimming Pool Regulations in the COVID-19 Era: Assessing Acceptability and Compliance in Greek Hotels in Two Consecutive Summer Touristic Periods. Water 2022, Vol. 14, Page 796 2022, 14, 796. [Google Scholar] [CrossRef]
- Legionnaires’ Disease - HSE Available online: https://www.hse.gov.uk/pubns/books/hsg274.htm (accessed on 14 September 2025).
- Legionella Control and Compliance Software | AquaAdept Available online: https://www.legionella-software.co.uk/ (accessed on 14 September 2025).
- Technologies for Legionella Control in Premise Plumbing Systems | US EPA Available online: https://www.epa.gov/ground-water-and-drinking-water/technologies-legionella-control-premise-plumbing-systems (accessed on 14 September 2025).
- Singh, R.; Hamilton, K.A.; Rasheduzzaman, M.; Yang, Z.; Kar, S.; Fasnacht, A.; Masters, S. V.; Gurian, P.L. Managing Water Quality in Premise Plumbing: Subject Matter Experts’ Perspectives and a Systematic Review of Guidance Documents. Water (Switzerland) 2020, 12. [Google Scholar] [CrossRef]
- Falkinham, J.O.; Pruden, A.; Edwards, M. Opportunistic Premise Plumbing Pathogens: Increasingly Important Pathogens in Drinking Water. Pathogens 2015, 4, 373–386. [Google Scholar] [CrossRef]
- Cullom, A.C.; Martin, R.L.; Song, Y.; Williams, K.; Williams, A.; Pruden, A.; Edwards, M.A. Critical Review: Propensity of Premise Plumbing Pipe Materials to Enhance or Diminish Growth of Legionella and Other Opportunistic Pathogens. Pathogens 2020, Vol. 9, Page 957 2020, 9, 957. [Google Scholar] [CrossRef]
- European Legionnaires’ Disease Surveillance Network (ELDSNet) - Operating Procedures. Available online: https://www.ecdc.europa.eu/en/publications-data/european-legionnaires-disease-surveillance-network-eldsnet-operating-procedures (accessed on 14 September 2025).
- Hadjichristodoulou, C.; Mouchtouri, V.; Vaitsi, V.; Kapoula, C.; Vousoureli, A.; Kalivitis, I.; Chervoni, J.; Papastergiou, P.; Vasilogiannakopoulos, A.; Daniilidis, V.D.; et al. Management of Environmental Health Issues for the 2004 Athens Olympic Games: Is Enhanced Integrated Environmental Health Surveillance Needed in Every Day Routine Operation? BMC Public. Health 2006, 6, 1–11. [Google Scholar] [CrossRef] [PubMed]
- Manage a Site Investigation for Travel-Associated Legionnaires Disease - GOV.UK. Available online: https://www.gov.uk/government/publications/report-a-site-investigation-for-travel-associated-legionnaires-disease (accessed on 14 September 2025).
- CDC Laboratory Guidance for Processing Environmental Samples | LD Investigations | CDC. Available online: https://www.cdc.gov/investigate-legionella/php/publications/lab-procedures-manual.html (accessed on 14 September 2025).
- Renwick, D.V.; Heinrich, A.; Weisman, R.; Arvanaghi, H.; Rotert, K. Potential Public Health Impacts of Deteriorating Distribution System Infrastructure. J. Am. Water Works Assoc. 2019, 111, 42–53. [Google Scholar] [CrossRef]
- LeChevallier, M.W.; Prosser, T.; Stevens, M. Opportunistic Pathogens in Drinking Water Distribution Systems—A Review. Microorganisms 2024, 12. [Google Scholar] [CrossRef]
- Papadakis, A.; Koufakis, E.; Chaidoutis, E.A.; Chochlakis, D.; Psaroulaki, A. Comparative Risk Assessment of Legionella Spp. Colonization in Water Distribution Systems Across Hotels, Passenger Ships, and Healthcare Facilities During the COVID-19 Era. Water (Switzerland) 2025, 17, 2149. [Google Scholar] [CrossRef]
- Yao, X.H.; Shen, F.; Hao, J.; Huang, L.; Keng, B. A Review of Legionella Transmission Risk in Built Environments: Sources, Regulations, Sampling, and Detection. Front. Public. Health 2024, 12, 1415157. [Google Scholar] [CrossRef]
- Papadakis, A.A.; Tsirigotakis, I.; Katranitsa, S.; Donousis, C.; Papalexis, P.; Keramydas, D.; Chaidoutis, E.; Georgakopoulou, V.E.; Spandidos, D.A.; Constantinidis, T.C. Assessing the Impact of the COVID-19 Pandemic Health Protocols on the Hygiene Status of Swimming Pools of Hotel Units. Medicine International 2023, 3, 32. [Google Scholar] [CrossRef] [PubMed]
- Papadakis, A.; Chochlakis, D.; Koufakis, E.; Carayanni, V.; Psaroulaki, A. Recreational Water Safety in Hotels: Lessons from the COVID-19 Pandemic and the Way Forward for a Safe Aquatic Environment. Tourism and Hospitality 2024, Vol. 5, Pages 1167-1181 2024, 5, 1167–1181. [Google Scholar] [CrossRef]
- Mellou, K.; Mplougoura, A.; Mandilara, G.; Papadakis, A.; Chochlakis, D.; Psaroulaki, A.; Mavridou, A. Swimming Pool Regulations in the COVID-19 Era: Assessing Acceptability and Compliance in Greek Hotels in Two Consecutive Summer Touristic Periods. Water 2022, Vol. 14, Page 796 2022, 14, 796. [Google Scholar] [CrossRef]
- Hotel Owners and Managers | Control Legionella | CDC. Available online: https://www.cdc.gov/control-legionella/php/hospitality/considerations-for-hotel-owners-and-managers.html (accessed on 14 September 2025).
- Legionella Outbreak Toolbox. Available online: https://legionnaires.ecdc.europa.eu/?pid=202 (accessed on 15 September 2025).
- Case Definitions - Guidance for the Public Health Management of Legionnaires’ Disease - Version 2 - Guidance for the Public Health Management of Legionnaires’ Disease - Publications - Public Health Scotland. Available online: https://publichealthscotland.scot/publications/guidance-for-the-public-health-management-of-legionnaires-disease/guidance-for-the-public-health-management-of-legionnaires-disease-version-2/case-definitions/ (accessed on 15 September 2025).
- Legionnaires’ Disease: Case Definitions - GOV.UK. Available online: https://www.gov.uk/government/publications/legionnaires-disease-clinical-case-definitions/legionnaires-disease-case-definitions (accessed on 15 September 2025).
- Legionellosis Surveillance and Trends | Legionella | CDC. Available online: https://www.cdc.gov/legionella/php/surveillance/index.html (accessed on 15 September 2025).
- About the Data: Case Definitions | LD Investigations | CDC. Available online: https://www.cdc.gov/investigate-legionella/php/data-research/case-definitions.html (accessed on 15 September 2025).
- Legionnaires. Available online: https://www.cste.org/page/Legionnaires (accessed on 15 September 2025).
- ISO 11731:2017 - Water Quality — Enumeration of Legionella. Available online: https://www.iso.org/standard/61782.html (accessed on 15 September 2025).
- ISO 11731-2:2004 - Water Quality — Detection and Enumeration of Legionella — Part 2: Direct Membrane Filtration Method for Waters with Low Bacterial Counts. Available online: https://www.iso.org/standard/32326.html (accessed on 15 September 2025).
- ISO 9308-1:2014 - Water Quality — Enumeration of Escherichia Coli and Coliform Bacteria — Part 1: Membrane Filtration Method for Waters with Low Bacterial Background Flora. Available online: https://www.iso.org/standard/55832.html (accessed on 15 September 2025).
- ISO 6222:1999 - Water Quality — Enumeration of Culturable Micro-Organisms — Colony Count by Inoculation in a Nutrient Agar Culture Medium. Available online: https://www.iso.org/standard/28960.html (accessed on 15 September 2025).
- ISO 7899-2:2000 - Water Quality — Detection and Enumeration of Intestinal Enterococci — Part 2: Membrane Filtration Method. Available online: https://www.iso.org/standard/14854.html (accessed on 15 September 2025).
- Standard Methods for the Examination of Water & Wastewater | Hach - Downloads. Available online: https://my.hach.com/standard-methods-for-the-examination-of-water-wastewater/product-downloads?id=59428492840 (accessed on 15 September 2025).
- ISO 19458:2006 - Water Quality — Sampling for Microbiological Analysis. Available online: https://www.iso.org/standard/33845.html (accessed on 15 September 2025).
- Toolkit: Developing a Legionella Water Management Program | Control Legionella | CDC. Available online: https://www.cdc.gov/control-legionella/php/toolkit/wmp-toolkit.html (accessed on 15 September 2025).
- Samuelsson, J.; Hallström, L.P.; Marrone, G.; Dias, J.G. Legionnaires’ Disease in the EU/EEA*: Increasing Trend from 2017 to 2019. Eurosurveillance 2023, 28. [Google Scholar] [CrossRef]
- Epi InfoTM | CDC. Available online: https://www.cdc.gov/epiinfo/index.html (accessed on 15 September 2025).
- MedCalc’s Relative Risk Calculator. Available online: https://www.medcalc.org/en/calc/relative_risk.php (accessed on 15 September 2025).
- Papadakis, A.; Keramarou, M.; Chochlakis, D.; Sandalakis, V.; Mouchtouri, V.A.; Psaroulaki, A. Legionella Spp. Colonization in Water Systems of Hotels Linked with Travel-Associated Legionnaires’ Disease. Water (Switzerland) 2021, 13, 2243. [Google Scholar] [CrossRef]
- Marras, L.; Bertolino, G.; Sanna, A.; Carraro, V.; Coroneo, V. Legionella Spp. Monitoring in the Water Supply Systems of Accommodation Facilities in Sardinia, Italy: A Two-Year Retrospective Analysis. International Journal of Environmental Research and Public Health 2023, Vol. 20, Page 6722 2023, 20, 6722. [Google Scholar] [CrossRef]
- Di Onofrio, V.; Pagano, M.; Santulli, M.; Rossi, A.; Liguori, R.; Di Dio, M.; Liguori, G. Contamination of Hotel Water Distribution Systems by Legionella Species: Environmental Surveillance in Campania Region, South Italy. Microorganisms 2023, Vol. 11, Page 1840 2023, 11, 1840. [Google Scholar] [CrossRef]
- Di Dio, M.; Santulli, M.; Pagano, M.; Rossi, A.M.; Liguori, R.; Liguori, G.; Di Onofrio, V. 4-Year Study in Monitoring the Presence of Legionella in the Campania Region’s Healthcare Facilities. Hygiene 2025, Vol. 5, Page 16 2025, 5, 16. [Google Scholar] [CrossRef]
- Domenech-Sanchez, A.; Laso, E.; Berrocal, C.I.; Albertí, S. Environmental Surveillance of Legionella in Tourist Facilities of the Balearic Islands, Spain, 2006 to 2010 and 2015 to 2018. Euro Surveill. 2022, 27. [Google Scholar] [CrossRef]
- Abu Khweek, A.; Amer, A.O. Factors Mediating Environmental Biofilm Formation by Legionella Pneumophila. Front. Cell Infect. Microbiol. 2018, 8, 38. [Google Scholar] [CrossRef]
- Khairullah, A.R.; Nuradji, H.; Nurjanah, D.; Dharmayanti, N.L.P.I.; Kusuma Wardhani, B.W.; Wibowo, S.; Moses, I.B.; Ariani Kurniasih, D.A.; Fauziah, I.; Kusala, M.K.J.; et al. Legionnaires’ Disease: A Review of Emerging Public Health Threats. Int. J. One Health 2025, 11, 62–77. [Google Scholar] [CrossRef]
- Sylvestre, É.; Charron, D.; Lefebvre, X.; Bedard, E.; Prévost, M. Leveraging Regulatory Monitoring Data for Quantitative Microbial Risk Assessment of Legionella Pneumophila in Cooling Towers. Science of The Total Environment 2025, 975, 179293. [Google Scholar] [CrossRef] [PubMed]
- Armstrong, T.W.; Haas, C.N. A Quantitative Microbial Risk Assessment Model for Legionnaires’ Disease: Animal Model Selection and Dose-Response Modeling. Risk Analysis 2007, 27, 1581–1596. [Google Scholar] [CrossRef]
- Buse, H.Y.; Schoen, M.E.; Ashbolt, N.J. Legionellae in Engineered Systems and Use of Quantitative Microbial Risk Assessment to Predict Exposure. Water Res. 2012, 46, 921–933. [Google Scholar] [CrossRef]
- Rhoads, W.J.; Hammes, F. Growth of Legionella during COVID-19 Lockdown Stagnation. Environ Sci (Camb) 2021, 7, 10–15. [Google Scholar] [CrossRef]
- Kunz, J.M.; Hannapel, E.; Vander Kelen, P.; Hils, J.; Hoover, E.R.; Edens, C. Effects of the COVID-19 Pandemic on Legionella Water Management Program Performance across a United States Lodging Organization. Int. J. Environ. Res. Public. Health 2023, 20, 6885. [Google Scholar] [CrossRef] [PubMed]
- Sopena, N.; Pedro-Botet, L.; Mateu, L.; Tolschinsky, G.; Rey-Joly, C.; Sabrià, M. Community-Acquired Legionella Pneumonia in Elderly Patients: Characteristics and Outcome. J. Am. Geriatr. Soc. 2007, 55, 114–119. [Google Scholar] [CrossRef] [PubMed]
- Fernández, J.A.; López, P.; Orozco, D.; Merino, J. Clinical Study of an Outbreak of Legionnaire’s Disease in Alcoy, Southeastern Spain. European Journal of Clinical Microbiology and Infectious Diseases 2002, 21, 729–735. [Google Scholar] [CrossRef]
- Increasing Rates of Legionnaires’ Disease in the EU/EEA. Available online: https://www.ecdc.europa.eu/en/news-events/increasing-rates-legionnaires-disease-eueea (accessed on 15 September 2025).
- Jain, N.; Krygowska, A.M. Legionnaire’s Looms: Europe’s Wake-up Call to Enhance Vigilance in Detection and Reporting. New Microbes New Infect. 2023, 55, 101194. [Google Scholar] [CrossRef] [PubMed]
- Viasus, D.; Gaia, V.; Manzur-Barbur, C.; Carratalà, J. Legionnaires’ Disease: Update on Diagnosis and Treatment. Infect. Dis. Ther. 2022, 11, 973–986. [Google Scholar] [CrossRef] [PubMed]
- Gleason, J.A.; Cohn, P.D. A Review of Legionnaires’ Disease and Public Water Systems – Scientific Considerations, Uncertainties and Recommendations. Int. J. Hyg. Environ. Health 2022, 240. [Google Scholar] [CrossRef]
- Rothberg, M.B.; Imrey, P.B.; Guo, N.; Deshpande, A.; Higgins, T.L.; Lindenauer, P.K. A Risk Model to Identify Legionella among Patients Admitted with Community-acquired Pneumonia: A Retrospective Cohort Study. J. Hosp. Med. 2022, 17, 624. [Google Scholar] [CrossRef]
- Bellew, S.; Grijalva, C.G.; Williams, D.J.; Anderson, E.J.; Wunderink, R.G.; Zhu, Y.; Waterer, G.W.; Bramley, A.M.; Jain, S.; Edwards, K.M.; et al. Pneumococcal and Legionella Urinary Antigen Tests in Community-Acquired Pneumonia: Prospective Evaluation of Indications for Testing. Clinical Infectious Diseases 2019, 68, 2026–2033. [Google Scholar] [CrossRef]
- Gorzynski, J.; Wee, B.; Llano, M.; Alves, J.; Cameron, R.; McMenamin, J.; Smith, A.; Lindsay, D.; Fitzgerald, J.R. Epidemiological Analysis of Legionnaires’ Disease in Scotland: A Genomic Study. Lancet Microbe 2022, 3, e835–e845. [Google Scholar] [CrossRef]
- Barskey, A.E.; Lackraj, D.; Tripathi, P.S.; Lee, S.; Smith, J.; Edens, C. Travel-Associated Cases of Legionnaires’ Disease in the United States, 2015–2016. Travel. Med. Infect. Dis. 2020, 40, 101943. [Google Scholar] [CrossRef]
- Marston, B.J. Surveillance for Legionnaires’ Disease. Arch. Intern. Med. 1994, 154, 2417. [Google Scholar] [CrossRef]
- Van Heijnsbergen, E.; Schalk, J.A.C.; Euser, S.M.; Brandsema, P.S.; Den Boer, J.W.; De Roda Husman, A.M. Confirmed and Potential Sources of Legionella Reviewed. Environ. Sci. Technol. 2015, 49, 4797–4815. [Google Scholar] [CrossRef]
- Yao, X.H.; Shen, F.; Hao, J.; Huang, L.; Keng, B. A Review of Legionella Transmission Risk in Built Environments: Sources, Regulations, Sampling, and Detection. Front. Public. Health 2024, 12, 1415157. [Google Scholar] [CrossRef] [PubMed]
- Papageorgiou, K.; Chronis, E.; Tzouanopoulos, A.; Steris, V.; Koutsopoulos, D.; Tzavaras, I.; Paraskevopoulos, K.; Karolidis, S. Prevalence of Legionella Spp. in the Water Distribution Systems of Northern Greece. Eur. J. Environ. Public. Health 2023, 7, em0147. [Google Scholar] [CrossRef]
- Winn, W.C. Legionnaires Disease: Historical Perspective. Clin. Microbiol. Rev. 1988, 1, 60–81. [Google Scholar] [CrossRef] [PubMed]
- Beauté, J.; Robesyn, E.; Jong, B. De Legionnaires’ Disease in Europe: All Quiet on the Eastern Front? European Respiratory Journal 2013, 42, 1454–1458. [Google Scholar] [CrossRef] [PubMed]
- Monistero, V.; Vicari, N.; Prati, P.; Bragoni, R.; Gazzola, A.; Sala, L.; Maisano, A.; Moroni, P.; Bronzo, V.; Luini, M.V.; et al. A Rapid and Reliable Method for Early Legionella Pneumophila Identification and Characterization in Support of the Epidemiology Study. Front. Microbiol. 2024, 15, 1452861. [Google Scholar] [CrossRef]
- Arrigo, I.; Galia, E.; Fasciana, T.; Diquattro, O.; Tricoli, M.R.; Serra, N.; Palermo, M.; Giammanco, A. Four-Year Environmental Surveillance Program of Legionella Spp. in One of Palermo’s Largest Hospitals. Microorganisms 2022, 10. [Google Scholar] [CrossRef] [PubMed]
- Scaturro, M.; Lanni, A.; Mancini, F.; Girolamo, A.; Fillo, S.; Ciammaruconi, A.; Lista, F.; Cocuzza, C.E.; Musumeci, R.; Ginevra, C.; et al. Antimicrobial Susceptibility and Epidemiological Types of Legionella Pneumophila Human Isolates from Italy (1987–2020). J. Glob. Antimicrob. Resist. 2025, 41, 181–188. [Google Scholar] [CrossRef]
- Uldum, S.A.; Schjoldager, L.G.; Baig, S.; Cassell, K. A Tale of Four Danish Cities: Legionella Pneumophila Diversity in Domestic Hot Water and Spatial Variations in Disease Incidence. Int. J. Environ. Res. Public. Health 2022, 19, 2530. [Google Scholar] [CrossRef]
- Kyritsi, M.A.; Mouchtouri, V.A.; Katsioulis, A.; Kostara, E.; Nakoulas, V.; Hatzinikou, M.; Hadjichristodoulou, C. Legionella Colonization of Hotel Water Systems in Touristic Places of Greece: Association with System Characteristics and Physicochemical Parameters. International Journal of Environmental Research and Public Health 2018, Vol. 15, Page 2707 2018, 15, 2707. [Google Scholar] [CrossRef]
- Controlling Legionella in Potable Water Systems | Control Legionella | CDC. Available online: https://www.cdc.gov/control-legionella/php/toolkit/potable-water-systems-module.html (accessed on 15 September 2025).
- Almeria, S.; Raki’c, A.R.; Vuki’c, D.; Luši’cluši’c, V.; Jurčev, A.; Savičevi’c, S. Influence of Metal Concentration and Plumbing Materials on Legionella Contamination. Microorganisms 2022, Vol. 10, Page 1051 2022, 10, 1051. [Google Scholar] [CrossRef]
- Xi, H.; Ross, K.E.; Hinds, J.; Molino, P.J.; Whiley, H. Efficacy of Chlorine-Based Disinfectants to Control Legionella within Premise Plumbing Systems. Water Res. 2024, 259. [Google Scholar] [CrossRef]
- Li, X.; Xu, J.; Wu, J.; Weir, M.H.; Xi, C. Prevalence of Legionella in a Public Building Water Plumbing System During COVID-19 Lockdown. Environment & Health 2023, 1, 352. [Google Scholar] [CrossRef] [PubMed]
- Nisar, M.A.; Ross, K.E.; Brown, M.H.; Bentham, R.; Whiley, H. Water Stagnation and Flow Obstruction Reduces the Quality of Potable Water and Increases the Risk of Legionelloses. Front. Environ. Sci. 2020, 8. [Google Scholar] [CrossRef]
- Kahn, R.; Derado, G.; Hannapel, E.J.; Vander Kelen, P.; Kunz, J.M.; Edens, C. Factors Associated with Legionella Detection in the Water Systems of National Lodging Organization Facilities with Water Management Programs in the United States. International Journal of Environmental Research and Public Health 2024, Vol. 21, Page 939 2024, 21, 939. [Google Scholar] [CrossRef] [PubMed]
- Brousseau, N.; Lévesque, B.; Guillemet, T.A.; Cantin, P.; Gauvin, D.; Giroux, J.P.; Gingras, S.; Proulx, F.; Côté, P.A.; Dewailly, E. Contamination of Public Whirlpool Spas: Factors Associated with the Presence of Legionella Spp., Pseudomonas Aeruginosa and Escherichia Coli. Int. J. Environ. Health Res. 2013, 23, 1–15. [Google Scholar] [CrossRef]
- Benkel, D.H.; McClure, E.M.; Woolard, D.; Rullan, J. V.; Miller, G.B.; Jenkins, S.R.; Hershey, J.H.; Benson, R.F.; Pruckler, J.M.; Brown, E.W.; et al. Outbreak of Legionnaires’ Disease Associated with a Display Whirlpool Spa. Int. J. Epidemiol. 2000, 29, 1092–1098. [Google Scholar] [CrossRef]
- Coetzee, N.; Duggal, H.; Hawker, J.; Ibbotson, S.; Harrison, T.G.; Phin, N.; Laza-Stanca, V.; Johnston, R.; Iqbal, Z.; Rehman, Y.; et al. An Outbreak of Legionnaires’ Disease Associated with a Display Spa Pool in Retail Premises, Stoke-on-Trent, United Kingdom, July 2012. Eurosurveillance 2012, 17. [Google Scholar] [CrossRef]
- Borella, P.; Montagna, M.T.; Romano-Spica, V.; Stampi, S.; Stancanelli, G.; Triassi, M.; Neglia, R.; Marchesi, I.; Fantuzzi, G.; Tatòt, D.; et al. Legionella Infection Risk from Domestic Hot Water. Emerg. Infect. Dis. 2004, 10, 457. [Google Scholar] [CrossRef]
- De Filippis, P.; Mozzetti, C.; Messina, A.; D’Alò, G.L. Data on Legionella Prevalence and Water Quality in Showers of Retirement Homes and Group Homes in the Province of Rome, Lazio Region, Italy. Data Brief. 2018, 19, 2364–2373. [Google Scholar] [CrossRef]
- De Filippis, P.; Mozzetti, C.; Messina, A.; D’Alò, G.L. Prevalence of Legionella in Retirement Homes and Group Homes Water Distribution Systems. Science of the Total Environment 2018, 643, 715–724. [Google Scholar] [CrossRef] [PubMed]
- Leoni, E.; Catalani, F.; Marini, S.; Dallolio, L. Legionellosis Associated with Recreational Waters: A Systematic Review of Cases and Outbreaks in Swimming Pools, Spa Pools, and Similar Environments. International Journal of Environmental Research and Public Health 2018, Vol. 15, Page 1612 2018, 15, 1612. [Google Scholar] [CrossRef]
- Hatanaka, N.; Xu, B.; Yasugi, M.; Morino, H.; Tagishi, H.; Miura, T.; Shibata, T.; Yamasaki, S. Chlorine Dioxide Is a More Potent Antiviral Agent against SARS-CoV-2 than Sodium Hypochlorite. Journal of Hospital Infection 2021, 118, 20–26. [Google Scholar] [CrossRef] [PubMed]
- Padhi, R.K.; Subramanian, S.; Satpathy, K.K. Formation, Distribution, and Speciation of DBPs (THMs, HAAs, ClO2−,AndClO3−) during Treatment of Different Source Water with Chlorine and Chlorine Dioxide. Chemosphere 2019, 218, 540–550. [Google Scholar] [CrossRef] [PubMed]
- Włodyka-Bergier, A.; Bergier, T. Influence of the Use of an Additional Oxidant (Chlorine Dioxide) in Water Treatment on Swimming Pool Water Quality. Energies 2022, Vol. 15, Page 5054 2022, 15, 5054. [Google Scholar] [CrossRef]
Figure 1.
Distribution of Legionnaires’ disease cases by demographic and epidemiological characteristics; Age–sex distribution of cases (top panel), days of stay by sex (middle panel), and incubation period by sex (bottom panel).
Figure 1.
Distribution of Legionnaires’ disease cases by demographic and epidemiological characteristics; Age–sex distribution of cases (top panel), days of stay by sex (middle panel), and incubation period by sex (bottom panel).
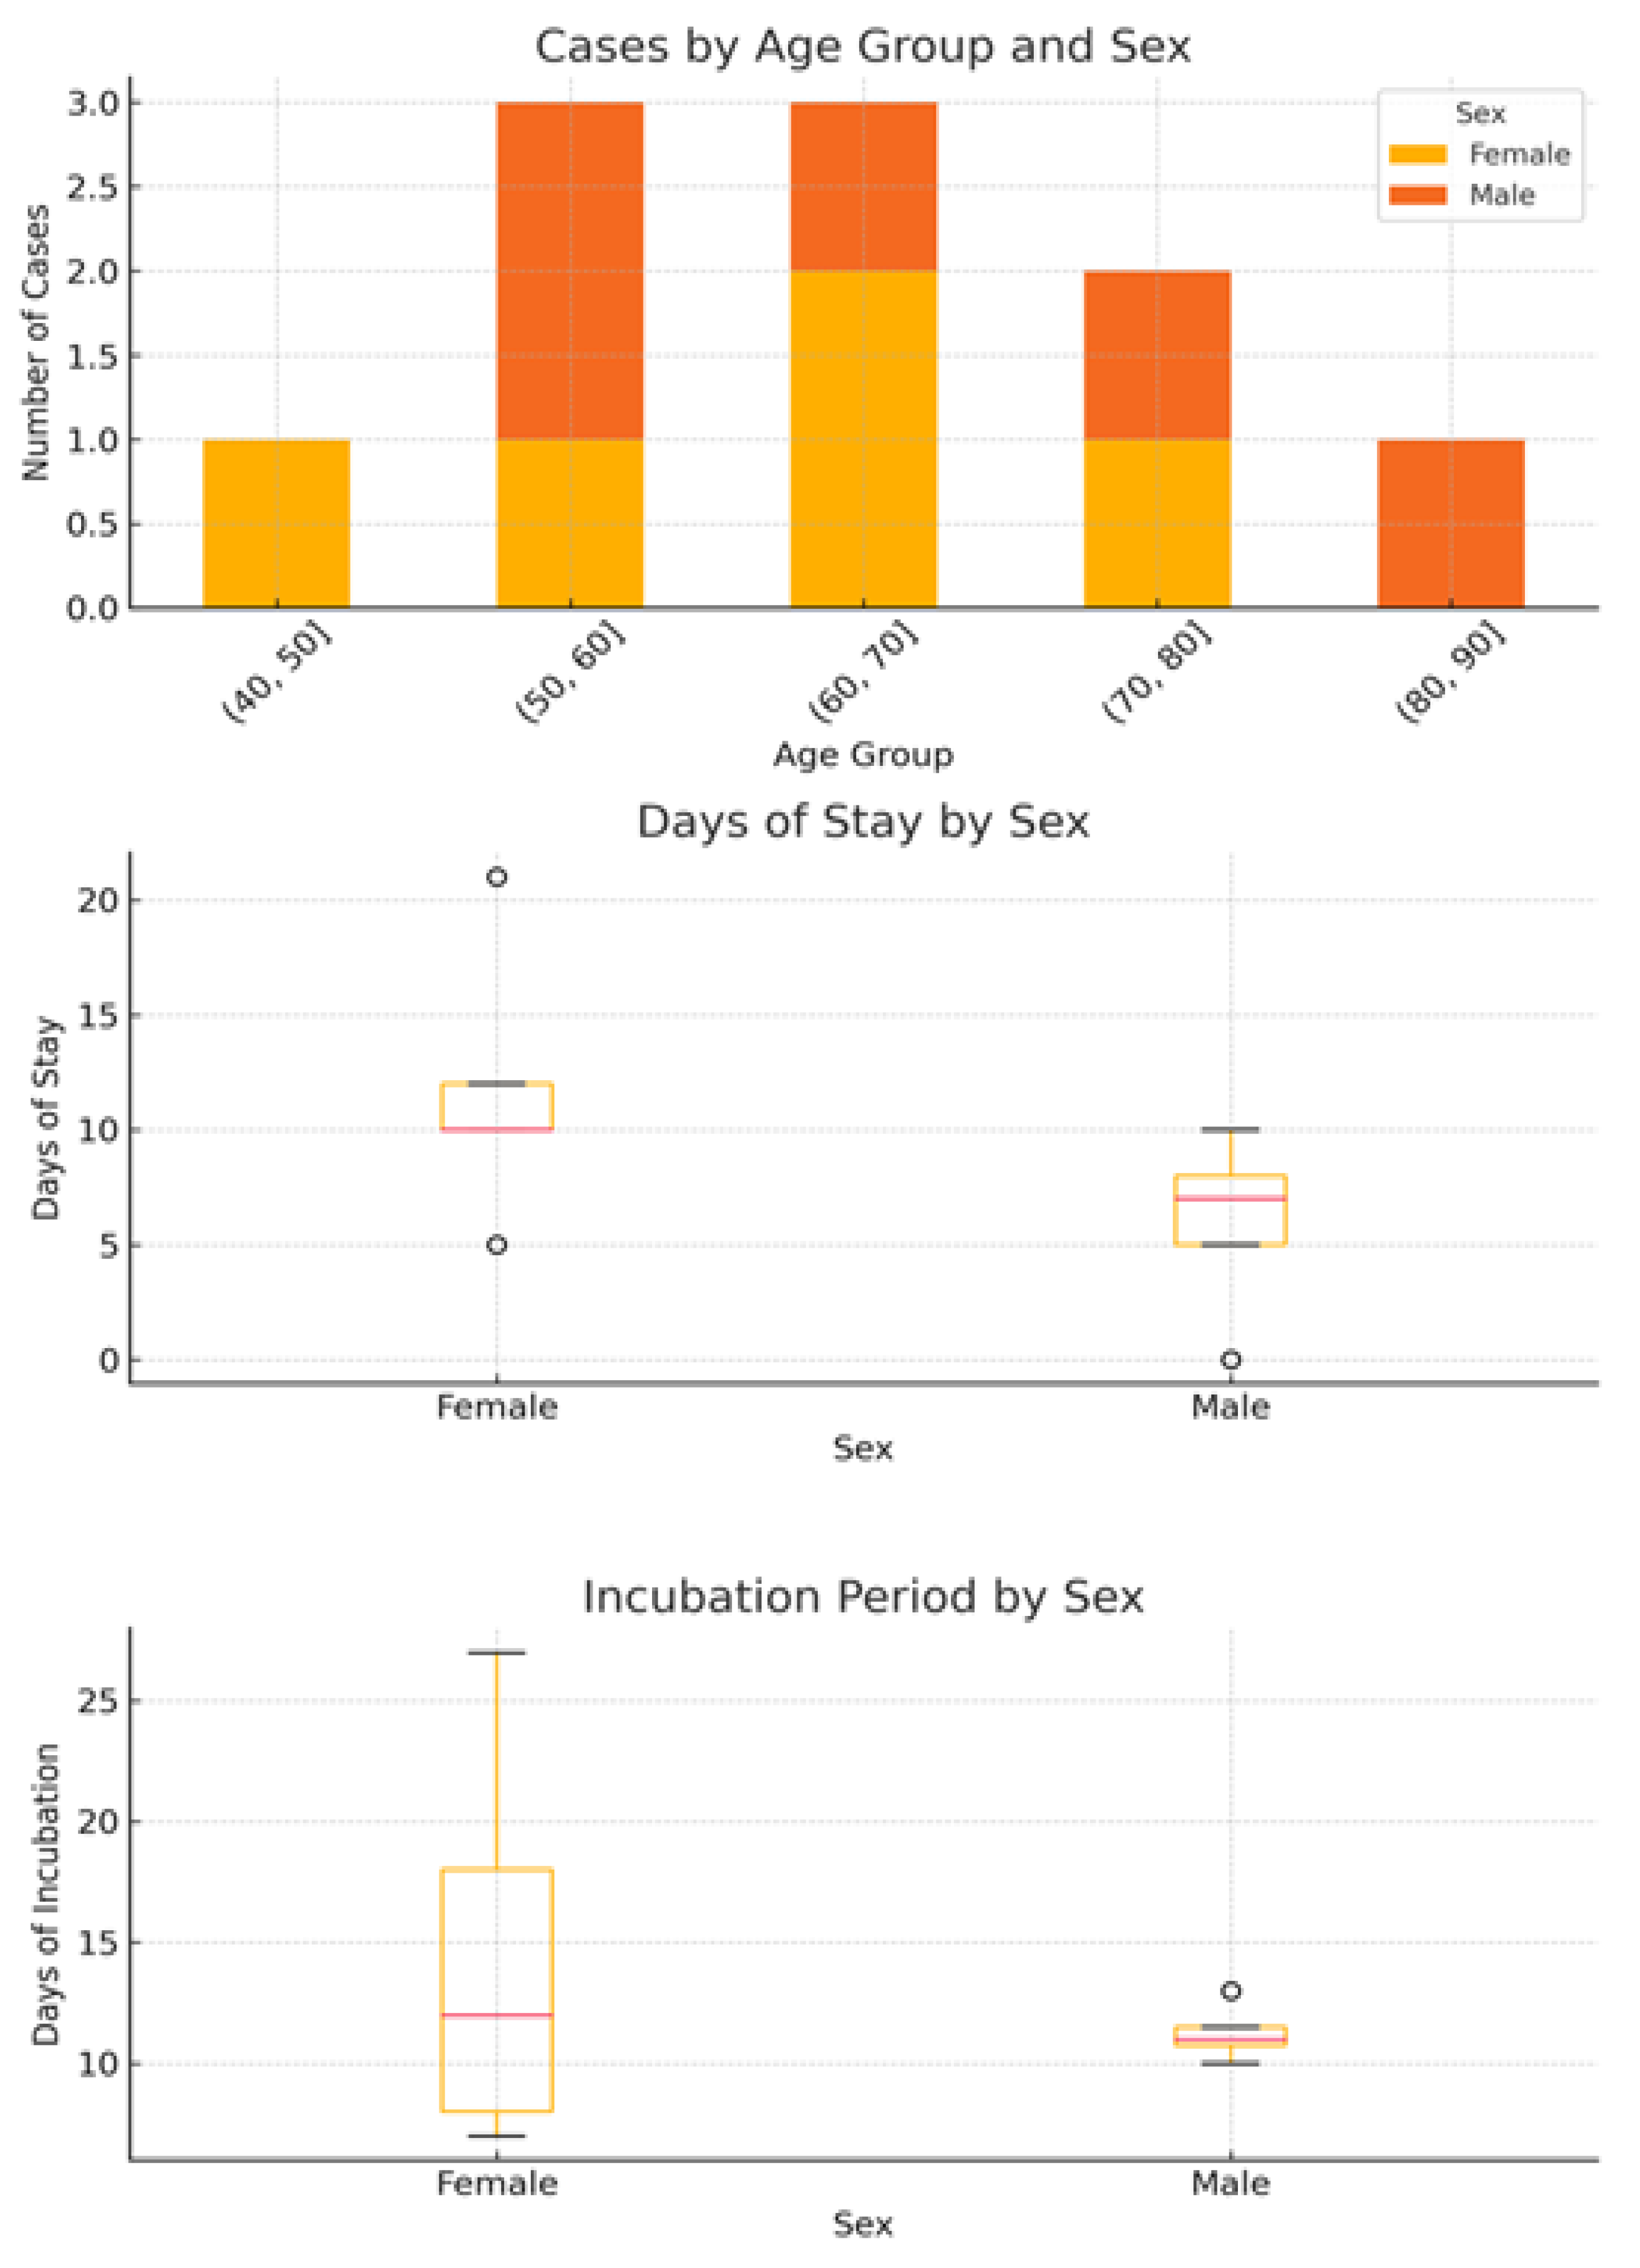
Figure 2.
Distribution of Legionella serogroups among all positive environmental samples (n = 25), 2016–2025; L. pneumophila serogroup 1 (SG1) predominated, followed by L. pneumophila serogroup 3 and non-pneumophila species.
Figure 2.
Distribution of Legionella serogroups among all positive environmental samples (n = 25), 2016–2025; L. pneumophila serogroup 1 (SG1) predominated, followed by L. pneumophila serogroup 3 and non-pneumophila species.
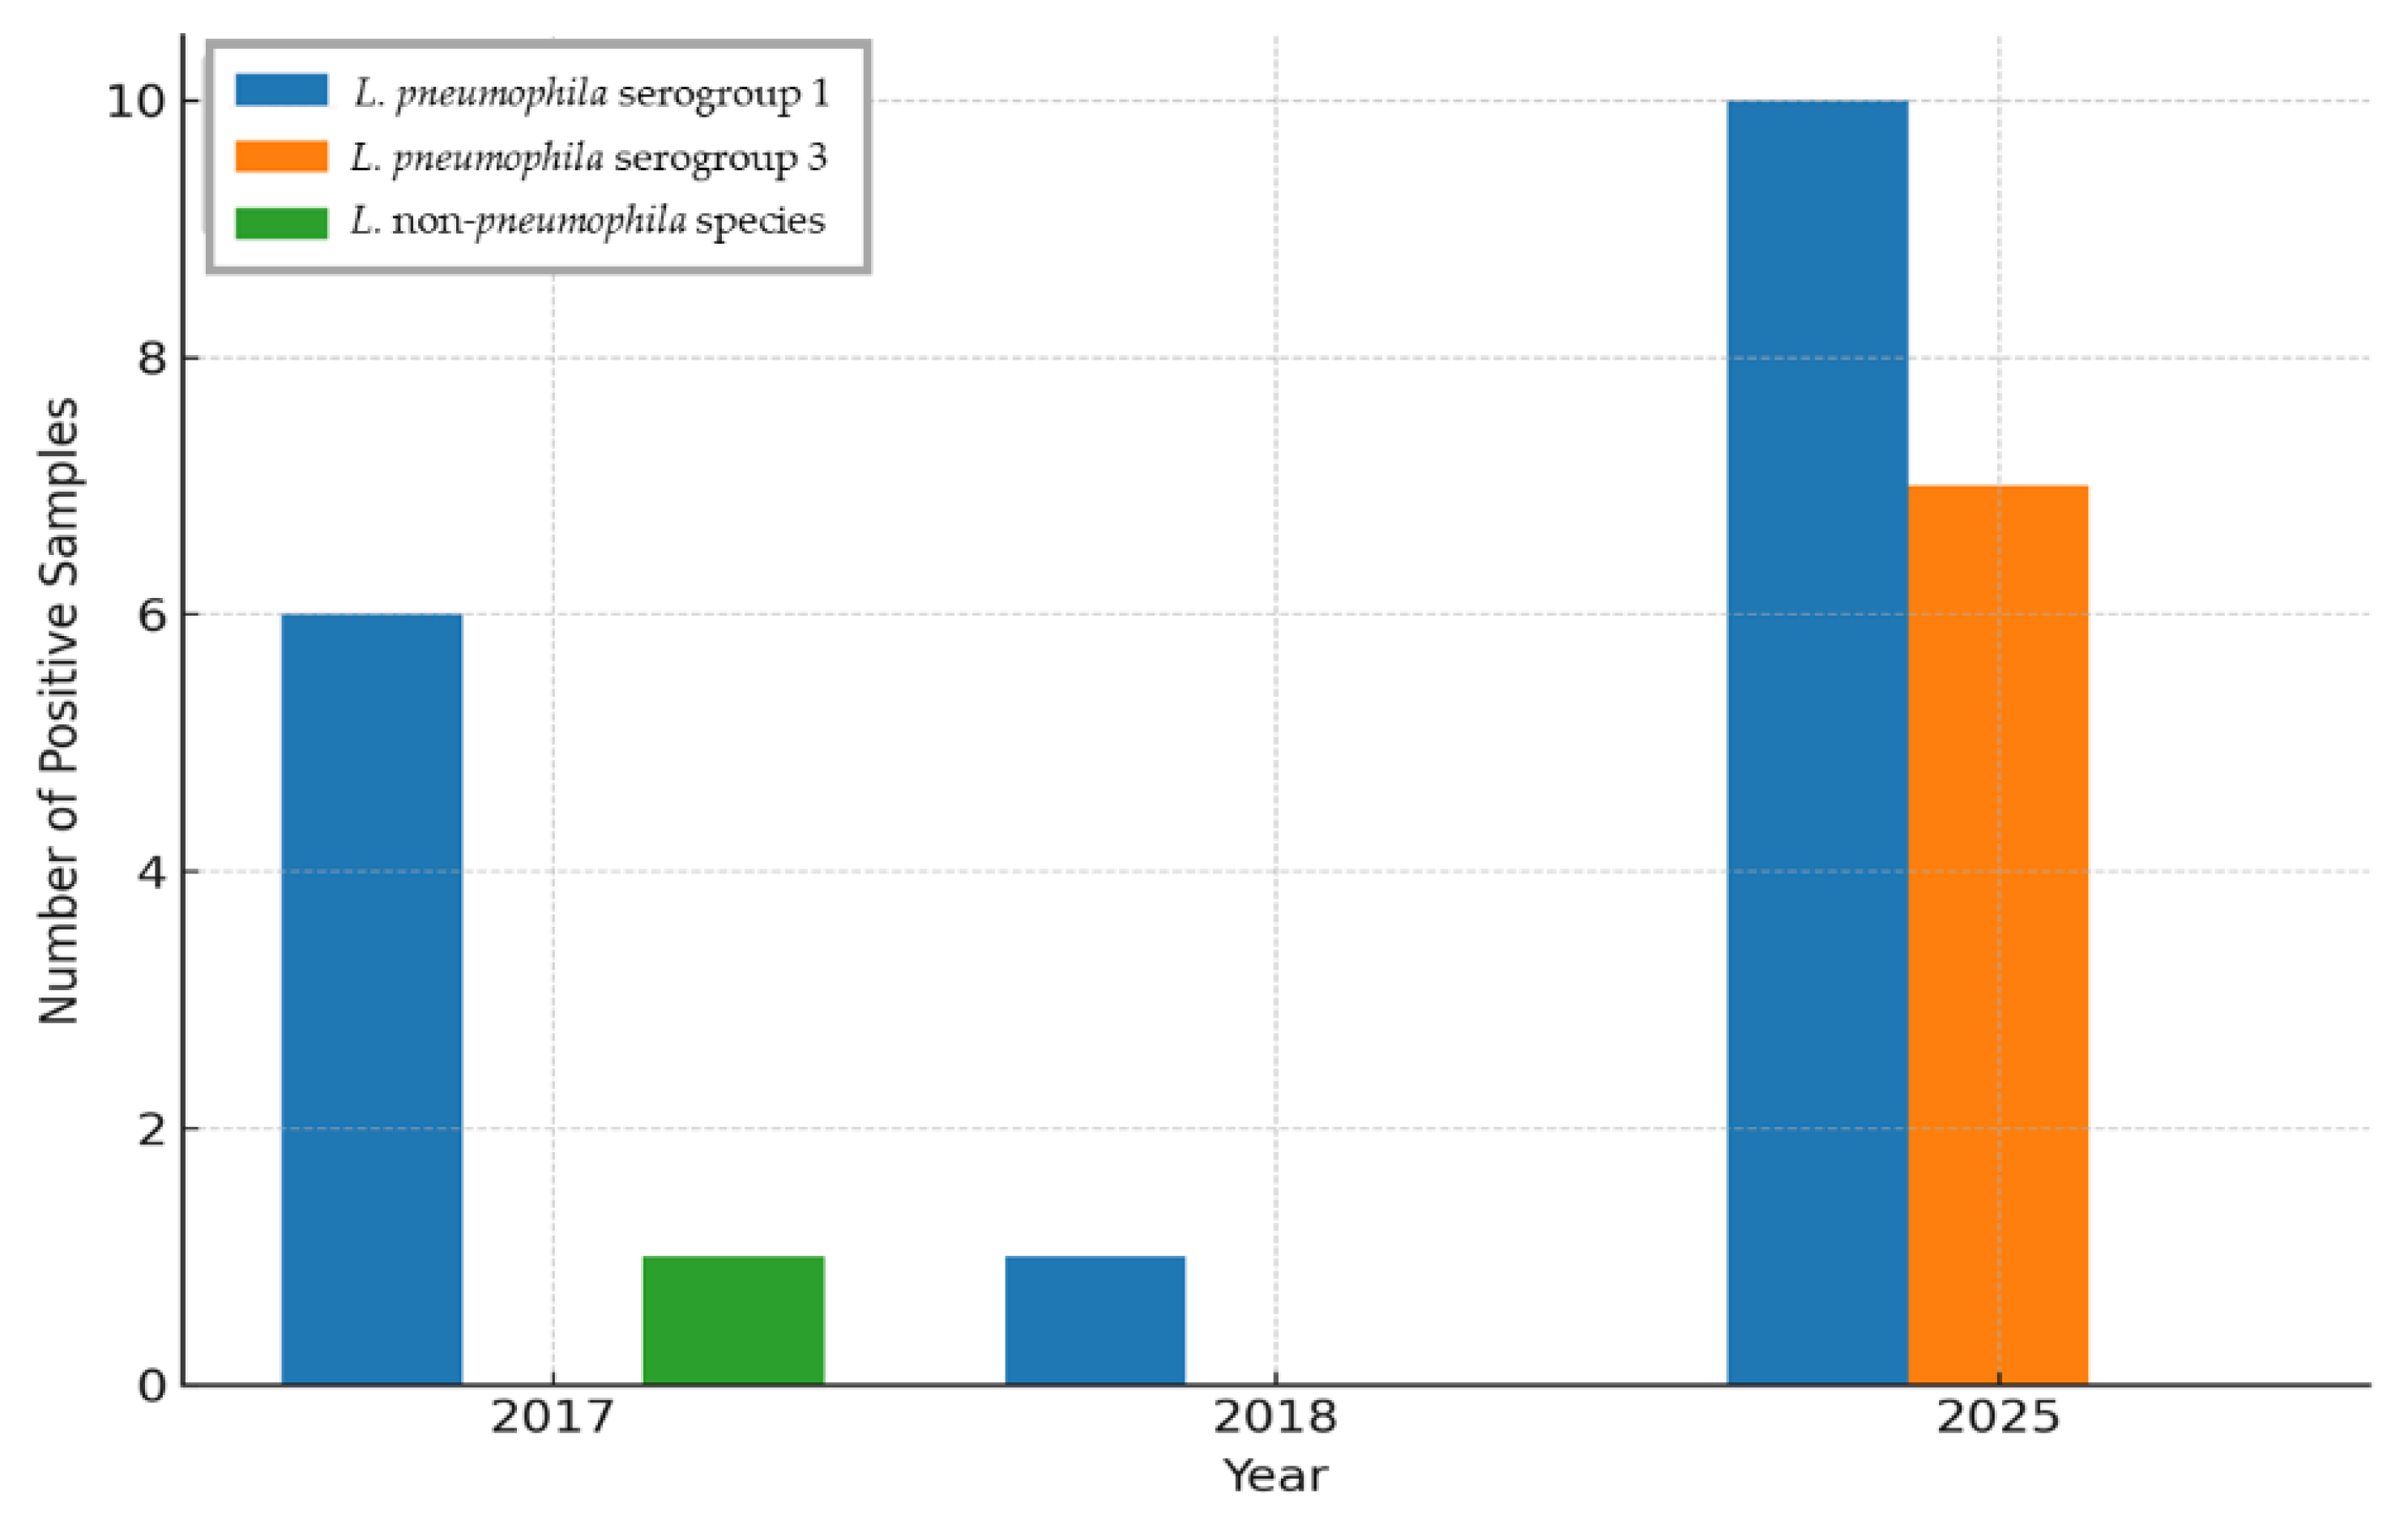
Figure 3.
Association Between Total Coliforms and Legionella Presence. Logistic regression analysis demonstrated a positive relationship between total coliform counts (cfu/100 mL) and the probability of Legionella detection in environmental water samples; Blue crosses represent actual data, while the green line indicates the fitted logistic regression curve.
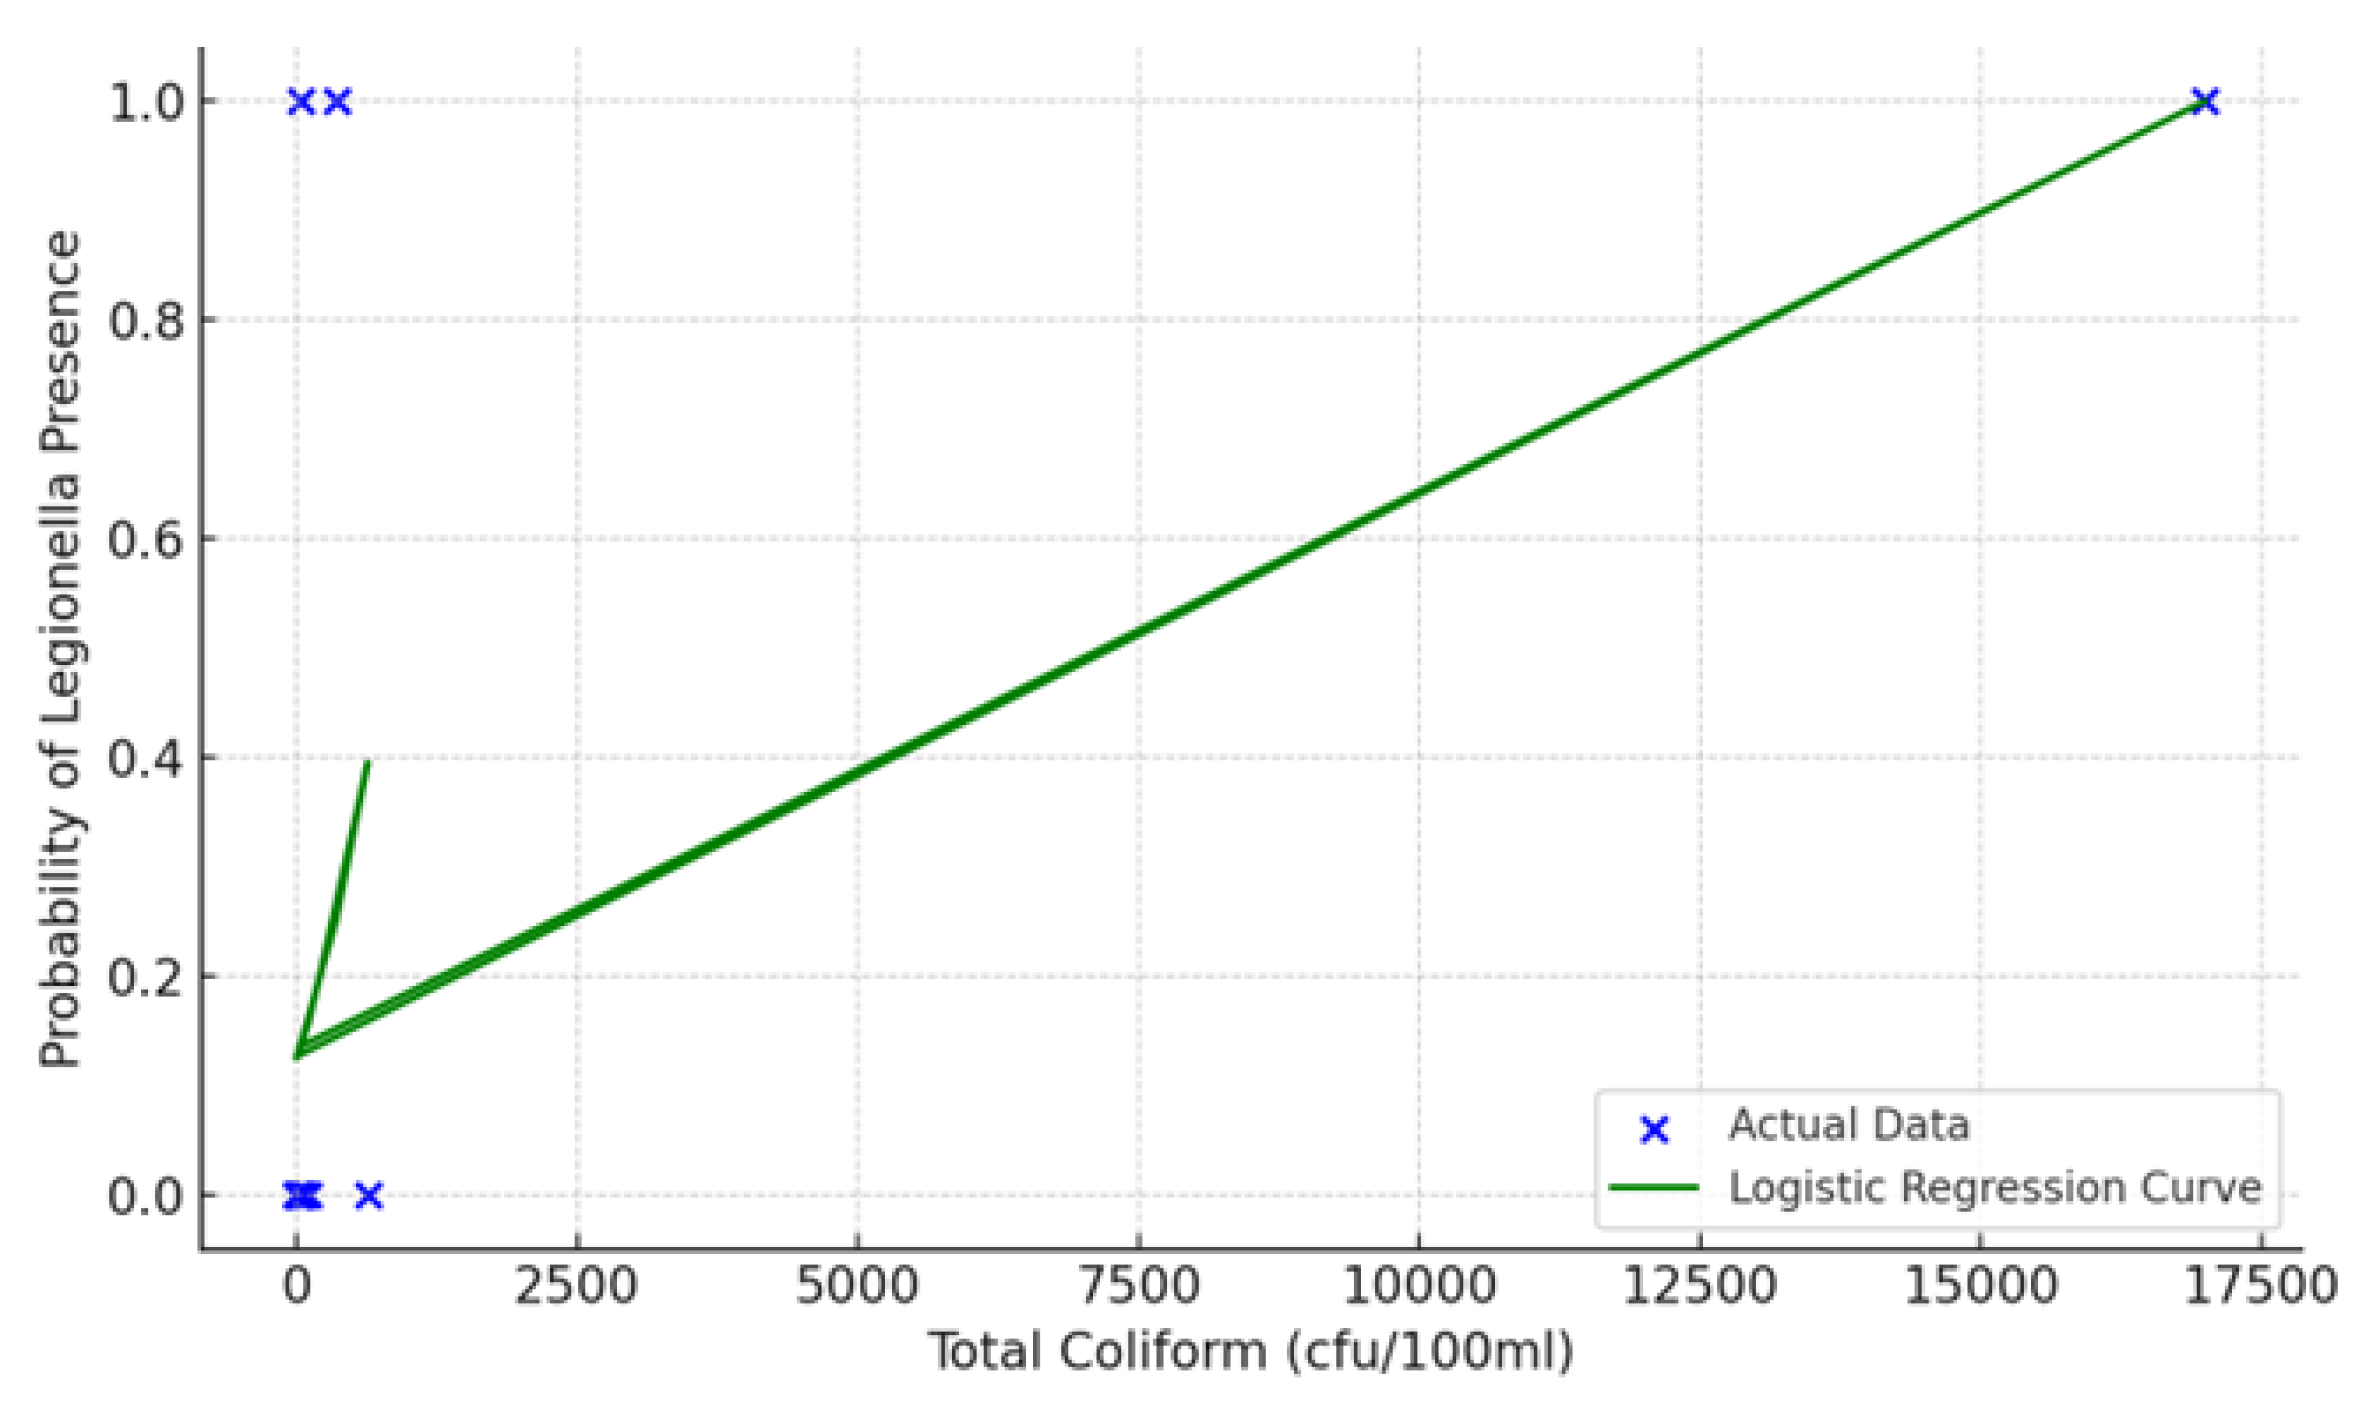
Figure 4.
Proportion of water samples not meeting the recommended physicochemical parameters (cold water >25°C and >20°C, Hot water <50 °C and free chlorine <0.2 mg/L) in the tourist facility during the outbreak investigation (2016–2025), with exact 95% binomial confidence intervals.
Figure 4.
Proportion of water samples not meeting the recommended physicochemical parameters (cold water >25°C and >20°C, Hot water <50 °C and free chlorine <0.2 mg/L) in the tourist facility during the outbreak investigation (2016–2025), with exact 95% binomial confidence intervals.
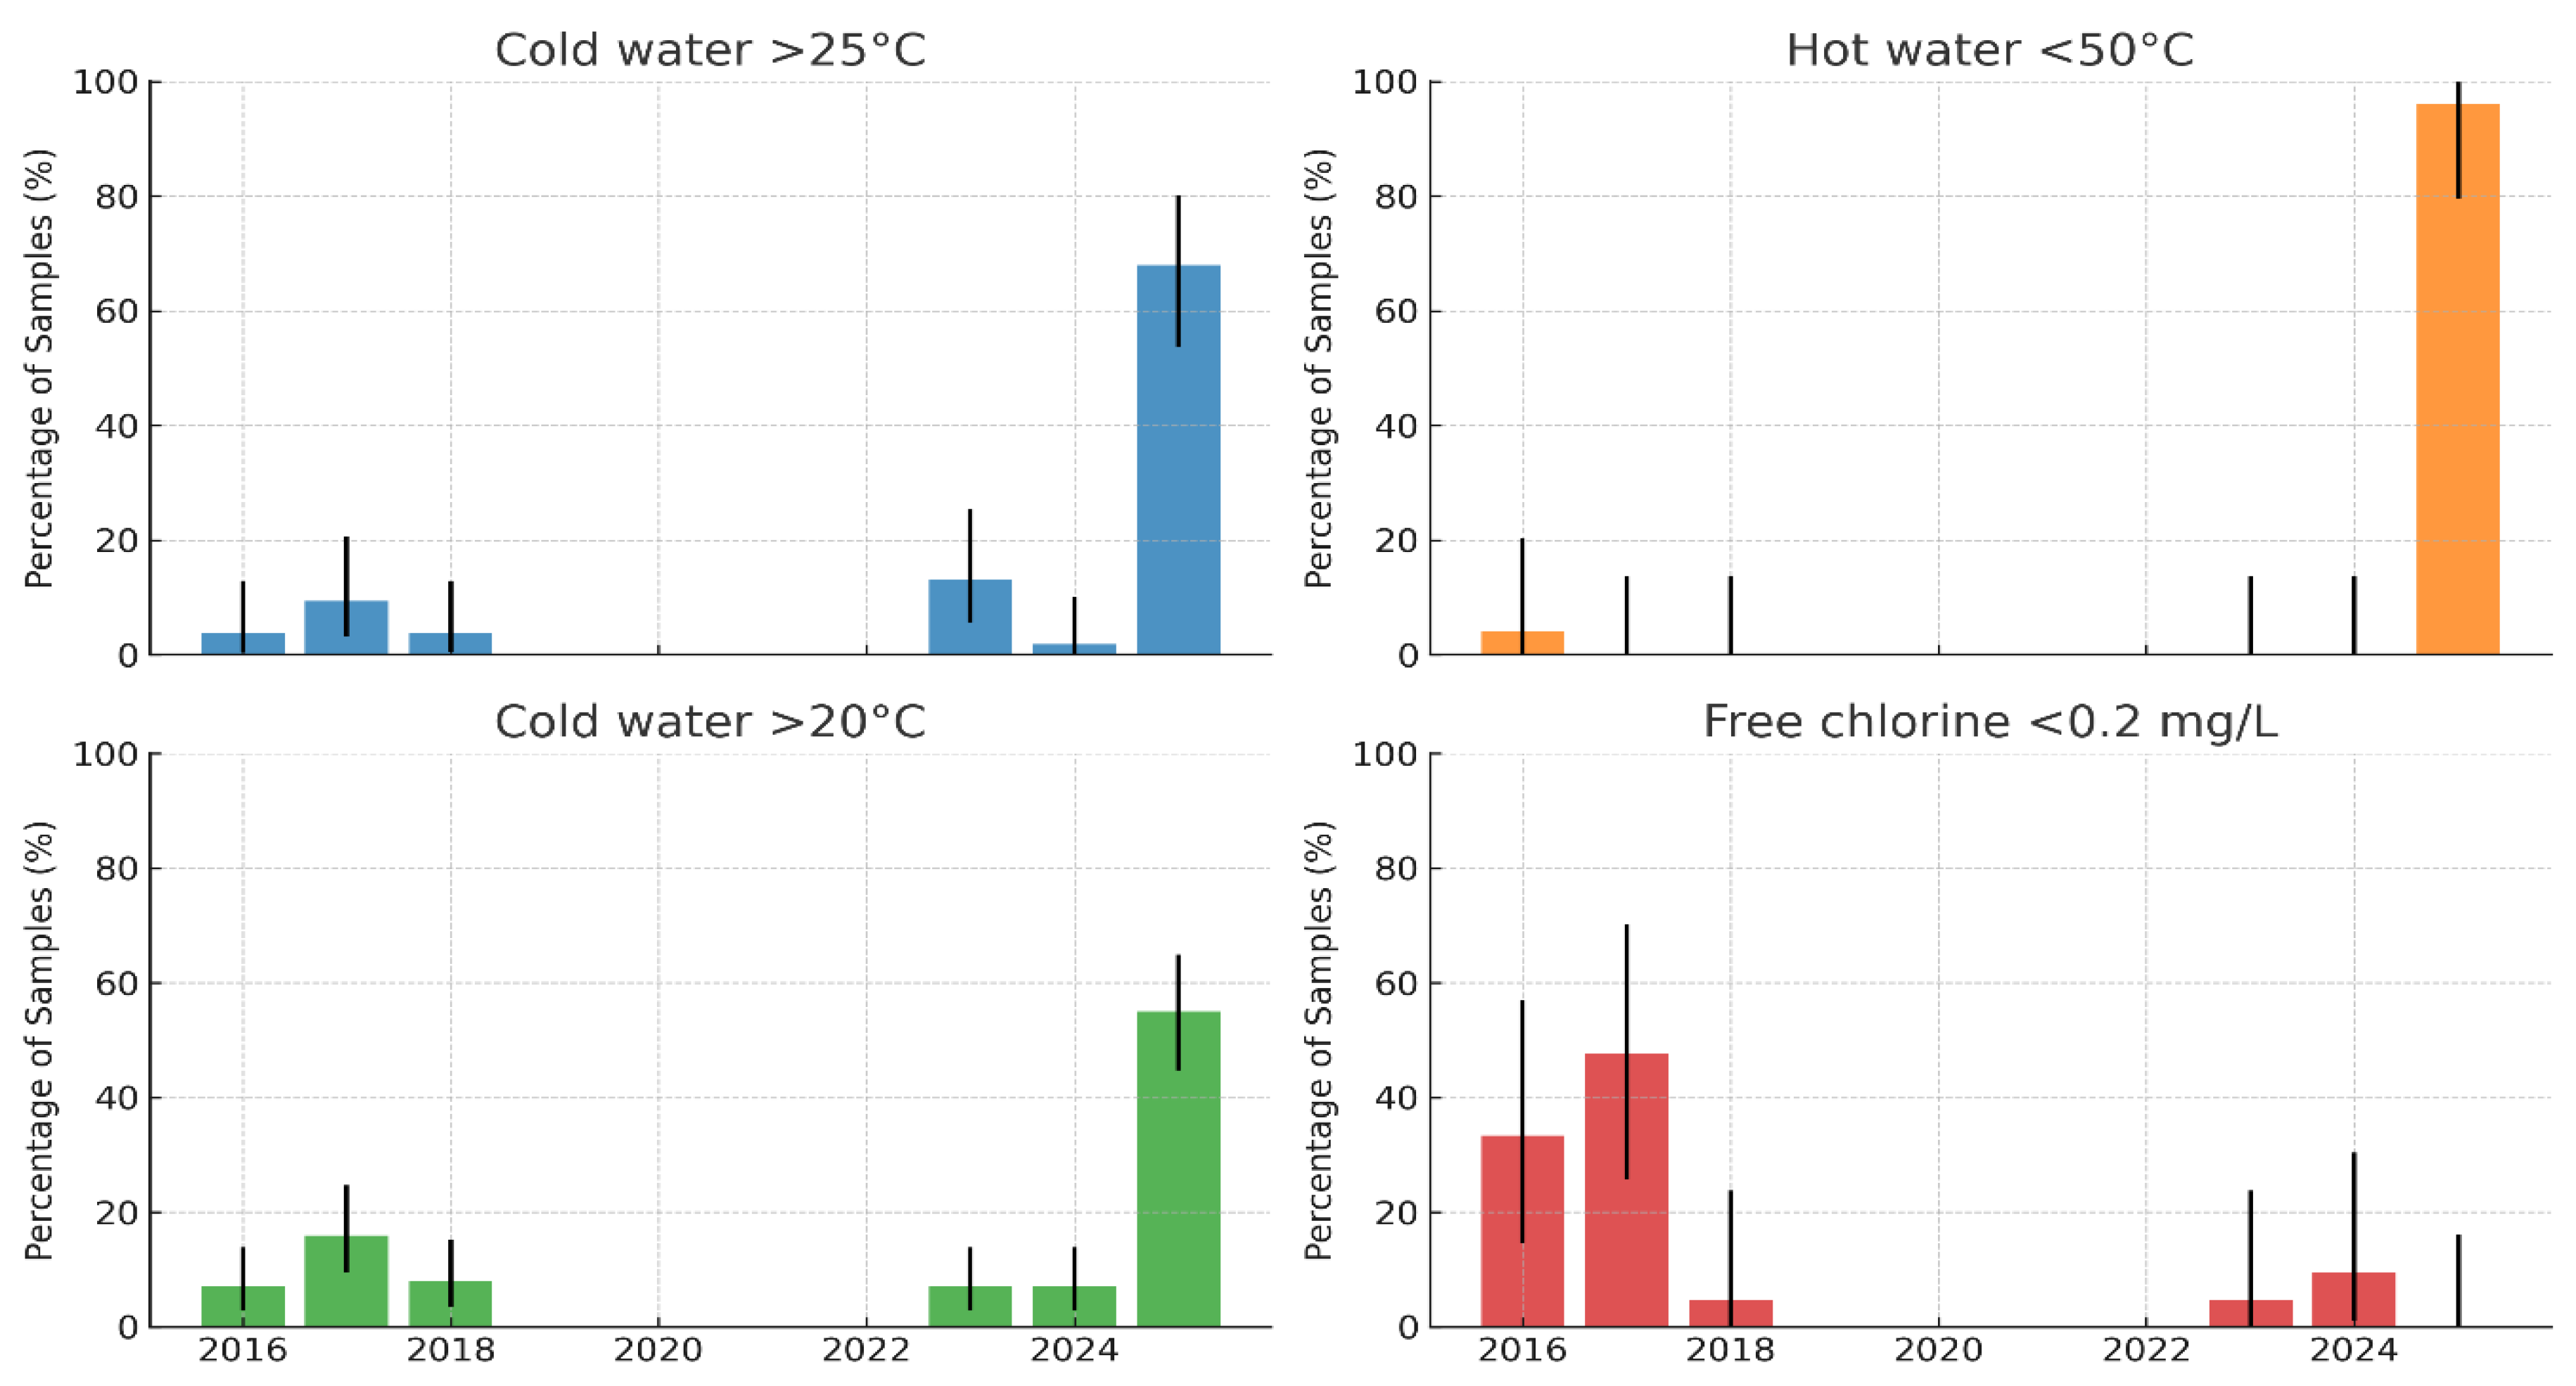
Figure 5.
Chloride, conductivity, and hardness levels by sampling point in the tourist facility water distribution system.
Figure 5.
Chloride, conductivity, and hardness levels by sampling point in the tourist facility water distribution system.
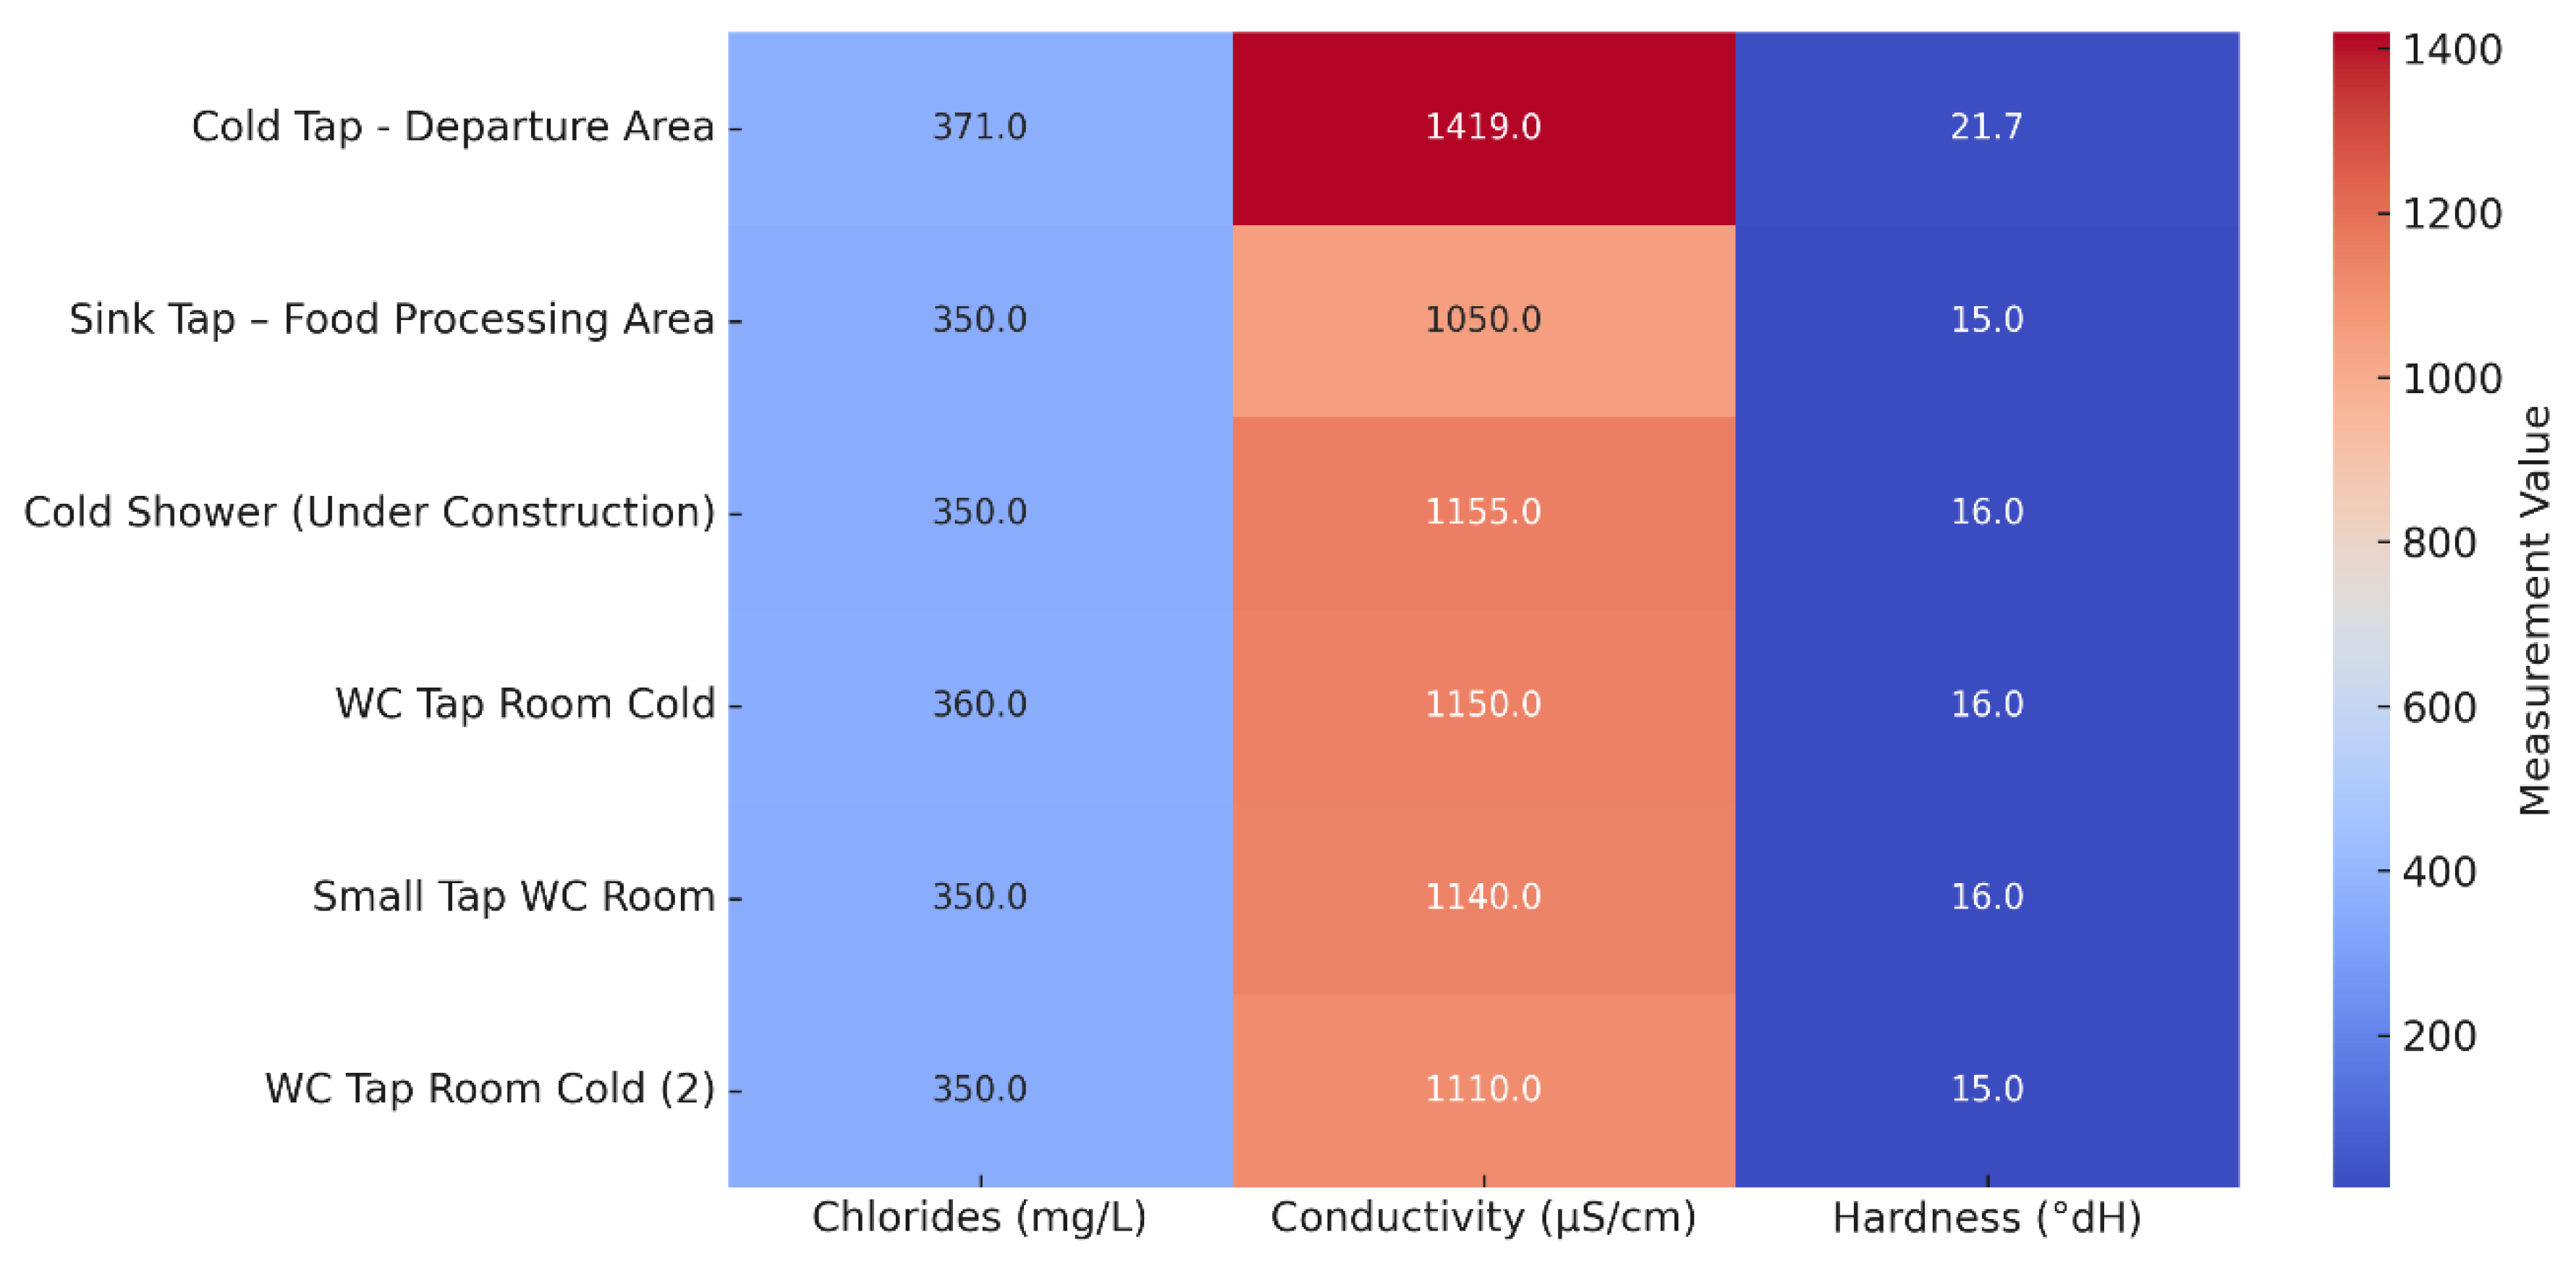
Figure 6.
Flowchart of the hotel’s water distribution system produced following the CDC Water Management Toolkit methodology.
Figure 6.
Flowchart of the hotel’s water distribution system produced following the CDC Water Management Toolkit methodology.
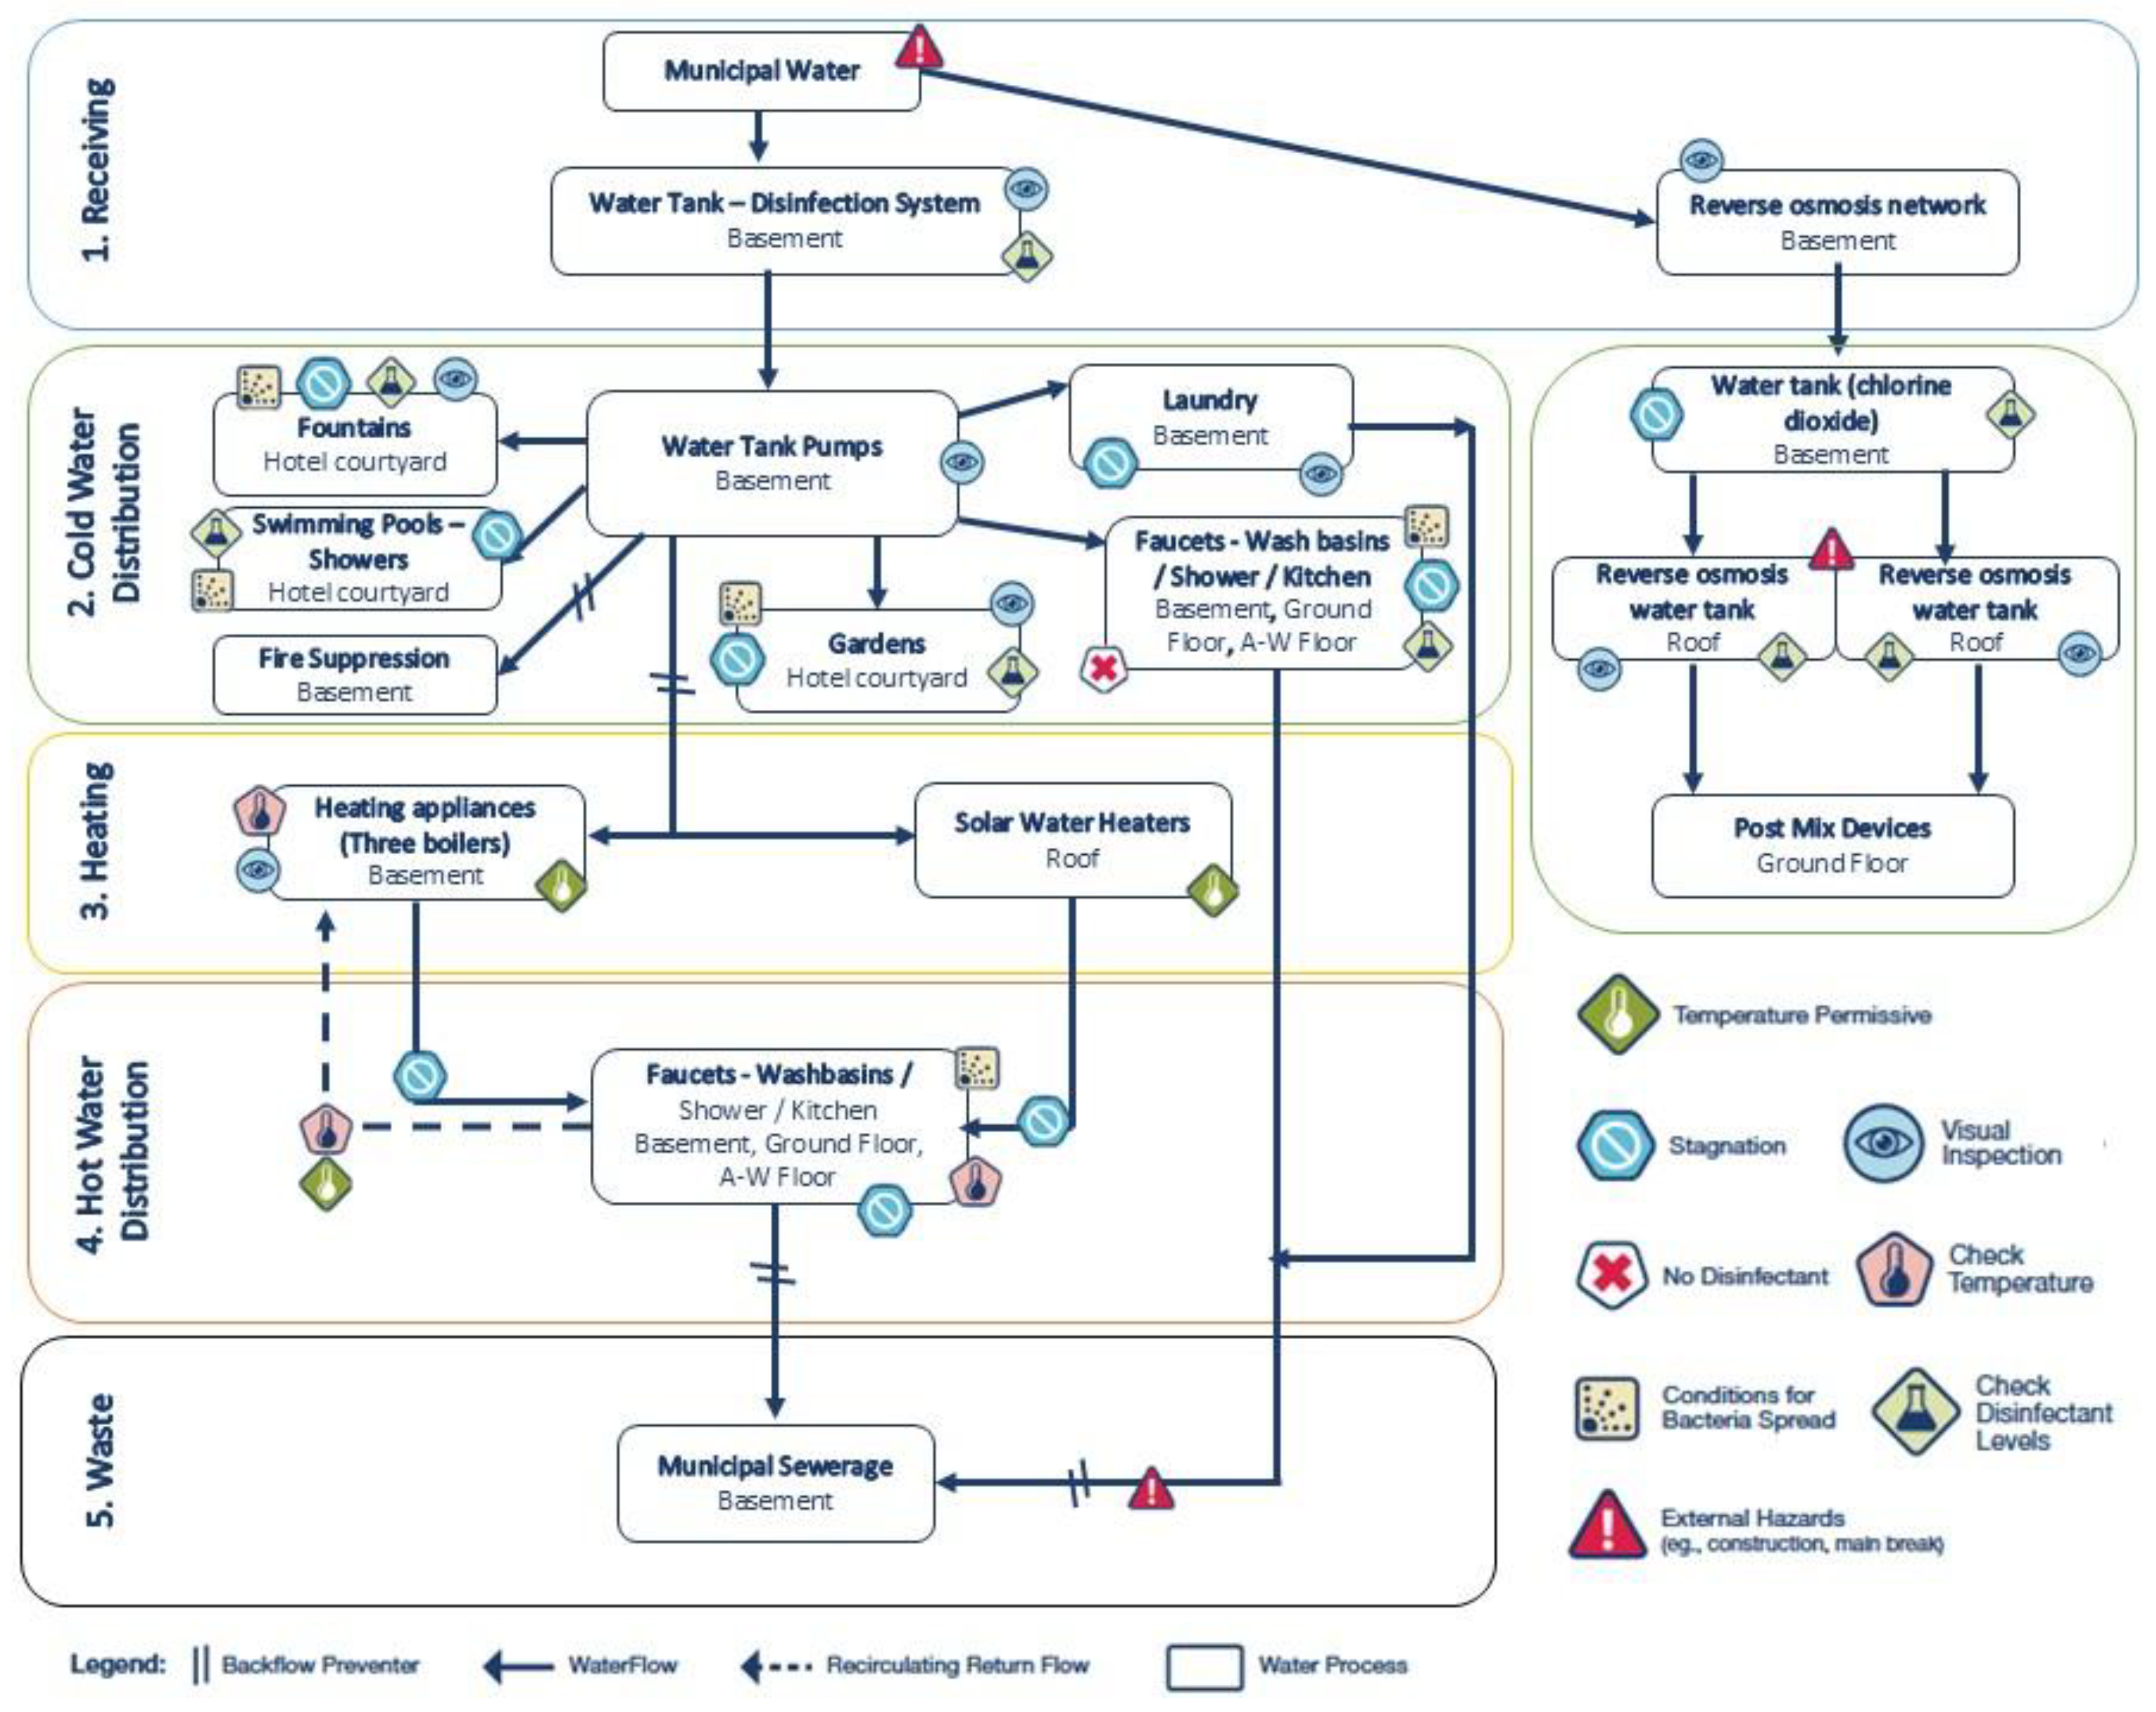
Figure 7.
Heatmap showing the percentage of water samples exceeding the control limits for Legionella load (≥50 CFU/L and ≥1000 CFU/L), free chlorine (<0.2 mg/L), cold-water temperature (>25 °C), and hot-water temperature (<50 °C) in the investigated hotel.
Figure 7.
Heatmap showing the percentage of water samples exceeding the control limits for Legionella load (≥50 CFU/L and ≥1000 CFU/L), free chlorine (<0.2 mg/L), cold-water temperature (>25 °C), and hot-water temperature (<50 °C) in the investigated hotel.
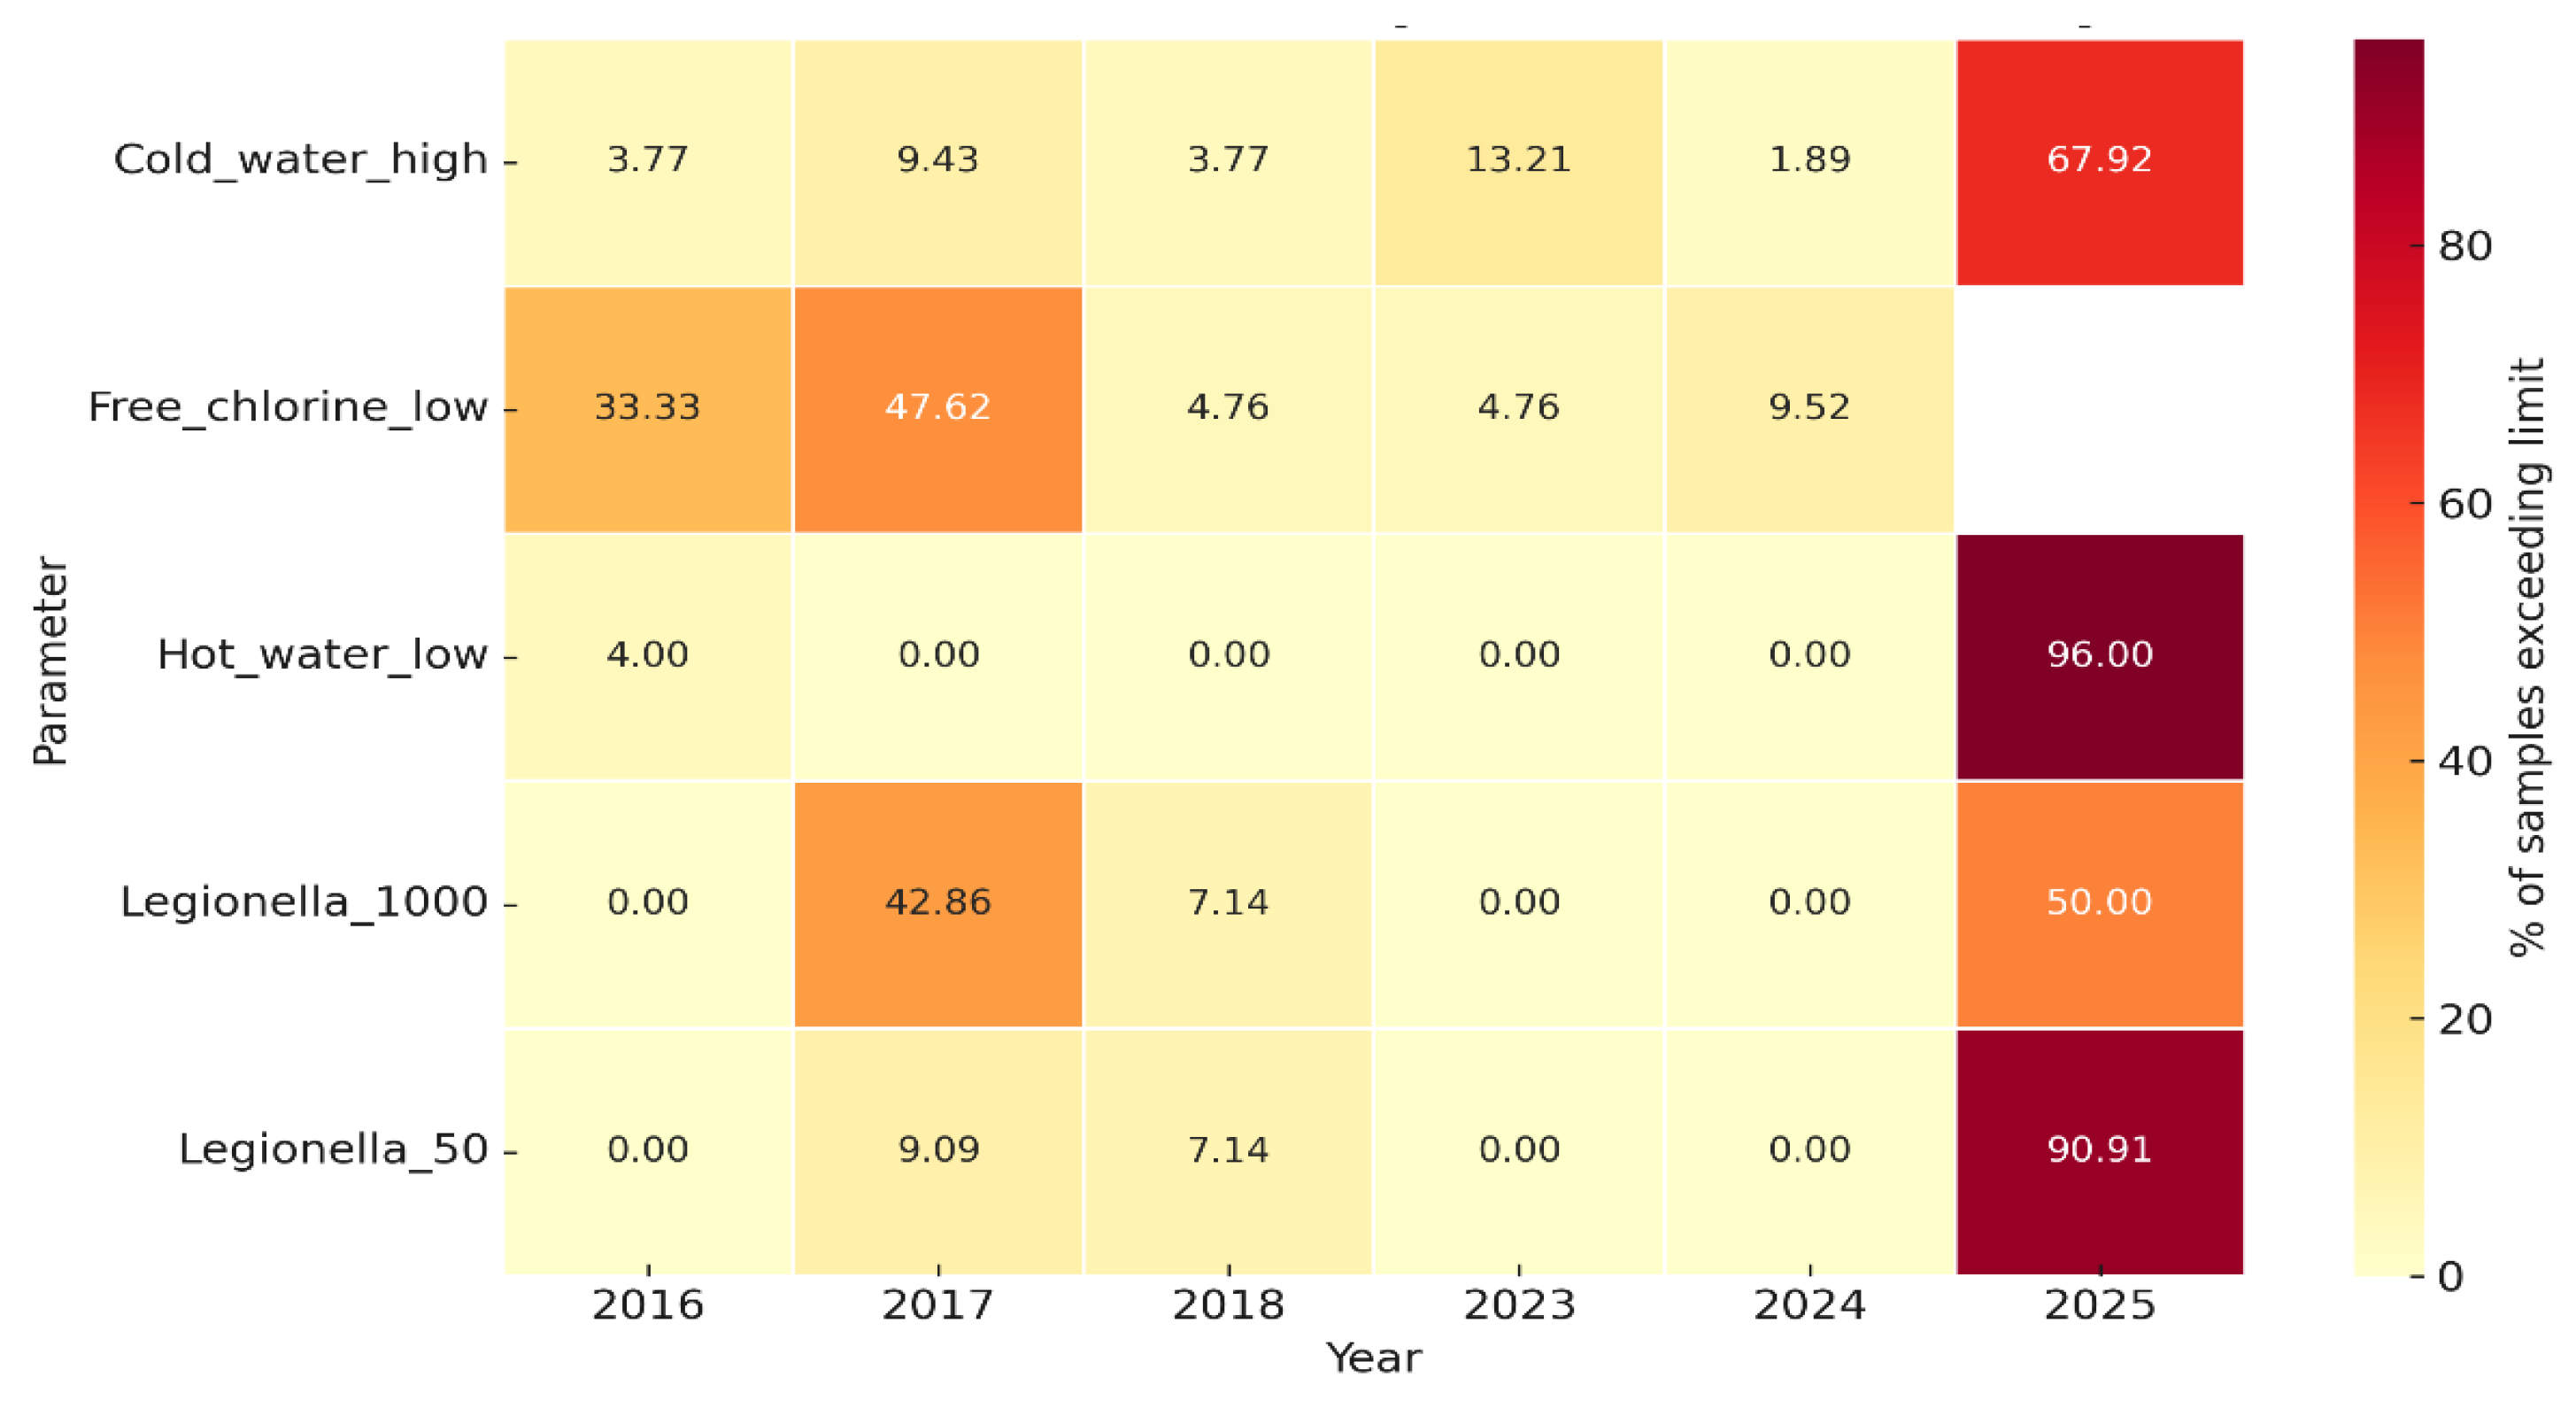
Figure 8.
Decision Tree for Corrective Actions by Hotel Administration Based on Identified Risk Triggers [13] .
Figure 8.
Decision Tree for Corrective Actions by Hotel Administration Based on Identified Risk Triggers [13] .
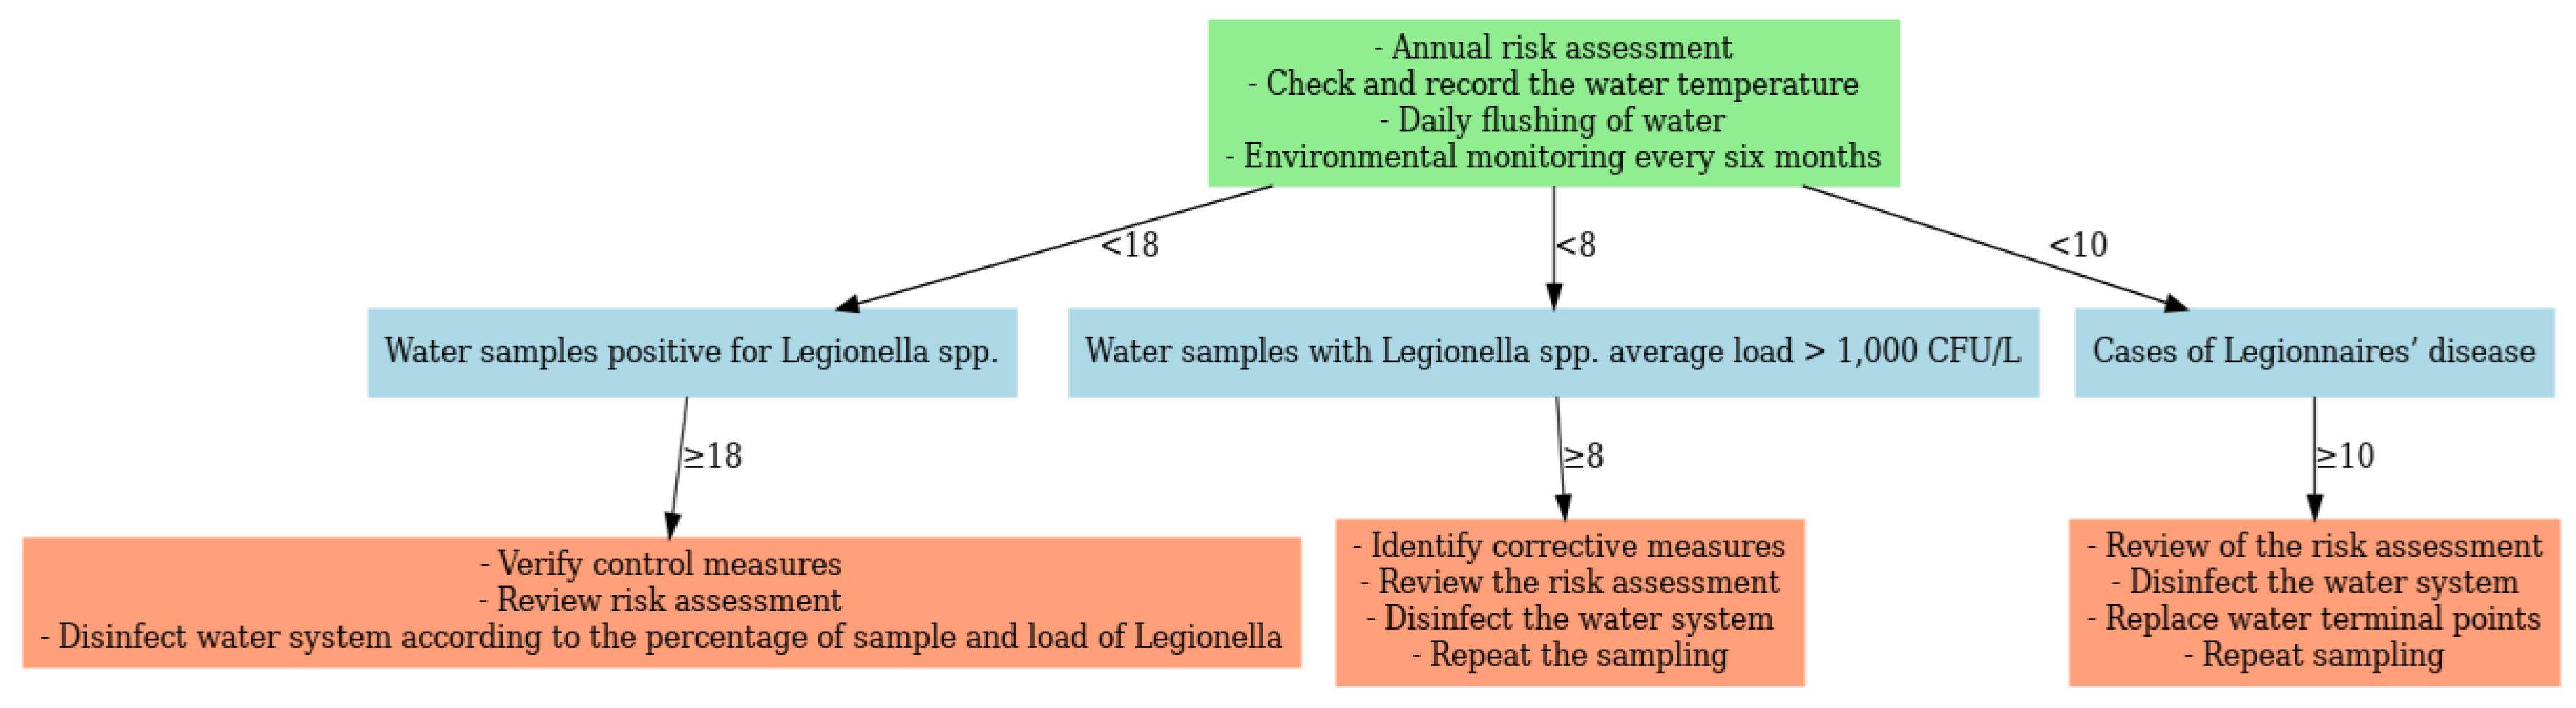
Table 1.
Annual distribution of Legionella-positive environmental samples at two thresholds (≥50 CFU/L and ≥1000 CFU/L), with 2025 data shown separately for pre- and post-intervention periods.
Table 1.
Annual distribution of Legionella-positive environmental samples at two thresholds (≥50 CFU/L and ≥1000 CFU/L), with 2025 data shown separately for pre- and post-intervention periods.
| Year | Total Samples (n) | ≥50 CFU/L Positive (n, %) [95% CI] | ≥1000 CFU/L Positive (n, %) [95% CI] |
|---|---|---|---|
| 92016 | 12 | 0 (0.00%) [0.00–26.46] | 0 (0.00%) [0.00–26.46] |
| 2017 | 29 | 7 (24.14%) [12.07–49.39] | 6 (20.69%) [7.99–39.72] |
| 2018 | 14 | 1 (7.14%) [0.18–33.87] | 1 (7.14%) [0.18–33.87] |
| 2023 | 13 | 0 (0.00%) [0.00–24.71] | 0 (0.00%) [0.00–24.71] |
| 2024 | 13 | 0 (0.00%) [0.00–24.71] | 0 (0.00%) [0.00–24.71] |
| 2025 (Pre-Intervention) | 68 | 17 (25%) [15.6–36.6] | 7 (10.3%) [15.6–36.6] |
| 2025 (Post-Intervention) | 32 | 0 (0%) [0.0%–10.9%] | 0 (0.00%) [0.0%–10.9%] |
| Total (2016–2025) | 181 | 25 (13.81%) [9.14–19.71] | 14 (7.73%) [4.29–12.64] |
Table 2.
Association between physicochemical noncompliance and Legionella spp. positivity (≥50 CFU/L).
Table 2.
Association between physicochemical noncompliance and Legionella spp. positivity (≥50 CFU/L).
| Parameter | Legionella + | Legionella – | Total | Relative Risk (95% CI) | p-value |
|---|---|---|---|---|---|
| Hot water <55 °C | 5 | 12 | 17 | 1.81 (0.75–4.35) | 0.20 |
| Hot water ≥55 °C | 10 | 53 | 63 | - | – |
| Cold water >20 °C | 14 | 86 | 100 | 2.74 (0.39–19.42) | 0.24 |
| Cold water ≤20 °C | 1 | 80 | 81 | - | – |
| Free chlorine <0.2 mg/L | 4 | 17 | 21 | 1.09 (0.41–2.92) | 0.85 |
| Free chlorine ≥0.2 mg/L | 11 | 48 | 59 | - | – |
Disclaimer/Publisher’s Note: The statements, opinions and data contained in all publications are solely those of the individual author(s) and contributor(s) and not of MDPI and/or the editor(s). MDPI and/or the editor(s) disclaim responsibility for any injury to people or property resulting from any ideas, methods, instructions or products referred to in the content. |
© 2025 by the authors. Licensee MDPI, Basel, Switzerland. This article is an open access article distributed under the terms and conditions of the Creative Commons Attribution (CC BY) license (http://creativecommons.org/licenses/by/4.0/).
Copyright: This open access article is published under a Creative Commons CC BY 4.0 license, which permit the free download, distribution, and reuse, provided that the author and preprint are cited in any reuse.


