
Submitted:
11 June 2025
Posted:
11 June 2025
You are already at the latest version
Abstract
Our four-year interdisciplinary behavioral weight loss program is fully covered by a public health insurance for patients with BMI ≥35kg/m2. We evaluated the real world outcomes of anthropometric, metabolic and psychologic parameters collected prior to the start (t0, n=381, 71% women) and after each segment of the program (t1-4, n=243, 126, 94, and 77). It is a prospective evaluation of clinical real world data including all patients who started the first segment of behavioral treatment until they quit/finish the program. The mean drop-out rates per treatment segment was 23%. Body weight after one year decreased from 127.3kg to 122.2 (p< .001). Average hemoglobin A1c value decreased from 5.8 % to 5.6 % in all patients (p< .001) and from 6.6 % to 6.2 % in patients with type 2 diabetes (p< .001). Further metabolic and psychological parameters improved significantly as well. The average weight nadir was reached after two segments, co-occurring with the most beneficial changes in laboratory parameters. Afterwards, mean weight slightly increased accompanied by a discrete loss of benefits in laboratory parameters. Our real world data with significant health improvements adds important value to discussions about the funding of obesity therapy and thus has the chance to improve therapy availability for obesity patients worldwide.
Keywords:
behavioral weight loss therapy
; weight reduction
; health insurance coverage
; real world data
; obesity
1. Introduction
Obesity defined as a body mass index (BMI) of >30 kg/m² leads to a higher risk of metabolic (e.g., diabetes mellitus type 2, arterial hypertension) and psychological (e.g., depression) diseases, and higher risks for incapacity for work and early retirement [1,2]. In persons with obesity, without treatment, usually with increasing age further weight gain occurs, regardless of baseline weight [3]. In contrast, even a moderate weight reduction can improve comorbidities and cardiovascular risk factors [4]. Other important goals of obesity treatment are an increase in quality of life, prevention of disability and loss of productive years [5].
National [6] and international [5] guidelines recommend an interdisciplinary behavioral treatment as the basis for obesity treatment. Usually it is a combination of nutritional, exercise and behavioral therapy [6] focused on problem identification and problem solving. This includes, e.g., self-monitoring, goal-settings and stress management. By individualizing components therapy adherence can be increased [7]. Behavioral weight loss treatment can be the basis for further treatment steps, such as bariatric surgery, but also, if successful, a relevant therapeutic intervention with important clinical improvements for patients [8].
However, for most persons in need, treatment options are rare due to a lack of financing for corresponding programs through the health care systems, and in industrialized countries obesity and low income are clearly associated [9]. Our evaluated behavioral weight loss therapy program offered a long-term behavioral weight loss treatment without a cost sharing by the patient. In contrast to many other behavioral weight loss programs [8,10,11], it intentionally avoided the use of meal replacement shakes, in order to provide a program for patients who are not suitable for full meal replacements for health, personal, monetary or other reasons. In addition, the German healthcare system currently does not fund the use of meal replacement products. For this reason, only programs without meal replacement products would be eligible for applying for nationwide health insurance coverage.
Here we report clinical real world data of an interdisciplinary four-year, fully health insurance funded Leipzig Obesity Management program, which due to its real world nature has an additional value to already available data from purely research-funded programs [12]. Data of the first segment of treatment was already published [13]. We now evaluated the efficacy of the complete four years of the program for weight change, and changes of metabolic and psychological parameters. In the case of premature termination, all available data up to the point of termination were taken into account.
2. Materials and Methods
2.1. Patients
Inclusion criteria for participation were a BMI ≥35 kg/m2, age ≥18 years and an insurance contract with the local health insurance company AOK PLUS. In Germany, behavioral weight loss therapy is not generally covered by health insurances. Our program was to our knowledge the first four-years-program in Germany, which secured full coverage through a contract between the hospital and the health insurance company.
Exclusion criteria were severe mental disorders, substance abuse and other conditions, which would impair the regular participation in the therapy program, or secondary causes of obesity like endocrine disorders.
Reported data is observational real world data, all patients with data were part of the program and there was no untreated control group.
2.2. Interventions and Assessments
At baseline assessment (t0), a blood draw was performed and routine medical and metabolic laboratory parameters were determined (Supplementary Information, Table A1). Medical history and anthropometric parameters were assessed by a physician in a standardized way. The EUROHIS-QOL 8 item index [14] and the patient health questionnaire (PHQ-9) [15] were used to assess quality of life and depressive symptoms, respectively. If the psychological assessment by questionnaires suggested clinically relevant problems in comparison to population norms, an in-person session with a clinical psychologist was scheduled. Furthermore, a nutritional history was assessed by a dietitian.
Following baseline assessments the interdisciplinary board meeting, consisting of a physician from the department of internal medicine, a dietitian, a psychologist and a case manager, decided about each patient’s treatment plan. If the patient had a primary indication for bariatric surgery (based on the national German guidelines [16]) and the patient agreed, bariatric surgery was offered. From August 2014 until September 2016, 411 patients performed baseline assessments, until the end of May 2020 all patients had either completed the whole Leipzig Obesity Management program or dropped out. Of the 411 baseline patients, 29 (7%) had a primary indication for bariatric surgery and were transferred to the department of surgery. One patient was included a second time into the program after dropping out after first inclusion during the first program segment. The second time was excluded from further evaluation. All other patients (n=381, 93%) started the behavioral weight loss program (Figure 1) and were included into courses of n=11-18 patients. The whole program consisted of four successive 1-year courses (“segments”), with the first segment having the highest intensity (i.e., most therapy hours), and following segments having less scheduled classes.
There were three options for similar behavioral treatment programs during the first segment. Patients were grouped regarding their physical ability for participation in the exercise sessions and the daytime when they could best participate (Supplementary Information, Table A2).
Participants absolved one of the three program options, which lasted approximately one year. Each course consisted of dietary counseling, behavioral therapy and sports courses and lasted approximately twelve months. The whole program consisted of four successive 1-year courses (“segments”), with the first segment having the highest intensity (i.e., most therapy hours), and following segments having less scheduled classes. During the first segment of the program, there were up to six individual diet therapy sessions, 6-12 nutritional group therapy sessions, 10-12 behavioral group therapy sessions and 40-48 group exercise sessions. The appointments took place in the obesity clinic of the University Hospital Leipzig/Germany, some of the exercise courses were conducted by associated regional partners (health sports clubs) [17,18,19].
Exercise sessions consisted of 45-60 min. of aerobic (e.g., Nordic walking, swimming) and anaerobic (e.g., weight lifting) exercises of light to medium intensity, adapted to the physical abilities of participants. Dietary counselling group sessions were 90 min., individual sessions 30 min. long. Treatment focused on increasing the intake of complex carbohydrates, a reduction in the intake of short-chained carbohydrates and saturated fatty acids, taking into account individual needs. Behavioral therapy group sessions lasted 90 min. and focused on goal-setting developing sustainable implementation strategies and problem solving. The sessions of all components (behavioral, diet and exercise therapy) took place within the year in a coordinated sequence so that the topics complement each other (Supplementary Information, Table A2).
At the end of the first segment of the behavioral weight loss program, an assessment comparable to the baseline assessment took place (t1). Thereafter, the interdisciplinary board meeting reviewed each patient`s progression to determine the further progression of therapy. If the patient wished to obtain bariatric surgery, a physician from the department of bariatric surgery was consulted. After completing the first program segment, bariatric surgery could be performed at any time of the program following the aforementioned algorithm.
In the second to fourth segment, frequency of appointments decreased (Supplementary Information Table A2). After completion of each segment lasting approximately one year, a segment assessment (t2-t4) identical to baseline assessment was performed. If necessary, patients could assign to additional appointments with the dietitian and/or psychologist throughout the whole time of treatment.
The aim was to achieve a participation rate of at least 80%. Patients with irregular attendance without giving reasons were excluded prematurely. Patients who did not reach the 80% target for health reasons were allowed to continue participating in the program. Patients who ended the program prematurely were defined as dropouts. All patients included into the analysis of the Leipzig Obesity Management program terminated the program (after completing t4 or prematurely) until May 31th 2020. The first therapy segment was started by 381 patients (n=272, 71.4% female). Mean ±standard error of the mean (SEM) age was 43.3 ±0.7 years, mean BMI 44.3 ±0.4 kg/m² and mean body weight 127.3 ±1.3 kg (Table 1). At first presentation, 118 (31%) patients had type 2 diabetes mellitus and 233 (61%) arterial hypertension. In average costs per patient ranged between 2,000 € for the first segment of therapy and 700 € for each of the second to fourth segment and were fully covered by the health insurance company.
2.3. Assessments of Laboratory Parameters
The laboratory parameters were determined in the Institute for Laboratory Medicine, Clinical Chemistry and Molecular Diagnostics at the Leipzig University Hospital. The calculation of the homeostasis model assessment of insulin resistance (HOMA-IR) was used to determine insulin resistance. Therefore, fasting glucose (mmol/l) was multiplied by fasting insulin (pmol/l) and divided by 156.2625 [20].
Patients were grouped as “patients with diabetes” if patients reported a previously established diagnosis of type 2 diabetes, were taking diabetes medication, had a hemoglobin A1c (HbA1c) ≥6.5% (48 mmol/mol) and/or a fasting plasma glucose ≥7 mmol/l. Patients with changes of diabetes medication throughout the course of the program were excluded from the analysis of glucose parameters (n=24). For assessment of HOMA-IR, additionally all patients with insulin treatment were excluded (n=21). Concordantly, for the assessment of parameters of lipid metabolism, patients with changes in lipid lowering medication through the time course of the study were excluded from the analysis (n=15).
2.4. Statistical Analysis of Medical Data
All patients who started the first year of therapy (n=381) were included in the evaluation. People who quit the program prematurely or get a bariatric surgery during the course of the program were included in the evaluation with the available data within the behavioral therapy phase. Controlling for patient’s age at baseline and correcting for multiple testing due to the different time set points according to Bonferroni [21], mixed model analyses were used to evaluate changes of parameters of interest of repeated measurements from t0 to t4 for all assessed parameters.
To model BMI changes over time, all available measurements were used in a sequence of linear mixed models that treated time as a continuous variable and patient as a random term. The first model in the sequence only contained time linearly, the second added its square, the third its cube and the fourth added time to the fourth power. The optimal model was selected by minimizing the Bayesian information criterion. Gender did not show a significant difference in the linear model, which is why it was not included [22].
Data are presented as mean ±standard error of the mean (SEM). For analysis, Excel 2016 (Microsoft Corporation version 16.0; Redmond, WA, USA), SPSS (IBM® version 25.0; Chicago, IL, USA), STATA (version 16.0) and R (The R Foundation for Statistical Computing, Version 3.5.1, Vienna, Austria) were used. All analyses used a two-tailed α <0.05 as level of significance.
2.5. Assessment and Statistical Analysis of Healthcare Costs
Average treatment and program costs were evaluated for the program group over a period of time starting three years before program and ending with the fourth year of treatment. Treatment costs included inpatient, outpatient and drug costs. There were also patients who did not incur any further healthcare costs in addition to the costs of the therapy program. These patients were also included in the evaluation. Because of dropouts and different durations of participation in the program, we standardized the costs outcomes to costs per capita and 30 days. We analyzed the changes of costs per time period and tested for significance with the Mann-Whitney U test correcting for multiple testing according to Bonferroni-Holm to maintain a global significance level of 5% [23].
3. Results
Of 411 eligible patients who fulfilled the in- and exclusion criteria and wanted to participate, 381 participants started the Leipzig Obesity Management program. During the whole time of treatment, 73 (19%) participants underwent bariatric surgery and 234 (61%) quit the program prematurely. Self-reported reasons for dropping out were personal and familial (28%) or health reasons (16%) (Supplementary Information, Table A3).
The whole four years of the behavioral weight loss program were completed by 77 (20%) participants (Figure 1). The average time between t0 and t4 was four years and seven months.
Between t0 and the last available measurement before completion (t4) or drop out, respectively, including measurements between the segment assessments, 61% of patients lost weight, mean weight loss was 2.9 ±0.6 kg (2.3 ±0.4%), p<.001 (Figure 2). Taking into account all available data at the two comparative time points irrespective of therapy adherence, mean body weight change during the first year from t0 to t1 (n=243) was -5 ±0.6 kg (p<.001), from t0 to t2 (n=126) -5.6 ±1.1 kg, from t0 to t3 (n=94) -4.9 ±1.2 kg and from t0 to t4 (n=77) -4.7 ±1.4 kg.
3.1. Mixed Model Analysis (Starting at t0 with n=381)
All patients who started the behavioral weight loss program (n=381) were included in the mixed model analysis regarding all measured parameters. For all assessed parameters, mean values from t0 to t4 and tests for significant time effects using mixed model analysis are depicted in Table 1; results are listed for the whole sample, anthropometric data also separately for women and men. Available patient measurements with data at different assessments for each parameter are shown in Supplementary Information, Table A4.
Average ±standard error of the mean. Derived from the mixed model analysis, significance levels depicted through asterisks on the respective mean value refer to tests of differences between baseline (t0) and the respective time point, controlling for age and multiple testing according to Bonferroni [19]. Distinct p-values are shown for tests of significant time/treatment effects within the mixed model analysis. ALAT, alanine aminotransferase; ASAT, aspartate aminotransferase; EUROHIS-QOL, EUROHIS-QOL 8 item index [12]; GGT, gamma glutamyltransferase; HbA1c, hemoglobin A1c, HDL, high density lipoprotein; LDL, low density lipoprotein; PHQ-9, Patient Health Questionnaire [13]. §Patients with type 2 diabetes without changes in diabetes medication during the course of the program; n=24 were thus excluded from this analysis: in 17 patients glucose lowering medication was intensified, in 7 patients reduced; †patients with type 2 diabetes without changes in diabetes medication during the course of the program and without insulin therapy; n=45 were thus excluded from this analysis; ‡patients without changes in lipid lowering medication, during the course of the program; n=15 were thus excluded from this analysis: in 10 patients lipid lowering medication was intensified, in 5 patients reduced. ***p<.001, **p<.01, *p<.05.
Compared to t0, most health parameters showed statistically significant decreases at t4. Specifically, the BMI was reduced from 44.3 ±0.4 kg/m2 at t0 to 43.4 ±0.5 kg/m2 at t4 (p<.01), with a significant treatment effect over the whole time course (p<.001) (Table 1). HOMA-IR decreased from 6.0 ±0.3 at t0 to 5.0 ±0.3 at t4 (p<.05; whole time course p<.01). The HbA1c between t0 and t4 did not change statistically significant for the whole cohort (p=.1), but the mixed-model analysis over the whole time course showed a statistically significant effect (p<.001). Analyses of subgroups of diabetic and patients without diabetes revealed same tendencies as the whole group (Table 1, Figure 3A). For the whole sample, low density lipoprotein (LDL) cholesterol decreased from 3.3 ±0.1 mmol/l at t0 to 3.2 ±0.1 mmol/l at t4 (p<.05; whole time course p<.05). The quality of life-score (EUROHIS-QOL) improved from 3.3 ±0.0 points at t0 to 3.6 ±0.1 points at t4 (p<.001; whole time course p<.001; Figure 3B) One of the EUROHIS-QOL items, unrelated to health “How satisfied are you with the conditions of your living place?”, did not change, unlike all other items (Supplementary Information, Table A5 and A6). The depressive symptoms score (PHQ-9) decreased from 3.2 ±0.0 points at t0 to 3.6 ±0.1 points at t4 by (p<.001; whole time course p<.001). A total of 217 persons completed the PHQ-9-score for depressive symptoms at least twice, 43 (20%) people had a reduction of 5 points or less, 17 (8%) had an increase of 5 points or more.
For analysis of BMI changes, the model containing terms up to the cubic terms was optimal. All patients with at least two weight measurements were included, starting at t0 with n=268. BMI reached its lowest value approximately two years after beginning of the program. Subsequently, BMI increased moderately, but remained well below the baseline value (Figure 4).
3.2. Completer Analysis of Variance of All Measured Parameters (n=77)
For the analysis of variance of all measured parameters, all patients who completed t4 were included (n=77). Mean weight loss for this group was 4.6 ±1.4 kg (-3.4 ±1.1%, both t0 vs. t4 and whole time course p<.001, Supplementary Information, Table A7). At the last measurement (t4), 28 (36%) persons had a weight loss of 5% or more and 16 (21%) of 10% or more compared to the initial weight. Further, HbA1c decreased by 0.1 ±0.1%-points (p<.05; whole time course p<.001) and HOMA-IR by 0.9 ±0.3 (p<.01; whole time course not statistically significant with p=.16, Table A8). For the whole sample, LDL cholesterol showed a trend for a decrease with -0.1 ±0.1 mmol/l (p=.07; whole time course p=.18). The quality of life-score (EUROHIS-QOL) improved by 0.2 ±0.1 points (p<.01; whole time course p<.05) and the depressive symptoms score (PHQ-9) did not change statistically significantly (p=.45; whole time course p=.19).
3.3. Exploratory Analysis of Healthcare Cost Changes Over Time (Starting Three Years Before Program)
When comparing the average costs for outpatient care before and during treatment, the trend increase did not reach a significant level (p=.12). Average costs for drugs also numerically changed up and down per year over time and increased continuously from the second year of the program. When comparing the average costs for drugs before and during treatment, the trend increase did not reach a significant level (p=.24). When comparing the average costs for hospital care before and during treatment, the trend increase did not reach a significant level (p=.51). In summary, all healthcare costs were numerically higher before and after the program, but none of the observed changes were statistically significant (Figure 5).
4. Discussion
Weight loss through behavioral weight loss programs leads to a clinically relevant improvement of obesity associated comorbidities [8]. However, therapy adherence and coverage of costs of such programs by healthcare providers is essential for success. Often, the duration of programs fully financed by health insurances is too short or coverage is not available at all, or patients quit programs prematurely yielding only partial effects. Reasons for limited motivation to participate include unrealistic weight loss expectations and a non-individualized therapy [24,25]. This may lead to an initial weight loss followed by more or less rapid weight regain, resulting in little benefits for patients [26]. Further reasons for unsatisfying therapy effects may be a single focus on nutritional therapy or physical activity [27], but not a combination of both interventions, accompanied by cognitive behavioral training as recommended by international guidelines [5,28].
Often, behavioral weight loss programs include a phase of formula diet at the beginning of the treatment [8,10,11]. In our Leipzig Obesity Management program, we did not include a formula phase to be able to offer the program also to people who are not able to conduct a meal replacement diet due to personal preference, medical reasons or the high costs of such therapeutic options. In addition, the German healthcare system does not fund the use of meal replacement products.
During the first intensive year of the multimodal treatment program, patients who absolved the first year lost 5 kg of their initial bodyweight. The second to fourth year aimed to maintain weight loss achieved in the first year. This goal was achieved considering all patients from the beginning up to the last measured weight. There was no statistically significant weight regain after t1, and mean bodyweight at the end of the program was significantly lower than at the beginning of the program.
Up to date, only few long-term behavioral weight loss intervention studies without meal replacement and with an intervention lasting longer than 1 year are available. In the US American “Practise-based Opportunities for Weight Reduction” (POWER) study, participants were randomized in two different intervention and one control group. One of the intervention groups had a remote support via telephone or internet, the other intervention group had an in-person weight loss support. The intervention groups had a 6 months intensive therapy with 1.5 years follow-up program, which had more frequent diet counselling visits or generally contact to clarify questions and increase motivation (in-person group: 30 group sessions, 10 individual sessions, 21 phone contacts; remote support group 33 phone contacts) than our program during the same time period. At the end of observation, a weight loss of 5.2% or 5.1 kg was achieved in the in-person treatment group, 5.0% or 4.6 kg in the remote support group, and 1.1% or 0.8 kg of the control group [29]. The more intense follow up program may explain higher weight loss outcomes than in our study. Furthermore, the mean baseline BMI of the intervention groups were 36.0 kg/m2 in the remote support group and 36.8 kg/m2 in the in-person treatment group, which also differed clearly from the population of our study with an average BMI of 44.3 kg/m².
As stated in the obesity guidelines of the American Diabetes Association of 2022, a weight reduction of 3 to 5% can relevantly improve health parameters as glycemic control and other cardiovascular risk factors [30]. In our cohort, all assessed parameters of glucose metabolism improved significantly in both groups, participants with and without diagnosis of type 2 diabetes at baseline. As expected, also in patients without diabetes, insulin resistance was common, mean HOMA-IR at baseline was 5.3 ±0.2. According to data from the American Diabetes Prevention Program, risk of diabetes in this group is extremely high [31].
In both, persons with and without diabetes, a reduction of the LDL cholesterol concentrations leads to a risk reduction for atherosclerotic cardiovascular disease [32,33]. The current analysis showed a significant decrease of LDL cholesterol during the time of treatment. Even a diet induced change of 0.1 mmol/l, as achieved by the participants of our program, has a positive effect on the risk for cardiovascular disease [34].
The C-reactive protein (CRP) is associated with inflammatory processes in the human body. In our study, concentrations decreased with bodyweight reduction. It is known that life style changes, especially exercise, have positive effects on CRP [35]. Another influencing factor appears to be nutritional behavior. Many components of a healthy and balanced diet seem to have a positive effect on inflammatory body processes [36]. All of these factors could have contributed the CRP decrease seen in our cohort.
In our study, scores for quality of life and depressive symptoms improved significantly. However, because the study lacked a placebo control group, nonspecific treatment expectation affecting mood cannot fully be ruled out (Hawthorne effect) [37]. Nevertheless, the EUROHIS-QOL item on the life situation did not change, which could indicate that effects on PHQ-9 and EUROHIS-QOL were driven by the beneficial medical effects of the behavioral weight loss program. In contrast, in the other not health related EUROHIS-QOL item about the financial situation, we saw a significant improvement, probably because of an improved capability of our patients to being employed. However, this is speculative because socioeconomic data were not assessed at measurements t1-t4. For PHQ-9, a change of five or more points is considered clinically relevant [38]. In our cohort, 20% of the patients who completed the questionnaire on at least twice had an improvement of five or more points from baseline to the last available measurement, whereas only 8% of the participants a deterioration of this magnitude.
Drop-out rates during the four years of our program were between 36% (first treatment year) and 11% (fourth year), the mean drop-out rates per treatment year was 23%. Additionally, 19% of patients starting the program were transferred to surgical obesity treatment during the program and did not complete all four years of the behavioral weight loss treatment (Figure 1). Neri et al. (2024) investigate reasons for dropouts in adults with overweight and obesity absolving a cognitive behavioral treatment [39]. They reported a dropout-rate between 5 and 62% in the studies included in their review. The focus was primarily on the reasons for dropping out. We only recorded these in categorized form. However, health and familial reasons appear to be a common reason. Looking at the dropout-rates of the studies in relation to the duration of the intervention, the duration seems to have an impact on the dropout-rate [39]. To our knowledge, no other evaluation of a behavioral treatment program under real world conditions with an intervention period of four years has not yet been published. Thus, a comparison of the dropout-rate is severely limited and our results fit into the broadly diversified field of dropout-rates.
Although the evaluation of cost efficacy of reported behavioral weight loss programs is difficult due to inconsistent methodologies of analyses, behavioral weight loss interventions seem to be cost-effective [40], with a non-linear relationship between health care costs and BMI-change [41]. Without intervention, in persons with obesity further weight gain occurs with increasing age regardless of the initial weight [3]. Consequently, considering previous literature [42], we hope that the program costs will be compensated on the long run by reduced health care costs for obesity associated comorbidities. However, this verification requires a longer observation period.
Some limitations of our study have to be discussed. First, our study was not a randomized clinical trial with an untreated group, but an uncontrolled observation of real world data. Thus, we cannot exclude unspecific treatment effects. However, our aim was to evaluate a behavioral weight loss program which was fully covered by a health insurance company and open to all patients insured with that company under real world conditions. We wanted to investigate if our program, which clearly differs in patient selection and available resources from controlled study conditions, which are usually far away from real world situations, can achieve meaningful benefits for participants. Second, health care costs could only be collected for fully completed therapy years. From our point of view, the cost analysis nevertheless provides a good overview for an initial assessment of cost efficiency. Third, our evaluation only covers the effects on body weight and health parameters during the treatment period. For evaluating maintenance of change, a follow up assessment in the years after the end of the program should be conducted. A study on this issue is already ongoing.
5. Conclusions
The current evaluation shows that the four-year Leipzig Obesity program, which is fully funded by a health insurance company, is a promising treatment approach for people with obesity class 2 and 3. A comparison with other studies showed that the intensity of follow-up care is decisive for long-term success of therapy. Health effects were maintained until the end of the program, although there was a slight vanishing trend of achieved medical benefits after the first intensive year of therapy. With regard to health care costs, there was no significant change during the time of evaluation. Here, more accurate studies with longer observation periods are necessary for a better assessment. However, the most outstanding feature of this evaluation is the real world data. In contrast to randomized, controlled studies under research conditions, our real world data allows an unbiased view of the achievable clinical effectiveness of the Leipzig Obesity Management program and is thus an important contribution to the development of treatment strategies for obesity.
6. Patents
Author Contributions
For research articles with several authors, a short paragraph specifying their individual contributions must be provided. The following statements should be used “Conceptualization, SV.F., M.S, M.F., A.H. and H.S.; methodology, SV.F., M.F. and H.S.; validation, SV.F., M.F. and H.S.; formal analysis, SV.F., HC.P. and S.V.; investigation, SV.F. and H.S.; resources, M.S., M.F. and M.B.; data curation, SV.F., H.F., N.S. and H.S.; writing—original draft preparation, SV.F., HC.P., S.V. and H.S.; writing—review and editing, SV.F., HC.P., S.V., F.F., H.F., N.S., M.S., M.F., M.B., A.H. and H.S.; visualization, SV.F. and H.S.; supervision, A.H. and H.S.; project administration, SV.F., F.F. and N.S.; funding acquisition, M.S., M.F. and M.B. All authors have read and agreed to the published version of the manuscript.”.
Funding
This research received no external funding.
Institutional Review Board Statement
The study was conducted in accordance with the Declaration of Helsinki, and approved by the Institutional Ethics Committee of the University of Leipzig [file number 157-12-12122011 and 06/23/2012].
Informed Consent Statement
Informed consent was obtained from all subjects involved in the study.
Data Availability Statement
The data that were generated and/or analyzed during the current study are available in pseudonymized form on request from the corresponding author in compliance with legal requirements and the informed consent.
Acknowledgments
We thank all participants of the Leipzig Obesity Management program for agreeing to analyze their data. We thank to Dr. rer. nat. habil. David Petroff for the statistical advice.
Conflicts of Interest
M.B. received honoraria as a consultant and speaker from Amgen, AstraZeneca, Bayer, Boehringer-Ingelheim, Daiichi-Sankyo, Lilly, Novo Nordisk, Novartis, Pfizer and Sanofi. A.H. reported receiving grants from the Federal Ministry of Education and Research, German Research Foundation, and Roland Ernst Foundation for Healthcare outside the submitted work; royalties for books on the treatment of eating disorders and obesity with Hogrefe and Kohlhammer; honoraria for workshops and lectures on eating disorders and obesity and their treatment; honoraria as editor of the International Journal of Eating Disorders and the journal Psychotherapeut; honoraria as a reviewer from Mercator Research Center Ruhr, Oxford University Press, and the German Society for Nutrition; and honoraria as a consultant for WeightWatchers, Zweites Deutsches Fernsehen, and Takeda. All other authors state that there are no conflicts of interest to declare. Abbreviations.
Appendix A
Interested people could call the hotline of the Obesity Outpatient Clinic at the Leipzig University autonomously. They got information about the content of the program, the need for regular participation (aim: participation in ≥80% of the appointments) and the data handling.

Table A1.
Laboratory parameters collected within the program (t0-t4).
| Diagnostic field | Parameter |
| Glucose Metabolism | Glucose Hemoglobin A1c C-Peptide Insulin |
| Lipids | Triglycerides Cholesterol High-density lipoprotein Low-density lipoprotein |
| Endocrinology | Cortisol Lutropin Follitropin Estradiol Testosteron |
| Electrolytes | Potassium Sodium |
| Haematology | Blood cell count |
| Liver/Pancreas | Alanine-aminotransferase Aspartate-aminotransferase Alkaline phosphatase Gamma-glutamyltransferase |
| Kidney | Creatinine |
| Heart/muscles | Creatine kinase |
| Inflammation | C-reactive protein |
Table A2.
Summary of the three courses of the Leipzig Obesity Management program of the first treatment segment (each patient was included into one of the courses) and the classes of the second to fourth segment of the program.
Table A2.
Summary of the three courses of the Leipzig Obesity Management program of the first treatment segment (each patient was included into one of the courses) and the classes of the second to fourth segment of the program.
| Inclusion criteria | Group size | Nutritional therapy | Exercise training | Behavioral therapy | Psychological crisis intervention | ||
| Group sessions | Individual sessions | Group sessions | Groups sessions | Individual sessions | |||
| 1st segment of therapy | |||||||
| „Individual therapy program“ | BMI ≥35 kg/m2 adaptable to physical fitness |
13-15 participants | 8 units with 90 min. | 6 units with 30 min.§ | 48 units with 60 min. | 10 units with 90 min. | as necessary |
| M.O.B.I.L.I.S. | BMI 35-40 kg/m2 At least 1 W per kg bodyweight in physical fitness test |
15-18 participants | 6 units with 90 min. | - § | 40 units with 60 min. | 12 units with 90 min. | as necessary |
| DOC WEIGHT® | BMI 35-40 kg/m2 plus comorbidity or BMI ≥40 kg/m2 At least 1 W per kg bodyweight in physical fitness test |
11-13 participants | 12 units with 90 min. | 2 units with 60 min.§ | 40 units with 45 min. | 12 units with 90 min. | as necessary |
| 2nd to 4th segment of therapy | |||||||
| Successful completion of the 1st segment | 13-18 participants | - | 8 units with 30 min.§ | 36 units with 60 min. | 16 units with 120 min. | as necessary | |
BMI =body mass index. §If needed, extra individual nutritional therapy sessions could be scheduled.
Three Options of Behavioral Therapy Programs
There were three options for similar behavioral treatment programs during the first segment (Tab. A2). Patients were grouped regarding their physical ability for participation in exercise sessions and the daytime when they could best participate.
M.O.B.I.L.I.S. is a behavioral treatment program offered throughout Germany that is aimed at patients with a BMI between 35 and 40 kg/m2 and a good physical fitness (a person needs to reach at least 1 W per kg bodyweight in a physical fitness test). It consists of groups sessions and includes 6 units (each 90 min.) nutritional therapy, 40 units (each 60 min.) exercise training and 12 units (each 90 min.) behavioral therapy.
DOC WEIGHT® 2.1 is also a 1-year treatment program offered throughout Germany. It is aimed at patients with a BMI between 35 and 40 kg/m2 plus minimum one obesity-associated comorbidity or a BMI higher than 40 kg/m2 and independent of the BMI a good physical fitness (a person needs to reach at least 1 W per kg bodyweight in a physical fitness test). It consists of groups sessions and includes 12 units (each 90 minutes) nutritional therapy, 40 units (each 45 minutes) exercise training and 12 units (each 90 min.) behavioral therapy. Additional there are two individual sessions (each 60 min.) with the dietician accompanying the group sessions.
The third option was the “individual program”, which is developed by the university hospital Leipzig. There were no inclusion criteria. It consists of groups sessions in behavioral therapy (10 units each 90 min.) and exercise training (48 units each 60 min.). The nutritional therapy is a combination of group sessions (8 units each 90 min.) and individual sessions (6 units each 30 min.).
The costs for the first segment depended on the course and the program. M.O.B.I.L.I.S. costed approximately 1,700 €, DOC WEIGHT® 2,700 € and the “individual program” 1,500 €. Most of patients absolved the “individual program” (n=159; 65%).
Table A3.
Individual items of the EUROHIS-QOL-questionnaire.
| Item | t0 (n=359) |
t1 (n=222) |
t2 (n=119) |
t3 (n=89) |
t4 (n=57) |
p |
|---|---|---|---|---|---|---|
| 1. How would you rate your quality of life? | 3.3 ±0.1 | 3.4 ±0.1* | 3.5 ±0.1*** | 3.6 ±0.1*** | 3.5 ±0.1 | <.001 |
| 2. How satisfied are you with your health? | 2.5 ±0.1 | 3.0 ±0.1*** | 3.1 ±0.1*** | 3.0 ±0.1*** | 3.0 ±0.1** | <.001 |
| 3. Do you have enough energy for everyday life? | 3.3 ±0.1 | 3.4 ±0.1 | 3.6 ±0.1** | 3.5 ±0.1** | 3.5 ±0.1 | <.01 |
| 4. How satisfied are you with your ability to perform your daily activities? | 3.2 ±0.1 | 3.5 ±0.1*** | 3.5 ±0.1** | 3.5 ±0.1** | 3.6 ±0.1*** | <.001 |
| 5. How satisfied are you with yourself? | 2.9 ±0.1 | 3.2 ±0.1*** | 3.4 ±0.1*** | 3.5 ±0.1*** | 3.5 ±0.1*** | <.001 |
| 6. How satisfied are you with your personal relationships? | 3.6 ±0.1 | 3.8 ±0.1* | 3.8 ±0.1 | 4.0 ±0.1*** | 3.9 ±0.1* | <.001 |
| 7. Have you enough money to meet your needs? | 3.1 ±0.1 | 3.3 ±0.1 | 3.4 ±0.1** | 3.5 ±0.1*** | 3.6 ±0.1*** | <.001 |
| 8. How satisfied are you with the conditions of your living place? | 4.0 ±0.1 | 4.0 ±0.1 | 4.0 ±0.1 | 4.1 ±0.1 | 4.1 ±0.1 | .33 |
Range from 1 (very bad) to 5 (very good). Average ±standard error of the mean. Derived from the mixed model analysis, significance levels depicted through asterisks on the respective mean value refer to tests of differences between baseline (t0) and the respective time point, controlling for age and multiple testing according to Bonferroni [21]. Further, distinct p-values are shown for tests of significant time/treatment effects within the mixed model analysis. EUROHIS-QOL =EUROHIS-QOL 8 Item Index [14]. ***p<.001, **p<.01, *p<.05.
Table A4.
Individual items of the PHQ9-questionnaire.
| Over the last 2 weeks, how often have you been bothered by any of the following problems? |
t0 (n=379) |
t1 (n=224) |
t2 (n=119) |
t3 (n=89) |
t4 (n=56) |
p |
| 1. Little interest or pleasure in doing things | 2.0 ±0.0 | 1.8 ±0.0** | 1.8 ±0.1** | 1.9 ±0.1 | 1.9 ±0.1 | <.01 |
| 2. Feeling down, depressed, or hopeless | 2.0 ±0.0 | 1.7 ±0.1** | 1.6 ±0.1*** | 1.6 ±0.1*** | 1.6 ±0.1*** | <.001 |
| 3. Trouble falling or staying asleep, or sleeping too much | 2.5 ±0.1 | 2.2 ±0.1** | 2.3 ±0.1 | 2.3 ±0.1 | 2.4 ±0.1 | <.01 |
| 4. Feeling tired or having little energy | 2.5 ±0.1 | 2.1 ±0.1*** | 2.2 ±0.1** | 2.2 ±0.1** | 2.3 ±0.1 | <.001 |
| 5. Poor appetite or overeating | 2.1 ±0.1 | 1.9 ±0.1*** | 1.8 ±0.1*** | 1.9 ±0.1** | 1.8 ±0.1** | <.001 |
| 6. Feeling bad about yourself – or that you are a failure or have let yourself or your family down | 1.8 ±0.1 | 1.5 ±0.1*** | 1.4 ±0.1*** | 1.5 ±0.1** | 1.4 ±0.1*** | <.001 |
| 7. Trouble concentrating on things, such as reading the newspaper or watching television | 1.6 ±0.1 | 1.5 ±0.1 | 1.4 ±0.1 | 1.5 ±0.1 | 1.6 ±0.1 | .07 |
| 8. Moving or speaking so slowly that other people could have noticed? Or the opposite – being so fidgety or restless that you have been moving around a lot more than usual | 1.3 ±0.0 | 1.2 ±0.0** | 1.1 ±0.0*** | 1.2 ±0.0** | 1.2 ±0.1* | <.001 |
| 9. Thoughts that you would be better off dead or of hurting yourself in some way | 1.2 ±0.0 | 1.1 ±0.0* | 1.1 ±0.0*** | 1.1 ±0.0*** | 1.1 ±0.0*** | <.001 |
Range from 0 (not at all) to 3 (nearly every day). Average ±standard error of the mean. Derived from the mixed model analysis, significance levels depicted through asterisks on the respective mean value refer to tests of differences between baseline (t0) and the respective time point, controlling for age and multiple testing according to Bonferroni [21]. Further, distinct p-values are shown for tests of significant time/treatment effects within the mixed model analysis. PHQ-9 =patient health questionnaire [15]. ***p<.001, **p<.01, *p<.05.
Table A5.
Self-reported reasons for dropping out (n=237).
| Reason for dropping out | n (%) |
|---|---|
| Personal / familial | 67 (28%) |
| Health | 37 (16%) |
| Termination by the university hospital due to lack of motivation | 77 (32%) |
| Professional | 17 (7%) |
| Dissatisfaction with the program | 16 (7%) |
| Death | 5 (2%) |
| Relocation | 4 (2%) |
| Other | 14 (6%) |
Table A6.
Available patient measurements with data at different assessments for each parameter. Differences occured due to missing data.
Table A6.
Available patient measurements with data at different assessments for each parameter. Differences occured due to missing data.
| t0 | t1 | t2 | t3 | t4 | |
|---|---|---|---|---|---|
| Body weight (kg) Women Men |
381 272 (71.4%) 109 |
243 173 (71.2%) 70 |
126 89 (70.6%) 37 |
94 67 (71.3%) 27 |
77 55 (71.4%) 22 |
| Body mass index (kg/m2) Women Men |
381 272 (71.4%) 109 |
243 173 (71.2%) 70 |
126 89 (70.6%) 37 |
94 67 (71.3%) 27 |
77 55 (71.4%) 22 |
| Waist circumference (cm) Women Men |
247 174 (70.4%) 73 |
210 146 (69.5%) 64 |
125 89 (71.2%) 36 |
94 67 (71.3%) 27 |
75 55 (73.3%) 20 |
| Hip circumference (cm) Women Men |
240 171 (71.3%) 69 |
207 145 (70.0%) 62 |
125 89 (71.2%) 36 |
94 67 (71.3%) 27 |
75 55 (73.3%) 20 |
| Fasting glucose (mmol/l) Diabetic patients§ Non-diabetics |
379 116 (30.6%) 263 |
218 60 (27.5%) 158 |
115 32 (27.8%) 83 |
84 28 (33.3%) 56 |
70 25 (35.7%) 45 |
| HbA1c (%) Diabetic patients§ Non-diabetics |
353 98 (27.8%) 255 |
216 58 (26.9%) 158 |
115 32 (27.8%) 83 |
84 28 (33.3%) 56 |
70 25 (35.7%) 45 |
| C-peptide (nmol/l) Diabetic patients§ Non-diabetics |
355 111 (31.3%) 244 |
217 60 (27.6%) 157 |
114 32 (28.1%) 82 |
84 28 (33.3%) 56 |
69 24 (34.8%) 45 |
| HOMA2-IR Diabetic patients† Non-diabetics |
311 74 (23.8%) 237 |
209 52 (24.9%) 157 |
110 28 (25.5%) 82 |
80 24 (30.0%) 56 |
65 20 (30.8%) 45 |
| Total cholesterol‡ (mmol/l) | 379 | 225 | 116 | 84 | 66 |
| LDL cholesterol‡ (mmol/l) | 379 | 225 | 116 | 84 | 66 |
| HDL cholesterol‡ (mmol/l) | 379 | 227 | 116 | 84 | 66 |
| Triglycerides‡ (mmol/l) | 379 | 227 | 116 | 84 | 66 |
| C-reactive protein (mg/l) | 379 | 242 | 119 | 90 | 75 |
| ASAT (µkat/l) | 379 | 242 | 126 | 94 | 77 |
| ALAT (µkat/l) | 379 | 242 | 126 | 94 | 77 |
| GGT (µkat/l) | 379 | 242 | 126 | 94 | 77 |
| Quality of life (EUROHIS-QOL) | 360 | 222 | 119 | 89 | 57 |
| Depression (PHQ-9) | 380 | 224 | 120 | 89 | 56 |
ALAT =Alanine-aminotransferase, ASAT =Aspartate-aminotransferase, EUROHIS-QOL =EUROHIS-QOL 8 Item Index, GGT =Gamma-glutamyltransferase, HbA1c =Hemoglobin A1c, HDL =high-density lipoprotein, LDL =low-density lipoprotein, PHQ-9 =patient health questionnaire. §Patients with type 2 diabetes without changes in diabetes-medication during the whole course of the program, n=24 were thus excluded from this analysis: in 17 patients glucose lowering medication was intensified, in 7 patients reduced; †Patients with type 2 diabetes without changes in diabetes-medication during the whole course of the program and without insulin therapy, n=45 were thus excluded from this analysis; ‡Patients without changes in lipid lowering medication, during the whole course of the program, n=15 were thus excluded from this analysis: in 10 patients lipid lowering medication was intensified, in 5 patients reduced.
Table A7.
Table A7. Development of anthropometric, metabolic and psychological parameters during therapy progress of the t4-completers (n=77).
Table A7.
Table A7. Development of anthropometric, metabolic and psychological parameters during therapy progress of the t4-completers (n=77).
| t0 | t1 | t2 | t3 | t4 | p | |
|---|---|---|---|---|---|---|
| Body weight (kg) Women Men |
119.4 ±2.7 113.2 ±2.5 134.9 ±5.9 |
111.7 ±2.6*** 105.7 ±2.4*** 126.8 ±5.8*** |
114.0 ±2.6*** 107.5 ±2.4** 130.3 ±5.5* |
114.5 ±2.6*** 108.1 ±2.5** 130.4 ±5.2* |
114.7 ±2.6*** 108.4 ±2. 4* 130.5 ±5.3* |
<.001# <.001# <.01# |
| Body mass index (kg/m2) Women Men |
42.6 ±0.8 42.9 ±0.9 42.0 ±1.5 |
39.9 ±0.8*** 40.0 ±0.9*** 39.4 ±1.5*** |
40.7 ±0.7*** 40.7 ±0.9** 40.6 ±1.4* |
40.8 ±0.7*** 40.9 ±0.9** 40.6 ±1.3* |
41.0 ±0.7** 41.1 ±0.9* 40.7 ±1.3* |
<.001# <.01# <.01# |
| Waist ratio (cm) Women Men |
124.9 ±1.9 121.7 ±2.1 134.4 ±3.3 |
120.7 ±1.9*** 116.8 ±1.8*** 130.5 ±4.0** |
120.8 ±1.9*** 116.9 ±1.9** 130.8 ±3.8* |
121.3 ±1.8*** 116.9 ±1.9** 132.0 ±3.4 |
122.3 ±1.9* 117.3 ±1.7** 136.0 ±3.6 |
<.001# <.01# <.05# |
| Hip ratio (cm) Women Men |
135.8 ±1.9 137.9 ±2.2 129.2 ±2.8 |
129.3 ±1.7*** 130.7 ±1.9*** 125.9 ±3.9** |
128.7 ±1.8*** 130.0 ±1.9*** 125.1 ±3.8** |
129.2 ±1.7*** 130.2 ±1.9*** 126.8 ±3.7* |
130.8 ±1.7** 131.2 ±1.9** 129.7 ±3.8 |
<.001# <.001# <.05# |
| Fasting glucose (mmol/l) Diabetic patients§ (n=25) Non-diabetics (n=45) |
6.2 ±0.2 7.3 ±0.3 5.6 ±0.1 |
5.9 ±0.2** 6.8 ±0.4* 5.4 ±0.1** |
6.2 ±0.2 7.4 ±0.4 5.6 ±0.1 |
6.3 ±0.2 7.3 ±0.6 5.7 ±0.1 |
6.3 ±0.2 7.5 ±0.5 5.6 ±0.1 |
.08# .36# <.05# |
| HbA1c (%) Diabetic patients§ Non-diabetics |
5.9 ±0.1 6.5 ±0.2 5.6 ±0.1 |
5.6 ±0.1*** 6.2 ±0.2** 5.3 ±0.0*** |
5.7 ±0.1*** 6.2 ±0.2* 5.4 ±0.0*** |
5.7 ±0.1*** 6.3 ±0.2 5.4 ±0.1*** |
5.8 ±0.1* 6.3 ±0.2 5.5 ±0.1** |
<.001# <.05 <.001 |
| C-peptide (nmol/l) Diabetic patients§ Non-diabetics |
1.2 ±0.1 1.4 ±0.1 1.2 ±0.1 |
1.1 ±0.1** 1.3 ±0.1 1.0 ±0.1* |
1.1 ±0.1** 1.2 ±0.1 1.0 ±0.1** |
1.0 ±0.1*** 1.1 ±0.1** 0.9 ±0.1** |
1.0 ±0.1** 1.2 ±0.2 0.9 ±0.1*** |
<.001# .22# <.001# |
| HOMA-IR Diabetic patients†(n=21) Non-diabetics (n=45) |
5.1 ±0.4 6.4 ±0.6 4.5 ±0.4 |
3.9 ±0.3*** 4.7 ±0.4*** 3.6 ±0.4** |
4.5 ±0.4 5.9 ±1.0 3.9 ±0.4 |
4.8 ±0.6 4.9 ±0.7 4.7 ±0.8 |
4.1 ±0.3** 4.9 ±0.7* 3.7 ±0.3 |
.16# .14# .35# |
| Total cholesterol‡ (mmol/l) | 5.1 ±0.1 | 4.9 ±0.1* | 4.9 ±0.1* | 5.0 ±0.1* | 4.9 ±0.1** | <.05 |
| LDL cholesterol‡ (mmol/l) | 3.3 ±0.1 | 3.2 ±0.1 | 3.3 ±0.1 | 3.2 ±0.1 | 3.2 ±0.1 | .18 |
| HDL cholesterol‡ (mmol/l) | 1.3 ±0.4 | 1.4 ±0.0* | 1.4 ±0.0* | 1.4 ±0.0* | 1.4 ±0.0** | <.05# |
| Triglyceride‡ (mmol/l) | 1.6 ±0.8 | 1.5 ±0.1** | 1.7 ±0.1 | 1.7 ±0.1 | 1.6 ±0.1 | <.01# |
| C-reactive protein (mg/l) | 7.8 ±0.8 | 6.5 ±1.1 | 6.1 ±0.6*** | 7.0 ±1.2 | 5.9 ±0.6** | .21# |
| ASAT (µkat/l) | 0.5 ±0.0 | 0.4 ±0.0** | 0.5 ±0.0 | 0.4 ±0.0*** | 0.4 ±0.0*** | <.01# |
| ALAT (µkat/l) | 0.6 ±0.0 | 0.5 ±0.0** | 0.5 ±0.1 | 0.5 ±0.0** | 0.5 ±0.0** | <.05# |
| GGT (µkat/l) | 0.7 ±0.1 | 0.6 ±0.1 | 0.7 ±0.1 | 0.6 ±0.1 | 0.6 ±0.1* | .11# |
| Quality of life (EUROHIS-QOL) | 3.5 ±0.1 | 3.6 ±0.1** | 3.6 ±0.1* | 3.6 ±0.1** | 3.7 ±0.1** | <.05 |
| Depression (PHQ-9) | 6.3 ±0.5 | 5.0 ±0.5** | 5.5 ±0.6 | 6.1 ±0.5 | 5.6 ±0.5 | .19# |
Average ± standard error of the mean. ALAT = Alanine-aminotransferase, ASAT = Aspartate-aminotransferase, EUROHIS-QOL = EUROHIS-QOL 8 Item Index, GGT = Gamma-glutamyltransferase, HbA1c = Hemoglobin A1c, HDL = high-density lipoprotein, LDL = low-density lipoprotein, PHQ-9 = patient health questionnaire. ***p<.001, **p<.01, *p<.05; §Patients with type 2 diabetes without changes in diabetes-medication during the whole course of the program, n=7 were thus excluded from this analysis: in 4 patients glucose lowering medication was intensified, in 3 patients reduced; †Patients with type 2 diabetes without changes in diabetes-medication during the whole course of the program and without insulin therapy, n=11 were thus excluded from this analysis; ‡Patients without changes in lipid lowering medication, during the whole course of the program, n=10 were thus excluded from this analysis: in 7 patients lipid lowering medication was intensified, in 3 patients reduced. #The Greenhouse-Geisser adjustment was used to correct for violations of sphericity.
References
- Avila, C.; Holloway, A.C.; Hahn, M.K.; Morrison, K.M.; Restivo, M.; Anglin, R. et al. An Overview of Links Between Obesity and Mental Health. Curr Obes Rep 2015; 4(3):303–10.
- World Health Oganisation. Obesity; 2023. Available from: URL: https://www.who.int/health-topics/obesity#tab=tab_1.
- Teuner, C.M.; Menn, P.; Heier, M.; Holle, R.; John, J.; Wolfenstetter, S.B. Impact of BMI and BMI change on future drug expenditures in adults: results from the MONICA/KORA cohort study. BMC Health Serv Res 2013; 13:424.
- Vidal, J. Updated review on the benefits of weight loss. Int J Obes Relat Metab Disord 2002; 26 Suppl 4:S25-8.
- Yumuk, V.; Tsigos, C.; Fried, M.; Schindler, K.; Busetto, L.; Micic, D.; et al. European Guidelines for Obesity Management in Adults. Obes Facts 2015; 8(6):402–24.
- Deutsche Adipositas-Gesellschaft (DAG) e., v. S3-Leitlinie Adipositas - Prävention und Therapie [Version 5.0 Oktober 2024]. Available from: URL: https://register.awmf.org/de/leitlinien/detail/050-001.
- Swan, W.I.; Vivanti, A.; Hakel-Smith, N.A.; Hotson, B.; Orrevall, Y.; Trostler, N.; et al. Nutrition Care Process and Model Update: Toward Realizing People-Centered Care and Outcomes Management. Journal of the Academy of Nutrition and Dietetics 2017; 117(12):2003–14.
- Lean, M.E.; Leslie, W.S.; Barnes, A.C.; Brosnahan, N.; Thom, G.; McCombie, L.; et al. Primary care-led weight management for remission of type 2 diabetes (DiRECT): an open-label, cluster-randomised trial. Lancet 2018; 391(10120):541–51.
- Kim, T.J.; Knesebeck, O. von dem. Income and obesity: what is the direction of the relationship? A systematic review and meta-analysis. BMJ Open 2018; 8(1):e019862.
- Weimann, A.; Fischer, M.; Oberänder, N.; Prodehl, G.; Weber, N.; Andrä, M.; et al. Willing to go the extra mile: Prospective evaluation of an intensified non-surgical treatment for patients with morbid obesity. Clin Nutr 2019; 38(4):1773–81.
- Wexler, D.J.; Chang, Y.; Levy, D.E.; Porneala, B.; McCarthy, J.; Rodriguez Romero, A.; et al. Results of a 2-year lifestyle intervention for type 2 diabetes: the Reach Ahead for Lifestyle and Health-Diabetes randomized controlled trial. Obesity (Silver Spring) 2022; 30(10):1938–50.
- Aziz, Z.; Absetz, P.; Oldroyd, J.; Pronk, N.P.; Oldenburg, B. A systematic review of real-world diabetes prevention programs: learnings from the last 15 years. Implement Sci 2015; 10:172.
- Frenzel, S.V.; Bach, S.; Ahrens, S.; Hellbardt, M.; Hilbert, A.; Stumvoll, M.; et al. Ausweg aus der Versorgungslücke: Voll Krankenkassen-finanzierte konservative Adipositas-Therapie. Dtsch Med Wochenschr 2020; 145(14):e78-e86.
- Brähler, E.; Mühlan, H.; Albani, C.; Schmidt, S. Teststatistische Prüfung und Normierung der deutschen Versionen des EUROHIS-QOL Lebensqualität-Index und des WHO-5 Wohlbefindens-Index. Diagnostica 2007; 53(2):83–96.
- Löwe, B.; Kroenke, K.; Herzog, W.; Gräfe, K. Measuring depression outcome with a brief self-report instrument: sensitivity to change of the Patient Health Questionnaire (PHQ-9). J Affect Disord 2004; 81(1):61–6.
- Dietrich, A. Aktuelle S3-Leitlinie „Therapie der Adipositas und metabolischer Erkrankungen“. Allgemein- und Viszeralchirurgie up2date 2019; 13(02):111–21.
- König, D.; Hörmann, J. ; Predel, H-G.; Berg, A. A 12-Month Lifestyle Intervention Program Improves Body Composition and Reduces the Prevalence of Prediabetes in Obese Patients. Obes Facts 2018; 11(5):393–9.
- Rudolph, A.; Hellbardt, M.; Baldofski, S.; Zwaan, M. de; Hilbert, A. Evaluation des einjährigen multimodalen Therapieprogramms DOC WEIGHT® 1.0 zur Gewichtsreduktion bei Patienten mit Adipositas Grad II und III. Psychother Psychosom Med Psychol 2016; 66(8):316–23.
- Schwalm, S.V.; Hilbert, A.; Stumvoll, M.; Striebel, R.; Sass, U.; Tiesler, U.; et al. Das Leipziger Adipositasmanagement. Adipositas - Ursachen, Folgeerkrankungen, Therapie 2015; 09(02):87–92. Available from: URL: https://www.thieme-connect.com/products/ejournals/html/10.1055/s-0037-1618900.
- Matthews, D.R.; Hosker, J.P.; Rudenski, A.S.; Naylor, B.A.; Treacher, D.F.; Turner, R.C. Homeostasis model assessment: insulin resistance and beta-cell function from fasting plasma glucose and insulin concentrations in man. Diabetologia 1985; 28(7):412–9.
- Curtin, F. , Schulz, P. Multiple correlations and Bonferroni's correction. Biol Psychiatry 1998; 44(8):775–7. Available from: URL: https://pubmed.ncbi.nlm.nih.gov/9798082/.
- Schwarz, G. Estimating the Dimension of a Model. The Annals of Statistics 1978; 6(2):461–4. Available from: URL: http://www.jstor.org/stable/2958889.
- Holm, S. A Simple Sequentially Rejective Multiple Test Procedure. Scandinavian Journal of Statistics 1979; 6(2):65–70. Available from: URL: http://www.jstor.org/stable/4615733.
- Bischoff, S.C.; Schweinlin, A. Obesity therapy. Clin Nutr ESPEN 2020; 38:9–18.
- Bray, G.A.; Heisel, W.E.; Afshin, A.; Jensen, M.D.; Dietz, W.H.; Long, M.; et al. The Science of Obesity Management: An Endocrine Society Scientific Statement. Endocr Rev 2018; 39(2):79–132.
- Ryan, D.H.; Yockey, S.R. Weight Loss and Improvement in Comorbidity: Differences at 5%, 10%, 15%, and Over. Curr Obes Rep 2017; 6(2):187–94.
- Hauner, H.; Moss, A.; Berg, A.; Bischoff, S.C.; Colombo-Benkmann, M.; Ellrott, T.; et al. Interdisziplinäre Leitlinie der Qualität S3 zur „Prävention und Therapie der Adipositas”. Adipositas - Ursachen, Folgeerkrankungen, Therapie 2014; 08(04):179–221.
- Garvey, W.T.; Mechanick, J.I.; Brett, E.M.; Garber, A.J.; Hurley, D.L.; Jastreboff, A.M.; et al. AMERICAN ASSOCIATION OF CLINICAL ENDOCRINOLOGISTS AND AMERICAN COLLEGE OF ENDOCRINOLOGY COMPREHENSIVE CLINICAL PRACTICE GUIDELINES FOR MEDICAL CARE OF PATIENTS WITH OBESITY. Endocr Pract 2016; 22 Suppl 3:1–203.
- Appel, L.J.; Clark, J.M. ; Yeh, H-C.; Wang, N-Y.; Coughlin, J.W.; Daumit, G. et al. Comparative effectiveness of weight-loss interventions in clinical practice. N Engl J Med 2011; 365(21):1959–68.
- American Diabetes Association Professional Practice Committee. 8. Obesity and Weight Management for the Prevention and Treatment of Type 2 Diabetes: Standards of Medical Care in Diabetes-2022. Diabetes Care 2022; 45(Suppl 1):S113-S124. Available from: URL: https://diabetesjournals.org/care/article/45/Supplement_1/S113/138906/8-Obesity-and-Weight-Management-for-the-Prevention.
- Kullo, I.J.; Trejo-Gutierrez, J.F.; Lopez-Jimenez, F.; Thomas, R.J.; Allison, T.G.; Mulvagh, S.L.; et al. A perspective on the New American College of Cardiology/American Heart Association guidelines for cardiovascular risk assessment. Mayo Clin Proc 2014; 89(9):1244–56.
- Grundy, S.M.; Stone, N.J.; Bailey, A.L.; Beam, C.; Birtcher, K.K.; Blumenthal, R.S.; et al. 2018 AHA/ACC/AACVPR/AAPA/ABC/ACPM/ADA/AGS/APhA/ASPC/NLA/PCNA Guideline on the Management of Blood Cholesterol: A Report of the American College of Cardiology/American Heart Association Task Force on Clinical Practice Guidelines. Circulation 2019; 139(25):e1082-e1143.
- 2019 ESC/EAS guidelines for the management of dyslipidaemias: Lipid modification to reduce cardiovascular risk. Atherosclerosis 2019; 290:140–205.
- Ge, L.; Sadeghirad, B.; Ball, G.D.C.; da Costa, B.R.; Hitchcock, C.L.; Svendrovski, A.; et al. Comparison of dietary macronutrient patterns of 14 popular named dietary programmes for weight and cardiovascular risk factor reduction in adults: systematic review and network meta-analysis of randomised trials. BMJ 2020; 369:m696. Available from: URL: https://www.ncbi.nlm.nih.gov/pmc/articles/PMC7190064/.
- Chandrasekhar, J.; Zaman, S. Associations Between C-Reactive Protein, Obesity, Sex, and PCI Outcomes: The Fat of the Matter. JACC Cardiovasc Interv 2020; 13(24):2893–5.
- Ramos-Lopez, O.; Martinez-Urbistondo, D.; Vargas-Nuñez, J.A.; Martinez, J.A. The Role of Nutrition on Meta-inflammation: Insights and Potential Targets in Communicable and Chronic Disease Management. Curr Obes Rep 2022; 11(4):305–35.
- McCarney, R.; Warner, J.; Iliffe, S.; van Haselen, R.; Griffin, M.; Fisher, P. The Hawthorne Effect: a randomised, controlled trial. BMC Med Res Methodol 2007; 7:30.
- Kroenke, K. Enhancing the clinical utility of depression screening. CMAJ 2012; 184(3):281–2.
- Neri, Ld.C.L.; Mariotti, F.; Guglielmetti, M.; Fiorini, S.; Tagliabue, A.; Ferraris, C. Dropout in cognitive behavioral treatment in adults living with overweight and obesity: a systematic review. Frontiers in nutrition 2024; 11:1250683. Available from: URL: https://pubmed.ncbi.nlm.nih.gov/38784136/.
- Tremmel, M. ; Gerdtham, U-G.; Nilsson, P.M.; Saha, S. Economic Burden of Obesity: A Systematic Literature Review. Int J Environ Res Public Health 2017; 14(4).
- Harrison, S.; Dixon, P.; Jones, H.E.; Davies, A.R.; Howe, L.D.; Davies, N.M. Long-term cost-effectiveness of interventions for obesity: A mendelian randomisation study. PLoS medicine 2021; 18(8):e1003725. Available from: URL: https://pubmed.ncbi.nlm.nih.gov/34449774/.
- Xin, Y.; Davies, A.; Briggs, A.; McCombie, L.; Messow, C.M.; Grieve, E. et al. Type 2 diabetes remission: 2 year within-trial and lifetime-horizon cost-effectiveness of the Diabetes Remission Clinical Trial (DiRECT)/Counterweight-Plus weight management programme. Diabetologia:2112–22. [CrossRef]
Figure 1.
Overview about participation numbers in different parts of the program. #First and †second obesity board, §primary indication for bariatric surgery. One patient was included a second time into the program after dropping out after first inclusion during the first program year. The second period was excluded from further evaluation.
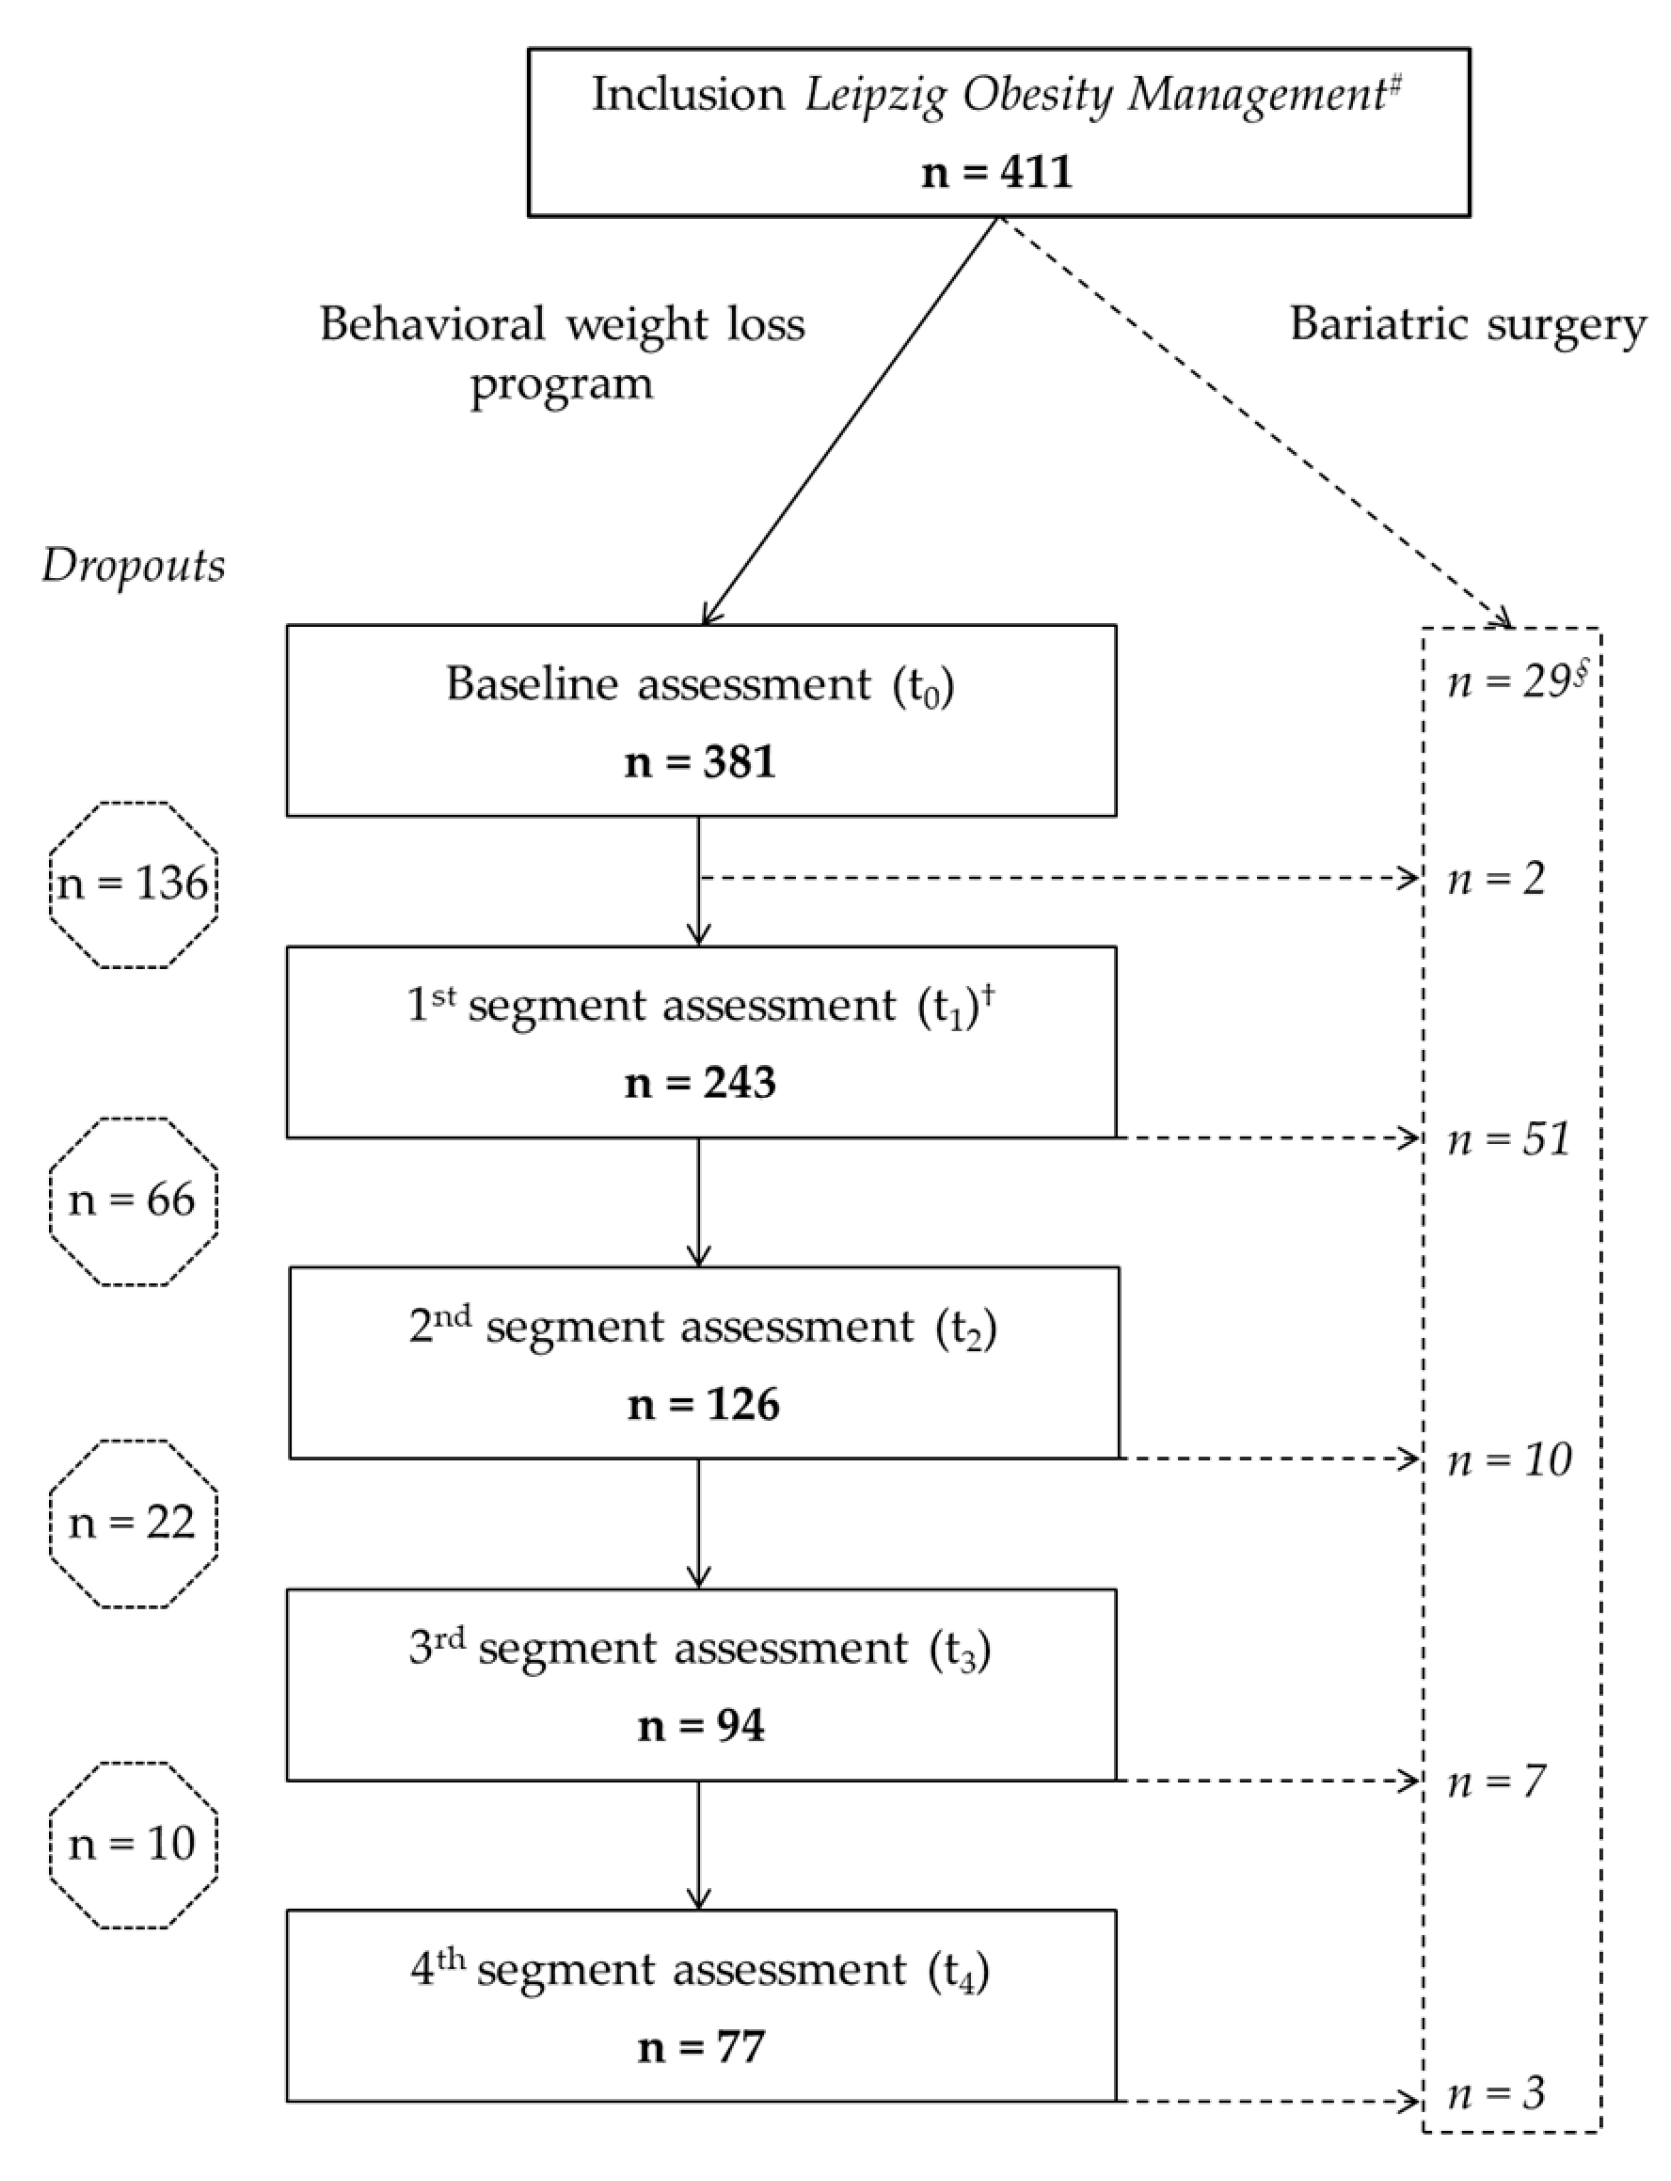
Figure 2.
Weight changes of participants from baseline assessment t0 until the last available measurement. All data assessed in the program, including additional weight measurements between segment assessments, were included. Grey bars = program completers; black bars = participants who switched to bariatric surgery; white bars = participants who quit the program early (dropouts).
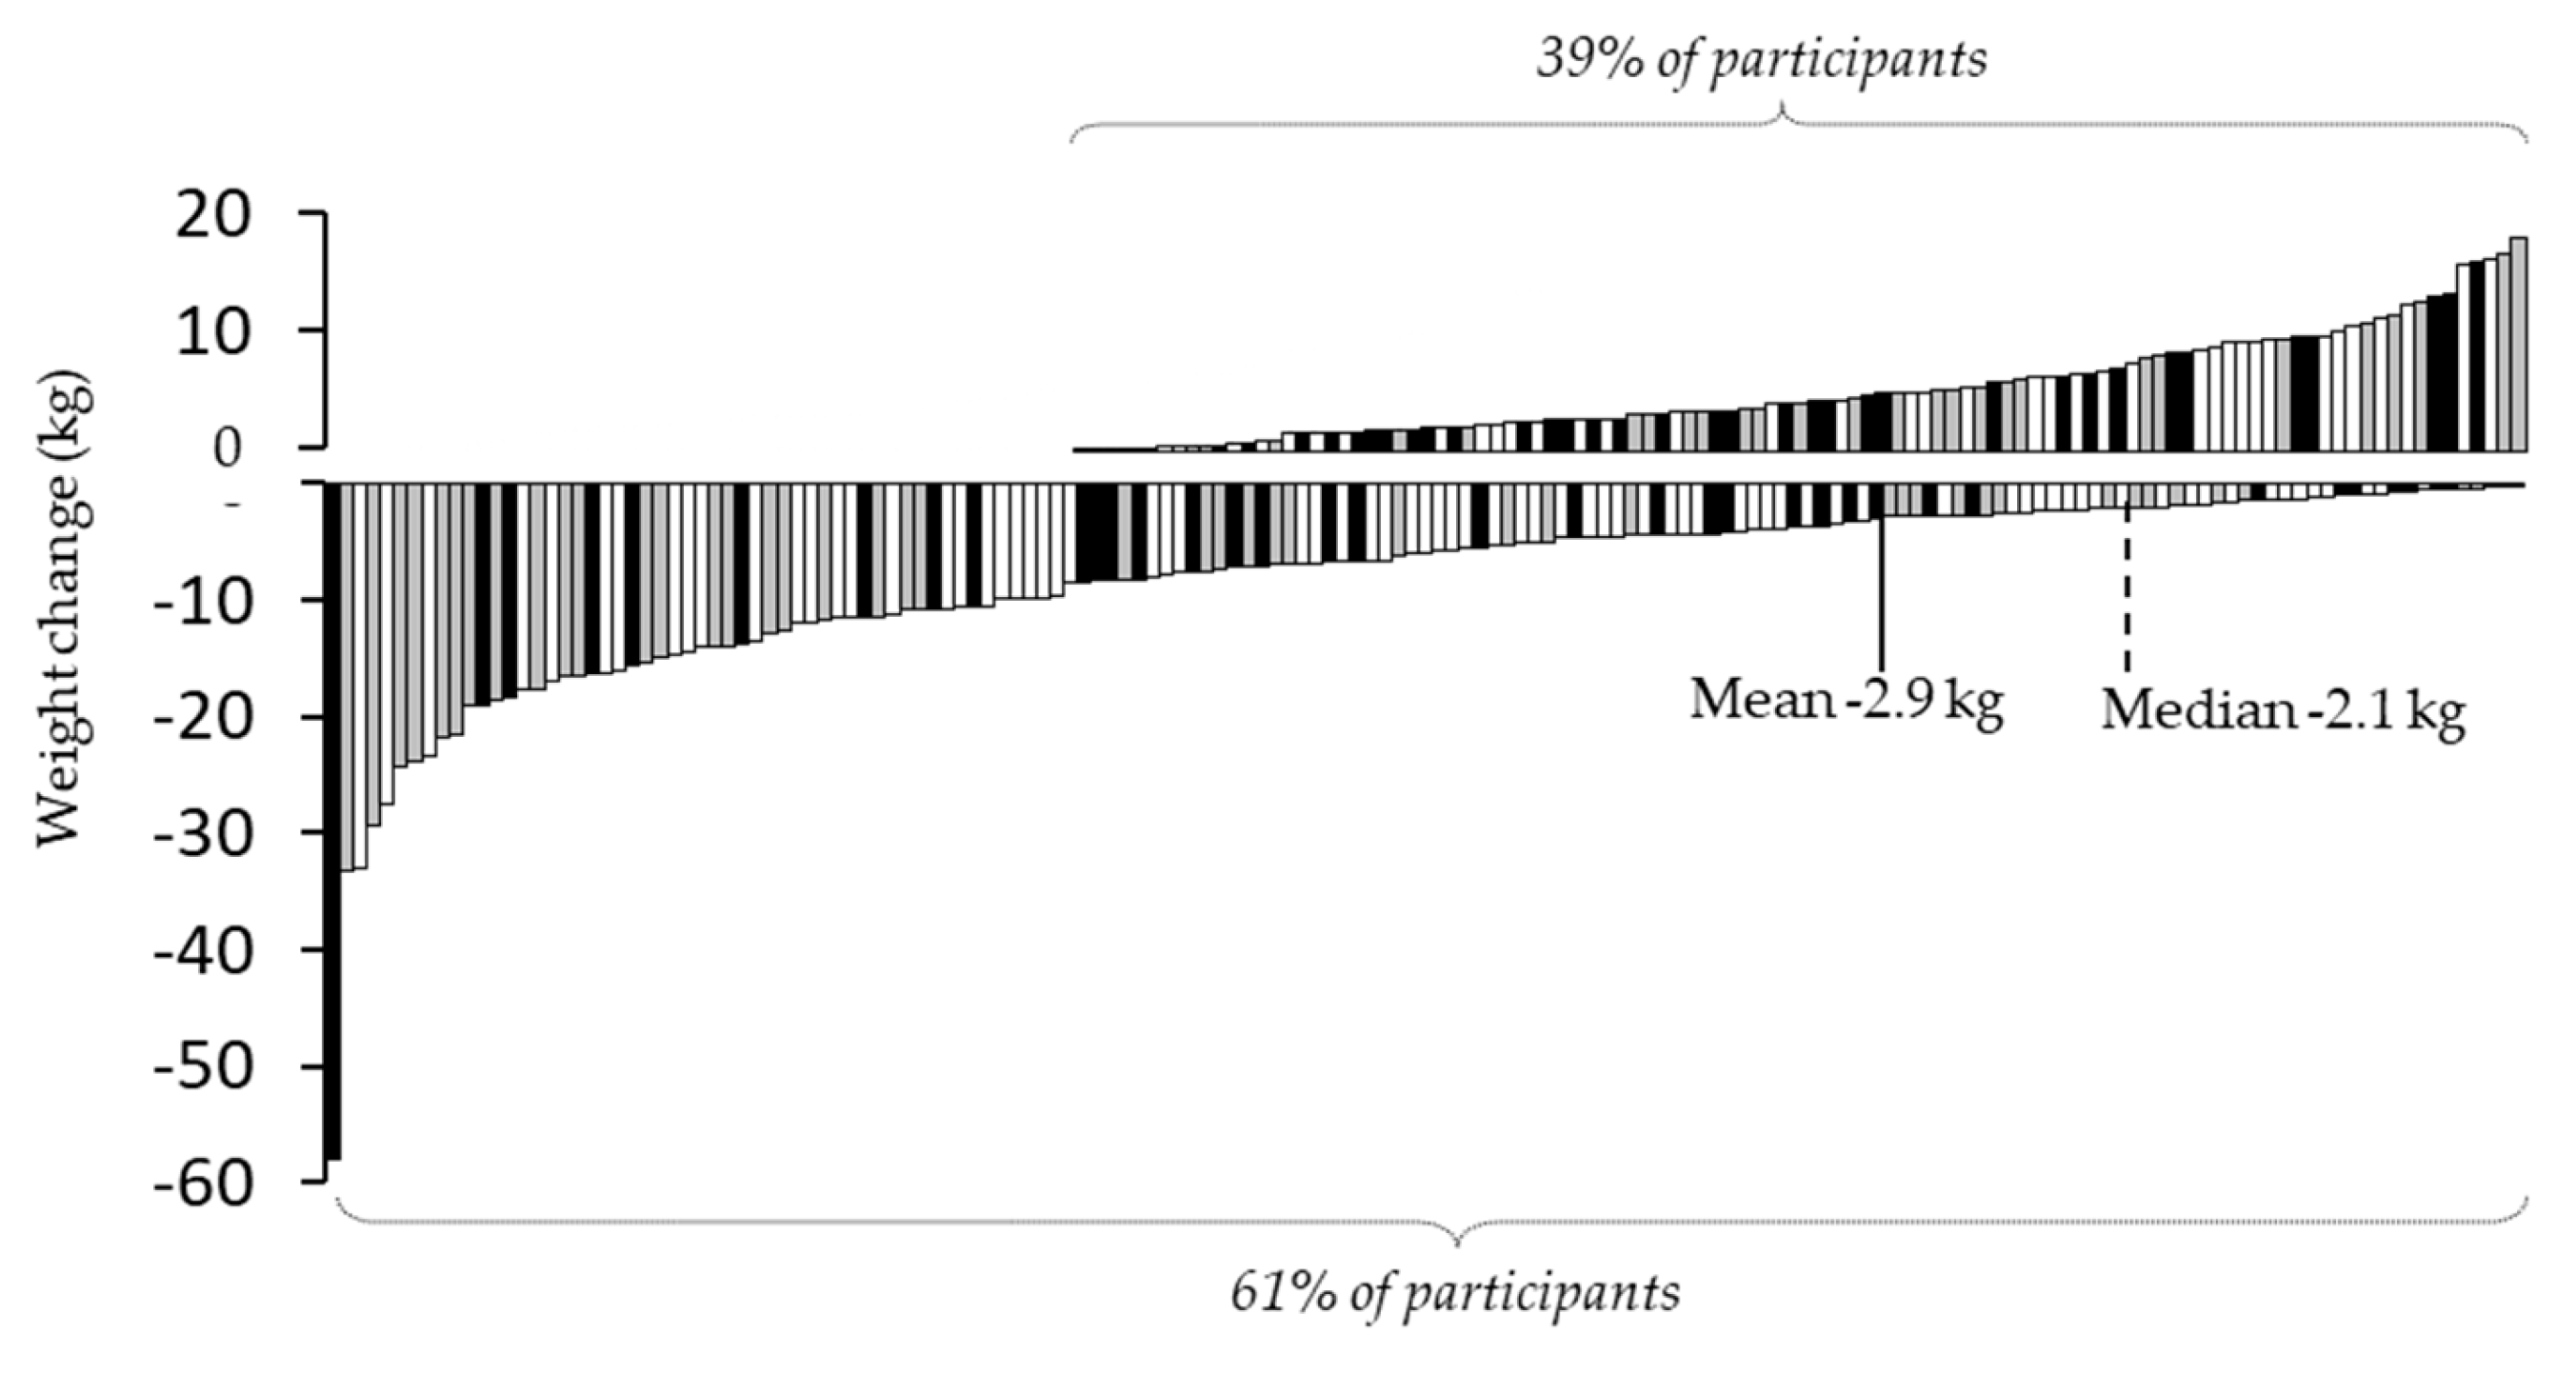
Figure 3.
Progression of fasting glucose, HbA1c and HOMA-IR of all patients, persons with type 2 diabetes and without a diabetes diagnosis, quality of life and depressive symptoms from t0 to t4. Average ±standard error of the mean. Derived from the mixed model analysis, significance levels depicted through asterisks on the respective mean values refer to tests of differences between baseline (t0) and the respective time points, controlling for age and multiple testing according to Bonferroni [21]. #Patients were defined as patients with type 2 diabetes if patients reported a previously established diagnosis of type 2 diabetes, were taking diabetes medication, had an HbA1c ≥6.5% (48 mmol/mol) and/or a fasting plasma glucose ≥7 mmol/l. ***p<.001, **p<.01, *p<.05. Hemoglobin A1c, HbA1c; homeostasis model assessment of insulin resistance, HOMA-IR; t1-4, 1st to 4th segment assessment.
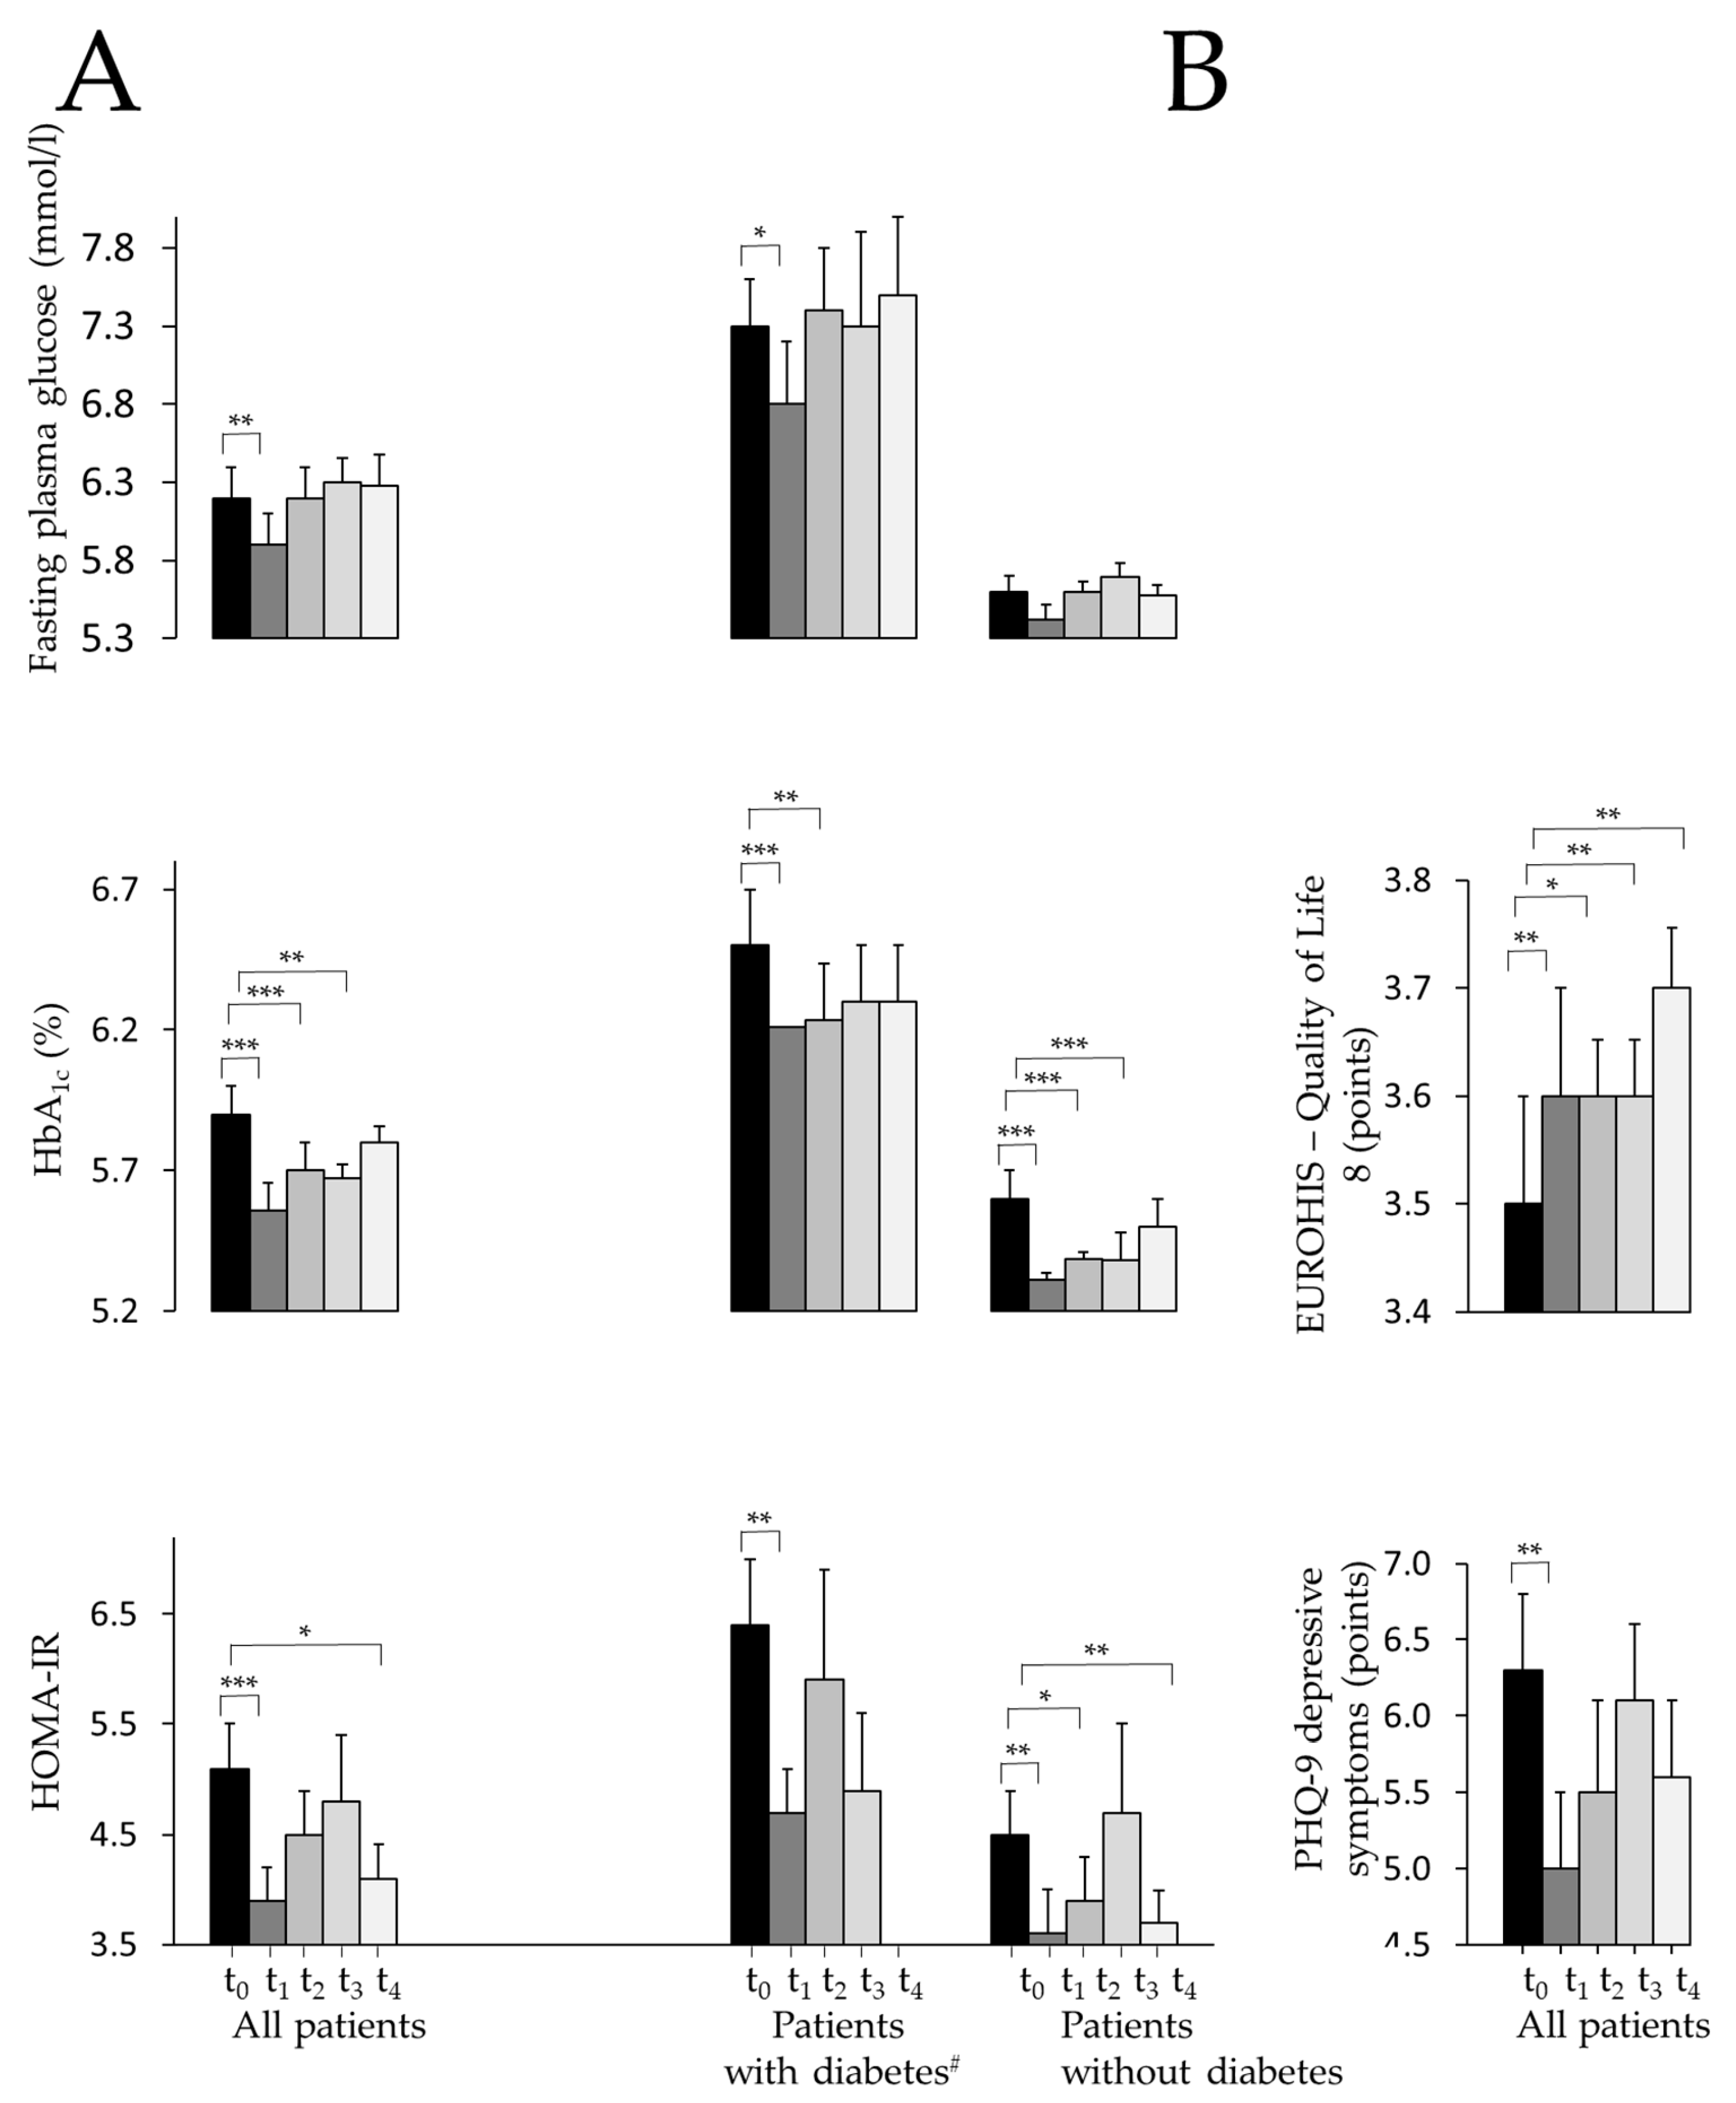
Figure 4.
Mean body mass index (in kg/m²) ±95% confidence interval (grey lines) of all patients taking part in the behavioral weight loss program. All data assessed in the program, including additional weight measurements between segment assessments, were included. Markers for segment assessments t1-4 are mean time points for all participants who completed the respective examination. On the x-axis, mean durations of segments 1-4 are displayed.
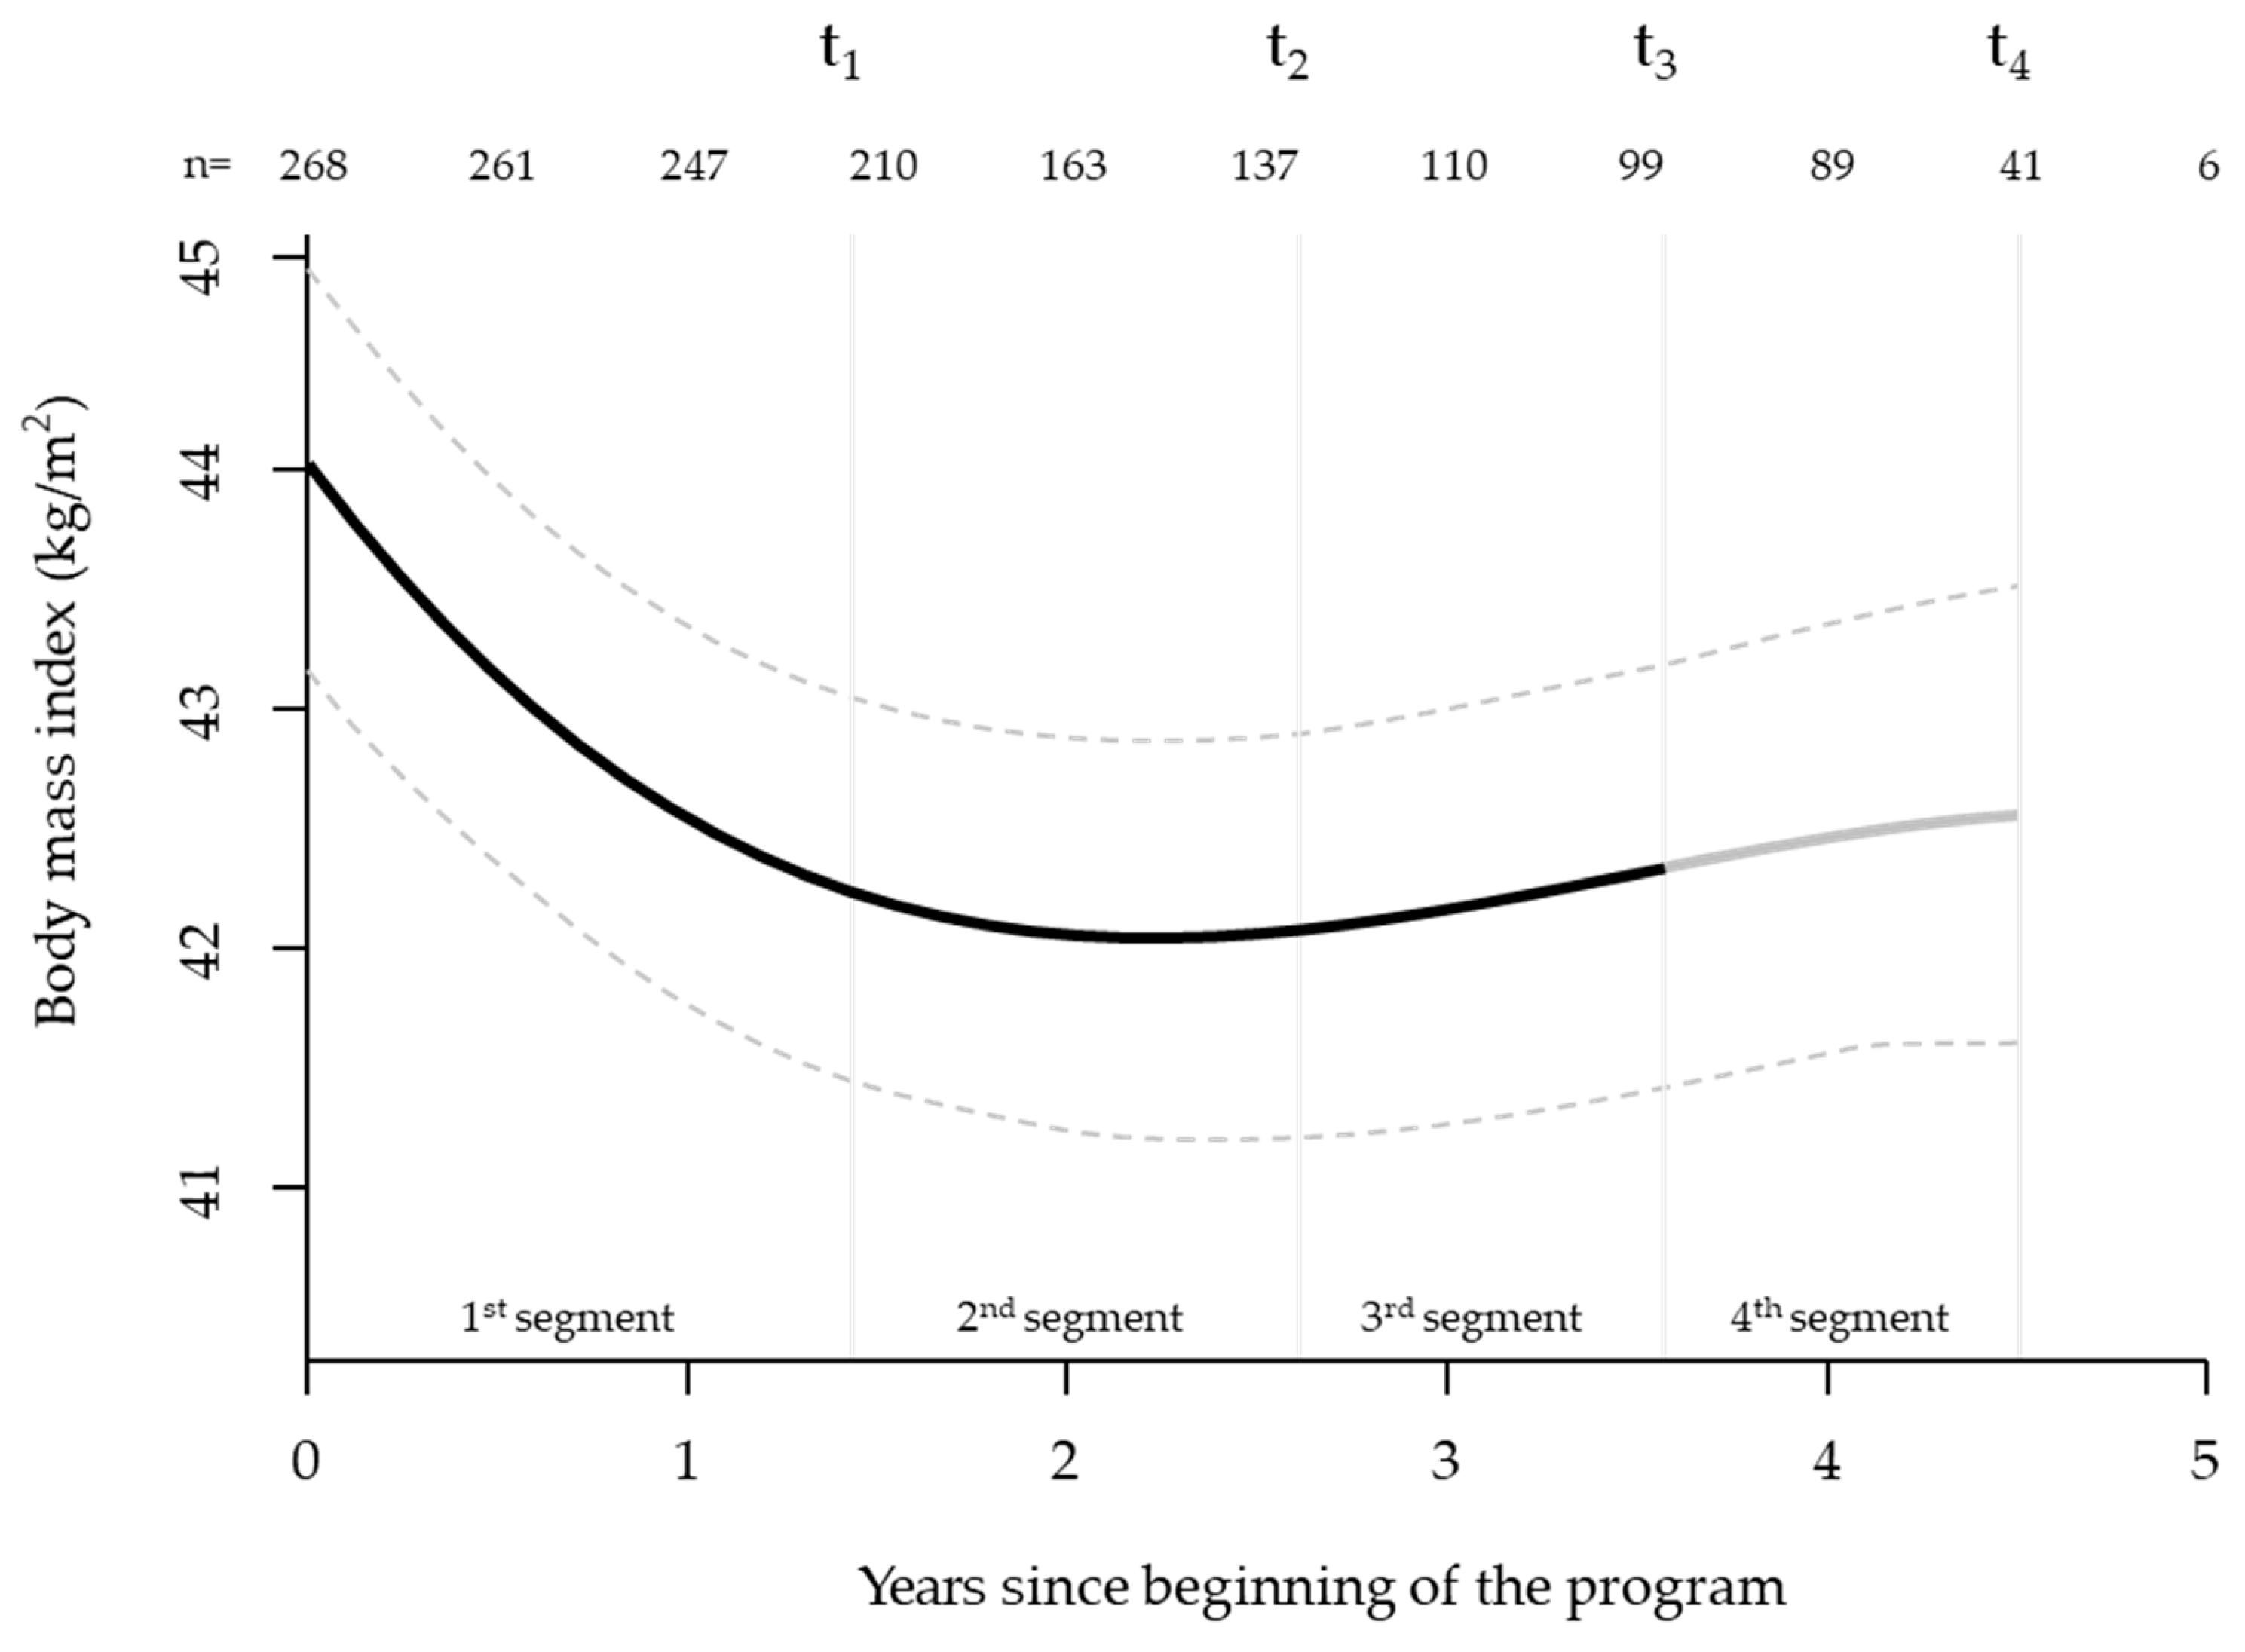
Figure 5.
Health care costs per patient paid by healthcare insurance company for outpatient care, drugs and hospital care three years before the program started and during participation in the program (excluding costs of the Leipzig Obesity Management program). The t-test with independent, unpaired samples did not show statistically significant differences between costs before and during the program. §Mean costs of, left: three years before start of the program, right: four years of participation in the program.
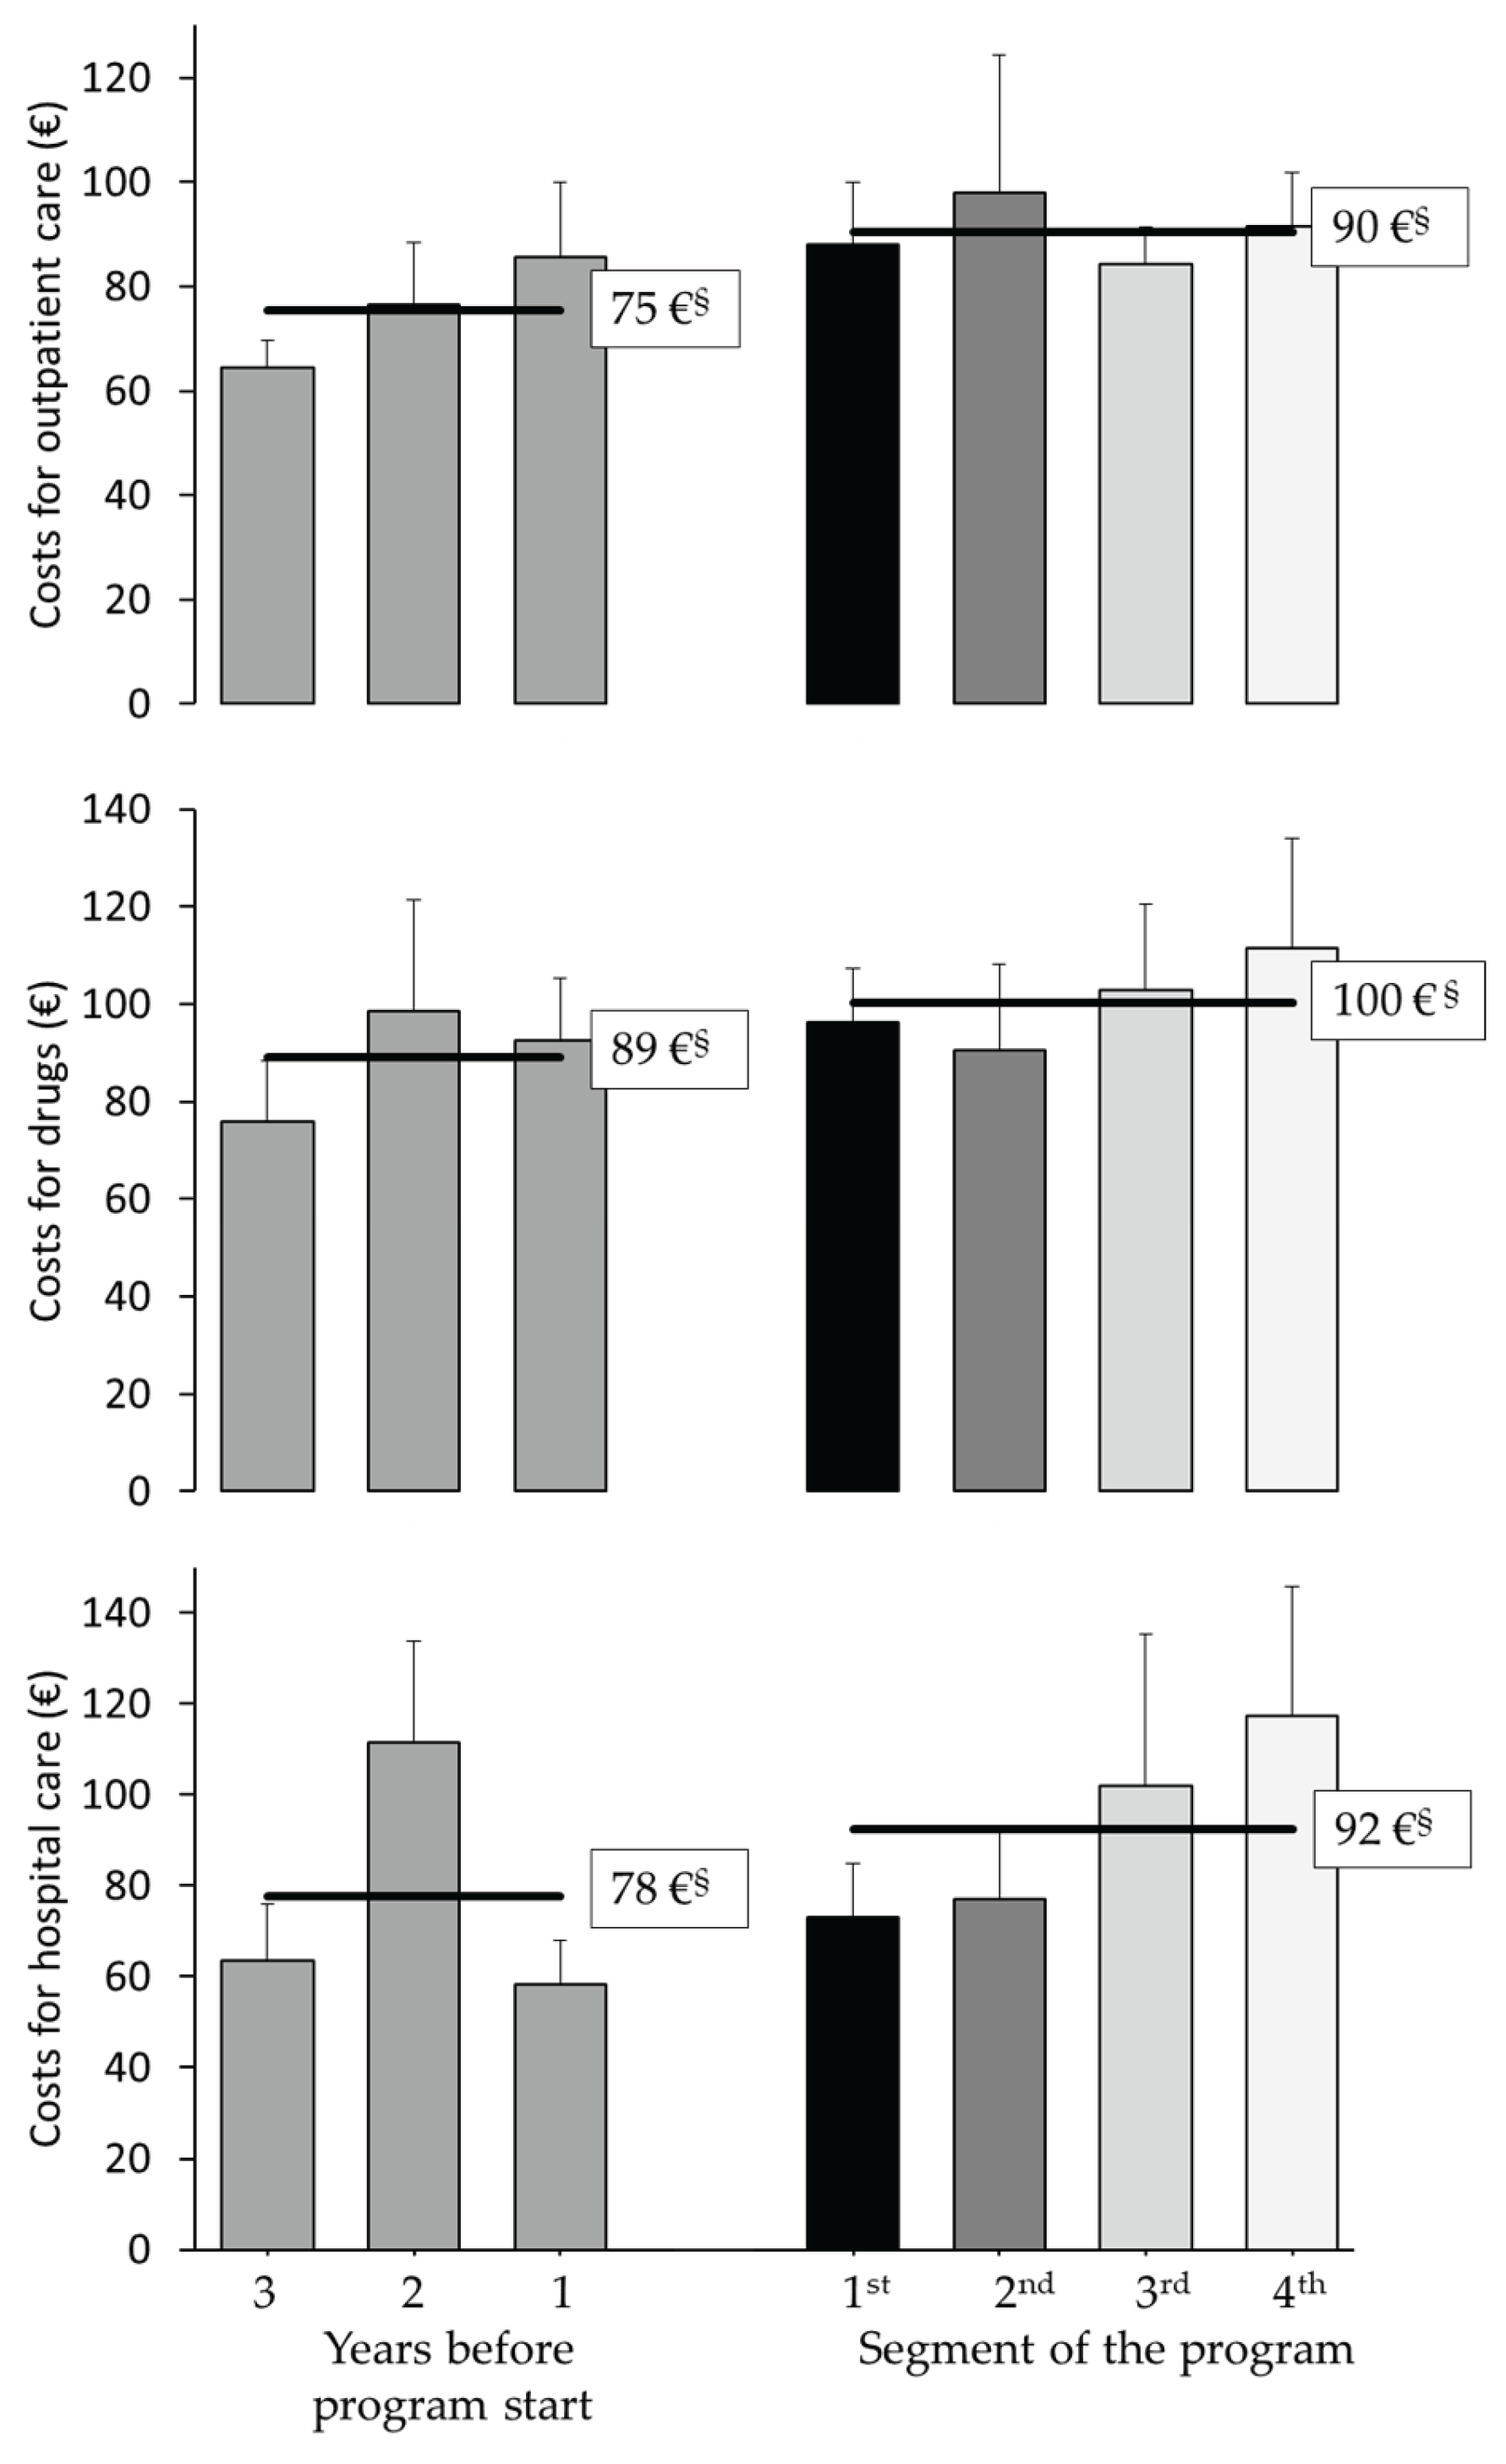
Table 1.
The development of anthropometric, metabolic and psychological parameters during therapy progress, including statistical significances of treatment effects (n=381).
Table 1.
The development of anthropometric, metabolic and psychological parameters during therapy progress, including statistical significances of treatment effects (n=381).
| t0 | t1 | t2 | t3 | t4 | p | |
| Patients n Women n (%) |
381 272 (71.4%) |
243 173 (71.2%) |
126 89 (70.6%) |
94 67 (71.3%) |
77 55 (71.4%) |
|
| Body weight (kg) Women Men |
127.3 ±1.3 120.4 ±1.3 144.3 ±2.6 |
122.2 ±1.3*** 115.3 ±1.3*** 139.4 ±2.7*** |
123.2 ±1.4*** 116.8 ±1.4*** 138.2 ±2.9** |
124.2 ±1.4** 117.6 ±1.5* 140.3 ±2.7** |
124.2 ±1.5** 117.6 ±1.5 140.4 ±2.9 |
<.001 <.001 <.01 |
| Body mass index (kg/m2) Women Men |
44.3 ±0.4 44.2 ±0.5 44.7 ±0.7 |
42.6 ±0.4*** 42.3 ±0.4*** 43.2 ±0.7*** |
42.9 ±0.4*** 42.9 ±0.5*** 42.9 ±0.8** |
43.3 ±0.4** 43.2 ±0.5* 43.5 ±0.8** |
43.4 ±0.5** 43.2 ±0.5 43.5 ±0.8 |
<.001 <.001 <.01 |
| Waist ratio (cm) Women Men |
129.7 ±1.0 125.1 ±1.1 140.9 ±1.7 |
125.4 ±1.0*** 120.4 ±1.1*** 137.6 ±1.6** |
124.9 ±1.0*** 120.0 ±1.0*** 136.8 ±1.6*** |
125.0 ±1.0*** 119.6 ±1.1*** 138.3 ±1.8 |
126.4 ±1.2** 120.1 ±1.2*** 141.9 ±2.4 |
<.001 <.001 <.001 |
| Hip ratio (cm) Women Men |
138.6 ±0.9 139.4 ±1.1 136.9 ±1.8 |
134.4 ±0.9*** 135.0 ±1.1*** 132.8 ±1.7*** |
133.1 ±0.9*** 133.6 ±1.1*** 131.7 ±1.7*** |
133.6 ±1.0*** 133.8 ±1.1*** 133.4 ±2.0 |
134.7 ±1.2** 134.7 ±1.3*** 138.1 ±3.0 |
<.001 <.001 <.001 |
| Fasting glucose (mmol/l) Patients with diabetes§ (t0: 28.0%) No diagnosed diabetes |
6.1 ±0.1 7.7 ±0.2 5.5 ±0.0 |
5.9 ±0.1** 7.4 ±0.2* 5.4 ±0.0 |
6.1 ±0.1 7.8 ±0.3 5.5 ±0.1 |
6.3 ±0.2 8.0 ±0.4 5.7 ±0.1 |
6.3 ±0.1 8.0 ±0.4 5.6 ±0.1 |
<.001 <.05 <.01 |
| HbA1c (%) Patients with diabetes§ No diagnosed diabetes |
5.8 ±0.0 6.6 ±0.1 5.5 ±0.0 |
5.6 ±0.0*** 6.2 ±0.1*** 5.3 ±0.0*** |
5.6 ±0.0*** 6.2 ±0.1** 5.4 ±0.0*** |
5.7 ±0.1** 6.4 ±0.1 5.4 ±0.0*** |
5.7 ±0.1 6.4 ±0.1 5.4 ±0.0 |
<.001 <.001 <.001 |
| C-peptide (nmol/l) Patients with diabetes§ No diagnosed diabetes |
1.4 ±0.0 1.6 ±0.1 1.3 ±0.0 |
1.3 ±0.0** 1.5 ±0.1 1.2 ±0.0** |
1.2 ±0.0*** 1.3 ±0.1* 1.1 ±0.0*** |
1.1 ±0.0*** 1.2 ±0.1*** 1.0 ±0.1*** |
1.1 ±0.1** 1.4 ±0.2 1.0 ±0.0*** |
<.001 <.01 <.001 |
| HOMA-IR Patients with diabetes† (t0: 22.1%) No diagnosed diabetes |
6.0 ±0.3 8.1 ±0.4 5.3 ±0.2 |
4.9 ±0.2*** 6.2 ±0.8* 4.5 ±0.2** |
5.1 ±0.3 6.7 ±1.1 4.5 ±0.3* |
5.2 ±0.3 6.8 ±0.9 4.6 ±0.4 |
5.0 ±0.3* - 4.3 ±0.3** |
<.01 <.05 <.01 |
| Total cholesterol‡ (mmol/l) | 5.1 ±0.1 | 5.0 ±0.1** | 4.9 ±0.1** | 4.9 ±0.1* | 4.9 ±0.1** | <.01 |
| LDL cholesterol‡ (mmol/l) | 3.3 ±0.1 | 3.2 ±0.1* | 3.3 ±0.1 | 3.2±0.1 | 3.2 ±0.1* | <.05 |
| HDL cholesterol‡ (mmol/l) | 1.2 ±0.0 | 1.3 ±0.0** | 1.3 ±0.0** | 1.3 ±0.0** | 1.3 ±0.0*** | <.001 |
| Triglycerides‡ (mmol/l) | 1.8 ±0.1 | 1.7 ±0.1 | 1.9 ±0.1 | 1.9 ±0.1 | 1.8 ±0.1 | <.01 |
| C-reactive protein (mg/l) | 8.4 ±0.3 | 7.6 ±0.5 | 7.0 ±0.6 | 8.7 ±1.7 | 6.5 ±0.5** | <.01 |
| ASAT (µkat/l) | 0.5 ±0.0 | 0.5 ±0.1*** | 0.5 ±0.0 | 0.4 ±0.0*** | 0.4 ±0.0*** | <.001 |
| ALAT (µkat/l) | 0.6 ±0.0 | 0.5 ±0.0*** | 0.5 ±0.0 | 0.5 ±0.0*** | 0.5 ±0.0*** | <.001 |
| GGT (µkat/l) | 0.7 ±0.0 | 0.6 ±0.0** | 0.6 ±0.0 | 0.6 ±0.0 | 0.6 ±0.0* | <.01 |
| Quality of life (EUROHIS-QOL) | 3.2 ±0.0 | 3.4 ±0.0*** | 3.5 ±0.1*** | 3.6 ±0.1*** | 3.6 ±0.1*** | <.001 |
| Depression (PHQ-9) | 7.9 ±0.3 | 6.2 ±0.3*** | 5.9 ±0.4*** | 6.3 ±0.3*** | 6.3 ±0.4*** | <.001 |
Disclaimer/Publisher’s Note: The statements, opinions and data contained in all publications are solely those of the individual author(s) and contributor(s) and not of MDPI and/or the editor(s). MDPI and/or the editor(s) disclaim responsibility for any injury to people or property resulting from any ideas, methods, instructions or products referred to in the content. |
© 2025 by the authors. Licensee MDPI, Basel, Switzerland. This article is an open access article distributed under the terms and conditions of the Creative Commons Attribution (CC BY) license (http://creativecommons.org/licenses/by/4.0/).
Copyright: This open access article is published under a Creative Commons CC BY 4.0 license, which permit the free download, distribution, and reuse, provided that the author and preprint are cited in any reuse.


