
Submitted:
10 June 2025
Posted:
12 June 2025
You are already at the latest version
Abstract
The assessments of a city's level of smartness in global indices are a relatively new area of investigation. It is useful in encouraging a rethinking of urban digital strategies, although different approaches to global smart city rankings are subject to criticism. The paper highlights the methodological features of constructing the Smart City Index (SCI) from IMD (International Institute for Management Development), based on residents’ assessments, their satisfaction with electronic services, and perception of the priority of urban infrastructure areas. The case of the Central European cities of the Visegrad region (Prague/Czech Republic, Budapest/Hungary, Bratislava/Slovakia, Warsaw and Krakow/Poland) was chosen as the basis for the in-depth analysis. The architectonics, the internal system of constructing and calculating city rankings by SCI, is analysed. A comparative analysis of technology indicators (e-services) in five cities of the Visegrad region, presented in the SCI, showed the smart features of each city. The progressive and regressive trends in the dynamics of smartness of Visegrad region cities were identified in five urban spheres indicated in the Index: Government, Activity, Health and Safety, Mobility, and Opportunities. This also made it possible to identify certain methodological gap in the SCI in establishing interdependencies between data on residents’ perception of the priority of areas of life in a particular city and the level of satisfaction of residents with electronic services. In particular, the structural indicators "affordable housing" and "green spaces" are not supported by e-services. The research aims to bridge this methodological gap by proposing a model for evaluating e-service according to the degree of coverage of life spheres in the city. The application of project, cross-sectoral, and systemic approaches made it possible to develop basic models for assessing the value of e-services. These models can be implemented by municipalities to assess and monitor e-services, as well as to select IT projects and elaborate strategies for smart sustainable city development.
Keywords:
smart city
; smart infrastructure
; е-governance
; e-participation
; technological services
; IТ project
; Smart City Index
; digitalization
; digital urban transformations
; urban development
; Visegrad region cities
1. Introduction
Information and communication technologies (ICT) are an important factor in the socio-economic well-being of countries, regions, and cities. Global trends include the rapid digitalization of services, the integration of generative and predictive AI, a growing focus on digital identity and data management, the shift towards remote work, and the increasing reliance on data and emerging technologies for policymaking. ICTs are widely used for planning, servicing, and managing cities, enabling faster and more efficient information delivery to communities and individuals; increasing participation and accountability in government and municipal policy. They are clearly based on the integration of digital technologies into urban infrastructure: information (communications) and city portals for electronic information services [1].
The cities around the world are developing different types of models, depending on the context of the vision of urban development and the ways in which digital technologies support the city; such models can be called Digital City, Intelligent City, or Smart City. A Digital City is clearly based on the integration of digital technology into the city infrastructure: information (communication), city portals for online information services. Intelligent Cities have intelligent systems (functionality), online web-based e-learning systems integrated and interoperable with other city platforms. Smart Cities, besides technology integration, also include innovation (advanced visualization and simulation tools), an e-learning platform, knowledge management, and benchmarking requirements. The major difference between Intelligent Cities and Smart Cities is the special focus of the latter on social and human concerns (quality of life) and ecological systems (sustainability) [2].
A smart city is defined as an urban environment that uses technology to increase the benefits and reduce the disadvantages of urbanization for residents. The theory and practice have changed the perception of the e-city from a technology-oriented approach to a more holistic one that takes into account the so-called soft components, such as social participation. The development of a smart city should occur through mechanisms of shared governance, such as the creation of a citizen-oriented, accessible, accountable, transparent, and inclusive city with a sense of safety and security [3]. ICT integration can expand and improve the delivery of urban services, streamline and optimize internal processes, and allow residents to interact with institutions and public issues in a variety of ways at both the national [4] and local levels [5,6]. This approach ensures that all voices are heard and that the impact of digital advancements on all groups is thoroughly considered, monitored, and evaluated.
In a context of increasing uncertainty (geopolitical, environmental, social, and economic), cities can perform better than nation states and be more human-centric and sustainable. This digital transformation extends into sectors like education, employment, social protection, healthcare, justice, and the environment, prioritizing digital skills and contributing to a workforce equipped for a digital-first economy. Smart cities are also seen as the best entry point for achieving the national sustainable development goals of countries [7]. According to OECD (Organization for Economic Co-operation and Development), national achievements in sustainable development of countries largely depend on the results of sustainable development at the local level: 65% of the Sustainable Development Goals will not be achieved without proper involvement and coordination with local and regional authorities [8].
The ratings and rankings are used to assess the states of urban smartness, and their indicators are often the basis for further development and decision-making on the implementation of necessary projects, programmes, and strategies. Worldwide, investors, city leaders, and ordinary citizens are paying increasing attention to the results of smart city indices. There are many indices for assessing smart cities, most of which have their own specific assessment criteria and ranking methodologies. Some organisations, including universities and private consulting companies, are assessing and ranking cities to generate global indices (IMD-SUTD Smart City Index, AT Kearney Global Cities Index, IESE Cities in Motion Ranking (CIMI), Cities of the Future Index (CFI), Mori-Foundation Global Power City Index (GPCI), Digital City Index (DCI), Global E-Government Survey (GEGS), Smart Eco-City Index (SECI), etc. The researchers are increasingly interested in comparing them [9,10,11,12,13].
Smart city assessment is a new field with great scientific and practical potential. Currently, there are no unified and generally accepted methods for comprehensively assessing smart cities. This is a problem because no rating is universally accepted and recognized. The authors discuss the choice of using primary or secondary data to compile smart city indices and their possible impact on the objectivity of the results. The smart city frameworks presented in the indices are also analyzed, and attempts are made to assess the validity of the criteria used. There is a noticeable lack of balance between indicators across different dimensions within the usual smart city framework [13]. The debate is also raised as to whether it is necessary to seek a balanced distribution of assessment indicators across the different domains of a smart city. The optimal approach to assessing the smartness of cities remains a challenging academic objective. The methodology of smart city indices is controversially assessed by researchers. In particular, Smart City Index [14], some authors consider “the most objective” [10], others – “not clear enough” [11]. This suggests that the assessment of smart cities still needs to be deeply understood.
This research aims to develop the methodology of the Smart City Index in terms of assessing the value of e-services in the case of Visegrad region cities.
In order to achieve this, the following tasks need to be accomplished:
- to analyse the methodology for assessing the Smart City Index;
- to carry out a comparative analysis of technological services of Visegrad region cities according to city profiles from the Smart City Index;
- to propose a methodological framework for assessing the value of e-services (IT projects), based on the importance of priority areas of city life and the satisfaction level of service providers among its residents.
To sum up, this research addresses the concept of smart cities and the trend of using global indices to evaluate smartness in cities. While smart city rankings have been criticized for insufficient transparency in their calculation, they offer opportunities to rethink digital urban transformations. The paper highlights the importance of understanding the architectonics of technological service indicators in smart indices to drive the development of smart city infrastructure and addresses the knowledge gap by comparing the values of the Smart City Index for Visegrad region cities.
The paper’s originality and novelty lie in its focus on deep analysis of technological services as the ranking factor for Visegrad region cities, which made it possible to develop a methodological framework for accounting for the city rankings in policymakers’ decision-making towards future smart infrastructure projects.
2. Materials and Methods
The ratings for smart city development are becoming important tools for assessing attractiveness, in particular, in terms of quality of life. The cities are compared and ranked according to various characteristics of smart infrastructure [13]. This is to some extent due to the complexity and multi-component nature of the smartness of the urban environment.
Meanwhile, one of the key problems of all city rankings is that public attention is mainly focused on the final ranking without taking into account the underlying methodological aspects of the rankings. Due to the lack of in-depth analysis of the ranking indicators, their strengths and weaknesses, cities miss the opportunity to use the results constructively. The actual strengths and weaknesses of cities can only be identified through a broad discussion of all the indicators that make up a city’s overall rank, and based on this, priority urban areas for further digital transformation can be determined. It is assumed that smart index scores are an important prerequisite for city data presented in the ratings to be used by cities for decision-making on the necessary programs and projects.
The city rankings differ in their methods, and there is a wide range of ways in which rankings can be compiled. Those rankings that focus on a more detailed and well-defined issue are considered to provide more applicable results than those that provide just a general list. This investigation is focused on highlighting the Smart City Index scorecard from the International Institute for Management Development (IMD) and the Singapore University of Technology and Design (SUTD). The fact is that this index is quite well-known among the public, although the detailed evaluation procedure is not published. The SCI methodology briefly states that all indicators are grouped into two ranking factors (or “pillars”): Structure and Technology. The two pillars are a reflection of a clear understanding that it is through the deployment of digital technologies that information can also be obtained on the effectiveness of the existing urban infrastructure. The cities are classified into four groups based on their performance on the Global Data Lab’s Human Development Index (HDI), then within each group, cities are assigned a rating scale (from AAA to D) based on the city’s perception score compared to the scores of all other cities in the same group [14]. The overall SCI presents the city rankings as a list, as well as the сity rating in the form of letters. Table 1 shows the rating and ranking indicators of the SCI for the top cities and cities in the Visegrad region.
A feature of the SCI methodological approach is that the data for the city profiles are obtained by interviewing residents in each city. This distinguishes it from other smart city rankings (CIMI, CFI, and GPCI) that do not rely on subjective data representing a perceptual level of evaluation of technical services. The subjectivity, in understanding smart city assessments by residents, has its own value in understanding trends in sustainable smart city development. After all, SCI represents the smart city in terms of how the technological environment increases the advantages and reduces the disadvantages of urbanisation for local residents. However, the methodology does not describe in detail the way of data collection and processing, the representativeness of the sample of respondents - 100 residents in each city, regardless of the total population (whether it is, for example, Prague with 1,330,000 people or Bratislava with 420,000).
The SCI, in addition to the overall ranking, consists of city profiles that show indicators for both structure and technology services. Through in-depth analysis of the structure of these indicators, it is possible to find out which components of smart city infrastructure are emphasised and which urban areas they ‘cover’. The scores of 20 urban technology services are grouped by urban life spheres: Health/safety (6), Mobility (5), Activity (1), Opportunities (4), Governance (5). Since a different number of services is defined for each sphere, the question of ensuring the completeness of representation of smart city indicators remains debatable. As well as the question of whether it is necessary to strive for a balanced distribution of assessment indicators in different areas to ensure objectivity.
According to the structural logic of the Index, the Structural indicators are grouped into the same groups of urban areas as the Technological ones. This is in line with the generally accepted smart city philosophy, which focuses on the development of an efficient infrastructure in which digital technologies are integrated with physical infrastructure for real-time monitoring, effective decision-making, and improved service delivery. A smart infrastructure should enable more comfortable, safer, and environmentally friendly living. This means that in order to achieve smart-city goals, it is necessary to develop Technologies without ‘disconnecting’ from the Structural factors of the urban infrastructure. That is why both Structure and Technology should be evaluated in the parameters of significant spheres of urban life, of which there are six in the Index.
Notably, there are still ongoing discussions about the completeness of the representation of smart infrastructure elements. The SCI has a different number of indicators for each of the urban spheres. Hence, a relevant question is whether the index developers should seek for a balanced distribution of assessment indicators in the different spheres to ensure impartiality. While the research for the correct approach is ongoing, it is important to adhere to the critical principle of comprehensiveness when formulating smart city structures. In addition, there is a question as to why a particular technological service is chosen to cover the physical infrastructure of the city. For example, there are questions about the technological indicators of medical infrastructure. Why was online arranging of medical appointments chosen for the SCI, while many cities are already actively implementing digital patient records with many online services? It is noteworthy that the structural indicator “green space” is not covered by any of the 20 technical services from the SCI.
In addition to the groups of services according to two ranking factors, Structure and Technology, the SCI cities profile presents data on the results of a survey of residents on the priority areas of cities. From a list of 15 indicators, respondents are asked to select 5 indicators that they consider most relevant for their city. In this way of data processing, the SCI city profiles include a general scale with 15 indicators of the spheres of urban life, where the percentage of respondents who included a certain sphere as one of their five priorities is indicated. A detailed analysis of these indicators for each city allows us to identify the peculiarities of their perception of the priority of areas of urban life (understanding of the quality of life in the city), as well as to compare with other cities or with global trends. In the city profiles, the results of this survey are presented autonomously, their numerical indicators are not included to calculate the smart ranking of cities. In addition, there is a partial lack of correlation between the surveys on 15 priority areas of cities and technological services, such as housing affordability, which is recognised as a global priority area, while among 20 technological services, there is not a single one that correlates with “affordable housing”.
This research proposes a methodological solution for the development of SCI methodology in terms of assessing the value of technological services of cities under uncertainty. Each city has its own strengths and weaknesses in smart infrastructure, so identifying the necessary priorities for further digital development is very important. The value has to be created as a result of each project action, based on the project management methodology. Therefore, an e-service (as an IT project) should also contain a value component. It is proposed to apply the principle of significance, weighting factors or indicators according to their impact or importance for the development of the smartness of cities, to assess the value of the e-project. This methodological tool allows evaluating e-projects according to the extent to which they are able to address the significant problems mentioned by residents in the survey. In other words, if an IT project that has an insignificant impact on the city’s infrastructure assessment is planned to be accepted for implementation, it will receive lower scores from the experts and, accordingly, will have a lower value. Consequently, cities with deficiencies in a certain aspect may receive projects that are maximally aligned with the residents’ priorities.
To verify the hypothesis, the means and tools of mathematical modelling are used; methods of multi-criteria evaluation and optimization under conditions of different degrees of certainty of initial information The application of the value focus in the context of project management methodology will make it possible to create a model for assessing the value of e-services in the parameters of the Smart City Index.
The spatial scope of this research is cities of the Visegrad region, an alliance of four European Union countries – the Czech Republic (CZ), Hungary (HU), Poland (PL), and Slovakia (SK). These countries share a common experience in creating smart and digital innovations within a common Smart Visegrad platform [9,15,16]). Smart Visegrad aims to strengthen the countries in the digital sphere, to help them become among the EU leaders in sustainable smart development. The data from 5 cities were analysed: Warsaw and Krakow/(PL), Bratislava/(SK), Prague/(CZ), and Budapest/(HU). Each city has a smart development strategy, where the use of information technology for effective city management and improving the quality of life of residents is noted [17,18,19,20].
Remarkably, there are no significant differences in smart aspirations among the cities of the Visegrad region, although each city has its own specific path to digital development and different positions in international rankings [9,15,16]. The Visegrad region cities are included in different groups and have different Smart City Ratings (Table 1): 1st – Prague (AA) and Bratislava (BB); 2nd – Warsaw (BBB) and Budapest (CCC), and 3rd – Krakow (B). The rankings of Polish [21,22], Slovak [23], Czech [24], and Hungarian [25] cities are becoming a subject for research, but the evaluations of the technological services underlying the SCI have not yet been analysed.
3. Results
3.1. Representation of the Visegrad Region cities in the Smart City Index
According to the 2023-2025 Smart Index, all cities in the Visegrad region have demonstrated progress in digital development, improving their rankings: Krakow - from 87th to 84th place, Budapest - from 79th to 70th place, Bratislava - from 62nd to 57th place, Warsaw – from 44th to 28th place, and Prague retains its place in the top twenty cities, rising from 14th to 12th place (Table 1). For an in-depth analysis, we propose to take a closer look at the smart profiles of Visegrad cities in terms of residents’ assessments of technological services. As mentioned above, the Technology pillar of the CCI consists of twenty technology services grouped thematically into five dimensions of city life (Health & Safety, Mobility, Activities, Opportunities (Work & School), and Governance).
The Health & Safety area is assessed by six types of technological services. All Visegrad cities, except Warsaw, have low scores (less than 50 points) for online services for reporting problems with city services. The highest scores were given to the technical capabilities of video cameras installed in public spaces to improve the sense of security (Table 2).
The technology analysis covers data from two reports, 2025 and 2024, which makes it possible to highlight trends of progress or regression for each city and the Visegrad region. For example, Prague’s scores have dropped significantly over this period: online reporting on city problems - from 51.5 to 44.0, technical services that allow you to easily return things - from 60.6 to 43.6, public Wi-Fi - from 58. 9 to 49.8, technical services for monitoring air pollution - from 47.1 to 38.2, online registration for medical services - from 62.3 to 58.8, and only one indicator improved - cameras increase the sense of security (from 63.4 to 66.6). In Warsaw, on the other hand, all but one of the indicators increased. Warsaw and Krakow are the leaders among the cities in the Visegrad region in terms of the Health & Safety indicators (Table 2).
The Mobility sphere is assessed by five types of technological services. The comparative analysis of the 2024-2025 city profile data shows the overall progress of all cities in the assessment of all technical services. All Visegrad cities have the highest scores for “Online scheduling and ticket sales has made public transport easier to use (from 67.1, Bratislava to 72.4, Prague and Budapest).
However, several technical services are rated low. For example, the mobile app for car sharing was rated less than 50 points by residents of all cities except Prague. Mobile phone services for reporting traffic jams in three cities (Prague, Bratislava, and Krakow) were rated between 48.8 and 49.5. The service Bicycle hiring has reduced congestion scored less than 50 points in Prague, as well as Apps that direct you to an available parking space have reduced travel time in Bratislava and Budapest. All cities have the highest scores for public transportation (from 67.1 in Bratislava to 72.4 in Prague and Budapest). In general, Warsaw retains its leadership among the Warsaw region countries, while Bratislava has the lowest scores (Table 3).
The Activities area is assessed by one type of technological service – online purchasing of tickets to shows and museums has made it easier to attend – which residents are satisfied with, ranging from 73.3 (Bratislava) to 81.0 (Warsaw) (Table 4).
The Opportunities (Work & School) sphere is assessed by four types of technological opportunities and services available to residents (Table 5). All cities in the Visegrad region demonstrate a positive development trend, with Warsaw being the obvious leader in all indicators, followed by Krakow in second place, and Bratislava in fifth.
The cities received high scores for IT infrastructure (high-speed internet) - from 67.8 (Bratislava) to 80.0 (Warsaw), as well as online job search services from 67.0 (Bratislava) to 76.5 (Warsaw). Online services for starting a new business received significantly lower scores - from 48.2 (Bratislava) to 64.5 (Warsaw). Another noteworthy trend is that the scores for the level of skills are lower than the scores for technical services. The scores range from 55.0 (Prague) to 66.0 (Warsaw).
The Governance area is assessed by four types of technological capabilities and services available to residents. Two Polish cities, Warsaw and Krakow, retain their leadership (Table 6). Residents are most satisfied with the technical capabilities in Processing identification documents online has reduced waiting times, from 57.7 (Bratislava) to 68.6 (Krakow). The most critical indicator for all cities is the capabilities in online public access to city finances has reduced corruption, which falls below 50 points, from 35.5 (Budapest) to 45.7 (Krakow). This is especially critical for Budapest and Prague, whose residents have identified Corruption/Transparency as one of the 5 key areas of quality of life (Budapest - 4th priority, 42.0%; Prague – 5th priority, 39.8%).
As for participatory e-decision-making, it remains low: “An online platform where residents can offer ideas has improved city life.” Bratislava and Budapest, although they have made some progress, have scores below 50, while the capitals of Poland and the Czech Republic have 55.1 and 56.5, respectively. However, it is worth noting that Prague has made a small progress, while Warsaw has made a significant regression, from 63.7 to 55.1 online voting increases participation, but the cities have low scores, from 49.4 (Bratislava) to 53.5 (Krakow). And in terms of online voting, Bratislava, although it has made progress, has not yet crossed the 50 mark. There is an obvious decline in participatory indicators (as in online voting: Warsaw regressed again, from 61.4 to 52.1). Budapest also demonstrates a smaller, but regression, from 53.6 to 52.0 (Table 6).
Thus, the analysis of the data on the technical capabilities of Visegrad cities showed, first, a certain discrepancy between the data in the city profiles and the generalized indicators for the Technology factor in the Smart City Ranking. While in the generalized Smart City Ranking, Prague is the leader among the cities studied, and Warsaw’s position in the ranking is much lower, according to the city profiles, Warsaw is the leader in all five areas. In addition, while Bratislava ranks 3rd among the cities studied in the generalized Technology ranking, and Krakow ranks 4th, according to the city profiles and the assessments of technological services, Krakow has significantly higher scores for technical services than Bratislava (at the level of ½ place among the cities of the Visegrad region). According to the overall rating, Budapest is an outsider, but the profile indicators do not confirm this. Bratislava is the outsider in Activities, Management, Opportunities (“Work & School”).
There are also examples where residents of developed smart cities rate services at the same level (or lower) than residents of Visegrad cities. For example, residents of Zurich (Ranking 1) rated the e-service “Arranging medical appointments online has improved access” lower than residents of Krakow (Ranking 70) - 63.9 and 67.9 respectively. This may indicate not so much a difference in the quality of the e-service as a higher level of requirements of the residents of the leading cities.
The analysis confirmed that most of the indicators of all the cities analyzed are above average, while each city has its own strengths and weaknesses. Accordingly, the further smart development of these cities can be more effective if the ranking positions in terms of technical services are taken into account when making decisions on the priority of electronic development, growth points for progress in technical services, and improving their assessment by residents. It is important to take into account the electronic data of city profiles in the expert evaluation of city programs and projects in order to improve the quality (usefulness) of technological services.
In our opinion, this smart index data (city profiles) can be of great value if we apply it to assess the value of e-services, but in terms of prioritizing areas of life in the city. It also enables decision makers to produce, evaluate and select solutions that create positive synergies for sustainable smart city development. Cities should develop their own performance dashboards with relevant indicators, and assessing the value of e-services can serve as an initial basis for identifying key dimensions and critical indicators.
3.2. Modeling the Value Assessment of e-Services in the SCI Framework
The value assessment of e-services for the SCI framework remains a challenging task. Smart cities require higher integration of e-services with the urban infrastructure and priority areas of city life. In this research, a scientific attempt is made to emphasize specific correlations between e-services (Technologies) used in the SCI rating at the level of city profiles and Priority areas of city life. The correlations identified between five groups of e-services and fifteen areas of city life (Table 7):
- “Health & Safety” – with such areas of city life: Air pollution (2), Basic amenities (water, waste) (3), Green spaces (7), Health services (8), Recycling (10), and Security (13);
- “Mobility” – with: Public transport (9), and Social mobility/inclusiveness (14);
- “Activities” – with: Social mobility/inclusiveness (14);
- “Opportunities (Work & School)” – with: Fulfilling employment (6), School education (12), and Unemployment (15);
- “Governance” – with: Citizen engagement (4) and Corruption/transparency (5).
The identification of correlations between certain technologies (e-services, IT products) and areas of city life showed, firstly, that the number of correlations ranges from zero (“Affordable housing” and “Green spaces”) to eleven (“Free public wi-fi has improved access to city services”). Secondly, the list of technologies has “bottlenecks” in terms of representativeness of the needs of city residents for digital city services. In particular, the SCI does not include an e-service or web application for residents regarding “Affordable housing”, even though it is recognized as the highest priority area. Considering that the SCI includes a score for “A website or App allows residents to effectively monitor air pollution,” it would be logical to include a similar technology (a website or App) that makes it easier for residents to find housing.
The area of city life, “Health services,” is represented only by the possibility of online registration for an appointment with a doctor. In our opinion, additional e-services, such as an online consultation with a doctor, an online medical card for a patient, could effectively cover these areas electronically.
We also consider that “Activities” technologies should be presented more widely, and not be limited to the “Online travel to exhibitions and museums that will be created for study” service. After all, there are many services, such as online excursions, immersive exhibitions, online broadcasts of performances, concerts, etc.
The measure of the effectiveness of digital technologies in different areas of city life can be defined by an integral assessment of the value of e-services. It involves following a 3-stage logical sequence of actions:
Stage 1. Analysis of data on the city’s e-services. Data selection (aggregation) on 20 e-services and 15 areas of city life.
In the SCI reports, these data on e-services in points are presented as points, and for calculating the value of e-services, it is proposed to use them as input weight coefficients.
An example of the values of input weighting coefficients for 20 smart city e-services λ1, λ2, …, λn and their calculated normalized analogues for five smart cities of the VR are presented in Table 8. An example of the values of input weighting coefficients for 15 smart city areas, β1, β2, …, βm, and their calculated normalized analogues for five smart cities of the VR are presented in Table 9.

Table 8.
An example of weighting coefficient values for the VR cities’ e-services.
| Technologies (e-services) | Weighting coefficients for smart citylife areas | ||||||||||
| Prague | Warsaw | Bratislava | Krakow | Budapest | Generalized normalized weight coefficient | ||||||
| Inputweighting coefficient | Normalised weighting coefficient | Inputweighting coefficient | Normalised weighting coefficient | Inputweighting coefficient | Normalised weighting coefficient | Inputweighting coefficient | Normalised weighting coefficient | Inputweighting coefficient | Normalised weighting coefficient | ||
| Health & Safety | |||||||||||
| е-S1 | 0.515 | 0.046 | 0.492 | 0.041 | 0.456 | 0.043 | 0.502 | 0.043 | 0.382 | 0.036 | 0.042 |
| е-S2 | 0.606 | 0.054 | 0.614 | 0.051 | 0.542 | 0.051 | 0.565 | 0.049 | 0.527 | 0.049 | 0.051 |
| е-S3 | 0.588 | 0.053 | 0.579 | 0.048 | 0.577 | 0.055 | 0.536 | 0.046 | 0.521 | 0.048 | 0.050 |
| е-S4 | 0.634 | 0.057 | 0.514 | 0.043 | 0.543 | 0.051 | 0.577 | 0.050 | 0.538 | 0.050 | 0.050 |
| е-S5 | 0.471 | 0.042 | 0.617 | 0.051 | 0.436 | 0.041 | 0.690 | 0.059 | 0.434 | 0.040 | 0.047 |
| е-S6 | 0.623 | 0.056 | 0.668 | 0.056 | 0.613 | 0.058 | 0.631 | 0.054 | 0.479 | 0.045 | 0.054 |
| Mobility | |||||||||||
| е-S7 | 0.381 | 0.034 | 0.470 | 0.039 | 0.399 | 0.038 | 0.409 | 0.035 | 0.396 | 0.037 | 0.037 |
| е-S8 | 0.508 | 0.045 | 0.505 | 0.042 | 0.441 | 0.042 | 0.486 | 0.042 | 0.454 | 0.042 | 0.043 |
| е-S9 | 0.446 | 0.040 | 0.576 | 0.048 | 0.511 | 0.048 | 0.518 | 0.045 | 0.495 | 0.046 | 0.045 |
| е-S10 | 0.696 | 0.062 | 0.711 | 0.059 | 0.677 | 0.064 | 0.712 | 0.061 | 0.713 | 0.066 | 0.063 |
| е-S11 | 0.490 | 0.044 | 0.499 | 0.041 | 0.452 | 0.043 | 0.450 | 0.039 | 0.578 | 0.054 | 0.044 |
| Activities | |||||||||||
| е-S12 | 0.764 | 0.068 | 0.786 | 0.065 | 0.746 | 0.071 | 0.791 | 0.068 | 0.791 | 0.074 | 0.069 |
| Work & School | |||||||||||
| е-S13 | 0.719 | 0.064 | 0.749 | 0.062 | 0.684 | 0.065 | 0.736 | 0.063 | 0.720 | 0.067 | 0.064 |
| е-S14 | 0.525 | 0.047 | 0.563 | 0.047 | 0.535 | 0.051 | 0.536 | 0.046 | 0.541 | 0.050 | 0.048 |
| е-S15 | 0.495 | 0.044 | 0.608 | 0.051 | 0.440 | 0.042 | 0.578 | 0.050 | 0.519 | 0.048 | 0.047 |
| е-S16 | 0.670 | 0.060 | 0.698 | 0.058 | 0.678 | 0.064 | 0.702 | 0.061 | 0.668 | 0.062 | 0.061 |
| Governance | |||||||||||
| е-S17 | 0.382 | 0.034 | 0.444 | 0.037 | 0.373 | 0.035 | 0.426 | 0.037 | 0.330 | 0.031 | 0.035 |
| е-S18 | 0.505 | 0.045 | 0.614 | 0.051 | 0.458 | 0.043 | 0.519 | 0.045 | 0.536 | 0.050 | 0.047 |
| е-S19 | 0.541 | 0.048 | 0.637 | 0.053 | 0.458 | 0.043 | 0.589 | 0.051 | 0.466 | 0.043 | 0.048 |
| е-S20 | 0.619 | 0.055 | 0.683 | 0.057 | 0.557 | 0.053 | 0.650 | 0.056 | 0.672 | 0.062 | 0.057 |
| ∑ | 11.178 | 1 | 12.027 | 1 | 10.576 | 1 | 11.603 | 1 | 10.760 | 1 | 1 |
Table 9.
An example of weighting coefficient values for the VR cities’ life areas.
| The areas of city life | Weighting coefficients for smart citylife areas | ||||||||||
| Prague | Warsaw | Bratislava | Krakow | Budapest | Generalized normalized weight coefficient | ||||||
| Inputweighting coefficient | Normalised weighting coefficient | Inputweighting coefficient | Normalised weighting coefficient | Inputweighting coefficient | Normalised weighting coefficient | Inputweighting coefficient | Normalised weighting coefficient | Inputweighting coefficient | Normalised weighting coefficient | ||
| 1 | 0.769 | 0.165 | 0.620 | 0.131 | 0.670 | 0.145 | 0.654 | 0.139 | 0.678 | 0.141 | 0.144 |
| 2 | 0.429 | 0.092 | 0.366 | 0.077 | 0.259 | 0.056 | 0.639 | 0.135 | 0.340 | 0.071 | 0.086 |
| 3 | 0.129 | 0.028 | 0.346 | 0.073 | 0.186 | 0.040 | 0.291 | 0.062 | 0.254 | 0.053 | 0.051 |
| 4 | 0.171 | 0.037 | 0.117 | 0.025 | 0.110 | 0.024 | 0.102 | 0.022 | 0.078 | 0.016 | 0.025 |
| 5 | 0.386 | 0.083 | 0.147 | 0.031 | 0.314 | 0.068 | 0.150 | 0.032 | 0.391 | 0.081 | 0.059 |
| 6 | 0.218 | 0.047 | 0.414 | 0.088 | 0.210 | 0.045 | 0.339 | 0.072 | 0.443 | 0.092 | 0.069 |
| 7 | 0.331 | 0.071 | 0.296 | 0.063 | 0.416 | 0.090 | 0.357 | 0.076 | 0.268 | 0.056 | 0.071 |
| 8 | 0.157 | 0.034 | 0.430 | 0.091 | 0.554 | 0.120 | 0.370 | 0.078 | 0.632 | 0.131 | 0.091 |
| 9 | 0.185 | 0.040 | 0.350 | 0.074 | 0.285 | 0.061 | 0.272 | 0.058 | 0.178 | 0.037 | 0.054 |
| 10 | 0.238 | 0.051 | 0.239 | 0.051 | 0.221 | 0.048 | 0.238 | 0.050 | 0.159 | 0.033 | 0.047 |
| 11 | 0.663 | 0.142 | 0.371 | 0.079 | 0.448 | 0.097 | 0.489 | 0.104 | 0.333 | 0.069 | 0.098 |
| 12 | 0.158 | 0.034 | 0.187 | 0.040 | 0.256 | 0.055 | 0.147 | 0.031 | 0.225 | 0.047 | 0.041 |
| 13 | 0.448 | 0.096 | 0.519 | 0.110 | 0.420 | 0.091 | 0.410 | 0.087 | 0.490 | 0.102 | 0.097 |
| 14 | 0.139 | 0.030 | 0.126 | 0.027 | 0.107 | 0.023 | 0.108 | 0.023 | 0.109 | 0.023 | 0.025 |
| 15 | 0.252 | 0.054 | 0.197 | 0.042 | 0.179 | 0.039 | 0.150 | 0.032 | 0.237 | 0.049 | 0.043 |
| ∑ | 4.673 | 1 | 4.725 | 1 | 10.576 | 1 | 11.603 | 1 | 10.760 | 1 | 1 |
Stage 2. Expert assessment of the value of technologies (e-services) in terms of ensuring the quality of city life.
In the context of the project approach, the system of city e-services must meet the requirements of usefulness/value in ensuring a high-quality of city living. For expert assessment, it is proposed to use a continuous scale [–1; 1] with reference markers:
«1» – the e-service fully ensures the achievement of the value (indicator) of quality of city life;
«0» – the e-service does not imply the achievement of the value (indicator) of quality of city life;
«–1» – the e-service has a negative impact on the value (indicator) of the quality of city life. How, for example, can this be related to the placement of video cameras, when some of the residents evaluate this positively, and others negatively.
An example of quantitative assessments of the value of e-services in each area of сity life is presented in Table 10.
Stage 3. Assessing the value of digital services using balanced regression ratios:
1) A partial model of a balanced assessment for all 5 groups of technologies for each e-service, which has the following form:
where Gjk – value assessment of the j-th е-service k-th group of digital technologies, , ; m – number of e-services included in the SCI [14], m=20; n – the number of areas of city life for which the assessment is carried out, n=15;
VTj – a balanced assessment by groups of digital technologies for the j-th e-service, ; λ1, λ2, …, λn – non-negative weighting factors satisfying the normalization condition λ1 + λ2 + …+ λn =1.
A visualisation of the balanced scores for the digital technology groups (Figure 1) and for each area of smart city life (Figure 2) in the form of profilograms makes it possible to identify the “emphases” and “gaps” in the e-services coverage.
Thus, in all VR cities, a significant advantage is preferred for the development of digital services for “Mobility”; and the list of available e-services mainly covers two priority areas: “Road congestion” (11) and “Security” (13). In Krakow, a significant share of e-services covers the area “Air pollution” (2), in Bratislava and Budapest – “Health services” (8), in Warsaw, Krakow, and Budapest – “Fulfilling employment” (6).
2) A partial model of a balanced scorecard for all e-services of the SCI for each area of city life is as follows:
where VTdk – balanced assessment of the value of smart city e-services in relation to the k-th area of city life, ; β1, β2, …, βm – are non-negative weighting factors satisfying the normalization condition β1 + β2 +…+ βm =1.
The results of the balanced assessment of technology in all areas of city life clearly demonstrate the extent to which e-services are utilised in each of the 15 smart city areas. In particular, in Prague, the e-services ‘Current internet speed and reliability meet connectivity needs’ and ‘Free public wi-fi has improved access to city services’ provide the highest coverage (Figure 3).
3) The model of integral assessment of the value of smart city e-services (VT), which can be presented either as a weighted average of balanced scores by technology groups for all e-services (formula 3) or as a weighted average of the estimated balanced of e-services for all smart city areas (formula 4):
Thus, a model has been formed for the integral assessment of the value of city e-services (VT):
Mathematical relations (3) and (4) result in the equation:
which allows to control the results of calculating the optimal values of the weighting factors λ1, λ2, …, λn and β1, β2, …, βm.
In general, the integral assessment of the value of e-services (VT) of V4 smart cities based on expert estimates (Table 8) was as follows: VTPrague=0.108, VTKrakow=0.102, VTBudapest=0.102, VTWarsaw=0.101, VTBratislava=0.100.
4. Discussion and Conclusions
The proposed/developed methodology for quantifying the value of city e-services should become an important tool for decision-making by municipalities on the introduction of a new e-service and/or the implementation of an IT project.
The city’s e-services, as defined by the SCI methodology, are an important focus of attention, when assessing their significance is determined by applying them to 15 areas of city life: 1 – Affordable housing; 2 – Air pollution; 3 – Basic amenities (water, waste); 4 – Citizen engagement; 5 – Corruption / transparency; 6 – Fulfilling employment; 7 – Green spaces; 8 – Health services; 9 – Public transport; 10 – Recycling; 11 – Road congestion; 12 – School education; 13 – Security; 14 – Social mobility / inclusiveness; 15 – Unemployment. The combination of expert assessments (Table 10), e-service weighting factors (Table 8), and indicators (areas) of quality of city life (Table 9) allows for a more comprehensive/quantitative assessment of the value of e-services (“Technologies”) in ensuring quality of city life. A continuous scale [–1; 1] is used for the assessment. The introduction of weighting coefficients for indicators of the quality of life in the city helps the decision-maker to determine the priority of the needs of residents who need coverage/coverage by e-services.
Such an author’s proposal for the development of the SCI methodology opens up the possibility of assessing the value of existing e-services for the digital city transformations. And the use of mathematical tools (1)–(6) allows for formalizing decision-making under conditions of varying degrees of certainty of the initial information. The proposed mathematical apparatus is basic; it can be supplemented and developed in accordance with the conditions and specifics of a particular smart city, IT project, and/or municipal programs for the sustainable development of smart cities.
The correct use of the proposed approach requires the expert to have developed digital competencies and knowledge/understanding of the specifics of the implementation of municipal IT projects, the introduction of IT products (e-services) in the context of city projects and programs. The expert carries out his own research on pre-project solutions, forms a “personal vision (personal point of view)” regarding the effectiveness of these solutions in providing e-services with indicators (areas) of urban life as “input data” in the form of tables of the accepted/established form. When filling out table forms, the expert may have (intentional or accidental) omissions and/or errors in cells, as well as violations of ethical rules (prevalence of subjectivity over objectivity). Such a situation will result in individual numerical values of criterion assessments being obtained at the output outside their agreed-upon ranges. Therefore, it is important that the proposed methodology for the quantitative assessment of the value of a city’s e-services makes it possible to promptly identify inconsistencies and eliminate them. Also, when monitoring the input data of computational procedures, technical errors requiring elimination can be detected.
The developed tools for assessing the sustainability of municipal/IT project management processes are an important tool for improving and developing the management system for high-tech municipal projects and programs from the perspective of sustainable development. The application of the analytical tools developed by the authors will be useful in the projects of municipal offices, IT companies, investors, as well as initiative projects that implement public-private partnership projects, public budgets, etc.
Along with it, the author’s approach requires additional scientific and practical investigations on processing specific data. The empirical basis for further research should be formed by analytical reports on other smart city indices. The presented analysis of e-services in the cities of the Visegrad region may be useful for developing programs to improve the digital infrastructure of other cities. A promising direction of relevant scientific explorations can be the consistent application of the fuzzy logic apparatus, the development of decision-making information technology, as well as the development of a corresponding software product.
The results of the assessment of five cities in the Visegrad region, presented in the SCI, are considered as input information for finding growth/improvement points for digital landscapes in the perspective of sustainable development. An information and contextual analysis of the “Smart City Index” indicators was carried out in Prague (Czech Republic), Warsaw and Krakow (Poland), Bratislava (Slovakia), and Budapest (Hungary).
A comparative analysis of the indicators and values showed that in all V4 places, e-services of the “Mobility” category are more developed (Car-sharing Apps; Apps that direct you to an available parking space; Bicycle hiring; Online scheduling and ticket sales; The city provides information on traffic congestion through mobile phones).
The exploration of the methodology for calculating the Smart City Index made it possible to highlight the correlation and relationships between the assessed e-services (in SCI terminology, “Technologies”) and indicators (areas) of city life. It was revealed that among the e-services (technologies) proposed for assessment, there are no e-services related to affordable housing and green spaces. Although residents of all V4 smart cities note “affordable housing” as the most priority indicator of quality of life in the city.
Considering that the value of digital technologies depends on the e-service’s impact on improving the quality of city life (in terms of residents’ level of satisfaction regarding different areas of city life), it is proposed to improve the existing SCI methodology to assess the value of e-service based on the interdependence of three variables:
- the extent of coverage of one or more areas sphere of city life by the assessed e-service;
- the significance of indicators (areas) of the quality of city life for citizens;
- the assessment of the significance of an e-service, to what extent it improves the quality of life of citizens in the area (or areas) of city life.
This approach allows for the formation of a comprehensive//integrated assessment of the value of an e-service in accordance with the SCI methodology.
A comprehensive methodology for the quantitative assessment of the value of smart city e-services under uncertainty is proposed. This methodology is developed using the apparatus of fuzzy mathematics and takes into account the relative importance of e-services (“Technologies”) specified in the SCI, and indicators (areas) of the quality of city life. Basic mathematical models for assessing the value of e-services have been developed, in particular:
- a partial model of balanced assessment across all categories/groups of technologies for each e-service (VТj);
- a partial model of balanced assessment across all e-services of the smart city for each indicator (sphere) of city life (VТdk);
- a model of integrated assessment of the value of e-services of the smart city (VT).
The application of such a model will allow decision-makers to evaluate IT projects and IT products (e-services) in the context of improving the efficiency of the quality of life in the city (according to 15 indices/areas). Such an assessment is important for making a decision on funding to start developing a technical task. The larger the scale of the IT project or IT program, the more visible the effects of digitalization of the sphere of urban services become. In general, the application of the proposed methodology and assessment tools for the value of e-services brings the e-government of the municipality to a higher level of digital maturity and better representation in international smart city rankings.
Author Contributions
Conceptualization, A. Avdiushchenko and T. Fesenko; methodology, T. Fesenko; validation, A. Avdiushchenko and G. Fesenko; formal analysis, G. Fesenko; investigation, A. Avdiushchenko and T. Fesenko; resources G. Fesenko; data curation, T. Fesenko, A. Avdiushchenko and G. Fesenko; writing—original draft preparation, T. Fesenko, A. Avdiushchenko and G. Fesenko; writing—review and editing, T. Fesenko and G. Fesenko; supervision, A. Avdiushchenko. All authors have read and agreed to the published version of the manuscript.
Funding
The research has been partly supported by a grant from the Priority Research Area (“Anthropocene”) under the Strategic Programme Excellence Initiative at Jagiellonian University.
Data Availability Statement
Data is available upon request.
Conflicts of Interest
The authors declare no conflict of interest.
References
- Nagenborg, M. , Stone T., González Woge M., Vermaas P.E., Eds. In Technology and the City. Towards a Philosophy of Urban Technologies; Springer International Publishing: Cham, Germany, 2021. [Google Scholar] [CrossRef]
- Fesenko, G. , Fesenko, T. City-Governance: conceptualizing digital maturity model. SOCRATES 2017, 5, 51–63. [Google Scholar] [CrossRef]
- Estevez, E.; , Lopes, N., Janowski, T. Smart sustainable cities – reconnaissance study. Guimarães: United Nations University. 2016. Available online: https://collections.unu.edu/view/UNU:5825 (accessed on 10 March 2025).
- Fesenko, T. , Fesenko, G. E-Readiness evaluation modelling for the monitoring programs E-Government at the national level (for the example of Ukraine). Eastern-European Journal of Interiorise Technologies, 2016, 3, 28–35. [Google Scholar] [CrossRef]
- OECD Programme on a territorial approach to the SDGs. Available online: https://www.oecd.org/en/about/programmes/oecd-programme-on-a-territorial-approach-to-the-sdgs.html (accessed on 10 March 2025).
- Fesenko, G.; Fesenko, T.; Fesenko, H.; Shakhov, A.; Yakunin, A.; Korzhenko, V. Developing e-mature model for municipal project and program management system. Eastern-European Journal of Enterprise Technologies 2021, 1/3, 15–28. [Google Scholar] [CrossRef]
- Caird, S. P. , Hallett, S. H. Towards evaluation design for smart city development. Journal of Urban Design 2018, 24, 188–209. [Google Scholar] [CrossRef]
- UN E-Government Survey 2024. Accelerating Digital Transformation for Sustainable Development. United Nations: New York, 2024.
- Jakubcinova, M.; Stefcikova, K.; Paril, V.; Hruza, F. Smart Visegrad – How modern and dynamic are the local governments of the V4 regions. Administratie si Management Public 2024, 43, 25–40. [Google Scholar] [CrossRef]
- Toh, Ch. K. Smart city indexes, criteria, indicators and rankings: An in-depth investigation and analysis. IET Smart Cities 2022, 4, 211–228. [Google Scholar] [CrossRef]
- Tsun, C. V. , Cole, A. Measuring progress of smart cities: Indexing the smart city indices. Urban Governance 2023, 3, 45–57. [Google Scholar] [CrossRef]
- Jussila, J., Sillanpää, V., Lehtonen, T., Helander, N. Value Assessment of e-Government Service from Municipality Perspective. In Proceedings of the 50th Hawaii International Conference on System Sciences, Hilton Waikoloa Village, Hawaii, USA, 4-7 January 2017. [Google Scholar]
- Shi, F. , Shi, W. A Critical Review of Smart City Frameworks: New Criteria to Consider When Building Smart City Framework. ISPRS International Journal of Geo-Information 2023, 12, 364. [Google Scholar] [CrossRef]
- Smart City Index. Available online: https://www.imd.org/smart-city-observatory/home/ (accessed on 10 May 2025).
- Górka, M. The idea of smart city in the perspective of the development of the capitals of the Visegrad Group countries. Nowa Polityka Wschodnia 2024, 1, 86–113. [Google Scholar] [CrossRef]
- Blazek, R. , Durana P., Jaros, J. How the V4 nations handle the idea of smart cities. Information 2022, 13, 570. [Google Scholar] [CrossRef]
- Bratislava rozumné mesto 2030: Koncepcia Smart City. 2018. Available online: https://zastupitelstvo.bratislava.sk/data/att/23774.pdf (accessed on 10 May 2025).
- Smart Budapest – Budapest okos város jövőképe. Budapest Főváros Önkormányzata. 2017. Available online: https://www.hugbc.hu/resources/docs/10_Smart_Budapest_jovokep.pdf (accessed on 10 May 2025).
- Koncepce Smart Prague 2030. Aktualizované verzie k 04/2024. Available online: https://smartprague.eu/files/koncepce_smartprague.pdf (accessed on 10 May 2025).
- Warszawa w kierunku Smart City. 2018. Available online: https://pawilonzodiak.pl/wp-content/uploads/2018/10/kfsmartwawa2018pl.pdf (accessed on 10 May 2025).
- Fesenko, G., Fesenko, T., Pamula, A., Gontar, B. and Gontar, Z. Smart-City of Poland: Informational and Analytical Context. 2023 IEEE 12th International Conference on Intelligent Data Acquisition and Advanced Computing Systems: Technology and Applications (IDAACS), Dortmund, Germany; 2023; pp. 627–632. [Google Scholar] [CrossRef]
- Gorecka, K., Vaquero, J.A., Mustonen, V., Mutzu Martis, M., Garau, C. Warsaw’s Smart City Mirage: Unmasking Ranking Variations and Methodological Mysteries of IMD Smart City Index Report. In Computational Science and Its Applications – ICCSA 2024 Workshops. ICCSA 2024. Lecture Notes in Computer Science; Gervasi, O., Murgante, B., Garau, C., Taniar, D., C. Rocha, A.M.A., Faginas Lago, M.N., Eds.; Springer: Cham, 2024; vol 14823. [Google Scholar] [CrossRef]
- Machyniak, J. , Mikuš, D., Dzureková, K., Srovnalíková, P. Smart City Strategies in Slovak Cities. European Journal of Interdisciplinary Studies 2023, 15, 17–33. [Google Scholar] [CrossRef]
- Štěpánek, P. The Challenges and Barriers for Smart City Investments in the Czech Republic. In 2023 Smart City Symposium Prague (SCSP); Prague, Czech Republic, 2023; pp. 1–5. [Google Scholar] [CrossRef]
- Busko, Т. L. Institutionalization of the Smart City Concept in Hungary: Results of a Discourse Analysis of Development Policy. In Proceedings of the Central and Eastern European eDem and eGov Days 2023 (CEEeGov ‘23). Association for Computing Machinery, New York, NY, USA, 209–217. 2023. [Google Scholar] [CrossRef]
Figure 1.
The examples of profilograms of balanced assessments of digital technologies for each technology group: (a) Prague; (b) Warsaw and Krakow; (c) Bratislava; (d) Budapest.
Figure 1.
The examples of profilograms of balanced assessments of digital technologies for each technology group: (a) Prague; (b) Warsaw and Krakow; (c) Bratislava; (d) Budapest.
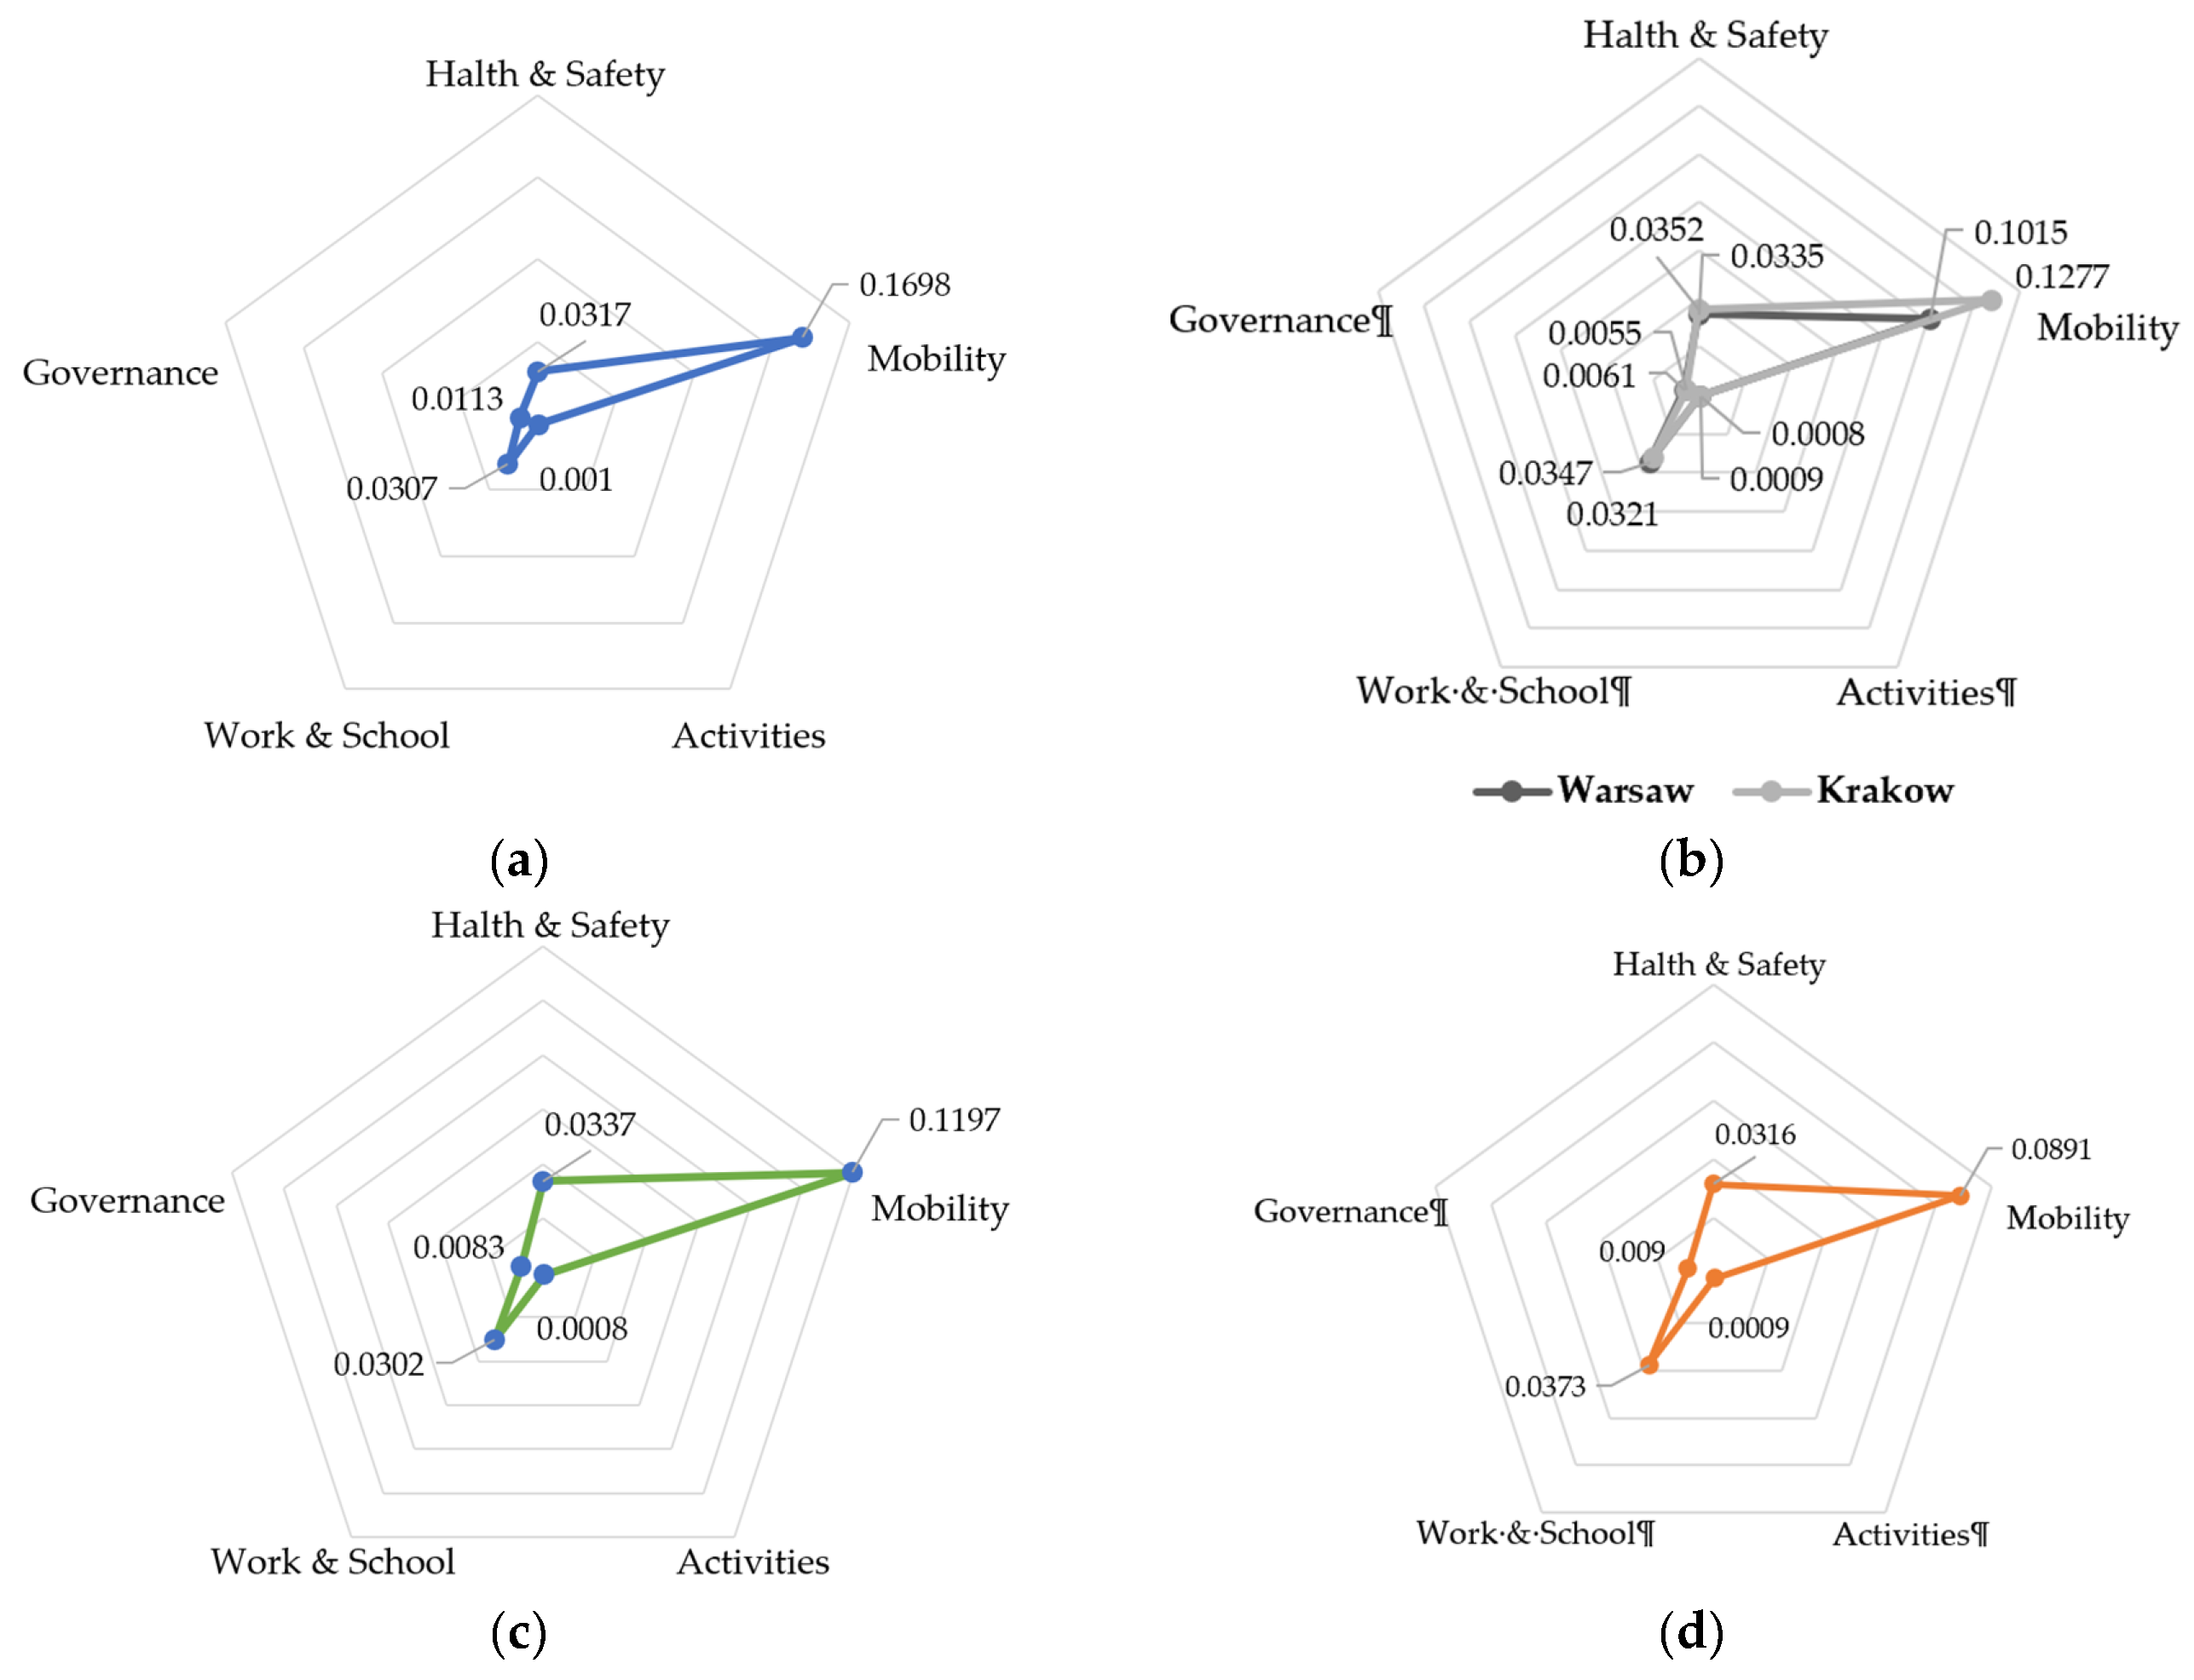
Figure 2.
The examples of profilograms of balanced assessments of digital technologies for each area of smart city life: (a) Prague; (b) Warsaw and Krakow; (c) Bratislava; (d) Budapest.
Figure 2.
The examples of profilograms of balanced assessments of digital technologies for each area of smart city life: (a) Prague; (b) Warsaw and Krakow; (c) Bratislava; (d) Budapest.
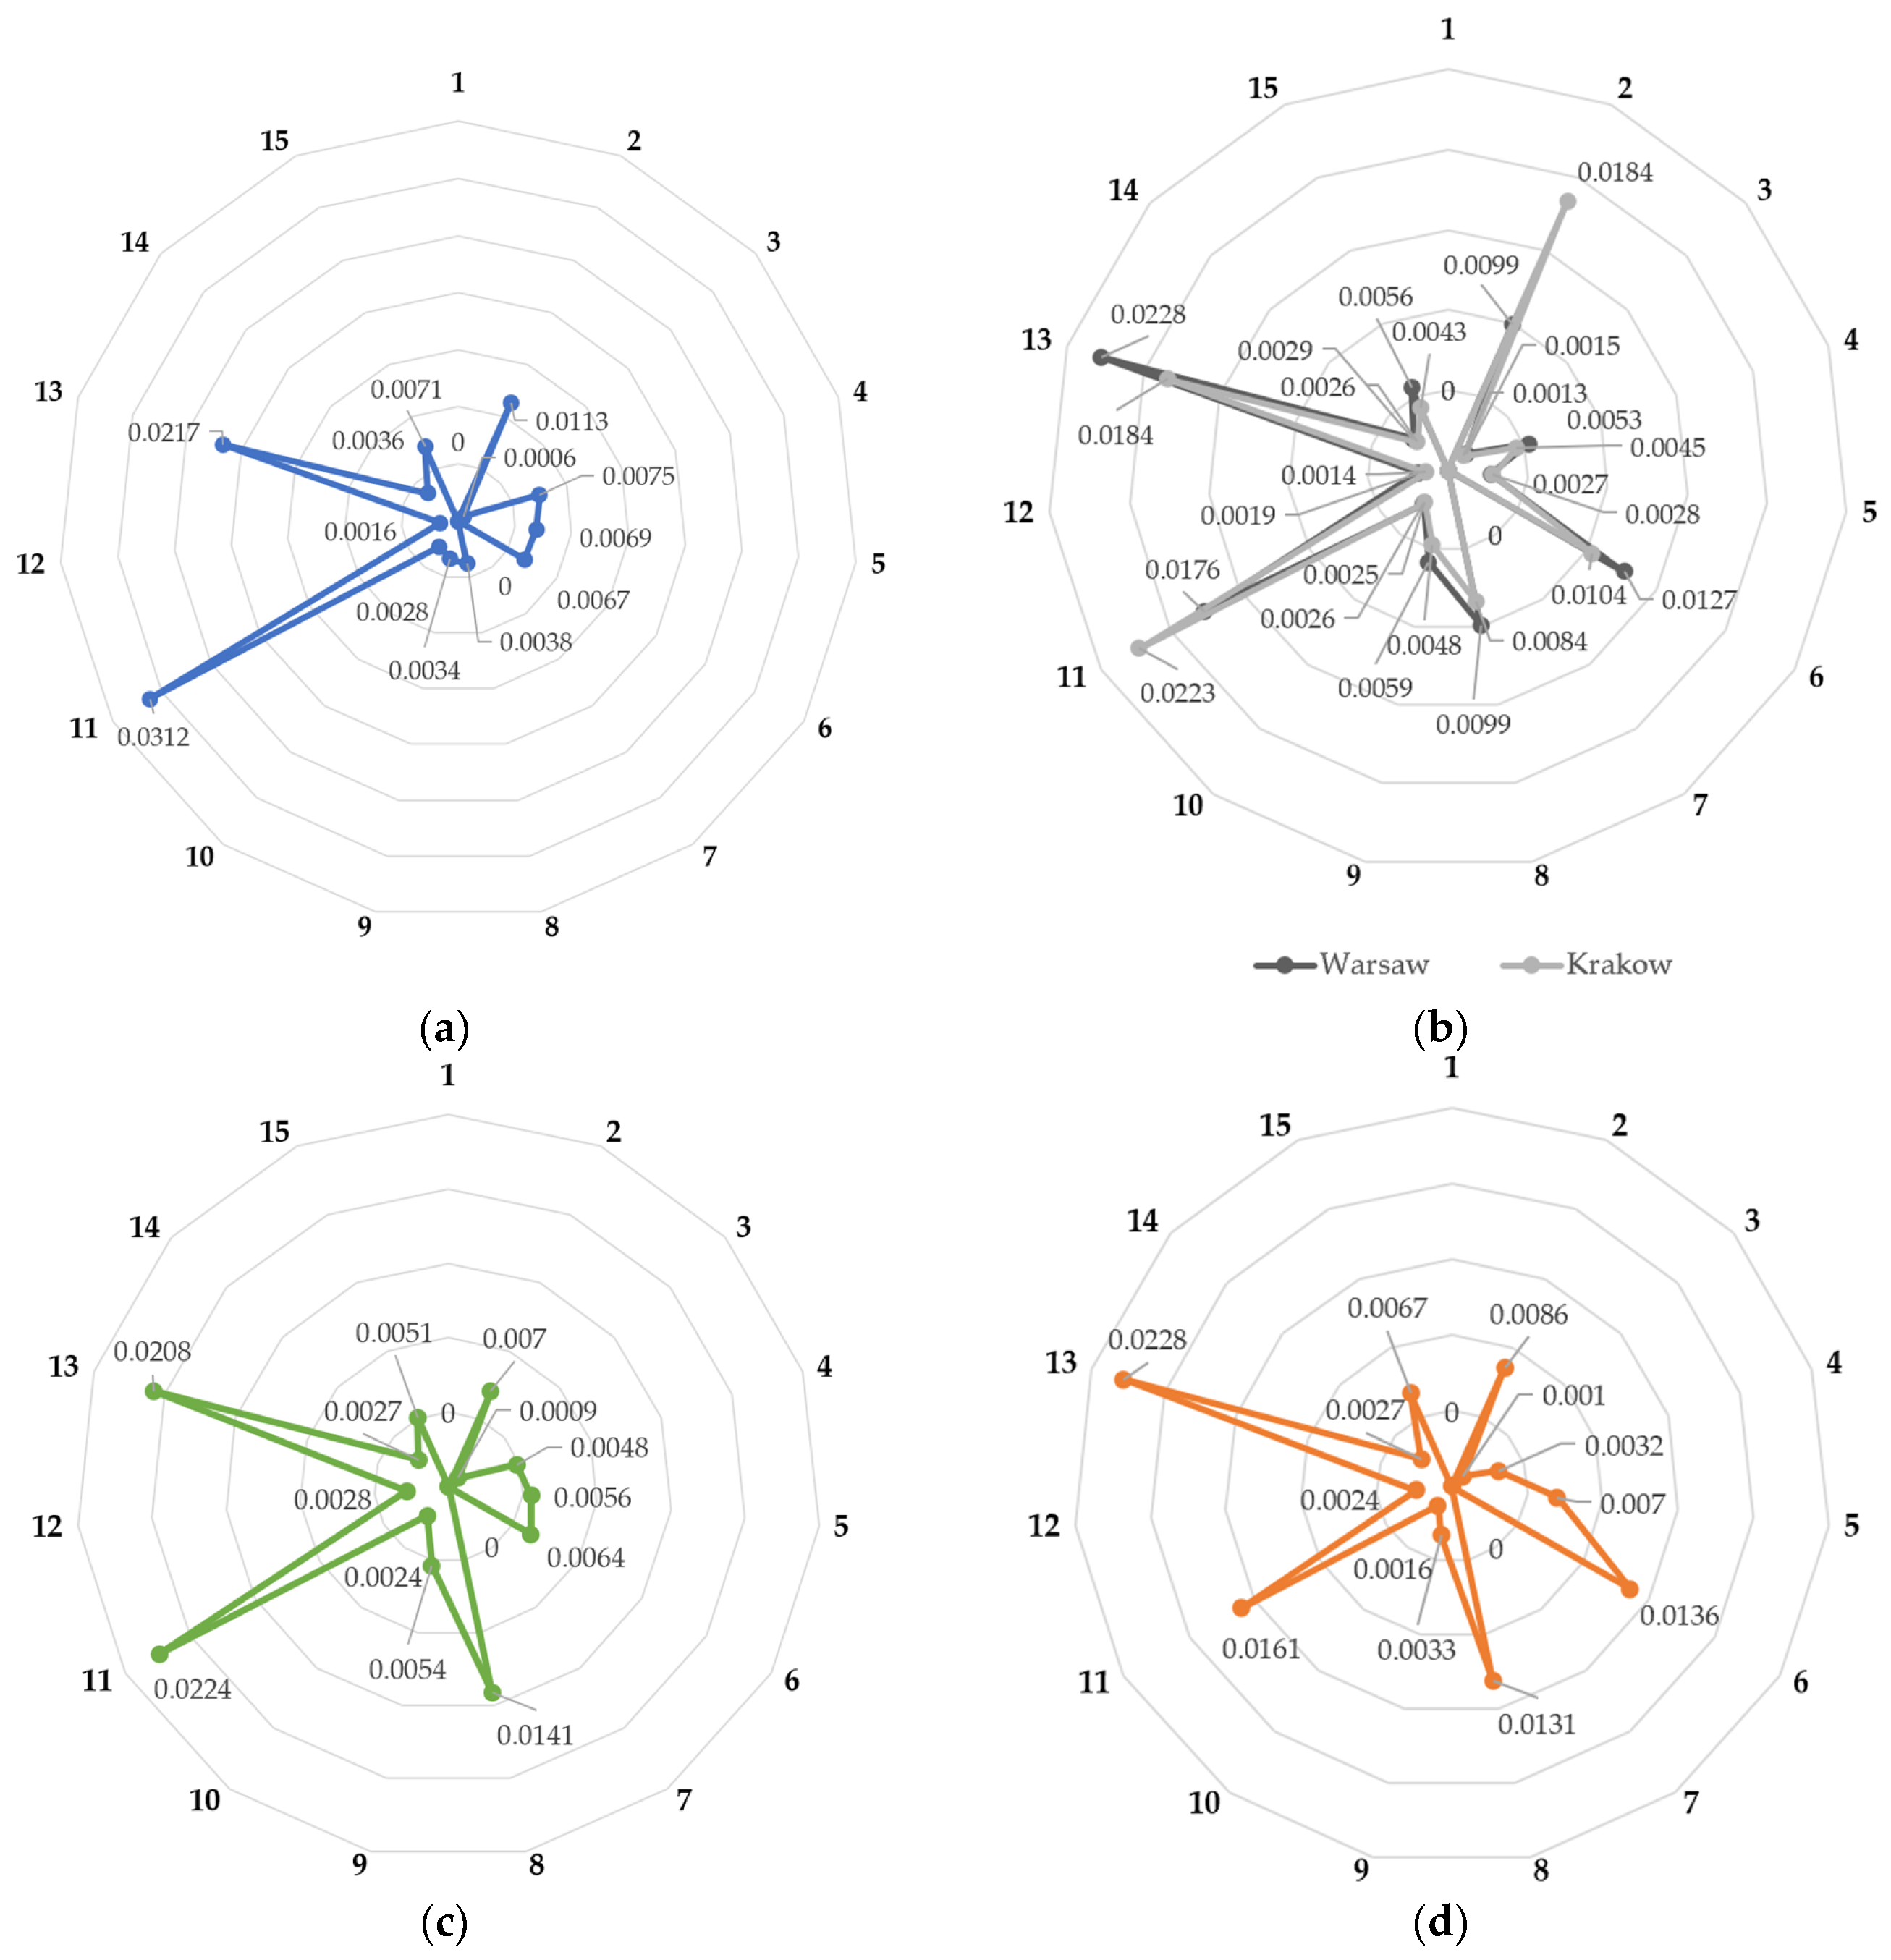
Figure 3.
An example of a diagram of a balanced assessment of the value technologies in all areas of the smart city for each e-service.
Figure 3.
An example of a diagram of a balanced assessment of the value technologies in all areas of the smart city for each e-service.
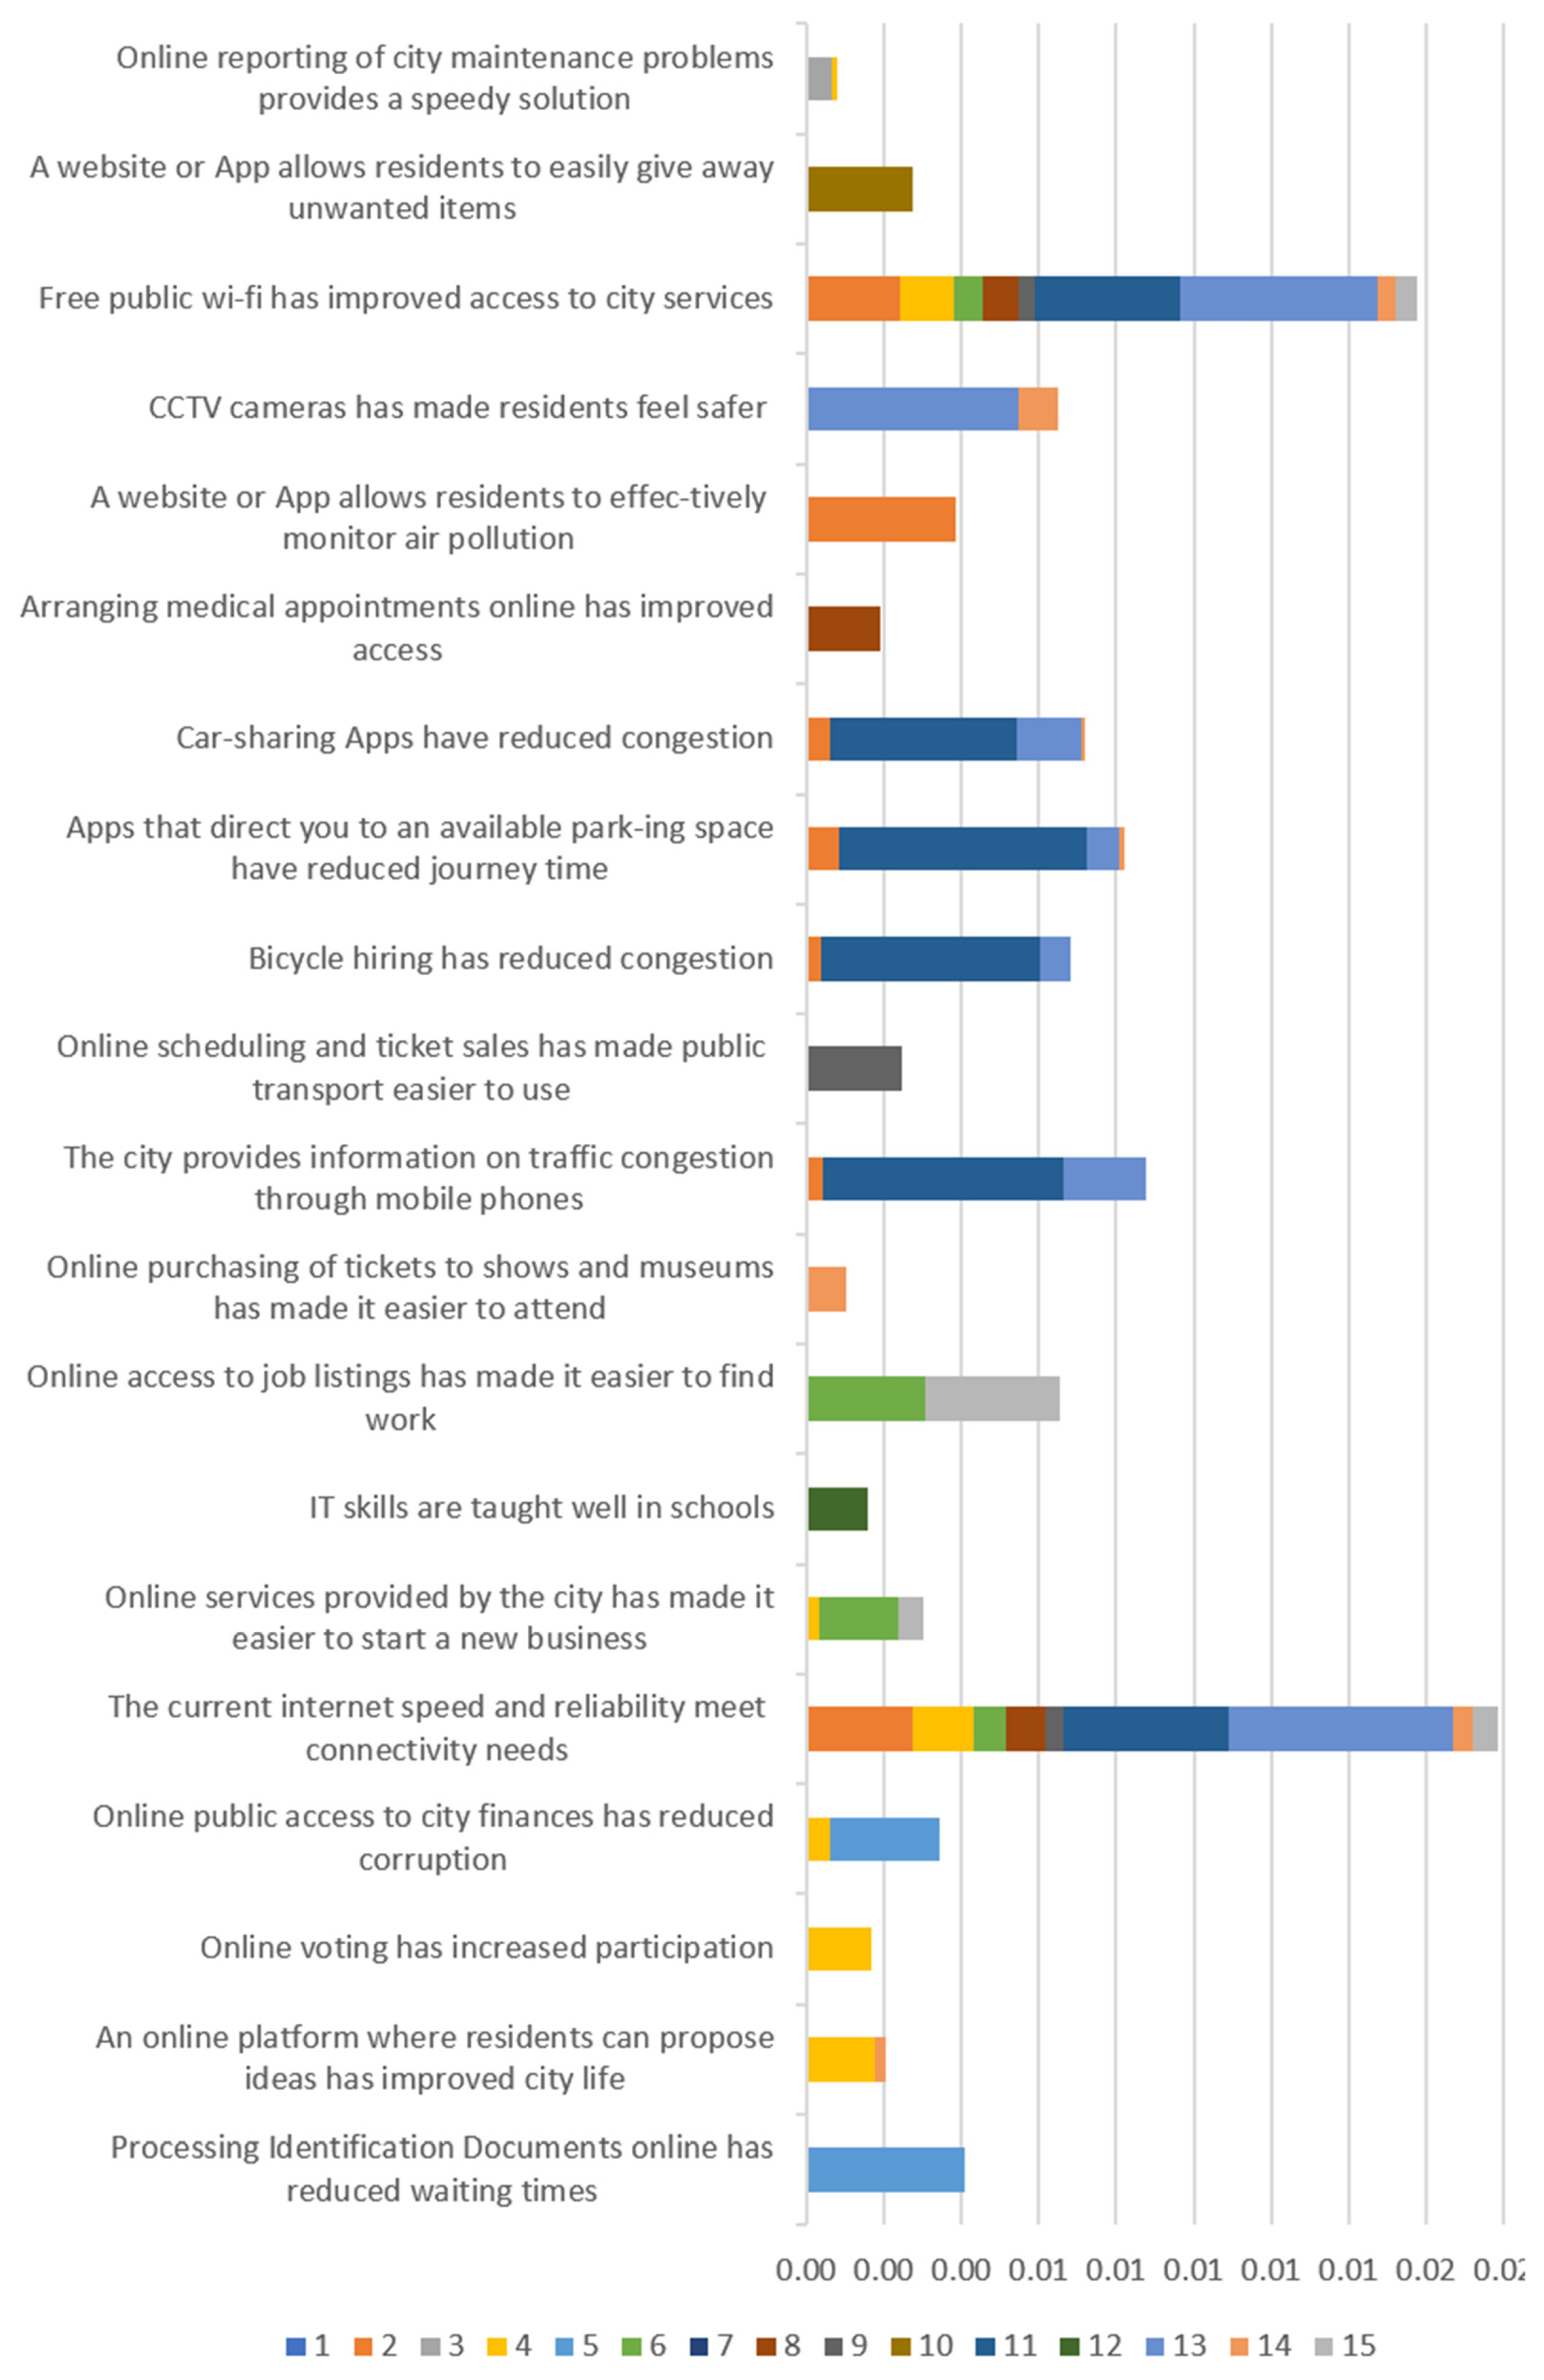
Table 1.
The SСI for the top cities and the Visegrad region cities, 2023-2025. Sourse: own work of authors based on [14].
Table 1.
The SСI for the top cities and the Visegrad region cities, 2023-2025. Sourse: own work of authors based on [14].
| City | Smart City Ranking | Smart City Rating | Factors Rating | Group | ||||
| 2025 | 2024 | 2023 | ∆2023-2025 | Structures | Technologies | |||
| Zurich | 1 | 1 | 1 | – | AAA | AAA | AАA | 1 |
| Oslo | 2 | 2 | 2 | – | AAА | AAА | AАА | 1 |
| Geneva | 3 | 4 | ↑1 | ААА | ААА | ААА | 1 | |
| Dubai | 4 | 12 | ↑8 | А | А | А | 2 | |
| Abu Dhabi | 5 | 10 | ↑5 | А | А | А | 2 | |
| London | 6 | 8 | ↑2 | АА | ААА | ААА | 1 | |
| Copenhagen | 7 | 6 | ↓1 | ААА | ААА | АА | 1 | |
| Canberra | 8 | 3 | 3 | ↓5 | AA | AAA | A | 1 |
| … | … | … | … | … | … | … | … | … |
| Prague | 12 | 15 | 14 | ↑3 | AА | AА | AА | 1 |
| Warsaw | 28 | 38 | 44 | ↑10 | BBB | А | А | 2 |
| Bratislava | 57 | 56 | 62 | ↓1 | BB | BB | ВВВ | 1 |
| Krakow | 70 | 76 | 79 | ↑6 | В | В | В | 3 |
| Budapest | 84 | 89 | 87 | ↑5 | ССС | B | BBВ | 2 |
| … | … | … | … | … | … | … | … | … |
| All | 146 | 142 | 141 | |||||
Table 2.
SCI data for Visegrad Region cities on technological services within the “Health & Safety” area, 2024-2025. Sourse: own work of authors based on [14].
Table 2.
SCI data for Visegrad Region cities on technological services within the “Health & Safety” area, 2024-2025. Sourse: own work of authors based on [14].
| Technological provisions and services” | Year | Prague | Warsaw | Bratislava | Krakow | Budapest |
| Online reporting of city maintenance problems provides a speedy solution | 2024 | 51.5 | 49.2 | 45.8 | 50.2 | 38.2 |
| 2025 | 44.0* | 56.2 | 45.3* | 49.5* | 39.3* | |
| A website or App allows residents to easily give away unwanted items | 2024 | 60.6 | 61.4 | 54.2 | 56.5 | 52.7 |
| 2025 | 43.6* | 71.2 | 55.9 | 58.4 | 51.5 | |
| Free public wifi has improved access to city services | 2024 | 58.8 | 57.9 | 57.7 | 53.6 | 52.1 |
| 2025 | 49.8* | 66.9 | 58.3 | 56.3 | 53.9 | |
| CCTV cameras has made residents feel safer | 2024 | 63.4 | 51.4 | 54.3 | 57.7 | 53.8 |
| 2025 | 66.6 | 63.9 | 52.2 | 57.5 | 57.1 | |
| A website or App allows residents to effectively monitor air pollution | 2024 | 47.1 | 61.7 | 43.6 | 69.0 | 43.4 |
| 2025 | 38.2* | 52.7 | 44.7* | 67.8 | 47.4* | |
| Arranging medical appointments online has improved access | 2024 | 62.3 | 66.8. | 61.3 | 63.1 | 47.9 |
| 2025 | 58.8 | 67.0 | 60.2 | 67.9 | 48.5* | |
| Total | 2024 | 343.7 | 348.4 | 316.9 | 350.1 | 288.1 |
| 2025 | 301.0 | 377.9 | 316.6 | 357.4 | 297.6 |
* The score is less than 50% and is critically important for improvement.
Table 3.
SCI data for Visegrad Region cities on technological services within the “Mobility” area, 2024-2025. Sourse: own work of authors based on [14].
Table 3.
SCI data for Visegrad Region cities on technological services within the “Mobility” area, 2024-2025. Sourse: own work of authors based on [14].
| Technological provisions and services | Year | Prague | Warsaw | Bratislava | Krakow | Budapest |
| Car-sharing Apps have reduced congestion | 2024 | 38.1 | 47.0 | 39.9 | 40.9 | 39.6 |
| 2025 | 54.9 | 49.4* | 43.3* | 42.0* | 40.8* | |
| Apps that direct you to an available parking space have reduced journey time | 2024 | 50.8 | 50.5 | 44.1 | 48.6 | 45.4 |
| 2025 | 53.1 | 55.9 | 46.3* | 50.2 | 46.8* | |
| Bicycle hiring has reduced congestion | 2024 | 44.6 | 57.6 | 51.1 | 51.8 | 49.5* |
| 2025 | 46.2* | 56.6 | 53.6 | 54.1 | 50.5 | |
| Online scheduling and ticket sales has made public transport easier to use | 2024 | 69.6 | 71.1 | 67.6 | 71.2 | 71.3 |
| 2025 | 72.4 | 72.3 | 67.1 | 72.0 | 72.4 | |
| The city provides information on traffic congestion through mobile phones | 2024 | 49.0 | 49.9 | 45.2 | 45.0 | 57.8 |
| 2025 | 49.5* | 59.0 | 49.3* | 48.8* | 60.1 | |
| Total | 2024 | 252.1 | 276.1 | 247.9 | 257.5 | 263.6 |
| 2025 | 276.1 | 293.2 | 259.6 | 267.1 | 270.6 |
* The score is less than 50% and is critically important for improvement.
Table 4.
SCI data for Visegrad Region cities on technological services within the “Activities” area, 2024-2025. Sourse: own work of authors based on [14].
Table 4.
SCI data for Visegrad Region cities on technological services within the “Activities” area, 2024-2025. Sourse: own work of authors based on [14].
| Technological provisions and services | Year | Prague | Warsaw | Bratislava | Krakow | Budapest |
| Online purchasing of tickets to shows and museums has made it easier to attend | 2024 | 76.4 | 78.6 | 74.6 | 79.1 | 79.1 |
| 2025 | 80.0 | 81.0 | 73.3 | 79.5 | 77.4 |
Table 5.
SCI data for Visegrad Region cities on technological services within the “Opportunities (Work & School)” area, 2024-2025. Sourse: own work of authors based on [14].
Table 5.
SCI data for Visegrad Region cities on technological services within the “Opportunities (Work & School)” area, 2024-2025. Sourse: own work of authors based on [14].
| Technological provisions and services | Year | Prague | Warsaw | Bratislava | Krakow | Budapest |
| Online access to job listings has made it easier to find work | 2024 | 71.9 | 74.9 | 68.4 | 73.6 | 72.0 |
| 2025 | 74.2 | 76.5 | 67.0 | 70.9 | 71.4 | |
| IT skills are taught well in schools | 2024 | 52.5 | 56.3 | 53.4 | 53.6 | 54.1 |
| 2025 | 55.0 | 66.0 | 55.2 | 54.8 | 55.9 | |
| Online services provided by the city has made it easier to start a new business | 2024 | 49.5 | 60.8 | 44.0 | 57.8 | 51.9 |
| 2025 | 51.9 | 64.5 | 48.2* | 61.8 | 51.5 | |
| The current internet speed and reliability meet connectivity needs | 2024 | 67.0 | 69.8 | 67.8 | 70.2 | 66.8 |
| 2025 | 71.7 | 80.0 | 67.8 | 72.2 | 69.5 | |
| Total | 2024 | 240.9 | 261.8 | 233.6 | 255.2 | 244.8 |
| 2025 | 258.2 | 287.0 | 238.2 | 259.7 | 248.3 |
* The score is less than 50% and is critically important for improvement.
Table 6.
SCI data for Visegrad Region cities on technological services within the “Governance” area, 2024-2025. Sourse: own work of authors based on [14].
Table 6.
SCI data for Visegrad Region cities on technological services within the “Governance” area, 2024-2025. Sourse: own work of authors based on [14].
| Technological provisions and services | Year | Prague | Warsaw | Bratislava | Krakow | Budapest |
| Online public access to city finances has reduced corruption | 2024 | 38.2 | 44.4 | 37.3 | 42.6 | 33.0 |
| 2025 | 42.3* | 44.8* | 39.0* | 45.7* | 35.5* | |
| Online voting has increased participation | 2024 | 50.5 | 61.4 | 45.8 | 51.9 | 53.6 |
| 2025 | 52.9 | 52.1 | 49.4* | 53.5 | 52.0 | |
| An online platform where residents can propose ideas has improved city life | 2024 | 54.1 | 63.7 | 45.8 | 58.9 | 46.4 |
| 2025 | 56.5 | 55.1 | 48.3* | 60.6 | 48.8* | |
| Processing identification documents online has reduced waiting times | 2024 | 61.9 | 68.3 | 55.7 | 65.0 | 67.2 |
| 2025 | 65.3 | 68.0 | 57.5 | 68.6 | 62.7 | |
| Total | 2024 | 204.7 | 237.8 | 184.6 | 218.4 | 200.2 |
| 2025 | 217.0 | 220.0 | 194.2 | 228.4 | 199.0 |
* The score is less than 50% and is critically important for improvement.
Table 7.
Correlation matrix of Technologies (e-services) and Priority areas for the SCI framework.
| Technologies (e-services) | Priority areasof city life | ||||||||||||||
| 1 | 2 | 3 | 4 | 5 | 6 | 7 | 8 | 9 | 10 | 11 | 12 | 13 | 14 | 15 | |
| Health & Safety | |||||||||||||||
| Online reporting of city maintenance problems provides a speedy solution (е-S1) | X | ||||||||||||||
| A website or App allows residents to easily give away unwanted items (е-S2) | X | ||||||||||||||
| Free public wi-fi has improved access to city services (е-S3) | X | X | X | X | Х | X | X | X | X | ||||||
| CCTV cameras has made residents feel safer (е-S4) | X | X | |||||||||||||
| A website or App allows residents to effectively monitor air pollution (е-S5) | X | ||||||||||||||
| Arranging medical appointments online has improved access (е-S6) | X | ||||||||||||||
| Mobility | |||||||||||||||
| Car-sharing Apps have reduced congestion (е-S7) | X | X | X | ||||||||||||
| Apps that direct you to an available parking space have reduced journey time (е-S8) | Х | Х | |||||||||||||
| Bicycle hiring has reduced congestion (е-S9) | Х | Х | |||||||||||||
| Online scheduling and ticket sales has made public transport easier to use (е-S10) | Х | ||||||||||||||
| The city provides information on traffic congestion through mobile phones (е-S11) | Х | ||||||||||||||
| Activities | |||||||||||||||
| Online purchasing of tickets to shows and museums has made it easier to attend (е-S12) | Х | ||||||||||||||
| Work & School | |||||||||||||||
| Online access to job listings has made it easier to find work (е-S13) | Х | Х | |||||||||||||
| IT skills are taught well in schools (е-S14) | Х | ||||||||||||||
| Online services provided by the city has made it easier to start a new business (е-S15) | Х | Х | Х | ||||||||||||
| The current internet speed and reliability meet connectivity needs (е-S16) | Х | Х | Х | Х | Х | Х | Х | Х | Х | Х | |||||
| Governance | |||||||||||||||
| Online public access to city finances has reduced corruption (е-S17) | Х | ||||||||||||||
| Online voting has increased participation (е-S18) | Х | ||||||||||||||
| An online platform where residents can propose ideas has improved city life (е-S19) | Х | ||||||||||||||
| Processing Identification Documents online has reduced waiting times (е-S20) | Х | ||||||||||||||
Table 10.
An example of expert assessments of e-services in the city life areas for the SCI.
| Technologies (e-services) | The areas of city life | ||||||||||||||
| 1 | 2 | 3 | 4 | 5 | 6 | 7 | 8 | 9 | 10 | 11 | 12 | 13 | 14 | 15 | |
| Health & Safety | |||||||||||||||
| Online reporting of city maintenance problems provides a speedy solution | 0 | 0 | 0.5 | 0.1 | 0 | 0 | 0 | 0 | 0 | 0 | 0 | 0 | 0 | 0 | 0 |
| A website or App allows residents to easily give away unwanted items | 0 | 0 | 0 | 0 | 0 | 0 | 0 | 0 | 0 | 1 | 0 | 0 | 0 | 0 | 0 |
| Free public wi-fi has improved access to city services | 0 | 0.5 | 0 | 0.7 | 0 | 0.3 | 0 | 0.5 | 0.2 | 0 | 0.5 | 0 | 1 | 0.3 | 0.2 |
| CCTV cameras has made residents feel safer | 0 | 0 | 0 | 0 | 0 | 0 | 0 | 0 | 0 | 0 | 0 | 0 | 1 | 0.6 | 0 |
| A website or App allows residents to effectively monitor air pollution | 0 | 1 | 0 | 0 | 0 | 0 | 0 | 0 | 0 | 0 | 0 | 0 | 0 | 0 | 0 |
| Arranging medical appointments online has improved access | 0 | 0 | 0 | 0 | 0 | 0 | 0 | 1 | 0 | 0 | 0 | 0 | 0 | 0 | 0 |
| Mobility | |||||||||||||||
| Car-sharing Apps have reduced congestion | 0 | 0.2 | 0 | 0 | 0 | 0 | 0 | 0 | 0 | 0 | 1 | 0 | 0.5 | 0.1 | 0 |
| Apps that direct you to an available parking space have reduced journey time | 0 | 0.2 | 0 | 0 | 0 | 0 | 0 | 0 | 0 | 0 | 1 | 0 | 0.2 | 0.1 | 0 |
| Bicycle hiring has reduced congestion | 0 | 0.1 | 0 | 0 | 0 | 0 | 0 | 0 | 0 | 0 | 1 | 0 | 0.2 | 0 | 0 |
| Online scheduling and ticket sales has made public transport easier to use | 0 | 0 | 0 | 0 | 0 | 0 | 0 | 0 | 1 | 0 | 0 | 0 | 0 | 0 | 0 |
| The city provides information on traffic congestion through mobile phones | 0 | 0.1 | 0 | 0 | 0 | 0 | 0 | 0 | 0 | 0 | 1 | 0 | 0.5 | 0 | 0 |
| Activities | |||||||||||||||
| Online purchasing of tickets to shows and museums has made it easier to attend | 0 | 0 | 0 | 0 | 0 | 0 | 0 | 0 | 0 | 0 | 0 | 0 | 0 | 0.5 | 0 |
| Work & School | |||||||||||||||
| Online access to job listings has made it easier to find work | 0 | 0 | 0 | 0 | 0 | 1 | 0 | 0 | 0 | 0 | 0 | 0 | 0 | 0 | 1 |
| IT skills are taught well in schools | 0 | 0 | 0 | 0 | 0 | 0 | 0 | 0 | 0 | 0 | 0 | 1 | 0 | 0 | 0 |
| Online services provided by the city has made it easier to start a new business | 0 | 0 | 0 | 0.2 | 0 | 1 | 0 | 0 | 0 | 0 | 0 | 0 | 0 | 0 | 1 |
| The current internet speed and reliability meet connectivity needs | 0 | 0.5 | 0 | 0.7 | 0 | 0.3 | 0 | 0.5 | 0.2 | 0 | 0.5 | 0 | 1 | 0.3 | 0.2 |
| Governance | |||||||||||||||
| Online public access to city finances has reduced corruption | 0 | 0 | 0 | 0.5 | 1 | 0 | 0 | 0 | 0 | 0 | 0 | 0 | 0 | 0 | 0 |
| Online voting has increased participation | 0 | 0 | 0 | 1 | 0 | 0 | 0 | 0 | 0 | 0 | 0 | 0 | 0 | 0 | 0 |
| An online platform where residents can propose ideas has improved city life | 0 | 0 | 0 | 1 | 0 | 0 | 0 | 0 | 0 | 0 | 0 | 0 | 0 | 0.2 | 0 |
| Processing Identification Documents online has reduced waiting times | 0 | 0 | 0 | 0 | 0.9 | 0 | 0 | 0 | 0 | 0 | 0 | 0 | 0 | 0 | 0 |
Disclaimer/Publisher’s Note: The statements, opinions and data contained in all publications are solely those of the individual author(s) and contributor(s) and not of MDPI and/or the editor(s). MDPI and/or the editor(s) disclaim responsibility for any injury to people or property resulting from any ideas, methods, instructions or products referred to in the content. |
© 2025 by the authors. Licensee MDPI, Basel, Switzerland. This article is an open access article distributed under the terms and conditions of the Creative Commons Attribution (CC BY) license (http://creativecommons.org/licenses/by/4.0/).
Copyright: This open access article is published under a Creative Commons CC BY 4.0 license, which permit the free download, distribution, and reuse, provided that the author and preprint are cited in any reuse.


