
Submitted:
11 June 2025
Posted:
11 June 2025
You are already at the latest version
Abstract
In early May 2025, extreme wildfires swept across Manitoba, Canada, fueled by unseasonably warm temperatures, prolonged drought, and stressed vegetation. Using multi-source satellite data, this study analyzes April anomalies in snow cover, precipitation, temperature, LAI, NDVI, and soil moisture to assess their combined role in preconditioning the landscape for fire. Results indicate that reduced vegetative greenness, rainfall deficits, and diminished snowpack created a flammable environment prior to ignition. These findings underscore the importance of integrating climate and biosphere anomalies into wildfire risk monitoring to enhance preparedness in boreal regions under accelerating climate change.
Keywords:
wildfire
; remote sensing
; Canada
; drought
; climate change
; Manitoba
1. Introduction
In early May 2025, severe wildfires broke out in various parts of Manitoba, Canada, and spread rapidly. As of the time of writing, three of the most intense fires have collectively burned approximately 1,400 square kilometers of land and forest (Figure 1). This wildfire caused the deaths of two people and led to the evacuation of approximately 1,000 residents from Lac du Bonnet and surrounding areas [1]. These fires emerged under conditions of ongoing drought and unseasonably warm weather, contributing to rapid fire spread and extensive damage to the landscape. The disaster occurred amid an exceptional heat wave in Manitoba, with temperatures in Winnipeg reaching 37°C (99°F) — the highest recorded in 125 years [1]. A national map, based on data from the Canadian Drought Monitor, showing drought intensity across Canada as of the end of April 2025, with parts of Manitoba marked as abnormally dry (D0) and under moderate drought (D1) conditions (Figure 1a). This event emphasizes the need for improved wildfire preparedness and more comprehensive monitoring of drought trends across Canada, particularly in vulnerable provinces like Manitoba.
Severe wildfires erupted in various locations across Manitoba, in May 2025, showing rapid progression over a short period (Figure 1b). A Landsat 8 image acquired on 4 May 2025 shows the burned area one day after ignition, with initial fire scars and smoke clearly visible (Figure 1c, left). By 10 May, Sentinel-2 imagery reveals that the fire had expanded dramatically to cover 381.5 km2, indicating rapid spread over less than a week (Figure 1c, right). Further east, a fire that started on 12 May had already grown to 952.7 km2 by 14 May, with a clear smoke plume along its southern boundary indicating ongoing fire activity and wind-driven transport (Figure 1d). Another fire that began on 10 May in southeastern Manitoba reached 64.8 km² by 14 May, exhibiting a compact burn pattern within a forest-agriculture interface (Figure 1e).
Advancements in remote sensing technologies have greatly enhanced our ability to monitor and detect wildfires [2,3]. Optical satellite imageries such as Landsat and Sentinel-2 allows for precise delineation of wildfire boundaries and the extent of their spread [4]. Furthermore, remote sensing provides valuable insights into the underlying causes, dynamics, and characteristics that drive wildfire intensification, enabling more effective fire management and mitigation strategies. Understanding how these environmental factors interact with wildfire dynamics is essential, especially in the context of changing climate and land surface conditions that are reshaping fire regimes in boreal ecosystems. Recent shifts in climatic parameters and land surface conditions have significantly altered fire regimes in boreal ecosystems [5]. This study analyzes April anomalies in snow cover, precipitation, temperature, leaf area index (LAI), normalized difference vegetation index (NDVI) and soil moisture across the province of Manitoba to assess their combined role in influencing wildfire risk.
2. Results and Discussion
The spatial anomalies of April 2025 across Manitoba point to a combination of environmental stressors conducive to wildfire ignition and spread (Figure 2). Negative anomalies in LAI (-0.0241), precipitation (-7.6 mm), and temperature (-0.368°C) reflect suppressed vegetation activity, dry atmospheric conditions, and cooler-than-average air temperatures, respectively. Despite the latter, a slightly positive soil moisture anomaly (+0.031) indicates marginal subsurface retention, though likely insufficient to offset surface dryness. These variables suggest that vegetation stress, fueled by moisture deficits, created a flammable landscape particularly vulnerable to ignition sources.
The province exhibited a mean LAI anomaly of -0.024, indicating a general reduction in vegetative greenness and canopy density (Figure 2a). This decline in LAI reflects early signs of vegetation stress or dieback, potentially driven by water scarcity and temperature conditions during the pre-fire season. The precipitation anomaly averaged -7.6 mm, suggesting a province-wide deficit in rainfall relative to the climatological norm. The central and southern regions were particularly affected, as evident in the anomaly map, which shows extensive zones in brown and yellow, signaling significantly drier-than-normal conditions (Figure 2b). Such early-season dryness leads to rapid fuel desiccation, particularly in fine fuels like grasses and small shrubs, which are critical to initial fire ignition and spread. Although not extreme across the province, air temperature anomalies display positive deviations, particularly in southern Manitoba (Figure 2c). These warmer-than-average patches are crucial, as they likely accelerated snowmelt and evaporative losses in April, reducing residual soil moisture ahead of the critical fire-prone period in May. In contrast, soil moisture anomaly averaged slightly positive (+0.031), which initially suggests sufficient subsurface moisture. However, the spatial distribution tells a different story. Significant parts of northern Manitoba exhibit negative soil moisture anomalies, represented by yellow to red tones on the map (Figure 2d). This suggests that, despite the presence of slightly above-average soil moisture in burned areas during April, other compounding factors—such as vegetation density and precipitation deficits—played a more dominant role in creating favorable conditions for fire ignition and spread.
Analysis of April Anomalies Related to Fire Conditions in Manitoba
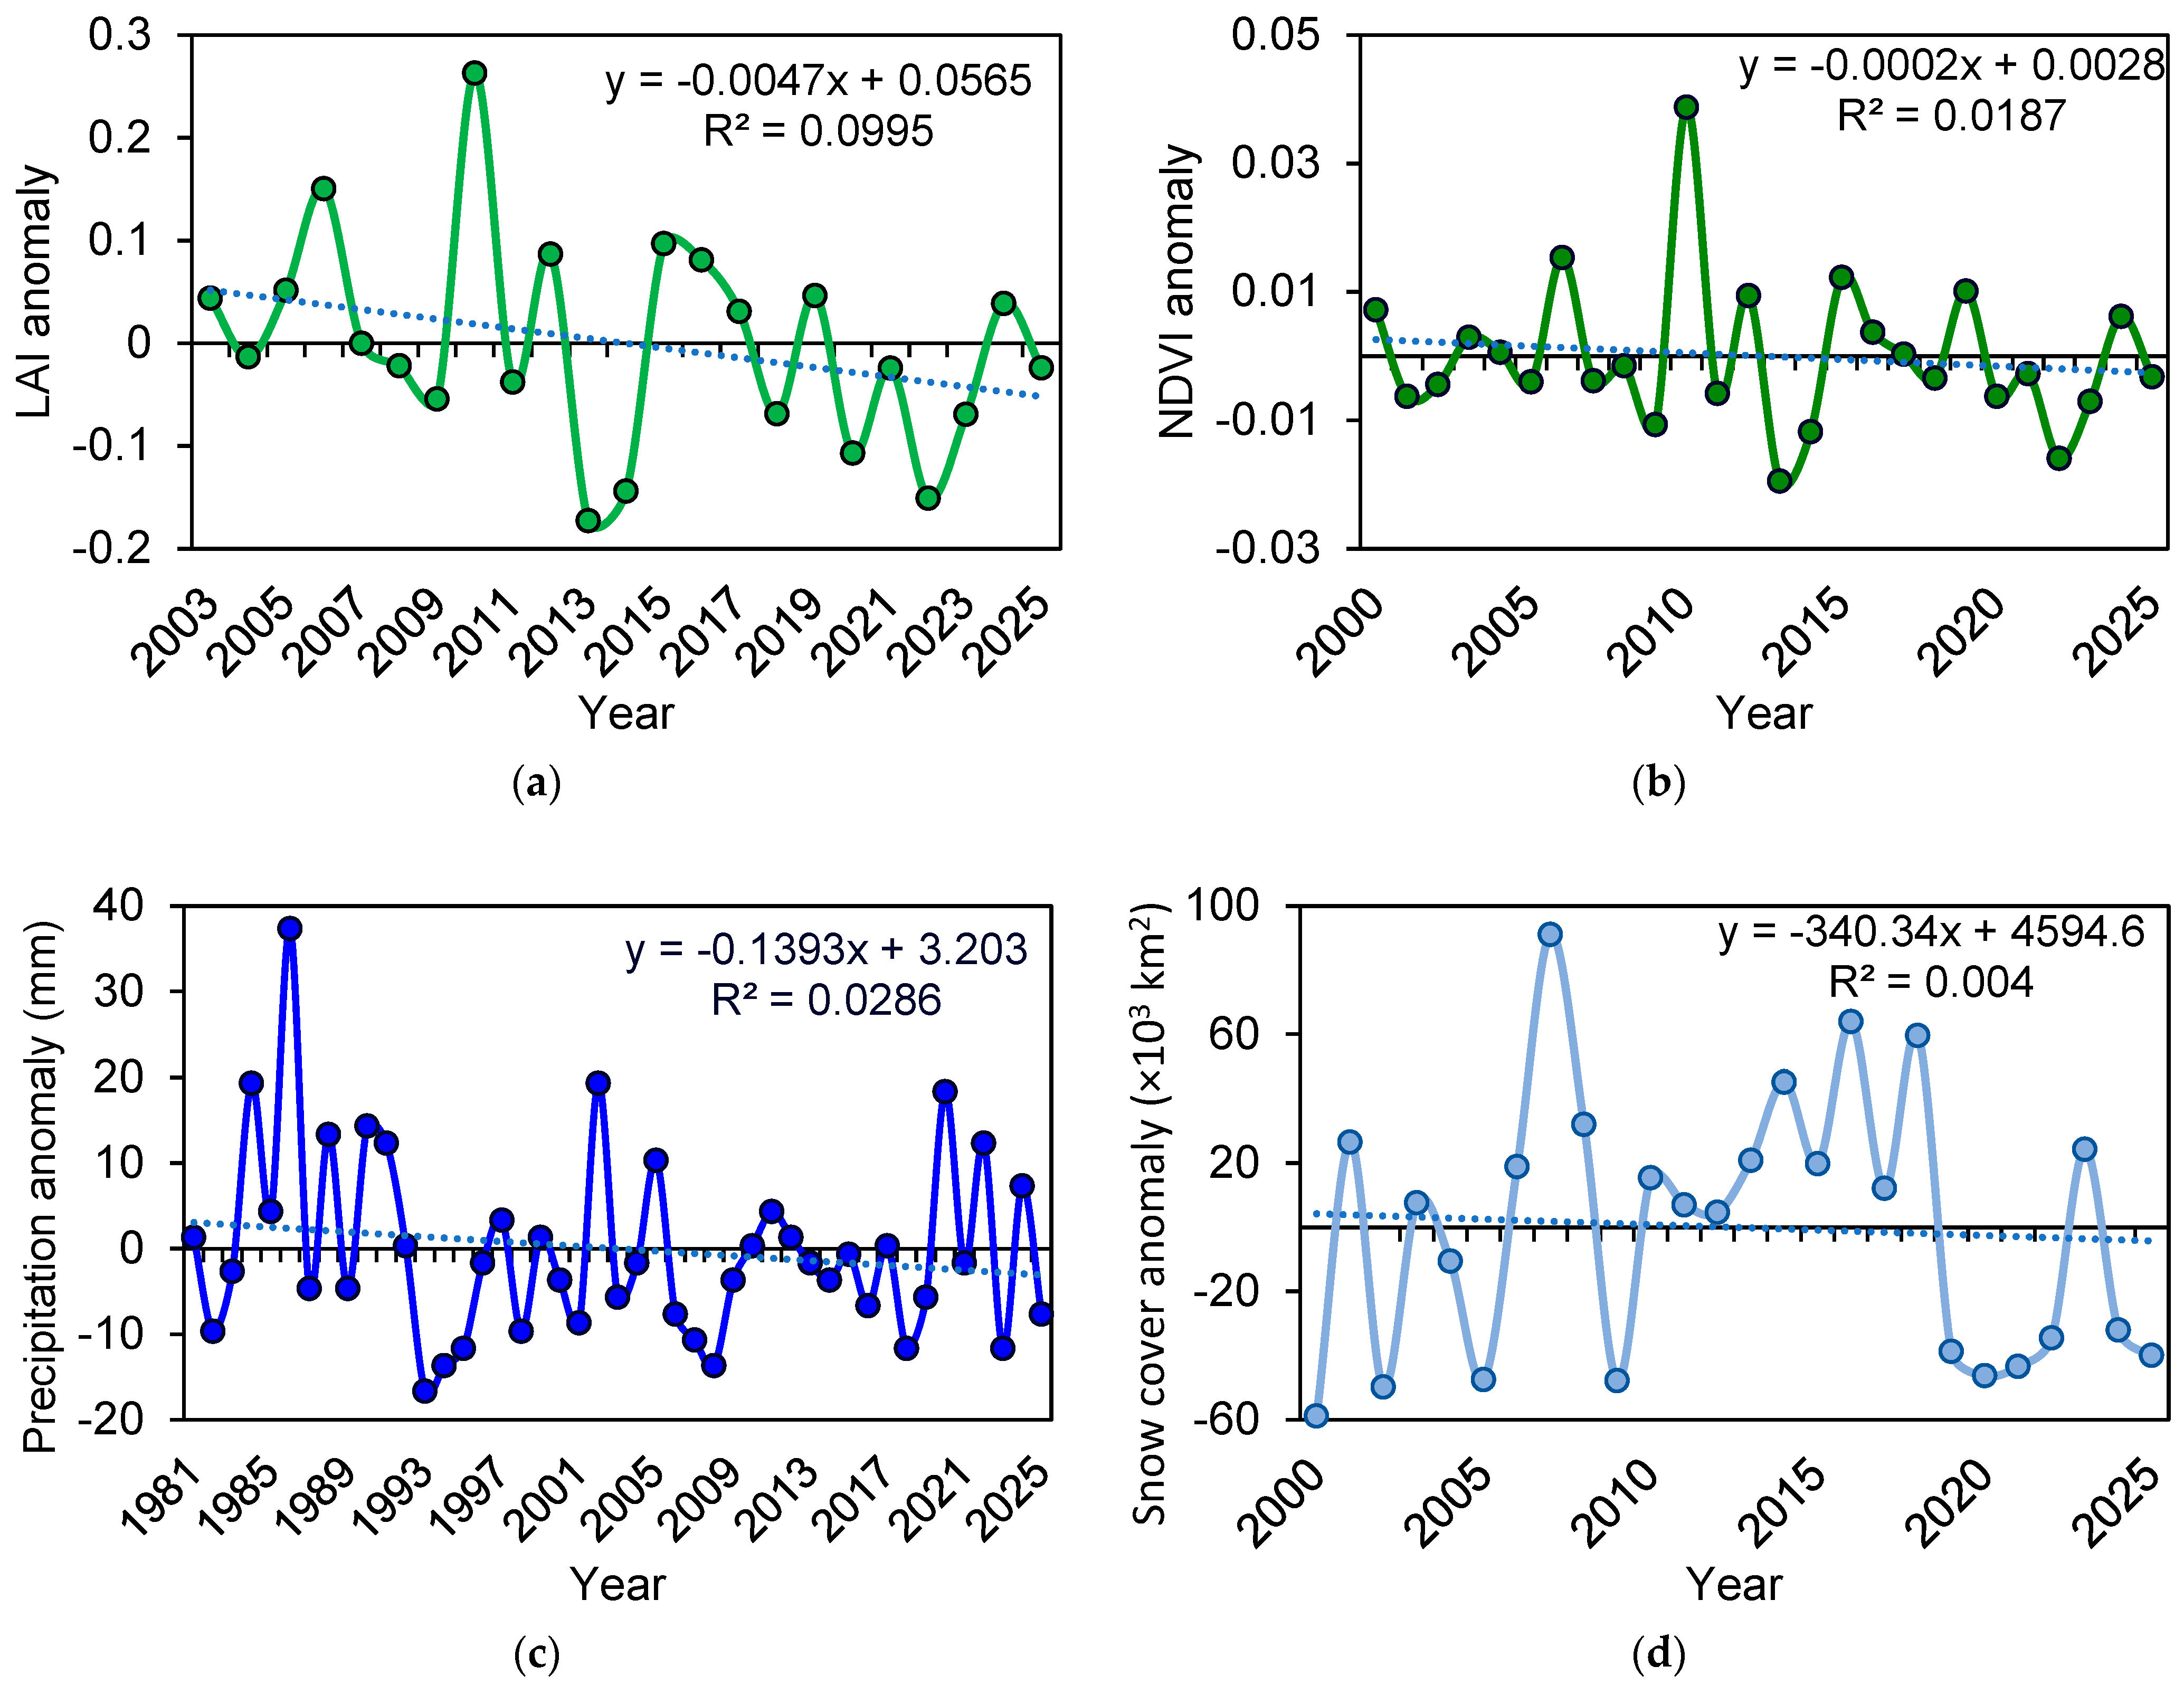
The LAI anomaly data (2003–2025) exhibit stronger interannual deviations compared to NDVI, with a notably negative anomaly in 2025 (-0.0241), consistent with limited leaf development during April (Figure 3a). Peaks in LAI (e.g., 2010, 2006, and 2015) correspond to years with higher spring greenness, while significant troughs (2013, 2014, 2022) are associated with dry Aprils, reinforcing the sensitivity of LAI to spring precipitation and temperature regimes. The NDVI anomaly time series (2000–2025) reveals moderate interannual variability, with pronounced vegetation stress events notably in 2013, 2014, and 2022 (Figure 3b). The 2025 anomaly (-0.0032) is close to neutral but follows several years of fluctuating productivity, indicating possible cumulative vegetation stress or recovery delays from previous droughts. The precipitation anomaly series (1981–2025) highlights frequent negative anomalies in recent decades, with particularly dry Aprils in 1993, 1994, 1995, and 2023 (Figure 3c). The 2025 anomaly (-7.67 mm) is in line with these dry episodes, suggesting a persistent trend of April dryness that may have long-term implications for vegetation regeneration and fire susceptibility in spring. Lastly, snow cover anomalies (2000–2025) demonstrate significant variability, with large deficits in 2000, 2002, and 2005, and surpluses in 2007, 2016, and 2018 (Figure 3d). In 2025, a snow cover anomaly of approximately -39,939 km² points to limited snow retention into April, likely accelerating ground exposure and preheating of fuels before the fire season. This reduced snow insulation, combined with dry and stressed vegetation, likely amplified the vulnerability of Manitoba’s landscape to ignition. Fluctuations in the El Niño–Southern Oscillation (ENSO) may be one of the factors contributing to the recent decline in snow cover extent [6]. Taken together, these indicators suggest that the fire outbreak in May 2025 occurred within a broader climatic context marked by recurring spring drought, declining snow cover, and vegetation stress—factors that collectively predispose the region to increasingly severe and earlier fire seasons.
In conclusion, the environmental context in April 2025—characterized by reduced vegetation health, rainfall deficits, localized drying of soil, and early fuel stress—created a preconditioned landscape highly susceptible to ignition and fire spread. Although moderate in isolation, these conditions likely acted synergistically, explaining the unusual fire activity observed in Manitoba in May. April anomalies in snow cover, hydrometeorological variables, and vegetation indices serve as early warning indicators of wildfire risk. The integration of satellite-derived snow cover anomaly data with climate and biosphere metrics can enhance forecasting and management of springtime fire risk in boreal landscapes like Manitoba. Future research should focus on quantifying the lag effects of snowmelt timing on fire ignition and propagation and integrating these anomalies into operational fire danger rating systems.
3. Conclusions
The May 2025 wildfires in Manitoba resulted from multiple interacting environmental stressors, including reduced April precipitation, early snowmelt, vegetation stress, and declining greenness, all contributing to a highly flammable landscape. While each anomaly alone appeared moderate, their combined impact significantly increased wildfire susceptibility, particularly in forest-agriculture transition zones. This study highlights the critical need for incorporating satellite-derived environmental indicators into operational fire risk assessments to anticipate better and manage spring wildfire outbreaks in boreal ecosystems.
Author Contributions
Conceptualization, A.A. and H.B.; methodology, A.A.; software, A.A.; validation, A.A.; formal analysis, A.A.; investigation, A.A.; resources, A.A.; data curation, A.A.; writing—original draft preparation, A.A.; writing—review and editing, A.A., H.B. and S.J.G; visualization, A.A.; supervision, H.B. and S.J.G; project administration, H.B. and S.J.G; funding acquisition, H.B. and S.J.G. All authors have read and agreed to the published version of the manuscript.
Funding
This research received no external funding.
Data Availability Statement
The datasets used and/or analyzed during the current study are available from the corresponding author upon reasonable request.
Acknowledgments
We gratefully acknowledge NASA for providing MODIS and Landsat satellite data, and the European Space Agency (ESA) for access to Sentinel-2 imagery, which were essential for wildfire monitoring and vegetation assessment. Drought data used in this study were obtained from the Canadian Drought Monitor, made available by Agriculture and Agri-Food Canada. We also acknowledge the Copernicus Climate Change Service (C3S) and the European Centre for Medium-Range Weather Forecasts (ECMWF) for providing ERA5-Land climate reanalysis data.
Conflicts of Interest
The authors declare no conflicts of interest.
References
- Isai, V. Canada’s Wildfire Season Is Off to a Deadly Start. The New York Times, https://www.nytimes.com/2025/05/15/world/canada/canada-wildfires-manitoba-deaths.html?smid=url-share. 15 May 2025. [Google Scholar]
- Amiri, A.; Soltani, K.; Gumiere, S.J.; Bonakdari, H. Forest fires under the lens: needleleaf index-a novel tool for satellite image analysis. npj Nat. Hazards 2025, 2, 9. [Google Scholar] [CrossRef]
- Barmpoutis, P.; Papaioannou, P.; Dimitropoulos, K.; Grammalidis, N. A review on early forest fire detection systems using optical remote sensing. Sensors 2020, 20, 6442. [Google Scholar] [CrossRef] [PubMed]
- Quintano, C.; Fernández-Manso, A.; Fernández-Manso, O. Combination of Landsat and Sentinel-2 MSI data for initial assessing of burn severity. Int. J. Appl. Earth Obs. Geoinf. 2018, 64, 221–225. [Google Scholar] [CrossRef]
- Sayedi, S.S.; Abbott, B.W.; Vannière, B.; Leys, B.; Colombaroli, D.; Romera, G.G.; Słowiński, M.; Aleman, J.C.; Blarquez, O.; Feurdean, A.; Brown, K. Assessing changes in global fire regimes. fire ecol. 2024, 20, 1–22. [Google Scholar] [CrossRef]
- Amiri, A.; Gumiere, S.; Bonakdari, H. White blanket, blue waters: tracing El Niño footprints in Canada. Int. J. Appl. Earth Obs. Geoinf. 2024, 135, 104267. [Google Scholar] [CrossRef]
Figure 1.
(a) Drought intensity across Canada showing areas ranging from abnormally dry (D0) to moderate drought (D1) as of the end of April 2025. Data were extracted from the Canadian Drought Monitor (https://open.canada.ca/data/en/dataset/292646cd-619f-4200-afb1-8b2c52f984a2). (b) Manitoba burned areas were extracted from Landsat 8 and Sentinel-2 satellite images. The boundaries of the wildfires from May 2025 are marked in black, with the area of each wildfire labeled on the map. (c) Landsat 8 imagery from 4 May 2025 shows the initial fire ignition site with an early burned area delineated using Sentinel-2 imagery on 10 May 2025. (d) A significant wildfire expansion is evident in central-eastern Manitoba, as re-vealed by Sentinel-2 imagery from 14 May 2025. (e) Fire event in southeastern Manitoba with a smaller burned area, also mapped from Sentinel-2 data acquired on 14 May 2025. Yellow polygons indicate fire perimeters. The imagery uses a false-color composite with shortwave infrared 2 (SWIR-2), near-infrared (NIR), and blue bands.
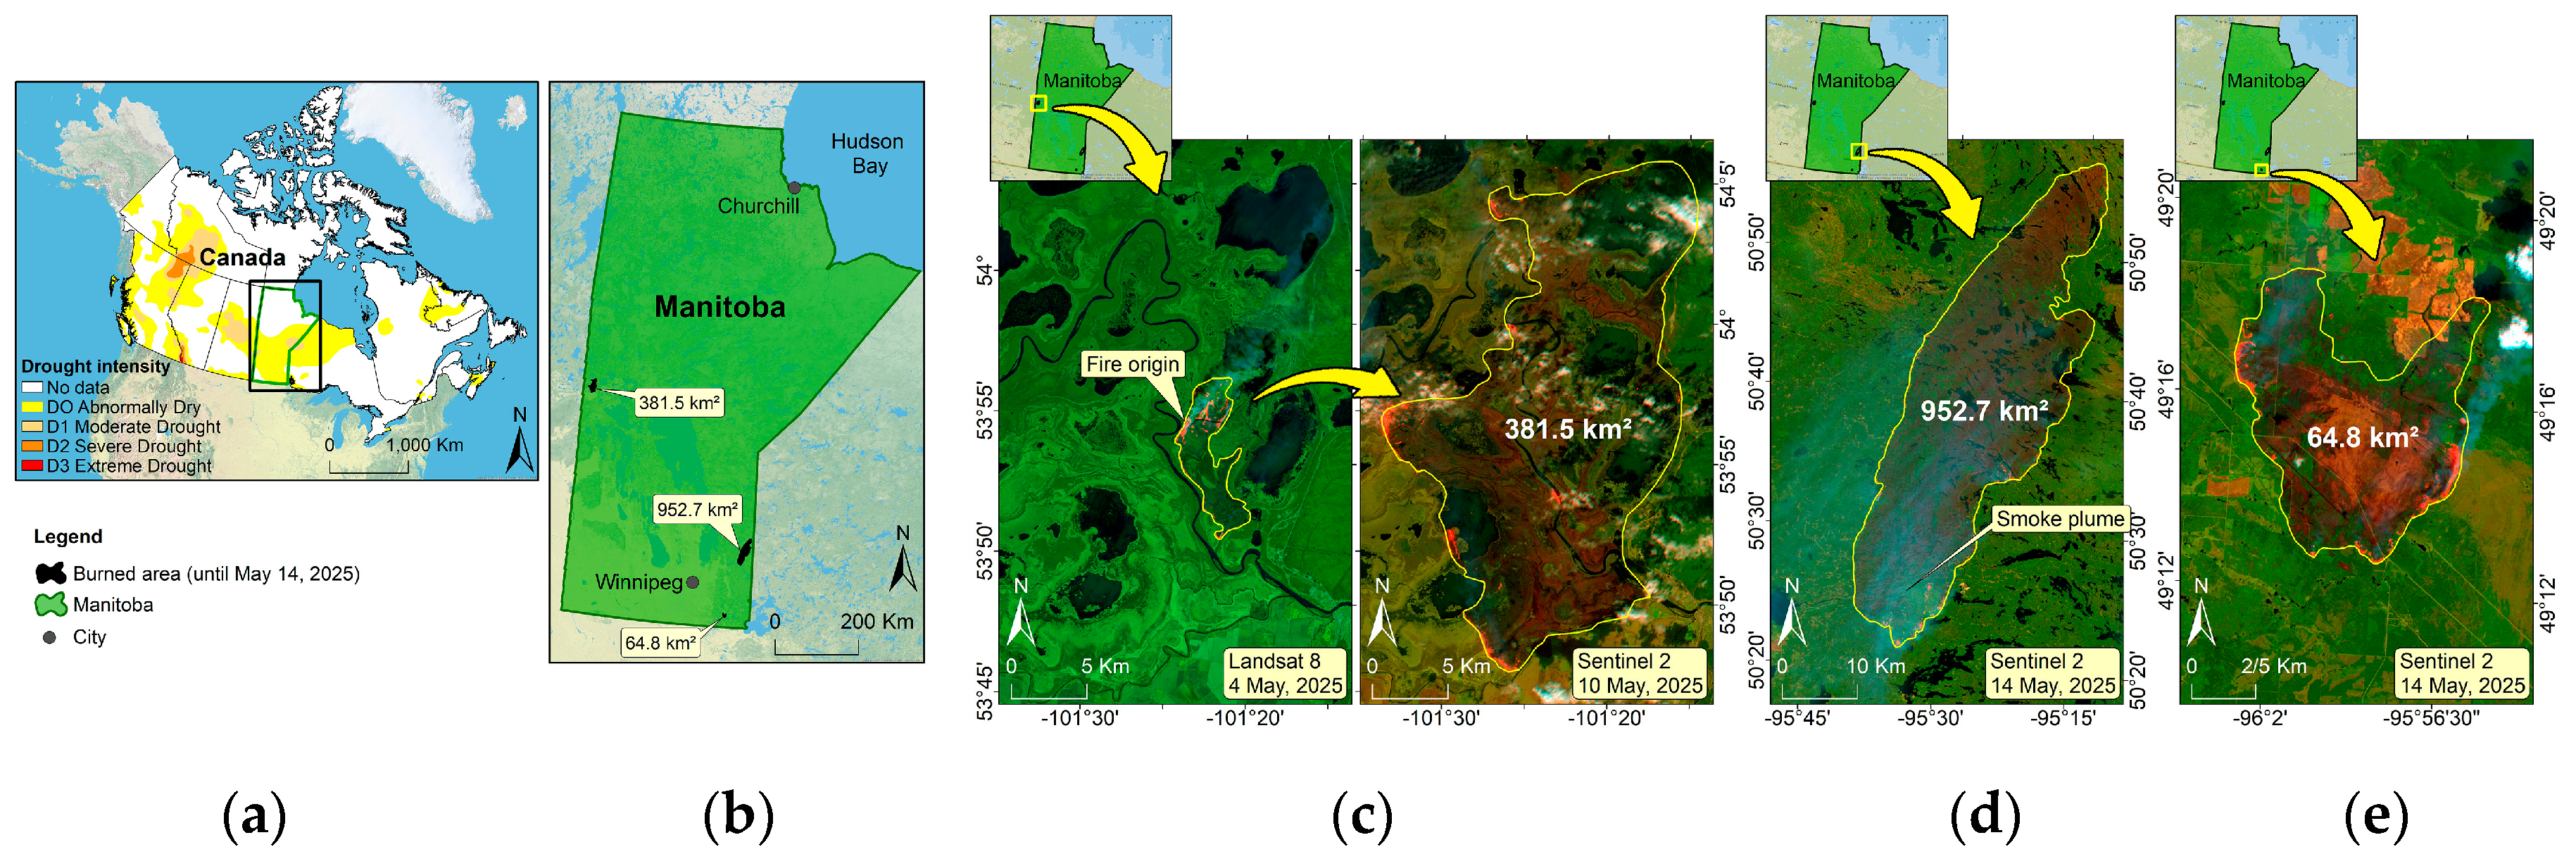
Figure 2.
Spatial anomalies of key environmental variables across Manitoba during April 2025: (a) leaf area index (LAI) derived from the Moderate Resolution Imaging Spectroradiometer (MODIS) product MCD15A3H, (b) precipitation (mm) obtained from the European Centre for Medium-Range Weather Forecasts (ECMWF) ERA5-Land dataset, (c) air temperature (°C) obtained from ERA5-Land, and (d) soil moisture (m3/m3) sourced from the National Oceanic and Atmospheric Administration (NOAA) Climate Forecast System Version 2 (CFSv2). Black squares indicate the wildfire locations.
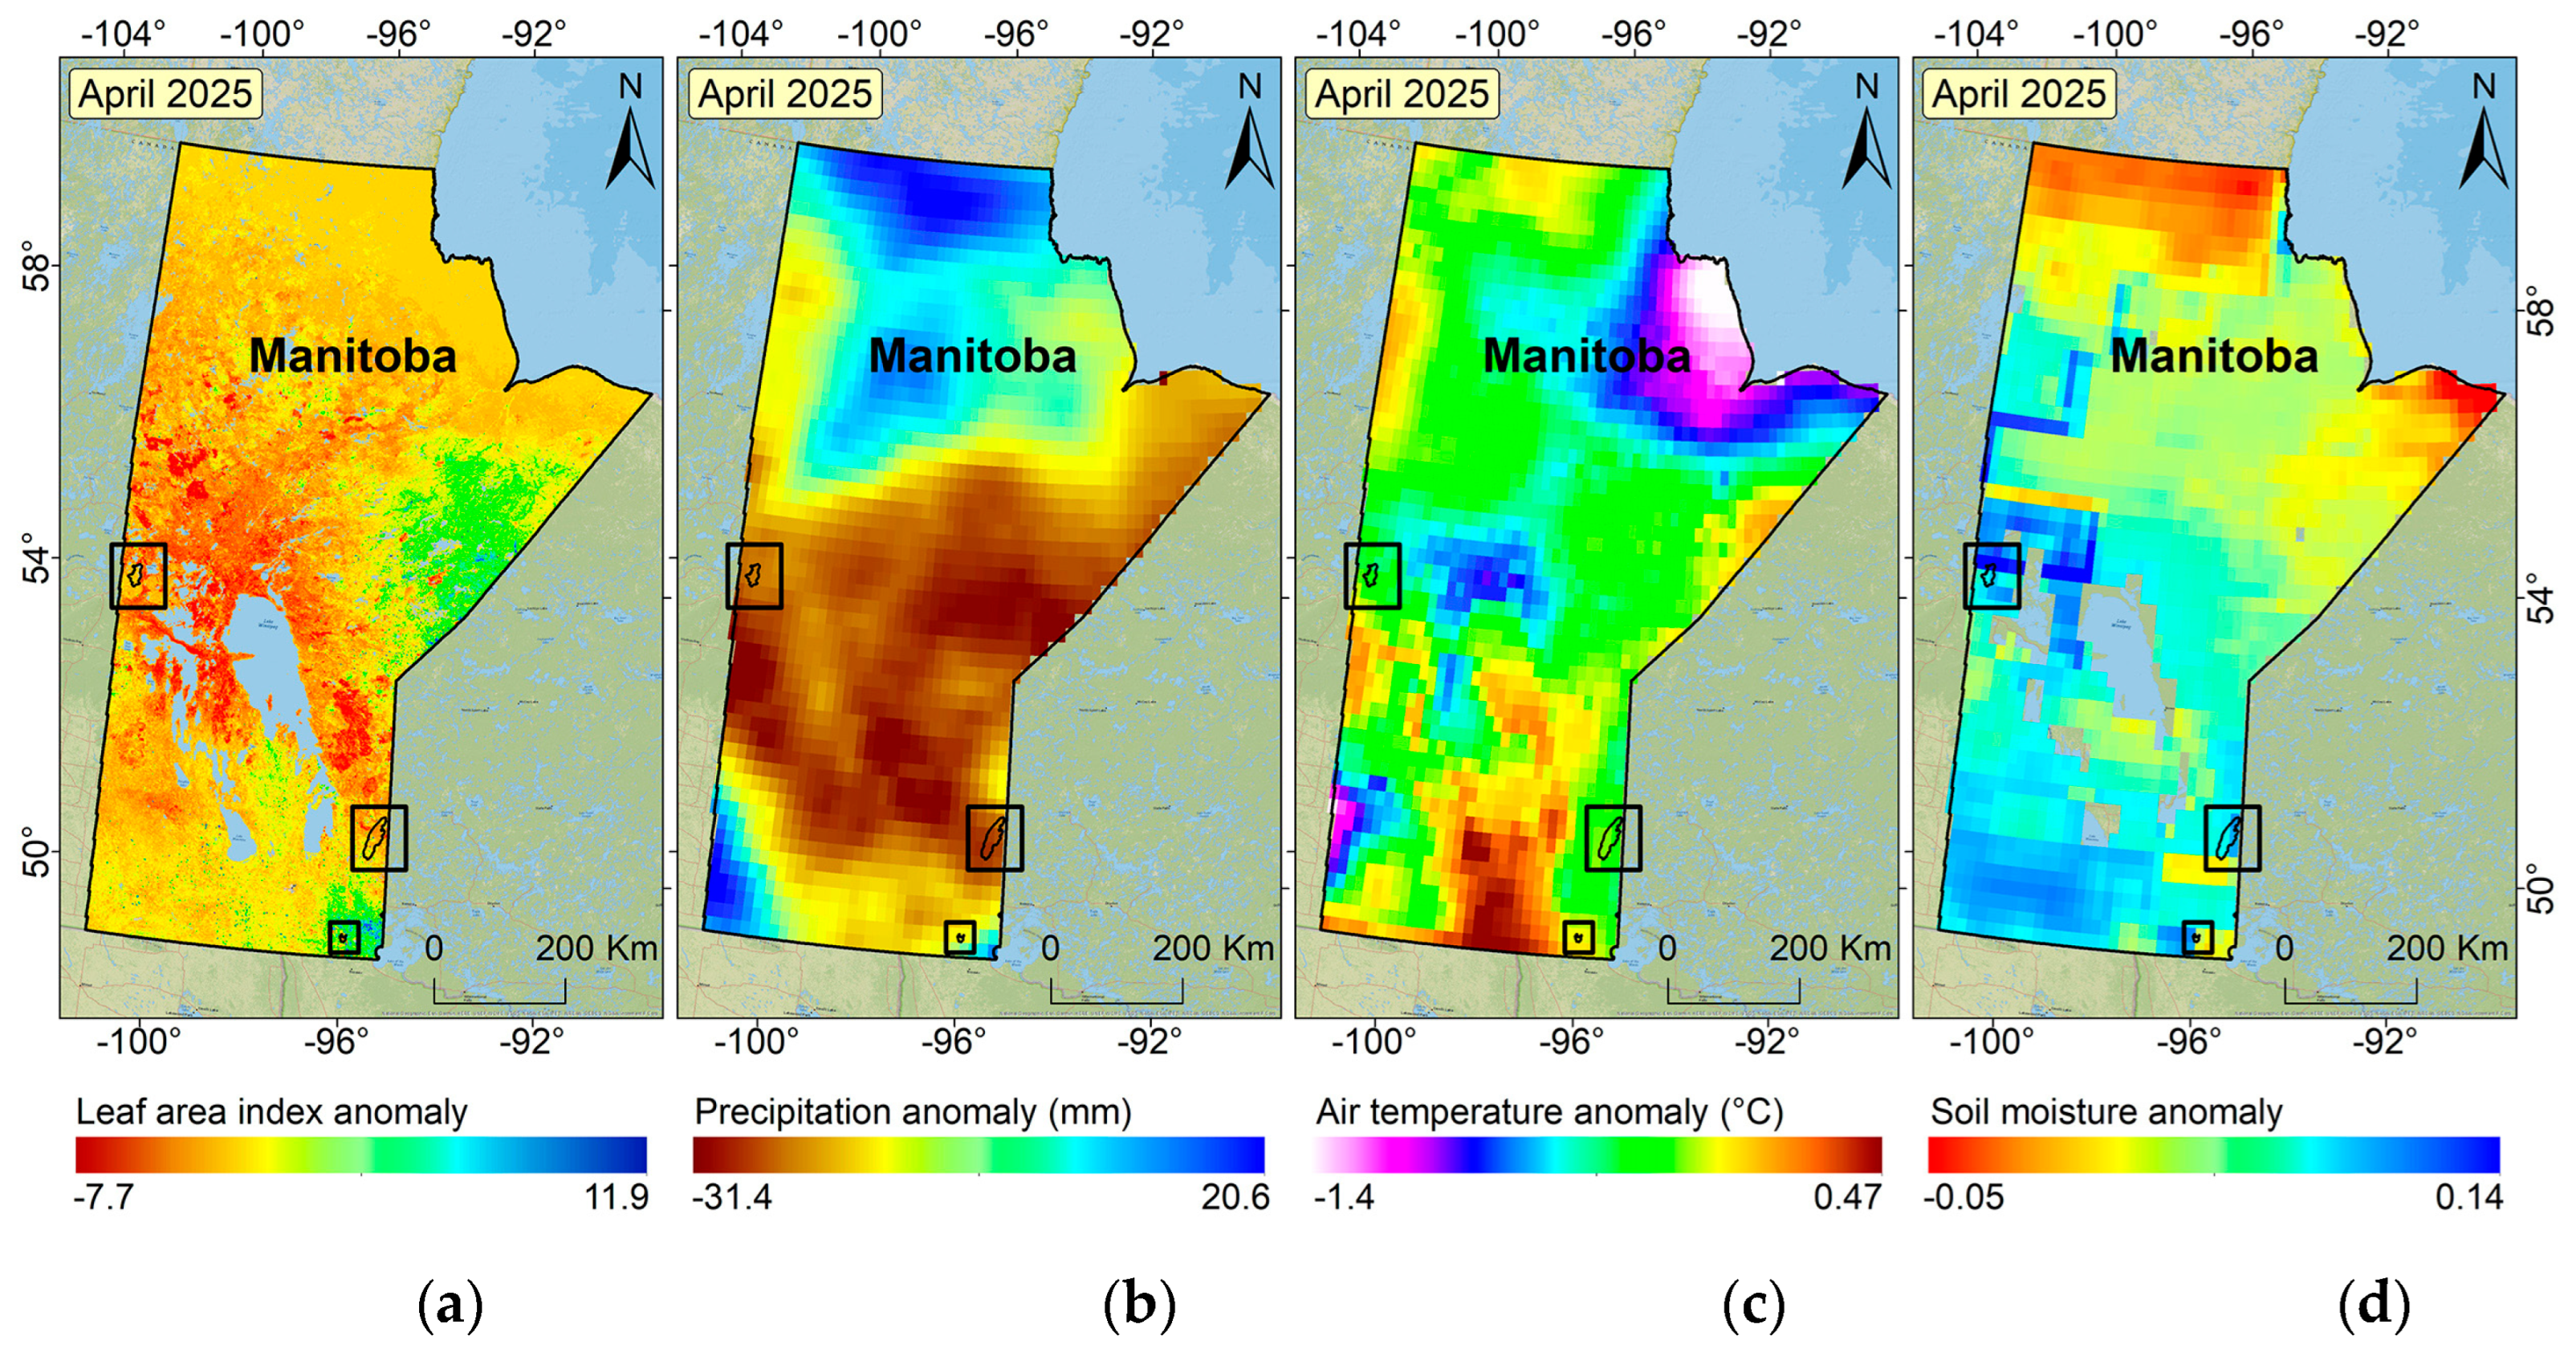
Figure 3.
Interannual anomalies for April in Manitoba for four key environmental variables, (a) leaf area index (LAI), (b) normalized difference vegetation index (NDVI), (c) precipitation, and (d) snow cover extent. LAI anomalies are derived from the MODIS MCD15A3H product; NDVI anomalies are calculated using the MODIS MOD09GQ product; precipitation data are from ERA5-Land; and snow cover anomalies are based on MODIS MOD10A1.
Disclaimer/Publisher’s Note: The statements, opinions and data contained in all publications are solely those of the individual author(s) and contributor(s) and not of MDPI and/or the editor(s). MDPI and/or the editor(s) disclaim responsibility for any injury to people or property resulting from any ideas, methods, instructions or products referred to in the content. |
© 2025 by the authors. Licensee MDPI, Basel, Switzerland. This article is an open access article distributed under the terms and conditions of the Creative Commons Attribution (CC BY) license (http://creativecommons.org/licenses/by/4.0/).
Copyright: This open access article is published under a Creative Commons CC BY 4.0 license, which permit the free download, distribution, and reuse, provided that the author and preprint are cited in any reuse.


