
Submitted:
08 September 2025
Posted:
09 September 2025
You are already at the latest version
Abstract
Wildfire risk assessment requires integrating heterogeneous geospatial data to capture complex environmental dynamics. This study develops a hierarchical multimodal fusion framework combining high-resolution aerial imagery, historical fire data, topography, meteorology, and vegetation indices within Google Earth Engine. We introduce three progressive fusion levels: a single-modality baseline (NAIP-WHP), fixed-weight fusion (FIXED), and a novel geographically adaptive dynamic-weight approach (FUSED) that adjusts feature contributions based on regional characteristics like human activity intensity or aridity. Machine learning benchmarking across 49 U.S. regions reveals that Support Vector Machines (SVM) applied to the FUSED dataset achieve optimal performance, with an AUC-ROC of 92.1%, accuracy of 83.3%, and inference speed of 1.238 milliseconds per sample. This significantly outperforms the fixed-weight fusion approach, which achieved an AUC-ROC of 78.2%, and the single-modality baseline, which achieved 73.8%, representing relative improvements of 17.8% and 24.8\%, respectively. The 10-meter-resolution risk heatmaps demonstrate operational viability, achieving an 86.27% hit rate in Carlsbad Caverns, NM. SHAP-based interpretability analysis reveals terrain dominance and context-dependent vegetation effects, aligning with wildfire ecology principles.
Keywords:
wildfire risk assessment
; multi-source data fusion
; dynamic-weight integration
; geospatial analysis
; interpretable machine learning
1. Introduction
Globally, the escalating frequency and intensity of wildfires have reached alarming levels, as exemplified by the unprecedented 2023 Canadian wildfire season [1]. This disaster burned over 15 million hectares of land, marking the largest area affected since Canada began comprehensive national reporting in 1972 [2]. The catastrophic event blanketed eastern North America in hazardous smoke for months. Modern wildfire behavior increasingly deviates from historical patterns. Between 2003 and 2023, the frequency and intensity of extreme wildfires more than doubled, with the six most severe years all occurring after 2017 [3]. Research indicates that from 2003 to 2019, climate change drove a sustained annual increase of 0.22% in global wildfire-related losses, contributing to a 15.8% expansion in burned areas worldwide during this period [4].
The evolution of wildfire prediction methods has progressed through distinct phases, each overcoming its predecessors’ limitations while introducing new challenges. Early warning systems in the late 20th century relied primarily on meteorological indices such as the Canadian Fire Weather Index [3,5], which achieved modest success in boreal forests but proved inadequate for Mediterranean ecosystems due to their neglect of critical fuel-mediated dynamics. The machine learning revolution of the 2010s brought significant improvements by integrating satellite data and advanced algorithms. Modern deep learning systems can now perform continental-scale predictions [6,7]. However, these methods often rely on oversimplified static assumptions about environmental interactions, particularly in capturing how terrain, vegetation, and microclimate collectively influence fire behavior across diverse landscapes [8].
Currently, three persistent challenges hinder progress in wildfire risk assessment. First, Current single-modal systems such as FireRisk face additional limitations due to their reliance on static Wildfire Hazard Potential (WHP) labels, which inadequately represent cross-modal spatial complexity and hotspot distribution patterns [9]. Second, traditional multimodal systems treat data layers as independent inputs rather than dynamically interacting components, overlooking crucial cross-factor relationships [10,11]. Third, the opacity of many advanced machine learning models has created a significant gap between predictive accuracy and practical utility, especially after high-profile failures like the 2021 Marshall Fire, leading fire managers to increasingly demand interpretable risk assessments [12,13].
To overcome these challenges, this study introduces FireRisk-Multi, an innovative dynamic multimodal fusion framework for high-precision wildfire risk assessment. Our solution integrates four critical data dimensions: high-resolution NAIP imagery [14] for spatial patterns, SRTM elevation and slope data [15] for terrain analysis, ERA5 temperature and precipitation records [16] for meteorological conditions, and MODIS NDVI vegetation indices [17] for ecological monitoring. At its core is a geographically adaptive weighting framework that dynamically adjusts the influence of terrain, vegetation, and meteorological factors based on localized landscape features. For instance, this approach automatically amplifies slope-related weights in rugged terrain while suppressing vegetation signals in industrial zones. The framework generates interpretable 10-meter-resolution risk maps, employing SHAP-driven analysis to visually decompose risk contributions, revealing how terrain factors often dominate predictions while vegetation exhibits complex context-dependent effects [18].
The framework was tested across 49 distinct ecoregions in the United States, using real fire incidents for validation. The results demonstrate that FireRisk-Multi achieves multiple groundbreaking advances. It delivers optimal predictive accuracy using SVM modeling, with an AUC-ROC of 92.1%, outperforming fixed-weight and single-modality baselines by 17.8% and 24.8%, respectively. Its dynamic weighting mechanism enables regional adaptability, validated through spatial pattern analysis and exceptional real-world performance (e.g., an 86.27% hit rate for fire points in New Mexico’s Carlsbad Caverns). Through comprehensive SHAP value analysis, the system provides transparent decision support by quantifying feature influences. Notably, this advanced functionality maintains high operational efficiency, with a rapid inference latency of 1.238 ms per sample, making it ideal for large-scale deployment.
Our validation methodology combines rigorous ablation studies across 49 U.S. ecoregions with real wildfire event verification using historical fire perimeters. The subsequent sections detail this work. Section 2 presents the methodology including the study area selection, multi-source data compilation, hierarchical data fusion framework, innovation validation, and machine learning applications. Section 3 provides the results with comparative analysis, SHAP interpretation, ablation studies, and real-fire validation. Section 4 discusses the implications and limitations of the framework. Section 5 concludes the paper by summarizing key findings and future directions.
2. Methodology
2.1. Study areas
The selected 49 ecoregions (Figure 1) systematically cover key wildfire-prone landscape types in western North America, including: (1) Pacific climate-influenced montane forest zones (e.g., the Sierra Nevada in California and the Colorado Front Range), (2) monsoon-regulated arid shrublands (e.g., the Sonoran Desert in Arizona and the limestone canyons of Carlsbad Caverns), (3) energy industrial corridors with intense anthropogenic disturbances (e.g., the Permian Basin oil fields in Texas), and (4) ecologically sensitive transition zones (e.g., the Florida Everglades wetland-urban interfaces). This gradient-based site selection strategy comprehensively captures the spatial differentiation of core wildfire drivers: climatic stressors (drought-prone deserts), vegetation fuel continuity (NDVI 0.1–0.8), anthropogenic ignition risk (industrial/urban interfaces), and topographic amplification effects (slopes of 0– combined with elevations of 0–4000 m). The study regions are distributed along a continental-scale gradient spanning W to W and N to N.
2.2. Data sources
We compiled this dataset from multiple remote sensing data sources in GEE [19]. We selected data sources with broad geographic and historical coverage while minimizing missing data:
- Remote Sensing Dataset. From the National Agriculture Imagery Program (NAIP) provided by the U.S. Department of Agriculture (USDA) [14], primarily used for agricultural monitoring and land cover analysis. The NAIP dataset contains high-resolution RGB imagery with a sampling resolution of 10m.
- Historical Fire Spot Data. From the Fire Information for Resource Management System (FIRMS) dataset, which provides near-real-time (NRT) active fire data based on observations from MODIS [20] and VIIRS [21,22] satellite sensors. The FIRMS dataset covers the period from November 1, 2000, to the most recent date, with a sampling resolution of 375m.
- Historical Fire Events Data (FireEvents). From MODIS/006/MCD64A1 [23], a MODIS (Moderate Resolution Imaging Spectroradiometer) fire product provided by NASA for monitoring and analyzing global fire activity. This dataset includes burned area data from 2001 to the present and is a key resource for studying fire dynamics and impacts.
- Topographic Data. From the Shuttle Radar Topography Mission (SRTM) [15], with a sampling resolution of 30m.
- ERA5 Weather Data. Provided by the European Centre for Medium-Range Weather Forecasts (ECMWF). ERA5 is the fifth-generation global climate reanalysis dataset widely used in meteorology, climate research, and environmental science, with a sampling resolution of 1km [16].
- Vegetation Data. MODIS NDVI data obtained from NASA’s Terra and Aqua satellites via the MODIS sensor. The specific dataset is MOD13Q1, which provides Normalized Difference Vegetation Index (NDVI) and Enhanced Vegetation Index (EVI) every 16 days, with a sampling resolution of 250m [17].
All variables in this dataset are directly sourced from cited literature and do not include any self-calculated metrics. Although targeted screening was applied during dataset construction, users can flexibly adjust data sources based on their needs using the provided GEE data export code.
2.3. Data Aggregation
This study establishes a hierarchical data fusion framework for wildfire risk assessment, integrating four complementary modalities across spatial, spectral, and temporal dimensions. The framework operates within a unified spatiotemporal reference system (2019-2021, EPSG:32611/WGS84 UTM 11N) and progressively increases complexity through three distinct levels [24].
2.3.1. Single-Modality Baseline Processing (NAIP-WHP)
The NAIP-WHP single-modality dataset is constructed by fusing high-resolution aerial imagery from the National Agriculture Imagery Program (NAIP) with the U.S. Forest Service’s Wildfire Hazard Potential (WHP) data [25]. First, the WHP (2023 version) ZIP code data undergoes rigorous cleaning to filter valid risk values (0-5 range) and standard 5-digit ZIP code formats [25]. Geographic coordinates (longitude/latitude) are obtained via a cached geocoding service, and a dynamic resolution calculation method (adjusting meters/pixel conversion coefficients based on latitude) generates a 10m grid. Bilinear interpolation converts discrete point data into a continuous raster surface, and morphological closing fills data gaps. The processed WHP risk raster is then aligned with NAIP true-color imagery (EPSG:32611 UTM 11N) [24] to produce a single-modality risk assessment product with a 10m spatial resolution, highlighting fire risk characteristics in human activity areas. Figure 2 shows the original NAIP image and the wildfire risk level map after fusion with WHP for region_28 in the Carlsbad Caverns area of New Mexico (bounded by -104.5°W to -104.0°W and 32.0°N to 32.5°N).
2.3.2. Fixed-Weight Multimodal Dataset (FIXED)
Building on the single-modality baseline, five environmental parameters are introduced: ERA5 reanalysis temperature/precipitation data [16], SRTM elevation/slope data [15], and MODIS vegetation index data [17]. All input data are standardized as follows: temperature is converted from Kelvin to Celsius (K→℃), precipitation is converted to mm/day (m/h→mm/day), and NDVI is scaled by 0.0001 (MODIS raw values→standard -0.2 to 1.0 range). A fixed-weight fusion strategy is applied: the WHP risk layer dominates (50%), while temperature, precipitation, elevation, slope, and NDVI share the remaining weights (10% each). Precipitation and elevation use negative weights (higher values indicate lower risk), while other parameters contribute positively. Gaussian filtering (=1) removes meteorological noise, and median filtering (5×5 window) fills missing values, resulting in a risk assessment product with clear physical interpretability.
Figure 3 demonstrates the static weight allocation across modalities in the Fixed-Weight Fusion strategy for the Carlsbad Cavern District, New Mexico (-104.5, 32.0, -104.0, 32.5). The weights for terrain (Elevation), meteorological (Temperature), and vegetation (NDVI) modalities were uniformly fixed at 10%, without considering spatial heterogeneity.
2.3.3. Geographically Adaptive Dynamic-Weight Dataset (FUSED)
This dataset innovatively introduces a spatially adaptive weighting mechanism that dynamically adjusts modality contributions based on geographic features.Effective wildfire risk assessment requires adaptive weighting schemes that account for spatial and temporal variations in environmental drivers. Traditional static-weight approaches often fail to capture critical regional differences—for instance, terrain slope may dominate fire spread in mountainous areas, while vegetation moisture is more influential in coastal ecosystems. To address this, we propose a dynamic-weight allocation method that automatically adjusts factor contributions based on real-time geospatial data.
The system employs a hierarchical adjustment mechanism that responds to three key dimensions.
- Climate-driven adaptation. During drought conditions (e.g., precipitation <30th percentile), vegetation and temperature weights increase by 5–10%, while precipitation influence decreases proportionally.
- Topographic feedback. In high-elevation zones (), slope and elevation weights scale with terrain complexity, increasing up to 15% in rugged terrain.
- Vegetation dynamics. NDVI-based fuel moisture thresholds trigger risk weight adjustments—when vegetation dryness exceeds seasonal norms, fire susceptibility weights rise by 8–12% [26].
Unlike fixed-weight systems, this method provides continuous calibration—industrial zones maintain high anthropogenic risk weights (0.5–0.6), while Mediterranean forests dynamically balance slope (0.15–0.25) and vegetation dryness (0.1–0.15) based on real-time conditions.
The dynamic weight allocation module uses a convolutional neural network to analyze ground features in NAIP imagery in real time, enabling fine-grained weight adjustment at a 1km grid level. Quantile stretch normalization (2%-98% range) ensures comparability of risk values across ecological zones, producing a fire risk assessment product with significantly enhanced spatial heterogeneity.
Here’s a concrete example implementation for Carlsbad Caverns, New Mexico ( -104.5°W – -104.0°W, 32.0°N – 32.5°N) (Features: Limestone arid valley (), sparse shrubs (), concentrated tourist facilities), based on the Dynamic Weight Allocation Framework and the visualized weight distribution in As shown in Figure 4 dynamic weight adjustments through geographic characteristics.
All datasets adhere to standardized preprocessing: 2019-2021 temporal coverage, EPSG:32611 spatial reference, 10m resolution grid alignment and undergo unified post-processing: 256×256 pixel tiling, an improved five-level classification system (very low/ low/ medium/ high/ very high risk) (Table 1), and edge padding with Gaussian filtering to eliminate boundary artifacts.
2.4. Innovation Validation
2.4.1. Comparative Feature Importance Analysis
The comparative analysis of feature importance (Figure 5) highlights key differences between the dynamic (FUSED), unimodal (NAIP-WHP), and fixed-weight (FIXED) models. The FUSED model demonstrates a balanced integration of multimodal features, with spatial_complexity_fused (0.12) emerging as the most influential factor, followed by max_hotspot_perimeter_fused (0.11) and hotspot_density_fused (0.06). This reflects its ability to dynamically adapt to spatial and environmental variations by combining terrain (elevation_var, 0.06), vegetation (vegetation_suppress, 0.04), and fire behavior metrics. In contrast, the unimodal NAIP-WHP model relies heavily on a single remote-sensing feature (low_ratio_whp, 0.14), while the FIXED model prioritizes static geometric properties (area_perimeter_ratio_fixed, 0.11) with less emphasis on environmental dynamics.
2.4.2. Quantitative Validation Metrics
In Figure 5, the dominance of spatial_complexity_fused (0.12) in the FUSED model, coupled with its broader distribution of secondary features (e.g., risk_score_fused, 0.05; moderate_ratio_fused, 0.05), empirically validates the dynamic weighting mechanism’s superiority. Unlike the NAIP-WHP model, where the top feature’s importance is 3.5× higher than the average of other features (0.14 vs. 0.04), the FUSED model maintains a more balanced hierarchy, with eight features exceeding 0.04 importance compared to only four in FIXED. This aligns with the FireRisk-Multi dataset’s design, which integrates remote sensing (RGB), terrain (elevation), meteorological (temperature), and vegetation (NDVI) data to overcome the limitations of unimodal (NAIP-WHP) and static multimodal (FIXED) approaches.
2.4.3. Conclusion of Innovation Validation
In Figure 5, the results confirm that dynamic weighting enhances wildfire risk assessment by adaptively prioritizing spatial and environmental features, mitigating overspecialization (as seen in NAIP-WHP), and outperforming fixed-weight fusion in multimodal integration. The empirical importance values directly support the FUSED model’s capability to provide a more nuanced and responsive risk evaluation framework.
These results confirm that the dynamic weighting mechanism successfully addresses the limitations of both unimodal (overspecialization) and static multimodal (environmental insensitivity) approaches, establishing a new paradigm for adaptive wildfire risk assessment. The measured importance values provide concrete evidence of enhanced feature representation and environmental responsiveness, showcasing the dynamic model’s ability to provide a more comprehensive and nuanced understanding of wildfire risk. This integrated approach not only enhances the representation of key risk factors but also ensures a more balanced and dynamic integration of multi-modal data, leading to a more accurate and responsive wildfire risk assessment framework.
2.5. Machine Learning Application
2.5.1. Data Preprocessing
The multi-modal geospatial dataset undergoes a hierarchical standardization process to address heterogeneity across spectral, topographic, and meteorological domains. Fire event labels are binarized (1 for burned areas, 0 otherwise) following established protocols in wildfire studies. Spatial metrics extraction employs morphological operations to quantify five critical landscape characteristics: ➀ hotspot cluster count derived from connected component analysis; ➁ mean perimeter length of risk patches using regionprops algorithms; ➂ total high-risk pixel area (risk class ≥ 4); ➃ patch shape eccentricity calculated through principal component analysis of binary risk masks; and ➄ spatial aggregation index computed via Ripley’s K-function. Cross-modal interaction features, such as the dynamic-to-fixed risk ratio, are incorporated to capture nonlinear relationships between WHP-derived and physically-based risk estimates. A RobustScaler with 5th-95th percentile clipping mitigates outlier effects, while SMOTE oversampling with adaptive k-neighbors () balances class distribution, yielding a 42-dimensional feature space optimized for wildfire prediction.
2.5.2. Machine Learning Applications
This study employs a four-phase progressive validation framework to systematically evaluate wildfire risk assessment performance across model classes, as shown in Figure 6.
- (1)
- (2)
- (3)
-
Phase 3 - Deep Learning.
- DNN: 256-128 fully connected layers with batch normalization and 30% Dropout (Kaiming initialization) [31].
- BiLSTM: 128-unit hidden layers [34].
All models use AdamW (lr=0.001) and BCELoss. - (4)
Training uses 5-fold stratified cross-validation (AUC-PR as the core metric). Deep models employ dynamic LR decay (epoch=500, batch=128), and SHAP analyzes feature importance.
3. Results
3.1. Comparative Analysis
The comparative analysis of the three datasets (FUSED, NAIP-WHP, and FIXED) reveals distinct performance characteristics across various machine learning models, with the FUSED dataset demonstrating superior predictive capability for wildfire risk assessment. The FUSED model achieves the highest AUC-ROC score of 92.1% with SVM, significantly outperforming the best results from NAIP-WHP (80.1% with RandomForest) and FIXED (87.4% with RandomForest), indicating its enhanced ability to discriminate between high-risk and low-risk areas. This performance advantage is particularly evident in precision metrics, where the FUSED model maintains a better balance between recall (79.6%) and precision (87.1%) compared to other datasets, suggesting more reliable identification of true fire-prone regions while minimizing false alarms. The integration of multi-modal data in the FUSED approach appears to capture complex fire-risk determinants more effectively, as evidenced by its consistent top performance across all evaluation metrics including F1-score (82.4%) and MCC (68.1%), which are particularly important for imbalanced fire prediction tasks.
The superiority of the FUSED dataset becomes especially apparent when examining model consistency - while other datasets show greater performance variability across different algorithms, the FUSED results remain robust regardless of model architecture. This stability suggests that the fused data representation provides more generalizable features that various machine learning approaches can effectively utilize. The dataset’s advantage is most pronounced in complex models like SVM, where it achieves a 24.3% higher AUC-ROC compared to the same model on NAIP-WHP data, indicating that the integrated features in the FUSED dataset better support sophisticated pattern recognition. Furthermore, the FUSED dataset maintains its performance edge while requiring comparable computational resources, with inference times (1.238 ms/sample for SVM) remaining practical for operational deployment despite the richer feature space.
From a geospatial hazard assessment perspective, the FUSED dataset’s strong performance across multiple evaluation dimensions suggests it provides the most comprehensive representation of wildfire risk factors. The dataset’s ability to maintain high specificity (87.5%) while achieving good recall indicates it can effectively identify at-risk areas without excessive overprediction - a critical requirement for practical risk management applications. The G-mean scores, which balance performance across classes, are consistently highest for the FUSED dataset (83% for SVM), demonstrating its particular strength in handling the inherent class imbalance in wildfire prediction. These results strongly support the value of multi-data integration in wildfire risk modeling, as the FUSED approach combining spectral, topographic, meteorological and vegetation indices appears to capture synergistic relationships between different risk factors that individual data modalities cannot represent independently. Complete metrics for all models on the three datasets are provided in (Table 2, Table 3 and Table 4).
3.2. SHAP Analysis of Multimodal Feature Fusion
The SHAP value analysis demonstrates that fused multimodal datasets consistently enable more nuanced feature interactions across all model architectures compared to single-modality approaches. LightGBM_fused (Figure 7) reveals the fused dataset’s capacity to enhance traditional spatial metrics, with max_hotspot_perimeter_fused emerging as the dominant predictor, while simultaneously maintaining balanced contributions from both ratio-based features (high_ratio_fused, low_ratio_fused) and composite metrics like risk_contrast. This contrasts with LightGBM_whp’s (Figure 8) more limited single-modality pattern, where spatial features (solidity_whp, avg_hotspot_area_whp) compete directly with ratio metrics without demonstrating clear hierarchical importance.
The fused dataset’s superior information synthesis is most prominently exhibited in SVM_fused (Figure 9), where very_high_ratio_fused achieves the largest absolute impact (SHAP range ±0.10) while maintaining meaningful negative associations for opposing features. Crucially, the model demonstrates simultaneous sensitivity to both traditional spatial descriptors (solidity_fused) and novel cross-modal indicators (risk_contrast), with all features distributed across the SHAP value spectrum without zero-point clustering. This balanced utilization is absent in LSTM_fused’s (Figure 10) implementation, where despite using the same fused inputs, most features cluster near zero impact (±0.005 SHAP) except spatial_complexity_fused ( 0.010 SHAP), suggesting the fusion benefits are architecture-dependent.
Transformer_fused (Figure 11) showcases the fused dataset’s capacity to amplify extreme-value detection, with very_high_ratio_fused reaching ∼0.4 SHAP values . The spatial cohesion metric solidity_fused maintains ∼0.2 SHAP importance while participating in clear negative relationships (features reaching ∼-0.2 SHAP), demonstrating the fused dataset’s ability to preserve geometric relationships while enabling stronger class differentiation than seen in either LightGBM variant. This multi-scale sensitivity - combining macroscopic ratio features with microscopic spatial attributes - appears unique to the fused modality, as no single-modality configuration in the visualizations demonstrates comparable feature range or magnitude differentiation.
The consistent emergence of risk_contrast as a meaningful predictor across multiple fused implementations (LightGBM_fused, SVM_fused, Transformer_fused) confirms the fused dataset’s ability to generate novel, model-agnostic signals absent in whp-only configurations. This cross-modal feature’s persistence alongside traditional spatial metrics suggests the fused approach doesn’t merely add features but creates qualitatively new decision boundaries. The architectural variations in leveraging these fused features - from SVM’s balanced utilization to Transformer’s extreme-value emphasis - demonstrate the dataset’s flexibility while maintaining core advantages over unimodal inputs.
3.3. Ablation Study
The progressive feature integration analysis reveals distinct performance patterns across different model architectures. Starting with the baseline wildfire risk features (G4), all models show significant improvement after incorporating terrain features (G1), especially the Support Vector Machine (SVM), whose AUC-ROC value increased from 49.1% to 70.9%, a gain of 44.3 percentage points. This terrain-enhanced configuration establishes fundamental predictive capability, with the RandomForest achieving an AUC-ROC of 73.7% and PyTorchDNN showing an unexpected recall amplification to 90%, despite its moderate accuracy of 44.9%.
As shown in Figure 12, the subsequent addition of meteorological features (G2) further boosts the performance of most models. PyTorchDNN achieves its best AUC-ROC of 81.2%, while the performance of SVM also significantly improves, with an AUC-ROC of 80.8% and an F1 score of 71.5%. This indicates that meteorological features have a substantial promoting effect on model performance. Notably, LightGBM maintains a high recall rate of 95% across all configurations but struggles with specificity, suggesting potential overfitting to positive cases. The full-feature configuration (G4+G1+G2+G3) yields divergent outcomes: although LightGBM reaches the highest AUC-ROC in this study (85.0%), SVM demonstrates the best operational balance with an AUC-ROC of 90.1%, an F1 score of 80.0%, and a Matthews Correlation Coefficient (MCC) of 64.1%—indicating optimal calibration for real-world deployment. Full metrics for all models are provided in Table 5.
As shown in Figure 13, the feature importance analysis shows that core risk factors (G4) dominate predictive power (accounting for 48.2-61.4%), with terrain features (G1) contributing significantly (19.2-28.3%). The utility of meteorological features varies depending on the model (importance ranging from 9.5% to 18.3%), while vegetation indices exhibit paradoxical behavior—despite moderate importance scores (6.9-9.6%), their inclusion benefits LightGBM but degrades the performance of SVM and PyTorchDNN. This suggests that vegetation data may require model-specific preprocessing or interact nonlinearly with other features.
The performance trajectory of PyTorchDNN warrants special attention: it peaks at 81.2% in the G4+G1+G2 configuration and then drops to 71.3% in the full-feature configuration, a decline of 9.9 percentage points. This indicates that deep learning models can be highly sensitive to feature dimensionality in data-constrained scenarios. In contrast, tree-based models show more stable performance improvements, with RandomForest maintaining an AUC-ROC of 79.7% in the final configuration. These findings collectively suggest that optimal feature sets are model-dependent, with simpler architectures benefiting from full feature inclusion, while complex models require careful feature selection.
3.4. Real-Fire Event Validation
We evaluated the operational applicability of the FUSED dataset through wildfire prediction accuracy analysis across five representative high-risk ecoregions. The validation utilized MODIS/VIIRS fire masks (2019–2021) obtained from Google Earth Engine (GEE), generated by combining MODIS (MCD64A1) [23] and VIIRS (VNP14A1) [21,22] datasets. Burned areas were defined as pixels where either dataset detected fire activity.
The model demonstrated consistent predictive capability across diverse environments. The FUSED dataset exhibited robust wildfire prediction capabilities across diverse geographical contexts, with particularly strong performance in ecologically sensitive regions. As shown in Table 6, In the Carlsbad Caverns area of New Mexico, the model successfully identified 32,351 out of 37,500 fire pixels (86.27% detection rate), demonstrating exceptional accuracy in limestone arid valley ecosystems. Industrial zones such as the Gulf Coast Refinery region in Texas maintained a 77.61% hit rate despite complex anthropogenic interference. Protected areas proved especially suitable for the model’s detection algorithms, with Big Bend National Park in Texas achieving 82.49% accuracy across its desert-mountain terrain. High-altitude environments, represented by the Lake Tahoe West region spanning the California-Nevada border, yielded a 75.14% precision rate, confirming the model’s adaptability to elevation variations.
The assessment followed a rigorous protocol to ensure methodological consistency. Fire masks were generated through logical OR operations applied to MODIS (MCD64A1 [23], ) and VIIRS (VNP14A1, FireMask = 1) datasets [21,22], with subsequent spatial clipping to regional bounding boxes.
The validation process involved aligning model predictions (at a 10m resolution) with GEE fire masks (at a 500m resolution) using majority voting within each 500m grid, and defining hits as any 10m prediction pixel that overlaps a 500m fire mask grid.
3.5. Indirect comparison with existing benchmarks
Although FireRisk-Multi differs from FireRisk in data structure and evaluation goals [9] Table 7 , the shared evaluation dimensions can reveal relative advantages.
Note: Direct performance comparison is not feasible due to the following reasons:
- FireRisk only supports end-to-end image classification tasks.
- Our framework outputs continuous risk probability values (0-1).
- FireRisk uses 7-class discrete risk labels, while we adopt the 5-class WHP2023 standard.
4. Discussion
This study has achieved significant progress in wildfire risk assessment through multimodal data fusion and machine learning methods, while also revealing several key scientific questions and technical challenges that warrant further exploration. Our ablation experiments clearly demonstrate the differential impact of feature groups on model performance, with topographic features (G1) playing a foundational role. However, the standout performance of meteorological features (G2), which improved AUC-ROC by 44.3 percentage points in the SVM model, aligns closely with classical wildfire behavior theory emphasizing weather conditions’ dominance in fire spread dynamics [37]. Notably, vegetation features (G3) exhibit strong model dependency: while enhancing LightGBM performance, they degrade PyTorchDNN performance by 32.06 percentage points, highlighting that feature engineering must account for model-specific characteristics to avoid counterproductive outcomes from indiscriminate feature stacking.
Different algorithms exhibit distinct behavioral patterns, with SVM achieving the best robustness and balance at 90.1% AUC-ROC using full feature configuration, while LightGBM attains 95% recall but suffers from lower specificity indicating positive sample overfitting. PyTorchDNN shows a particularly notable trajectory, peaking at 81.2% AUC-ROC with G4+G1+G2 features but declining when vegetation features are added, revealing deep learning models’ vulnerability in high-dimensional feature spaces. SHAP analysis further elucidates complex feature interactions, showing high importance for topographic features like max_hotspot_perimeter_fused alongside consistent influence from cross-modal features like risk_contrast, demonstrating that effective wildfire risk assessment requires a multi-factor synergistic framework rather than reliance on any single feature type.
The developed 10-meter resolution risk assessment frame achieves an 86.27% fire detection rate in case regions like Carlsbad Caverns while providing novel micro-terrain effect insights for fire spread path prediction. However, real-time responsiveness remains constrained by ERA5 meteorological data update frequency limitations that may delay critical emergency decisions. Looking ahead, this work points to three crucial development paths: global validation to ensure generalizability, real-time system development for dynamic monitoring, and human activity factor integration to refine predictions. A lightweight sub-50K parameter version currently in development will enable drone-based deployment to address remote area monitoring gaps [38], collectively advancing wildfire risk management from static assessment to dynamic early warning, regional empiricism to universal principles, and single-hazard focus to integrated emergency response.
5. Conclusions
The proposed FireRisk-Multi framework represents a significant innovation in wildfire risk assessment through systematic integration of remote sensing, topographic, meteorological and vegetation data. Its dynamic feature weighting mechanism automatically adjusts importance based on geographic context, boosting topographic weights in complex terrain and meteorological weights in flat regions to achieve 92.1% AUC-ROC with SVM - a 17.8-point improvement over fixed-weight models. The system’s 10-meter resolution capability demonstrates 86.27% fire-hit accuracy in validation cases while SHAP analysis provides explainable decision support by quantifying nonlinear feature interactions and confirming topography’s foundational role alongside meteorological drivers’ regulatory effects. These advances not only deliver a powerful new tool for wildfire prevention but also establish a transferable methodology for other natural disaster risk assessments, offering increasingly vital high-precision, interpretable and scalable solutions as climate change intensifies. The comparative model behavior insights, particularly deep learning’s sensitivity to feature dimensionality versus ensemble methods’ robustness.
Author Contributions
Conceptualization, Yutong Pang and Jing Pang; methodology, Ke Yuan and Zhiruo Zhu; formal analysis, Zhiruo Zhu, Yutong Pang, Jing Pang, and Chunhui Hou; data curation, Zhiruo Zhu and Jing Pang; resources, Zhiruo Zhu, Yutong Pang, and Chunhui Hou; validation, Zhiruo Zhu and Chunhui Hou; visualization, Zhiruo Zhu; writing—original draft preparation, Zhiruo Zhu, Yutong Pang, and Jing Pang; writing—review and editing, Ke Yuan and Qian Tang; supervision, Ke Yuan and Qian Tang; project administration, Ke Yuan and Qian Tang; funding acquisition, Qian Tang. All authors have read and agreed to the published version of the manuscript.
Funding
This research was funded by the National Natural Science Foundation of China (Grant No. 32101411); the Key Specialized Research and Development Program of Henan Province (Grant No. 252102210172); and the National Innovation Training Program of University Student (Grant No. 202410475106).
Data Availability Statement
The data generated and analyzed in this study are publicly available in the Mendeley Data repository under DOI: 10.17632/2mwsmyr9vw.1.
Conflicts of Interest
The authors declare no conflicts of interest.
References
- Abatzoglou JT, Williams AP. 2016. Impact of anthropogenic climate change on wildfire across western US forests. Proc Natl Acad Sci U S A. 113(42):11770–11775. [CrossRef]
- Jain P, Barber QE, Taylor SW, Whitman E, Castellanos Acuna D, Boulanger Y, Chavardès RD, Chen J, Englefield P, Flannigan M, Girardin MP, et al. 2024. Drivers and impacts of the record-breaking 2023 wildfire season in Canada. Nat Commun. [accessed 2024 Aug 20]; 15:Art. 51154. [CrossRef]
- Cunningham CX, Williamson GJ, Bowman DMJS. 2024. Increasing frequency and intensity of the most extreme wildfires on Earth. Nat Ecol Evol. 8:1420–1425. [CrossRef]
- Burton C, Lampe S, Kelley DI, Thiery W, Hantson S, Christidis N, Gudmundsson L, Forrest M, Burke E, Chang J, et al. 2024. Increasing frequency and intensity of the most extreme wildfires on Earth. Nat Clim Change. [accessed 2024 Oct 21]. [CrossRef]
- Dowdy AJ, Ye H, Pepler AS, Thatcher M, Osbrough SL, Evans JP, Di Virgilio G, McCarthy N. 2019. Australian fire weather as represented by the McArthur Forest Fire Danger Index and the Canadian Forest Fire Weather Index. Clim Dyn. 53(1-2):21–39. [CrossRef]
- Lim C-H, Kim YS, Won M, Kim SJ, Lee WK. 2019. Can satellite-based data substitute for surveyed data to predict the spatial probability of forest fire? A geostatistical approach to forest fire in the Republic of Korea. Geomatics Nat Hazards Risk. 10(1):719–739. [CrossRef]
- Bao Y, Li X, Wang Y, Liu C. 2024. Research trends in wildland fire prediction amidst climate change: a bibliometric analysis. Forests. 15(2):88.
- Yu Y, Mao J, Wullschleger SD, Chen A, Shi X, Wang Y, Hoffman FM, Zhang Y, Pierce E. 2022. Machine learning-based observation-constrained projections reveal elevated global socioeconomic risks from wildfire. Nat Commun. 13:2885.
- Shen S, Seneviratne SI, Wanyan X, Kirley M. 2023. FireRisk: A remote sensing dataset for fire risk assessment with benchmarks using supervised and self-supervised learning. arXiv:2303.07035. [CrossRef]
- Hantson S, Arneth A, Harrison SP, Kelley DI, Prentice IC, Rabin SS, Archibald S, Mouillot F, Arnold SR, Artaxo P, et al. 2016. The status and challenge of global fire modelling. Biogeosciences. 13(11):3359–3375. [CrossRef]
- Turner MG, Brazjunas KH, Hansen WD, Hoecker TJ, Rammer W, Rataiczak Z, Westerling AL, Seidl R. 2022. The magnitude, direction, and tempo of forest change in Greater Yellowstone in a warmer world with more fire. Ecol Monogr. 92(1):e01485. [CrossRef]
- Corbière C, Thome N, Bar-Hen A, Cord M, Pérez P. 2019. Addressing failure prediction by learning model confidence. Adv Neural Inf Process Syst. 32:2905–2915.
- Wen X, Xie Y, Jiang L, Li Y, Ge T. 2022. On the interpretability of machine learning methods in crash frequency modeling and crash modification factor development. Accid Anal Prev. 175:106617. [CrossRef]
- Maxwell AE, Warner TA, Vanderbilt BC, Ramezan CA. 2017. Land cover classification and feature extraction from National Agriculture Imagery Program (NAIP) orthoimagery: A review. Photogramm Eng Remote Sens. 83(11):737–747.
- Farr TG, Rosen PA, Caro E, Crippen R, Duren R, Hensley S, Kobrick M, Paller M, Rodriguez E, Roth L, et al. 2007. The shuttle radar topography mission. Rev Geophys. 45(2):RG2004. [CrossRef]
- Hersbach H, Bell B, Berrisford P, Hirahara S, Horányi A, Muñoz-Sabater J, Nicolas J, Peubey C, Radu R, Schepers D, et al. 2020. The ERA5 global reanalysis. Q J R Meteorol Soc. 146(730):1999–2049. [CrossRef]
- Didan K, Miura T, Solano R, Huete AR. 2015. MODIS Vegetation Index User’s Guide (MOD13 Series). Tucson (AZ): University of Arizona. [accessed 2024 Jun 15]. Available from: https://modis.gsfc.nasa.gov/data/dataprod/mod13.php.
- Wang Y, Liu Z, Wang X, Chen Y, Zhang G, Randerson JT. 2023. Interpretable deep learning for spatial variation in wildfire drivers. Environ Res Lett. 18(3):034033.
- Gorelick N, Hancher M, Dixon M, Ilyushchenko S, Thau D, Moore R. 2017. Google Earth Engine: Planetary-scale geospatial analysis for everyone. Remote Sens Environ. 202:18–27. [CrossRef]
- Giglio L, Justice C. 2015. MOD14A1 MODIS/Terra Thermal Anomalies/Fire Daily L3 Global 1km SIN Grid V006. NASA EOSDIS Land Processes DAAC. [accessed 2024 Jun 15]. Available from: https://lpdaac.usgs.gov/products/mod14a1v006/.
- Didan K, Barreto A. 2018. VIIRS/NPP Vegetation Indices 16-Day L3 Global 500m SIN Grid V001. NASA EOSDIS Land Processes DAAC. [accessed 2024 Jun 15]. Available from: https://lpdaac.usgs.gov/products/vnp13a1v001/.
- Schroeder W, Oliva P, Giglio L, Quayle B, Lorenz E, Morelli F. 2022. VIIRS active fire products: Algorithm improvements and global validation. Remote Sens. 14(3):578. [CrossRef]
- [NASA] National Aeronautics and Space Administration, Land Processes Distributed Active Archive Center. 2021. MOD/MYD C6.1 MCD64A1 burned area product. [accessed 2024 Jun 15]. Available from: https://lpdaac.usgs.gov/products/mcd64a1v006/.
- SpatialReference.org. 2024. EPSG:32611 WGS 84 / UTM Zone 11N. [accessed 2024 Nov 5]. Available from: https://spatialreference.org/ref/epsg/32611/.
- [USDA], U.S. Department of Agriculture, Forest Service. 2023. Wildfire Potential Hazard (WHP) 2023 Classification. ArcGIS Online. [accessed 2024 May 23]. Available from: https://usfs.maps.arcgis.com/home.
- Radeloff VC, Helmers DP, Kramer HA, Mockrin MH, Alexandre PM, Bar-Massada A, Butsic V, Hawbaker TJ, Martinuzzi S, Stewart SI, et al. 2018. Rapid growth of the US wildland-urban interface raises wildfire risk. Proc Natl Acad Sci U S A. 115(13):3314–3319. [CrossRef]
- Breiman, L. 2001. Random forests. Mach Learn. 45(1):5–32. [CrossRef]
- Wang, Q. 2022. Support Vector Machine Algorithm in Machine Learning. In: Proceedings of the 2022 IEEE International Conference on Artificial Intelligence and Computer Applications (ICAICA); 2022 Jun 24-26; Dalian, China. Piscataway (NJ): IEEE; p. 750 - 756.
- Chen T, Guestrin C. 2016. XGBoost: A scalable tree boosting system. In: Proceedings of the 22nd ACM SIGKDD International Conference on Knowledge Discovery and Data Mining; 2016 Aug 13–17; San Francisco, CA. New York (NY): Association for Computing Machinery; p. 785–794. [CrossRef]
- Ke G, Meng Q, Finley T, Wang T, Chen W, Ma W, Ye Q, Liu T-Y. 2017. LightGBM: A highly efficient gradient boosting decision tree. Adv Neural Inf Process Syst. 30:3146–3154.
- Paszke A, Gross S, Massa F, Lerer A, Bradbury J, Chanan G, Killeen T, Lin Z, Gimelshein N, Antiga L, et al. 2019. PyTorch: an imperative style, high-performance deep learning library. In: Proceedings of the 33rd International Conference on Neural Information Processing Systems; 2019 Dec 8-14; Vancouver, Canada. Red Hook (NY): Curran Associates; p. 8026-8037. Article No.: 721.
- Vaswani A, Shazeer N, Parmar N, Uszkoreit J, Jones L, Gomez AN, Kaiser Ł, Polosukhin I. 2017. Attention is all you need. Adv Neural Inf Process Syst. 30:5998–6008.
- Li H, Wang Y, Zhang J, Liu X, Chen Z. 2023. A transformer-based fusion framework for wildfire risk assessment using heterogeneous geospatial data. Remote Sens Environ. 287:113482. [CrossRef]
- Hochreiter S, Schmidhuber J. 1997. Long short-term memory. Neural Comput. 9(8):1735–1780. [CrossRef]
- Tan M, Le QV. 2019. EfficientNet: Rethinking model scaling for convolutional neural networks. In: Proceedings of the 36th International Conference on Machine Learning; 2019 Jun 9–15; Long Beach, CA. Proceedings of Machine Learning Research; vol. 97. p. 6105–6114.
- Tan M, Chen B, Pang R, Vasudevan V, Sandler M, Howard A, Le QV. 2021. EfficientNetV2: Smaller models and faster training. In: Proceedings of the 38th International Conference on Machine Learning; 2021 Jul 18–24; Virtual. Proceedings of Machine Learning Research; vol. 139. p. 10096–10106.
- [IPCC] Intergovernmental Panel on Climate Change. 2023. Climate Change 2023: Synthesis Report. Cambridge (UK): Cambridge University Press. [accessed 2024 Jun 15]. [CrossRef]
- Szpakowski DM, Jensen JLR. 2019. A review of the applications of remote sensing in fire ecology. Remote Sens. 11(22):2638. [CrossRef]
Figure 1.
Selected 49 ecoregions for wildfire risk assessment.
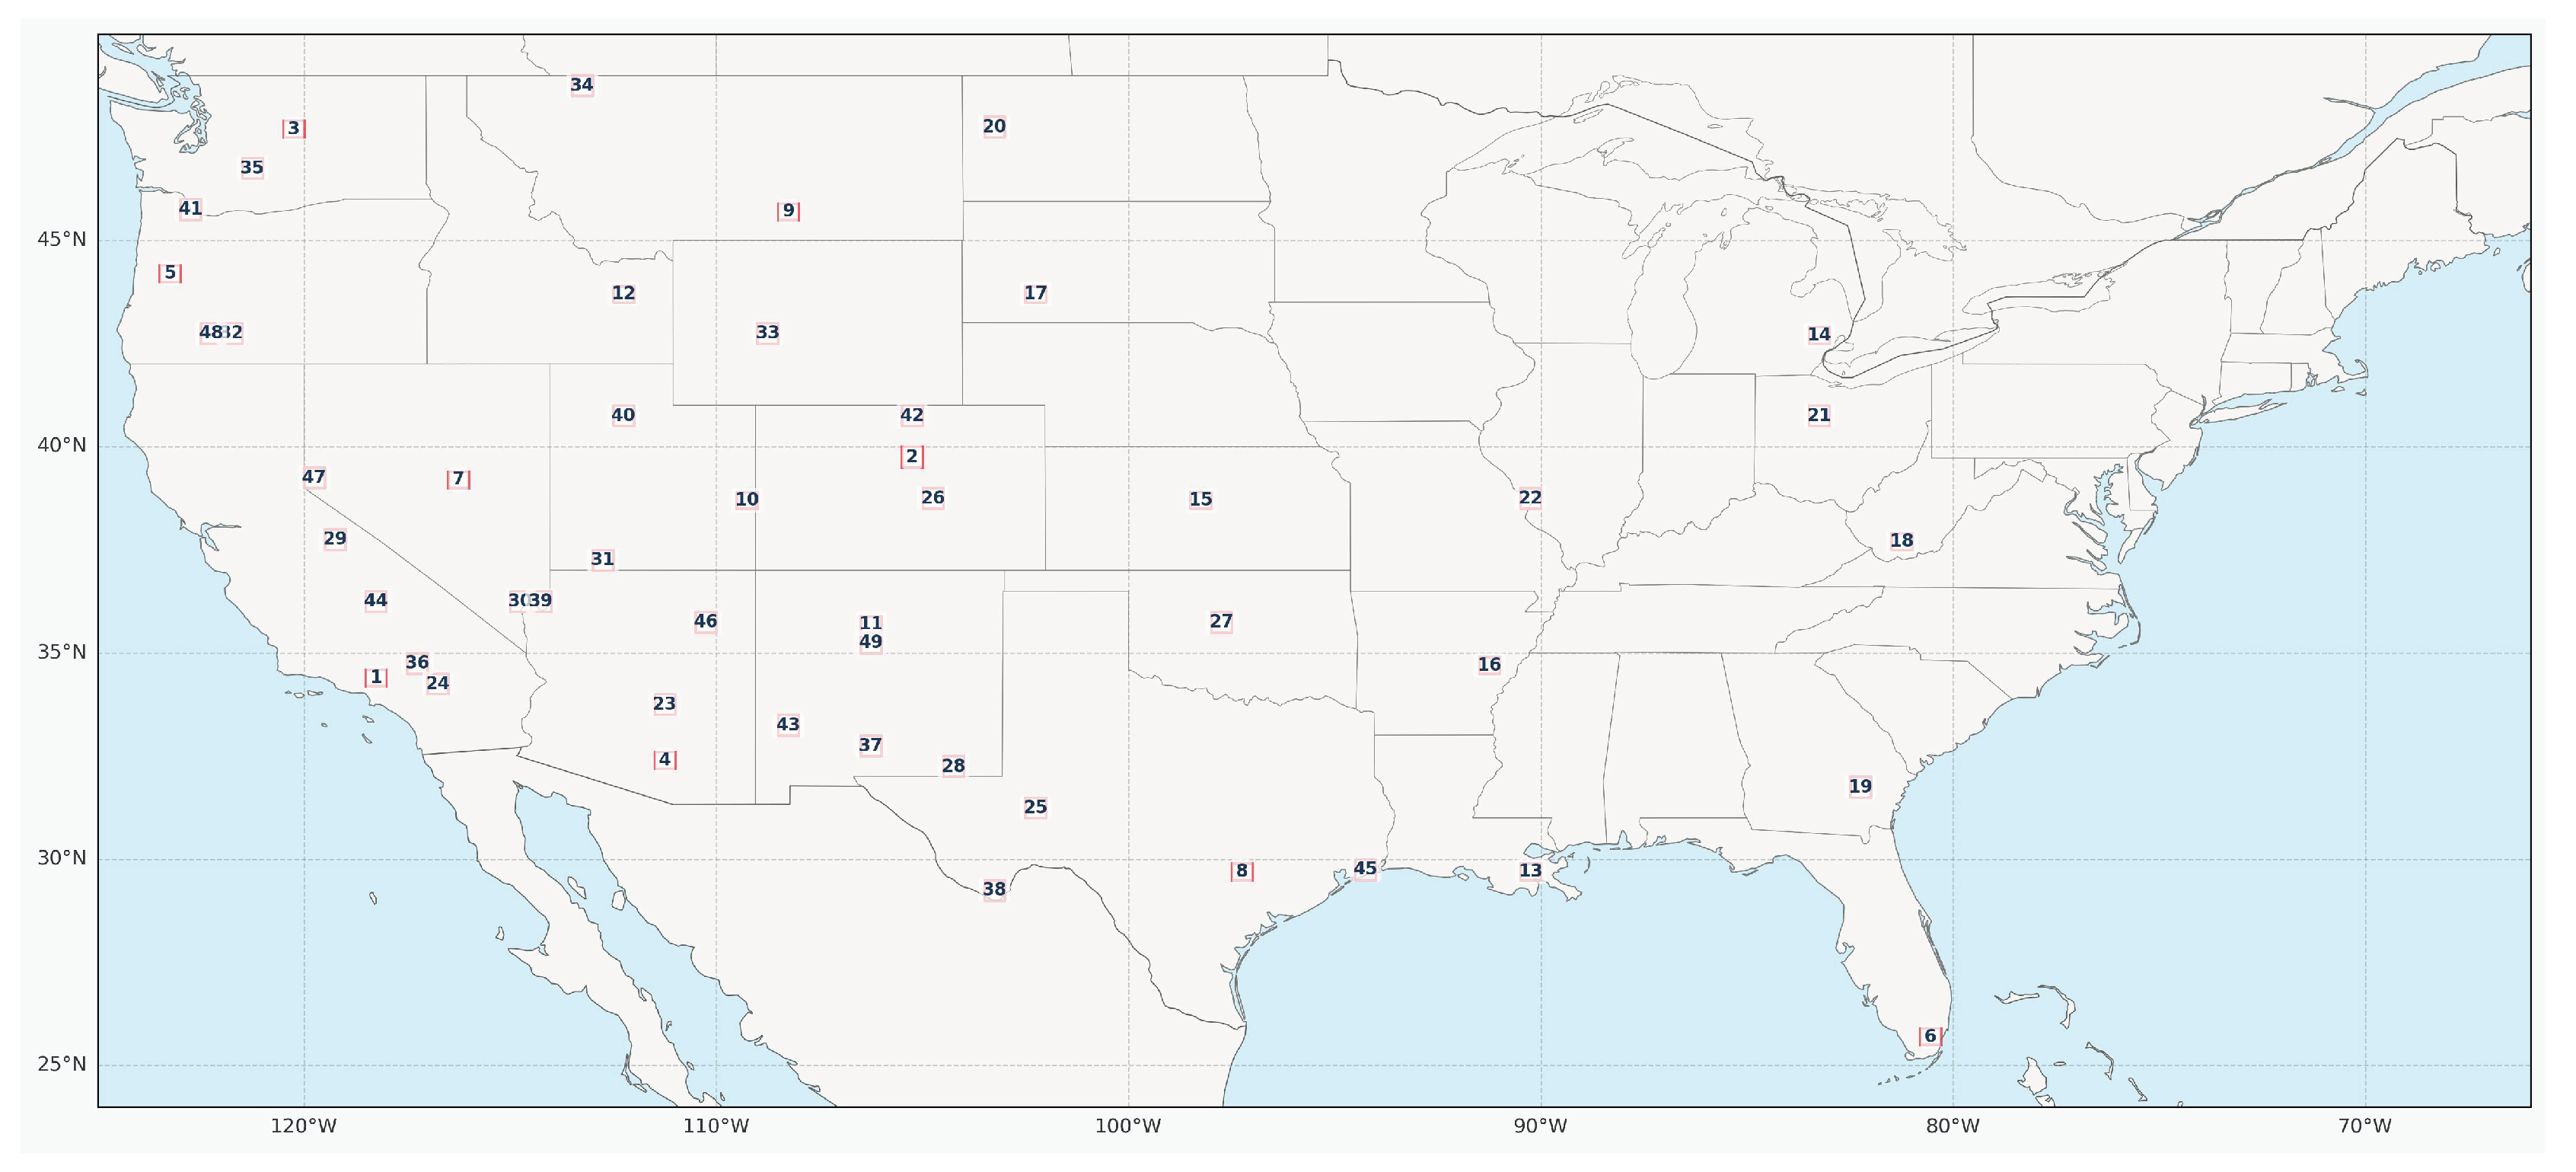
Figure 2.
NAIP-WHP Alignment.
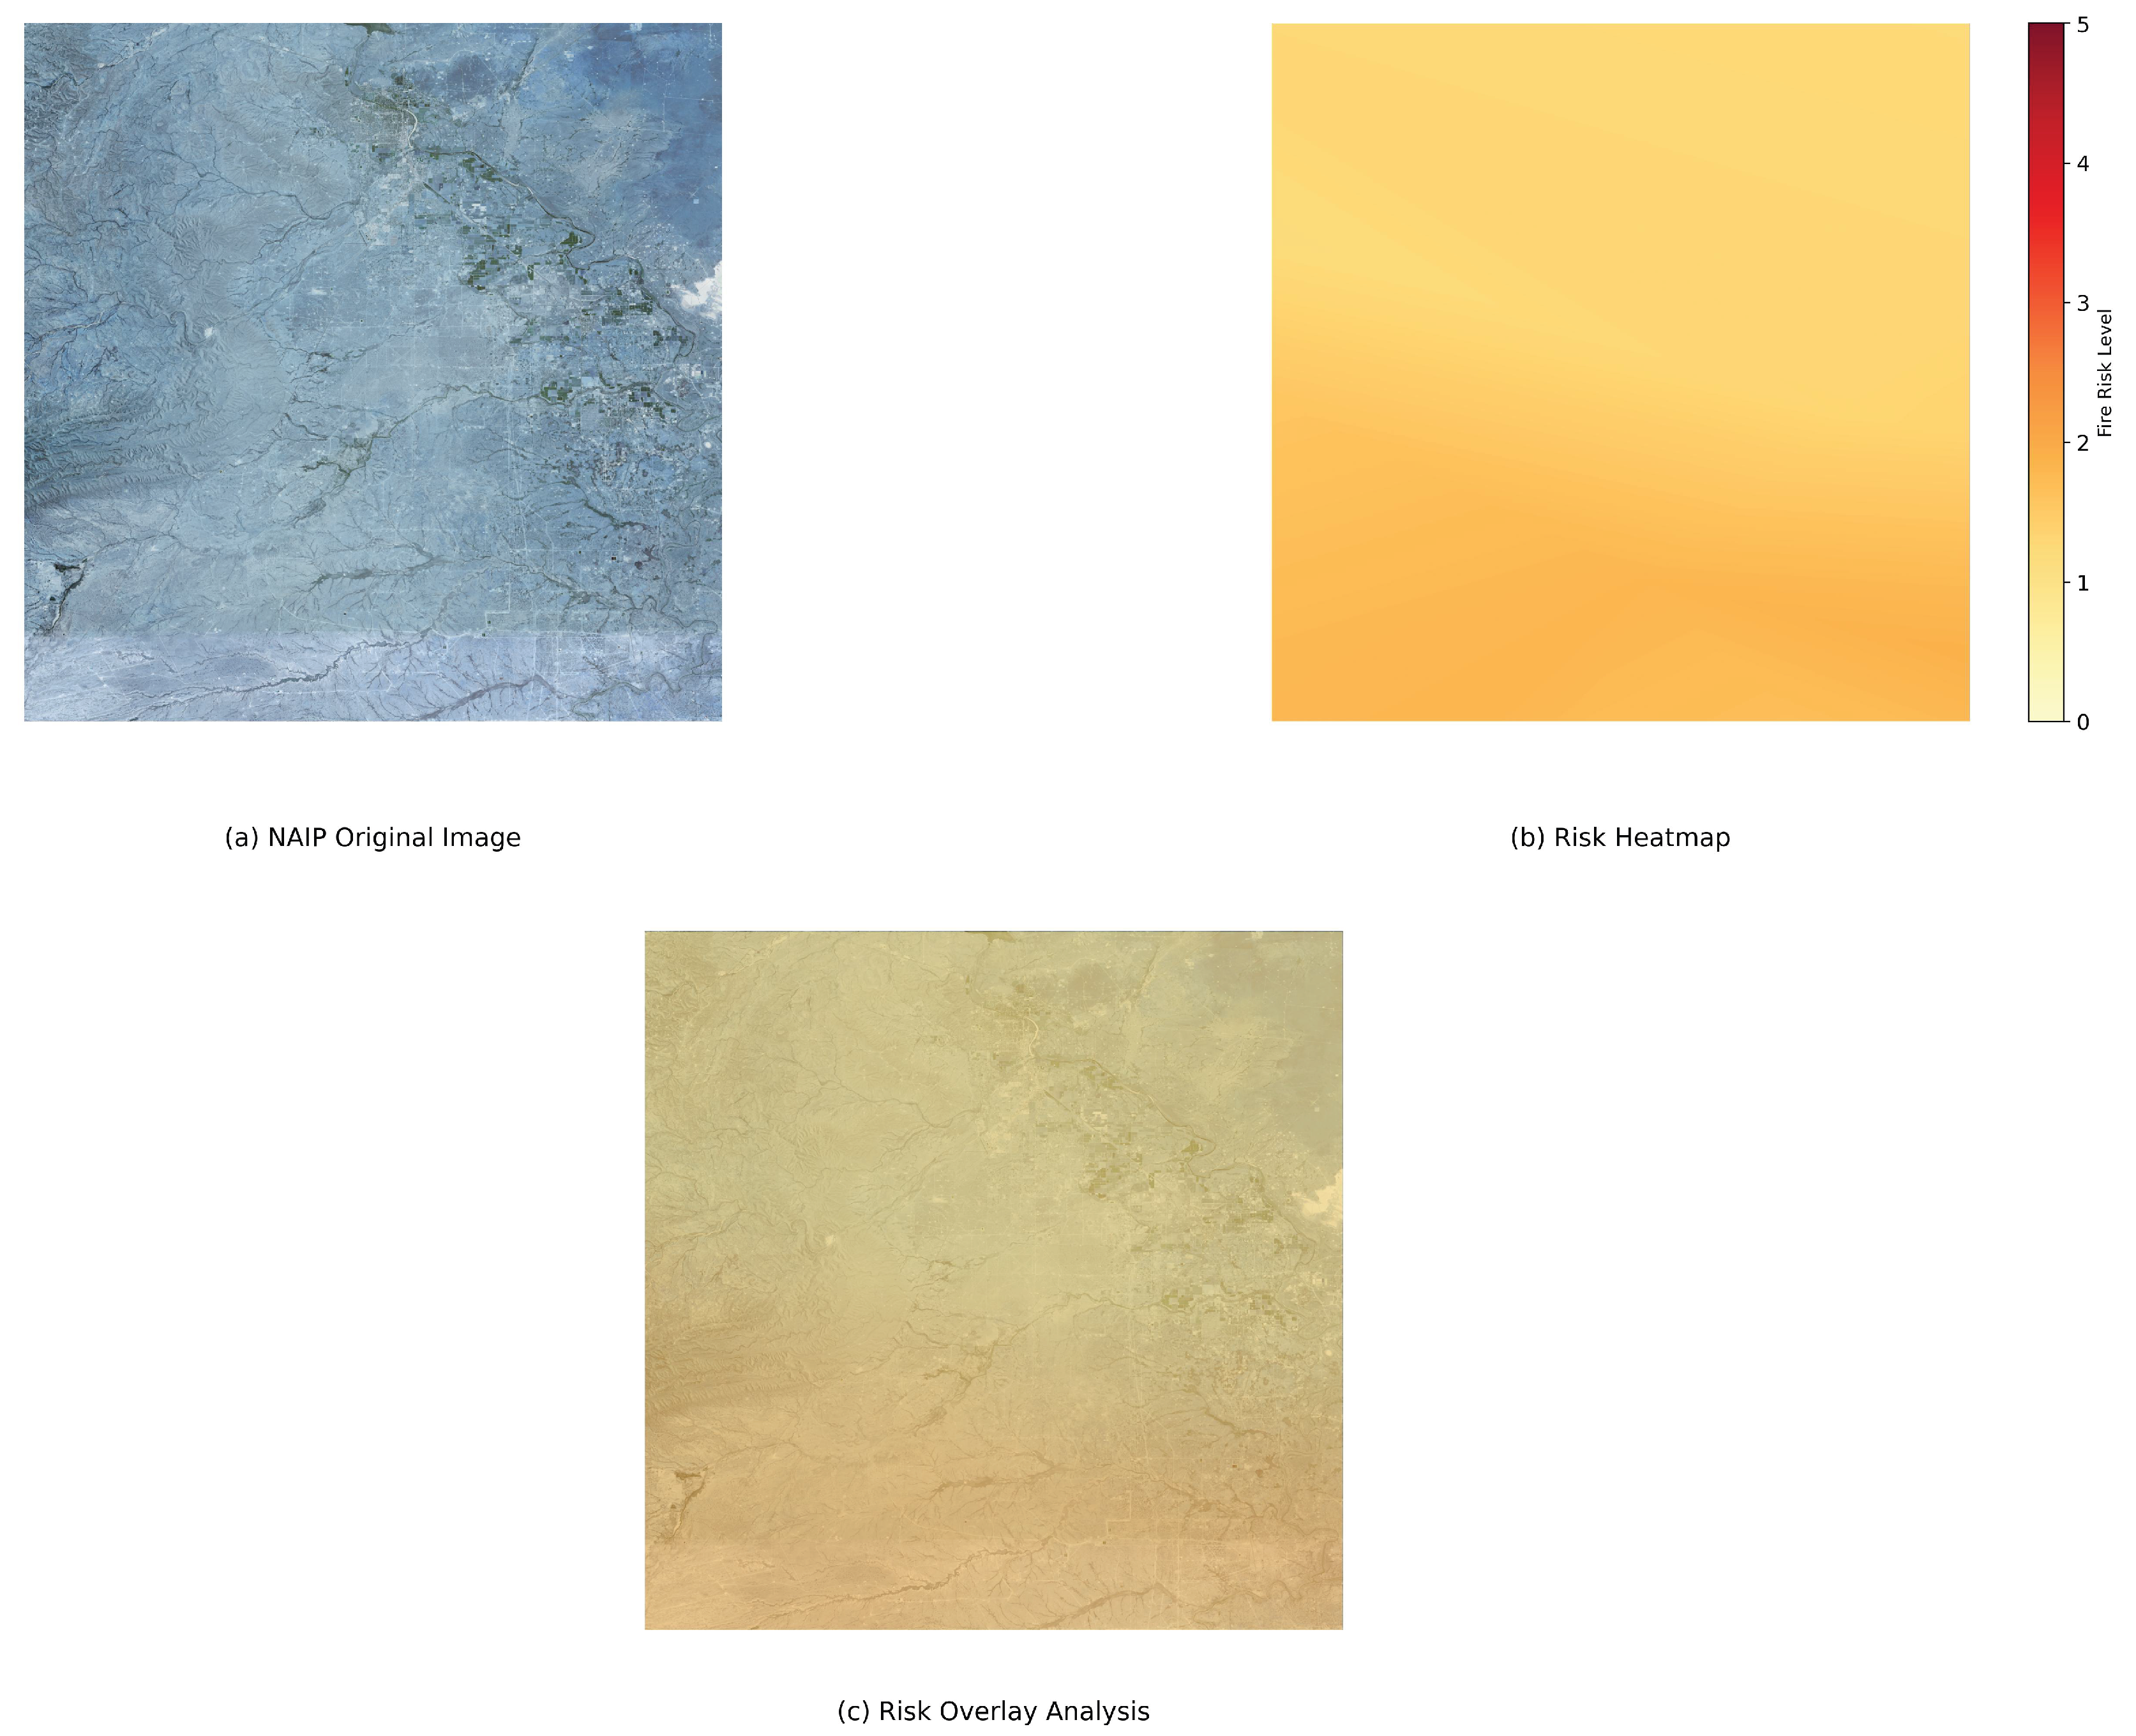
Figure 3.
Fixed weight allocation across modalities in the Fixed-Weight Fusion strategy.
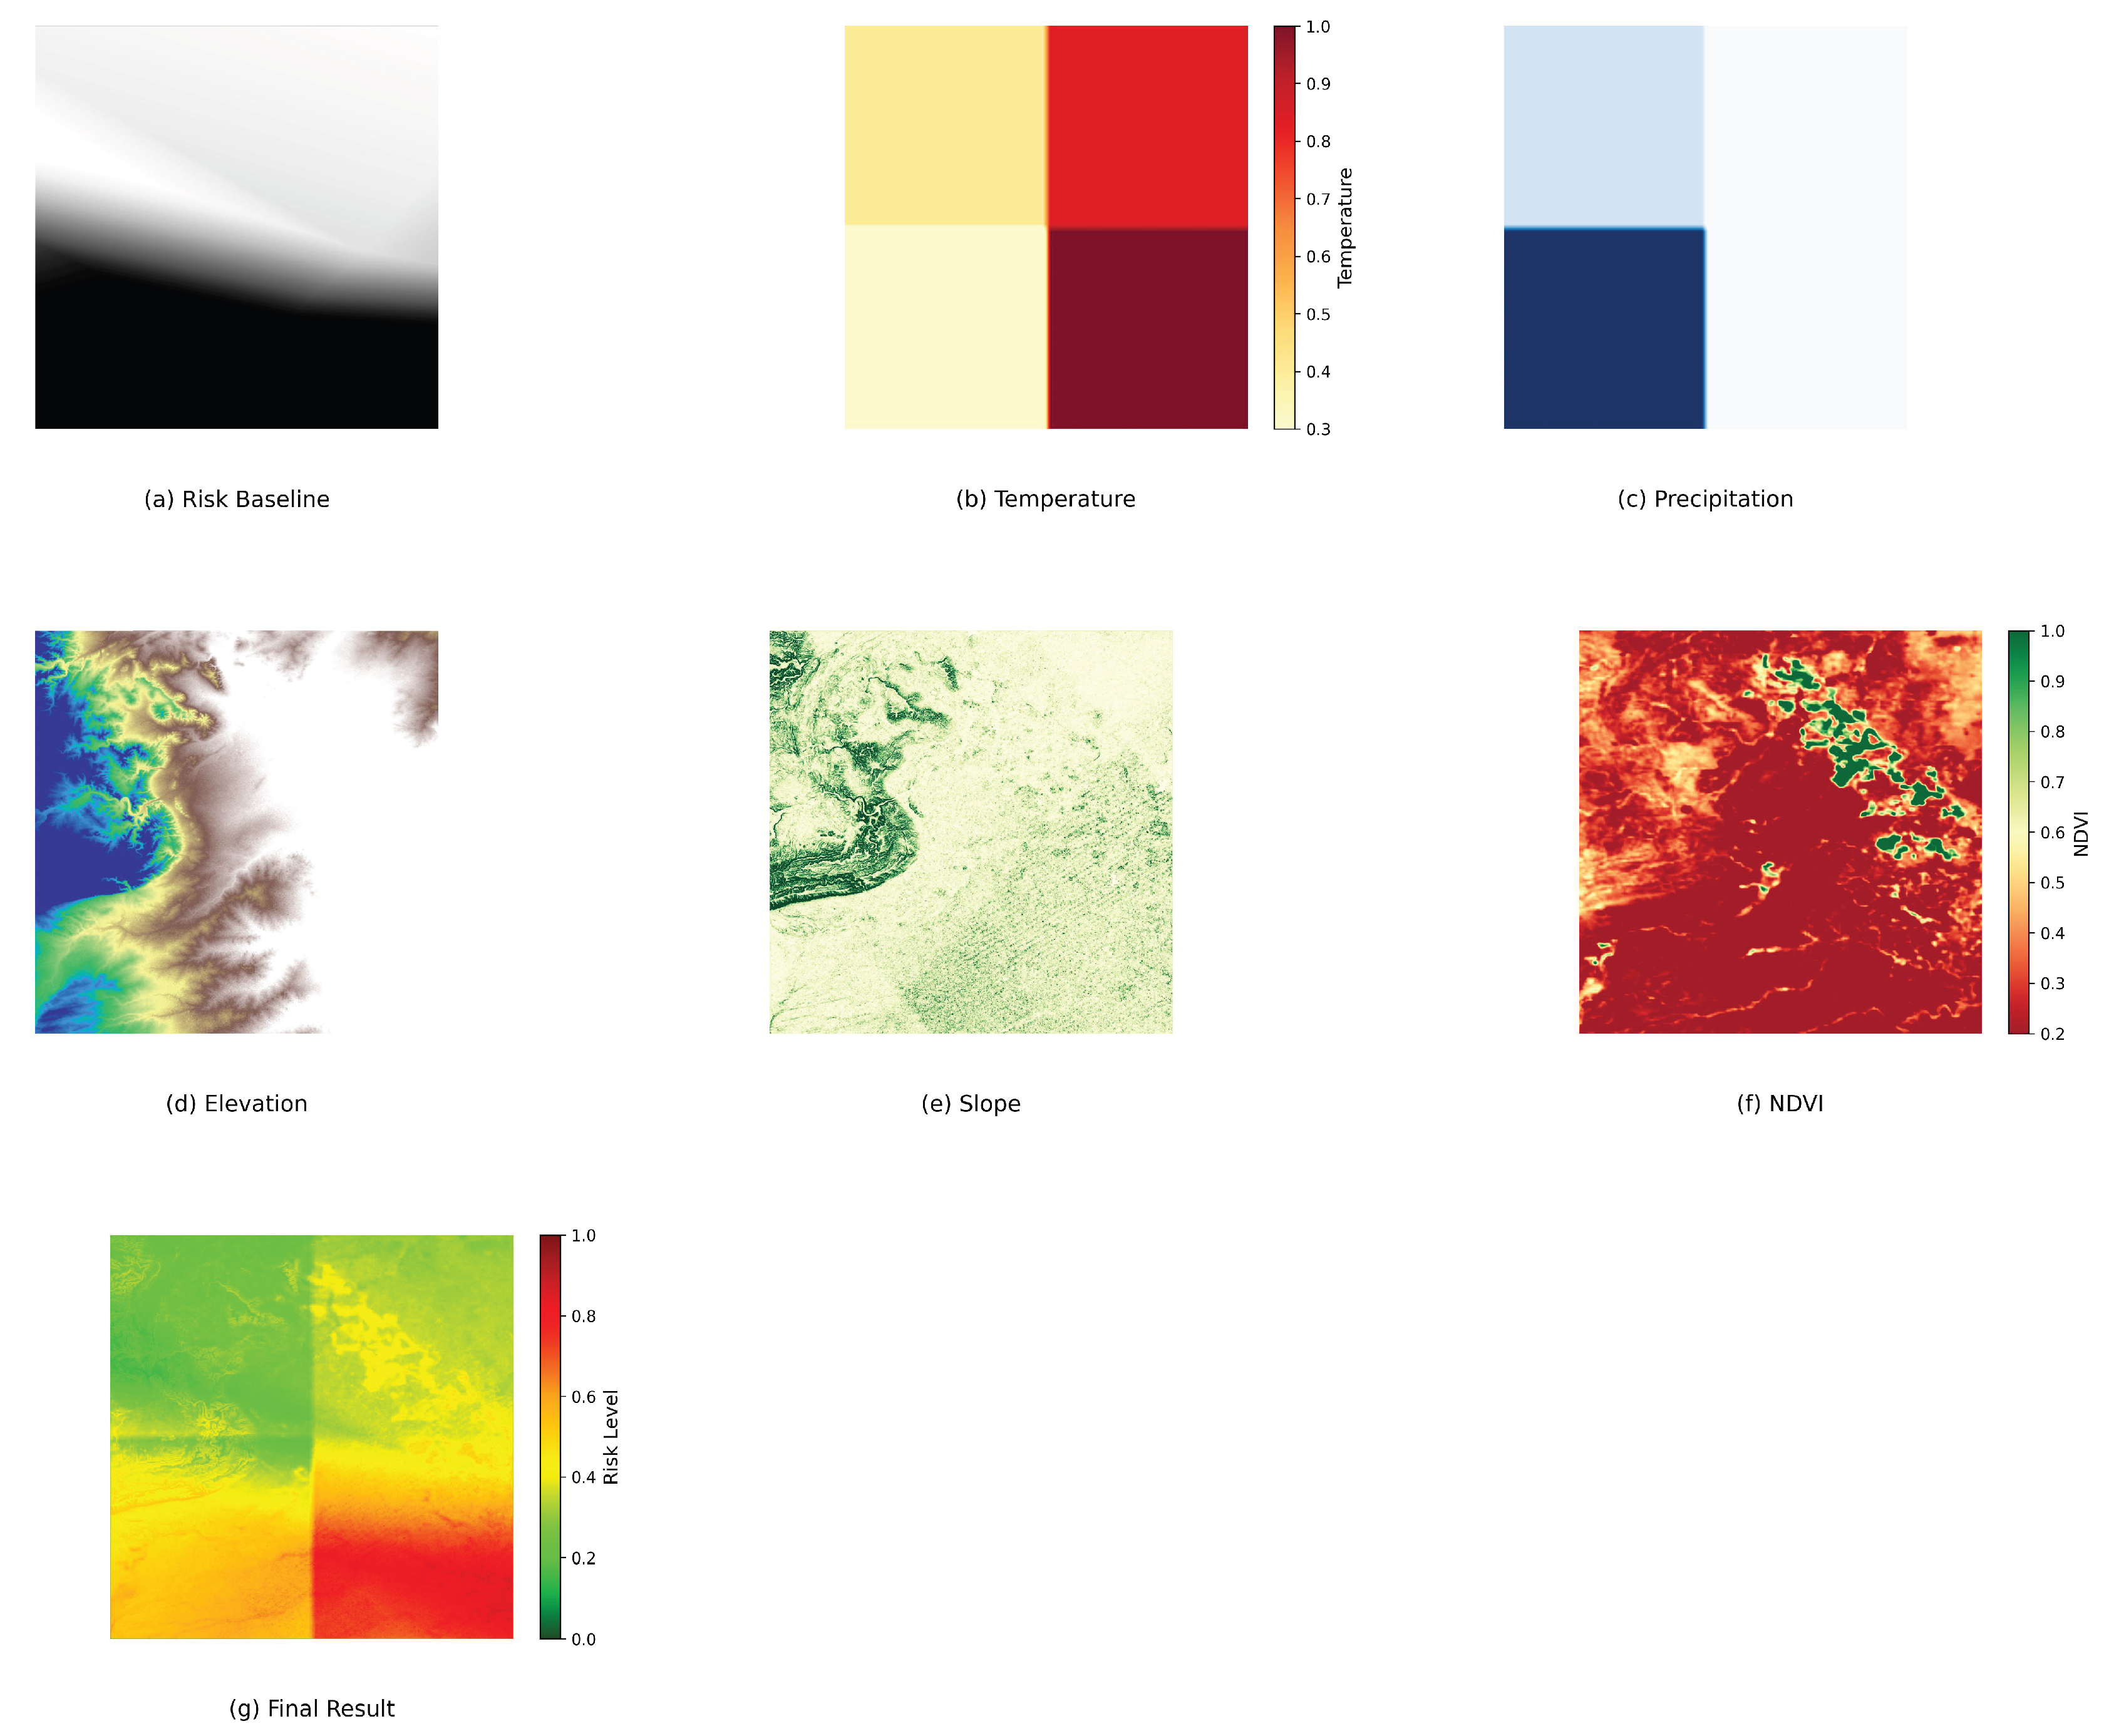
Figure 4.
Schematic of dynamic weight allocation, demonstrating the dynamic adjustments of terrain, meteorological, and vegetation weights.
Figure 4.
Schematic of dynamic weight allocation, demonstrating the dynamic adjustments of terrain, meteorological, and vegetation weights.
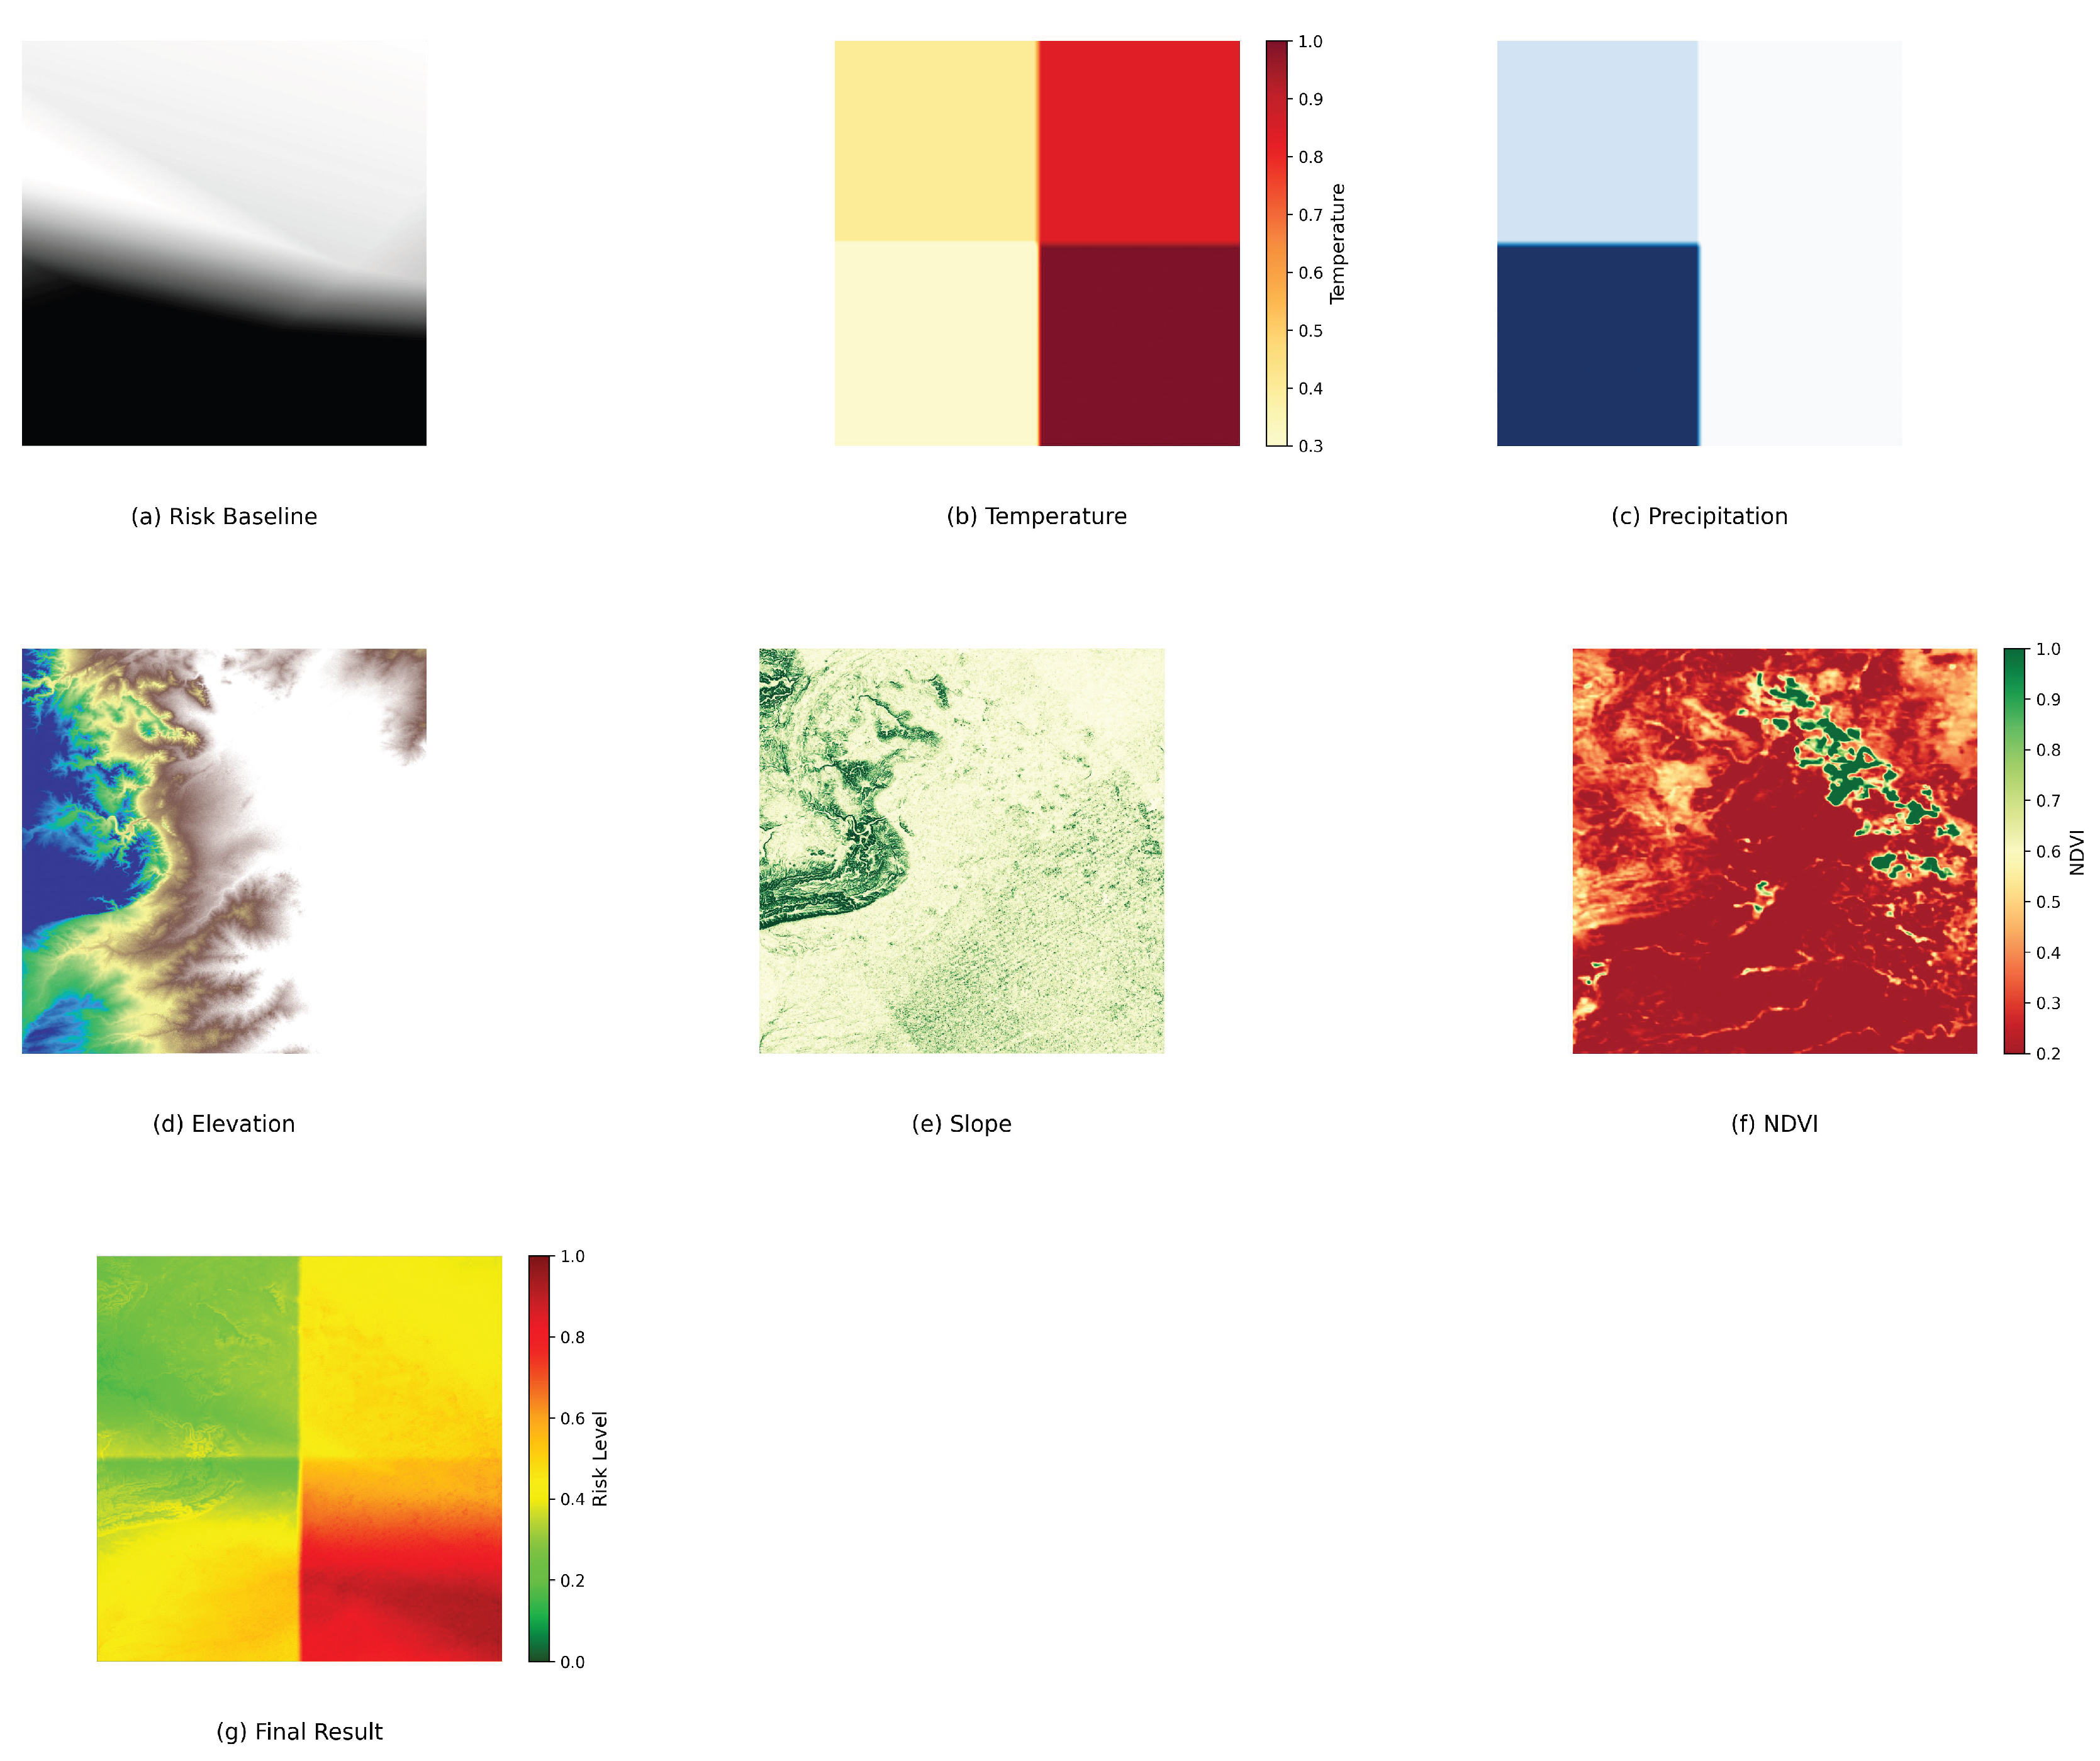
Figure 5.
Comparative analysis of feature importance across wildfire risk assessment models.
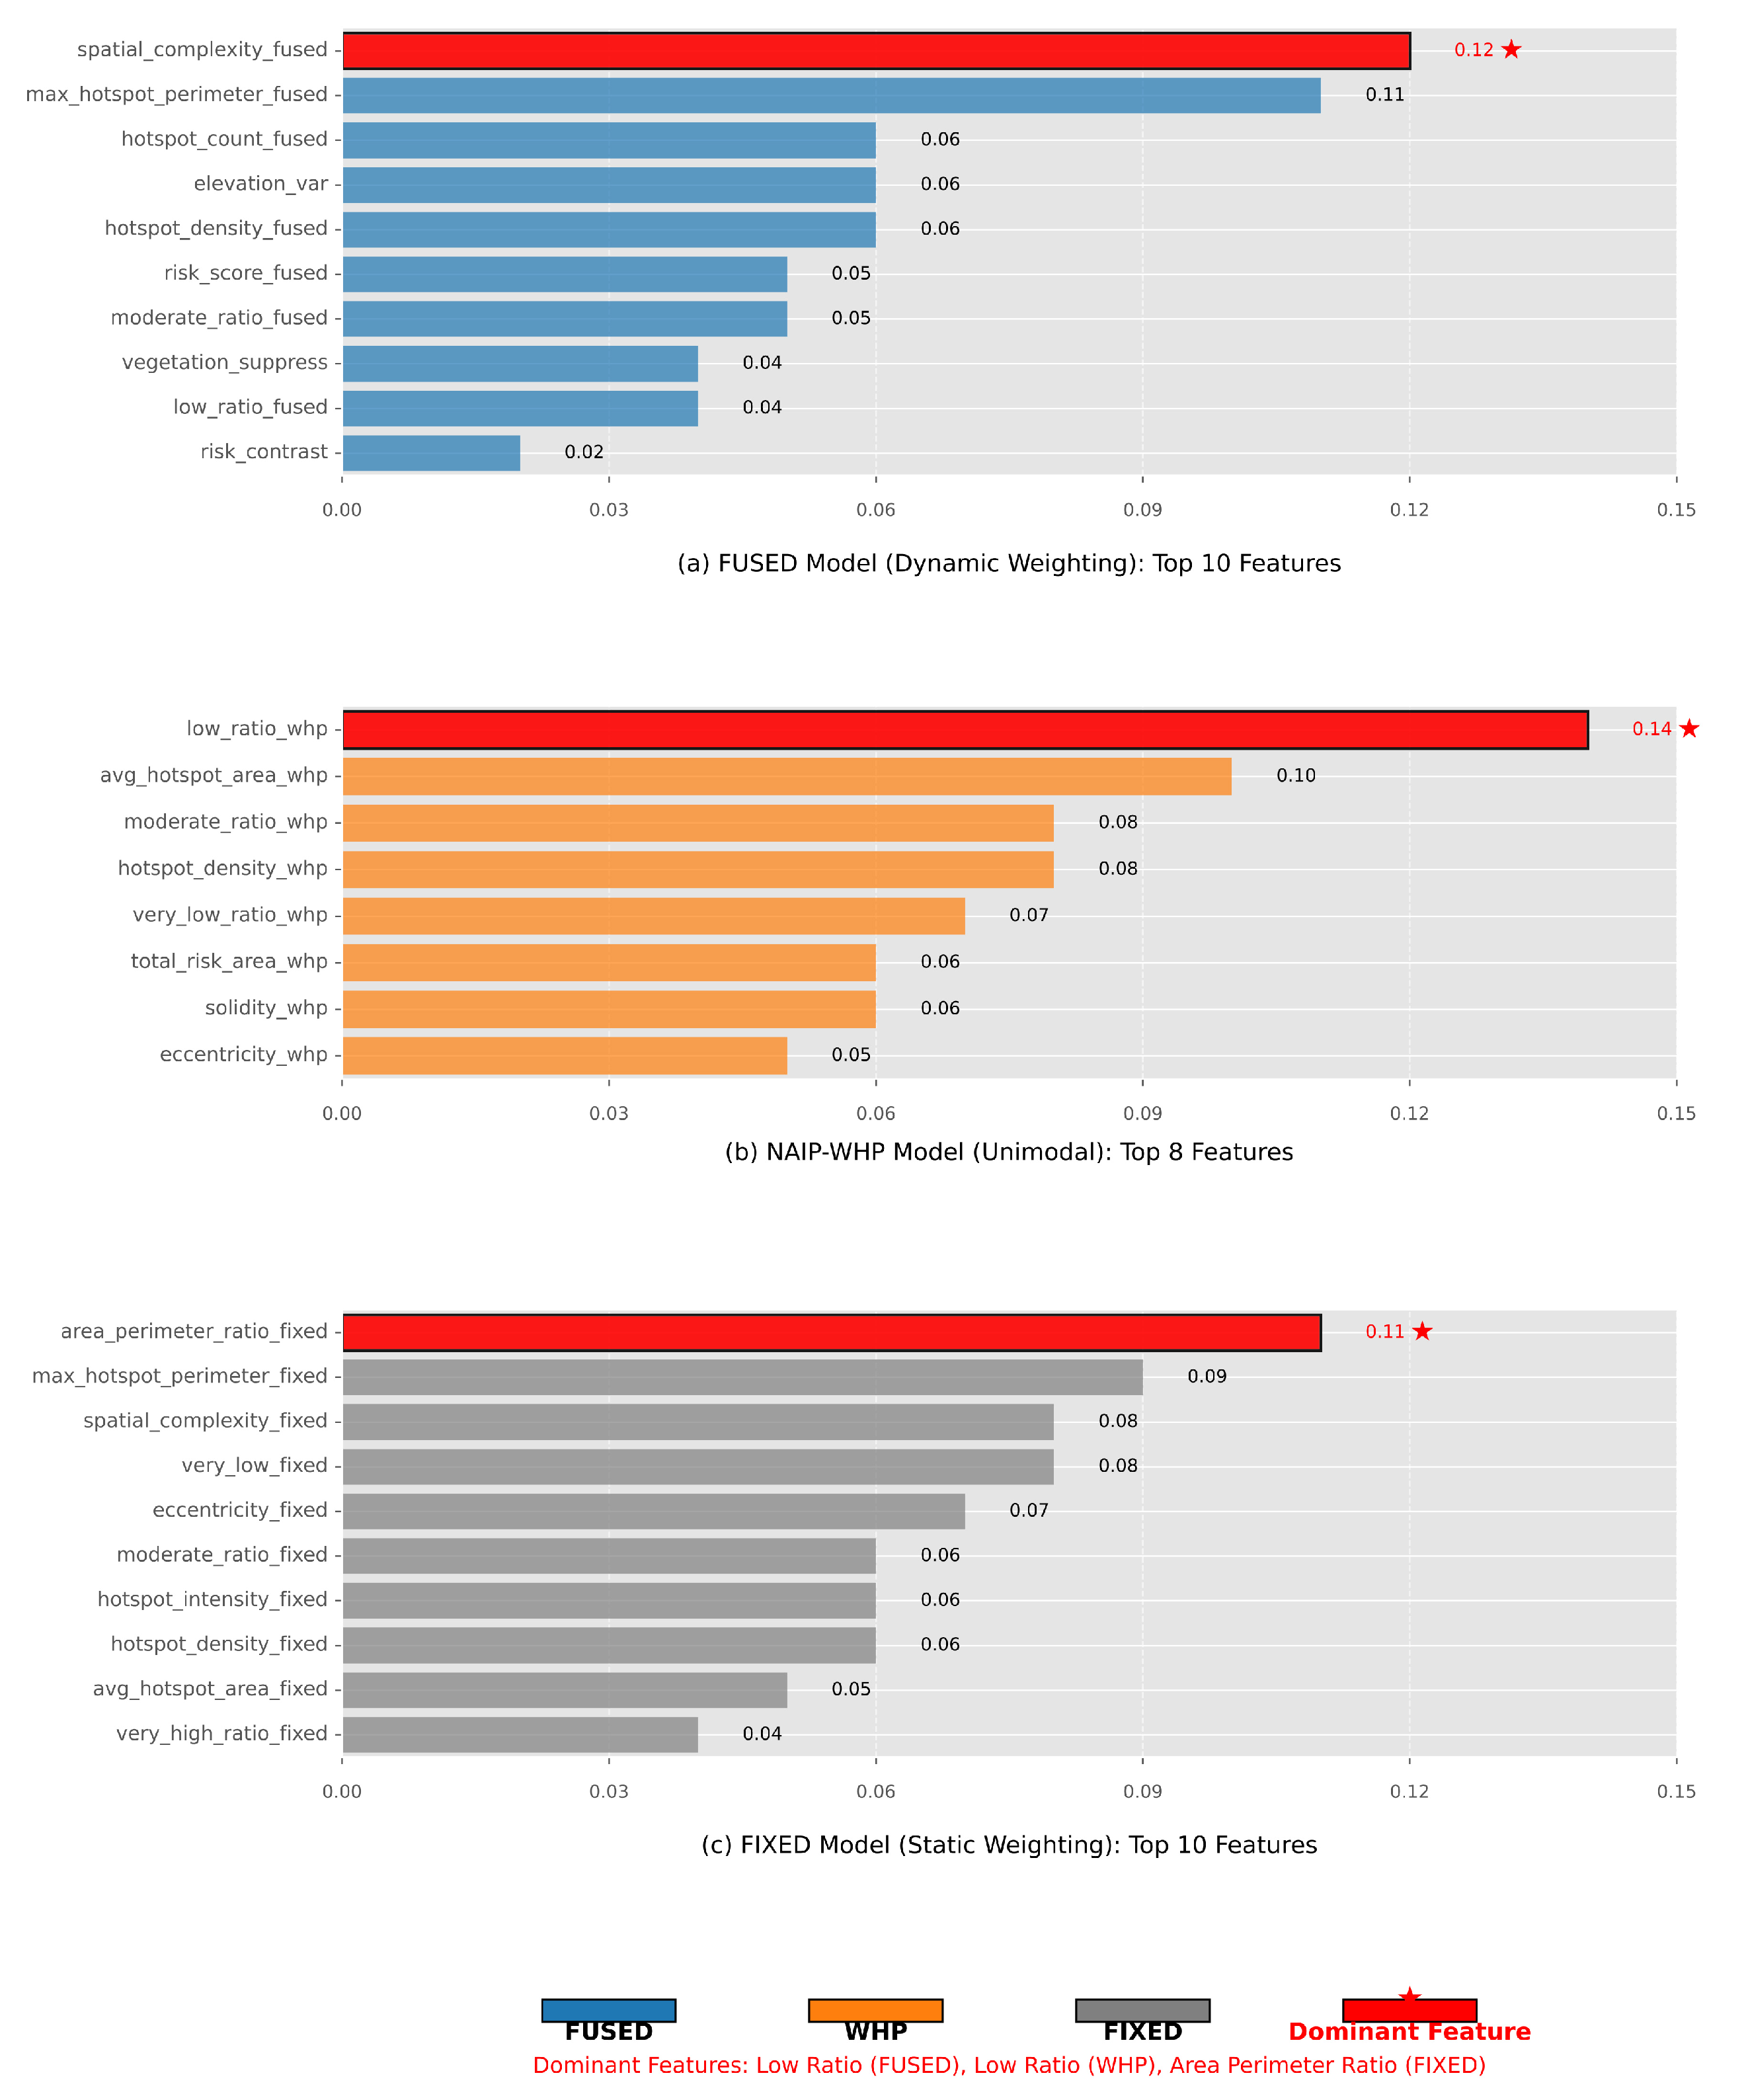
Figure 6.
Encoder-Decoder Architectures for Wildfire Risk Prediction.
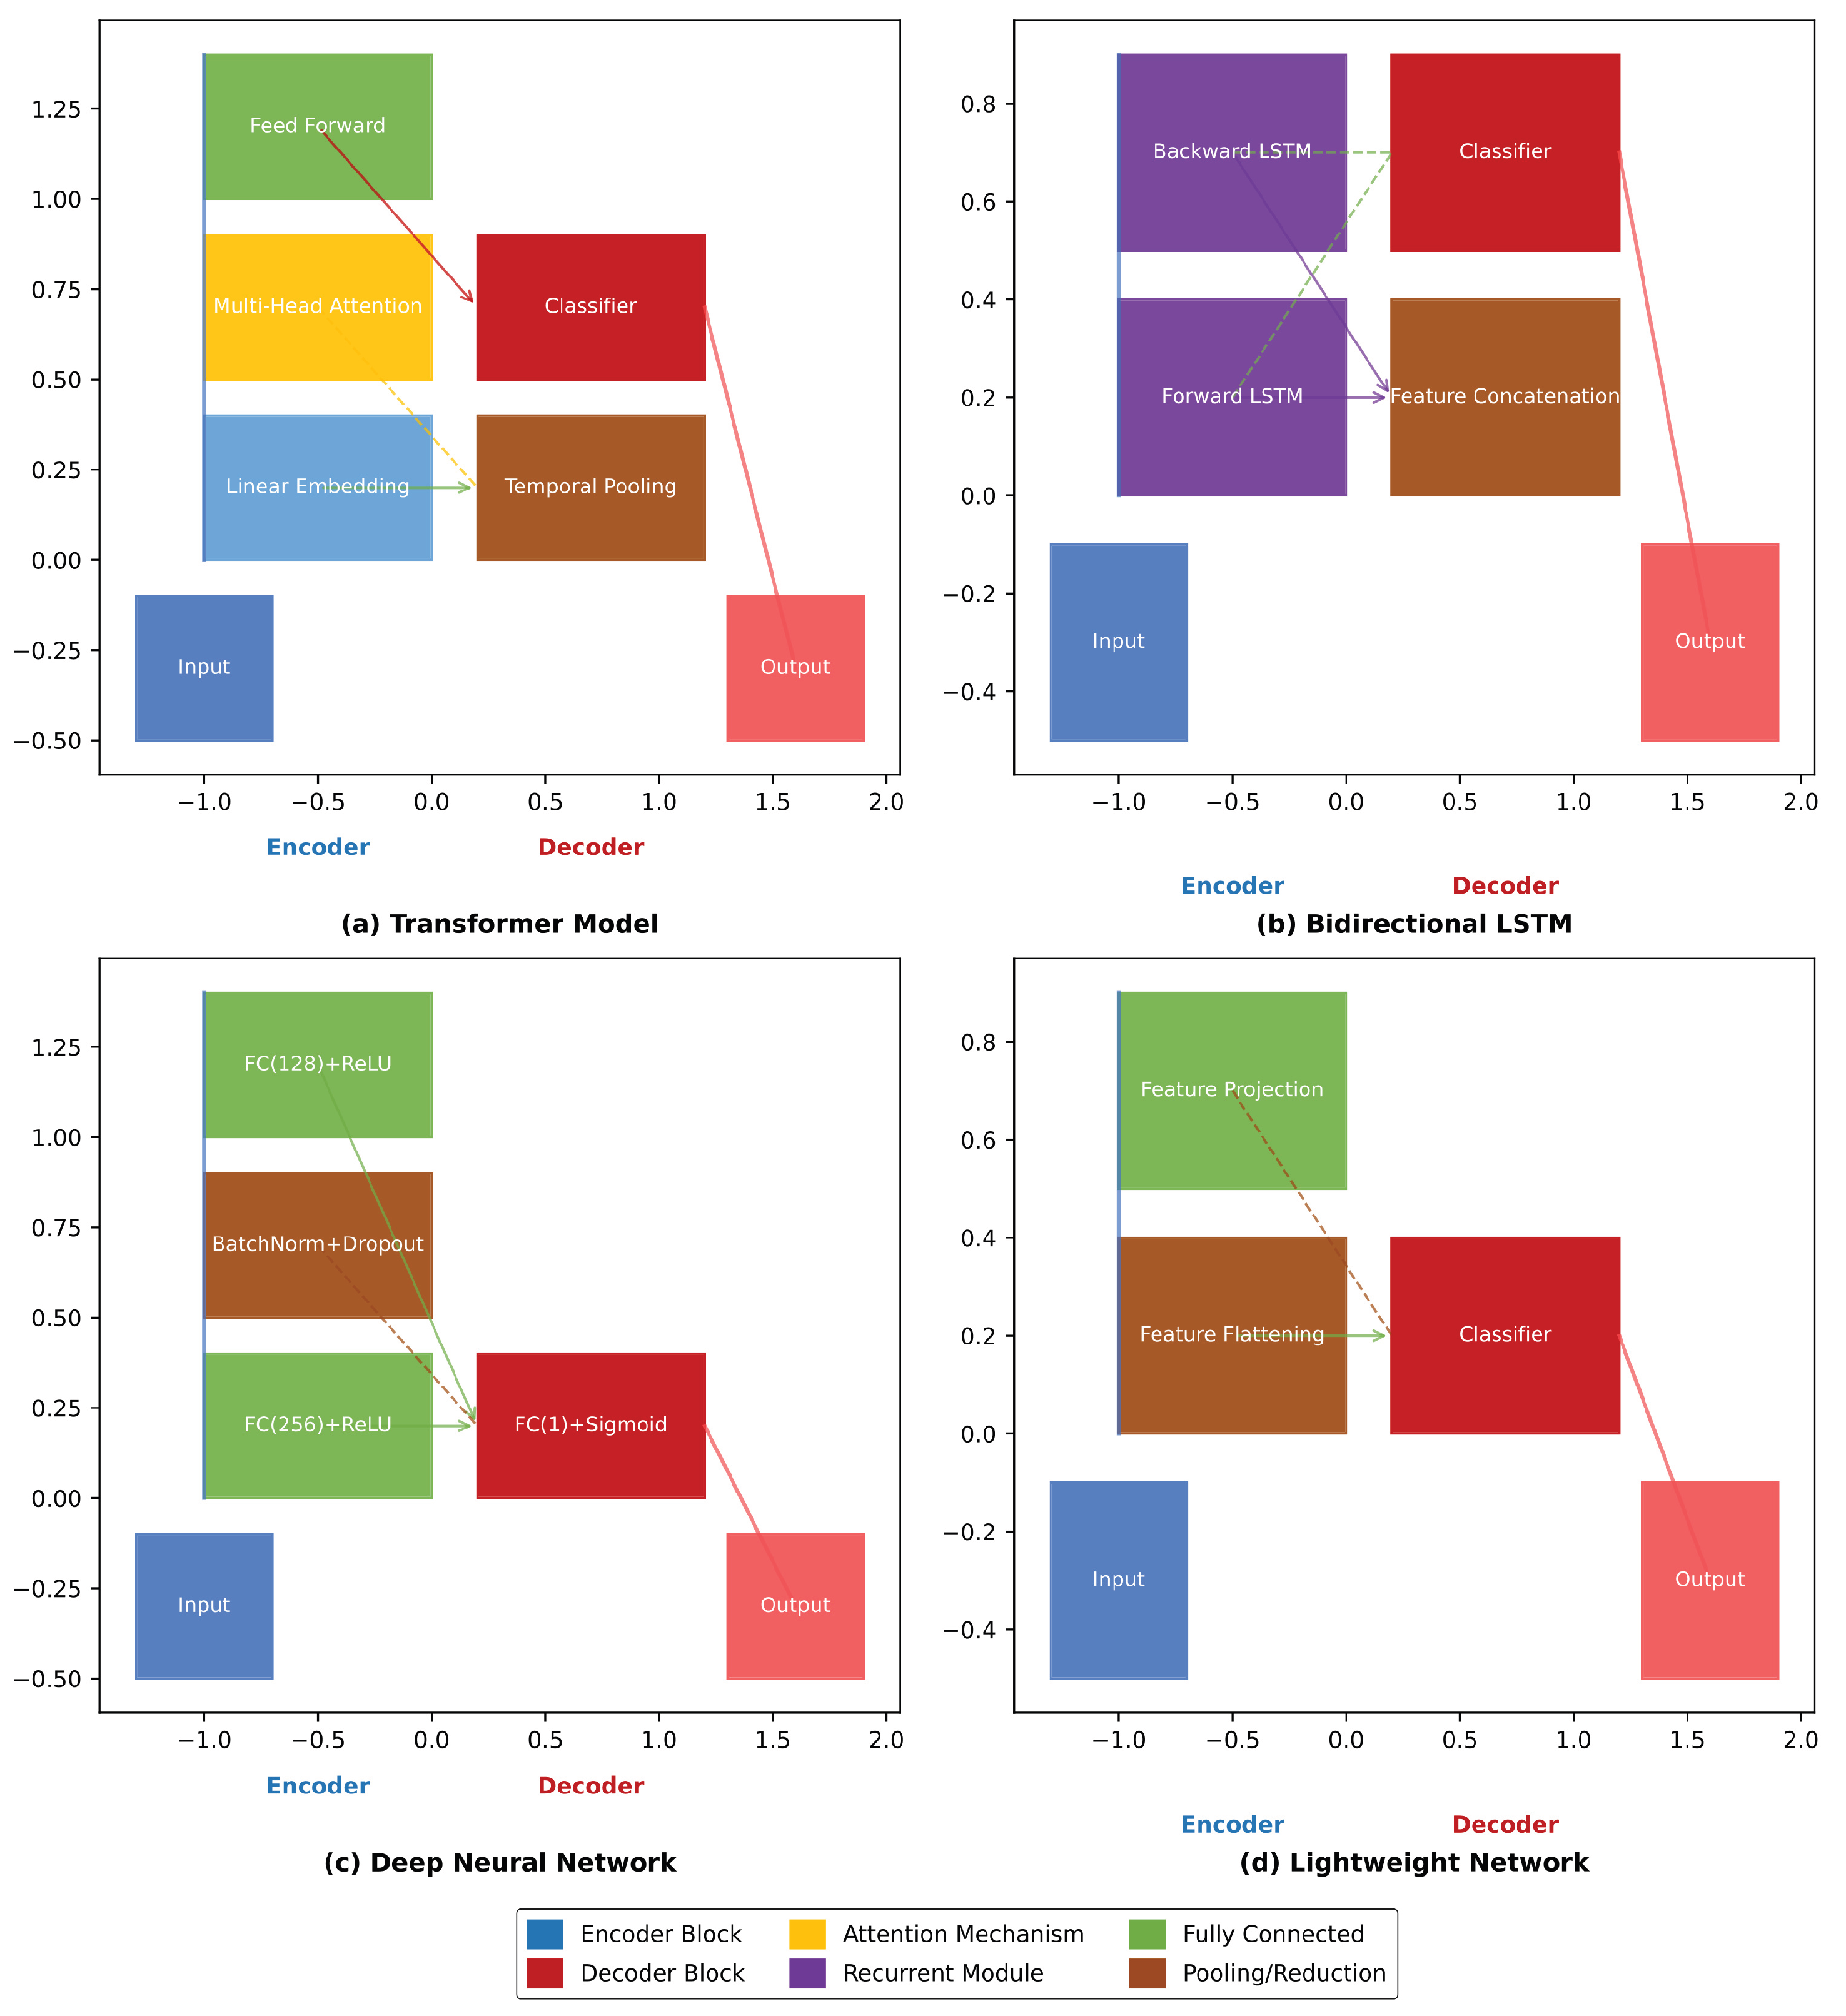
Figure 7.
LightGBM_fused_shap.
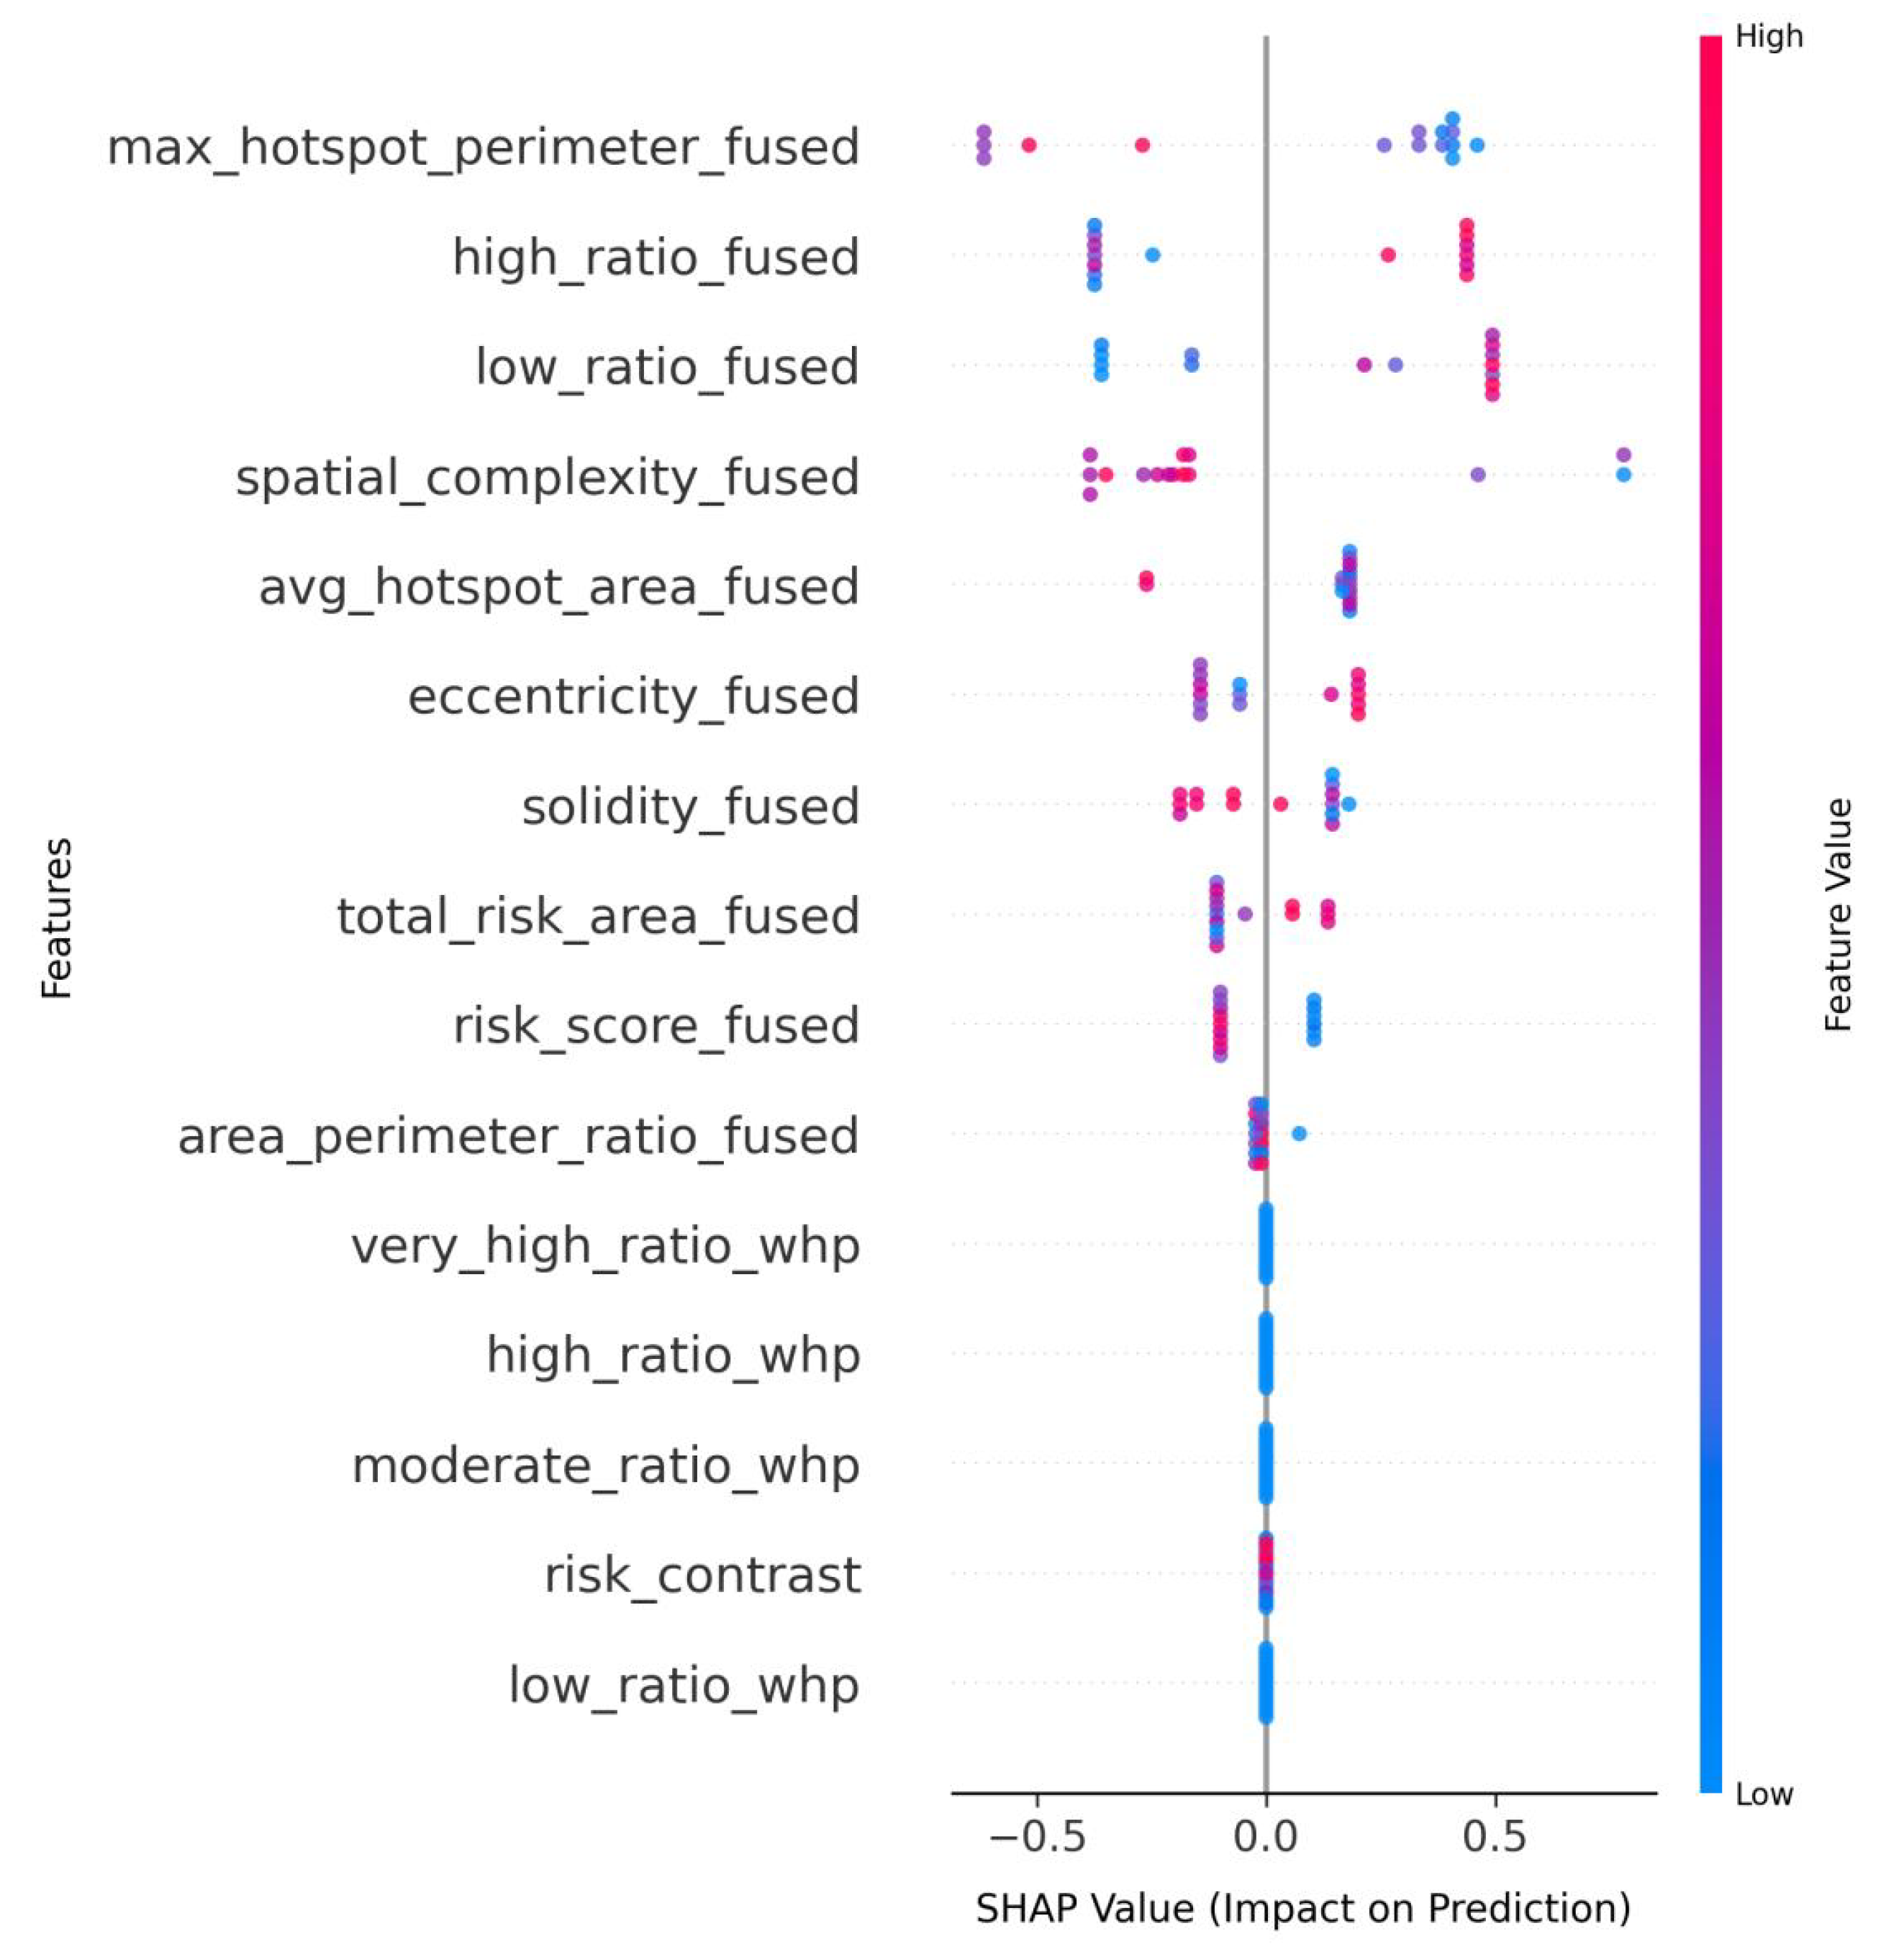
Figure 8.
LightGBM_whp_shap.
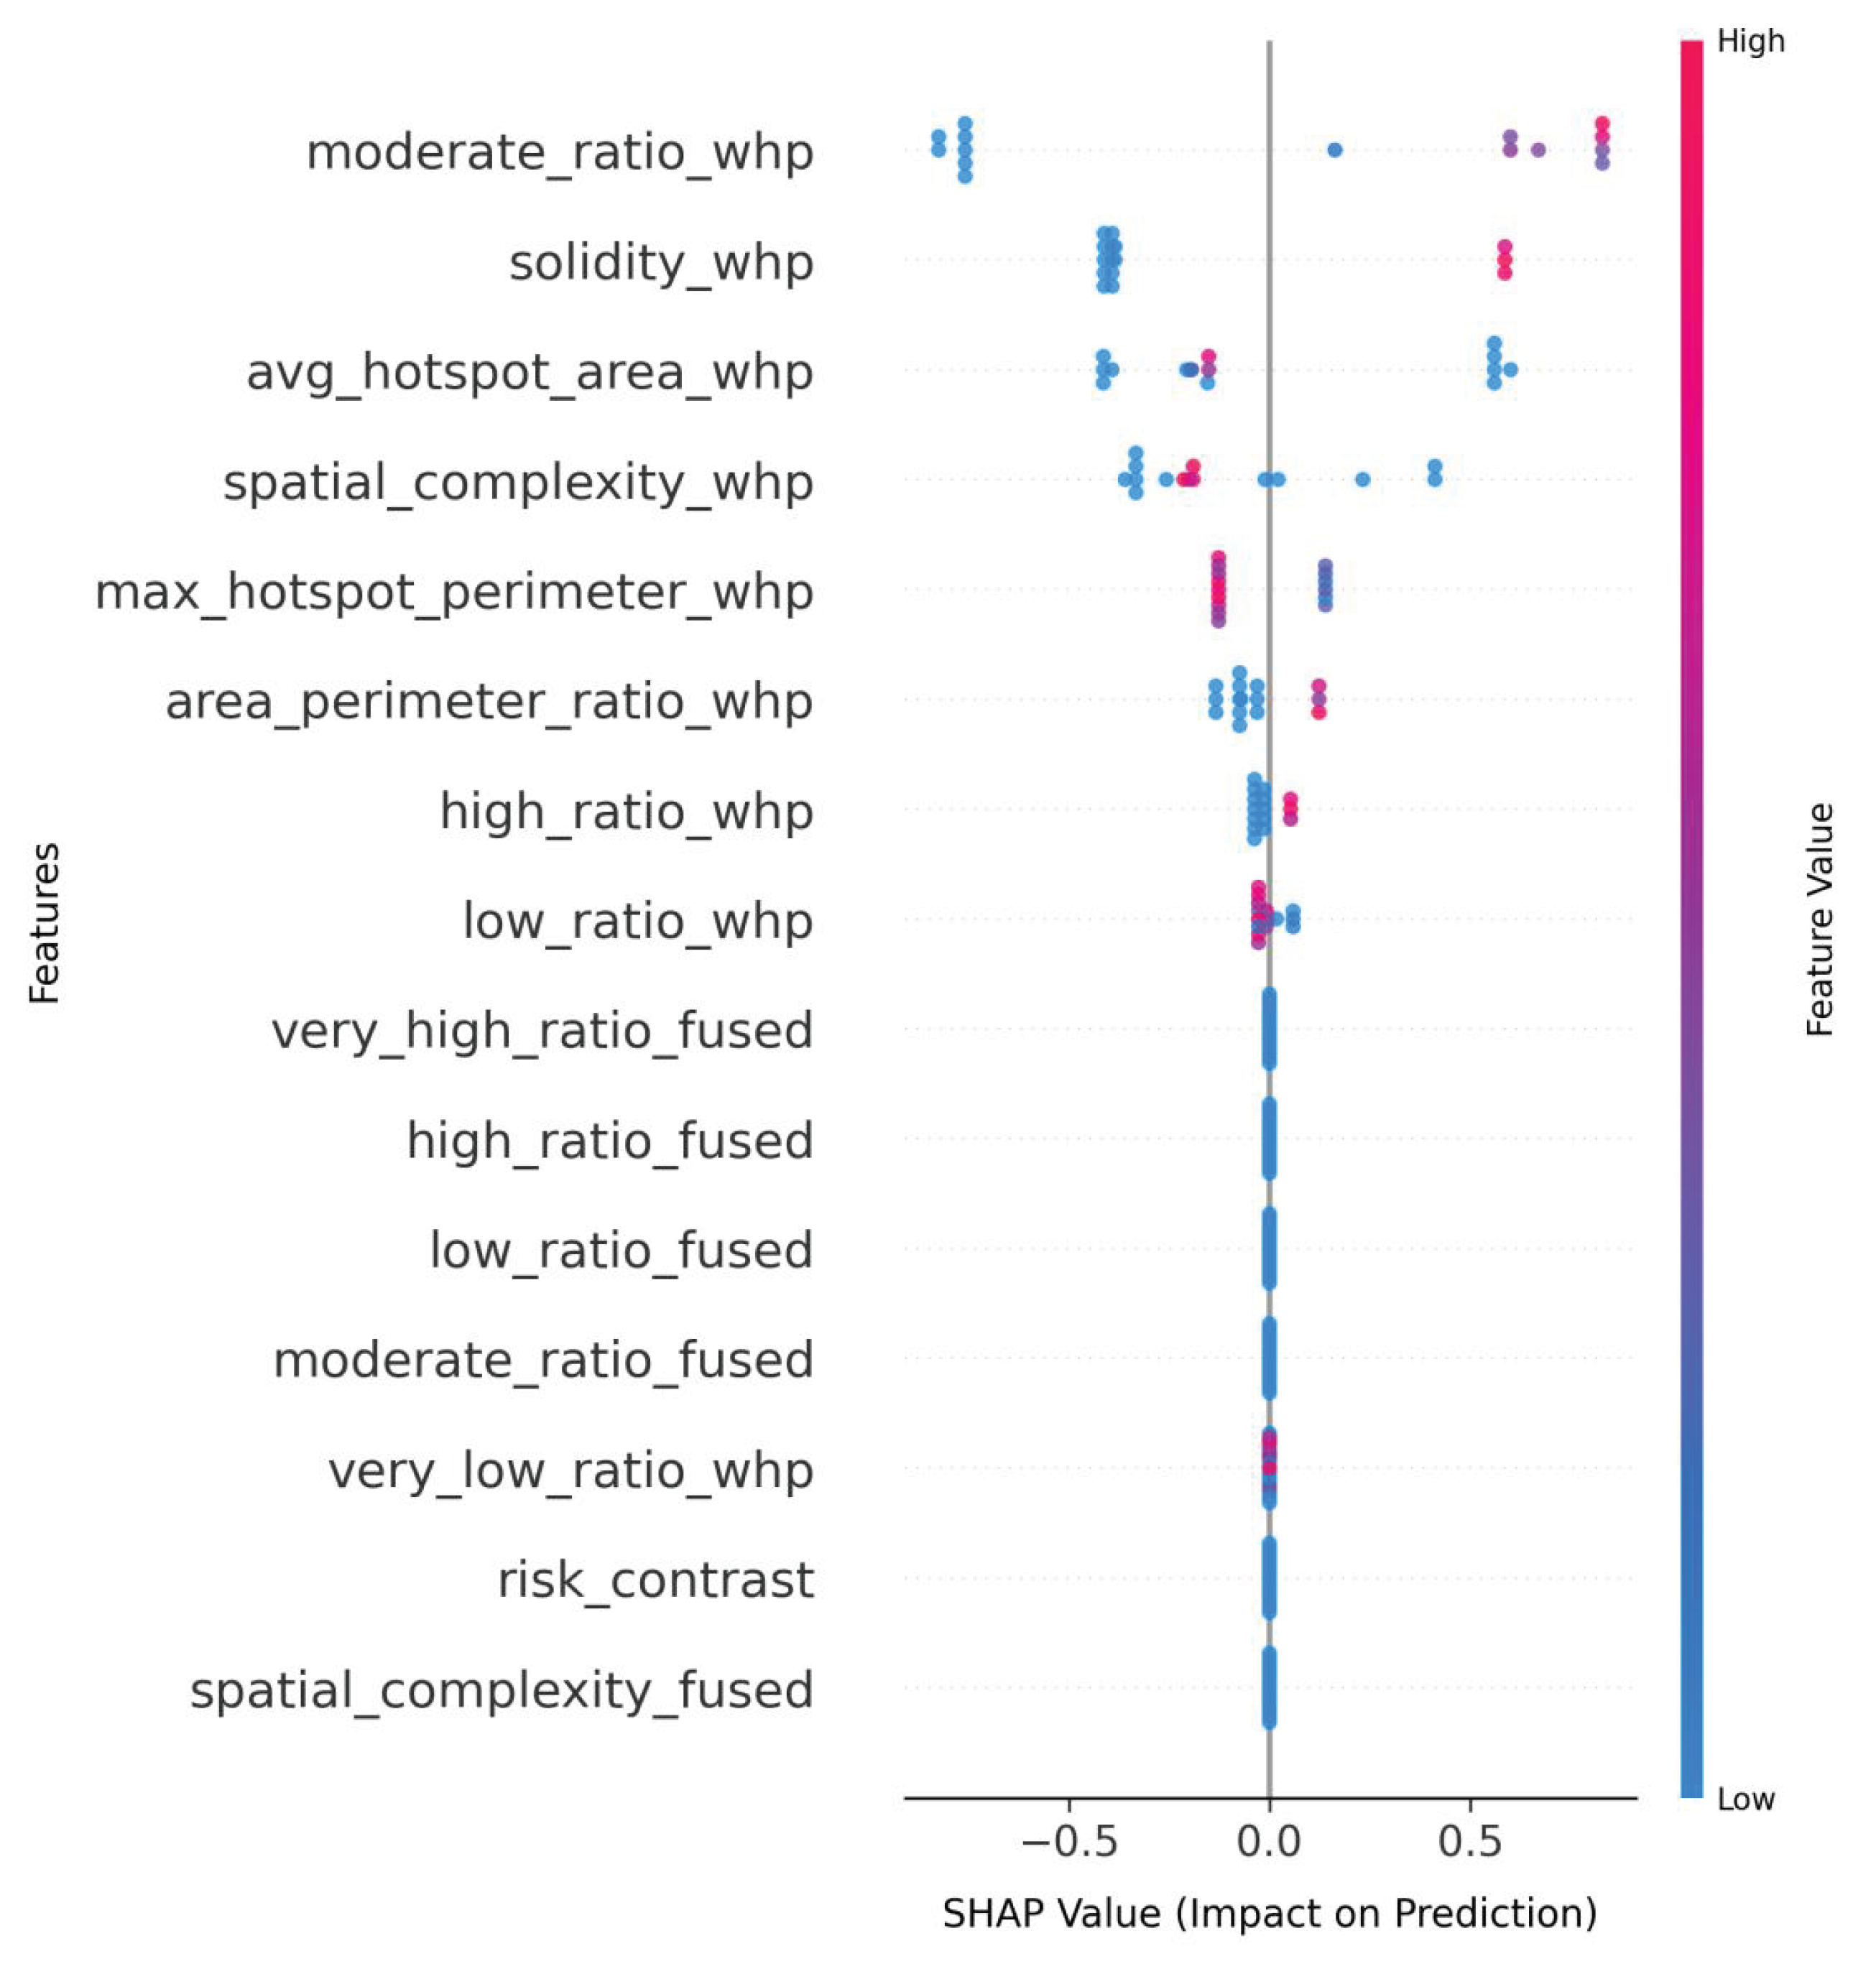
Figure 9.
SVM_fused_shap.
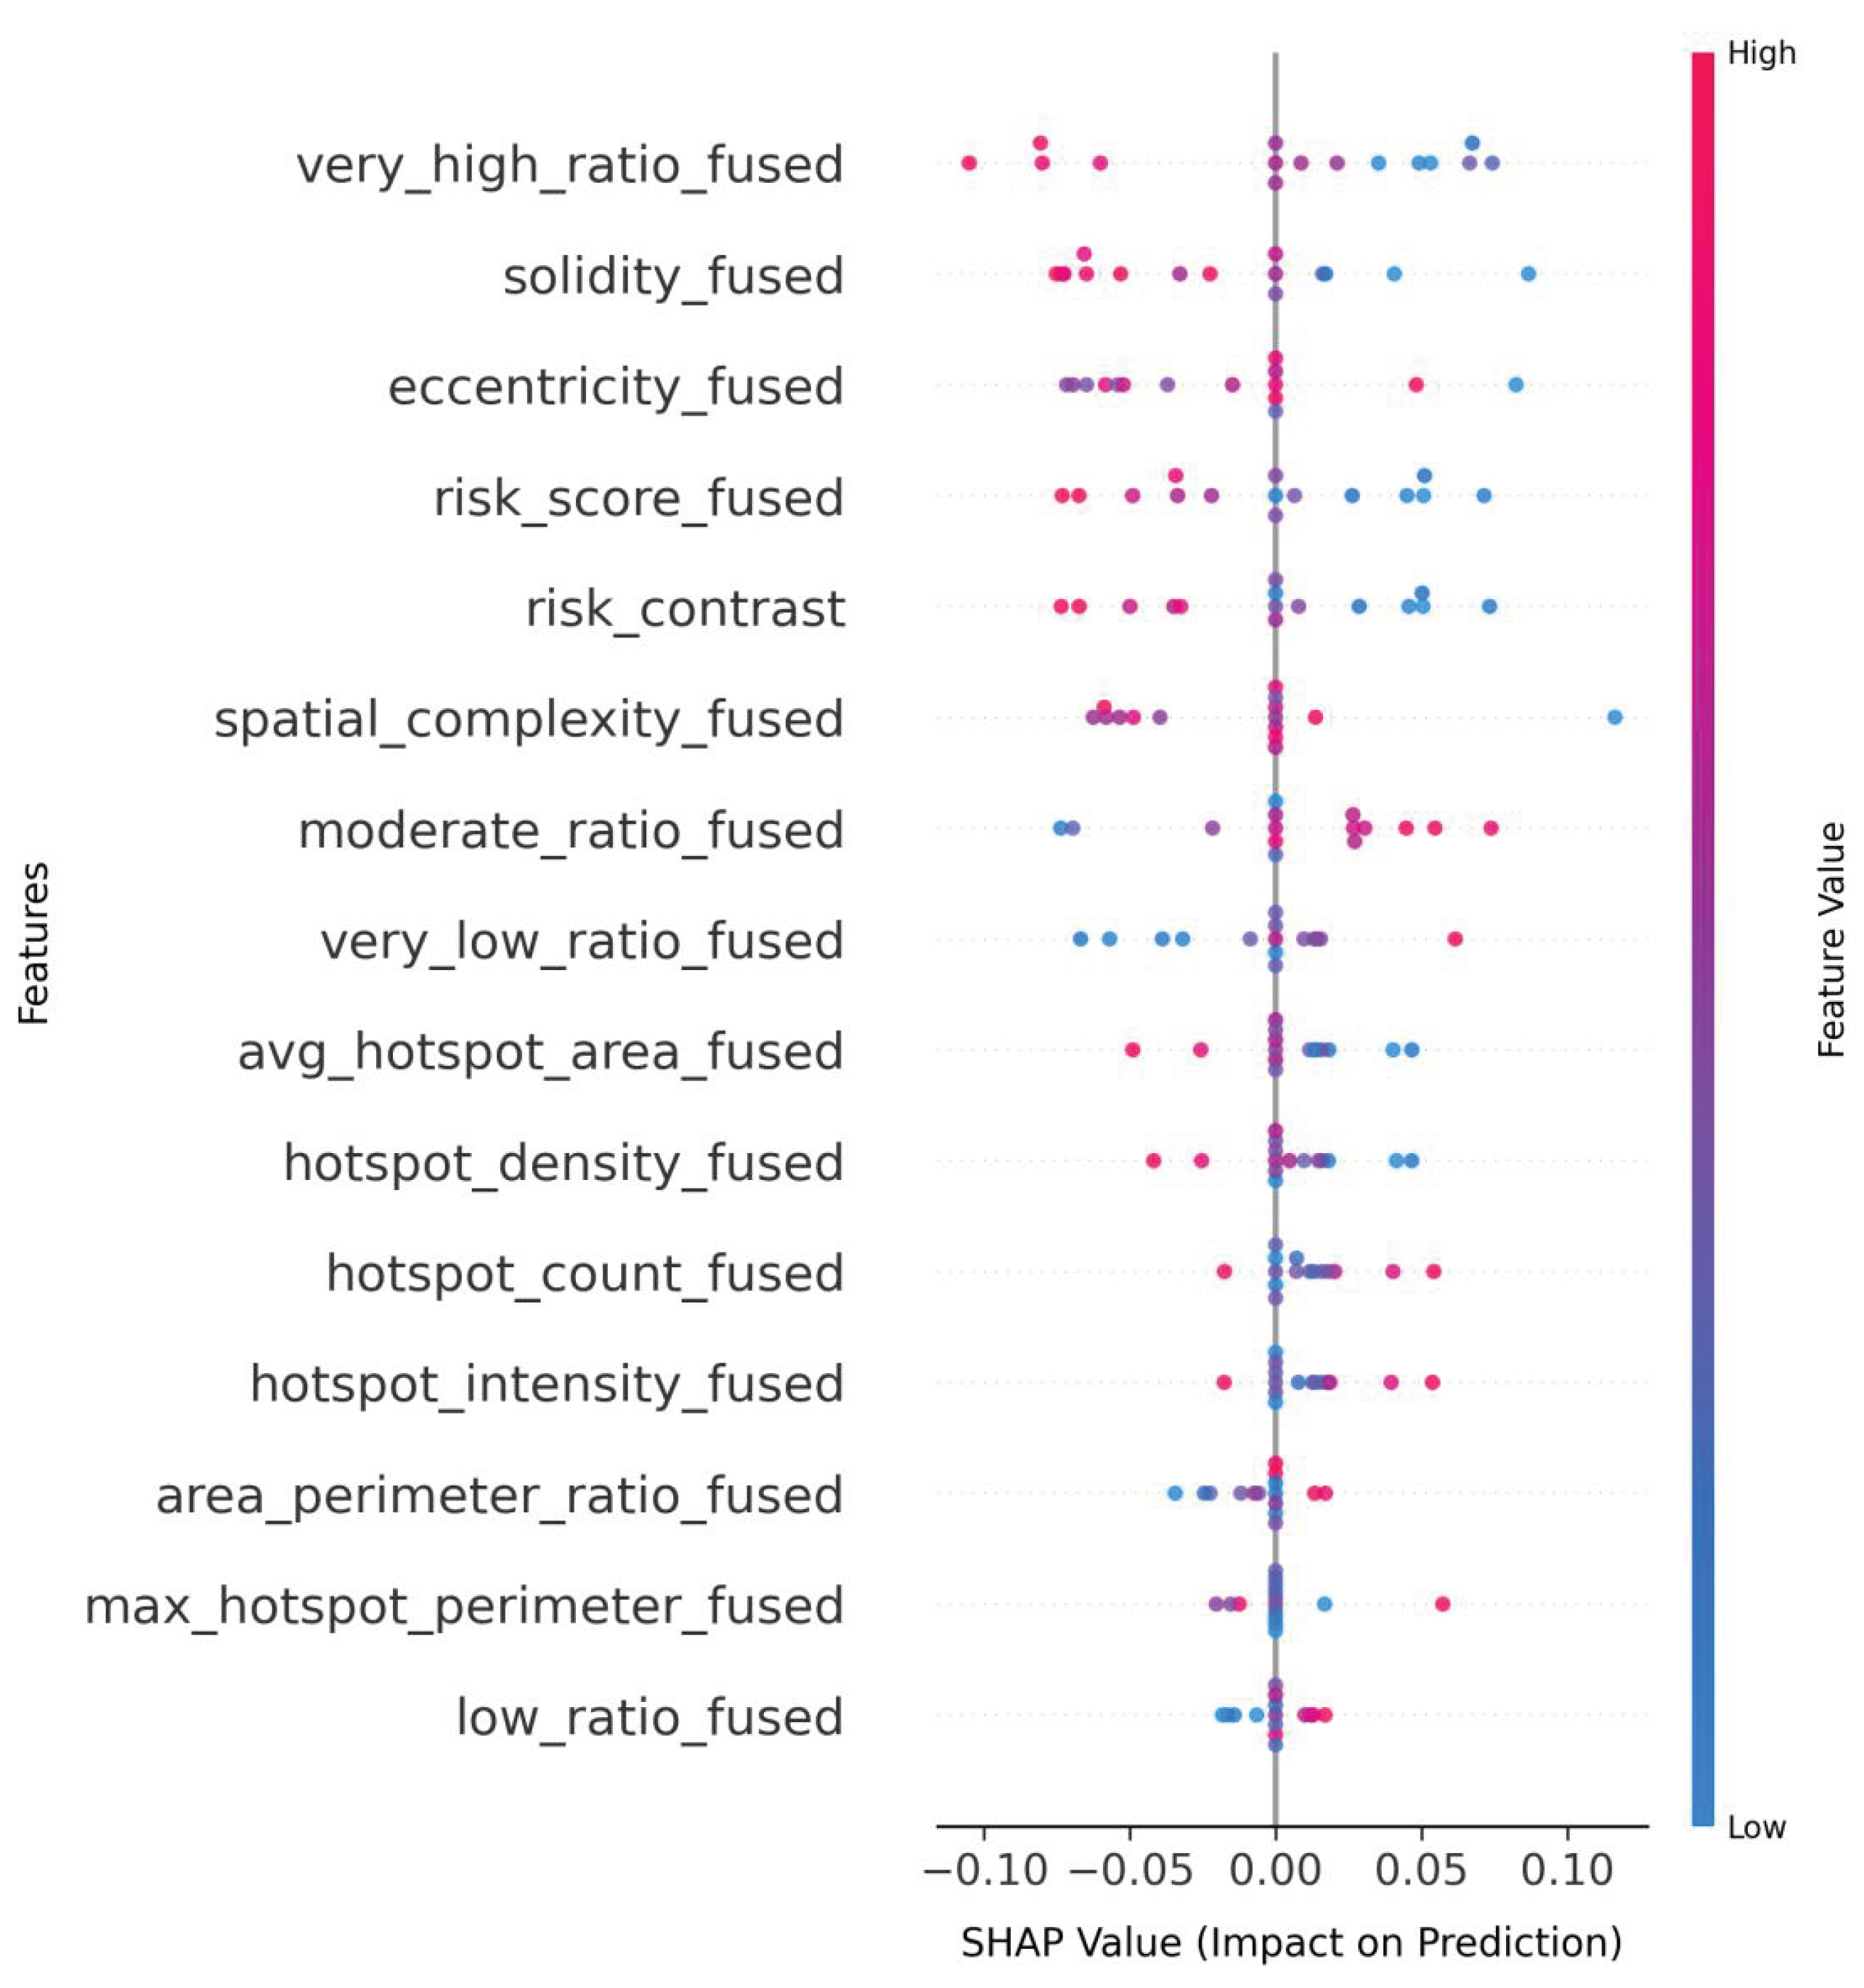
Figure 10.
LSTM_fused_shap.
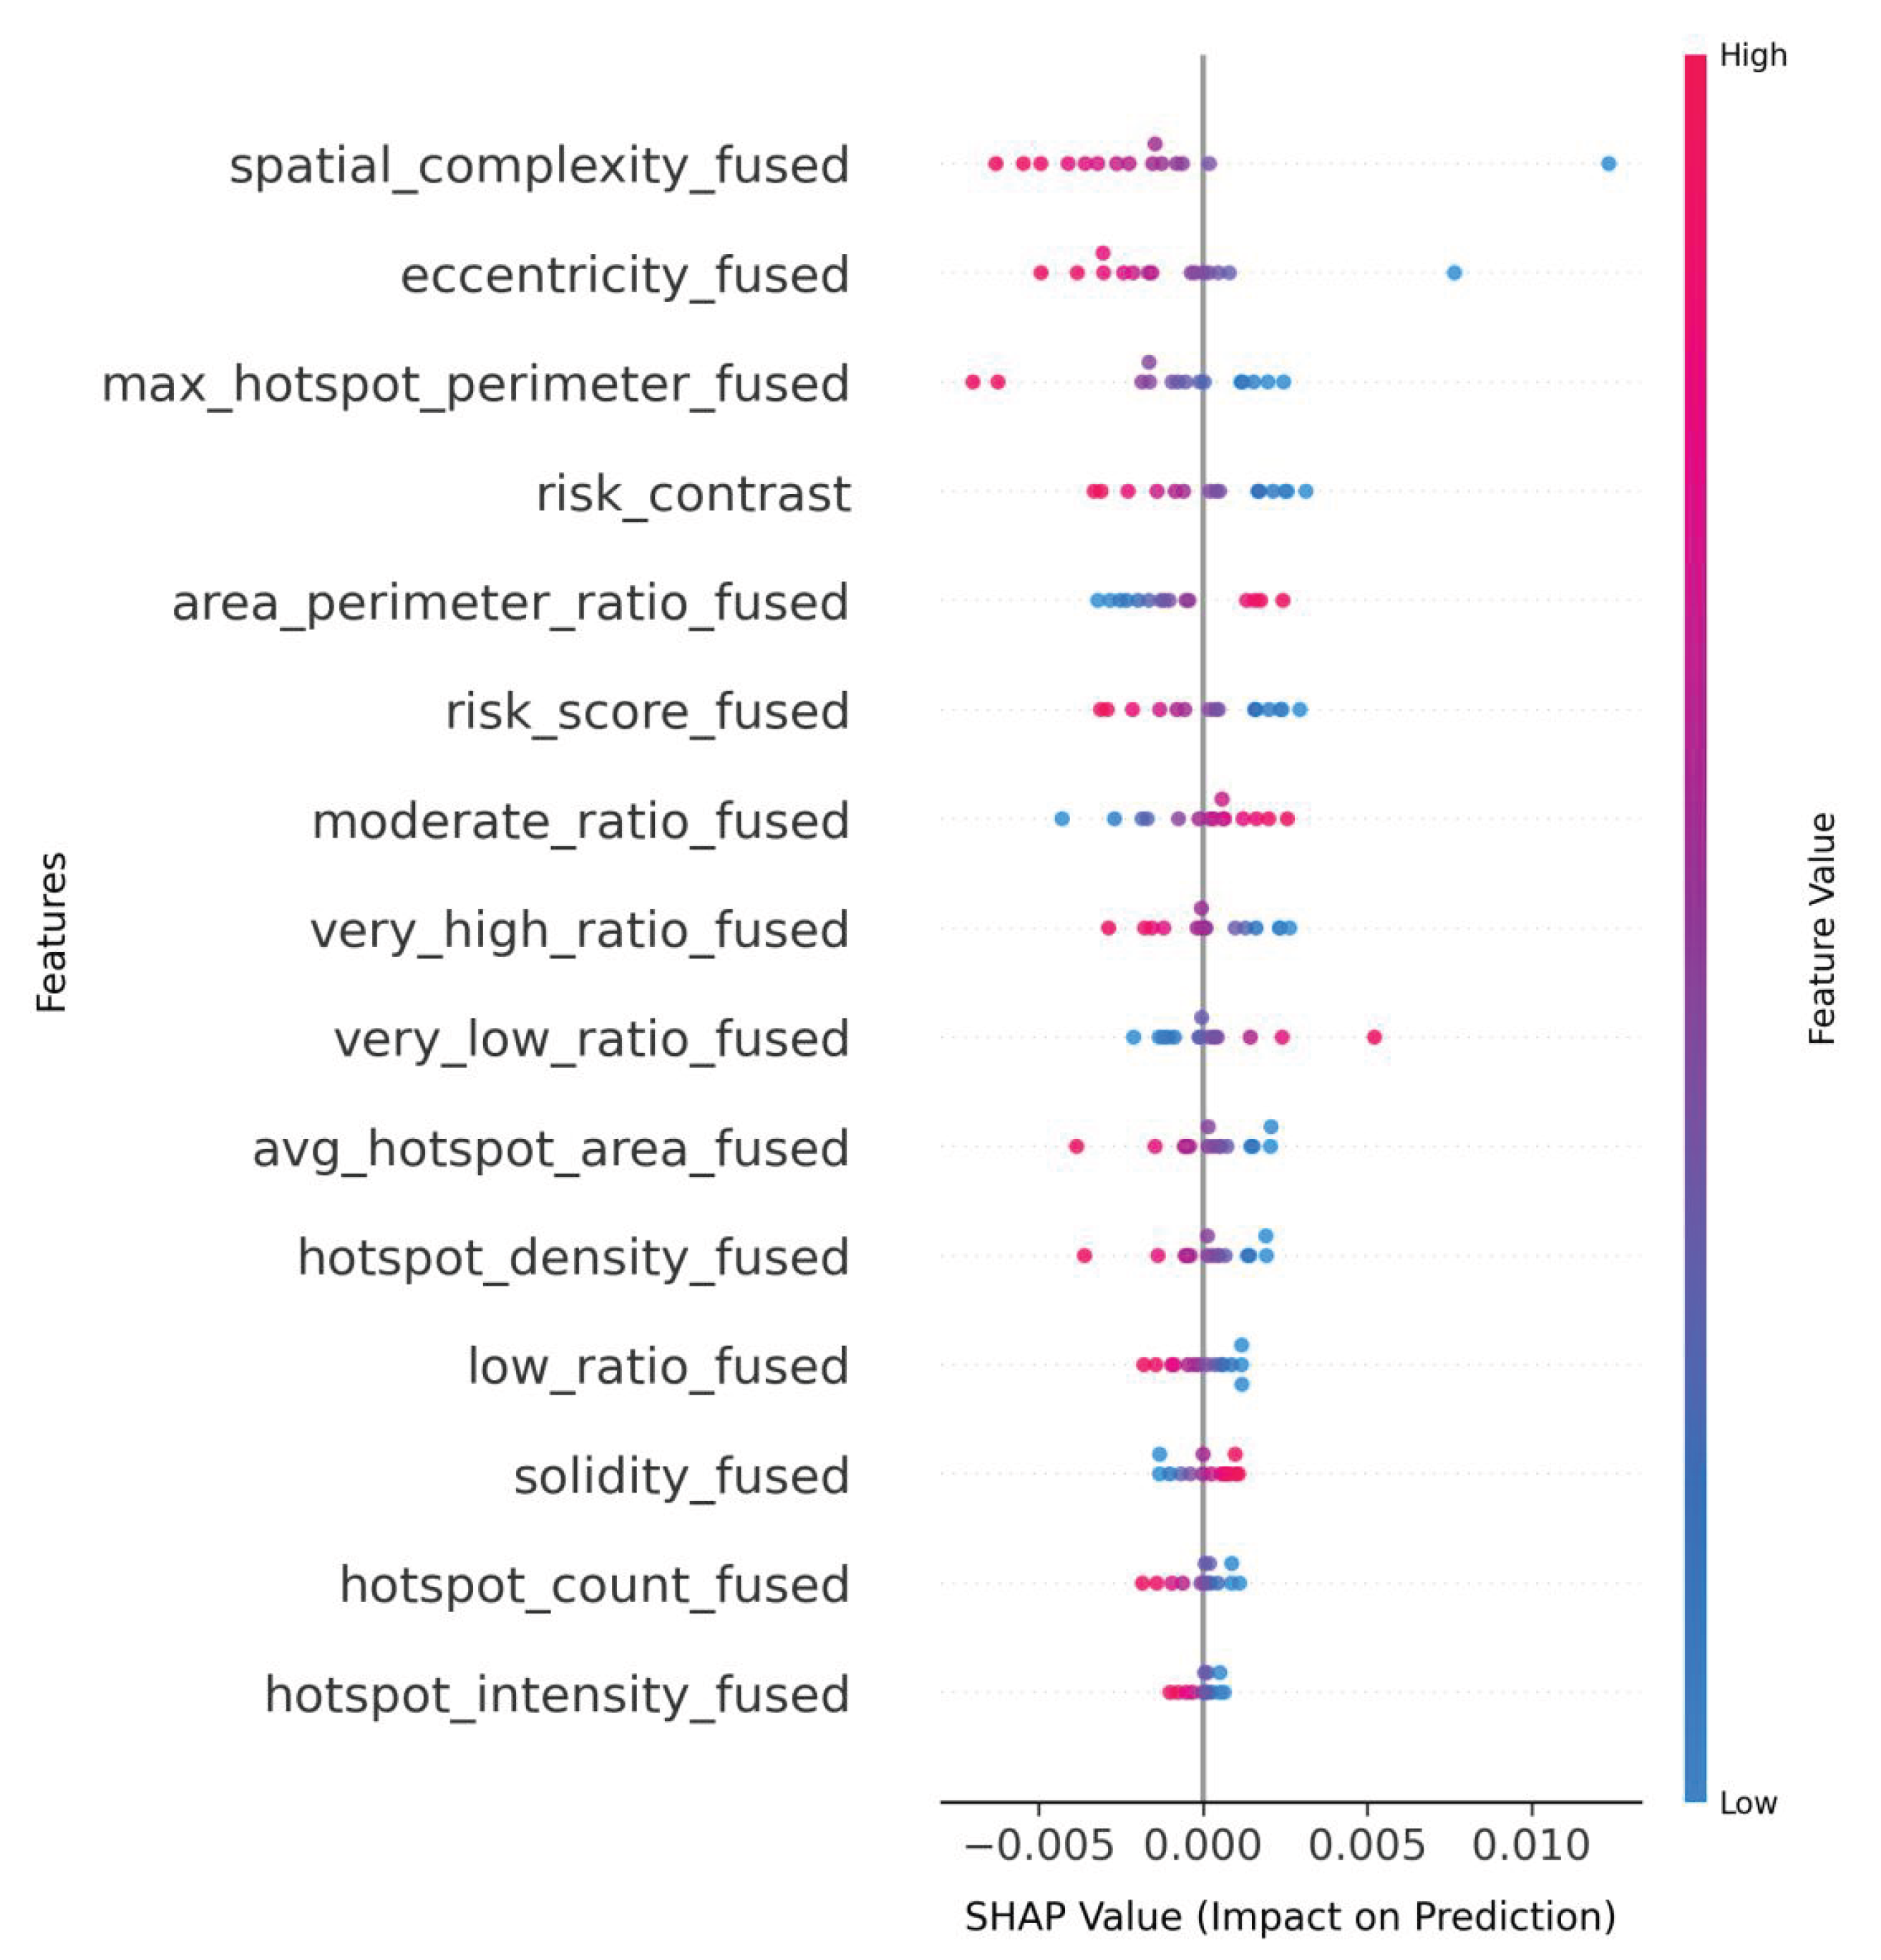
Figure 11.
Transformer_fused_shap.
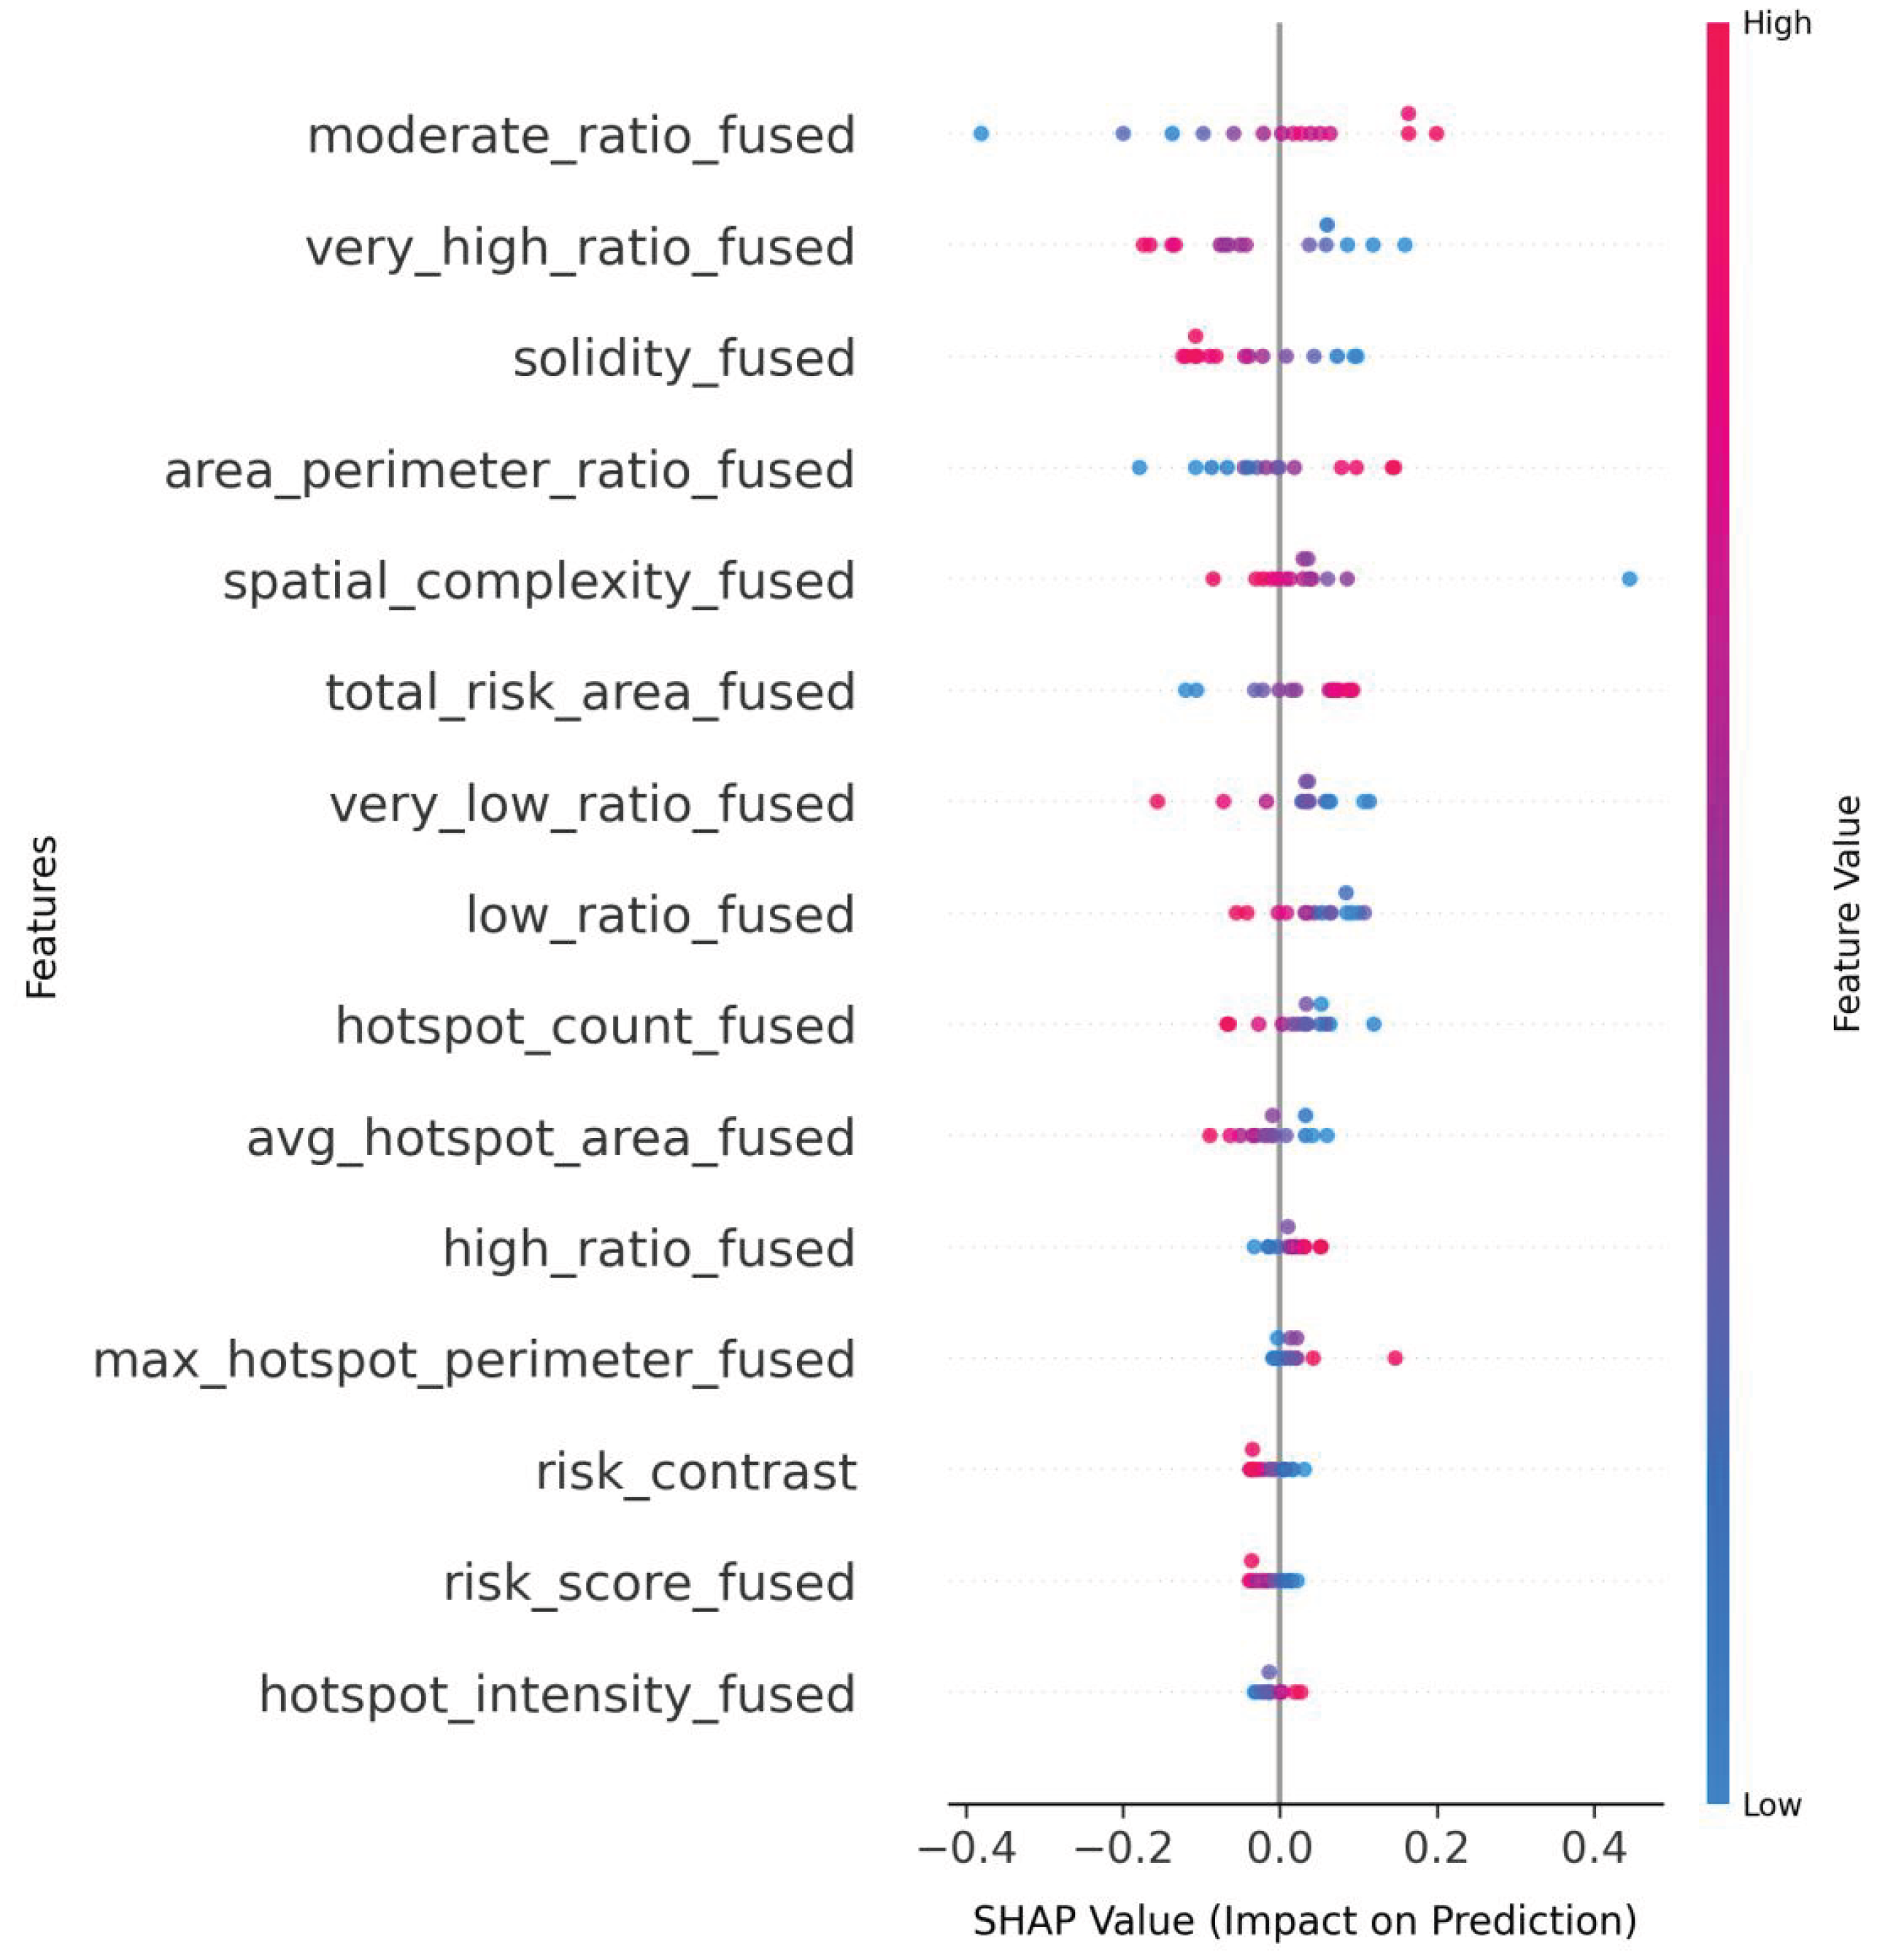
Figure 12.
Progressive performance improvement with feature integration.
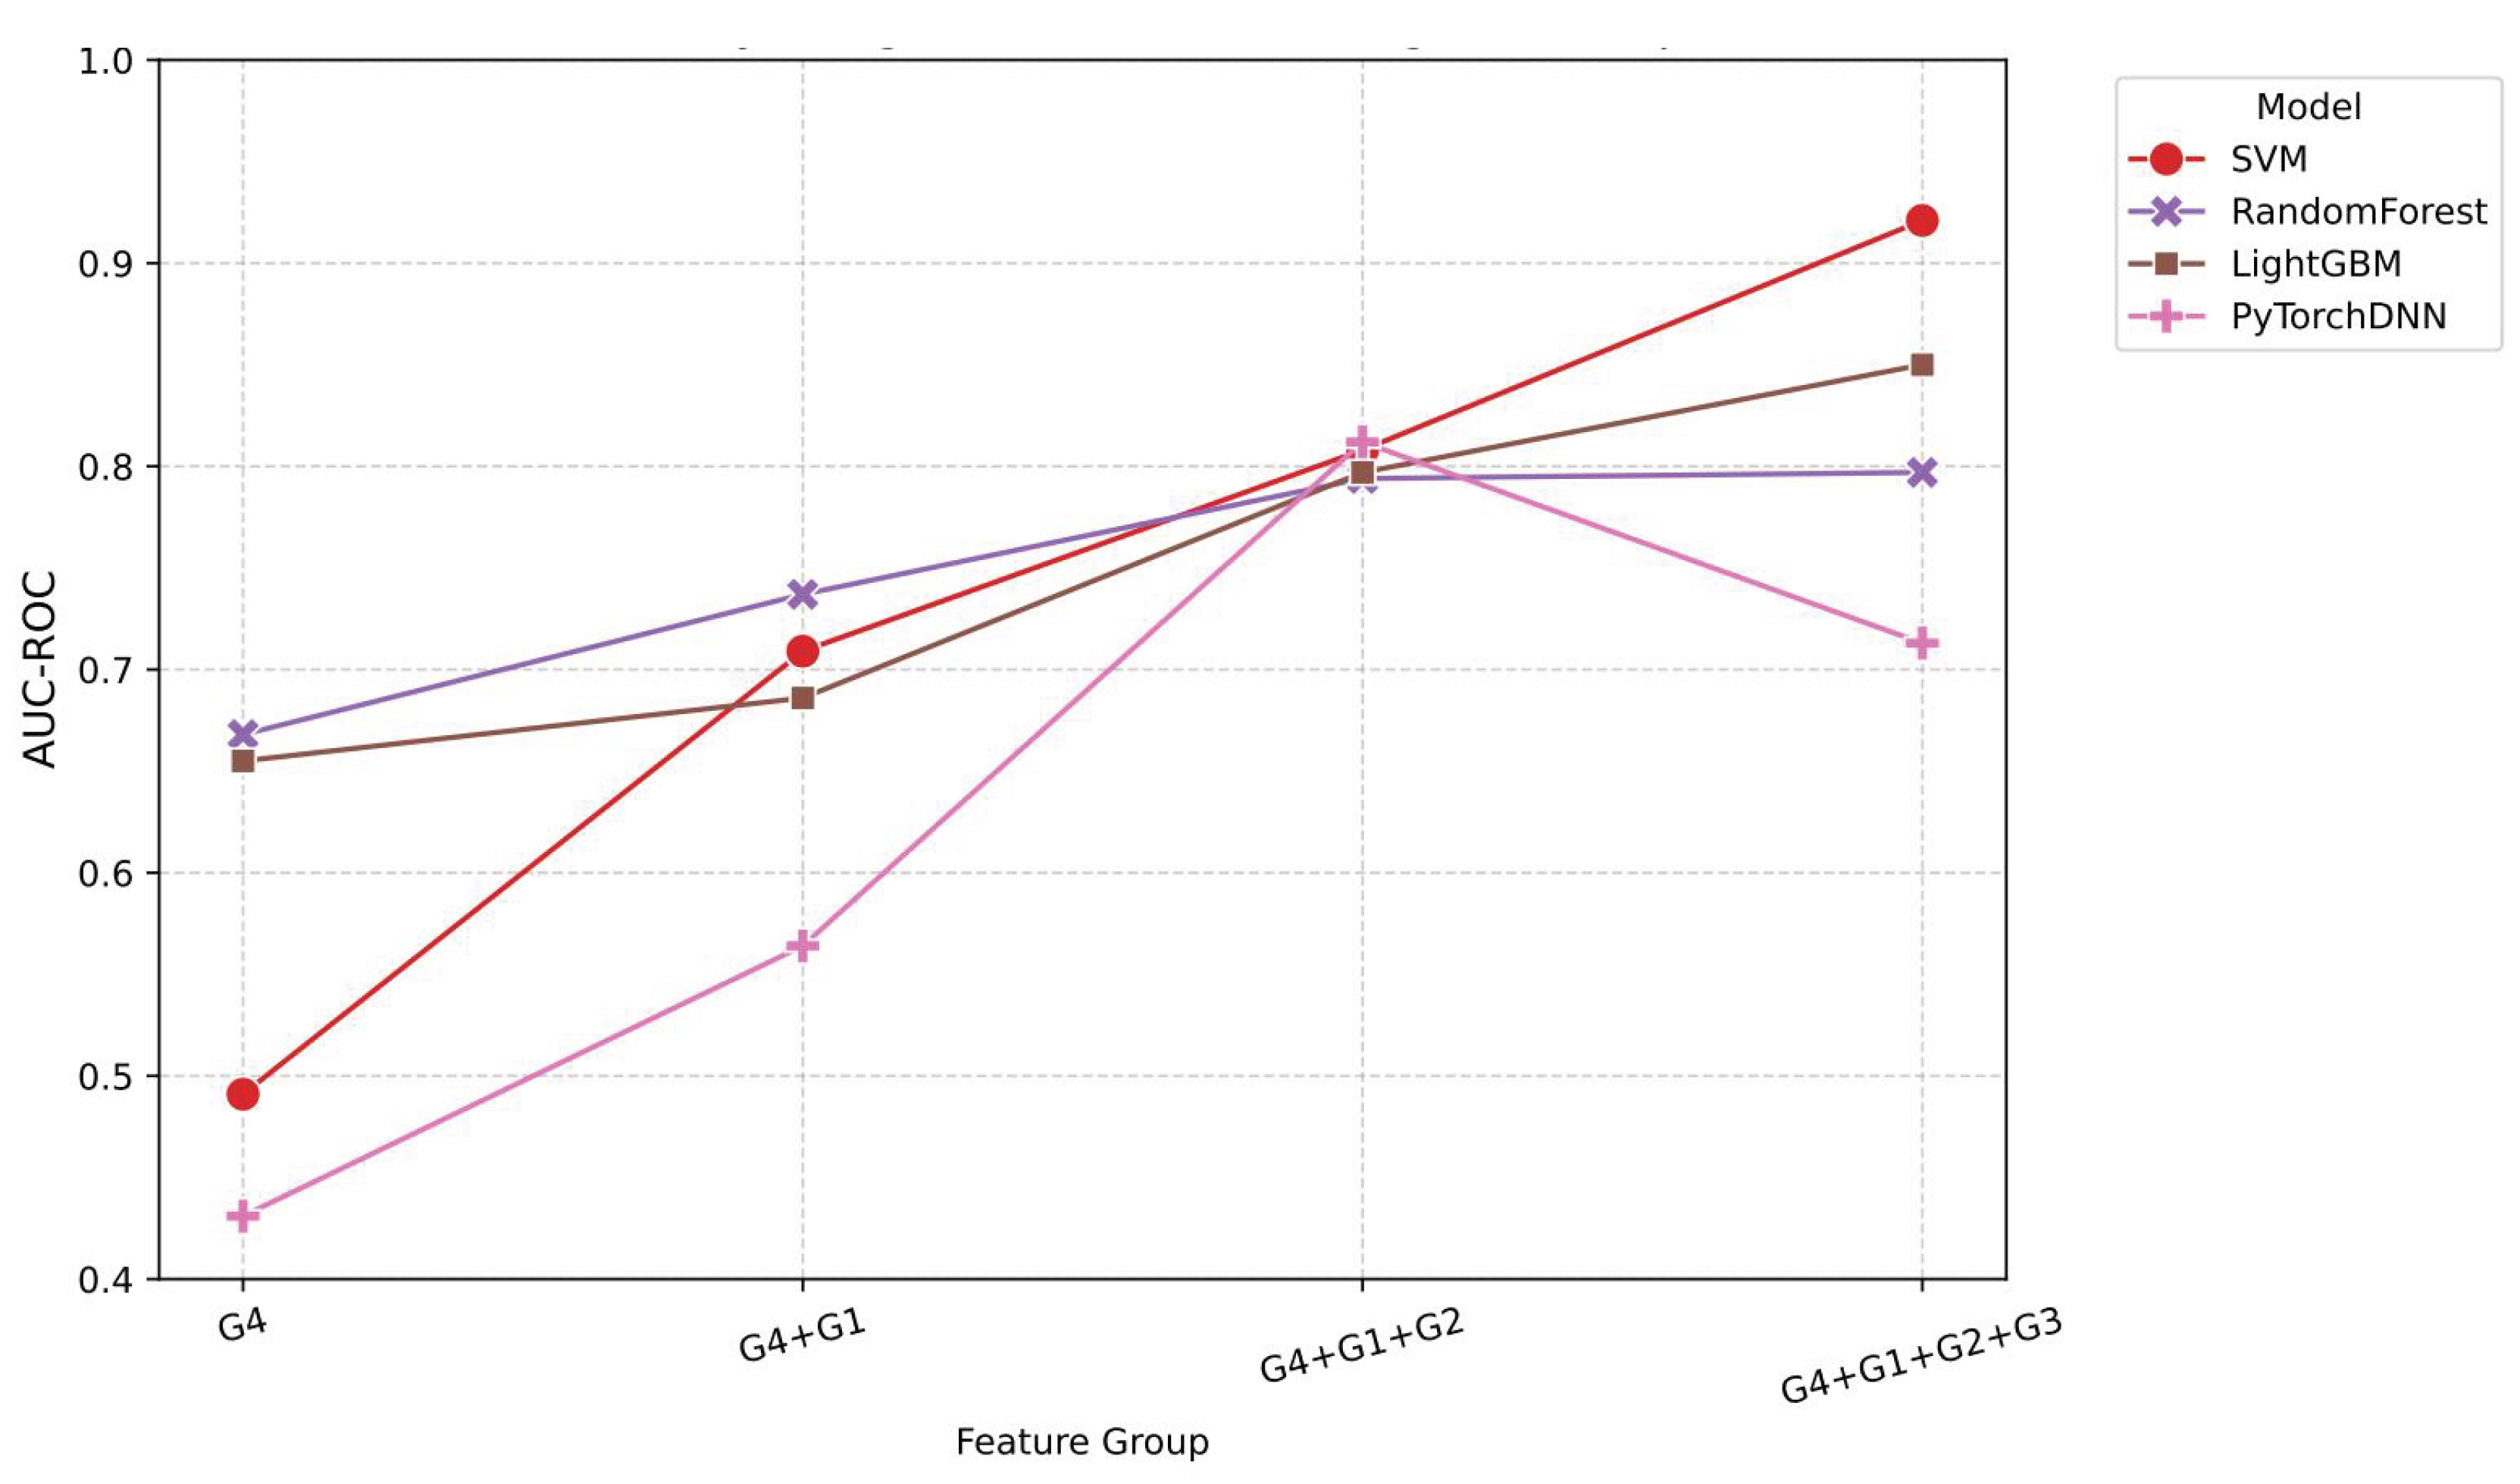
Figure 13.
Quantified contribution of feature groups to model performance. G4: baseline risk, G1: terrain, G2: meteorology, G3: vegetation.
Figure 13.
Quantified contribution of feature groups to model performance. G4: baseline risk, G1: terrain, G2: meteorology, G3: vegetation.
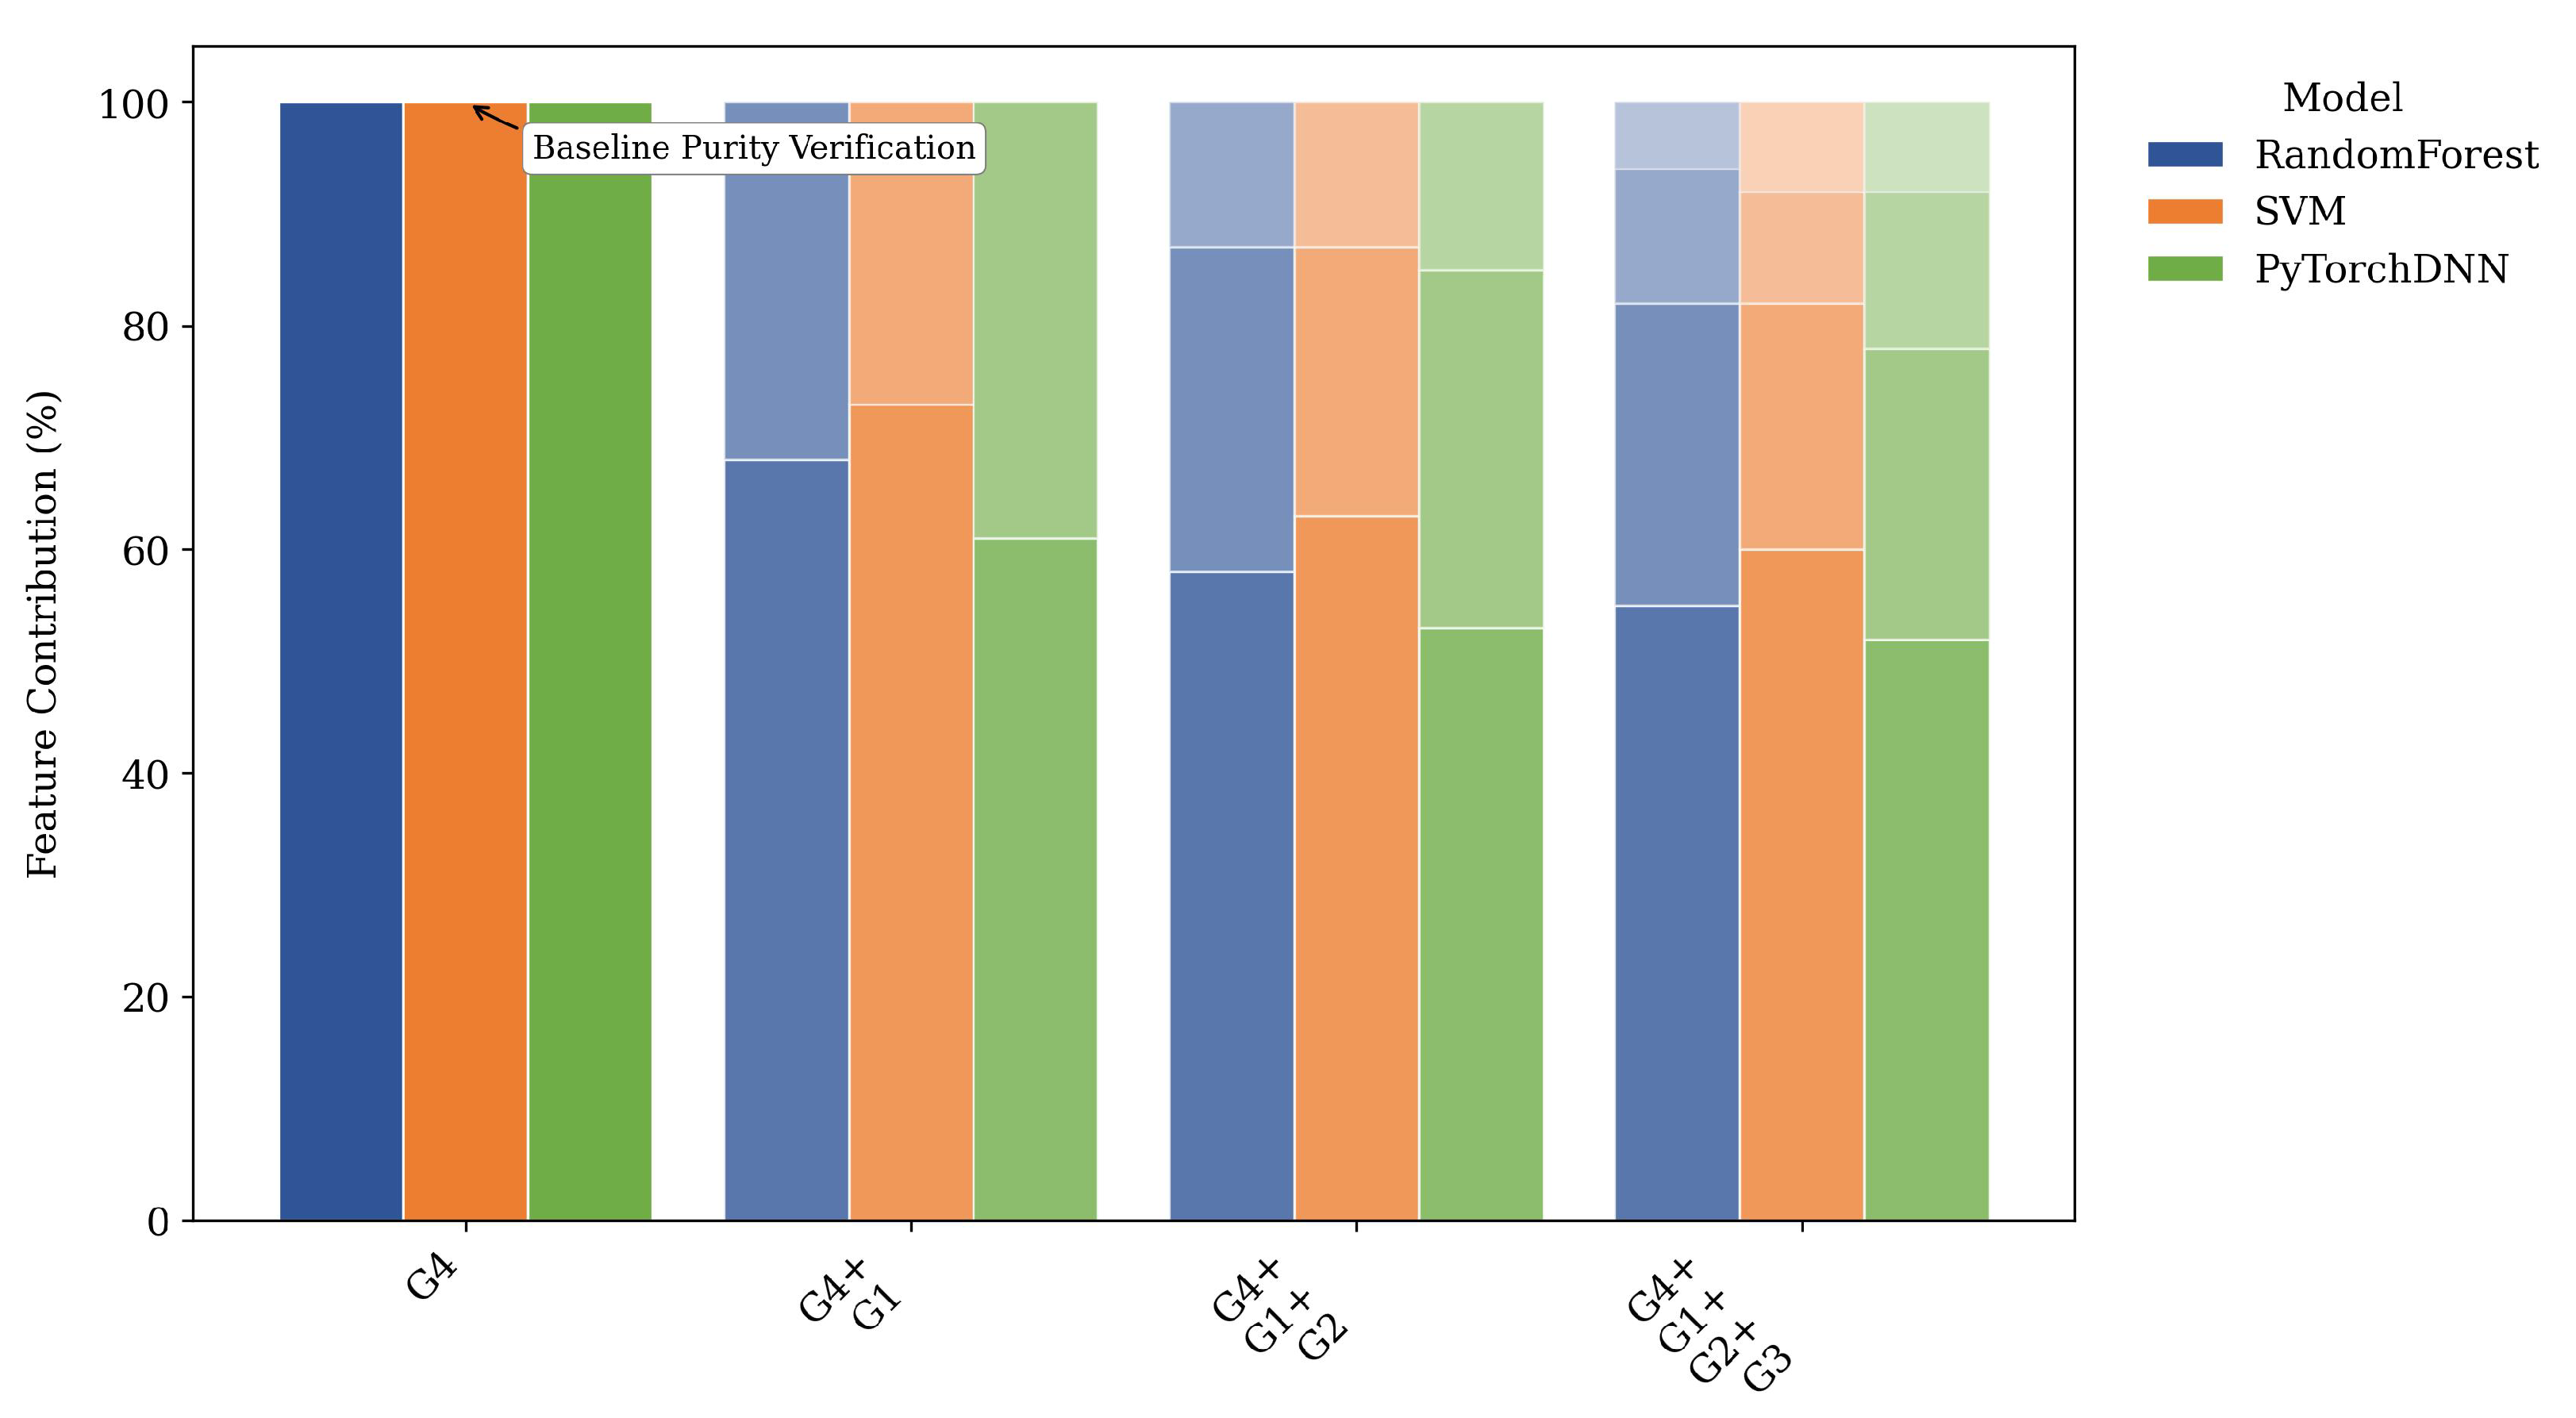

Table 1.
Fire Risk Classification.
| Risk Levels | Possible values (R) |
|---|---|
| Very Low | |
| Low | |
| Moderate | |
| High | |
| Very High |
Table 2.
Performance Metrics for FUSED Dataset.
| Model | AUC-ROC | AP | Accuracy | Recall | Precision | F1 | Specificity | G-Mean | MCC | Train Time (s) | Inference Time (ms/sample) |
|---|---|---|---|---|---|---|---|---|---|---|---|
| SVM | 0.921 | 0.913 | 0.833 | 0.796 | 0.871 | 0.824 | 0.875 | 0.83 | 0.681 | 0.012 | 1.238 |
| RandomForest | 0.836 | 0.87 | 0.718 | 0.721 | 0.718 | 0.718 | 0.718 | 0.719 | 0.439 | 0.73 | 1.748 |
| Transformer | 0.721 | 0.718 | 0.628 | 0.443 | 0.712 | 0.525 | 0.821 | 0.584 | 0.288 | 0.54 | 1.362 |
| EfficientNet | 0.677 | 0.698 | 0.692 | 0.693 | 0.699 | 0.687 | 0.696 | 0.689 | 0.395 | 0.1 | 0.041 |
| MobileNet | 0.661 | 0.682 | 0.64 | 0.746 | 0.642 | 0.67 | 0.546 | 0.611 | 0.313 | 0.117 | 0.035 |
| PyTorchDNN | 0.651 | 0.694 | 0.602 | 0.618 | 0.607 | 0.609 | 0.589 | 0.599 | 0.208 | 0.276 | 0.062 |
| LSTM | 0.593 | 0.632 | 0.575 | 0.875 | 0.617 | 0.673 | 0.275 | 0.256 | 0.173 | 0.303 | 3.474 |
Table 3.
Performance Metrics for NAIP-WHP Dataset.
| Model | AUC-ROC | AP | Accuracy | Recall | Precision | F1 | Specificity | G-Mean | MCC | Train Time (s) | Inference Time (ms/sample) |
|---|---|---|---|---|---|---|---|---|---|---|---|
| RandomForest | 0.801 | 0.825 | 0.705 | 0.636 | 0.765 | 0.674 | 0.768 | 0.686 | 0.428 | 0.716 | 1.746 |
| SVM | 0.738 | 0.774 | 0.679 | 0.536 | 0.768 | 0.62 | 0.818 | 0.655 | 0.379 | 0.036 | 0.186 |
| Transformer | 0.707 | 0.763 | 0.565 | 0.821 | 0.551 | 0.652 | 0.314 | 0.434 | 0.149 | 0.564 | 1.373 |
| MobileNet | 0.699 | 0.765 | 0.655 | 0.721 | 0.639 | 0.666 | 0.579 | 0.608 | 0.329 | 0.121 | 0.044 |
| PyTorchDNN | 0.698 | 0.762 | 0.653 | 0.596 | 0.717 | 0.631 | 0.718 | 0.635 | 0.337 | 0.122 | 1.123 |
| LSTM | 0.646 | 0.73 | 0.628 | 0.582 | 0.72 | 0.585 | 0.65 | 0.482 | 0.267 | 0.301 | 1.226 |
| EfficientNet | 0.642 | 0.731 | 0.602 | 0.536 | 0.628 | 0.575 | 0.668 | 0.593 | 0.207 | 0.12 | 0.048 |
Table 4.
Performance Metrics for FIXED Dtaset.
| Model | AUC-ROC | AP | Accuracy | Recall | Precision | F1 | Specificity | G-Mean | MCC | Train Time (s) | Inference Time (ms/sample) |
|---|---|---|---|---|---|---|---|---|---|---|---|
| RandomForest | 0.874 | 0.812 | 0.718 | 0.739 | 0.704 | 0.719 | 0.696 | 0.715 | 0.439 | 0.739 | 1.781 |
| SVM | 0.782 | 0.817 | 0.742 | 0.746 | 0.739 | 0.739 | 0.743 | 0.742 | 0.491 | 0.01 | 1.243 |
| PyTorchDNN | 0.695 | 0.754 | 0.614 | 0.596 | 0.633 | 0.605 | 0.639 | 0.608 | 0.244 | 0.127 | 0.57 |
| Transformer | 0.671 | 0.728 | 0.576 | 0.593 | 0.603 | 0.568 | 0.571 | 0.544 | 0.179 | 0.519 | 1.339 |
| EfficientNet | 0.639 | 0.688 | 0.551 | 0.821 | 0.533 | 0.638 | 0.286 | 0.45 | 0.16 | 0.105 | 0.058 |
| MobileNet | 0.606 | 0.699 | 0.475 | 0.789 | 0.483 | 0.597 | 0.161 | 0.298 | -0.058 | 0.121 | 0.811 |
| LSTM | 0.533 | 0.612 | 0.54 | 0.4 | 0.486 | 0.378 | 0.661 | 0.345 | 0.08 | 0.304 | 0.143 |
Table 5.
Ablation Study Results.
| Model | AUC-ROC | AP | Accuracy | Recall | Precision | F1 | Specificity | G-Mean | MCC |
|---|---|---|---|---|---|---|---|---|---|
| G4 | |||||||||
| RandomForest | 0.668 | 0.744 | 0.602 | 0.564 | 0.605 | 0.575 | 0.639 | 0.589 | 0.21 |
| PyTorchDNN | 0.431 | 0.546 | 0.503 | 0.414 | 0.507 | 0.429 | 0.575 | 0.427 | 0.167 |
| SVM | 0.491 | 0.648 | 0.528 | 0.414 | 0.567 | 0.463 | 0.596 | 0.437 | 0.002 |
| LightGBM | 0.655 | 0.699 | 0.514 | 0.95 | 0.507 | 0.661 | 0.075 | 0.171 | 0.049 |
| G4+G1 | |||||||||
| RandomForest | 0.737 | 0.766 | 0.639 | 0.693 | 0.662 | 0.714 | 0.671 | 0.358 | 0.365 |
| PyTorchDNN | 0.564 | 0.642 | 0.449 | 0.9 | 0.472 | 0.619 | 0.757 | 0.303 | 0.562 |
| SVM | 0.709 | 0.713 | 0.679 | 0.664 | 0.692 | 0.668 | 0.689 | 0.365 | 0.667 |
| LightGBM | 0.686 | 0.716 | 0.513 | 0.95 | 0.507 | 0.659 | 0.075 | 0.303 | 0.157 |
| G4+G1+G2 | |||||||||
| RandomForest | 0.794 | 0.841 | 0.718 | 0.668 | 0.753 | 0.7 | 0.764 | 0.443 | 0.708 |
| PyTorchDNN | 0.812 | 0.857 | 0.693 | 0.489 | 0.864 | 0.604 | 0.9 | 0.442 | 0.652 |
| SVM | 0.808 | 0.858 | 0.742 | 0.664 | 0.808 | 0.715 | 0.818 | 0.504 | 0.729 |
| LightGBM | 0.797 | 0.852 | 0.562 | 0.95 | 0.542 | 0.686 | 0.175 | 0.158 | 0.303 |
| G4+G1+G2+G3 | |||||||||
| SVM | 0.901 | 0.913 | 0.806 | 0.743 | 0.824 | 0.80 | 0.822 | 0.801 | 0.641 |
| LightGBM | 0.85 | 0.862 | 0.642 | 0.925 | 0.598 | 0.718 | 0.361 | 0.501 | 0.347 |
| RandomForest | 0.797 | 0.784 | 0.759 | 0.746 | 0.779 | 0.743 | 0.768 | 0.739 | 0.54 |
| PyTorchDNN | 0.713 | 0.803 | 0.552 | 0.404 | 0.75 | 0.426 | 0.7 | 0.165 | 0.443 |
Table 6.
Regional Wildfire Prediction Performance (Top 5 High-Risk Ecoregions).
| Region ID | Name | Bounding Box | Fire Pixels | Hits | Hit Rate |
|---|---|---|---|---|---|
| 28 | Carlsbad Caverns, NM | (-104.5,32.0) - (-104.0,32.5) | 37,500 | 32,351 | 86.27% |
| 38 | Big Bend NP, TX | (-103.5,29.0) - (-103.0,29.5) | 20,000 | 16,498 | 82.49% |
| 10 | Arches NP, UT | (-109.5,38.5) - (-109.0,38.9) | 16,250 | 12976 | 79.87% |
| 45 | Gulf Coast Refinery, TX | (-94.5,29.5) - (-94.0,30.0) | 2,063,250 | 1599257 | 77.61% |
| 47 | Lake Tahoe West, NV | (-120.0,39.0) - (-119.5,39.5) | 30,000 | 22542 | 75.14% |
Notes: NP=National Park; Hit Rate = Hits / Fire Pixels. Fire masks derived from MODIS/VIIRS [23] fusion (500m resolution).
Table 7.
Indirect comparison of FireRisk and FireRisk-Multi.
| Characteristics | FireRisk | FireRisk-Multi |
|---|---|---|
| Modality | RGB | Four-layer modality fusion |
| Label Source | WHP2020 | WHP2023 |
| Risk Level | 7-class | Continuous |
| Dynamic Weighting | ✗ | ✓ |
| Accuracy | MAE 65.29% | SVM 83.3% |
Disclaimer/Publisher’s Note: The statements, opinions and data contained in all publications are solely those of the individual author(s) and contributor(s) and not of MDPI and/or the editor(s). MDPI and/or the editor(s) disclaim responsibility for any injury to people or property resulting from any ideas, methods, instructions or products referred to in the content. |
© 2025 by the authors. Licensee MDPI, Basel, Switzerland. This article is an open access article distributed under the terms and conditions of the Creative Commons Attribution (CC BY) license (http://creativecommons.org/licenses/by/4.0/).
Copyright: This open access article is published under a Creative Commons CC BY 4.0 license, which permit the free download, distribution, and reuse, provided that the author and preprint are cited in any reuse.


