Submitted:
09 June 2025
Posted:
11 June 2025
You are already at the latest version
Abstract
Francis Fukuyama's "End of History" thesis, predicting the triumph of liberal democracy and free-market capitalism after the Cold War, faces challenges from recent events, particularly the trade policies of Donald Trump's presidency. Characterized by tariffs and protectionism, these policies have cast doubt on the future of globalization. Trump's tariffs have disrupted established trade patterns and injected significant uncertainty into financial markets. Our research reveals a substantial impact across nearly all asset classes, with trade-related shocks explaining a significant portion of market volatility. These shocks operate by shifting investor expectations about economic growth and increasing perceived risk. Companies who are heavily reliant on exports to target markets have been particularly vulnerable to these financial disruptions, experiencing heightened volatility.
The implementation of tariffs also coincided with rising inflation concerns, leading to potential market reactions like increased bond yields. Historically, trade disruptions have been linked to financial crises. Trump's tariffs, by influencing inflation and creating trade instability, have contributed to market volatility. The research utilizes daily data on key financial variables and macroeconomic announcements, employing a Vector Autoregression (VAR) model to analyze the effects. The findings reveal significant market volatility and sector vulnerability due to trade-related shocks, which alter investor expectations and increase perceived risks. The implementation of tariffs has also been linked to rising inflation concerns, influencing market reactions such as increased bond yields. Historical parallels are drawn to previous financial crises, emphasizing the potential for tariffs to contribute to financial instability. The study underscores the sensitivity of global financial markets to trade policy shifts and highlights the broader economic implications of protectionist policies. These results provide empirical evidence that contemporary trade policies can disrupt financial stability, challenging the assumed trajectory of globalization and the stability promised by liberal democratic governance.
Keywords:
trade shocks
; financial markets
; VAR
; impulse response
1. Introduction
Following the election of Donald Trump as President of the United States in 2017, a sharp transformation occurred in the global trade regime, replacing the decades-long principles of free trade and multilateralism with a protectionist approach. The trade war between the US and China, which began in 2018, marked a clear departure from the rule-based multilateral trading system. The tariffs imposed by the US on even its allies created uncertainty in the global trade system, leading to market concerns and increased volatility in financial markets. Global markets responded harshly to Trump’s protectionist policies, resulting in sharp declines in stock prices and fluctuations in exchange rates. Investors, in particular, increased their tendencies toward safe-haven assets such as US Treasury bonds and the Japanese yen. Trump has continued to carry out tariff threats and implementations during his new term in office. In April 2025, the introduction of comprehensive new tariffs and measures described as the most severe trade barriers of the past century caused a loss of $2.4 trillion in stock markets, marking the largest daily loss since the March 2020 pandemic crisis. As protectionist rhetoric and policy uncertainty gained momentum once again, the Trade Policy Uncertainty (TPU) index reached historic highs, and the Volatility Index (VIX), a key indicator of market volatility, tested record levels. Unusual fluctuations in US Treasury yields reflected fundamental changes in risk perception.
These economic upheavals have also sparked an important theoretical debate. After the Cold War, Francis Fukuyama’s “End of History” thesis suggested that liberal democracy and free-market capitalism represented the final form of human political and economic organization. Today, however, the nationalist and protectionist wave heightened during the Trump era has reopened this thesis for reconsideration. The liberal international order, which has endured for nearly seventy years, has been undermined, and the very existence of this system is now being questioned. The claim of “the final form of human governance” is once again being tested in the face of rising protectionist tendencies. This study aims to contribute to the re-evaluation of Fukuyama’s “End of History” thesis in contemporary conditions while empirically examining the impact of Trump’s protectionist trade policies on global financial markets. In this context, the study analyzes market volatility, investor expectations, bond interest rates, and risk premium indicators, focusing on the period of uncertainty. The study employs high-frequency market data from the 2018-2025 period within the framework of the Vector Autoregression (VAR) model to explore the effects of trade policy shocks on financial markets.
2. Literature
Amiti et al. (2019) analyzed and measured the effects of the trade war between the United States and its trading partners in 2018 on prices and welfare. As a result of the implemented import tariffs, they found a significant increase in the prices of intermediate and final goods, while estimating a loss in real income. The study revealed a monthly welfare loss of $1.4 billion and determined that the 10% tariff imposed led to a 10.4% increase in prices. This process of de-globalization and the implementation of protectionist trade policies, even in the short term and with full pass-through, proved detrimental to the domestic economy. Unilateral protectionist actions also heightened uncertainty in financial markets.
Caldara et al. (2020) aimed to examine the effects of uncertainty in international trade policies on the U.S. economy. They identified the damage caused by protectionist policy tendencies on global economies. While the study measured the impact on investment using panel regression and time series methods, it employed a macro-level VAR model to estimate the effects on total investment and output. According to the findings, sudden changes in trade policy (such as tariff increases) significantly reduce business investments. The uncertainty shock was found to lower the level of fixed capital investment by 1–2% and to adversely affect overall economic activity.
Baker et al. (2016) developed a new index measuring economic policy uncertainty (EPU) and analyzed its economic impacts. In a study conducted on twelve major economies, uncertainty indices were created, enabling international comparisons. The effects of policy uncertainty during periods of high volatility on stock prices, investment, and employment were also examined. It was determined that economic uncertainty is a measurable concept and that it has a significant impact on the economy. The EPU index has become an important tool for measuring the effects of uncertainties arising from developments such as protectionism, wars, and financial crises on financial markets.
Rodrik (2018) explores an alternative model of globalization, arguing that the current form of globalization poses a challenge to economic stability. In his book, which critically examines the concept of hyper-globalization, he highlights political polarization and the rise of protectionism.
The study by Funke et al. (2020) includes a sample of 51 populist presidents and prime ministers between 1900 and 2020, analyzing their effects on economic growth and stability. To measure economic performance, the study incorporated variables such as inflation, exchange rates, public debt, and financial indicators. Under populist leadership, a 10% decline in real income was observed, along with medium-term inflationary pressures. A key finding of these periods was the process of disintegration, with a tendency to partially detach from the global economic order. As a result of this trend, medium-term consequences included the loss of fiscal discipline, weakening of institutions, and increases in country risk premiums, leading to capital outflows.
In their 2023 study, Ang and Wang examined the impact of political uncertainties triggered by the enactment and subsequent repeal of the Smoot-Hawley Tariff Act on financial markets. Focusing on how trade policy uncertainty is reflected in financial markets, the study analyzed market responses on 16 key event dates. Covering the period from 1929 to 1935, it was found that the U.S. stock market experienced an average loss of 3.6% on each key event date, alongside significant increases in stock return volatility.
Boer and Rieth (2024) investigated the macroeconomic effects of import tariffs and trade policy uncertainty in the United States, identifying their impact on growth, trade, investment, and employment. The study employed a DSGE model and used data on gross domestic product (GDP), imports, exports, investment, the consumer price index, and the nominal effective exchange rate for the period 1960–2019. Based on the analysis conducted using the SVAR method, the study found persistent negative effects on GDP, a depreciation in the exchange rate, and a decrease in import and investment rates, while export levels increased. It is projected that reversing protectionist policies would lead to a cumulative output increase of 4% over three years. The protectionist measures implemented particularly in 2018–2019 resulted in a 2% decline in output.
3. Methodology
Sims (1980) criticized the temporal restriction of definitions in the simultaneous equation system and the temporary classification of endogenous/exogenous variables. VAR assumes that all variables under study are endogenous. It presents the vector of endogenous variables as an autoregressive function of their lagged values. Although this model includes seasonal dummies and trends, it is essential that all variables are perceived as endogenous (Baltagi, 2011: 378). As per the existing literature, the VAR method has been demonstrated as a coherent and credible approach (Stock and Watson, 2001). The VAR model can be presented as follows:
This equation models how an asset’s return Yt depends on its past performance Yt-1, Yt-2, Yt-3. The coefficients β1, β2, β3 capture the influence of these past returns. In Vector Autoregression (VAR) models, each variable is predicted by its own history, similar to Yt here. VAR models are best suited for stable data (stationary series) and require choosing the most impactful lags Yt-1, Yt-2 and etc.
The VAR model has many advantages and disadvantages (Brooks, 2008: 292-293). The Vector Autoregression (VAR) model offers several distinct advantages over traditional econometric techniques. Notably, its endogenous treatment of all variables enables the simultaneous estimation of their interdependencies, a crucial feature for understanding complex economic systems. Furthermore, the VAR model’s multivariate nature allows for a more nuanced examination of the dynamic relationships between variables, capturing intricate patterns and features that may be overlooked in univariate models. This increased flexibility often leads to more accurate and informative forecasts compared to traditional structural models.
However, the VAR model is not without its limitations. One significant drawback is its lack of theoretical underpinnings. While it can effectively describe the empirical relationships between variables, it provides little insight into the underlying economic mechanisms driving these interactions. Additionally, the VAR model can be susceptible to spurious relationships, where correlations between variables appear statistically significant but lack meaningful economic causation. This can complicate the interpretation of model results and make it challenging to estimate accurate coefficients. Moreover, the assumption of stationarity at the same level is essential for hypothesis testing within the VAR framework. While some researchers argue for analyzing non-stationary data without differencing to preserve information about long-run relationships, this approach can introduce challenges and potential biases in the estimation and interpretation of results.
Once we estimate the VAR model, we can use variance decomposition to analyze the sources of variability in the dependent variable. This technique helps us quantify how much of the future forecast errors (how much the actual values deviate from the predictions) for each variable are explained by its lagged values, compared to the influence of other variables in the model. Moreover, impulse response analysis and variance decomposition are often used in conjunction. IRFs reveal the dynamic nature of the response, while variance decomposition helps quantify the relative importance of each shock in explaining the variability. In particular, variance decompositions offer a different way to examine variable structures in the VAR method.
Briefly, variance decomposition is a statistical technique that allows researchers to break down the variance of a variable (such as the return of a stock index) into the contributions of different factors. This is useful for understanding what factors are most important for driving the movement of the variable. This combined approach provides a comprehensive understanding of how shocks propagate through the system and influence the behavior of individual variables.
4. Data
The data period from January 1, 2024, onward is selected due to the convergence of impactful events hypothesized to drive market volatility. Commencing posts the identified “Japan fall,” the period captures initial market adjustments to this exogenous shock. Subsequently, it encompasses rising concerns regarding potential regime changes in various regions, introducing political instability and economic policy uncertainty, factors known to elevate market fluctuations. Crucially, this timeframe also witnessed an intensification of tariff-related activities and trade policy shifts. The imposition or threat of tariffs disrupts trade, alters competition, and generates uncertainty about economic growth and corporate earnings, acting as established catalysts for market volatility. Therefore, this specific period allows for the analysis of the interconnected effects of the “Japan fall’s” aftermath, heightened regime change concerns, and escalating tariff periods on market volatility. Examining this confluence aims to disentangle their individual and combined impacts on financial market fluctuations during a time of heightened global uncertainty, offering valuable insights for policymakers and investors. Our daily dataset is as exhibited in Table 1.
Variables in the models starting with capital R means returns of the relevant variable. All retures are calculated as follows:
Analyzing Donald Trump’s Twitter (now X) usage during his second presidency (starting January 2025) compared to his first (2017–2021) regarding tariffs, trade wars, China, and Europe requires examining available data on his posting behavior. Given the lack of direct access to his full tweet history, this analysis relies on web sources, logical inference, and patterns from provided search results to estimate changes and reasons. This investigation will also address the “why” behind any observed reduction in his X activity. In his first presidency (2017–2021), Trump exhibited high activity on Twitter, posting thousands of tweets annually, with studies estimating approximately 22,000 tweets over his term, averaging 15–20 tweets daily1. He frequently used Twitter to announce, defend, or comment on trade policies, especially tariffs and trade wars with China and the EU2.
A 2019 analysis indicated that roughly 10–15% of his tweets focused on trade, economy, or China, peaking during key trade war escalations, such as the 2018–2019 China tariffs. For instance, in 2018, he tweeted about China tariffs or trade deficits approximately 200–300 times, often framing them as wins for U.S. workers. Trump mentioned “China” in approximately 500 tweets during 2018–2019, frequently tied to trade war rhetoric, intellectual property theft, or negotiations. EU-related tweets were less frequent, around 50–100 annually, focusing on trade imbalances, NATO spending, or tariffs, such as steel/aluminum in 2018.
His tweets were direct, often inflammatory, and used to rally supporters or pressure adversaries, with real-time updates during trade talks, like the 2019 G20 summit. In contrast, during his second presidency (2025), Trump’s overall X activity appears reduced, with sources suggesting a decrease to 5–10 posts daily, possibly due to strategic shifts or platform changes. Recent tariffs, such as the 145% on China and 20% on the EU in April 2025, are less discussed on X compared to 2018–2019, with only a few key posts noted, including his April 9, 2025, Truth Social/X announcement pausing reciprocal tariffs for 90 days, except for China. Estimated tariff/trade posts are around 20–50 since January 2025, compared to 200–300 annually in 2018–2019.
China remains a focus, but mentions are fewer, approximately 10–20 posts in 2025 versus 500 in 2018–2019, emphasizing escalating tariffs but with less frequent real-time updates. EU tariff mentions are sparse, around 5–10 posts, despite 20% tariffs announced in April 2025, focusing on broader trade policy rather than specific EU critiques. Trump’s X engagement remains high per post, but overall reach decreased in his second term due to fewer posts (5,500–7,300 to 1,800–3,600 annually) and X’s algorithm changes. Specifically, tariff/trade, China, and EU mentions significantly declined. This shift reflects a strategic communication change, favoring Truth Social, controlled messaging, and using tariffs for negotiation. Platform changes, audience fatigue, policy context (swift tariff implementation), and personal/political factors (learning from past controversies, time constraints) also contributed. While critics deemed his tariffs reckless, reduced X usage indicates a shift to calculated negotiation, not necessarily less commitment. This may limit public support rallying but avoids market panic. Given the reduced role of X in Trump’s communication, research should focus on the objective realities of his trade policies, specifically tariff implementation and the tariff calendar, for a more precise understanding of economic consequences, moving beyond social media discourse.
In this context we created our own TARIFF dummy variable based on the tariff calendar3 data (Table 2) which gets the value of 1 when an important event occurs for tariff and 0 on the other days. This table outlines a series of trade-related actions, primarily tariffs, attributed to “President Donald J. Trump” spanning from 2024 to 2035. The events reveal an aggressive protectionist stance, with tariffs imposed on a wide range of goods from various countries including Canada, Mexico, China, and EU nations, often citing “fair and reciprocal” trade as justification. Tariff rates fluctuate, some are delayed, and the scope covers steel, aluminum, agricultural products, and automobiles, suggesting a broad trade war. Threats and sanctions accompany the tariffs, indicating potential international disputes. The table lacks information on the economic impact, raising questions about long-term effects and the accuracy of the events presented.
In Table 3 analysis of the two covariance matrices reveals distinctions between tariff-related decision days and other days in financial markets. The first covariance matrix corresponds to tariff-related decision days, while the second represents other days. A key observation is that during tariff-related decision days, there appears to be a notable increase in the interconnectedness of financial assets, particularly evident in the relationship between stock indices and bonds.
The covariance between the CSI 300 (Chinese stocks) and the S&P 500 (US stocks) becomes significantly more negative on tariff-related days compared to other days. This suggests that tariff decisions tend to heighten the divergence in the performance of these major global stock markets, potentially reflecting increased uncertainty and varied investor reactions to the economic implications of tariffs on these economies.
Regarding bond behavior, while the positive covariance between BOND10Y and BOND2Y persists in both periods, their relationship with stock indices seems to shift during tariff-related decision days. For instance, the covariance between the S&P 500 and bonds appears lower during these times. The VIX (volatility index) maintains its expected negative correlation with the S&P 500 in both scenarios, as VIX typically rises when the stock market declines.
However, the magnitude of this inverse relationship is more pronounced on non-tariff days. In summary, the covariance matrices indicate that tariff-related decision days are characterized by heightened market sensitivity and altered relationships between asset classes, especially a stronger negative correlation between major stock indices, suggesting that trade policy decisions create periods of increased market uncertainty and risk.
5. Emprical Results
Figure 1 of RBond10Y, RBond2Y, RBrent, RCSI 300, RG-old, and VIX show notable reactions during April 2025, the period coinciding with tariff calendar events. Bond returns (RBond10Y and RBond2Y) exhibit increased volatility, with initial rises followed by declines, suggesting market uncertainty. Brent crude oil returns (RBrent) display a downward spike, potentially reflecting concerns about reduced global demand due to tariffs. The Chinese stock market index (RCSI 300) shows a downward trend and heightened volatility, likely due to the negative impact of tariffs on Chinese trade. Gold returns (RGold) experience a significant upward surge, indicating a flight to safety amidst economic uncertainty.
Finally, the VIX, a measure of market volatility, spikes sharply, signifying increased investor anxiety surrounding the tariff implications. Overall, the tariff events appear to trigger short-term market reactions characterized by increased volatility and shifts in asset prices, reflecting concerns about economic growth, trade disruptions, and a preference for safe-haven assets.
Let be the vector of endogenous variables at time t, and let
be the vector of exogenous variables (including the constant term).
The VAR(1) model can be generally represented as:
where:
yt=A1yt−1+Bxt+ϵt
A1 is a 4×4 matrix of coefficients for the lagged endogenous variables and
B is a 4×2 matrix of coefficients for exogenous variables (constant and TARIFF)
is a 4×1 vector of error terms (innovations).
Expanding this into the individual equations based on the output provided:
Equation for RS_P500:
RS_P500t=c11RS_P500t−1+c12RBOND2Yt−1+c13RBRENTt−1+c14RCSI_300t−1+c15+c16TARIFFt+ϵ1t
Substituting the estimated coefficients:
RS_P500t=−0.1450RS_P500t−1+0.0880RBOND2Yt−1+0.0315RBRENTt−1 +0.1336RCSI_300t−1+0.0010−0.0072TARIFFt+ϵ1t
Equation for RBOND2Y:
RBOND2Yt=c21RS_P500t−1+c22RBOND2Yt−1+c23RBRENTt−1+c24RCSI_300t−1+c25+c26TARIFFt+ϵ2t
Substituting the estimated coefficients:
RBOND2Yt=−0.1769RS_P500t−1−0.1234RBOND2Yt−1−0.0211RBRENTt−1+0.1539RCSI_300t−1−0.0010−0.0001TARIFFt+ϵ2t
Equation for RBRENT:
RBRENTt=c31RS_P500t−1+c32RBOND2Yt−1+c33RBRENTt−1+c34RCSI_300t−1+c35+c36TARIFFt+ϵ3t
Substituting the estimated coefficients:
RBRENTt=−0.1129RS_P500t−1+0.0208RBOND2Yt−1−0.0044RBRENTt−1+0.0124RCSI_300t−1−0.0015+0.0027TARIFFt+ϵ3t
Equation for RCSI_300:
RCSI_300t=c41RS_P500t−1+c42RBOND2Yt−1+c43RBRENTt−1+c44RCSI_300t−1+c45+c46TARIFFt+ϵ4t
Substituting the estimated coefficients:
Where cij represents the estimated coefficients C(i,j) from the provided output, and the constant term corresponds to the coefficient of the implicit constant variable. The subscripts t and t−1 denote the time period. The ϵit terms represent the error terms for each equation.
RCSI_300t=0.1421RS_P500t−1+0.1185RBOND2Yt−1−0.0071RBRENTt−1+0.1949RCSI_300t−1+0.0010−0.0017TARIFFt+ϵ4t
In Figure 2, on left hand side the blue bars, showing how much RS_P500’s own changes affect its overall variation, are very high for all 12 periods. This means that most of the ups and downs in RS_P500 are due to its own past movements. The orange (RBOND2Y), green (RBRENT), and red (RCSI_300) bars are tiny. This shows that these other factors have very little impact on how much RS_P500 changes.
On the right-hand side the red bars, showing how much RCSI_300’s own changes affect their overall variation, are also high for all 12 periods, though a bit less dominant than for RS_P500. This means that RCSI_300’s own past movements are the main reason for its ups and downs. However, the blue bars (RS_P500) are noticeably present, especially in earlier periods, even though they are still small. This suggests that RS_P500 has some influence on how much RCSI_300 changes. The orange (RBOND2Y) and green (RBRENT) bars are very small for RCSI_300 as well.
Both RS_P500 and RCSI_300’s volatility is mainly caused by their own past fluctuations. They are mostly self-driven. There’s a slight indication that RS_P500 has some effect on how RCSI_300 changes, meaning they are somewhat connected. The other two factors, RBOND2Y and RBRENT, don’t seem to have much impact on the volatility of either RS_P500 or RCSI_300 during the period shown.
Furthermore, we employ an impulse response function (IRF) framework, derived from a Vector Autoregression (VAR) model, to examine the impact of unexpected shocks (innovations) in one asset’s return on the future returns of other assets within the system (Figure 3)
The reported responses are accompanied by confidence bands to assess the statistical significance of the estimated effects. The results indicate significant short-term autocorrelation within both equity markets. A positive innovation in S&P 500 returns elicits an immediate positive response in its own future returns, which subsequently decays and becomes statistically indistinguishable from zero within a few periods.
Similarly, a positive shock to CSI 300 returns generates a positive initial response that also diminishes overtime, losing statistical significance in the short run. These findings suggest the presence of short-term momentum or behavioral factors within these markets, where positive returns tend to be followed by further positive returns in the immediate subsequent periods. A key finding of this analysis is the evidence of a statistically significant short-term spillover effect from the US to the Chinese equity market. A positive innovation in S&P 500 returns leads to a positive response in CSI 300 returns.
This impact peaks around the second period following the shock and then gradually dissipates, becoming statistically insignificant within a few periods. This observation suggests a degree of interconnectedness between the two largest global equity markets, where positive sentiment or information originating in the US market is transmitted to the Chinese market in the short run. This spillover could be attributed to various factors, including investor sentiment, global investment strategies, or indirect linkages through trade and economic activity.
In contrast to the significant own-shock effects and the inter-market spillover, the analysis reveals a limited and generally statistically insignificant impact of innovations in 2-year government bond returns (RBOND2Y) and Brent crude oil returns (RBRENT) on the returns of both the S&P 500 and the CSI 300 indices. Positive shocks to 2-year bond returns appear to have a negligible effect on both equity markets across the forecast horizon. Similarly, positive innovations in Brent crude oil returns elicit a small and statistically insignificant response in both S&P 500 and CSI 300 returns.
These findings suggest that, within the context of this VAR model, macroeconomic factors proxied by short-term government bond returns and commodity prices (oil) do not exert a strong direct influence on the short-term dynamics of these major equity markets. This could imply that equity market movements are more driven by market-specific factors, investor sentiment, and information flows within and between equity markets themselves, at least in the short run.
Finally, this impulse response analysis highlights the presence of short-term positive autocorrelation in both the US and Chinese equity markets. Furthermore, it provides evidence of a statistically significant positive short-term spillover effect from the US stock market to the Chinese stock market. Conversely, innovations in 2-year government bond returns and Brent crude oil returns appear to have a limited and statistically insignificant impact on the returns of both equity indices within the analyzed framework. These findings contribute to our understanding of the dynamic linkages within global financial markets, emphasizing the short-term interdependence between major equity markets while suggesting a relatively weaker direct influence of the considered macroeconomic variables on equity returns in the short run. Further research could explore these relationships using alternative methodologies, longer time horizons, and a broader set of macroeconomic and financial variables.
6. Conclusions
Francis Fukuyama’s “End of History” thesis, positing the triumph of Western liberal democracy as the culmination of ideological evolution, remains a potent framework for analyzing contemporary global dynamics, particularly the interplay between political systems and economic stability. While subject to critiques regarding its perceived oversimplification of global politics and optimistic outlook, Fukuyama’s core argument regarding the inherent advantages of liberal democracy – characterized by the rule of law, free markets, and democratic governance – finds compelling resonance in the context of international trade and financial markets.
The disruption caused by protectionist trade policies, exemplified by the empirical evidence from studies on tariffs, serves as a stark reminder of the vulnerabilities that arise when the principles underpinning liberal democratic ideals are challenged. The ensuing market volatility and sector-specific vulnerabilities underscore the crucial role of stable and predictable governance in maintaining economic equilibrium. In contrast, the foundational tenets of liberal democracy, with their emphasis on open markets and adherence to established legal frameworks, appear better suited to navigate economic disruptions and foster a more resilient financial landscape.
The findings from the analysis of trade policy impacts lend empirical weight to Fukuyama’s broader assertion. The instability and increased risks associated with protectionist measures highlight the inherent connection between a stable, rule-based political order and a predictable, well-functioning global economy. This suggests that deviations from the principles of liberal democracy, particularly in the realm of economic policy, can have tangible and destabilizing consequences for financial markets.
In conclusion, while the “End of History” debate continues to evolve, Fukuyama’s insights offer a valuable lens through which to understand the broader implications of trade policies on global financial stability. The evidence presented reinforces the notion that the core tenets of liberal democracy provide a more conducive environment for managing economic challenges and sustaining a stable international financial system. As such, Fukuyama’s work remains a relevant and insightful contribution to our understanding of the intricate relationship between political ideology and economic outcomes in the contemporary world.
References
- Ang, J.; Wang, J. Political Uncertainty and Market Reactions: Evidence from the Smoot-Hawley Tariff Act and Its Repeal. Global Finance Journal 2023, 55, 100802. [Google Scholar] [CrossRef]
- Amiti, M.; Redding, S.J.; Weinstein, D.E. The Impact of the 2018 Tariffs on Prices and Welfare. Journal of Economic Perspectives 2019, 33, 187–210. [Google Scholar] [CrossRef]
- Baker, S.R.; Bloom, N.; Davis, S.J. Measuring economic policy uncertainty. The Quarterly Journal of Economics 2016, 131, 1593–1636. [Google Scholar] [CrossRef]
- Boer, L.; Rieth, M. The macroeconomic consequences of import tariffs and trade policy uncertainty. IMF Working Paper, 2024/013. International Monetary Fund. 2024. [Google Scholar]
- Caldara, D.; Iacoviello, M.; Molligo, P.; Prestipino, A.; Raffo, A. The Economic Effects of Trade Policy Uncertainty. Journal of Monetary Economics 2020, 109, 38–59. [Google Scholar] [CrossRef]
- Funke, M.; Schularick, M.; Trebesch, C. Populist leaders and the economy. American Economic Review 2023, 113, 3249–3288. [Google Scholar] [CrossRef]
- Rodrik, D. Straight talk on trade: Ideas for a sane world economy; Princeton University Press, 2017. [Google Scholar]
| 1 | |
| 2 | |
| 3 |
Figure 1.
Daily Returns of the Financial Market.
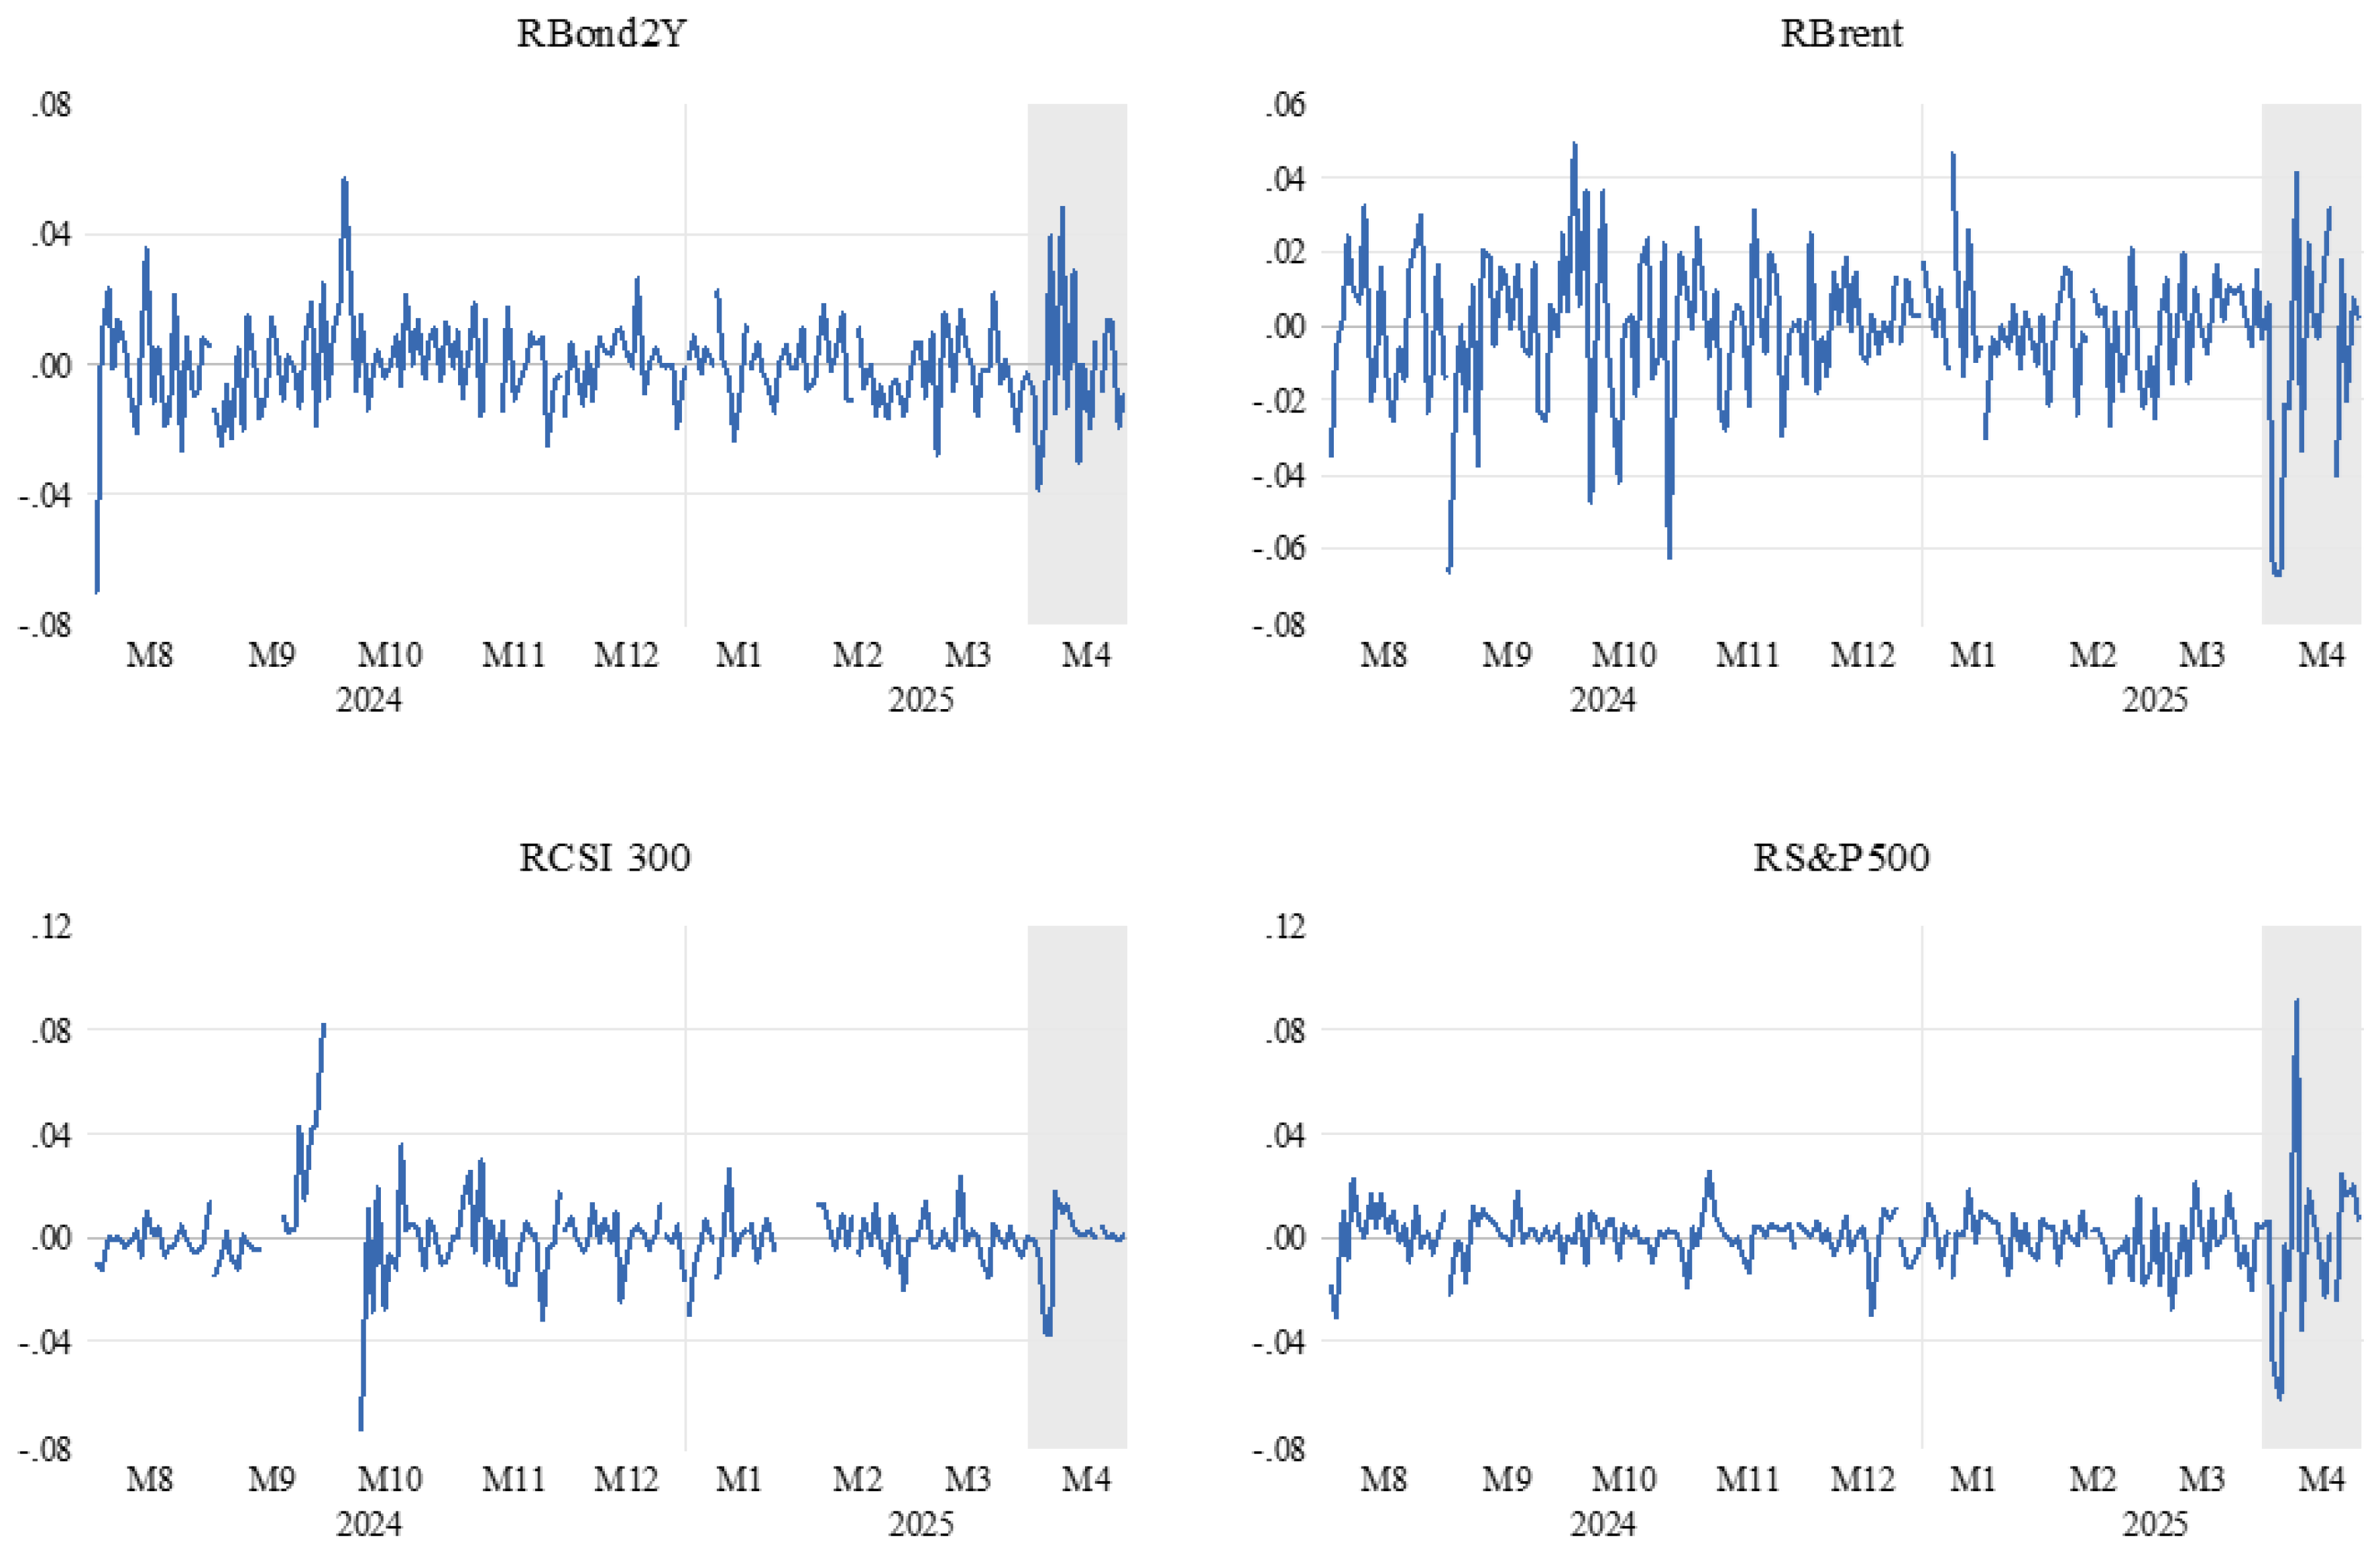
Figure 2.
Variance Decompositions of US and China Financial Market.
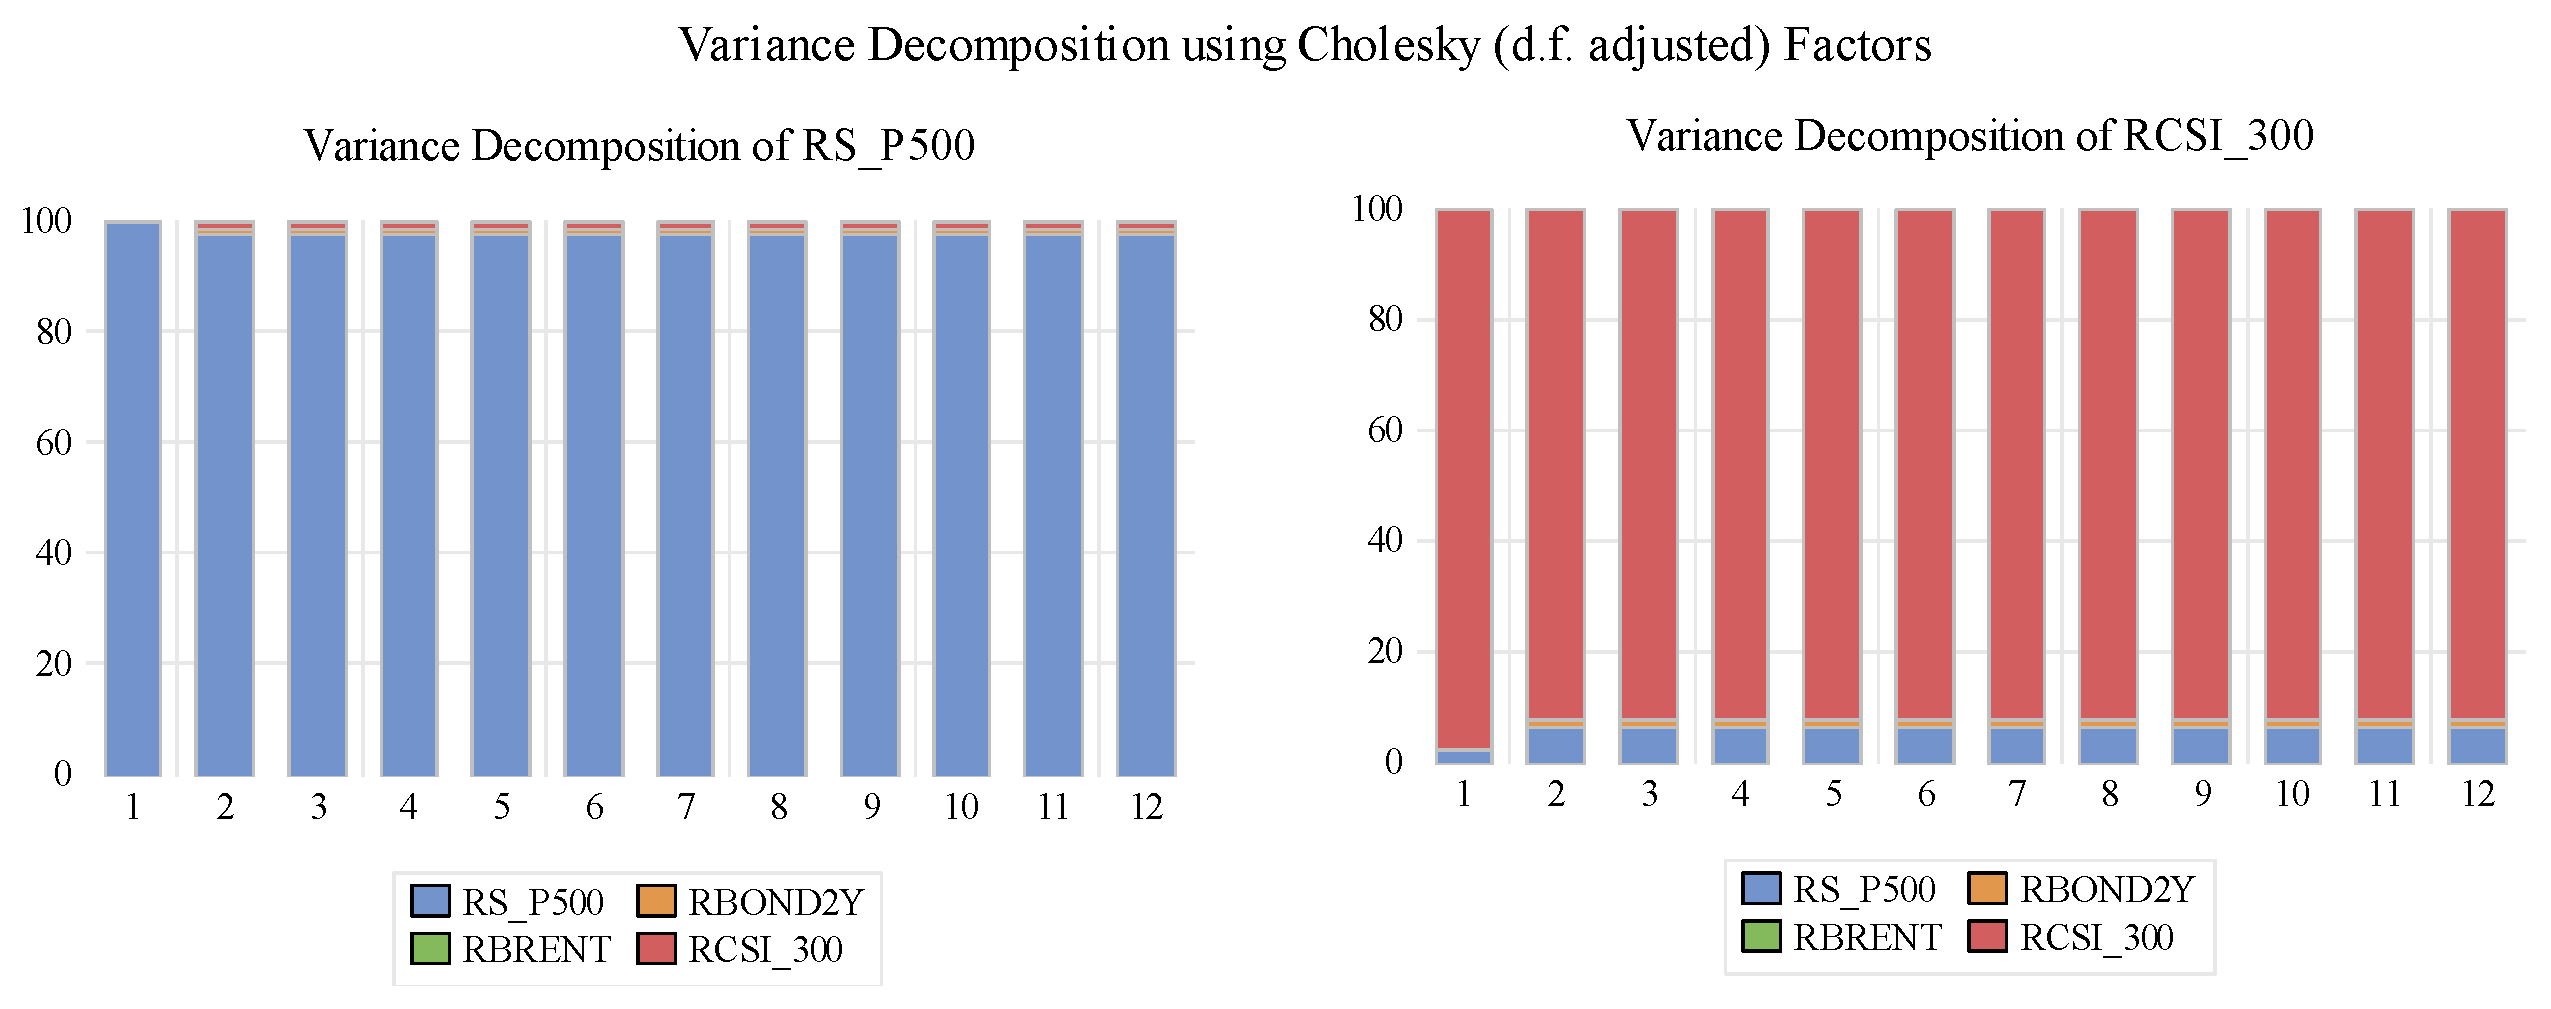
Figure 3.
Impulse Response Analysis of US and China Financial Market.
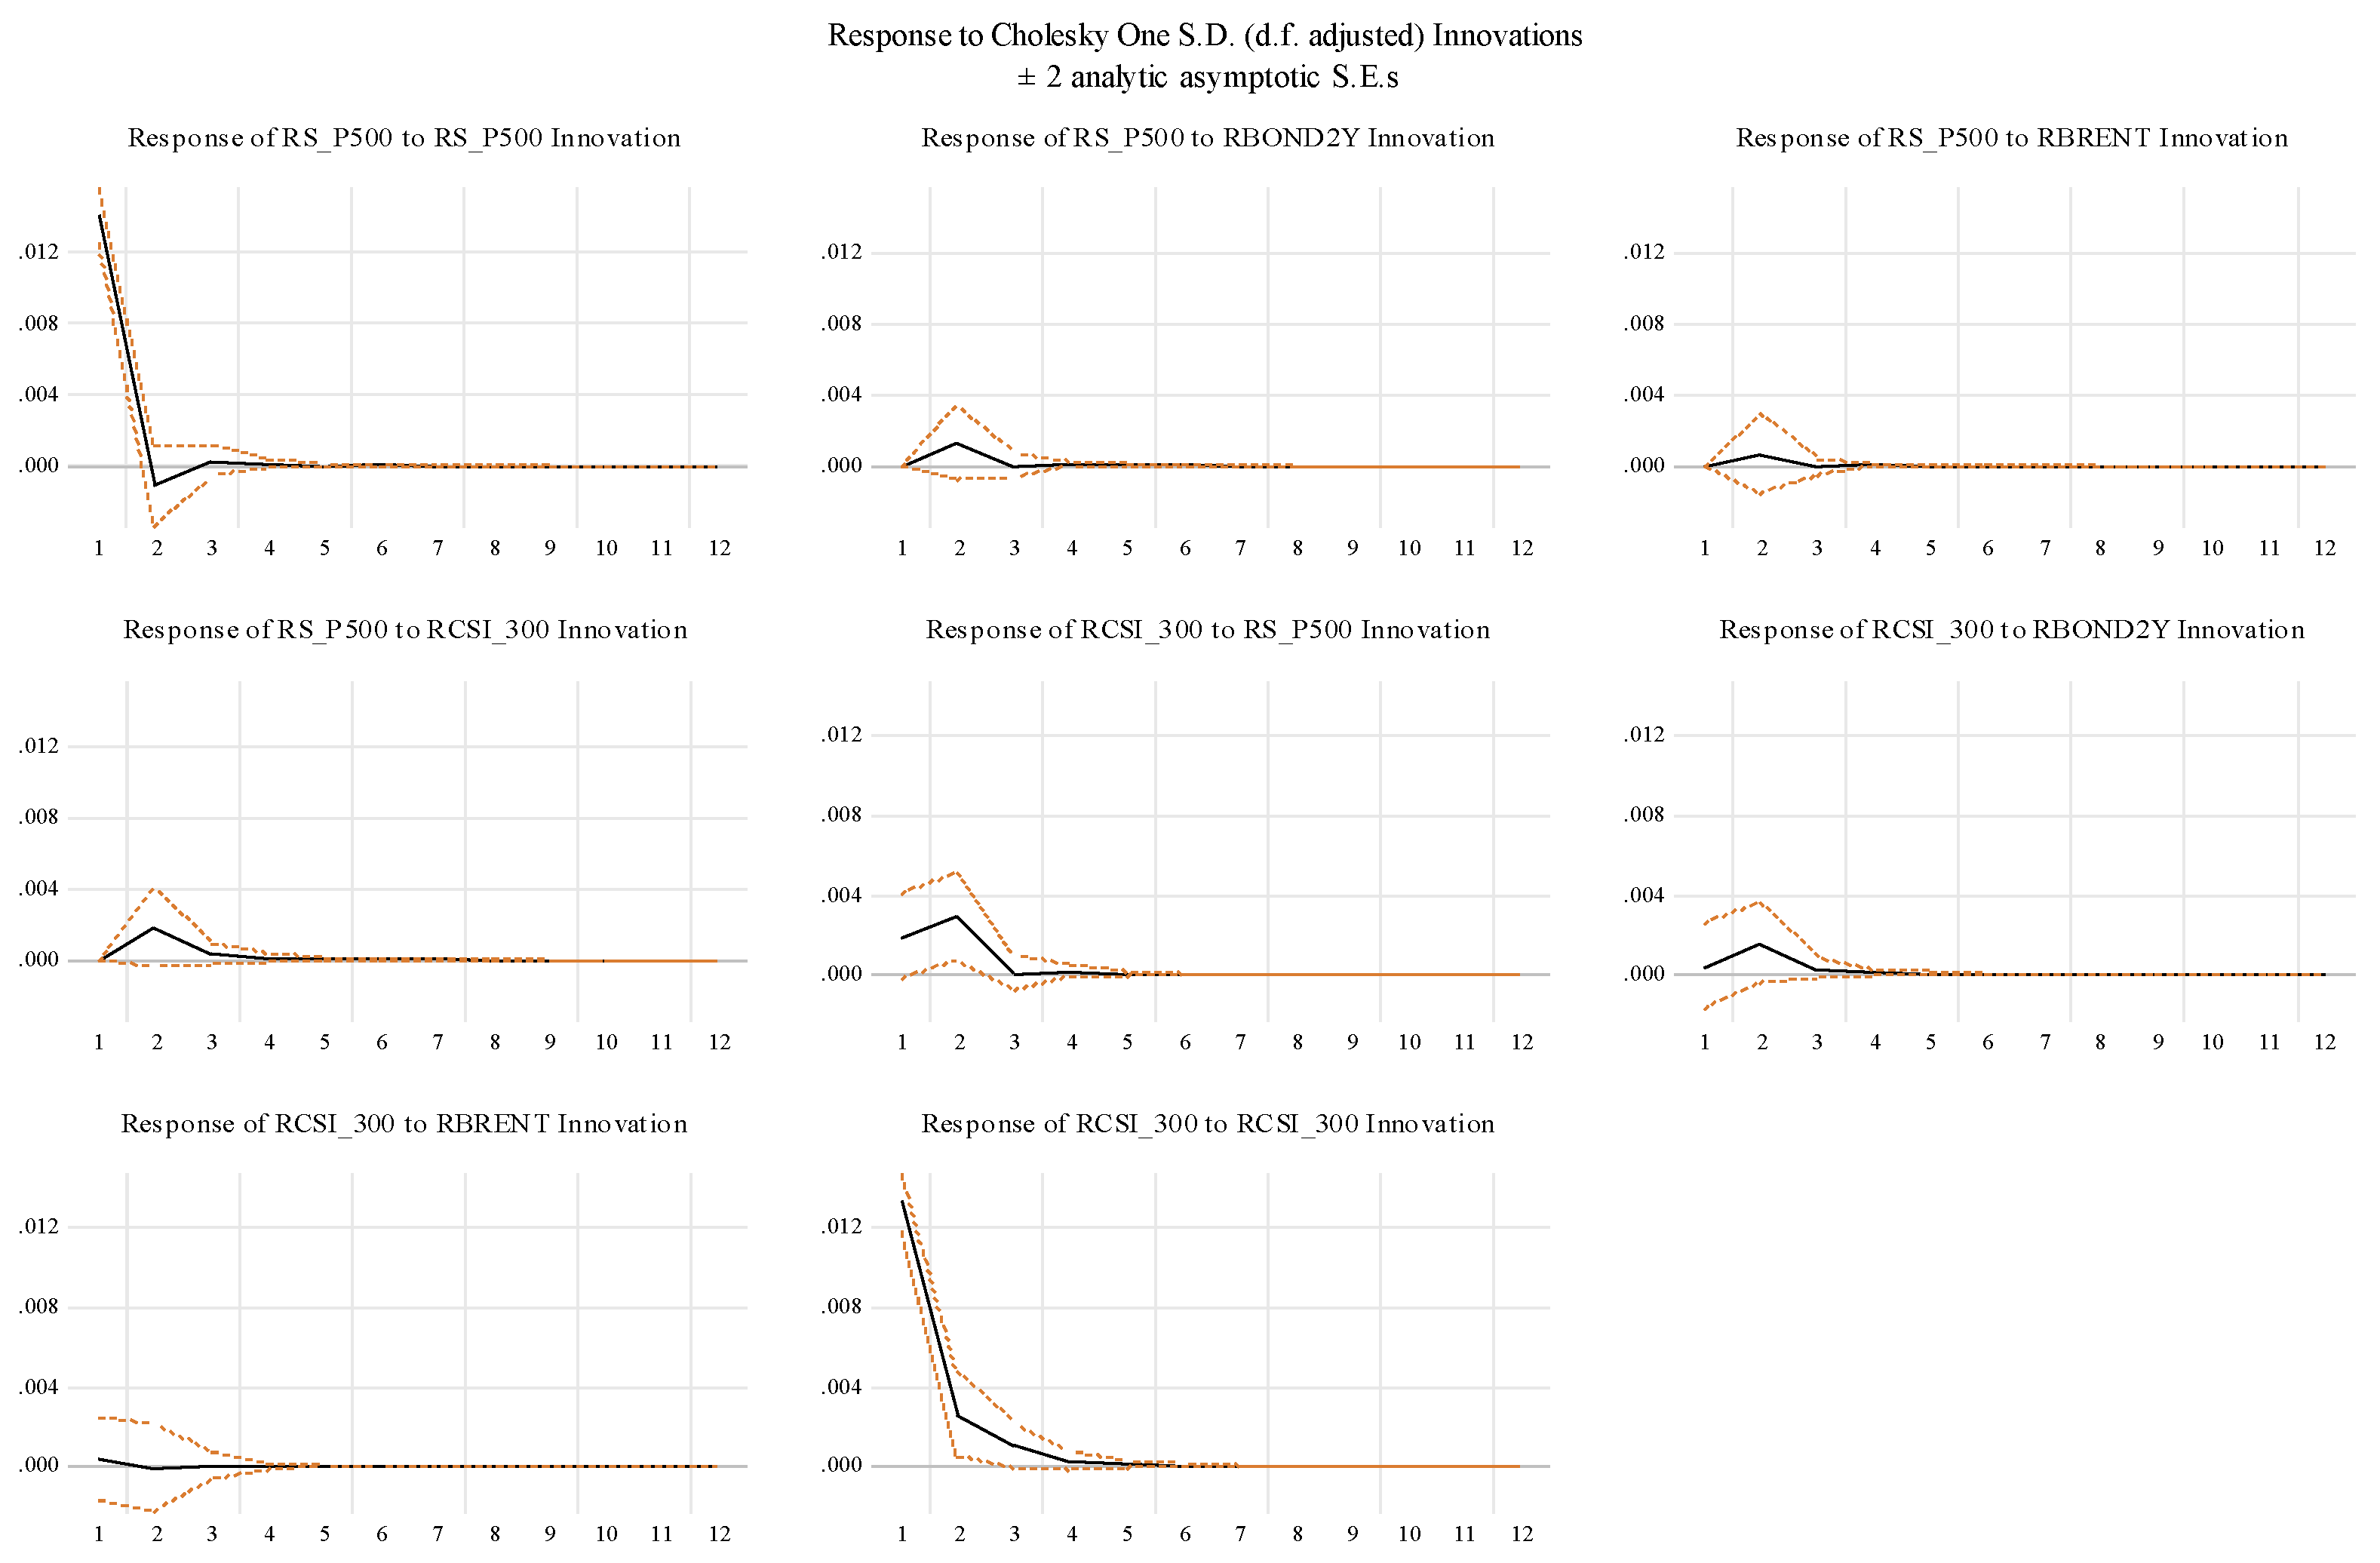

Table 1.
Dataset Explanation.
| Symbol | Data explanation |
|---|---|
| Bond2Y | 5-year US bond |
| S_P500 | S&P 500 index |
| Brent | Brent oil prices |
| CSI_300 | Shanghai Shenzhen CSI 300 Index |
| Gold | Gold prices |
| VIX | Fear Index |
Table 2.
Tariff Events.
| # | Date | Event |
|---|---|---|
| 1 | 30.11.2024 | Trump threatens 100% tariff on the BRIC bloc of nations if they act to undermine US dollar |
| 2 | 09.01.2025 | Trump Threatens Denmark With Tariffs Over Greenland |
| 3 | 26.01.2025 | Trump’s tariff threat worked on Colombia, but his plans for Canada and Mexico carry higher stakes |
| 4 | 01.02.2025 | Fact Sheet: President Donald J. Trump Imposes Tariffs on Imports from Canada, Mexico and China |
| 5 | 04.02.2025 | 25% tariffs on Canada delayed for one month, 25% tariffs on Mexico delayed for one month, 10% tariffs on China |
| 6 | 05.02.2035 | Removal of de minimis exemption for imports from China |
| 7 | 07.02.2035 | Trump tells Ishiba at the White House that he wants to slash the US trade deficit with Japan |
| 8 | 11.02.2035 | Adjusting Imports of Aluminum into The United States, 25% tariffs on steel and aluminum |
| 9 | 13.02.2035 | President Donald J. Trump Announces “Fair and Reciprocal Plan” on Trade |
| 10 | 21.02.2035 | Defending American Companies and Innovators From Overseas Extortion and Unfair Fines and Penalties |
| 11 | 03.03.2025 | Tariffs on China raised to 20% |
| 12 | 04.03.2025 | President Donald J. Trump Proceeds with Tariffs on Imports from Canada and Mexico, 25% tariffs imposed on Mexico, Canada |
| 13 | 06.03.2025 | 25% tariff on USMCA-compliant goods on Mexico and Canada removed, 25% tariff on potash reduced to 10% |
| 14 | 07.03.2025 | Trump Threatens to Hit Russia With Sanctions in Push for Peace Deal |
| 15 | 11.03.2024 | 25% steel and aluminum tariffs raise to 50% on Canada |
| 16 | 12.03.2024 | 25% steel and aluminum tariffs, 25% steel and aluminum tariffs raise to 50% on Canada |
| 17 | 13.03.2024 | 200% tariffs on EU wine and alcohol |
| 18 | 24.03.2025 | 25% tariffs on countries importing Venezuelan oil, 25% tariffs on any country which imports Venezuelan oil |
| 19 | 26.03.2025 | 25% auto tariffs |
| 20 | 01.04.2025 | USTR report on reciprocal trade due |
Table 3.
Covariance Matrix.
| BOND2Y | BRENT | CSI_300 | S_P500 | |
| BOND2Y | 0.0193 | 0.2512 | -3.5972 | 21.0354 |
| BRENT | 0.25 | 5.95 | -75.17 | 321.15 |
| CSI_300 | -3.60 | -75.17 | 2455.61 | -4165.94 |
| S_P500 | 21.04 | 321.15 | -4165.94 | 31691.65 |
| BOND2Y | BRENT | CSI_300 | S_P500 | |
| BOND2Y | 0.0516 | 0.3222 | 38.4755 | 41.1525 |
| BRENT | 0.32 | 16.59 | -230.15 | 345.91 |
| CSI_300 | 38.48 | -230.15 | 78383.48 | 41975.71 |
| S_P500 | 41.15 | 345.91 | 41975.71 | 69686.81 |
Disclaimer/Publisher’s Note: The statements, opinions and data contained in all publications are solely those of the individual author(s) and contributor(s) and not of MDPI and/or the editor(s). MDPI and/or the editor(s) disclaim responsibility for any injury to people or property resulting from any ideas, methods, instructions or products referred to in the content. |
© 2025 by the authors. Licensee MDPI, Basel, Switzerland. This article is an open access article distributed under the terms and conditions of the Creative Commons Attribution (CC BY) license (http://creativecommons.org/licenses/by/4.0/).
Copyright: This open access article is published under a Creative Commons CC BY 4.0 license, which permit the free download, distribution, and reuse, provided that the author and preprint are cited in any reuse.


