Submitted:
10 June 2025
Posted:
10 June 2025
You are already at the latest version
Abstract
The retina is highly sensitive to oxygen and blood supply, and hypoxia plays a key role in retinal diseases such as diabetic retinopathy (DR) and age-related macular degeneration (AMD). Müller glial cells, essential for retinal homeostasis, respond to injury and hypoxia with reactive gliosis, characterized by upregulation of Glial Fibrillary Acidic Protein (GFAP) and vimentin, cellular hypertrophy, and extracellular matrix changes, which can impair retinal function and repair. The retinal pigment epithelium (RPE) supports photoreceptors, forms part of the blood-retinal barrier, and protects against oxidative stress; its dysfunction contributes to retinal degenerative diseases such as AMD, retinitis pigmentosa (RP), and Stargardt disease (SD).
Keywords:
müller glia
; retinal pigmented epithelium
; extracellular vesicles
; exosomes
; proteomics
; ECIS
; GFAP
; blood-retinal barrier
; hypoxia
; retinopathy
1. Introduction
The retina is a metabolically active tissue that is extremely sensitive to blood and oxygen perfusion. Any altered blood supply to the eye affects the retina. Systemic hypoxemia (lung or heart disease) or a local vascular disease in the retina can cause retinal hypoxia. All animal cells need oxygen for ATP production to fuel metabolic reactions, and even the smallest changes in oxygen tension bring about adjustments to maintain oxygen homeostasis. However, there are specific retinal diseases in which low oxygen tension either contributes to or plays a crucial role in new vessel formation, such as diabetic retinopathy (DR) and age-related macular degeneration (AMD)[1].
Müller cells are the predominant class of glial cells in the vertebrate retina. They span the entire width of the retina from the inner to the outer limiting membrane. Additionally, they are intimately involved in the visual cycle through synthesizing and renewing cone visual pigments, providing an anti-oxidative support of neurons and photoreceptors, regulating the tightness of the blood-retinal barrier (BRB), maintaining the normal transmitter milieu, and controlling calcium and water homeostasis within the retina [2].
Glial fibrillary acidic protein (GFAP) is a member of the intermediate filament family of proteins, a group that contributes to the formation of the cell cytoskeleton that is normally expressed by Müller cells at low levels but becomes upregulated in response to retinal injury, neuronal degeneration, retinal detachment, light damage or mechanical lesioning. Additional responses of Müller cells to injury include hypertrophy, proliferation, migration, and altered expression of enzymes and intermediate filament proteins [3].
Gliosis is a complex cellular response often seen in various neurological disorders. It involves increased expression of intermediate filament proteins—especially GFAP and vimentin—along with glial cell enlargement (hypertrophy) and the buildup of inhibitory extracellular matrix components. This process can hinder tissue function and repair. Although the exact role of intermediate filaments in gliosis is debated, they are thought to help maintain the structural changes in glial cells. Reactive gliosis specifically features elevated levels of these proteins and morphological changes in glial cells, such as process thickening and stabilization [4].
Ischemic retinopathies often involve neuronal loss and abnormal blood vessel growth. Müller glial cells in the retina produce pigment epithelium-derived factor (PEDF), a neuroprotective and anti-angiogenic protein that helps counteract elevated vascular endothelial growth factor (VEGF) levels, which are mainly regulated by hypoxia-inducible factor 1 (HIF-1) during hypoxia [5]. In hypoxic conditions, these cells also increase vascular permeability, contributing to disease progression [6,7]. Modulating Müller glial behavior—by inhibiting gliosis and encouraging reprogramming—offers a promising strategy for treating retinal degeneration[8].
The retinal pigment epithelium (RPE) consists of a single layer of uniformly shaped polygonal cells located at the retina's outermost region. Its outer surface interfaces with Bruch’s membrane and the choroid, while the inner surface contacts the photoreceptor outer segments. Basal infoldings on the outer side enhance the cell's surface area, promoting efficient exchange of substances. The basement membrane is tightly linked to these basal folds through half-desmosomes found in the innermost part of Bruch’s membrane [9].
Tight junctions between the single-layered RPE and adjacent gap junctions regulate substance movement and, together with Bruch’s membrane and the choroid, form the choroid-blood-retinal barrier along the peripheral retina [10]. The RPE also contains a sophisticated metabolic system that mitigates the buildup of reactive oxygen species (ROS), protecting against oxidative damage [11]. Because of its critical structural and functional roles, any disruption in the RPE can compromise vision and contribute to retinal diseases such as retinitis pigmentosa (RP), age-related macular degeneration (AMD), and Stargardt disease (SD) [12].
Extracellular vesicles (EVs) are small, single-membrane vesicles ranging from about 30 to 200 nanometers in diameter. They share the same membrane orientation as their parent cells and are rich in specific proteins, lipids, nucleic acids, and glycoconjugates. These vesicles contain complex, membrane-bound protein structures and exhibit significant molecular diversity [13].
EVs are formed through budding from the plasma membrane or within endosomes and play a key role in cellular protein quality control. Once released, they participate in various functions, including extracellular matrix remodeling and intercellular communication [14]. EVs are also involved in numerous physiological and pathological processes, such as development, immune responses, tissue maintenance, cancer, and neurodegenerative diseases. Due to these versatile roles, EVs are being explored as potential diagnostic and therapeutic tools across a range of disorders [15,16,17].
The current study suggests that under hypoxic conditions, EVs derived from RPE cells mediate metabolic reprogramming in Müller glial cells. Conversely, Müller cell-derived EVs under hypoxia may influence RPE cell metabolism and barrier function, suggesting a bidirectional EV-mediated crosstalk that helps maintain retinal homeostasis and structural integrity during metabolic stress.
2. Materials and Methods
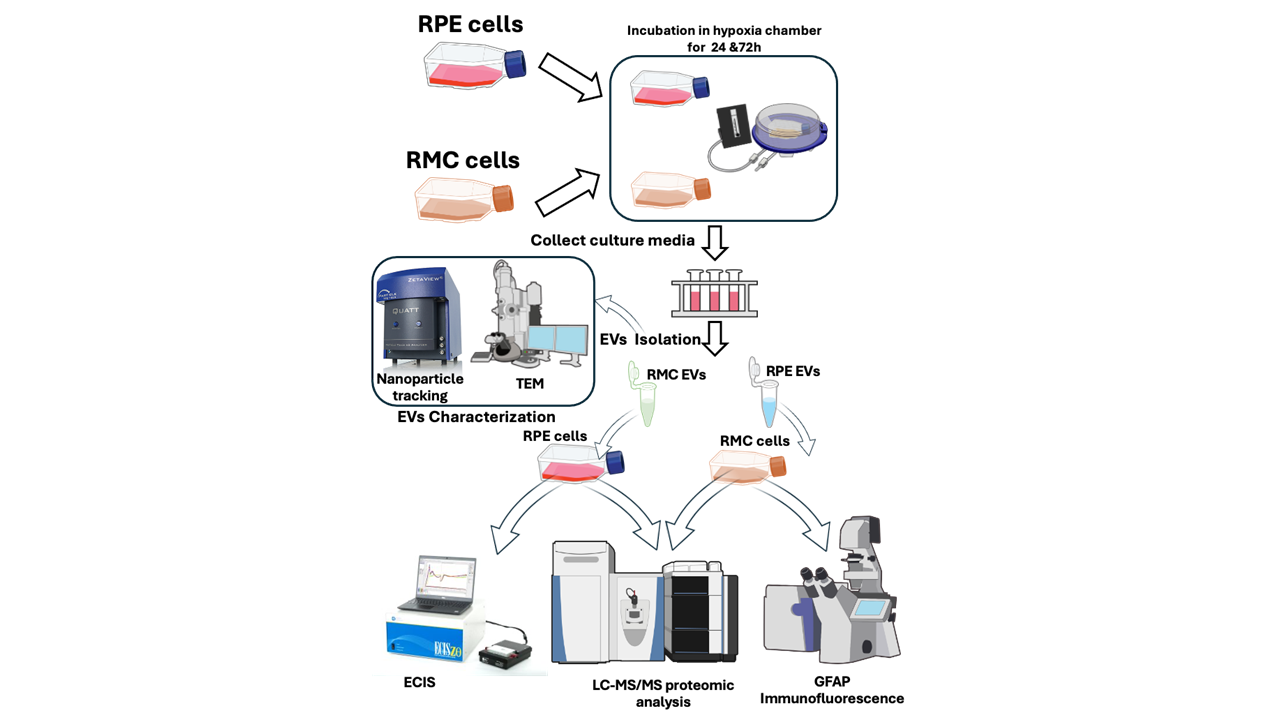
2.1. Retinal Pigmented (RPE) and Müller Cells (RMC) Culture
Rat Müller cells (RMCs) were purchased from Applied Biological Materials Inc. (abm, USA Catalogue # T0576). They were cultured with DMEM-F12 (Dulbecco’s Modified Eagle Medium/Nutrient Mixture F-12, Thermo Fischer Scientific, MA, USA, Catalogue # 11320033). While the ARPE-19 were purchased from American Type Culture Collection (ATCC, Catalogue # CRL-2302). According to source recommendation, they were cultured with DMEM-F12 (Dulbecco’s Modified Eagle Medium/Nutrient Mixture F-12, ATCC, USA Catalogue # 302006) containing 10 % fetal bovine serum (FBS) (Gibco™ Fetal Bovine Serum, Fischer Scientific, USA, Catalogue # A5670801). Both RMCs and ARPE-19 were incubated under both normoxia and hypoxia conditions. The normoxia condition was performed by incubating the cells 37ºC, 5% CO2. The hypoxia condition was established by incubating the cells in hypoxia chamber 37ºC, 5% CO2 and 2.5% O2.
2.2. Isolation of Extracellular Vesicles (EVs)
EVs were isolated using total exosomes’ isolation reagent (Invitrogen, Thermal Fisher Scientific, USA, Catalogue # 4478359) from cell culture medium harvested after 24 h, 48 h, and 72 h of incubation following the manufacturer’s protocol. Collected media were centrifuged for 30 min at 2000 ×g to remove cell debris. The supernatant was then transferred to a new tube and mixed with the reagent at a 2:1 ratio then left at 4 ◦C overnight. Samples were recentrifuged at 10,000 ×g at 4oC for 65 min. The final pellets were resuspended in 1× phosphate-buffered saline (PBS). The isolated EVs were stored at 2°C to 8°C for up to 1 week, or at ≤20°C for long-term storage.
2.3. EVs Characterizations
2.3.1. Nanoparticle Tracking of the Isolated Extracellular Vesicles
The isolated EVs were studied with ZetaView@ (Particle Matrix Inc., Wildmoos, Inning am Ammersee, Germany) using both scatter and fluorescence mode (488-nm laser, 40 mW power) for information about the average size and concentration/ml of EVs in the collected samples.
2.3.2. Transmission Electron Microscope (TEM)
To confirm the existence of EVs in the sample, a life science TEM (JOEL JEM-1220, Tokyo, Japan) was used. 10 μL of a 1 in 10 dilution of the samples was applied to formvar/carbon-coated nickel TEM grids, and they were left incubating for 30 min. Then, deionized water was used to wash the grids twice. After that, the grids were dried and stained with phosphotungstic acid [18]. In addition, Immunogold labeling of EVs was performed using Anti-CD63 (Thermofischer, USA, Catalogue # PA5-100713). Grids were examined in a JEM 1400 Flash TEM (JEOL USA Inc., Peabody MA) at 110 kV and imaged with a Gatan One View Digital Camera (Gatan Inc., Pleasanton, CA).
2.4. Assessment of the Effect of Co-Culturing RMCs and RPE-EVs
2.4.1. GFAP Immunofluorescence (IF) for RMCs
Müller cells were seeded in Falcon cell culture slide- 8 chambers and cultured with RPE-EVs for 24 and 72 h. The concentrations for EVs were 160×106 particles/µl. The cells were fixed for IF. Therefore, there were 7 groups in each period as follows:
Group I: 4x10⁴ RMCs cultured in complete culture media without any addition.
Group II: 4x10⁴ RMCs co-cultured with RPE-EVs isolated under normoxia after 24 hr.
Group III: 4x10⁴ RMCs co-cultured with RPE-EVs isolated under normoxia after 48 hr.
Group IV: 4x10⁴ RMCs co-cultured with RPE-EVs isolated under normoxia after 72 hr.
Group V: 4x10⁴ RMCs co-cultured with RPE-EVs isolated under hypoxia after 24 hr.
Group VI: 4x10⁴ RMCs co-cultured with RPE-EVs isolated under hypoxia after 48 hr.
Group VII: 4x10⁴ RMCs co-cultured with RPE-EVs isolated under hypoxia after 72hr.
For IF Staining, the cells were fixed using 10% formaldehyde for 10 min. The antigen retrieval was done using an antigen retrieval solution. The slides were placed in the blocking buffer (BSA, goat serum, and TritonX mixture) for at least 30 min. After quick washes using PBS, x1, the GFAP Primary antibody (catalogue number PA1-10019) was added to the slides and left for 2 hrs. or overnight at RT or 4 degrees with blocking buffer 1:250. The next day, slides were washed in PBS x2. Secondary Antibody tagged with green fluorescence was added to the slides. Then, slides were washed by x2 PBS. The coverslip was placed using Vectashield DAPI mounting media (Sigma-Aldrich Chemical Corp., St. Louis, MO, USA). The slides were stored and examined in the dark.
2.4.2. Proteomics for RMCs
RMCs were seeded in a 6-well plate and cultured with RPE-EVs for 24 and 72 h. The concentrations for EVs were 160×106 particles/µl. Then, the cells were harvested and collected in Eppendorf. The cells were divided into the following groups:
Group I: RMCs normally cultured in complete culture media
Group II: RMCs co-cultured with RPE-EVs isolated under normoxia after 24 h
Group III: RMCs co-cultured with RPE-EVs isolated under normoxia after 72 h
Group IV: RMCs co-cultured with RPE-EVs isolated under hypoxia after 24h.
Group V: RMCs co-cultured with RPE-EVs isolated under hypoxia after 72h
LC-MS/MS Sample Preparation and Analysis Summary
Cell Lysis: Cells were harvested using 0.25% EDTA-trypsin, centrifuged at 1200 rpm for 5 minutes, and washed with PBS. The cell pellets were lysed using RIPA buffer and centrifuged. The resulting supernatant was collected, and protein concentration was quantified using the BCA assay.
Protein Digestion: Trypsin was added at a 1:25 enzyme-to-protein ratio, and digestion proceeded at 37 °C for 16 hours. The peptides were collected via centrifugation, eluted with ddH₂O and NH₄HCO₃, and dried at 45 °C.
Data Acquisition: Peptide samples were analyzed using the Easy-nLC 1200 system coupled with an Orbitrap Fusion Lumos mass spectrometer in Data-Dependent Acquisition (DDA) mode. Data was acquired in real-time using XCalibur software.
Data Analysis: Raw MS data were analyzed using MaxQuant (v2.0.3.0), referencing the Human Uniprot database. The FDR threshold was <1%. Protein expression data from both RMC and RPE cells were normalized and analyzed statistically using Perseus (v2.0.3.0), and pathway enrichment was conducted using Metascape with KEGG, Reactome, and GO databases.
Data Normalization: Targeted proteomics data were normalized against reference proteins, which were GAPDH and β-actin. Therefore, the target protein level was normalized by dividing it by the normalization factor. The normalization factor was the mean of both GAPDH and β-actin levels.
2.5. Assessment of the effect of Co-Culturing RPE and RMCs-EVs.
2.5.1. Electric Cell-Substrate Impedance Sensing Method (ECIS)
The electric cell-substrate impedance sensing [ECIS®Zθ (theta)] instrument (Applied Biophysics Inc., Troy, NY, USA) was used to measure normalized transcellular electrical resistance (TER) of RPE as an indicator of the barrier integrity. Briefly, electrode arrays (96-wells, Applied Biophysics Inc., Catalogue # 96W20idf PET) coated with 0.02 % gelatine and 100 μM cysteine were used to culture RPE. The cells were either cultured alone or cocultured with 80×106 particles/µl RMCs-EVs isolated after 24hr, 48hr, or 72hr under both normoxia and hypoxia. Accordingly, the RPE was also divided into 7 groups. TER was independently measured in each well over the experimental time course (Every 24 h). Plotting of the normalized resistance as a function of time was done after calculating the ratio of the measured resistance to baseline resistance.
2.5.2. Proteomics for RPE
RPEs were seeded on a 6-well plate and cultured with RMCs-EVs for 24 and 72 h. The concentrations for EVs were 160×106 particles/µl. Then, the cells were harvested and collected in Eppendorf. The groups were as follows:
Group I: RPEs cultured alone in complete culture media
Group II: RPEs co-cultured with RMC-EVs isolated under normoxia after 24 h
Group III: RPEs co-cultured with RMC-EVs isolated under normoxia after 72 h
Group IV: RPEs co-cultured with RMC-EVs isolated under hypoxia after 24h.
Group V: RPEs co-cultured with RMC-EVs isolated under hypoxia after 72h
The remaining steps for LC-MS/MS Sample Preparation and Analysis are the same as mentioned previously with RMCs’ proteomics.
3. Results
3.1. EVs Characterization
3.1.1. Nanoparticle Tracking Analysis by Zetaveiw Analysis
3.1.2. Transmission Electron Microscope
Transmission electron microscopy was used to confirm the presence of EVs in the suspensions and can be used to describe EVs’ morphology and match the size that was found by Zetveiw analysis. EVs' shapes were oval or spherical. Using anti-CD63, immunogold labelling detected CD-63 inside and on the surface of the EVs. (RPE-EVs: Figure (1) i and ii) (RMC-EVs: Figure (2) i and ii)
3.2. Co-Culture RMCs and RPE-EVs
3.2.1. Time-Dependent GFAP Upregulation in RMCs Treated with Hypoxic and Normoxic RPE EVs
As anti-GFAP is a widely used marker for retinal injury and/or reactive Müller glial cells and gliosis, it has been selected to detect the effect of RPE-EVs isolated after a hypoxic condition versus a normal condition. This reactivity after 24 and 72h was less noted in the RMCs control group. GFAP immune-expression after 24h of incubation was significantly higher in the RPE EVs treated groups- either normoxic or hypoxic- than the control group. Meanwhile, there was a non-significant difference among the EV-treated groups. After 72h of RMCs and RPE EVs co-culturing, GFAP also showed a marked rise in RPE EVs treated groups, but it was more significant in RMCs treated with 72h hypoxic RPE EVs. GFAP expression was also significantly higher in RMCs treated by 72h hypoxic RPE EVs when compared to both RMC groups treated with either 24h or 72h normoxic RPE EVs Figure 3.
3.2.2. Proteomic Profiling Reveals Temporal Pathway Modulation in RMCs by Hypoxia-Induced RPE-EVs
Under hypoxia, there were notable changes after the analysis of the proteomic data and analysis of the RMC protein enrichment after coculturing with RPE EVs for 24h and 72h. After 24h of coculturing, the top 20 enriched pathways were correlated to cytoplasmic translation processes, RNA stabilization, amino acid metabolism, mineral absorption, and synaptic functions. Meanwhile, after 72h of coculturing, the top 30 enriched pathways were mainly related to mitochondrial activity, and ATP-related processes, including ATP synthase, oxidative phosphorylation, aerobic respiration, and citric cycle. Figure 4
3.3. Co-culture RPE and RMC-EVs
3.3.1. Hypoxic RMC-EVs Disrupt RPE Barrier Integrity in a Time-Dependent Manner
The integrity of junctions between the RPE cells treated with normoxia and hypoxia RMC EVs for 24h, 48h, and 72h was assessed by ECIS which demonstrated a non-significant change in the intercellular resistance among the RPE cells treated with normoxia RMC EVs for 24h, 48h, and 72h (blue line). An evident decrease in TER was detected in RPE cocultured with hypoxic RMC EVs for 24h, and this attenuation progressed over time after 48h and 72 h of coculturing with hypoxic RMC EVs (yellow line) Figure 5
3.3.2. Hypoxic RMC-EVs Induce Distinct Temporal Proteomic Signatures in RPE Cells
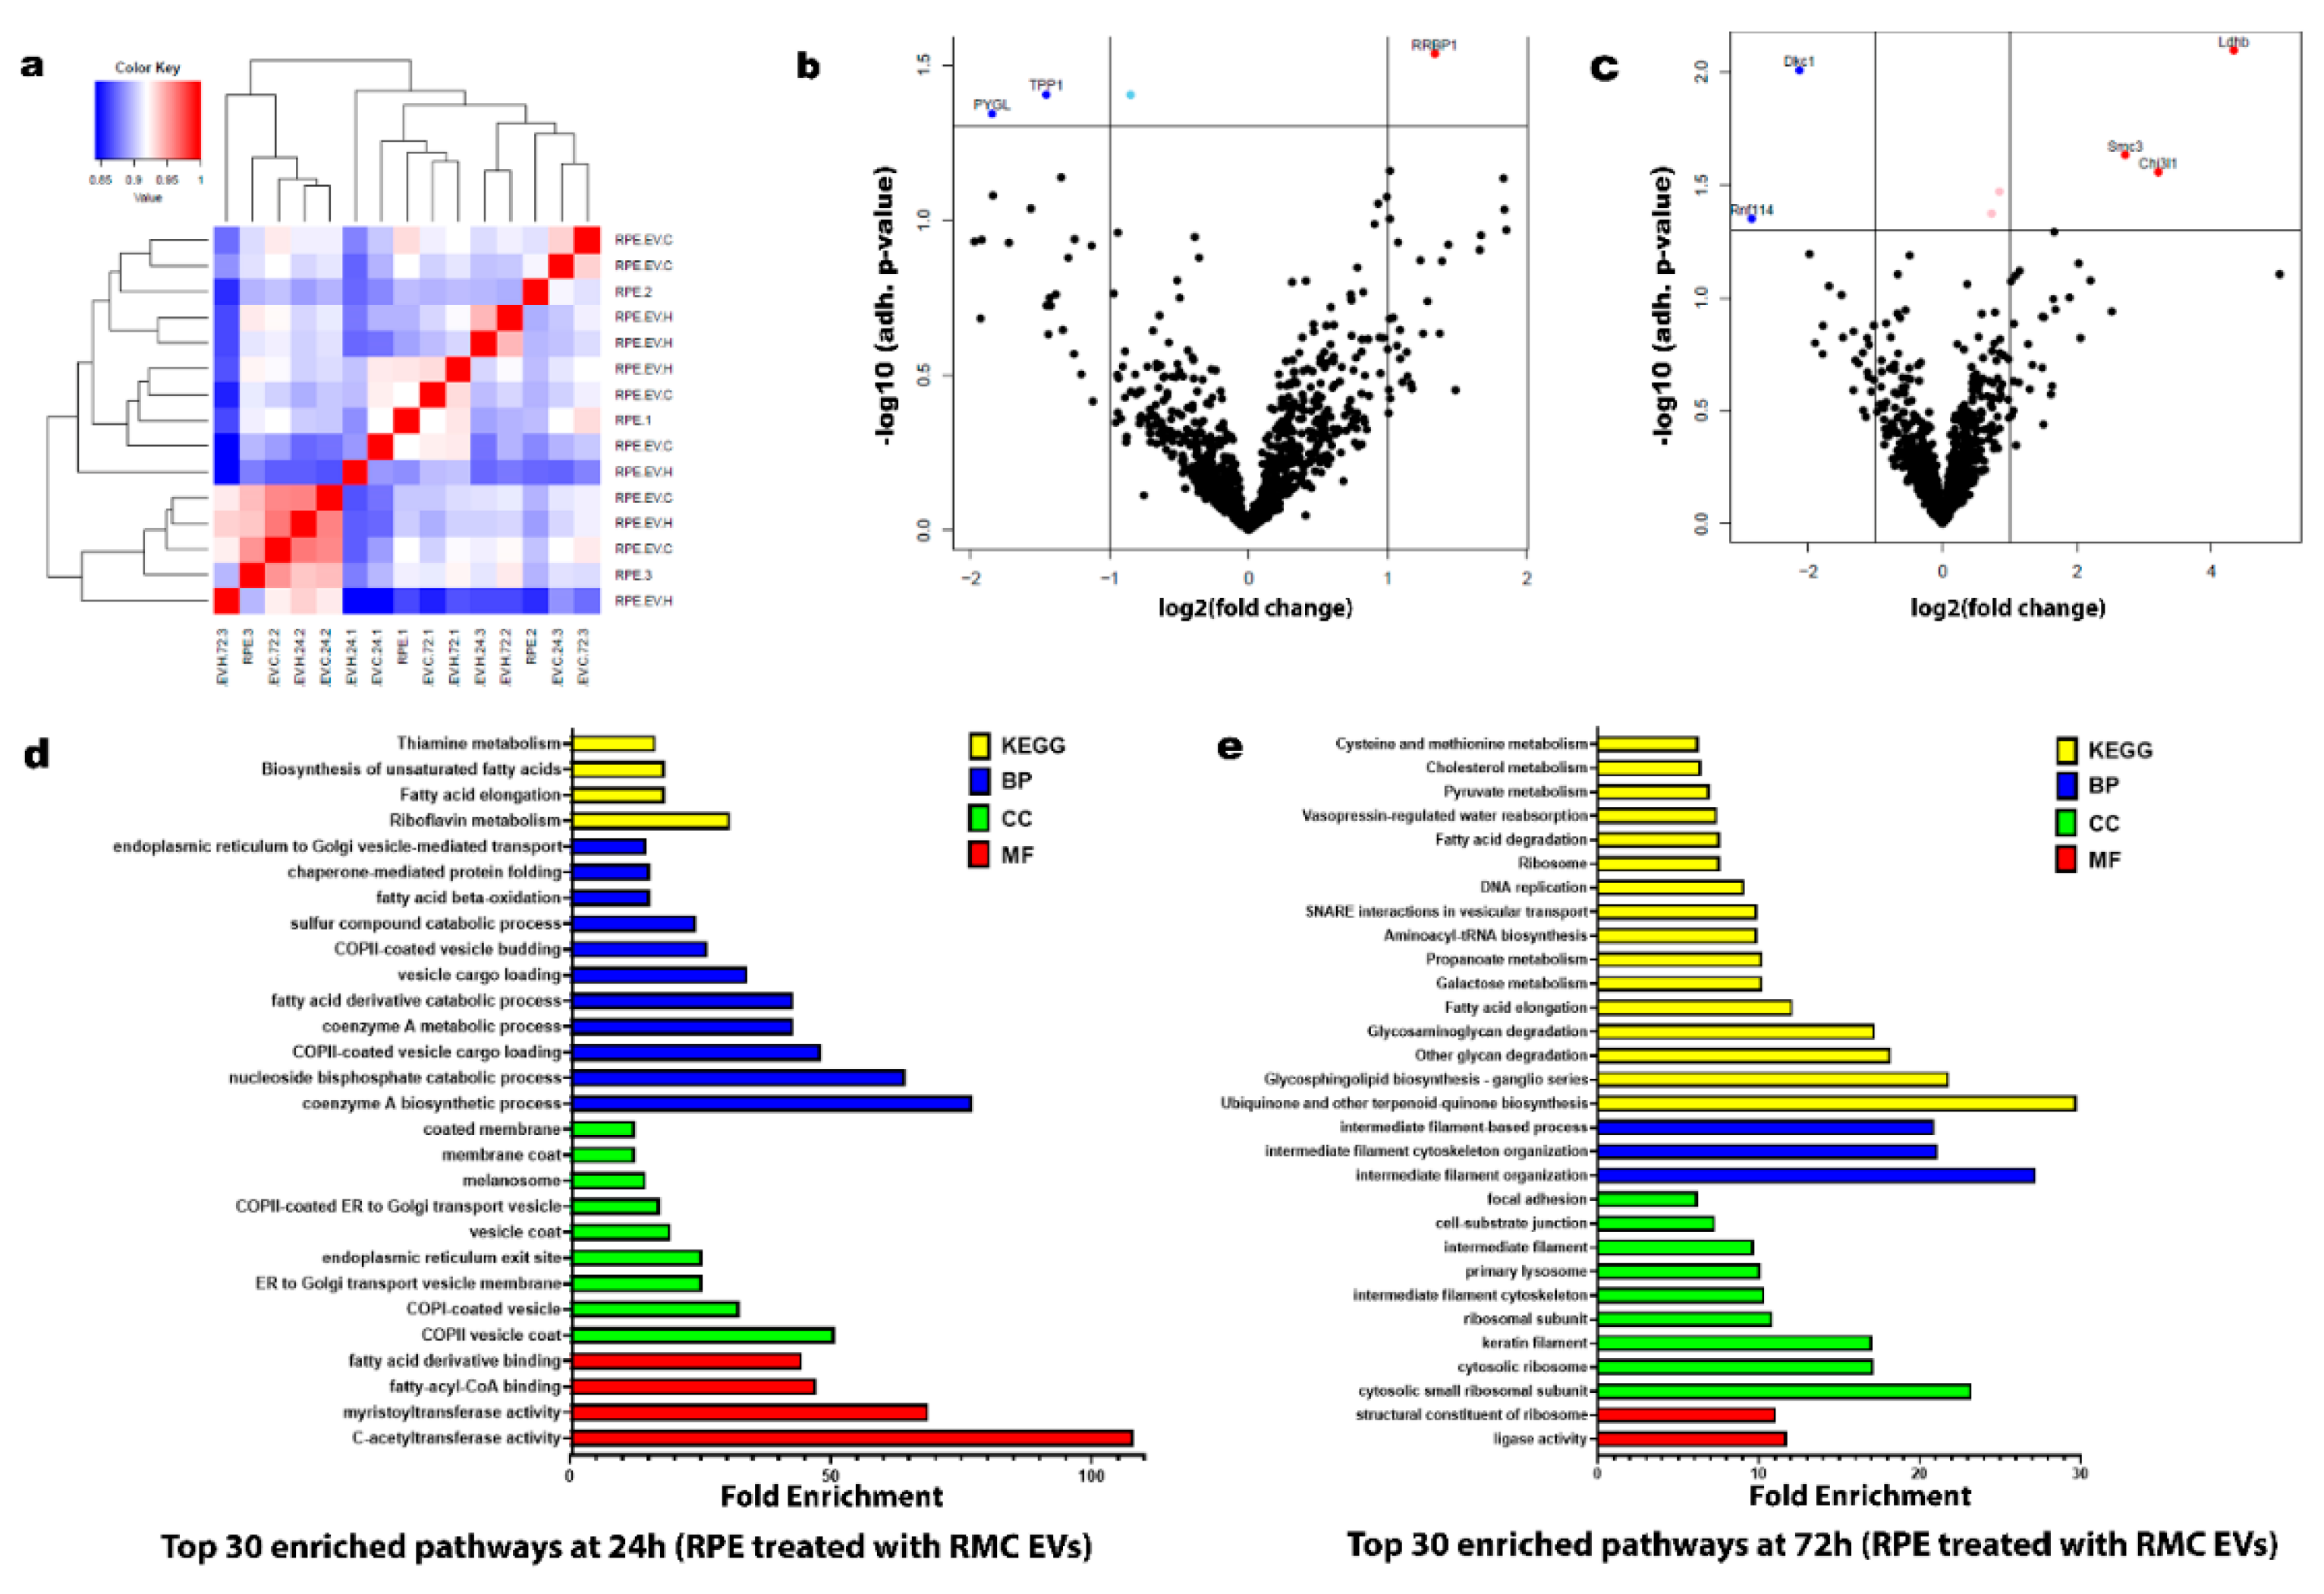
Under hypoxia, there were notable changes after the analysis of the proteomic data and analysis of the RPE protein enrichment after coculturing with RMC EVs for 24h and 72h. After 24h of coculturing, the top 30 enriched pathways were correlated to ER activity and cellular vesicular transport, together with fatty acid metabolism. Meanwhile, after 72h of coculturing, the top 30 enriched pathways were mainly related to biosynthetic pathways, including protein synthesis, cytoskeletal proteins formation, and cellular support and adhesion. Figure 6.
3.4. Proteomic Validation Results
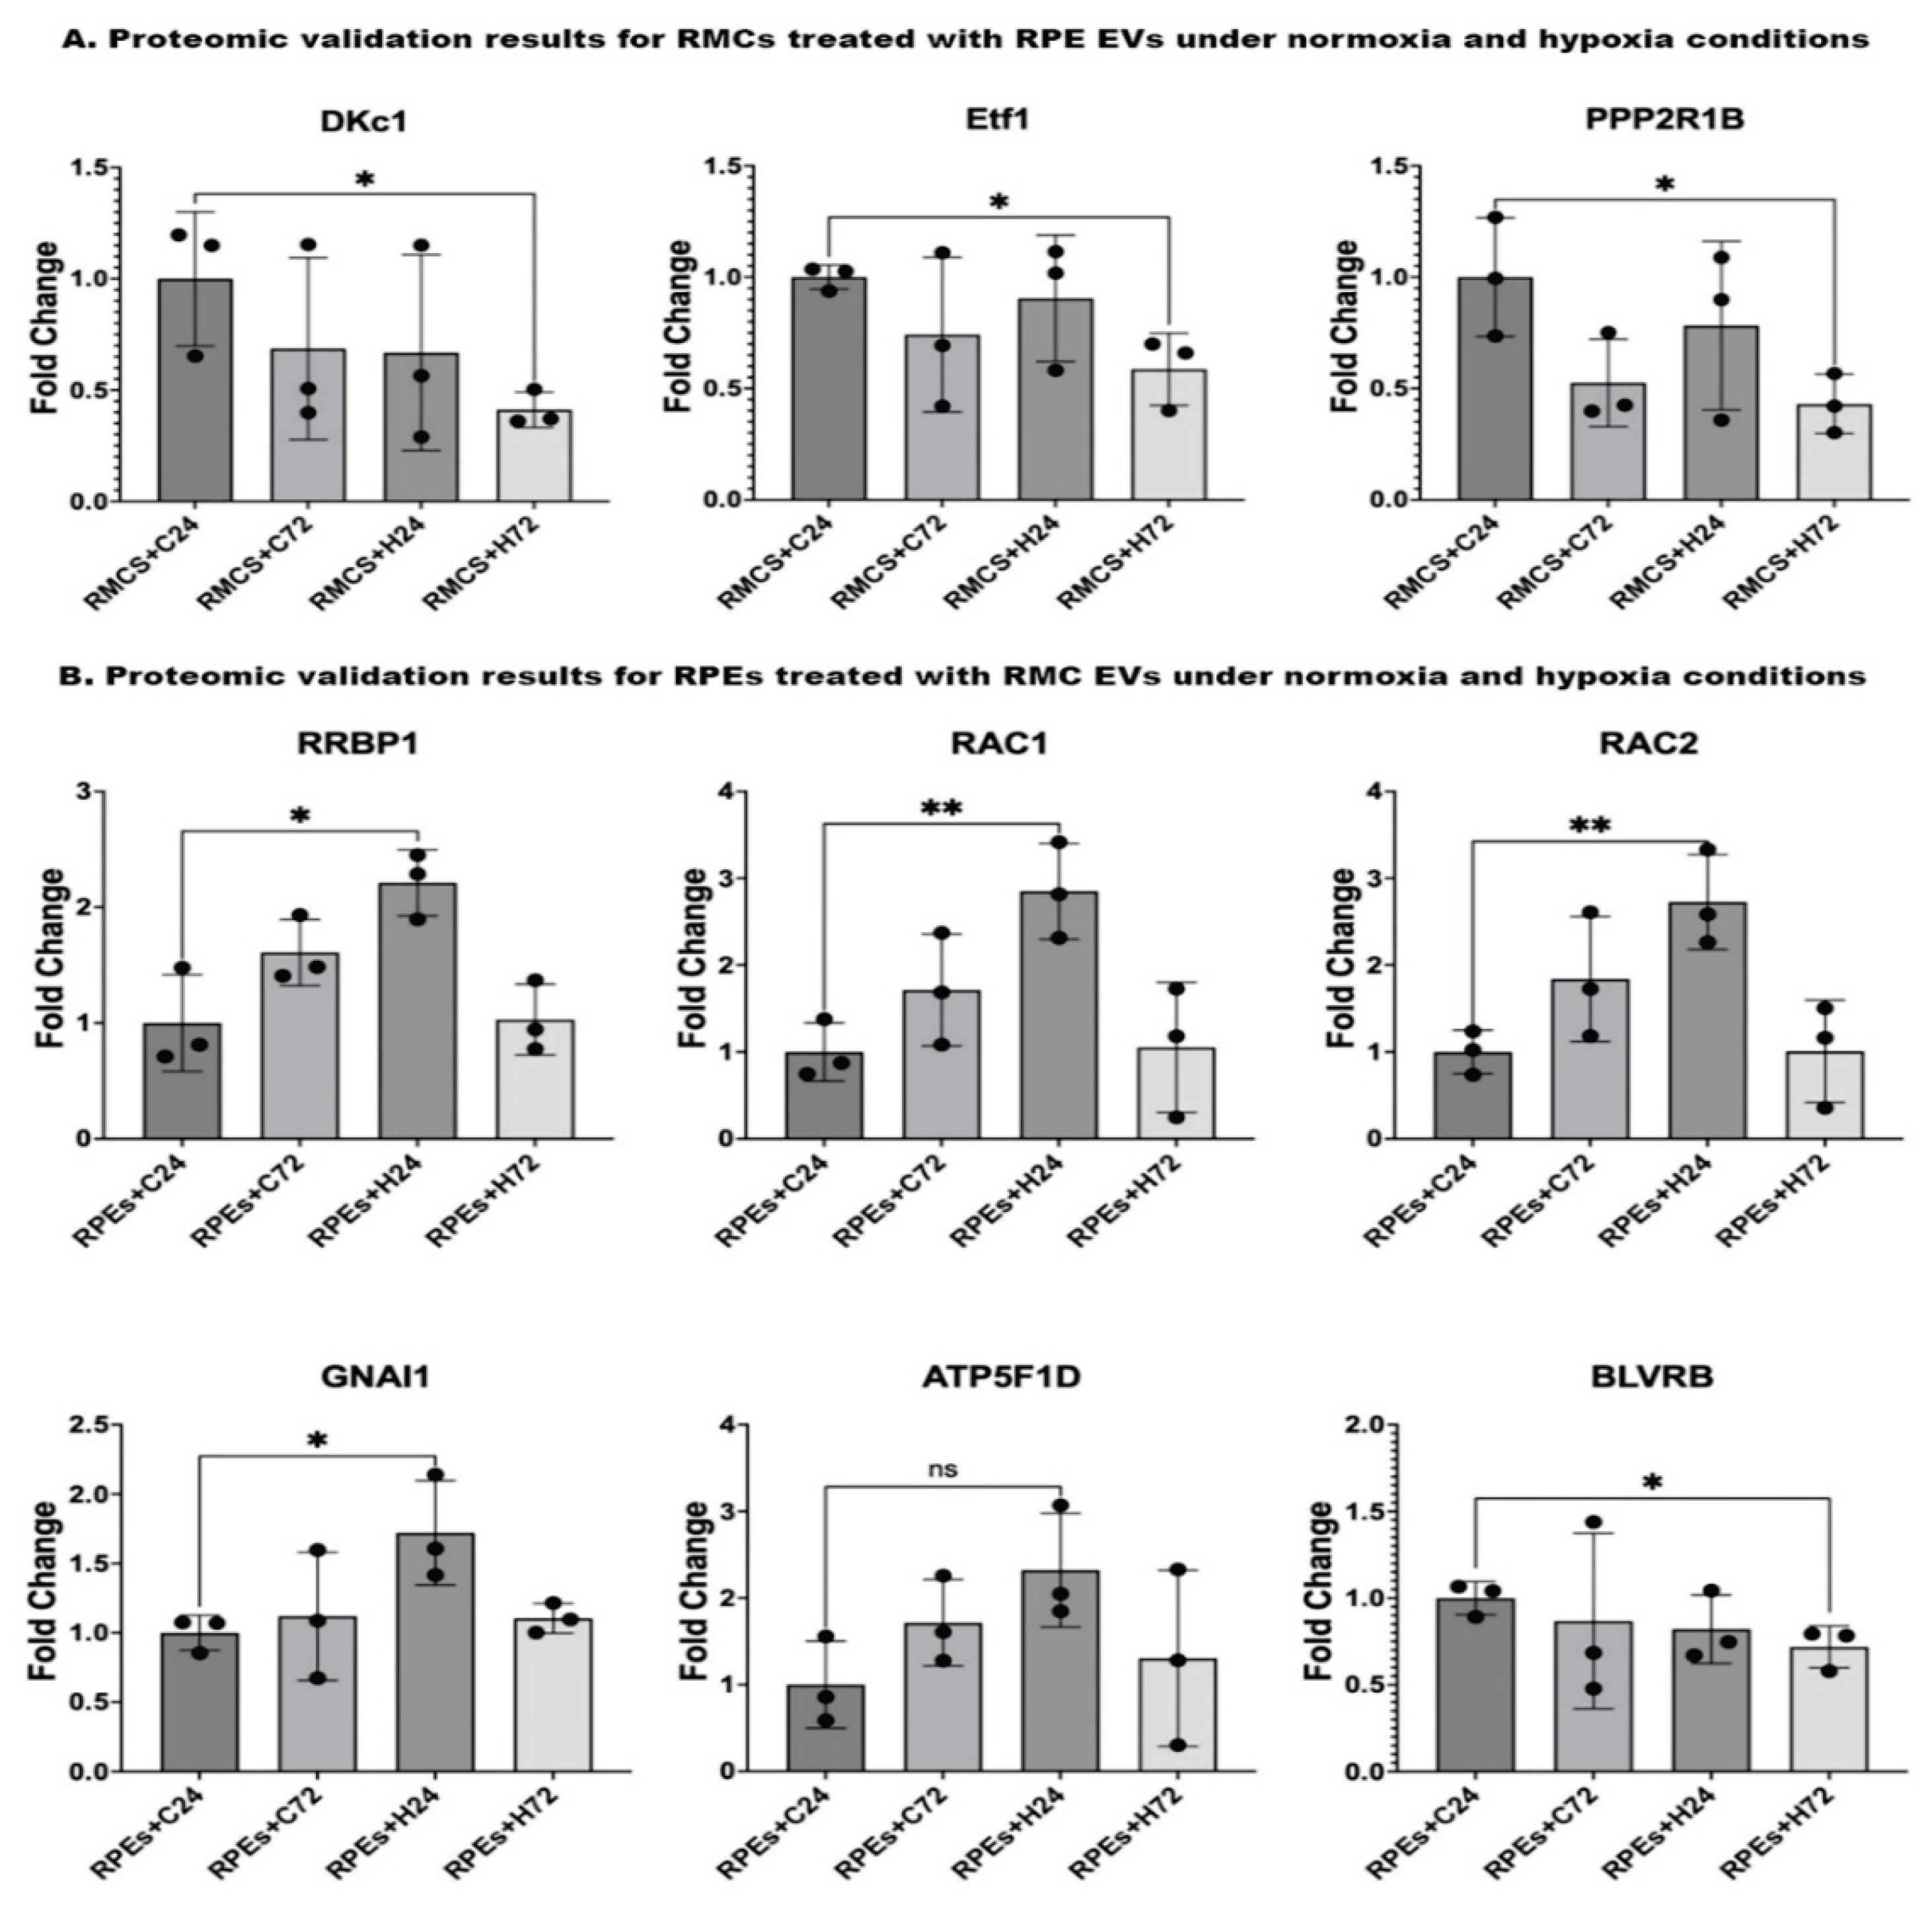
On validating the proteomic results for RMCs treated with RPE EVs, it showed a significant downregulation of DKc1, Etf1, and PPP2R1B protein expression in RMCs treated with RPE EVs after 72h of hypoxia compared to those RMCs treated with RPE EVs under normoxia for 24h.
On validating the proteomic results for RPE treated with RMC EVs we found the following: on comparing the protein expressions in RPE treated with RMC-EVs after 24h of hypoxia, those RPE treated with RMC-EVs under normoxia for 24h showed a significant elevation of RRBP1, RAC1, RAC2, and GNAI1. On the other hand, there was a non-significant rise in ATP5F1D expression. BLVRB gene expression was significantly higher in RPE treated with RMC EVs after 72h of hypoxia when compared to RPE treated with RMC-EVs under normoxia for 24h.
Figure 7.
Proteomic validation of both RMCs and RPE occulted with EVs under normoxic and hypoxic conditions. (A) Proteomic validation results for RMCs treated with RPE EVs: It shows a significant reduction of DKc1, Etf1, PPP2R1B gene expressions in RMC treated with RPE EVs after 72h of hypoxia compared to those RMC treated with RPE EVs under normoxia for 24h. (B) Proteomic validation results for RPE treated with RMC-EVs: On comparing the gene expressions in RPE treated with RMC-EVs after 24h of hypoxia, those RPE treated with RMC-EVs under normoxia for 24h showed a significant elevation of RRBP1, RAC1, RAC2, and GNAI1. On the other hand, there was a non-significant rise in ATP5F1D gene expression. BLVRB gene expression was significantly higher in RPE treated with RMC EVs after 72h of hypoxia when compared to RPE treated with RMC-EVs under normoxia for 24h.
4. Discussion
The retina ranks among the most metabolically active organs in the human body. Its metabolic processes are tightly regulated to ensure an adequate supply of blood and oxygen necessary for neural transmission of visual signals [19]. Two vascular systems support the retina: the choriocapillaris and the central retinal artery. The choriocapillaris nourishes the outer layers of the retina, including RPE and photoreceptors, while the central retinal artery delivers oxygen to the inner retina, including the retinal ganglion cells and the retinal nerve fiber layers [20,21]. Retinal arteries are regulated by vasogenic factors released from the endothelium in response to intraocular pressure and the retina's metabolic demands [22].
The retina meets its energy demands primarily through aerobic respiration and β-oxidation. However, during metabolic stress or low oxygen conditions (hypoxia), it increasingly depends on alternative pathways like the pentose phosphate pathway and anaerobic metabolism [23]. Notably, hypoxia has also been shown to enhance β-oxidation, suggesting this process plays a role in both healthy and diseased states. These metabolic shifts help retinal cells adapt and survive under hypoxic conditions [24].
As mentioned before, RPE supports the retina through maintaining retinal structure and function, conducting phagocytosis, forming the outer BRB, transporting nutrients, ions, and water, absorbing light, shielding retinal cells from photo-oxidative damage, sustaining the visual cycle, and producing essential factors. Therefore, it is essential for proper eye function, and any disruptions in this layer structurally or functionally causes several eye diseases [9,25]. Disruptions in the structure or function of the RPE are closely linked to several eye diseases, such as age-related macular degeneration (AMD), proliferative vitreoretinopathy (PVR), Stargardt disease, retinitis pigmentosa (RP), and diabetic retinopathy (DR) [12].
Müller cells are the principal radial glial cells of the retina, extending across its full thickness and interacting with all types of retinal cells [26]. In disease states, various intracellular signaling pathways become activated within Müller cells, leading to increased production of pro-angiogenic factors and suppression of anti-angiogenic factors. These responses are further intensified by the proliferation and dedifferentiation of Müller cells [27].
Extracellular vesicles (EVs) facilitate intercellular communication by transferring bioactive molecules such as proteins, lipids, mRNAs, and microRNAs. In the retina, especially under stress conditions like hypoxia, EVs could play a vital role in mediating the crosstalk between Müller glial cells and RPE cells—two cell types crucial for maintaining retinal structure, homeostasis, and function [28,29,30]. Under hypoxic conditions, both Müller cells and RPE cells undergo metabolic and functional alterations. Hypoxia can stimulate the release of EVs with altered cargo, reflecting the cellular stress response [31,32].
In the current work, culturing RMCs together with RPE-EVs, the GFAP expression was evaluated by IF as GFAP is a widely used marker for retinal injury. GFAP expressions showed significant elevation under both normoxic and hypoxic conditions. GFAP can initially help stabilize the retinal environment. During hypoxia, it undergoes upregulation due to Müller cell activation and retinal stress. Prolonged or excessive GFAP expression may contribute to pathological remodeling and visual impairment [33]. GFAP expression during hypoxia may be influenced by HIF-1α signaling, a key transcription factor activated under low oxygen conditions [34].
Using pathway enrichment analysis of the proteomics data, we investigated the underlying metabolic pathways that may be changed between normoxia and hypoxia during the co-culturing of RMCs with RPE EVs. After 24h of culturing RMCs with hypoxic RPE EVs, the enriched pathways including the cellular components, biological processes, and genomic expression were mainly directed to maintain the normal function of RMCs including cytoplasmic proteins’ formation, RNA stabilization, glutamate and aspartate metabolism, calcium and minerals absorption in addition to normal neurotransmitters function as dopamine and serotonin [26]. Glutamate, a neurotransmitter released by neurons, is taken up by Müller cells through the glutamate-aspartate transporter. Within Müller cells, the reclaimed glutamate is converted into glutamine by the enzyme glutamine synthetase, which is abundantly expressed in these cells. The resulting glutamine is then released by Müller cells and transported back to neurons for reuse [35].
On the other hand, after culturing RMCs with hypoxic RPE EVs for 72h, metabolic reprogramming occurred, and the enriched pathways were aligned to enhanced mitochondrial function and ATP production, including enhanced proton-transporting ATP synthase, negative control of small GTPase, enhanced oxidative phosphorylation, and tricarboxylic acid cycle (TCA) cycle. Those findings are in agreement with previous studies that indicated that normally, ATP in Müller cells is mainly obtained through the glycolytic pathway, and the oxygen consumption is extremely low. Thus, Müller cells tolerate persistent hypoxia and hypoglycemia, saving oxygen and providing energy for the neurons [36].
On validating the data, there was a significant reduction of the levels of DKc1, ETF1, and PPP2R1B in RMCs co-cultured with hypoxic RPE EVs for 72h when compared to the control group. This finding aligns with the previously mentioned adaptive trials of RMCs to maintain their function as normally as possible. DKc1, which is known to play an active role in telomerase stabilization and maintenance, as well as recognition of small nucleolar RNA ribonucleoproteins (snoRNPs). Its reduction in the studied cells may lead to impaired RNA processing, affect telomere stability, and facilitate apoptosis of the cells [37]. DKC1 dysfunction leads to telomere shortening, which causes premature cellular apoptosis. Some studies in telomeropathy models suggest retinal degeneration may occur secondary to telomerase dysfunction [38,39]. Ischemia induces a global shutdown of translation, but some stress-responsive proteins (e.g., HIF-1α, VEGF) need to be selectively translated [40]. DKC1 is part of the H/ACA ribonucleoprotein complex, involved in rRNA modification (pseudouridylation) and stabilization of various RNAs. Disruption of DKC1 function could impair the stress-adaptive translational landscape, leading to inefficient stress responses in ischemic tissues [41].
ETF1 protein plays an essential role in directing the termination of mRNA translation by recognizing the stop codons. It has been linked to peptide chain elongation and nervous system development pathways. It is also involved in the regulation of apoptosis [42]. Hypoxic stress (e.g., in DR) triggers translational reprogramming [43]. Translation termination factors like ETF1 may be modulated under hypoxia to selectively translate survival or angiogenic proteins (e.g., VEGF). Dysregulation could contribute to abnormal angiogenesis or neuronal cell death in ischemic retinal diseases [44]. Translation termination factors like ETF1 are tightly linked to the quality control of newly synthesized proteins [45]. In retinal cells, particularly the RPE and Müller glia, this balance is critical. Disruption may exacerbate oxidative stress, promote inflammation, or lead to cell death seen in retinal hypoxic conditions (e.g., DR, retinal vein occlusion) [46].
PPP2R1B is a group of enzymes that catalyze the removal of phosphate groups from serine and/or threonine residues by hydrolysis of phosphoric acid monoesters. They oppose the action of kinases and phosphorylases and are involved in signal transduction [47]. Disruption in PPP2R1B expression or function could alter PP2A activity, which regulates apoptosis by dephosphorylating pro-apoptotic and anti-apoptotic proteins (e.g., Bad, Bcl-2, p53). contributing to excessive or impaired cell death in the retina [48,49]. PP2A negatively regulates inflammatory signaling pathways, including NF-κB, MAPK, and STAT3 [50]. In retinal glial cells (Müller glia, microglia), these pathways are activated during injury or stress [51]. A deficit in PPP2R1B might enhance inflammatory responses, exacerbating gliosis and retinal damage in diseases like DR or retinal ischemia.
During the current work, we assessed the barrier integrity between RPE after culturing with RMC-EVs under normoxic and hypoxic conditions. The resistance showed a dramatic decline over time among the hypoxic-EVs-treated groups, but there was no significant change among the normoxic-EVs-treated groups. The BRB consists of inner and outer components and plays an important role in the homeostatic regulation of the retinal microenvironment. The outer BRB (oBRB) is formed by tight junctions (TJ) between cells of the retinal pigment epithelium (RPE) [52].
In a hypoxic adult rat model in which a severe disruption of the iBRB is induced by two hours of hypoxia, no disruption of the oBRB was seen. The intercellular spaces between RPE cells were widened, but the TJs remained intact and prevented the impact of the systemically administered Horseradish peroxidase (HRP). Findings suggest that the oBRB is highly resistant to hypoxic damage and disruption of the oBRB, when it occurs, involves factors other than hypoxia as oxidative stress and generation of ROS [53].
The present study showed the dominance of fatty acid metabolic pathways, together with ER-related, and intracellular vesicular transport in RPE cells cultured with 24h hypoxia RMC EVs. These findings closely resemble the typical efficient metabolic function of RPE, which plays a key role in supplying energy to retinal cells and preserving photoreceptor structure and function. The RPE primarily relies on substrates such as lactate, proline, and fatty acids for mitochondrial respiration, with ATP production mainly driven by the oxidative phosphorylation of lactate. Recent research has highlighted proline as the dominant metabolic substrate used by the RPE, which is synthesized within the cells from ornithine through the action of ornithine aminotransferase (OAT) [54].
RPE cells transport lipids to fuel photoreceptors, so normal lipid metabolism in the RPE is important for photoreceptor survival and function. Normal lipid metabolism is important for maintaining RPE mitochondrial metabolism. Fatty acids from shed photoreceptor outer segments are metabolized in the mitochondria of RPE by β-oxidation to produce NADH, FADH2, and acetyl coenzyme A [55].
RMC-EVs after 72h of hypoxia have shifted the proteomic pathways of cocultured RPE. The enhanced pathways included increased cytoplasmic ribosomes and function, increased intermediate filament expression, like keratin filament, most notably the biosynthesis of Ubiquinone and other terpenoid-quinone compounds. Ubiquinone (UQ), also known as coenzyme Q (CoQ), is a redox-active lipid present in all cellular membranes where it acts in a range of biological activities, mostly to enhance ATP production and minimize reactive oxygen species production [56].
On validating the data, the levels of RRBP1, RAC1 &2, and GANI1 were significantly elevated, but ATP5P1D was non-significantly increased in RPE cultured with hypoxic RMC EVs for 24h compared to the control group. BLVRB was significantly reduced in RPE cultured with hypoxic RMC EVs for 72h compared to the control group.
Aligning with the proteomic findings, RRBP1(also referred to as p180) is a membrane-bound protein found in the endoplasmic reticulum that enhances the association of certain mRNAs with the endoplasmic reticulum. It plays a role in ER morphology, ER proliferation, secretory pathways, and secretory cell differentiation, and the mediation of ER-microtubule interactions [57]. Hypoxia impairs oxygen-dependent protein folding in the ER, causing ER stress and activating the unfolded protein response (UPR) [58]. RRBP1 contributes to mRNA anchoring and protein translation on the rough ER. RRBP1 dysregulation may disrupt protein quality control, increase misfolded protein accumulation, and lead to apoptosis or inflammatory signaling [59].
RAC1 and RAC2 are small GTPases of the Rho family that regulate critical cellular functions such as cytoskeletal remodeling, oxidative stress signaling, cell survival, and inflammation. Both play overlapping yet distinct roles depending on cell type and context. While RAC1 is ubiquitously expressed, RAC2 is primarily found in hematopoietic and immune cells [60]. In the context of retinal hypoxia as seen in diseases like DR, retinal vein occlusion (RVO), and AMD, RAC1 and RAC2 are implicated through several mechanistically relevant pathways [61,62,63]. RAC1 activates NADPH oxidase, particularly NOX2, leading to the generation of ROS [64]. In hypoxic retinal tissue, this contributes to endothelial dysfunction, blood-retinal barrier (BRB) breakdown, and oxidative damage to photoreceptors and RPE cells [65,66]. In Müller glial cells, Rac1 contributed to the crosstalk between different signaling pathways activated in Müller glia after injury [67]. Rac1 is responsible for activating the expression of hypoxia-induced HIF-1α. Upregulation of VEGF in hypoxic RPE cells, mediated by HIF-1, is responsible for choroidal neovascularization. Zhang et al. found that the levels of HIF-1α and Rac1 protein significantly increase in a time-dependent manner under hypoxia. The expression of HIF-1α protein reaches the maximum at 8 h, and Rac1 protein reaches the maximum at 4 h, which starts to decrease after that [68]
GNAI1 is a G-protein α-subunit involved in inhibitory signaling pathways, notably those mediated by G-protein-coupled receptors (GPCRs). Direct studies linking GNAI1 to retinal diseases are limited, but it has been linked to colitis, colon cancer, seizures, hypotonia, and neurodevelopmental disorders [69,70,71]. In colorectal cancer models, exosomal miR-320d has been shown to downregulate GNAI1 expression in vascular endothelial cells. This downregulation leads to the activation of the JAK2/STAT3 signaling pathway and an increase in VEGFA expression, promoting angiogenesis [72]. GNAI1's involvement in inhibitory signaling pathways suggests it could modulate responses to hypoxia, possibly by influencing angiogenic signaling or interacting with hypoxia-responsive transcription factors.
ATP5F1D (formerly known as ATP5D) encodes the delta subunit of mitochondrial ATP synthase (Complex V), a critical enzyme in oxidative phosphorylation responsible for ATP production. While direct studies linking ATP5F1D to retinal hypoxia are limited, emerging research highlights the broader role of mitochondrial ATP synthase subunits in retinal energy metabolism and hypoxia-induced pathologies [73]. Under hypoxic conditions, such as diabetic retinopathy, AMD, and oxygen-induced retinopathy (OIR), mitochondrial functions are compromised, including altered ATP Synthase activity that leads to decreased ATP production, exacerbating energy deficits in retinal cells [74,75,76].
BLVRB (Biliverdin Reductase B) is an enzyme that catalyzes the conversion of biliverdin to bilirubin. It is a potent antioxidant that enables biliverdin reductase [NAD(P)+] activity, peptidyl-cysteine S-nitrosylase activity, and riboflavin reductase (NADPH) activity. It is in cytosol, nucleoplasm, and plasma membrane. It acts as a regulator of hematopoiesis, intermediary metabolism (glutaminolysis, glycolysis, TCA cycle, and pentose phosphate pathway) [77]. Studies on BLVRB in retinal hypoxia are scarce, the enzyme's antioxidant role suggests it could mitigate oxidative damage in hypoxic retinal conditions.
5. Conclusions
Our study highlights the critical role of EV-mediated crosstalk between RPE and Müller cells in adapting to hypoxia. Short-term hypoxia induces a protective metabolic shift in Müller cells, supporting neurotransmitter recycling and maintaining cellular function, while prolonged hypoxia leads to metabolic reprogramming geared toward enhancing mitochondrial respiration and ATP production. Concurrently, hypoxic RPE cells exhibit alterations in lipid metabolism, intracellular vesicular transport, and biosynthesis of mitochondrial co-factors such as ubiquinone, all of which contribute to sustaining retinal energy demands and minimizing oxidative stress.
Proteomic analysis revealed time-dependent modulation of key molecular pathways and proteins, including reduced levels of DKc1, ETF1, and PPP2R1B, implicating changes in RNA processing, translation termination, and signal transduction, as well as elevated expression of proteins like RRBP1, RAC1/2, and GNAI1 that support endoplasmic reticulum function, cytoskeletal dynamics, and neurodevelopmental signaling. The changes in barrier integrity observed in oBRB further emphasize the selective vulnerability and resilience of retinal components to hypoxic stress.
Together, these findings underscore the retina's intricate response to hypoxia, involving coordinated metabolic and molecular adaptations in Müller and RPE cells. EV-mediated intercellular communication emerges as a crucial mechanism for maintaining retinal homeostasis and function under adverse conditions, offering potential therapeutic targets for preventing or mitigating hypoxia-related retinal degeneration.
Supplementary Materials
The following supporting information can be downloaded at the website of this paper posted on Preprints.org.
Author Contributions
Conceptualization, Khaled Elmasry; Data curation, Alaa Mansour and Khaled Elmasry; Formal analysis, Mohamed Gad and Samar Habib; Funding acquisition, Khaled Elmasry; Investigation, Alaa Mansour and Khaled Elmasry; Methodology, Alaa Mansour and Khaled Elmasry; Supervision, Khaled Elmasry; Validation, Mohamed Gad and Samar Habib; Writing – original draft, Alaa Mansour and Mohamed Gad; Writing – review & editing, Samar Habib and Khaled Elmasry.
Funding
This work is supported by the Start-up fund from Augusta University, the Dental College of Georgia for KE and NIH core grant P30EY031631 to Vision Discovery Institute at Medical College of Georgia, Augusta University, Augusta, GA, USA.
Institutional Review Board Statement
Not applicable.
Informed Consent Statement
Not applicable.
Data Availability Statement
The original contributions presented in this study are included in the article/supplementary material. Further inquiries can be directed to the corresponding author(s).
Acknowledgments
The authors would like to thank Dr. Bartoli’s lab (Department of Ophthalmology, The Medical College of Georgia) for their help and guidance during this study.
Conflicts of Interest
The authors declare no conflicts of interest.
Abbreviations
The following abbreviations are used in this manuscript:
| DR | Diabetic retinopathy |
| AMD | Age-related macular retinopathy |
| GFAP | Glial fibrillary acidic protein |
| RPE | Retinal pigmented epithelium |
| EVs | Extracellular vesicles |
| oBRB | Outer blood-retinal barrier |
| PEDF | Pigment epithelial-derived factor |
| VEGF | Vascular epithelial growth factor |
| HIF-1 | Hypoxia-inducible factor 1 |
| ROS | Reactive oxygen species |
| RP | Retinitis pigmentosa |
| SD | Stargardt disease |
| FBS | Fetal bovine serum |
| PBS | Phosphate-buffered saline |
| TEM | Transmission electron microscope |
| ECIS | Electric cell-substrate impedance sensing method |
| TER | Transcellular electrical resistance |
| MF | Molecular function |
| CC | Cellular component |
| BP | Biological process |
| KEGG | Kyoto Encyclopedia of Genes and Genomes |
| ER | Endoplasmic reticulum |
| PVR | Proliferative vitreoretinopathy |
| TCA | Tricarboxylic acid cycle |
| DKC1 | Dyskerin Pseudouridine Synthase 1 |
| snoRNPs | small nucleolar RNA ribonucleoproteins |
| ETF1 | Eukaryotic Translation Termination Factor 1 |
| PPP2R1B | Protein Ser/Thr phosphatases |
| TJ | Tight junctions |
| HRP | Horseradish peroxidase |
| OAT | Ornithine aminotransferase |
| UQ | Ubiquinone |
| CoQ | coenzyme Q |
| RRBP1 | Ribosome-binding protein 1 |
| URP | Unfolded protein response |
| RVO | Retinal vein occlusion |
| GNAI1 | Guanine Nucleotide-Binding Protein G(i) Subunit Alpha-1 |
| GPCRs | G-protein-coupled receptors |
| ATP5F1D | delta subunit of mitochondrial ATP synthase (Complex V) |
| OIR | Oxygen-induced retinopathy |
| BLVRB | Biliverdin Reductase B |
References
- Arjamaa, O. and M. Nikinmaa, Oxygen-dependent diseases in the retina: role of hypoxia-inducible factors. Experimental eye research, 2006. 83(3): p. 473–483. [CrossRef]
- Reichenbach, A. and A. Bringmann, Glia of the human retina. Glia, 2020. 68(4): p. 768–796. [CrossRef]
- Lupien, C., et al., Expression of glial fibrillary acidic protein in primary cultures of human Muller cells. Exp Eye Res, 2004. 79(3): p. 423–9. [CrossRef]
- Hippert, C., et al., RNAi-mediated suppression of vimentin or glial fibrillary acidic protein prevents the establishment of Muller glial cell hypertrophy in progressive retinal degeneration. Glia, 2021. 69(9): p. 2272–2290. [CrossRef]
- Yang, X.M., et al., Hypoxia-induced upregulation of pigment epithelium-derived factor by retinal glial (Muller) cells. J Neurosci Res, 2012. 90(1): p. 257–66.
- Huang, S., et al., Small extracellular vesicles of organoid-derived human retinal stem cells remodel Muller cell fate via miRNA: A novel remedy for retinal degeneration. J Control Release, 2024. 370: p. 405–420. [CrossRef]
- Goldman, D., Muller glial cell reprogramming and retina regeneration. Nat Rev Neurosci, 2014. 15(7): p. 431–42. [CrossRef]
- Xin, X., et al., Hypoxic retinal Muller cells promote vascular permeability by HIF-1-dependent up-regulation of angiopoietin-like 4. Proc Natl Acad Sci U S A, 2013. 110(36): p. E3425–34. [CrossRef]
- Rickman, C.B. and O. Strauss, The Function of the Retinal Pigment Epithelium. Adler's Physiology of the Eye E-Book, 2024: p. 339.
- Malavade, S., Overview of the ophthalmic system, in Nano-Biomaterials for ophthalmic drug delivery. 2016, Springer. p. 9–36.
- Fisher, C.R. and D.A. Ferrington, Perspective on AMD pathobiology: a bioenergetic crisis in the RPE. Investigative ophthalmology & visual science, 2018. 59(4): p. AMD41–AMD47. [CrossRef]
- Wang, S., et al., The retinal pigment epithelium: functions and roles in ocular diseases. Fundamental Research, 2023. [CrossRef]
- Wang, J., M.M. Barr, and A.M. Wehman, Extracellular vesicles. Genetics, 2024. 227(4): p. iyae088.
- Meldolesi, J., Exosomes and ectosomes in intercellular communication. Current Biology, 2018. 28(8): p. R435–R444. [CrossRef]
- Aheget, H., et al., Exosomes: their role in pathogenesis, diagnosis and treatment of diseases. Cancers, 2020. 13(1): p. 84.
- Habib, S., et al., Extracellular Vesicles and Diabetic Retinopathy: Nano-Sized Vesicles with Mega-Sized Hopes, in Diabetic Retinopathy - Advancement in Understanding the Pathophysiology and Management Strategies, M.I.I. Nawaz, Editor. 2024, IntechOpen: Rijeka. [CrossRef]
- Elmasry, K., et al., Possible Role of Endothelial-Derived Cellular and Exosomal-miRNAs in Lipid-Mediated Diabetic Retinopathy: Microarray Studies. Cells, 2024. 13(22). [CrossRef]
- Narayanan, R., C.C. Huang, and S. Ravindran, Hijacking the Cellular Mail: Exosome Mediated Differentiation of Mesenchymal Stem Cells. Stem Cells Int, 2016. 2016: p. 3808674. [CrossRef]
- Wong-Riley, M., Energy metabolism of the visual system. Eye and brain, 2010: p. 99–116. [CrossRef]
- Liu, H. and V. Prokosch, Energy metabolism in the inner retina in health and glaucoma. International journal of molecular sciences, 2021. 22(7): p. 3689. [CrossRef]
- Karti, O., I. Saatci, and A.O. Saatci, Vascular supply of the eye: clinical anatomy. Medical Hypothesis, Discovery and Innovation in Ophthalmology, 2025. 13(4): p. 176. [CrossRef]
- Kur, J., E.A. Newman, and T. Chan-Ling, Cellular and physiological mechanisms underlying blood flow regulation in the retina and choroid in health and disease. Progress in retinal and eye research, 2012. 31(5): p. 377–406. [CrossRef]
- Hurley, J.B., et al., Energy metabolism in the vertebrate retina. Vertebrate Photoreceptors: Functional Molecular Bases, 2014: p. 91–137.
- Gnanasambandam, B., et al., Addressing retinal hypoxia: pathophysiology, therapeutic innovations, and future prospects. Therapeutic Advances in Ophthalmology, 2024. 16: p. 25158414241280187. [CrossRef]
- Yang, S., J. Zhou, and D. Li, Functions and diseases of the retinal pigment epithelium. Frontiers in pharmacology, 2021. 12: p. 727870. [CrossRef]
- Reichenbach, A., et al., Müller cells in the healthy retina. 2010: Springer.
- Medina-Arellano, A.E., et al., Müller cells and retinal angiogenesis: critical regulators in health and disease. Frontiers in Cellular Neuroscience, 2024. 18: p. 1513686. [CrossRef]
- Martins, B., et al., Contribution of extracellular vesicles for the pathogenesis of retinal diseases: Shedding light on blood-retinal barrier dysfunction. Journal of Biomedical Science, 2024. 31(1): p. 48. [CrossRef]
- Wang, L. and X. Wei, Exosome-based crosstalk in glaucoma pathogenesis: a focus on oxidative stress and neuroinflammation. Frontiers in Immunology, 2023. 14: p. 1202704. [CrossRef]
- Ren, J., et al., Diabetic retinopathy: Involved cells, biomarkers, and treatments. Frontiers in Pharmacology, 2022. 13: p. 953691. [CrossRef]
- Martins, B., et al., Extracellular vesicles and MicroRNA: putative role in diagnosis and treatment of diabetic retinopathy. Antioxidants, 2020. 9(8): p. 705. [CrossRef]
- Atienzar-Aroca, S., et al., Oxidative stress in retinal pigment epithelium cells increases exosome secretion and promotes angiogenesis in endothelial cells. Journal of cellular and molecular medicine, 2016. 20(8): p. 1457–1466. [CrossRef]
- Coorey, N.J., et al., The role of glia in retinal vascular disease. Clinical and Experimental Optometry, 2012. 95(3): p. 266–281. [CrossRef]
- Choi, Y.K., Detrimental roles of hypoxia-inducible factor-1α in severe hypoxic brain diseases. International Journal of Molecular Sciences, 2024. 25(8): p. 4465. [CrossRef]
- Bringmann, A., et al., GABA and glutamate uptake and metabolism in retinal glial (Müller) cells. Frontiers in endocrinology, 2013. 4: p. 48. [CrossRef]
- Winkler, B.S., et al., Energy metabolism in human retinal Muller cells. Investigative ophthalmology & visual science, 2000. 41(10): p. 3183–3190.
- Garus, A. and C. Autexier, Dyskerin: an essential pseudouridine synthase with multifaceted roles in ribosome biogenesis, splicing, and telomere maintenance. Rna, 2021. 27(12): p. 1441–1458. [CrossRef]
- Liao, P., et al., Telomeres: dysfunction, maintenance, aging and cancer. Aging and Disease, 2023. 15(6): p. 2595.
- Rossiello, F., et al., Telomere dysfunction in ageing and age-related diseases. Nature cell biology, 2022. 24(2): p. 135–147. [CrossRef]
- Wouters, B.G., et al. Control of the hypoxic response through regulation of mRNA translation. in Seminars in cell & developmental biology. 2005. Elsevier. [CrossRef]
- Feng, Q., et al., The role of RNA modification in hepatocellular carcinoma. Frontiers in pharmacology, 2022. 13: p. 984453. [CrossRef]
- Lykke-Andersen, S. and T.H. Jensen, Nonsense-mediated mRNA decay: an intricate machinery that shapes transcriptomes. Nature reviews Molecular cell biology, 2015. 16(11): p. 665–677. [CrossRef]
- Zuo, Z., et al., The Role of Non-coding RNAs in Diabetic Retinopathy: Mechanistic Insights and Therapeutic Potential. Molecular Neurobiology, 2025: p. 1–32.
- Harel, S., et al., ETS1, ELK1, and ETV4 transcription factors regulate angiopoietin-1 signaling and the angiogenic response in endothelial cells. Frontiers in Physiology, 2021. 12: p. 683651. [CrossRef]
- Tang, J.X., et al., Mitochondrial OXPHOS biogenesis: co-regulation of protein synthesis, import, and assembly pathways. International Journal of Molecular Sciences, 2020. 21(11): p. 3820. [CrossRef]
- Zhang, S.X., et al., The unfolded protein response in retinal vascular diseases: implications and therapeutic potential beyond protein folding. Progress in Retinal and eye Research, 2015. 45: p. 111–131. [CrossRef]
- Swingle, M.R. and R.E. Honkanen, Inhibitors of serine/threonine protein phosphatases: biochemical and structural studies provide insight for further development. Current medicinal chemistry, 2019. 26(15): p. 2634–2660. [CrossRef]
- Van Hoof, C. and J. Goris, Phosphatases in apoptosis: to be or not to be, PP2A is in the heart of the question. Biochimica et Biophysica Acta (BBA)-Molecular Cell Research, 2003. 1640(2-3): p. 97–104.
- Antony, R., W.J. Lukiw, and N.G. Bazan, Neuroprotectin D1 induces dephosphorylation of Bcl-xL in a PP2A-dependent manner during oxidative stress and promotes retinal pigment epithelial cell survival. Journal of Biological Chemistry, 2010. 285(24): p. 18301–18308. [CrossRef]
- Barisic, S., et al., Identification of PP2A as a crucial regulator of the NF-κB feedback loop: its inhibition by UVB turns NF-κB into a pro-apoptotic factor. Cell Death & Differentiation, 2008. 15(11): p. 1681–1690. [CrossRef]
- Chen, Y., et al., Regulations of retinal inflammation: focusing on Müller glia. Frontiers in cell and developmental biology, 2022. 10: p. 898652. [CrossRef]
- O’Leary, F. and M. Campbell, The blood–retina barrier in health and disease. The FEBS Journal, 2023. 290(4): p. 878–891. [CrossRef]
- Kaur, C., W. Foulds, and E. Ling, Blood–retinal barrier in hypoxic ischaemic conditions: basic concepts, clinical features and management. Progress in retinal and eye research, 2008. 27(6): p. 622–647.
- Haydinger, C.D., T. Kittipassorn, and D.J. Peet, Power to see—Drivers of aerobic glycolysis in the mammalian retina: A review. Clinical & Experimental Ophthalmology, 2020. 48(8): p. 1057–1071. [CrossRef]
- Gabrielle, P.H., Lipid metabolism and retinal diseases. 2022, Wiley Online Library. [CrossRef]
- Wang, Y. and S. Hekimi, Understanding ubiquinone. Trends in cell biology, 2016. 26(5): p. 367–378. [CrossRef]
- Cui, X.A., H. Zhang, and A.F. Palazzo, p180 promotes the ribosome-independent localization of a subset of mRNA to the endoplasmic reticulum. PLoS biology, 2012. 10(5): p. e1001336. [CrossRef]
- Bartoszewska, S. and J.F. Collawn, Unfolded protein response (UPR) integrated signaling networks determine cell fate during hypoxia. Cellular & molecular biology letters, 2020. 25(1): p. 18. [CrossRef]
- McLaughlin, T., et al., Cellular stress signaling and the unfolded protein response in retinal degeneration: mechanisms and therapeutic implications. Molecular Neurodegeneration, 2022. 17(1): p. 25. [CrossRef]
- Parri, M. and P. Chiarugi, Rac and Rho GTPases in cancer cell motility control. Cell communication and signaling, 2010. 8: p. 1–14. [CrossRef]
- Zhang, P., et al., Rac1 activates HIF-1 in retinal pigment epithelium cells under hypoxia. Graefe's Archive for Clinical and Experimental Ophthalmology, 2009. 247: p. 633–639. [CrossRef]
- Sahajpal, N., A. Kowluru, and R.A. Kowluru, The regulatory role of Rac1, a small molecular weight GTPase, in the development of diabetic retinopathy. Journal of clinical medicine, 2019. 8(7): p. 965.
- Ramshekar, A., H. Wang, and M.E. Hartnett, Regulation of Rac1 activation in choroidal endothelial cells: insights into mechanisms in age-related macular degeneration. Cells, 2021. 10(9): p. 2414. [CrossRef]
- Kowluru, R.A., et al., TIAM1–RAC1 signalling axis-mediated activation of NADPH oxidase-2 initiates mitochondrial damage in the development of diabetic retinopathy. Diabetologia, 2014. 57: p. 1047–1056. [CrossRef]
- Wilkinson-Berka, J.L., et al., Reactive oxygen species, Nox and angiotensin II in angiogenesis: implications for retinopathy. Clinical science, 2013. 124(10): p. 597–615. [CrossRef]
- Lenin, R., S.M. Thomas, and R. Gangaraju, Endothelial activation and oxidative stress in neurovascular defects of the retina. Current pharmaceutical design, 2018. 24(40): p. 4742–4754. [CrossRef]
- Nomura-Komoike, K., F. Saitoh, and H. Fujieda, Phosphatidylserine recognition and Rac1 activation are required for Müller glia proliferation, gliosis and phagocytosis after retinal injury. Scientific reports, 2020. 10(1): p. 1488.
- Zhang, P., et al., Rac1 activates HIF-1 in retinal pigment epithelium cells under hypoxia. Graefes Arch Clin Exp Ophthalmol, 2009. 247(5): p. 633–9. [CrossRef]
- Li, Z.-W., et al., GNAI1 and GNAI3 reduce colitis-associated tumorigenesis in mice by blocking IL6 signaling and down-regulating expression of GNAI2. Gastroenterology, 2019. 156(8): p. 2297–2312. [CrossRef]
- Muir, A.M., et al., Variants in GNAI1 cause a syndrome associated with variable features including developmental delay, seizures, and hypotonia. Genetics in Medicine, 2021. 23(5): p. 881–887. [CrossRef]
- Bonkowski, E., E. Fathi, and H.C. Mefford, GNAI1-Related Neurodevelopmental Disorder. GeneReviews®[Internet], 2024.
- Wu, Y., et al., Exosomal miR-320d promotes angiogenesis and colorectal cancer metastasis via targeting GNAI1 to affect the JAK2/STAT3 signaling pathway. Cell Death & Disease, 2024. 15(12): p. 913.
- Oláhová, M., et al., Biallelic mutations in ATP5F1D, which encodes a subunit of ATP synthase, cause a metabolic disorder. The American Journal of Human Genetics, 2018. 102(3): p. 494–504. [CrossRef]
- Ferrington, D.A., C.R. Fisher, and R.A. Kowluru, Mitochondrial defects drive degenerative retinal diseases. Trends in molecular medicine, 2020. 26(1): p. 105–118. [CrossRef]
- Solaini, G., et al., Hypoxia and mitochondrial oxidative metabolism. Biochimica et Biophysica Acta (BBA)-Bioenergetics, 2010. 1797(6-7): p. 1171–1177.
- Chen, Y., et al., Metabolism dysregulation in retinal diseases and related therapies. Antioxidants, 2022. 11(5): p. 942. [CrossRef]
- O’Brien, L., et al., Biliverdin reductase isozymes in metabolism. Trends in Endocrinology & Metabolism, 2015. 26(4): p. 212–220. [CrossRef]
Figure 1.
Characterization of RPE EVs. It shows the normoxia RPE EVs’ sizes after 24h, 48h, and 72h, were represented using the Zetaveiw nanoparticle tracking, respectively (A, B, C), and shape and immunogold labelling of isolated EVs using EM imaging (i &ii). Similarly, the hypoxia RPE EVs, the sizes after 24h, 48h, and 72h, were represented in (D, E, F) and their shape and immunogold labelling (iii &iv).
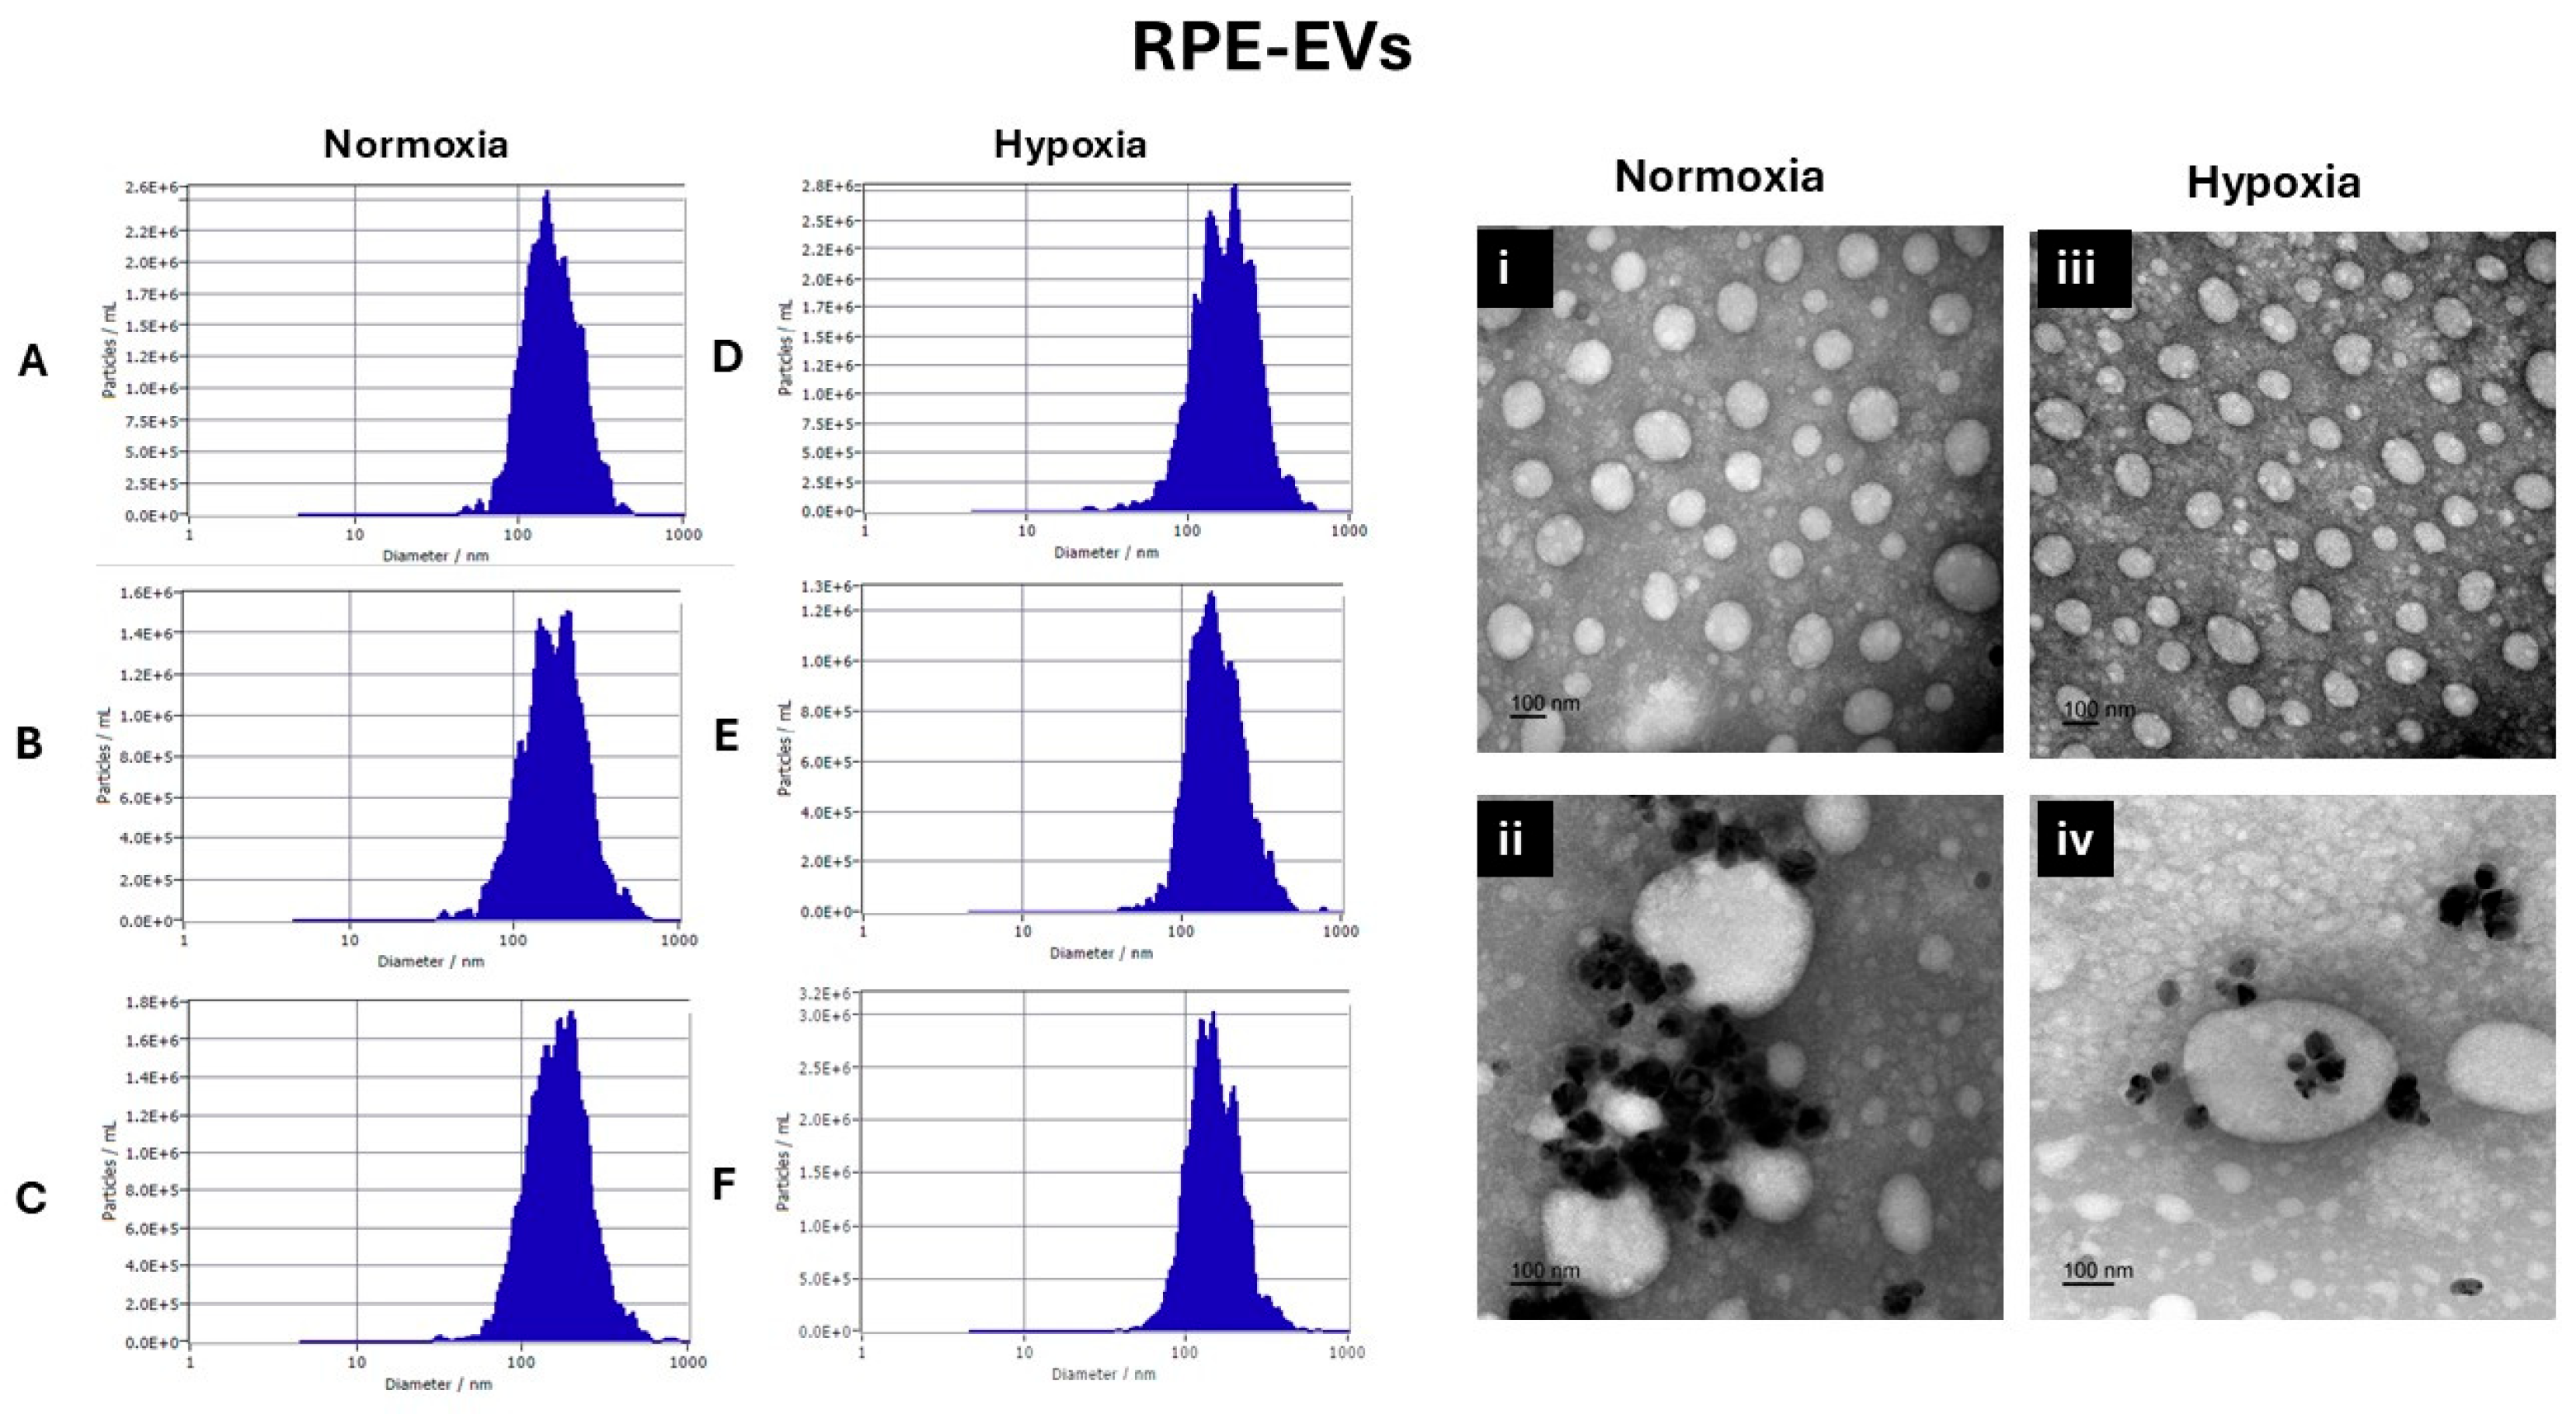
Figure 2.
Characterization of RMC EVs. It shows the normoxia RMC EVs’ sizes after 24h, 48h, and 72h, were represented using the Zetaveiw nanoparticle tracking, respectively (A, B, C), and shape and immunogold labelling of isolated EVs using EM imaging (i &ii). Similarly, the hypoxia RPE EVs, the sizes after 24h, 48h, and 72h, were represented in (D, E, F) and their shape and immunogold labelling in (iii &iv).
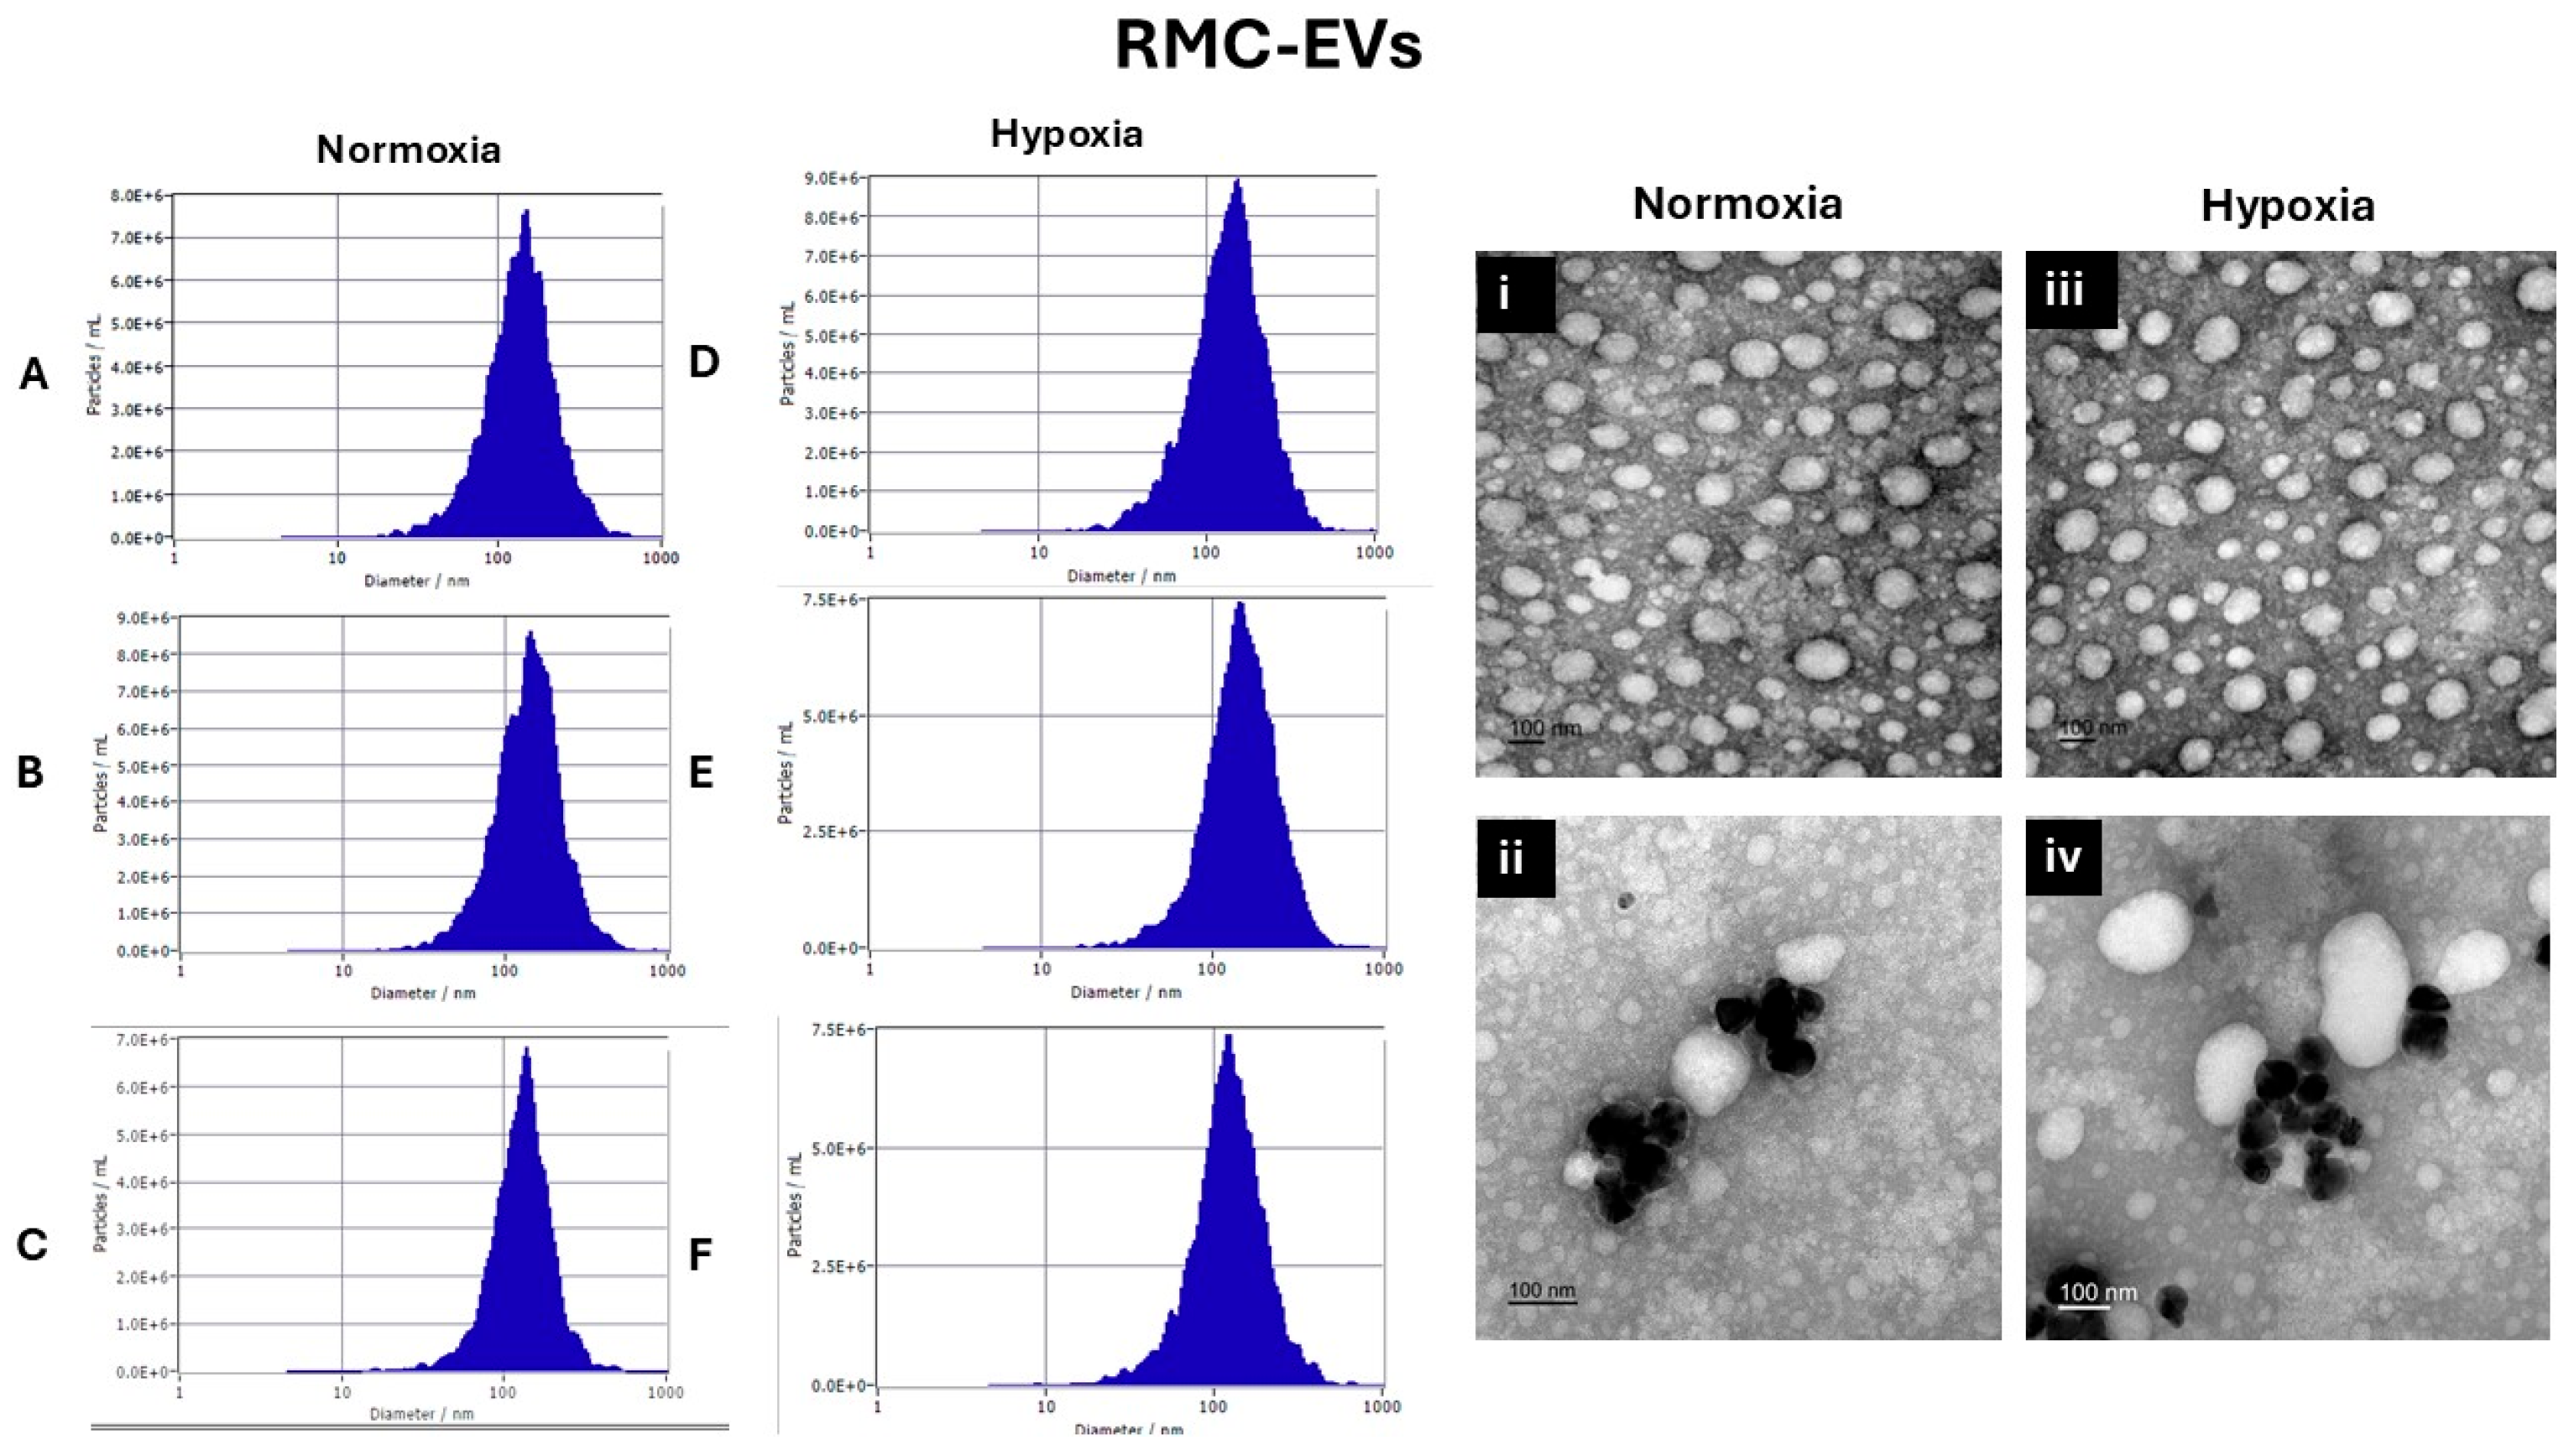
Figure 3.
Time-Dependent GFAP Upregulation in RMCs Treated with Hypoxic and Normoxic RPE EVs. This reactivity after 24 and 72h was less noted in the RMCs control group. GFAP immune-expression after 24h of incubation was significantly higher in the RPE EVs treated groups- either normoxic or hypoxic- than the control group. Meanwhile, there was a non-significant difference among the EV-treated groups. After 72h of RMCs and RPE EVs co-culturing, GFAP also showed a marked rise in RPE EVs treated groups, but it was more significant in RMCs treated with 72h hypoxic RPE EVs. GFAP expression was also significantly higher in RMCs treated with 72h hypoxic RPE EVs when compared to both RMC groups treated with either 24h or 72h normoxic RPE EVs.
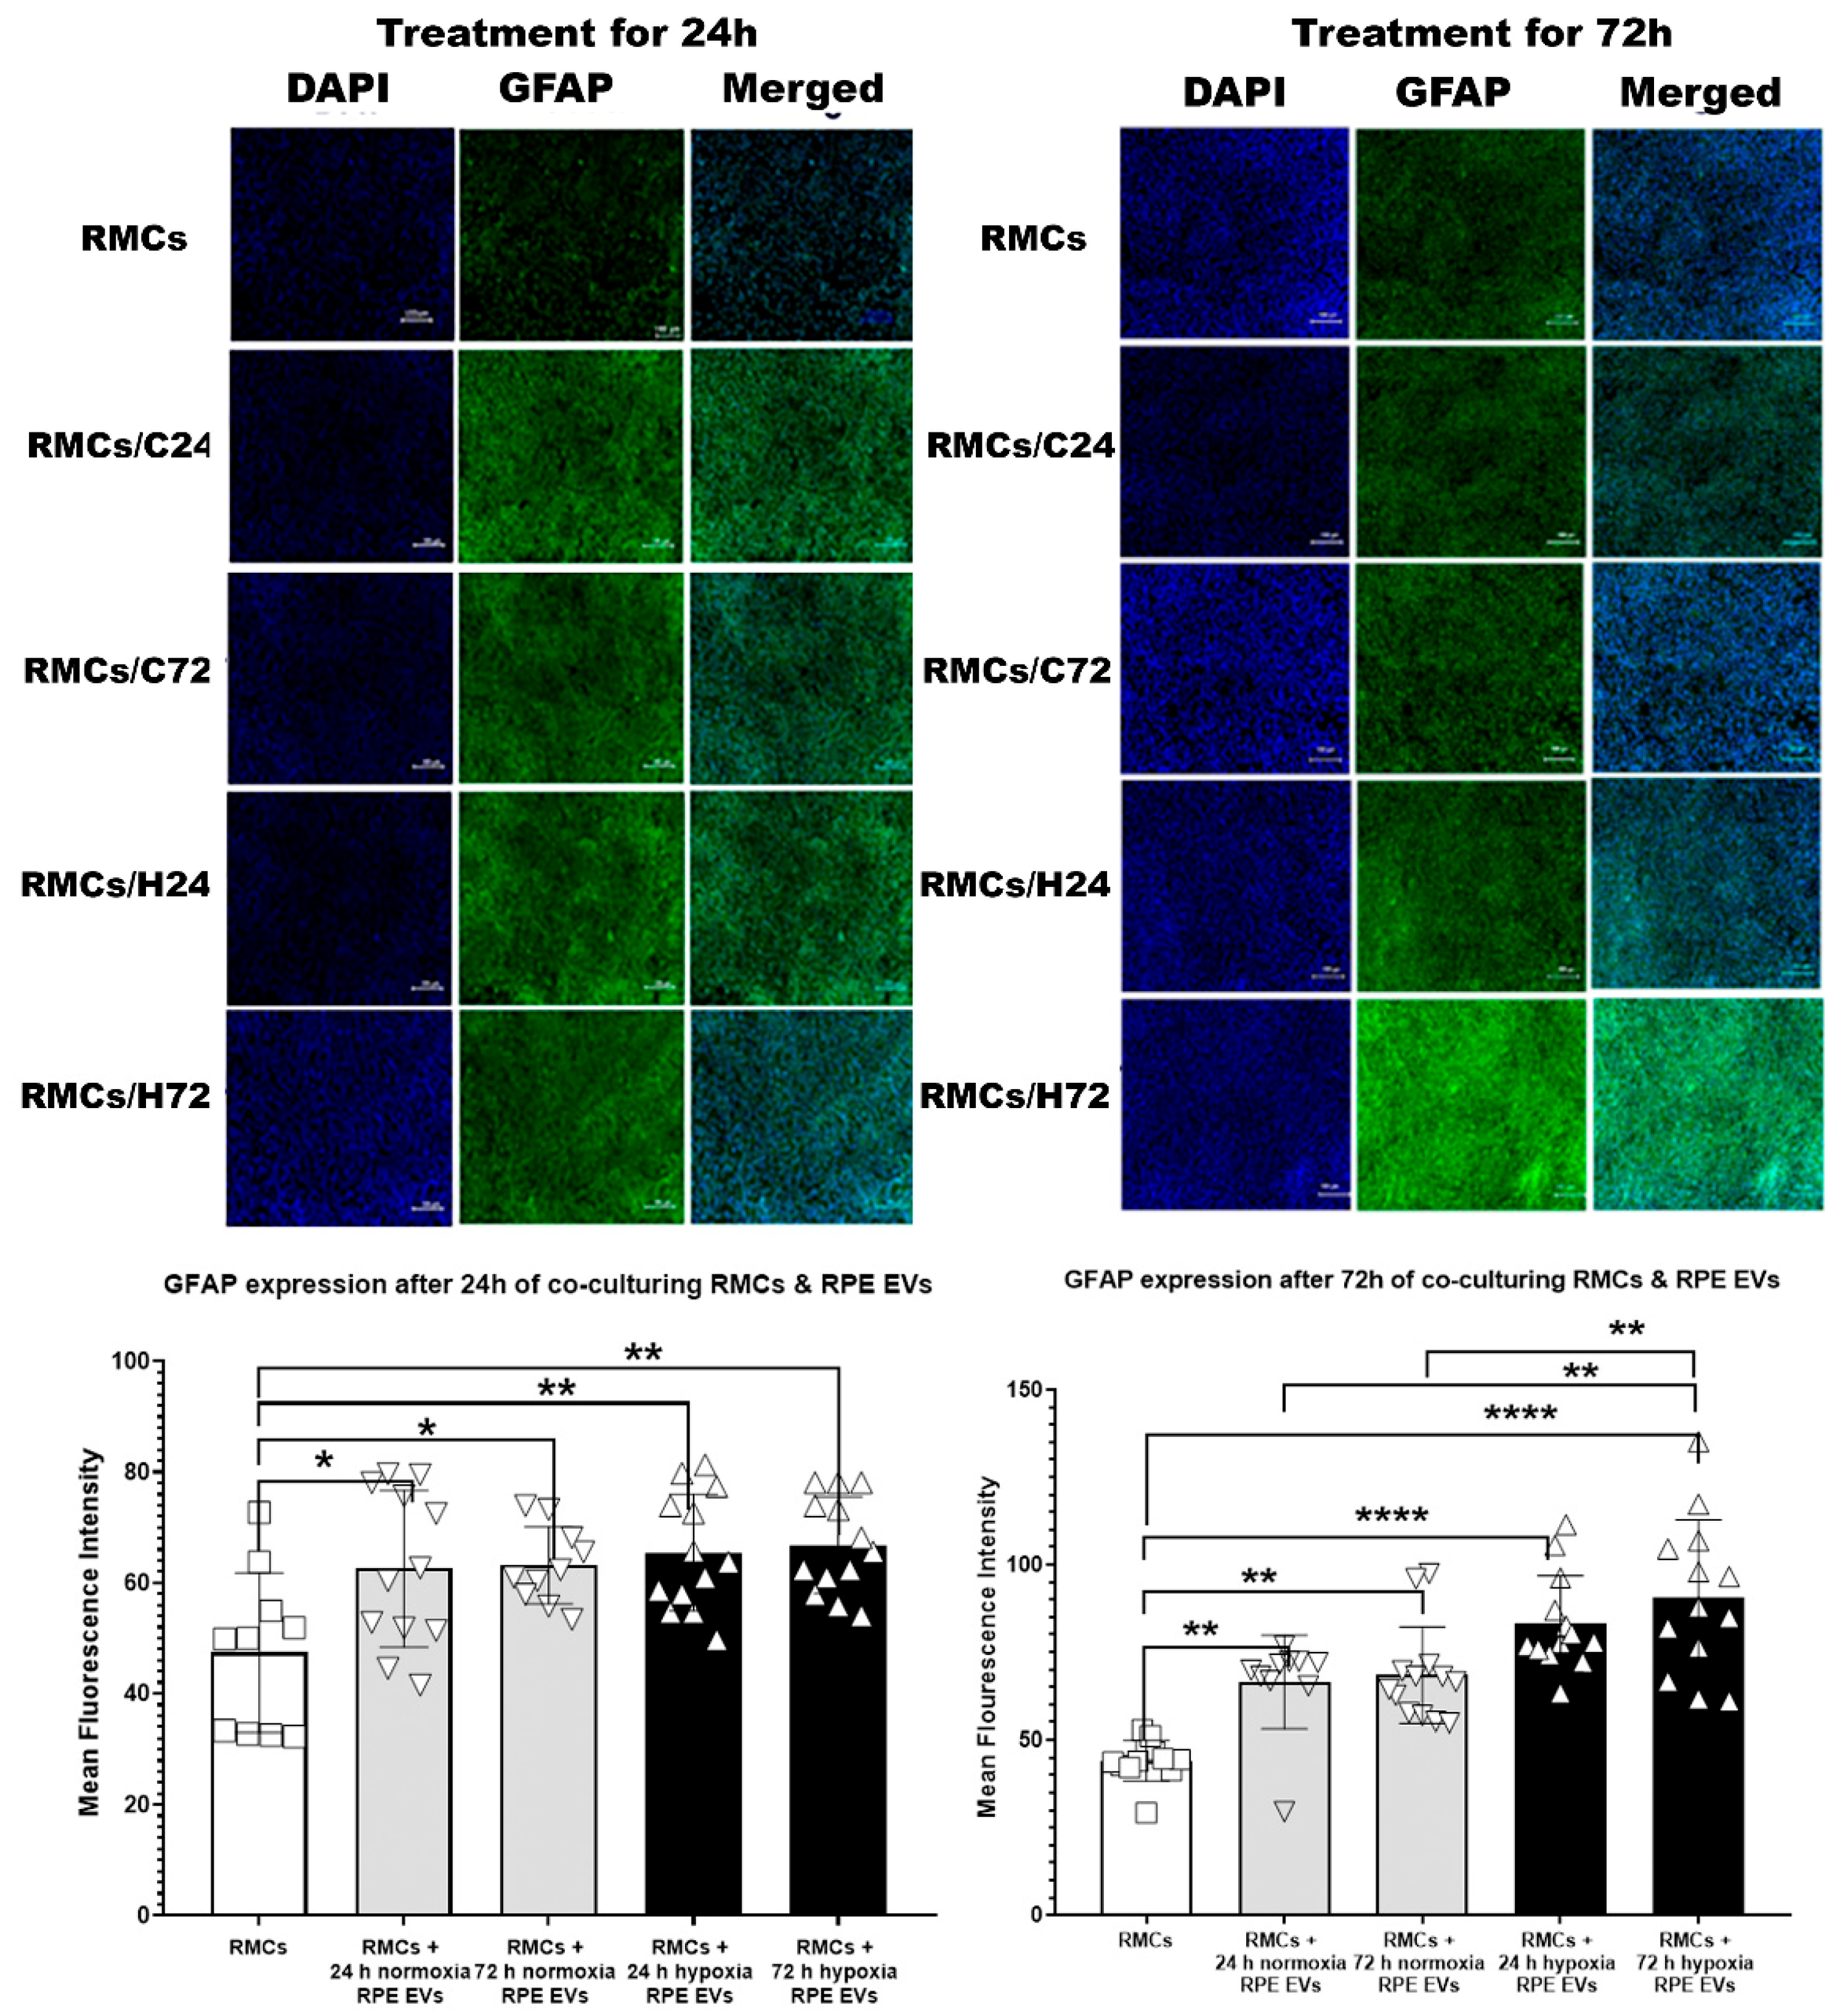
Figure 4.
Proteomic Profiling Reveals Temporal Pathway Modulation in RMCs by Hypoxia-Induced RPE-EVs. (a) Hierarchical clustering heatmap of the proteomic expression of the RMCs studied groups. (b) Volcano map of a distinguishable mRNA expression profiling in RMCs treated with hypoxic RPE EVs for 24h. (c) Volcano map of a distinguishable mRNA expression profiling in RMCs treated with hypoxic RPE EVs for 72h. (d) List of the top 20 enriched pathways in RMCs treated with hypoxic RPE EVs for 24h. (e) List of the top 30 enriched pathways in RMCs treated with hypoxic RPE EVs for 72h. The top basic functions were categorized into the following classes: Molecular function (MF) (Red), Cellular component (CC) (Green), Biological process (BP) (Blue), and Kyoto Encyclopedia of Genes and Genomes (KEGG)(Yellow).
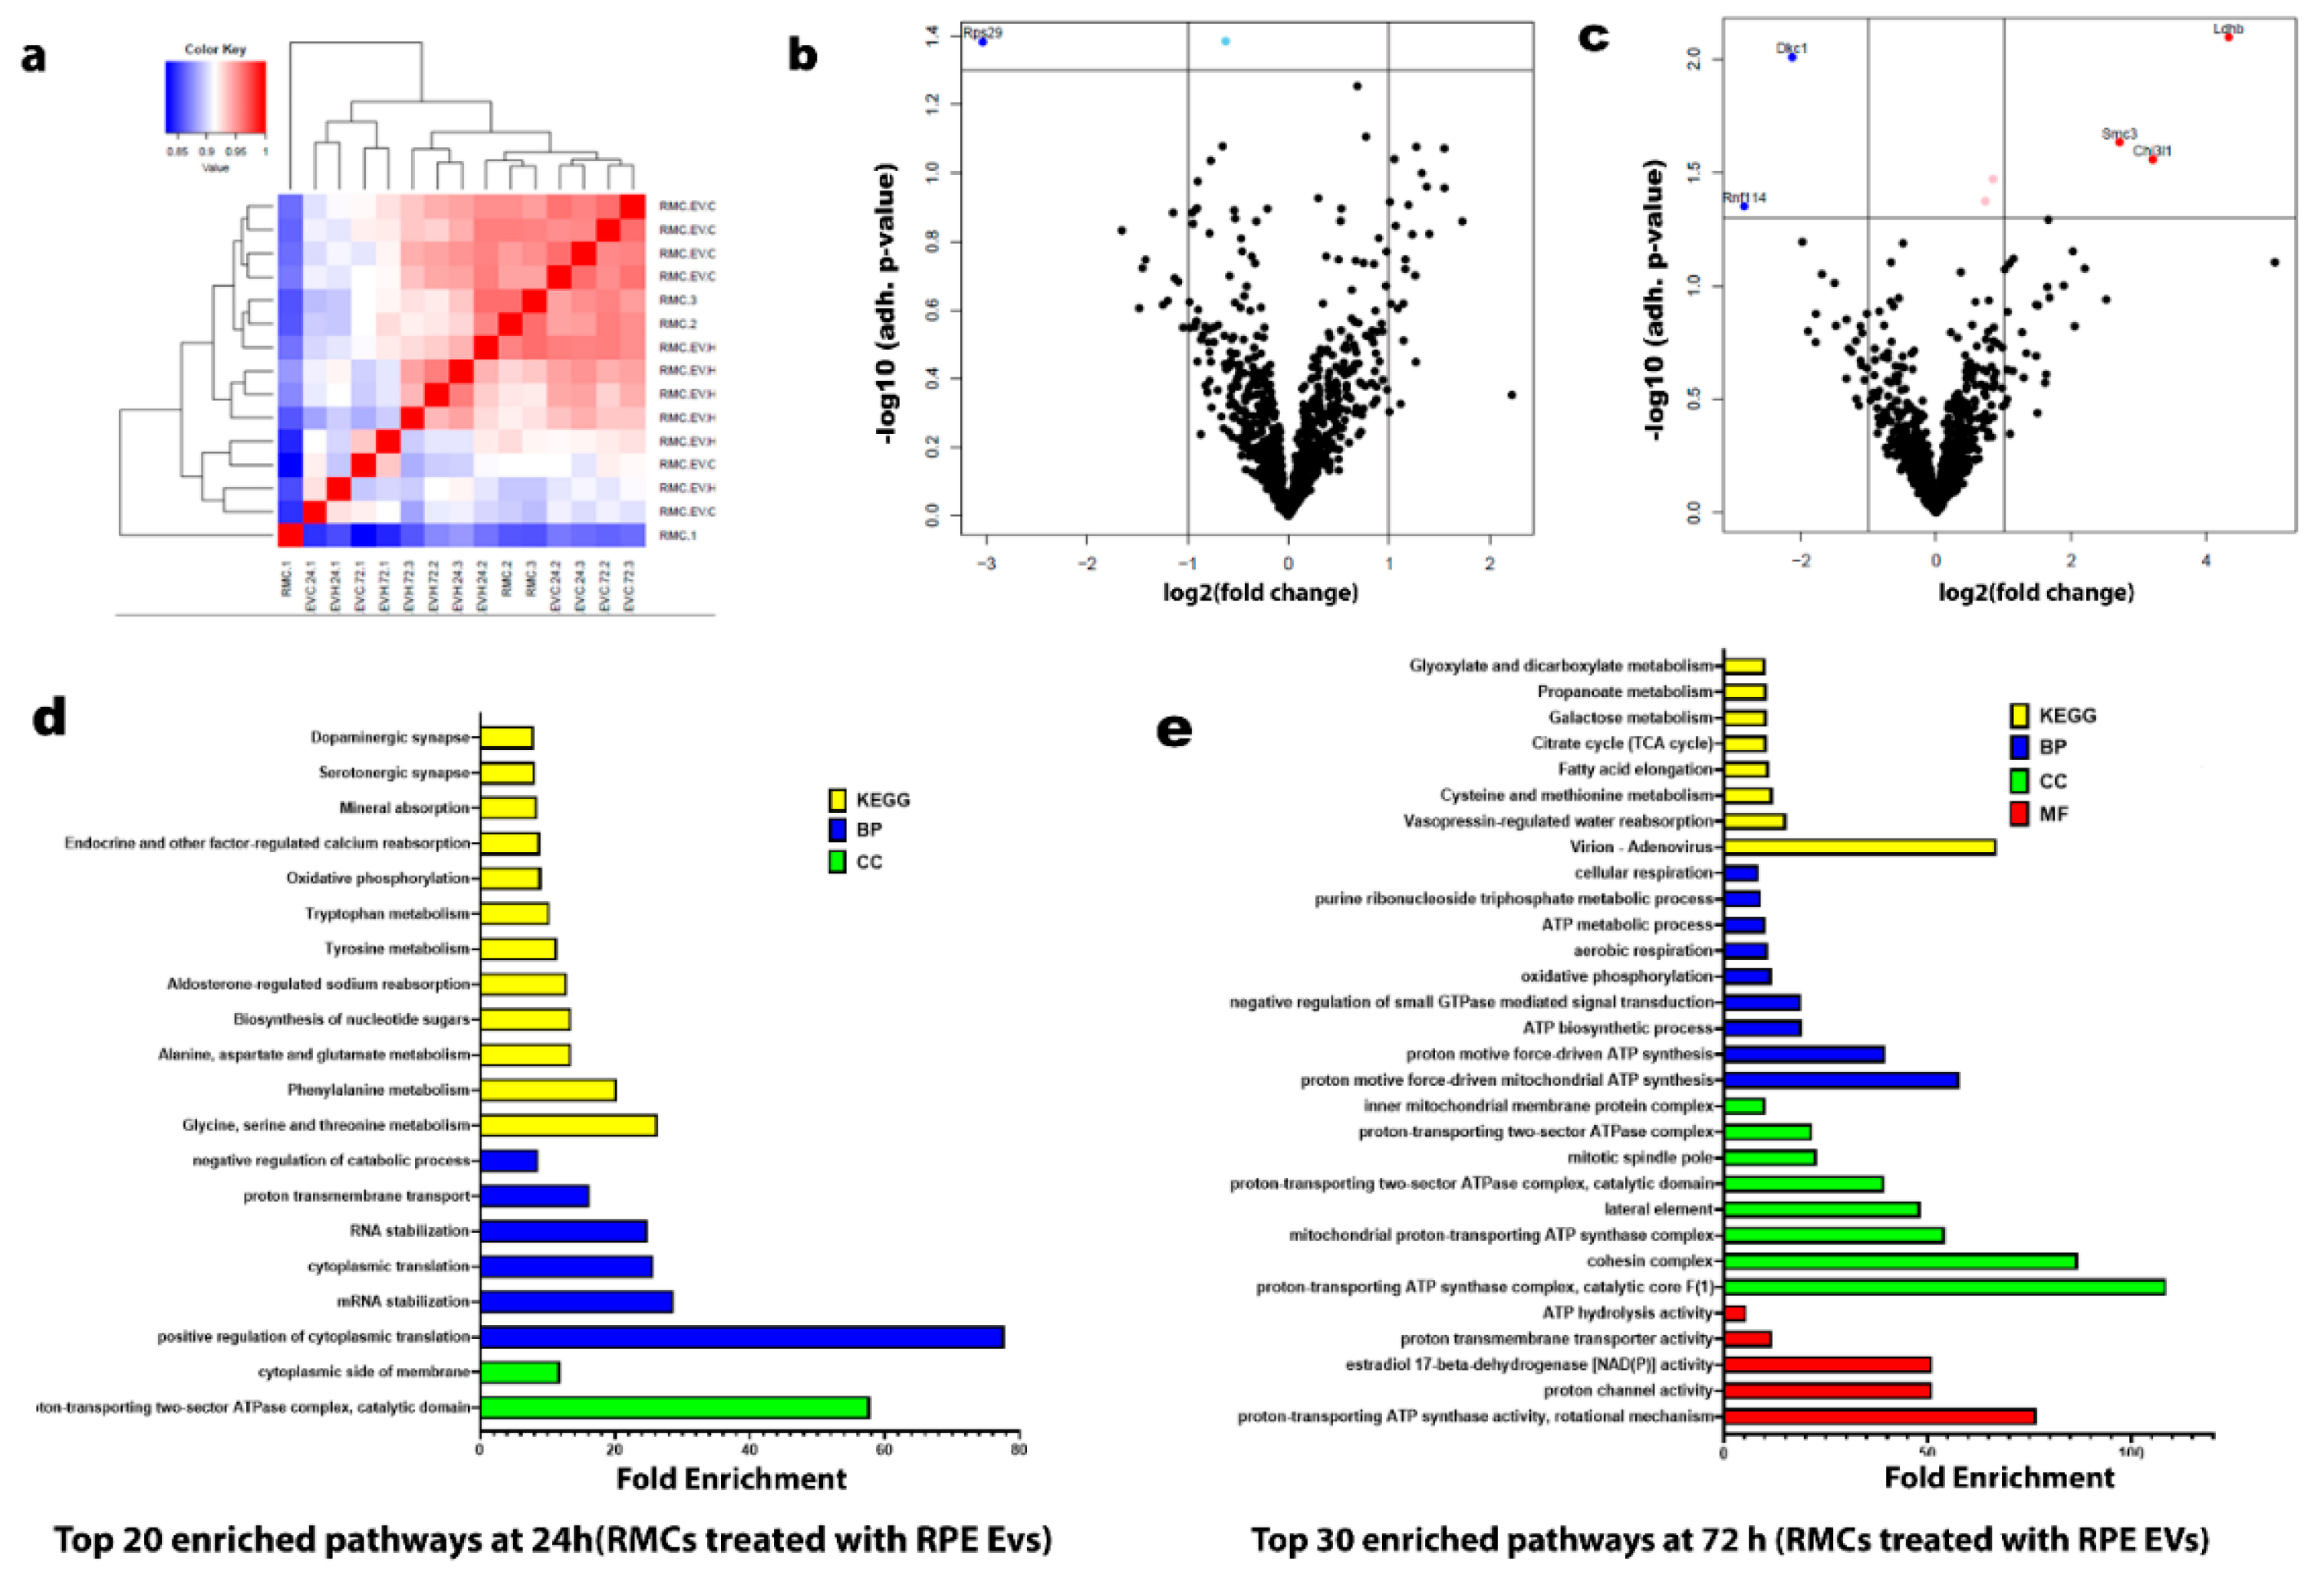
Figure 5.
Effect of normoxic and hypoxic RMC-EVs on RPE barrier function. ECIS analysis demonstrated a marked decrease in TER of RPE treated with hypoxia RMC EVs compared over time (yellow lines) to those treated with normoxia RMC-EVs (blue lines). Data points represent the mean of 4–6 wells at the same time points.
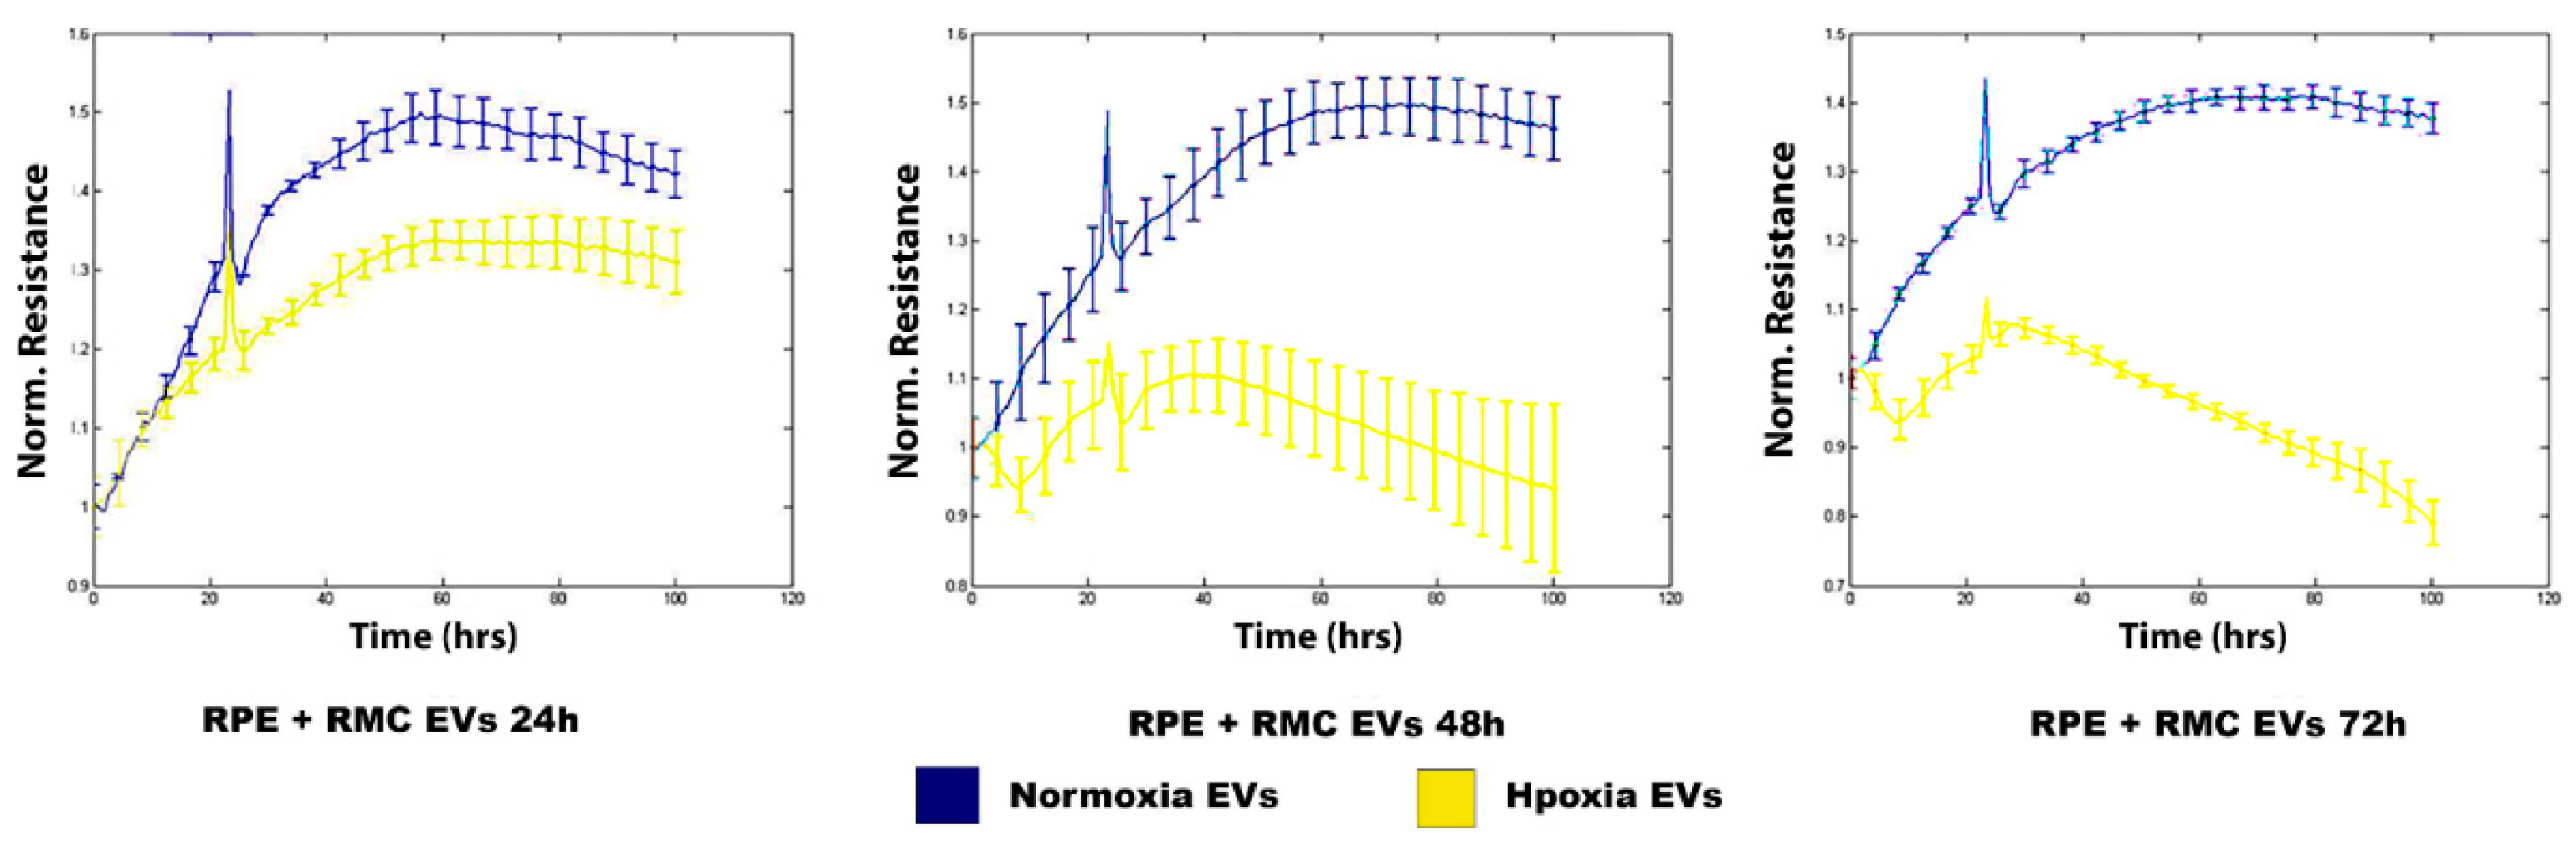
Figure 6.
Proteomic profiles of RPE. (a) Hierarchical clustering heatmap of the proteomic expression of the RPEs studied groups. (b) Volcano map of a distinguishable mRNA expression profiling in RPEs treated with hypoxic RMC EVs for 24h. (c) Volcano map of a distinguishable mRNA expression profiling in RPEs treated with hypoxic RMC EVs for 72h. (d) List of the top 30 enriched pathways in RPEs treated with hypoxic RMC EVs for 24h. (e) List of the top 30 enriched pathways in RPEs treated with hypoxic RMC EVs for 72h. The top basic functions were categorized into the following classes: Molecular function (MF) (Red), Cellular component (CC) (Green), Biological process (BP) (Blue), and and Kyoto Encyclopedia of Genes and Genomes (KEGG)(Yellow).
Disclaimer/Publisher’s Note: The statements, opinions and data contained in all publications are solely those of the individual author(s) and contributor(s) and not of MDPI and/or the editor(s). MDPI and/or the editor(s) disclaim responsibility for any injury to people or property resulting from any ideas, methods, instructions or products referred to in the content. |
© 2025 by the authors. Licensee MDPI, Basel, Switzerland. This article is an open access article distributed under the terms and conditions of the Creative Commons Attribution (CC BY) license (http://creativecommons.org/licenses/by/4.0/).
Copyright: This open access article is published under a Creative Commons CC BY 4.0 license, which permit the free download, distribution, and reuse, provided that the author and preprint are cited in any reuse.


