
Submitted:
09 June 2025
Posted:
09 June 2025
You are already at the latest version
Abstract
The retina, a light-sensitive tissue of the central nervous system located at the poste-rior part of the eye, is particularly vulnerable to alterations in oxygen levels. In various retinal diseases, such as central retinal vein occlusion, glaucoma, and diabetic reti-nopathy, hypoxia (a condition of low oxygen levels) is commonly observed. Müller glia, the principal glial cells in the retina, play a crucial role in supporting the metabolic needs of retinal neurons. They are also responsible for sensing oxygen levels and, in response to hypoxia, express Hypoxia-Inducible Factor 1 (HIF-1), a transcription factor that activates signalling pathways related to hypoxia.
In this study, primary rat Müller glial cells were cultured and exposed to a 1% oxygen for 72 hours. Following this, immunohistochemical assays were conducted to assess the effects of hypoxia on various parameters, including HIF-1α expression, cell surviv-al, Müller cell-specific markers (CRALBP and GS), gliosis (GFAP expression), apoptosis (caspase-3 expression), cell proliferation (Ki-67 expression), and metabolic stress (in-dicated by the number of mitochondria per cell).
Under hypoxic conditions, a decrease in Müller glial survival and proliferation was observed. Conversely, there was an increase in HIF-1α expression, GFAP expression, caspase-3-positive cells, and the number of mitochondria per cell. However, no signif-icant changes were noted in the expression of the Müller glial markers GS and CRALBP.
In conclusion, hypoxia resulted in reduced proliferation and survival of Müller glial cells, primarily due to increased apoptosis and heightened metabolic stress.
Keywords:
Müller glia
; hypoxia
; retina
; metabolic stress
1. Introduction
Müller glia (MG) is the predominant non-neuronal cell type in the vertebrate retina and account for up to 90% of retinal glia. These cell bodies exhibit a distinctive radial morphology, extending across the entire thickness of the retina—from the inner to the outer layer—which enables them to interact with all retinal neurons and cell types [1,2]. Due to the close contact with all the cells of this tissue, apart from providing structural stability, MG are involved in a multitude of retinal essential activities, constitute a common link between all retinal cell types and establish metabolic associations with them, in addition to maintaining homeostasis or guiding light to the photoreceptors [2,3]. It is due to this tight junction that MG are able to transport most of the nutrients, waste products, ions, water, oxygen and other molecules to the retinal blood vessels and neurons [2].
MG have multiple functions, one of the main functions of MG is to maintain the blood-retinal barrier, the integrity of which is necessary for proper retinal function. Normally, MG enhance the barrier function of vascular endothelia by secreting many different factors [1,2]. Furthermore, it has been observed that MG may act as a communication system for metabolic exchange between blood vessels and neurons [2]. Beyond their structural role, MG are crucial for neuroprotection and the regulation of synaptic activity. Their neuroprotective functions encompass a variety of mechanisms, including the uptake of excess glutamate, which is neurotoxic to retinal ganglion cells (RGCs). Additionally, MG are involved in maintaining and recycling neurotransmitters essential for nerve signalling and supplying neurotransmitter precursors. They also play a key role in regulating glucose and glycogen metabolism by providing neurons with vital nutrients such as lactate and pyruvate. [2,3]. Neurotrophic factors released by MG are involved in the regulation of retinal neuronal circuits and in the protection of RGCs. Likewise, many neuroprotective factors have been identified that increase the survival of both photoreceptors and RGCs [2,4,5,6].
The retina has metabolic peculiarities related to its activity. Glucose from internal cellular glycogen stores or lactate is the primary metabolite used by retinal cells to produce energy, both under aerobic and anaerobic conditions. The glial cells and neurons carry out complex metabolic relationships that adjust their metabolic activity to their needs. For example, MG are able to resist early stages of hypoxia and low glucose environments by activating glycolysis anaerobic glycolysis and oxidating alternative substrates, such as lactate, glutamate or glutamine, to obtain energy in the form of ATP [2,7].
The retina has one of the highest oxygen consumption rate per tissue volume compared to other organs [8]. Its high energy demand is since it is a highly sensitive and efficient system that converts light energy into neural signals, which is why the retina consumes oxygen more rapidly than other tissues [9,10]. In times of increased energy demand, oxygen becomes one of the most limited metabolites in this tissue. For this reason, the retina is susceptible to alterations in oxygen levels, making it susceptible to hypoxia, that’s it, a lack of oxygen to an organism, tissue or cell [11].
These conditions may derive from cardiovascular effects of chronic obstructive airway disease, ocular ischemic syndrome associated with arterial obstructive conditions such as carotid artery stenosis, hyperviscosity syndromes or trauma [12]. These pathologies that cause oxygen deprivation in the retina can lead to several vision-threatening disorders, such as central retinal vein occlusion among other diseases [13]. Similarly, pathologies such as diabetic retinopathy, glaucoma or retinal occlusive vasculitis have also been observed to be affected by hypoxia [12,14]. Furthermore, it has been described that RGCs are particularly sensitive to hypoxic stress and contribute to their degeneration which led to irreversible vision loss [12]. Under hypoxic conditions, it is known that MG can be activated rapidly, remove metabolic waste, and maintain the balance of the extracellular environment of the retina to protect RGCs [15]. This activation occurs through the expression of hypoxia-inducible factor (HIF), which is a transcription factor responsible for the activation of genes that facilitate the adaptation and survival of cells to hypoxia [16].
Given the crucial role MG in the neuroprotection of RGCs, maintaining retinal metabolic homeostasis, and acting as the retina’s primary oxygen sensors, understanding how hypoxia impacts MG is of great interest. An in vitro hypoxia model will help us explore how MG respond and potentially contribute to the progression of retinal diseases. Therefore, in this study, we aim to investigate the effects of hypoxia on MG by examining the impact of low oxygen levels on HIF-1α, MG-specific markers, cell survival, apoptosis, gliosis, proliferation, and metabolic stress in primary MG cultures.
2. Materials and Methods
2-month adult Sprague-Dawley rat eyes (Rattus norvegicus domestica) (n=20) were obtained from animals that were housed under a 12 h light–dark cycle with ad libitum access to food and water and were humanely sacrificed by exposure to CO2. Animal experimentation is adhered to the ARVO Statement for the Use of Animals in Ophthalmic and Vision Research. Moreover, all the experimental protocols are complied with the European (2010/63/UE) and Spanish (RD53/2013) regulations regarding the protection of experimental animals, and they were approved by the Ethics Committee for Animal Welfare at the University of the Basque Country.
2.1. Retina Extraction and Primary Müller Glia Cultures
Rat retinas were enucleated and maintained in CO2-independt medium (Life Technologies, Carlsbad, CA, USA) and the cornea and anterior chamber were separated from the rest of the eye and both, the crystalline and vitreous humor were removed. Next, the retina was isolated from the sclera and cut by the optic nerve. Then, MG were cultured according to the protocols established previously [17]. Briefly, the retina was digested at 37°C for 30 min with papain (20 U/mL: Worthington, Lakewood, NJ, USA) and DNase I (2,000 U/mL: Worthington, Lakewood, NJ, USA) in Sterile Earle‘s Balanced Salt Solution (EBSS). This enzymatic digestion was stopped by adding Dulbecco’s Modified Eagle’s Medium (DMEM: Life Technologies, Carlsbad, CA, USA) containing 10% Fetal Bovine Serum (FBS: Life Technologies, Carlsbad, CA, USA) and the retina was dissociated mechanically. The cell homogenate obtained was centrifuged at 1,200 rpm 5 min to remove debris and the pellet was resuspended in DMEM + 10% FBS. The same cell number were seeded in poly-l-Lysine (100 μg/ml: Sigma-Aldrich, St. Louis, MO, USA) and laminin (10 mg/ml: Sigma-Aldrich, St. Louis, MO, USA) coated 13mm sterile coverslips on a 24 well-plate. The cell cultures were maintained in a humidified incubator at 37°C in an atmosphere of 5% CO2. The medium was changed on day 1 of the culture and half the volume of the medium was replaced every 2 days until the cultures were in a pre-confluent state. When primary MG reached this state, they were changed into hypoxic condition (1% O2, 5% CO2), whereas the control plate was maintained in 21% O2 and 5% CO2 during 72h (Figure 1).
2.2. Immunocytochemical Analysis and Image Capture
The cells were washed three times in Phosphate Buffered Saline (PBS, pH 7.4), fixed in methanol at −20°C for 10 min and washed again three times. Later, non-specific antigen binding was blocked with blocking buffer (0.1% Triton X-100 and 3% Bovine Serum Albumin -BSA- in PBS). The primary antibodies (Table 1) were diluted in blocking buffer and incubated with the cells overnight at 4°C. After washing three times in PBS, cells were incubated for 1 h at room temperature with the corresponding secondary antibodies diluted 1:1,000, Alexa Fluor 488 conjugated goat anti-mouse and Alexa Fluor 555 conjugated goat anti-rabbit antibodies (Invitrogen, Carlsbad, CA, USA); and Alexa Fluor 488 conjugated goat anti-rabbit and Alexa Fluor 555 conjugated goat anti-mouse antibodies (Invitrogen, Carlsbad, CA, USA), as well as DAPI 1:10,000. After a further three washes with PBS, the coverslips were mounted with Fluor-save Reagent (Sigma-Aldrich, St. Louis, MO, USA). Müller cells were analyzed on an epifluorescence microscope (Zeiss, Jena, Germany) coupled to a digital camera (Zeiss Axiocam MRM, Zeiss, Jena, Germany) (Figure 1).
2.3. Quantification and Statistical Analysis
For the cell survival quantification, a mosaic of the entire coverslip was obtained with a 10X objective and once the mosaic was defined, the coverslip surface area was calculated (132.73 mm2). The semi-automatic Zen software (Zeiss) was used to count the total number of nuclei stained with DAPI, taking into consideration the limits of the axis of the nuclei of MG to achieve more accurate measurements. As such, we used a specific macro designed to measure the limits of the axes (10–40 μm), which was corrected manually for each image. Using Image J software (1.48v), Caspase 3, Ki-67 and mitochondria were quantified. Three coverslips were analyzed for each experimental condition and from four independent experiments. Statistical analyses were carried out with IBM SPSS Statistical v.24-0, and the means and standard error of the mean (SEM) for each condition are presented. A Mann-Whitney U test was used to evaluate whether there were significant differences between means. Differences were considered significant for all tests at p-value ≤ 0.05.
3. Results
3.1. Expression of HIF-1α
In order to study how the hypoxia affects MG cultures, we evaluated different parameters to define the characteristics of MG under low oxygen conditions. First of all, we studied the effect of hypoxia by evaluating HIF-1α expression, a cellular transcription factor that is activated by lack of oxygen. In control cultures, low labelling intensity was found in the cell cytoplasm, apart from some cells that showed a high labelling intensity (Figure 2A). By contrast, in cells subjected to hypoxia, the labelling was intense in the cytoplasm of MG (Figure 2C). Since HIF-1α is a transcription factor, we examined its nuclear localization as an indicator of hypoxic response. Under normoxic conditions, MG cell cultures displayed little to no nuclear labelling. In contrast, exposure to hypoxia resulted in a marked increase in nuclear HIF-1α signal. These findings indicate that MG cells respond to hypoxic stress by upregulating HIF-1α expression, with prominent accumulation observed in both the nucleus and cytoplasm.
3.2. MG Markers and Cell Survival Assay
Having assessed the in vitro model by the validation of MG responding to hypoxia, the expression of molecular markers of MG were analyzed in rat cultures, specifically the expression of glutamine synthetase (GS), and CRALBP. The expression of the specific MG markers was evident, showing no differences in the expression of CRALBP (Figure 3A,B) and GS (Figure 3C,D) in hypoxia compared to control conditions. Nevertheless, survival of MG was analyzed in control cultures and those subjected to hypoxia. For this purpose, the coverslips were analyzed in their entirety and the percentage of cells in hypoxia compared to the control was calculated. In these, it was observed that by subjecting the cells to 1% O2, cell survival in hypoxia compared to the control decreased significantly to 65.17 ± 14.86% (Figure 3E). In addition, it seems to be an increase in MG nuclear and cell size under hypoxic conditions, although these measurements were not performed.
3.3. Hypoxia Mediated Apoptosis
To study hypoxia mediated apoptosis, MG that showed positive labelling for caspase 3, an apoptosis marker, was quantified in hypoxia compared to control cultures. Both, in control and hypoxic conditions, a nuclear labelling was observed (Figure 4A,B). In control condition, 12.18 ± 1.99% of the cells present caspase 3, while, under hypoxic conditions, the percentage increased significantly (p-value ≤ 0.05) to 23.45 ± 1.64% (Figure 4C).
3.4. Gliosis by GFAP Expression
To determine if hypoxia can induce gliosis in MG, cytoskeletal protein GFAP was studied in the MG cell cultures. In the control cultures, GFAP seems to have a basal expression, whereas, in low oxygen conditions, these cells showed a greater expression of GFAP (Figure 5). Thus, the induction of gliosis by the effect of hypoxia is confirmed by this experiment. Moreover, in low oxygen conditions, vimentin fibers (an important component of the cytoskeleton) appear to change into a more disorganized form of its structure without increasing their expression levels, suggesting that vimentin can also be considered as a marker of gliosis (Figure 4, Figure 6 and Figure 7).
3.5. Müller Glia Proliferation
To study the effect of hypoxia on cell proliferation, as a marker of actively dividing cells, MG cultures were labelled with anti-Ki-67 antibody. The percentage of Ki-67 nuclear positive cells was quantified (Figure 6A, B). In control cultures, 22.87 ± 1.37% of Müller cells expressed Ki-67, whereas under hypoxic conditions, the percentage decreased significantly (p-value ≤ 0.05) to 16.64 ± 1.76% (Figure 6C).
3.6. Metabolic Stress
Due to mitochondria are the source of energy for any cell type, and they consume a large amount of oxygen, the number of mitochondria in MG has been analyzed by labelling of the VDAC1 channel, specific to mitochondrial membranes. Under control conditions, it has been observed that mitochondria are found mainly around the nucleus (Figure 7A), while, under hypoxic conditions, a greater distribution of mitochondria is found throughout the cytoplasm in addition to around the nucleus (Figure 7B). Likewise, the number of mitochondria/cell (mit/cell) was also quantified (Figure 7C), as well as the number of mitochondria per µm2 in both control and hypoxia for the same cell area (Figure 7D). Through this experiment, it was observed that under hypoxic conditions the number of mitochondria increases significantly (p-value ≤ 0.05) to 181.73 ± 26.04 mit/cell compared to the control (104.7 ± 10.45 mit/cell) (Figure 7C). Furthermore, it can also be observed that, for the same MG area, there is an increase in the number of mitochondria per µm2, where in control it is 0.0488 ± 0.0049 mit/µm2 while in hypoxia it increases significantly (p-value ≤ 0.05) to 0.0907 ± 0.0039 mit/µm2 (Figure 7D,E), suggesting an increase in metabolic stress when MG are under hypoxic conditions. Furthermore, mitochondrial size appears to be influenced by oxygen conditions, as smaller mitochondria were observed under hypoxic conditions, although this parameter was not quantitatively measured. Notably, under control conditions, mitochondria are predominantly located around the nucleus. In contrast, hypoxia not only increases the number of mitochondria but also results in a broader distribution throughout the cell.
4. Discussion
The retina is part of CNS, where MG are the predominant non-neuronal cell type in the vertebrate retina and account for up to 90% of retinal glia. MG have a wide variety of functions, including maintenance of the blood-retinal barrier, neuroprotection and regulation of the synaptic activity of the different neurons found on the different layers of the retina, homeostasis, regulation of cell volume and metabolite reserve among many other functions [1,2]. Furthermore, the retina has the highest oxygen consumption rate per tissue volume compared to other organs, including the brain, so its high energy demand makes it a tissue highly susceptible to oxygen variations, and therefore to hypoxia [9,10,11]. In different diseases affecting the retina, such as central retinal vein occlusion, glaucoma, diabetic retinopathy or other diseases related to retinal neovascularization, it has been shown that there is an important hypoxic component [12,13,18].
Although protocols for in vitro culture of MG exist [13,15,18,19], most rely on neonatal mice or cell lines, which may not fully reflect the conditions in adult mammalian retinas in vivo. Given this limitation, the present study focuses on the effects of hypoxia on adult MG in primary cultures. We examined HIF-1α expression, cell survival, caspase-3 mediated apoptotic cell death, reactive gliosis, cell proliferation, and metabolic stress, indicated by mitochondrial numbers.
When we exposed MG to hypoxia, we observed an increase in HIF-1α expression, validating the hypoxia in vitro model. It is well established that one of the primary cellular responses to hypoxic damage is the upregulation of the transcription factor HIF-1α, which triggers the cell’s adaptive mechanisms to counteract hypoxic injury [12,13]. In a glaucomatous mouse model, immunolabeling of the entire retina and western blot analysis for HIF-1α protein levels, revealed a marked increase in HIF-1α expression, particularly in MG and astrocytes [20]. Numerous studies have confirmed that HIF-1α expression rises under hypoxic conditions [21,22,23], which aligns with the findings of the present study.
The expression of the MG markers CRALBP and GS, which play key roles in homeostasis and glia-neuron interactions [3], was analyzed under both control and hypoxic conditions. Besides confirming the purity of our cultures, as these are specific markers for MG, we found no significant differences in their expression. Other studies have reported similar findings [24]. For instance, in a study using the immortalized Müller cell line rMC-1 subjected to hypoxia, CRALBP and GS expression remained unchanged after 24 hours of exposure [19]. In contrast to previous studies reporting an increase in GS levels under hypoxic conditions [15]—likely due to the role of GS in metabolizing excessive extracellular glutamate, which can exert neurotoxic effects on RGCs [2,3]—our results did not show a clear upregulation of GS expression. This discrepancy may be attributable to differences in the age of the rats used for MG cell culture: while previous studies used neonatal rats, our experiments employed cells from adult rats. Additionally, the duration of hypoxic exposure may also play a role, as our MG cells were subjected to 72 hours of hypoxia, potentially modeling chronic rather than acute hypoxic stress.
After exposure to hypoxia, a decrease in MG cell survival was observed. Similar findings have been reported in other studies using the methyl-thiazolyltetrazolium (MTT) assay, which measures cell viability and shows reduced levels under hypoxic conditions, indicating decreased survival [25]. This decline in cell survival is linked to increased apoptotic cell death via caspase-3 expression, as a significant rise in caspase-3 positive cells has been noted under hypoxia [26], and decreased proliferating levels observed by Ki-67 labeling. Other studies found that under chemically induced hypoxia, such as CoCl2 exposure, there were elevated caspase 3 levels [27], which aligns with the findings of this study. A reduction in the proliferative capacity of primary MG cultures under hypoxic conditions was observed, as evidenced by decreased nuclear Ki-67 labeling. These results are consistent with previous studies using the methyl-thiazolyl-tetrazolium (MTT) assay, which reported reduced MG proliferation under hypoxia compared to normoxia [25]. However, contrasting findings have been reported in studies using the rMC-1 Müller glial cell line, where hypoxia was associated with increased proliferation [19]. This discrepancy highlights the differential behavior of primary MG cultures and immortalized MG cell lines under hypoxic conditions.
Moreover, the observed decrease in proliferation combined with increased apoptosis likely reduces cell density, which may allow surviving MGs to occupy more space. This spatial availability could facilitate the extension of cellular processes and contribute to morphological remodeling. While an increase in nuclear size was observed, this change may also reflect alterations in cell activation state, nuclear architecture, or cell cycle dynamics, rather than solely being a consequence of reduced crowding.
GFAP, a type III intermediate filament, is the most commonly used marker for studying reactive gliosis in MG [28]. In pathological conditions such as ischemia/hypoxia, glaucoma, or diabetic retinopathy, the expression of this protein is upregulated, making it a key indicator of damage in retinal glial cells [29,30,31]. These results agree with those obtained in this study as increased GFAP labelling can be observed under hypoxic conditions. In this study, it is observed that vimentin, like GFAP—both type III intermediate filaments—undergoes structural disorganization under hypoxic conditions, although vimentin expression levels are not altered. This phenomenon may occur because vimentin acts as a redox sensor, adopting different configurations in response to various oxidants and electrophiles. As a result, oxidative stress, driven by increased reactive oxygen species (ROS), can alter the structure and organization of vimentin filaments [32]. The disorganization of vimentin observed here is likely due to oxidative stress caused by the elevated ROS levels generated by mitochondrial metabolic stress under hypoxic conditions.
The retina has the highest rate of oxygen consumption per tissue volume compared to other organs [8], making the role of mitochondria indispensable. In cellular metabolism, mitochondria are responsible for using oxygen to produce energy, modulate cellular redox potential, osmotic regulation, pH control or calcium homeostasis between others [33] and it has been observed that under hypoxia, there a downregulation of metabolic activity and ATP production [25,34,35]. Our results indicate that under hypoxic conditions there is an increase in the number of mitochondria in MG, which translates into increased metabolic stress in these cells. These results have been confirmed by other studies indicating that under conditions of prolonged hypoxia, there is a decrease in mitochondrial autophagy, resulting in an increase in mitochondrial numbers which means an increase in metabolic stress [21].
In addition to reducing autophagy, hypoxia has been shown to induce mitochondrial fission [36,37]. Notably, intrauterine hypoxia also leads to an increase in mitochondrial biogenesis and content, suggesting that hypoxia triggers mitochondrial dysregulation and a reduction in energy metabolism in cortical astrocytes [35]. This dysregulation contributes to increased metabolic stress. These findings provide insight into the observed rise in total mitochondrial numbers and the reduction in mitochondrial size. Furthermore, under hypoxic conditions and elevated HIF-1α expression, complex II of the mitochondrial electron transport chain becomes activated, while the activity of complex I (NADH-ubiquinone oxidoreductase) is downregulated [38,39]. As a result of reduced complex I activity and limited oxygen availability, NADH accumulates within the mitochondria, disrupting the NADH/NAD⁺ ratio. This imbalance suggests that mitochondrial dysfunction under hypoxic conditions involves not only metabolic stress but also oxidative stress. This may be linked to an increase in the number of mitochondria, as excess NADH could be harmful to MG cells, prompting a need for more mitochondria per cell. Mitochondria adapt dynamically to the energy demands of different cell types and environments. In this study, we observed that oxygen deprivation alters the intracellular distribution of mitochondria, likely linked to increased mitochondrial motility.
Previous research in neurons has shown that the regulator of mitochondrial movement is upregulated under hypoxic conditions, driven by HIF-1α, leading to its redistribution throughout the cytoplasm [40]. Additionally, it has been demonstrated that this redistribution is influenced by the Hypoxia Upregulated Mitochondrial Movement Regulator (HUMMR), which, under hypoxic conditions, collaborates with HIF-1α to drive anterograde mitochondrial movement from the soma to dendrites and axons in neurons, or from the soma to astrocytic projections in astrocytes [41]. In contrast, in cancer cells, mitochondria exhibit a different pattern of localization, often aggregating around the nucleus [36]. However, in the present study, mitochondria display a broader distribution, extending throughout the cytoplasm. These findings underscore the metabolic stress experienced by cells under hypoxia, as the redistribution of mitochondria across the cytoplasm is indicative of elevated metabolic demand and stress [40].
5. Conclusions
In summary, the retina is a CNS tissue with the highest metabolic rate in the body, surpassing even the brain, making it particularly vulnerable to fluctuations in oxygen levels. Müller glia (MG), the primary glial cells in the retina, perform numerous functions essential for the maintenance and communication of various retinal cells. Our study reveals that MG are highly sensitive to oxygen level changes, with hypoxia leading to reduced proliferation and survival due to apoptosis and increased metabolic stress. In conclusion, MG respond to hypoxia and may play a role in the development of pathologies with a hypoxic component. Further research is necessary to fully understand how these changes impact retinal physiology and to explore potential strategies to mitigate the effects of hypoxia on MG.
Author Contributions
“Conceptualization, X.P. and E.V.; methodology, X.P., X.M.; validation, E.V. and X.P.; formal analysis, X.P.; investigation, X.P. and X.M.; resources, E.V.; data curation, X.P.; writing—original draft preparation, X.M.; writing—review and editing, X.P. and E.V.; visualization, X.P.; supervision, X.P. and E.V.; project administration, E.V.; funding acquisition, E.V. All authors have read and agreed to the published version of the manuscript.
Funding
This research was funded by Gobierno Vasco (IT1510-22) and MICIU/AEI/10.13039/501100011033 (PID2023-152778OB-I00) to E.V.
Informed Consent Statement
Not applicable.
Data Availability Statement
Data Availability Statements are available in section “MDPI Research Data Policies” at https://www.mdpi.com/ethics.
Conflicts of Interest
The authors declare no conflicts of interest.
Abbreviations
The following abbreviations are used in this manuscript:
| ARVO | Association for Research in Vision and Ophthalmology |
| ATP | Adenosine Triphosphate |
| BSA | Bovine Serum Albumin |
| CNS | Central Nervous System |
| CoCl2 | Cobalt(II) chloride |
| CRALBP | Cellular Retinaldehyde |
| DAPI | 4′,6-Diamidino-2-Phenylindole |
| DMEM | Dulbecco’s Modified Eagle’s Medium |
| EBSS | Earle’s Balanced Salt Solution |
| FBS | Fetal Bovine Serum |
| GFAP | Glial Fibrillary Acidic Protein |
| GLAST | Glutamate Aspartate Transporter |
| GS | Glutamine Synthetase |
| HIF | 1- Hypoxia-Inducible Factor 1 |
| HIF | 1α - Hypoxia - Inducible Factor 1 - alpha |
| HUMMR | Hypoxia Upregulated Mitochondrial Movement Regulator |
| Ki67 | A marker for cellular proliferation |
| MG | Müller Glia |
| MTT | Methyl-Thiazolyl-Tetrazolium |
| NADH | Nicotinamide Adenine Dinucleotide (reduced form) |
| PBS | Phosphate Buffered Saline |
| RGC | Retinal Ganglion Cell |
| ROS | Reactive Oxygen Species |
| SEM | Standard Error of the Mean |
| SPSS | Statistical Package for the Social Sciences |
| VDAC1 | Voltage-Dependent Anion Channel 1 |
References
- Reichenbach, A.; Bringmann, A. New functions of Muller cells. Glia 2013, 61, 651–678. [Google Scholar] [CrossRef] [PubMed]
- Vecino, E.; Rodriguez, F.D.; Ruzafa, N.; Pereiro, X.; Sharma, S.C. Glia-neuron interactions in the mammalian retina. Prog. Retin. Eye Res. 2016, 51, 1–40. [Google Scholar] [CrossRef] [PubMed]
- Bringmann, A.; Pannicke, T.; Grosche, J.; Francke, M.; Wiedemann, P.; Skatchkov, S.N.; Osborne, N.N.; Reichenbach, A. Muller cells in the healthy and diseased retina. Prog. Retin. Eye Res. 2006, 25, 397–424. [Google Scholar] [CrossRef]
- Garcia, M.; Forster, V.; Hicks, D.; Vecino, E. In vivo expression of neurotrophins and neurotrophin receptors is conserved in adult porcine retina in vitro. Invest. Ophthalmol. Vis. Sci. 2003, 44, 4532–4541. [Google Scholar] [CrossRef]
- Pereiro, X.; Miltner, A.M.; La Torre, A.; Vecino, E. Effects of Adult Muller Cells and Their Conditioned Media on the Survival of Stem Cell-Derived Retinal Ganglion Cells. Cells 2020, 9. [Google Scholar] [CrossRef]
- Ruzafa, N.; Pereiro, X.; Lepper, M.F.; Hauck, S.M.; Vecino, E. A Proteomics Approach to Identify Candidate Proteins Secreted by Muller Glia that Protect Ganglion Cells in the Retina. Proteomics 2018, 18, e1700321. [Google Scholar] [CrossRef]
- Reichenbach, A.; Bringmann, A. Glia of the human retina. Glia 2020, 68, 768–796. [Google Scholar] [CrossRef]
- Ames, A., 3rd. Energy requirements of CNS cells as related to their function and to their vulnerability to ischemia: a commentary based on studies on retina. Can J Physiol Pharmacol 1992, 70 (Suppl. 1), S158–S164. [Google Scholar] [CrossRef]
- Eshaq, R.S.; Wright, W.S.; Harris, N.R. Oxygen delivery, consumption, and conversion to reactive oxygen species in experimental models of diabetic retinopathy. Redox Biol 2014, 2, 661–666. [Google Scholar] [CrossRef]
- Kimble, E.A.; Svoboda, R.A.; Ostroy, S.E. Oxygen consumption and ATP changes of the vertebrate photoreceptor. Exp Eye Res 1980, 31, 271–288. [Google Scholar] [CrossRef]
- Ruzafa, N.; Rey-Santano, C.; Mielgo, V.; Pereiro, X.; Vecino, E. Effect of hypoxia on the retina and superior colliculus of neonatal pigs. PLoS One 2017, 12, e0175301. [Google Scholar] [CrossRef] [PubMed]
- Kaur, C.; Foulds, W.S.; Ling, E.A. Blood-retinal barrier in hypoxic ischaemic conditions: basic concepts, clinical features and management. Prog Retin Eye Res 2008, 27, 622–647. [Google Scholar] [CrossRef] [PubMed]
- Ou, K.; Mertsch, S.; Theodoropoulou, S.; Wu, J.; Liu, J.; Copland, D.A.; Scott, L.M.; Dick, A.D.; Schrader, S.; Liu, L. Muller Cells Stabilize Microvasculature through Hypoxic Preconditioning. Cell Physiol Biochem 2019, 52, 668–680. [Google Scholar] [CrossRef] [PubMed]
- Jassim, A.H.; Nsiah, N.Y.; Inman, D.M. Ocular Hypertension Results in Hypoxia within Glia and Neurons throughout the Visual Projection. Antioxidants 2022, 11, 888. [Google Scholar] [CrossRef]
- Yu, J.; Yan, Y.; Chen, Y.; Zheng, Y.; Yu, X.; Wang, J.; Wang, Y.; Wang, A.; Kang, X.; Cen, J.; et al. A(2A)R Antagonists Upregulate Expression of GS and GLAST in Rat Hypoxia Model. Biomed Res Int 2020, 2020, 2054293. [Google Scholar] [CrossRef]
- Li, X.; Liu, J.; Hoh, J.; Liu, J. Muller cells in pathological retinal angiogenesis. Transl Res 2019, 207, 96–106. [Google Scholar] [CrossRef]
- Pereiro, X.; Ruzafa, N.; Acera, A.; Urcola, A.; Vecino, E. Optimization of a Method to Isolate and Culture Adult Porcine, Rats and Mice Muller Glia in Order to Study Retinal Diseases. Front. Cell Neurosci. 2020, 14, 7. [Google Scholar] [CrossRef]
- Yafai, Y.; Iandiev, I.; Wiedemann, P.; Reichenbach, A.; Eichler, W. Retinal endothelial angiogenic activity: effects of hypoxia and glial (Muller) cells. Microcirculation 2004, 11, 577–586. [Google Scholar] [CrossRef]
- Wang, X.; Hasan, O.; Arzeno, A.; Benowitz, L.I.; Cafferty, W.B.; Strittmatter, S.M. Axonal regeneration induced by blockade of glial inhibitors coupled with activation of intrinsic neuronal growth pathways. Exp Neurol 2012, 237, 55–69. [Google Scholar] [CrossRef]
- Ergorul, C.; Ray, A.; Huang, W.; Wang, D.Y.; Ben, Y.; Cantuti-Castelvetri, I.; Grosskreutz, C.L. Hypoxia inducible factor-1alpha (HIF-1alpha) and some HIF-1 target genes are elevated in experimental glaucoma. J Mol Neurosci 2010, 42, 183–191. [Google Scholar] [CrossRef]
- Jassim, A.H.; Fan, Y.; Pappenhagen, N.; Nsiah, N.Y.; Inman, D.M. Oxidative Stress and Hypoxia Modify Mitochondrial Homeostasis During Glaucoma. Antioxid Redox Signal 2021, 35, 1341–1357. [Google Scholar] [CrossRef] [PubMed]
- Ke, Q.; Costa, M. Hypoxia-inducible factor-1 (HIF-1). Mol Pharmacol 2006, 70, 1469–1480. [Google Scholar] [CrossRef] [PubMed]
- Zhang, L.; Shi, B.; Hu, M.; Qian, L. HIF-1alpha and Caspase-3 expression in aggressive papillary thyroid carcinoma. World J Surg Oncol 2022, 20, 353. [Google Scholar] [CrossRef]
- Ikeda, T.; Nakamura, K.; Oku, H.; Horie, T.; Kida, T.; Takai, S. Immunohistological Study of Monkey Foveal Retina. Sci Rep 2019, 9, 5258. [Google Scholar] [CrossRef]
- Morawski, K.; Kocemba-Pilarczyk, K.; Zarzycka, M.; Dudzik, P.; Trojan, S.E.; Laidler, P. In vitro culture Muller cell model to study the role of inverted internal limiting membrane flap technique in macular hole closure. J Physiol Pharmacol 2021, 72. [Google Scholar] [CrossRef]
- Eskandari, E.; Eaves, C.J. Paradoxical roles of caspase-3 in regulating cell survival, proliferation, and tumorigenesis. J Cell Biol 2022, 221. [Google Scholar] [CrossRef]
- Ahmad, A.; Nawaz, M.I.; Siddiquei, M.M.; Abu El-Asrar, A.M. Apocynin ameliorates NADPH oxidase 4 (NOX4) induced oxidative damage in the hypoxic human retinal Muller cells and diabetic rat retina. Mol Cell Biochem 2021, 476, 2099–2109. [Google Scholar] [CrossRef]
- Xue, L.; Ding, P.; Xiao, L.; Hu, M.; Hu, Z. Nestin is induced by hypoxia and is attenuated by hyperoxia in Muller glial cells in the adult rat retina. Int J Exp Pathol 2011, 92, 377–381. [Google Scholar] [CrossRef]
- Jo, A.O.; Lakk, M.; Rudzitis, C.N.; Krizaj, D. TRPV4 and TRPC1 channels mediate the response to tensile strain in mouse Muller cells. Cell Calcium 2022, 104, 102588. [Google Scholar] [CrossRef]
- Krizaj, D.; Ryskamp, D.A.; Tian, N.; Tezel, G.; Mitchell, C.H.; Slepak, V.Z.; Shestopalov, V.I. From mechanosensitivity to inflammatory responses: new players in the pathology of glaucoma. Curr Eye Res 2014, 39, 105–119. [Google Scholar] [CrossRef]
- Woldemussie, E.; Wijono, M.; Ruiz, G. Muller cell response to laser-induced increase in intraocular pressure in rats. Glia 2004, 47, 109–119. [Google Scholar] [CrossRef] [PubMed]
- Martinez-Cenalmor, P.; Martinez, A.E.; Moneo-Corcuera, D.; Gonzalez-Jimenez, P.; Perez-Sala, D. Oxidative stress elicits the remodeling of vimentin filaments into biomolecular condensates. Redox Biol 2024, 75, 103282. [Google Scholar] [CrossRef] [PubMed]
- Gincel, D.; Vardi, N.; Shoshan-Barmatz, V. Retinal voltage-dependent anion channel: characterization and cellular localization. Invest Ophthalmol Vis Sci 2002, 43, 2097–2104. [Google Scholar]
- Adzigbli, L.; Sokolov, E.P.; Wimmers, K.; Sokolova, I.M.; Ponsuksili, S. Effects of hypoxia and reoxygenation on mitochondrial functions and transcriptional profiles of isolated brain and muscle porcine cells. Sci Rep 2022, 12, 19881. [Google Scholar] [CrossRef]
- LFS, E.S.; Brito, M.D.; Yuzawa, J.M.C.; Rosenstock, T.R. Mitochondrial Dysfunction and Changes in High-Energy Compounds in Different Cellular Models Associated to Hypoxia: Implication to Schizophrenia. Sci Rep 2019, 9, 18049. [Google Scholar] [CrossRef]
- Benej, M.; Papandreou, I.; Denko, N.C. Hypoxic adaptation of mitochondria and its impact on tumor cell function. Semin Cancer Biol 2024, 100, 28–38. [Google Scholar] [CrossRef]
- Kim, H.; Scimia, M.C.; Wilkinson, D.; Trelles, R.D.; Wood, M.R.; Bowtell, D.; Dillin, A.; Mercola, M.; Ronai, Z.A. Fine-tuning of Drp1/Fis1 availability by AKAP121/Siah2 regulates mitochondrial adaptation to hypoxia. Mol Cell 2011, 44, 532–544. [Google Scholar] [CrossRef]
- Griebsch, M.; Klemm, M.; Haueisen, J.; Hammer, M. Hypoxia-induced redox signalling in Muller cells. Acta Ophthalmol 2017, 95, e337–e339. [Google Scholar] [CrossRef]
- Lukyanova, L.D.; Kirova, Y.I. Mitochondria-controlled signaling mechanisms of brain protection in hypoxia. Front Neurosci 2015, 9, 320. [Google Scholar] [CrossRef]
- Huang, X.; Zhao, L.; Peng, R. Hypoxia-Inducible Factor 1 and Mitochondria: An Intimate Connection. Biomolecules 2022, 13, 50. [Google Scholar] [CrossRef]
- Li, Y.; Lim, S.; Hoffman, D.; Aspenstrom, P.; Federoff, H.J.; Rempe, D.A. HUMMR, a hypoxia- and HIF-1alpha-inducible protein, alters mitochondrial distribution and transport. J Cell Biol 2009, 185, 1065–1081. [Google Scholar] [CrossRef] [PubMed]
Figure 1.
Methodology used in this experiment. Created with BioRender.com.
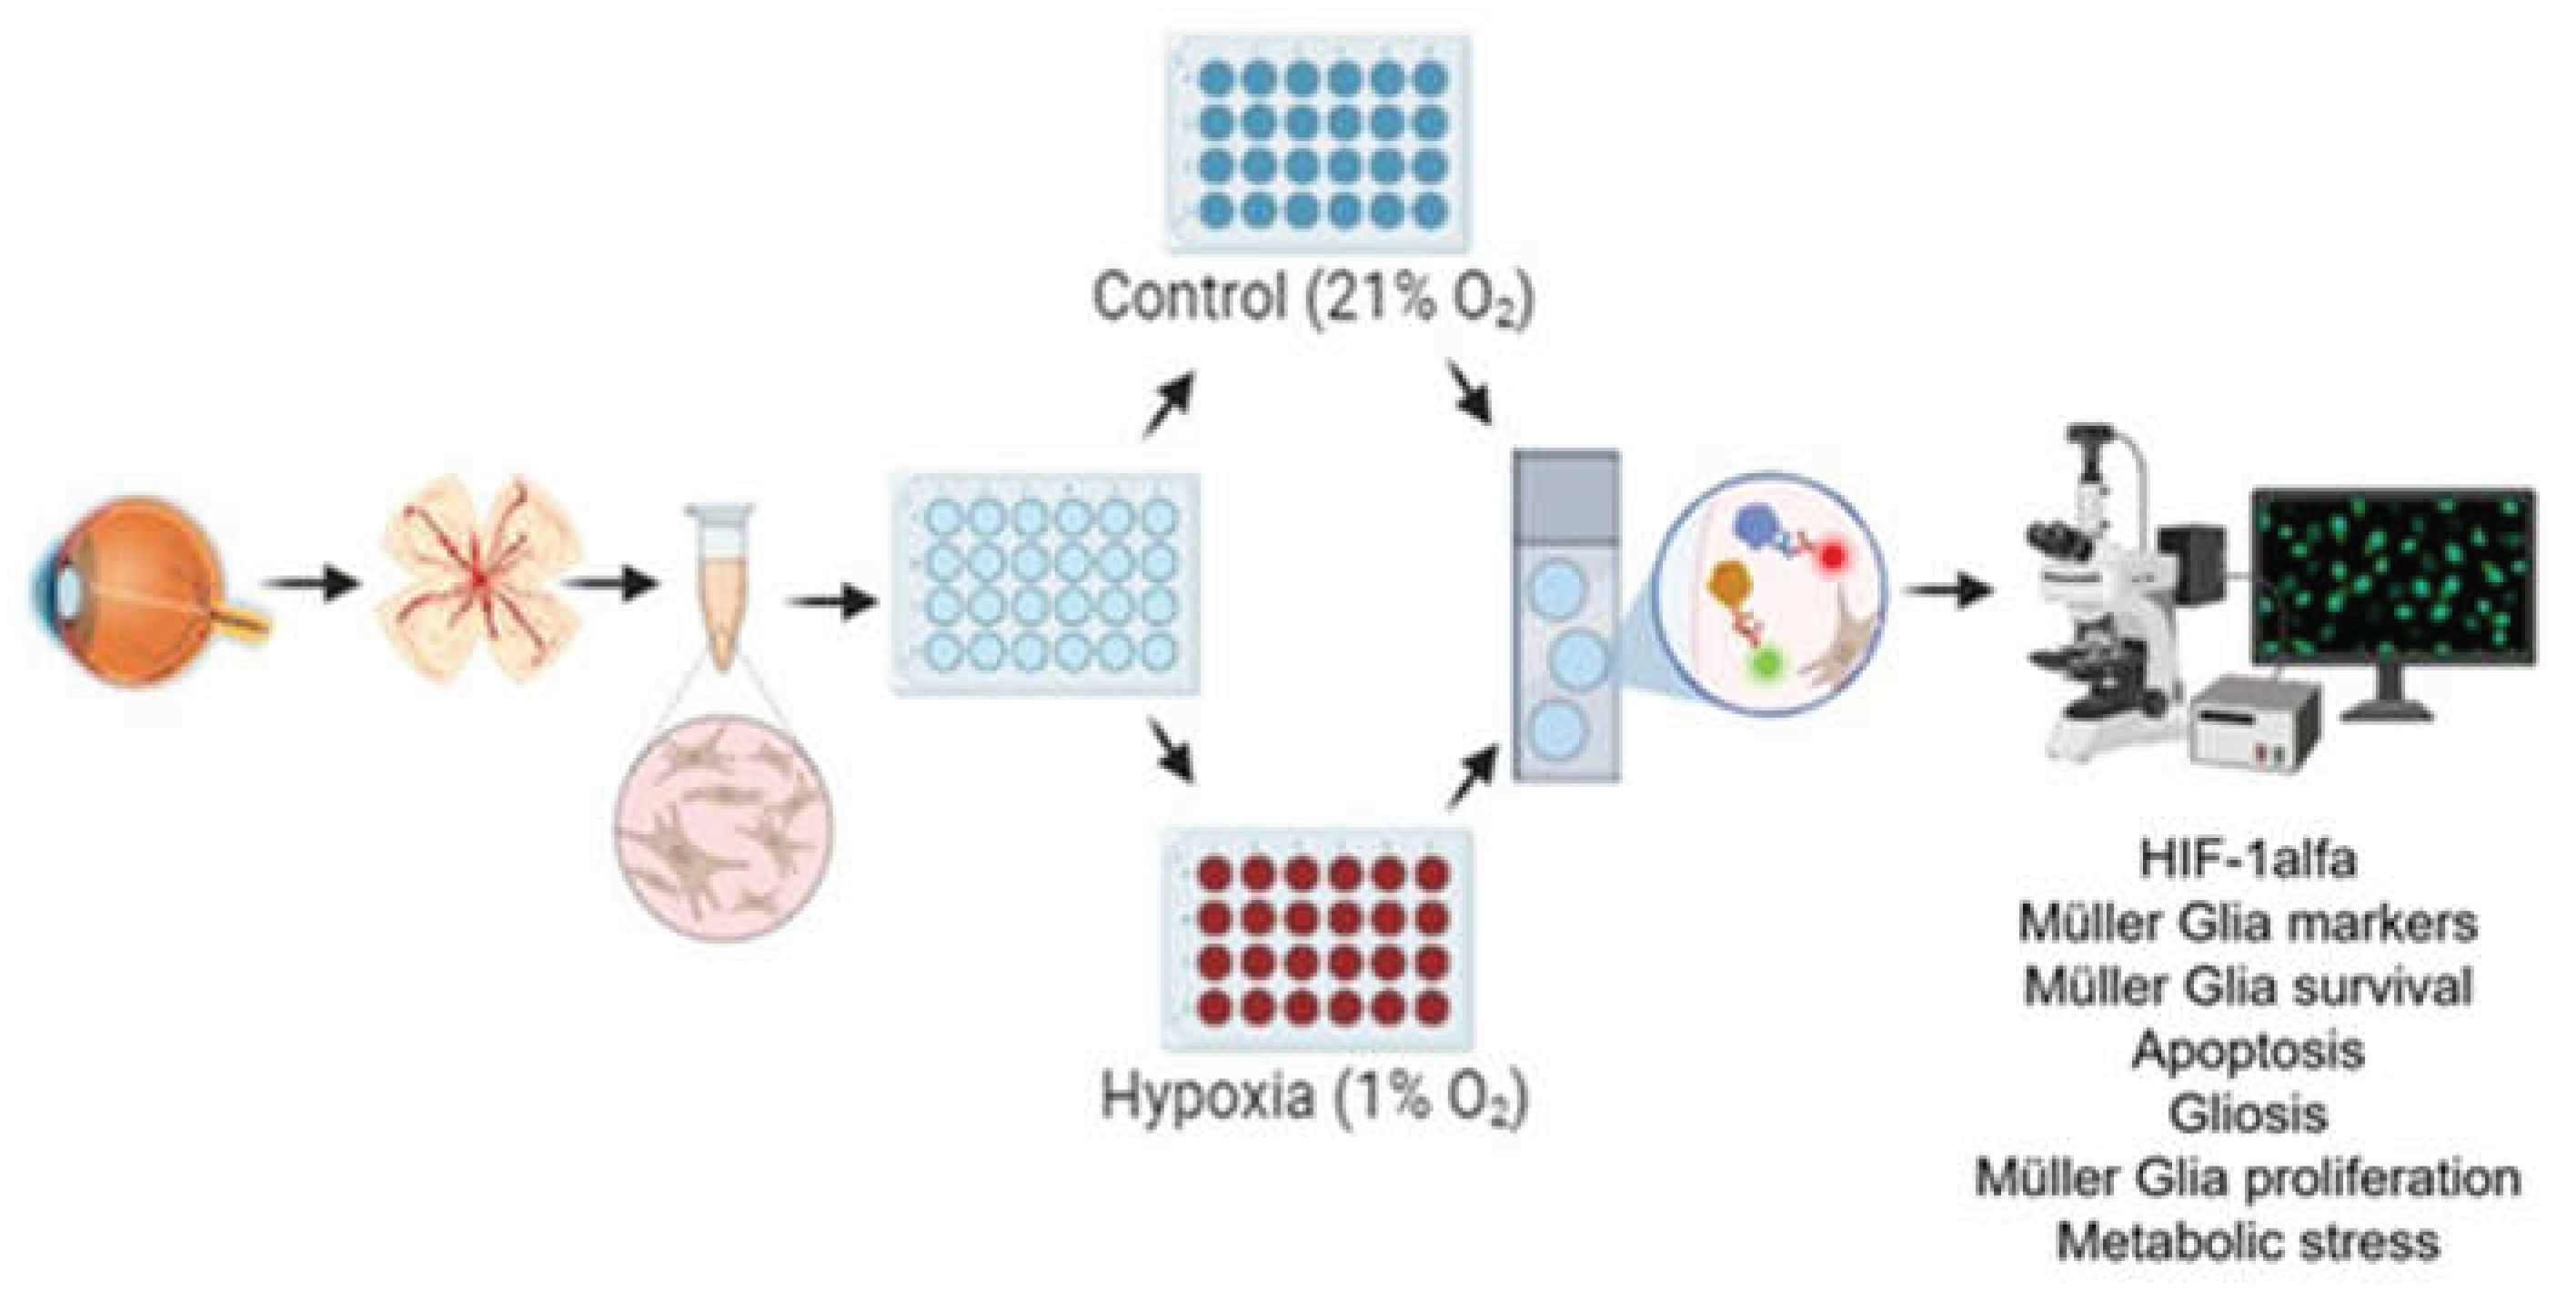
Figure 2.
Effect of hypoxia on HIF-1α expression. Images of MG cultures taken under control (A, B) and hypoxia (C, D) conditions (B and D images are zoom-in images of A and C respectively). It is observed that under hypoxic conditions there is a greater expression of HIF-1α marker. Cells were labelled with anti-HIF-1α (red) and the cell nuclei were labelled with DAPI (blue). Scale bar = 50µm.
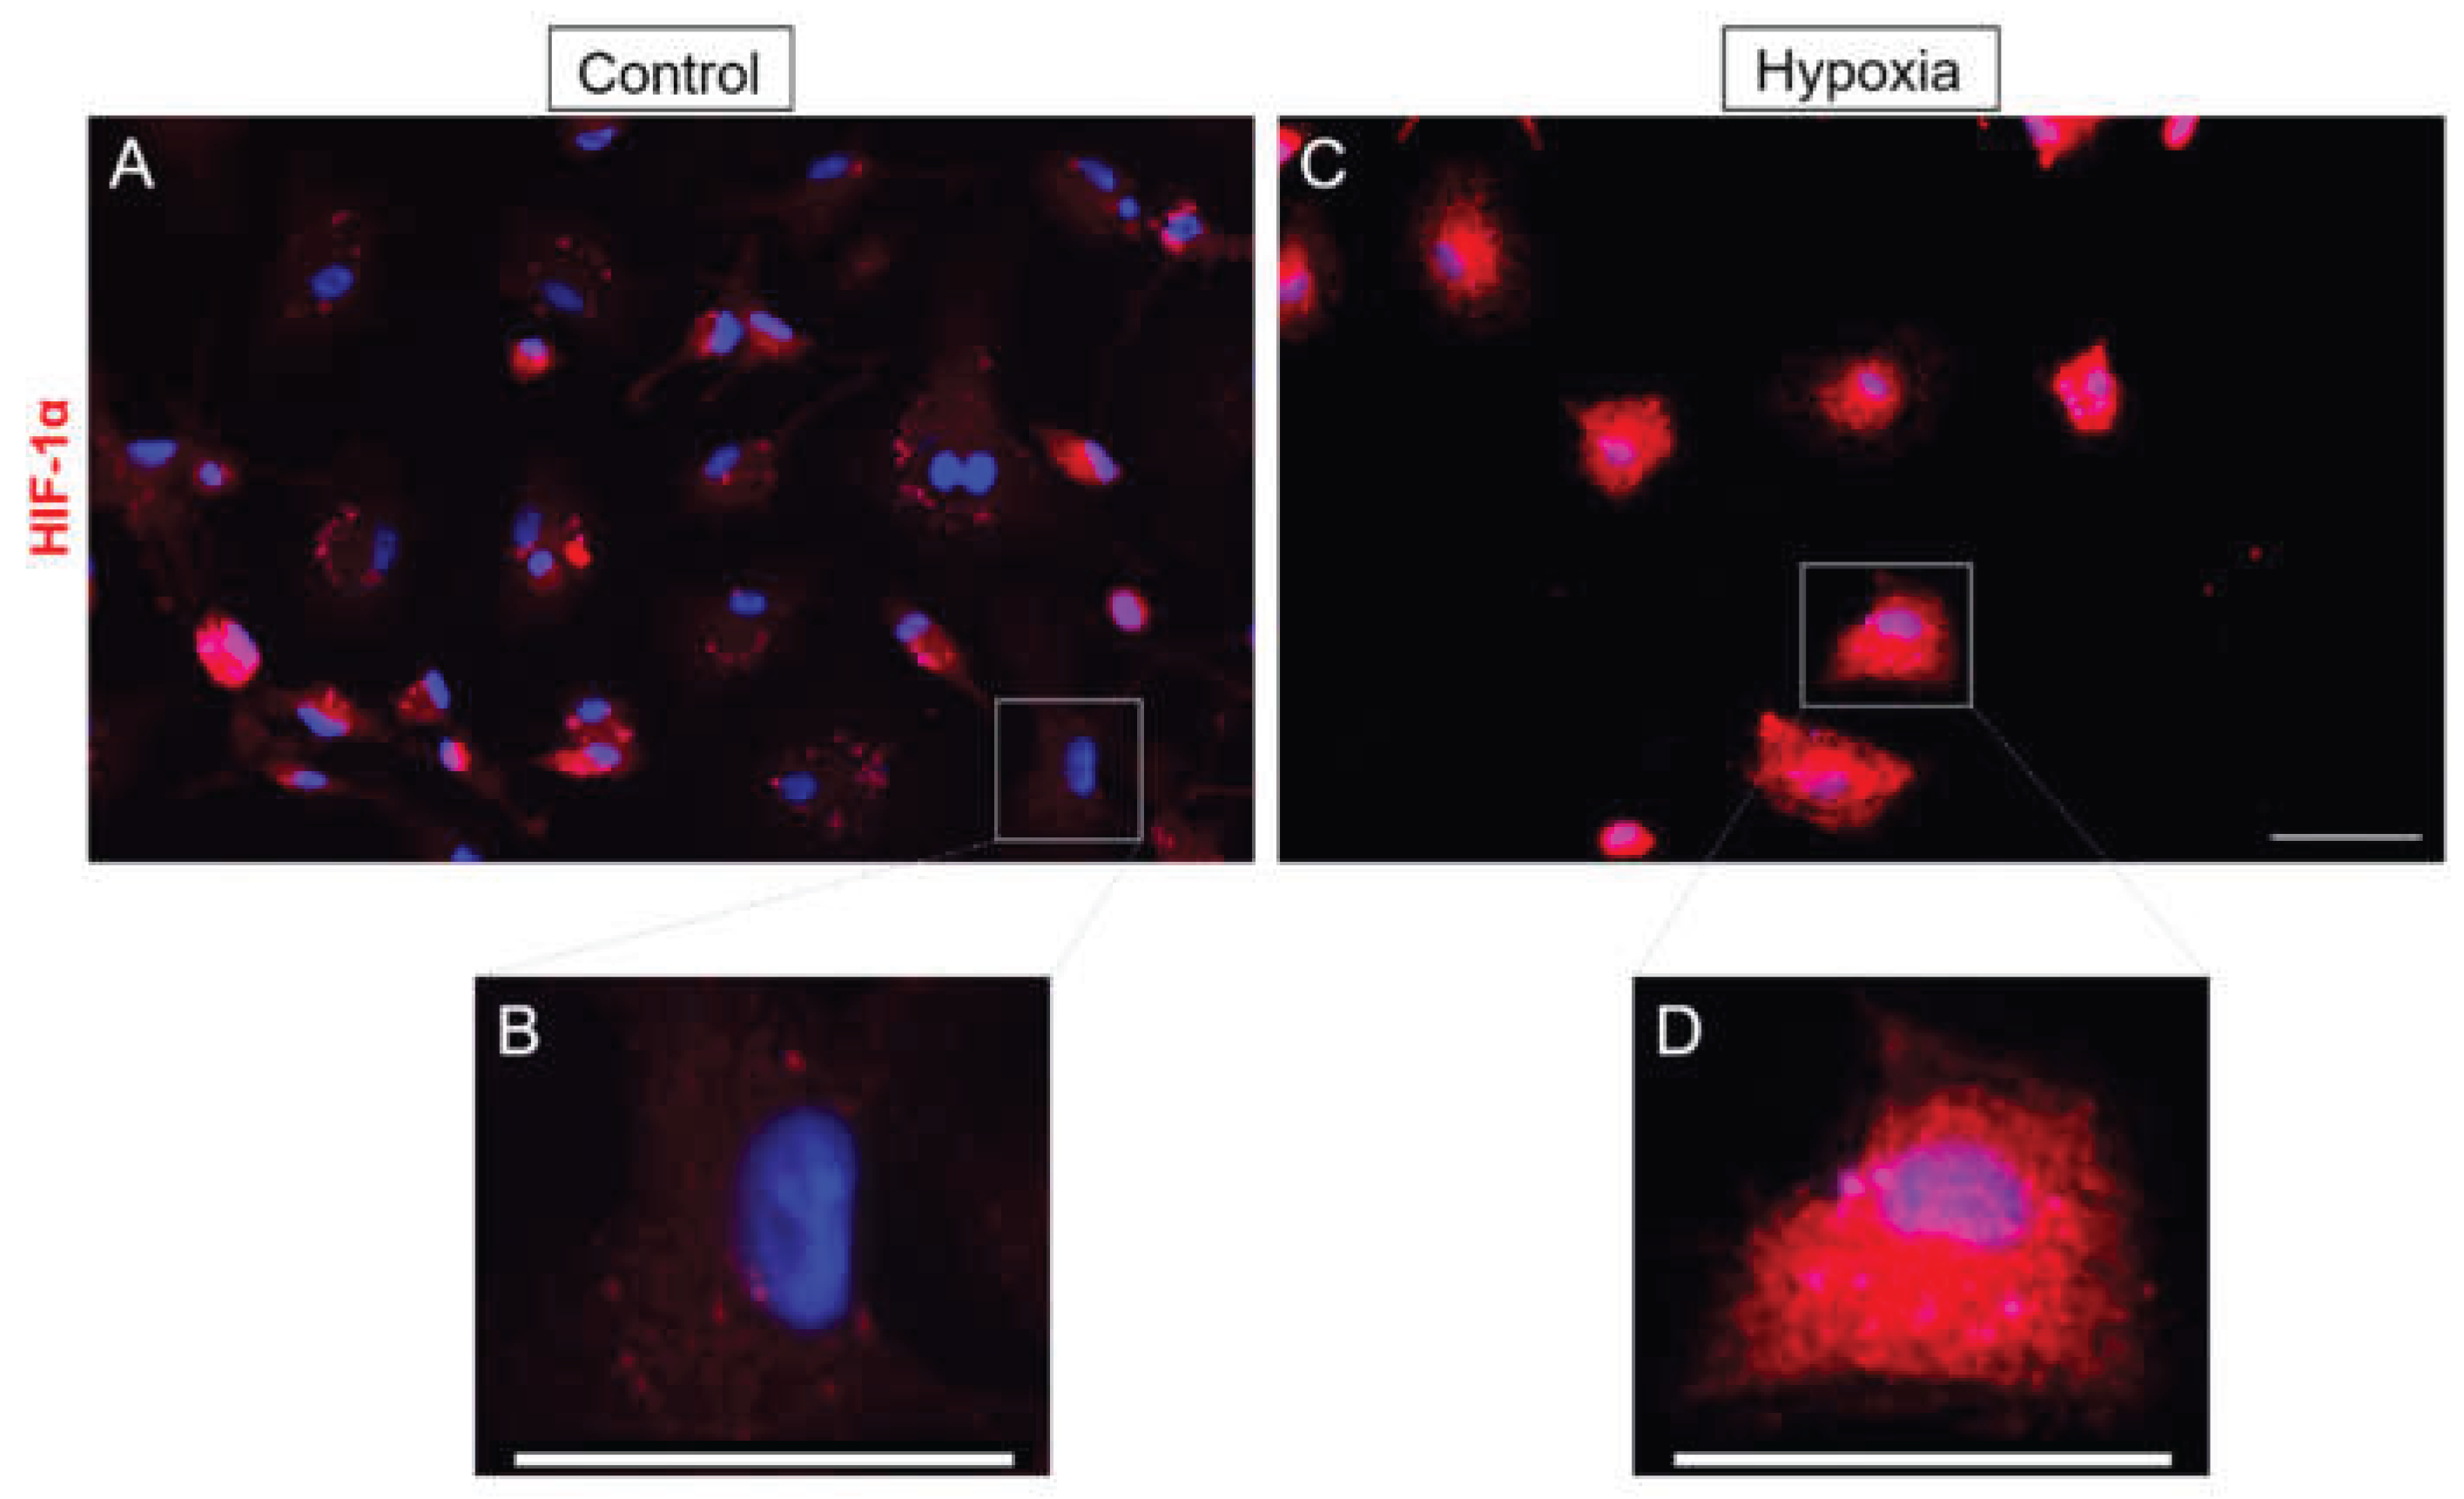
Figure 3.
Analysis of survival and expression of CRALBP and GS in MG cultures under control and hypoxia conditions. Images of Müller cell cultures taken under control (A, C) and hypoxia (B, D) conditions in which the expression of CRALBP (red) (A, B) and GS (red) is observed (C, D). It is observed that both the expression of CRALBP and the expression of GS do not vary in both conditions. In the analysis of cell survival, a significant decrease in the total number of cells in hypoxia is observed compared to the control (E). Nuclei were labelled with DAPI (blue). *p-value ≤ 0.05. Scale bar = 50µm.
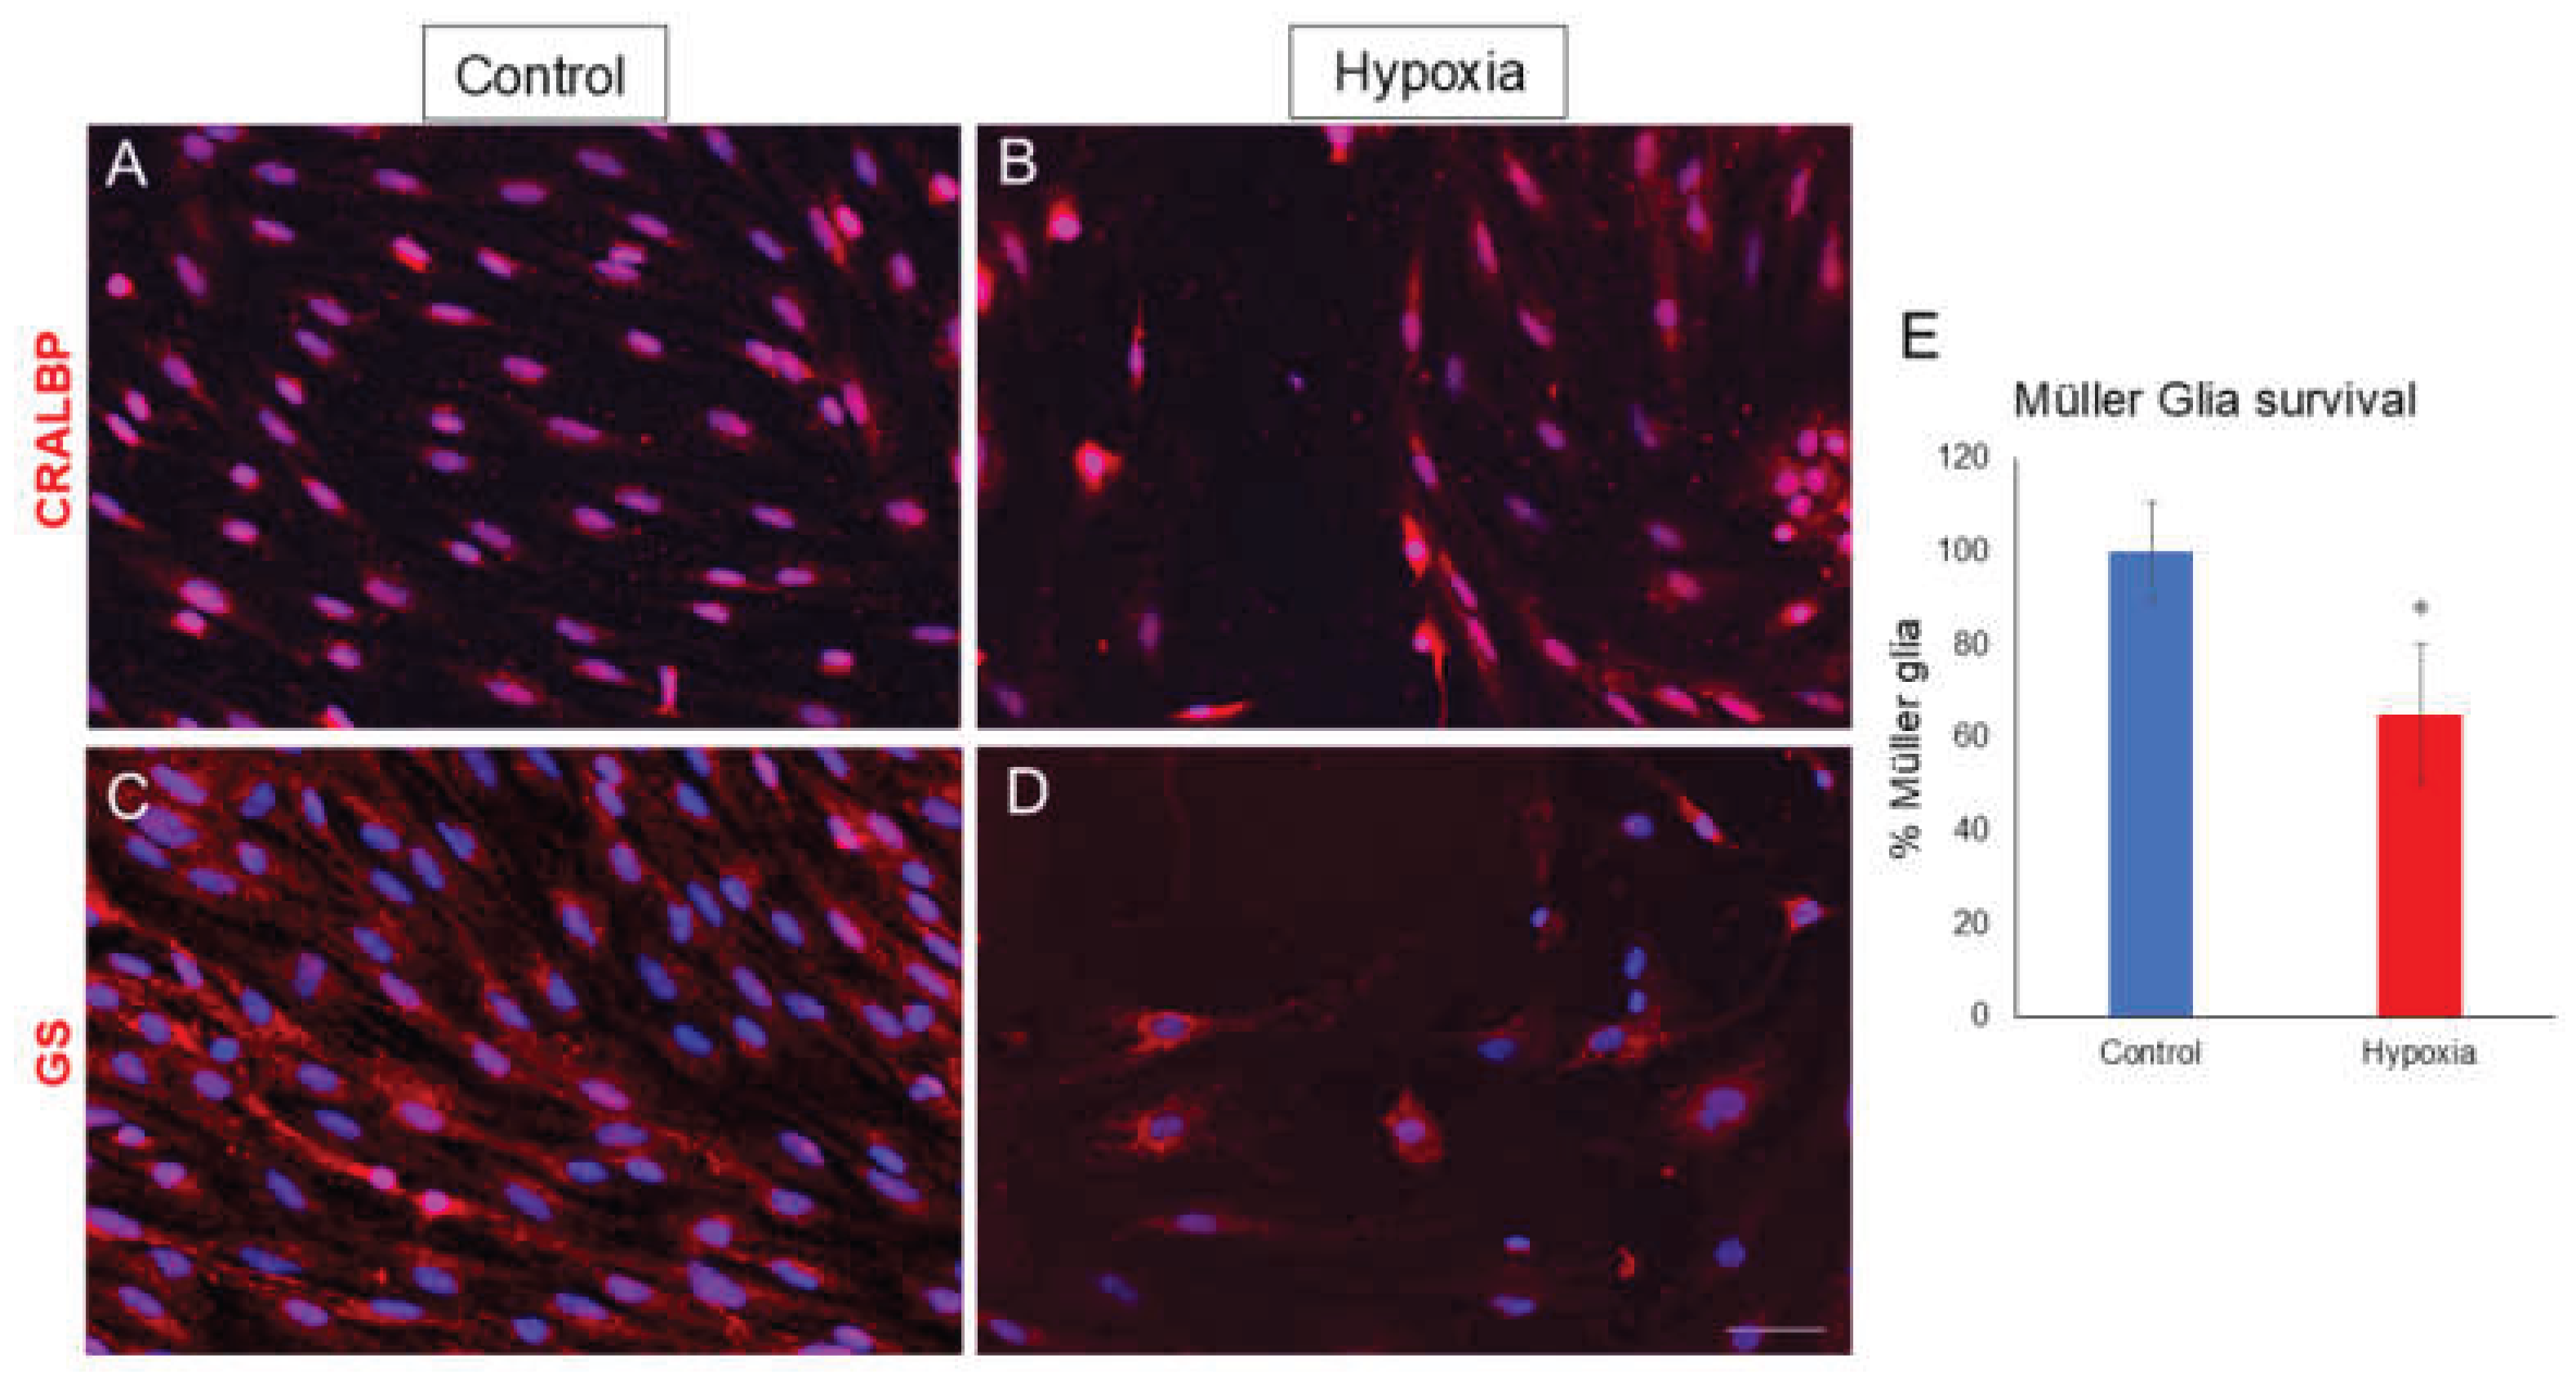
Figure 4.
Analysis of apoptosis by expressing caspase 3. Images of MG cultures were taken under control (A) and hypoxia (B) conditions in which the expression of caspase 3 (red) and vimentin (green) is observed. A significant increase in the number of caspase 3-positive cells is observed under hypoxic conditions compared to the control (C). Nuclei were labelled with DAPI (blue). *p-value ≤ 0.05. Scale bar = 50µm.
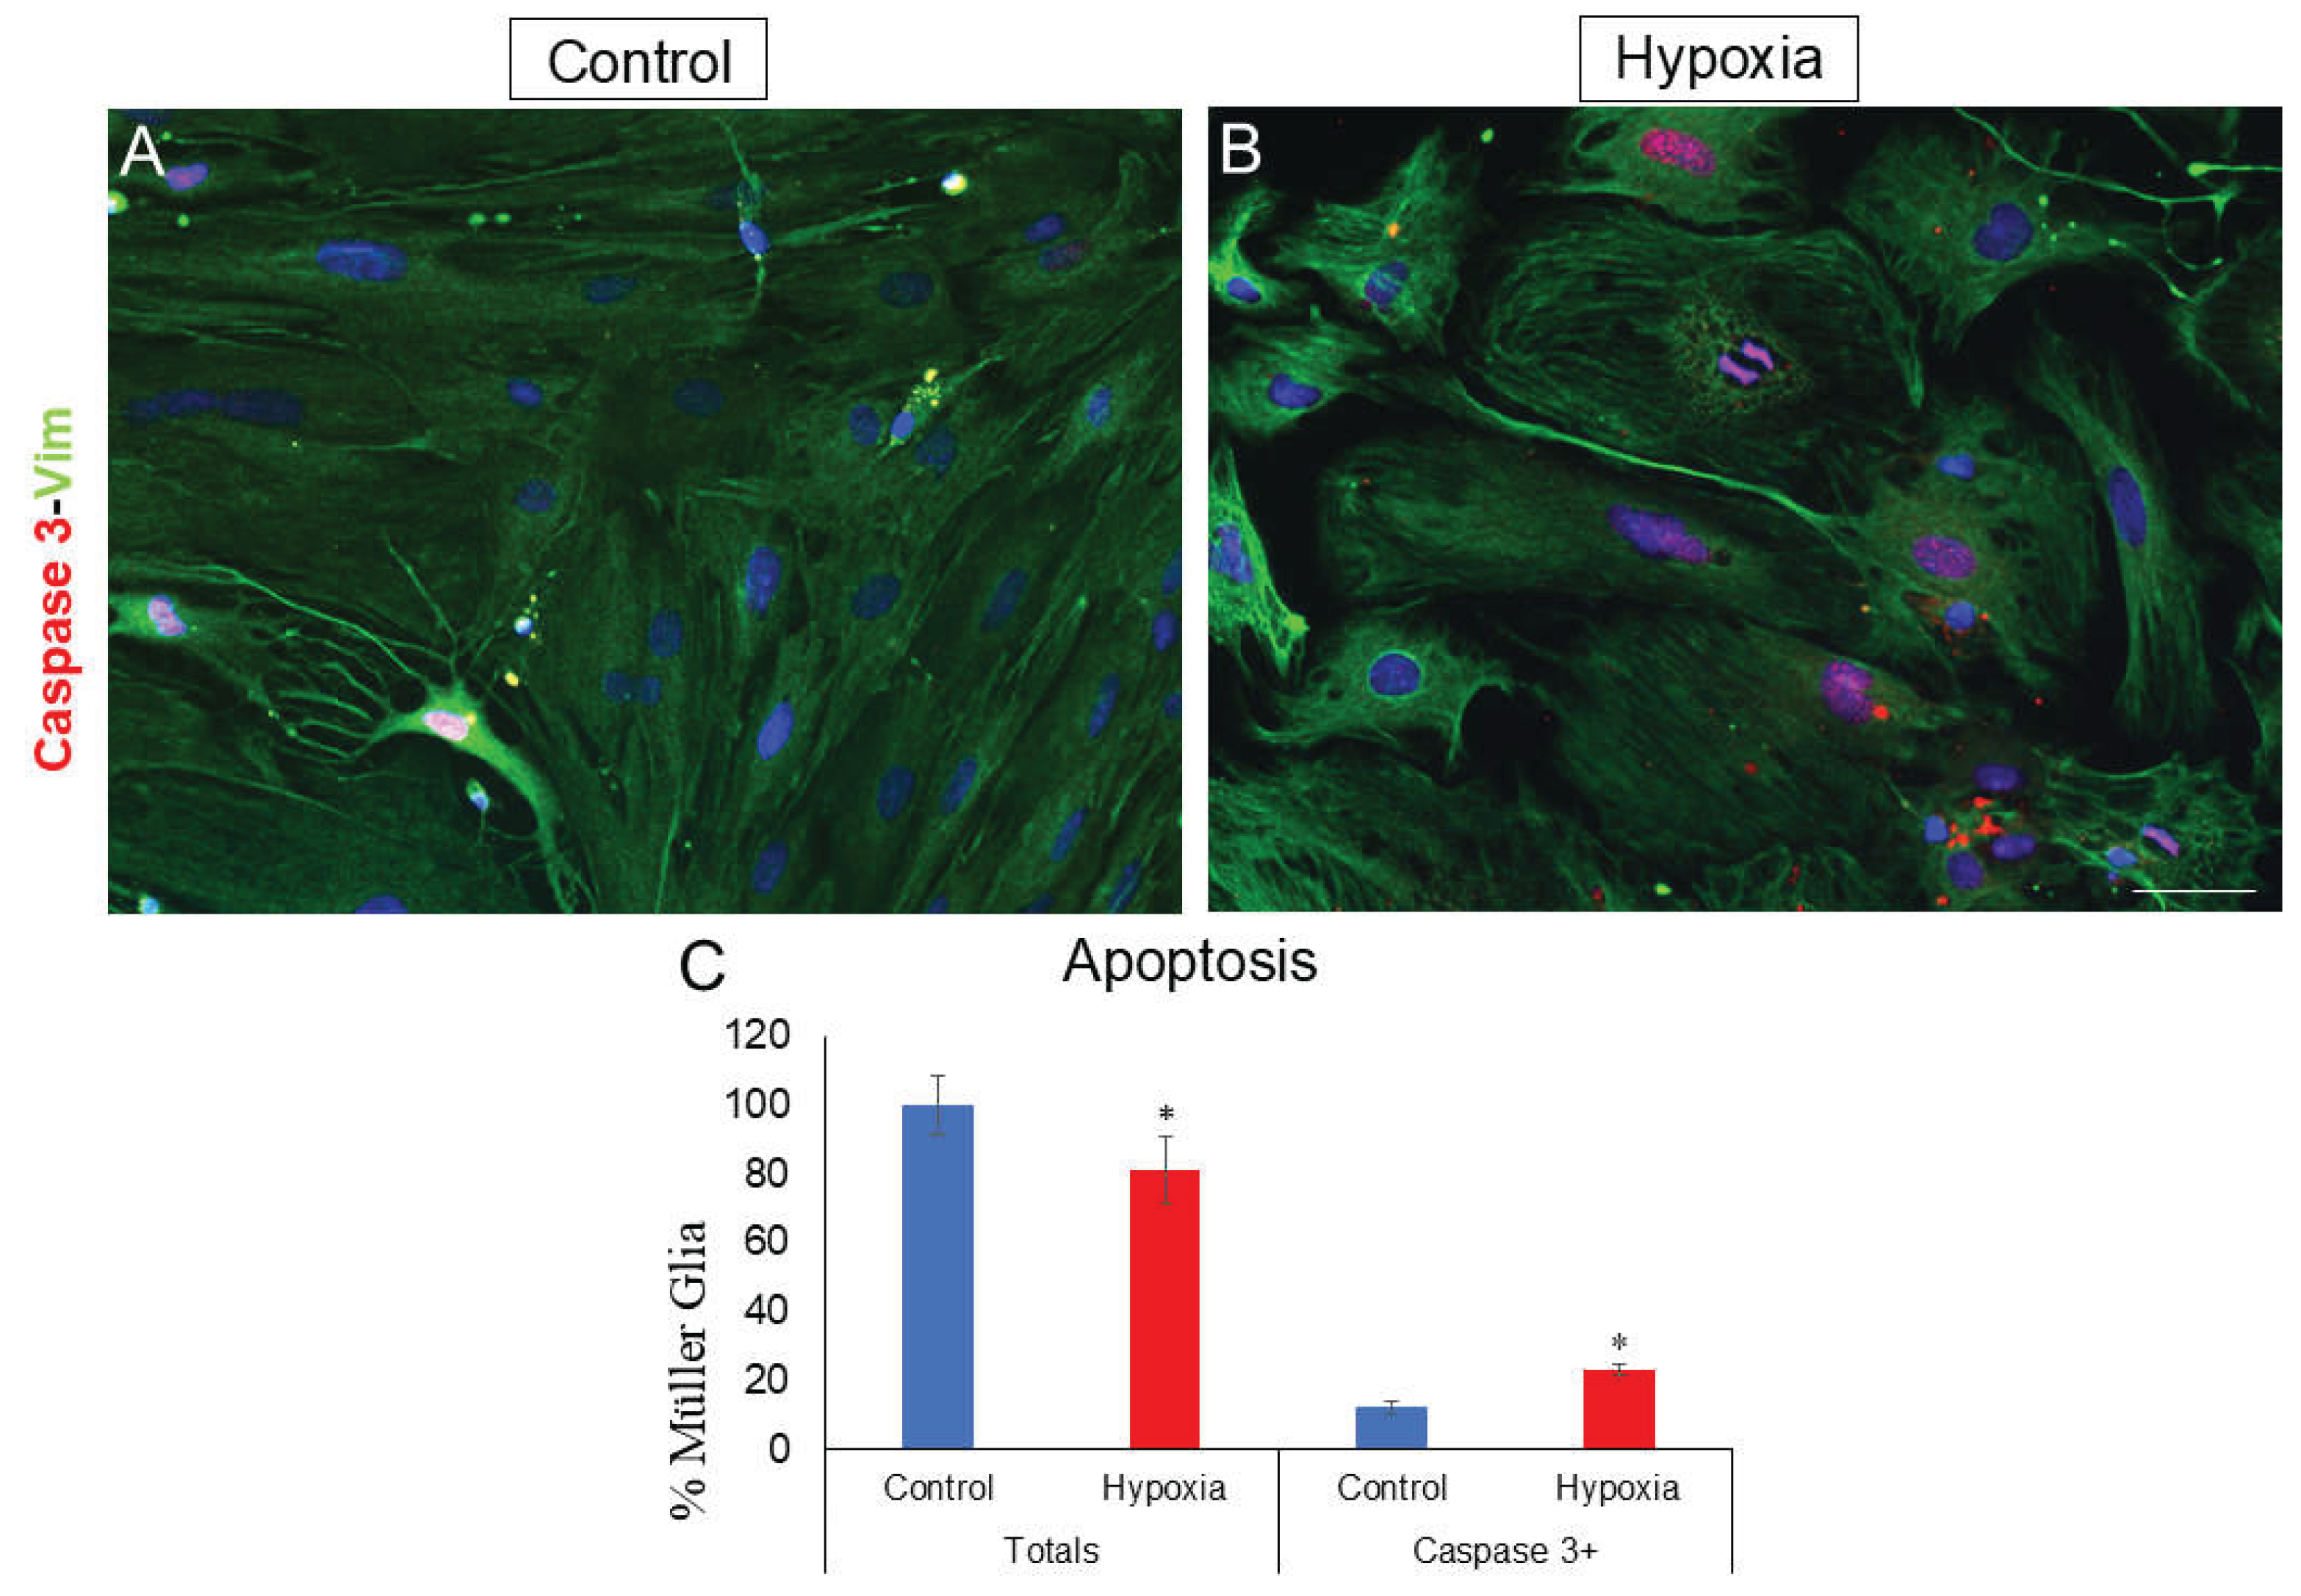
Figure 5.
Effect of hypoxia on the expression of the gliosis marker GFAP under control and hypoxia conditions. Images of MG cultures taken under control (A) and hypoxia (B) conditions in which the expression of GFAP (green) is observed. A greater expression of GFAP is observed in hypoxic conditions compared to the control. Nuclei were labelled with DAPI (blue). Scale bar = 50µm.
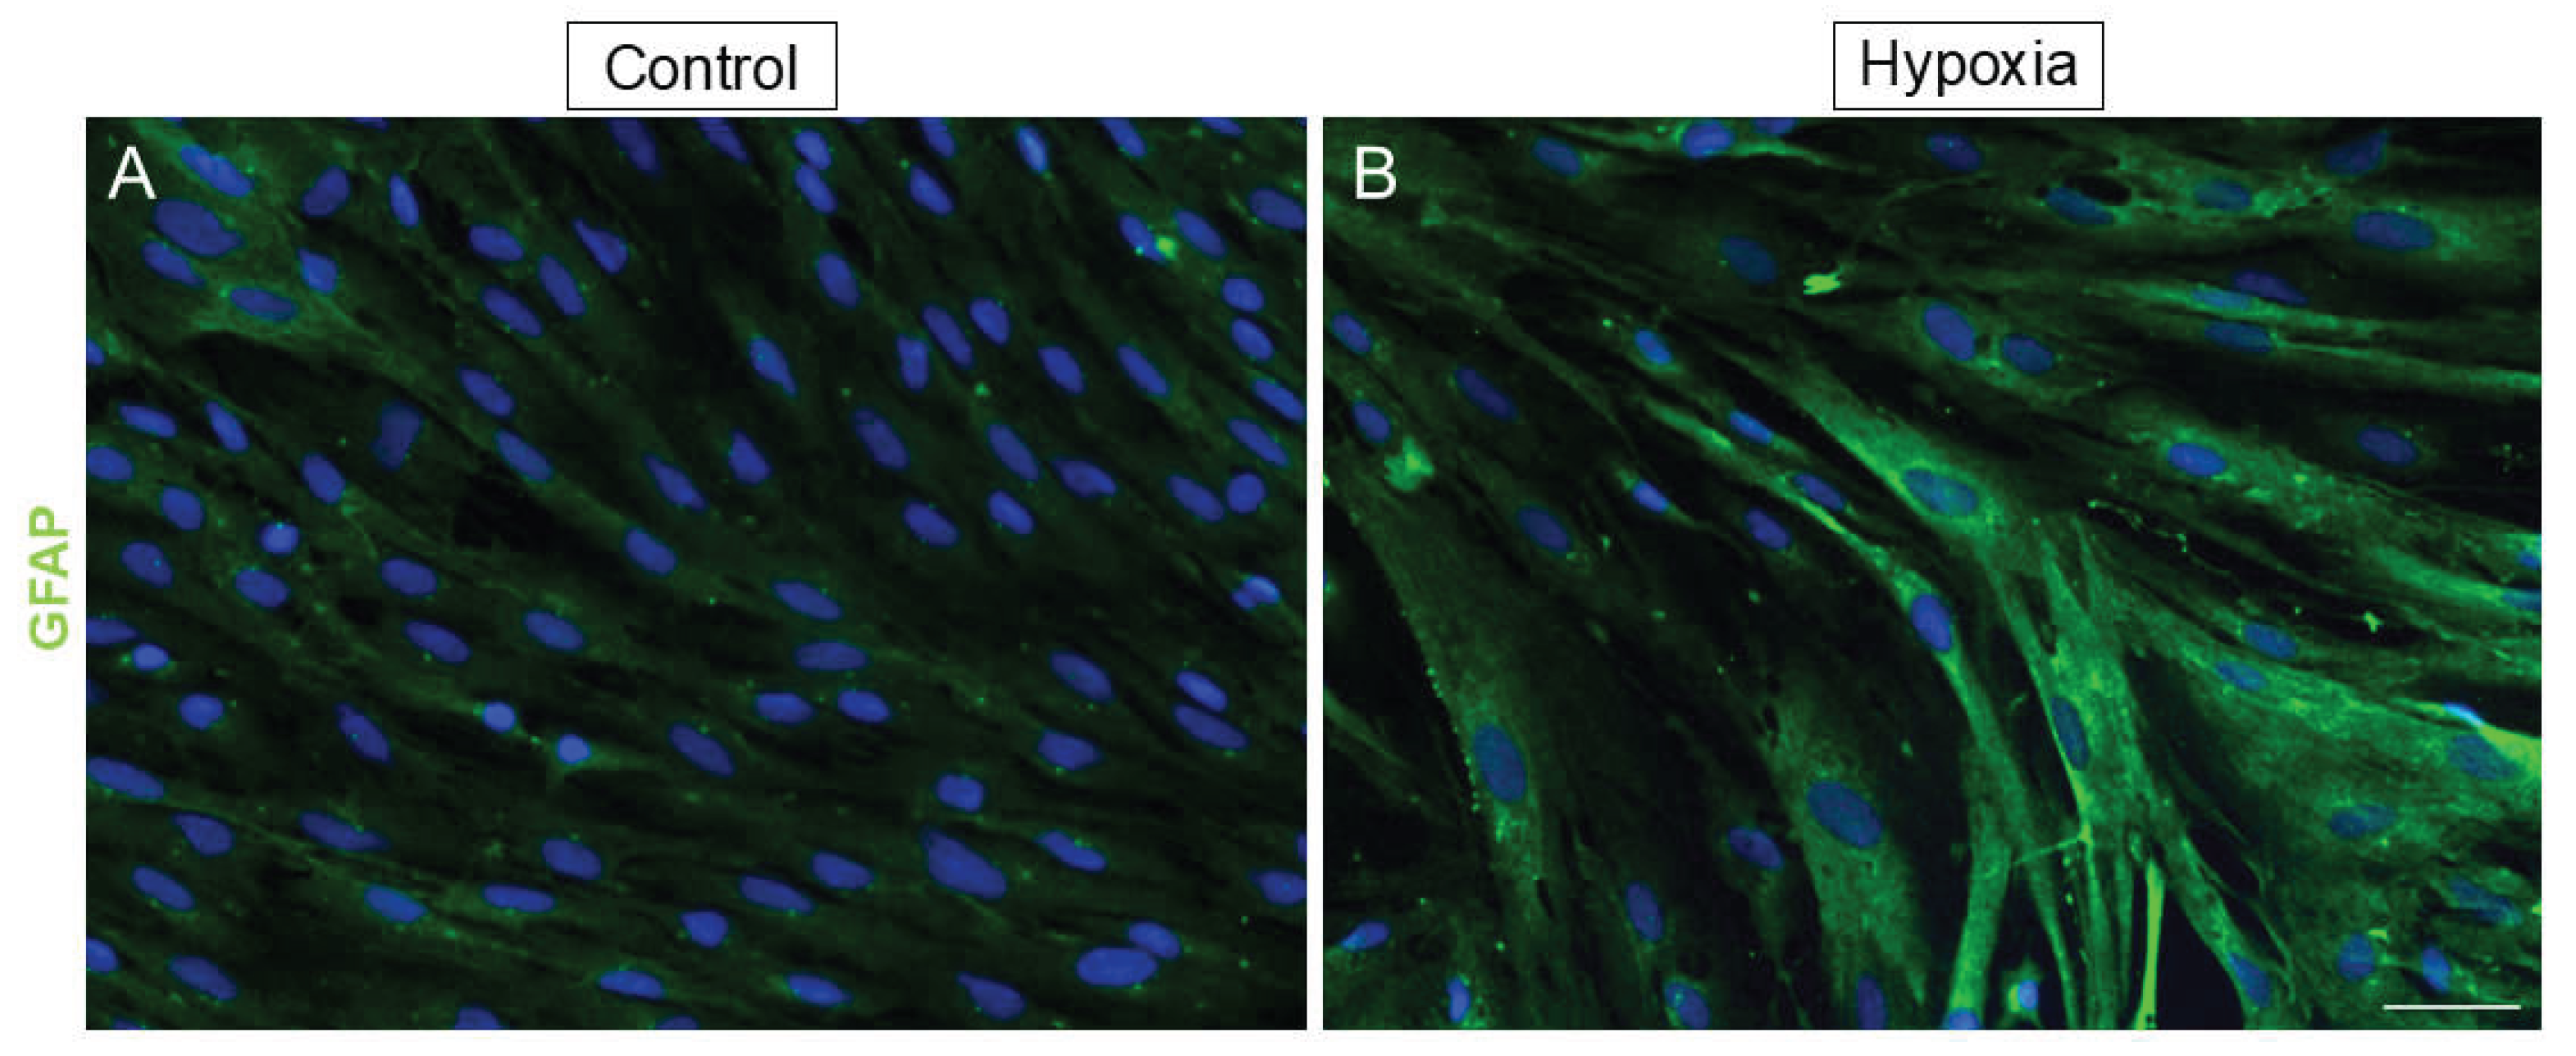
Figure 6.
Analysis of MG proliferation through Ki-67 expression. Images of a MG culture taken under control (A) and hypoxia (B) conditions in which the expression of Ki-67 (red) and vimentin (green) is observed. A significant decrease in the percentage of cells expressing Ki-67 is observed under hypoxic conditions compared to the control (C). Nuclei were labelled with DAPI (blue). *p-value ≤ 0.05. Scale bar = 50µm.
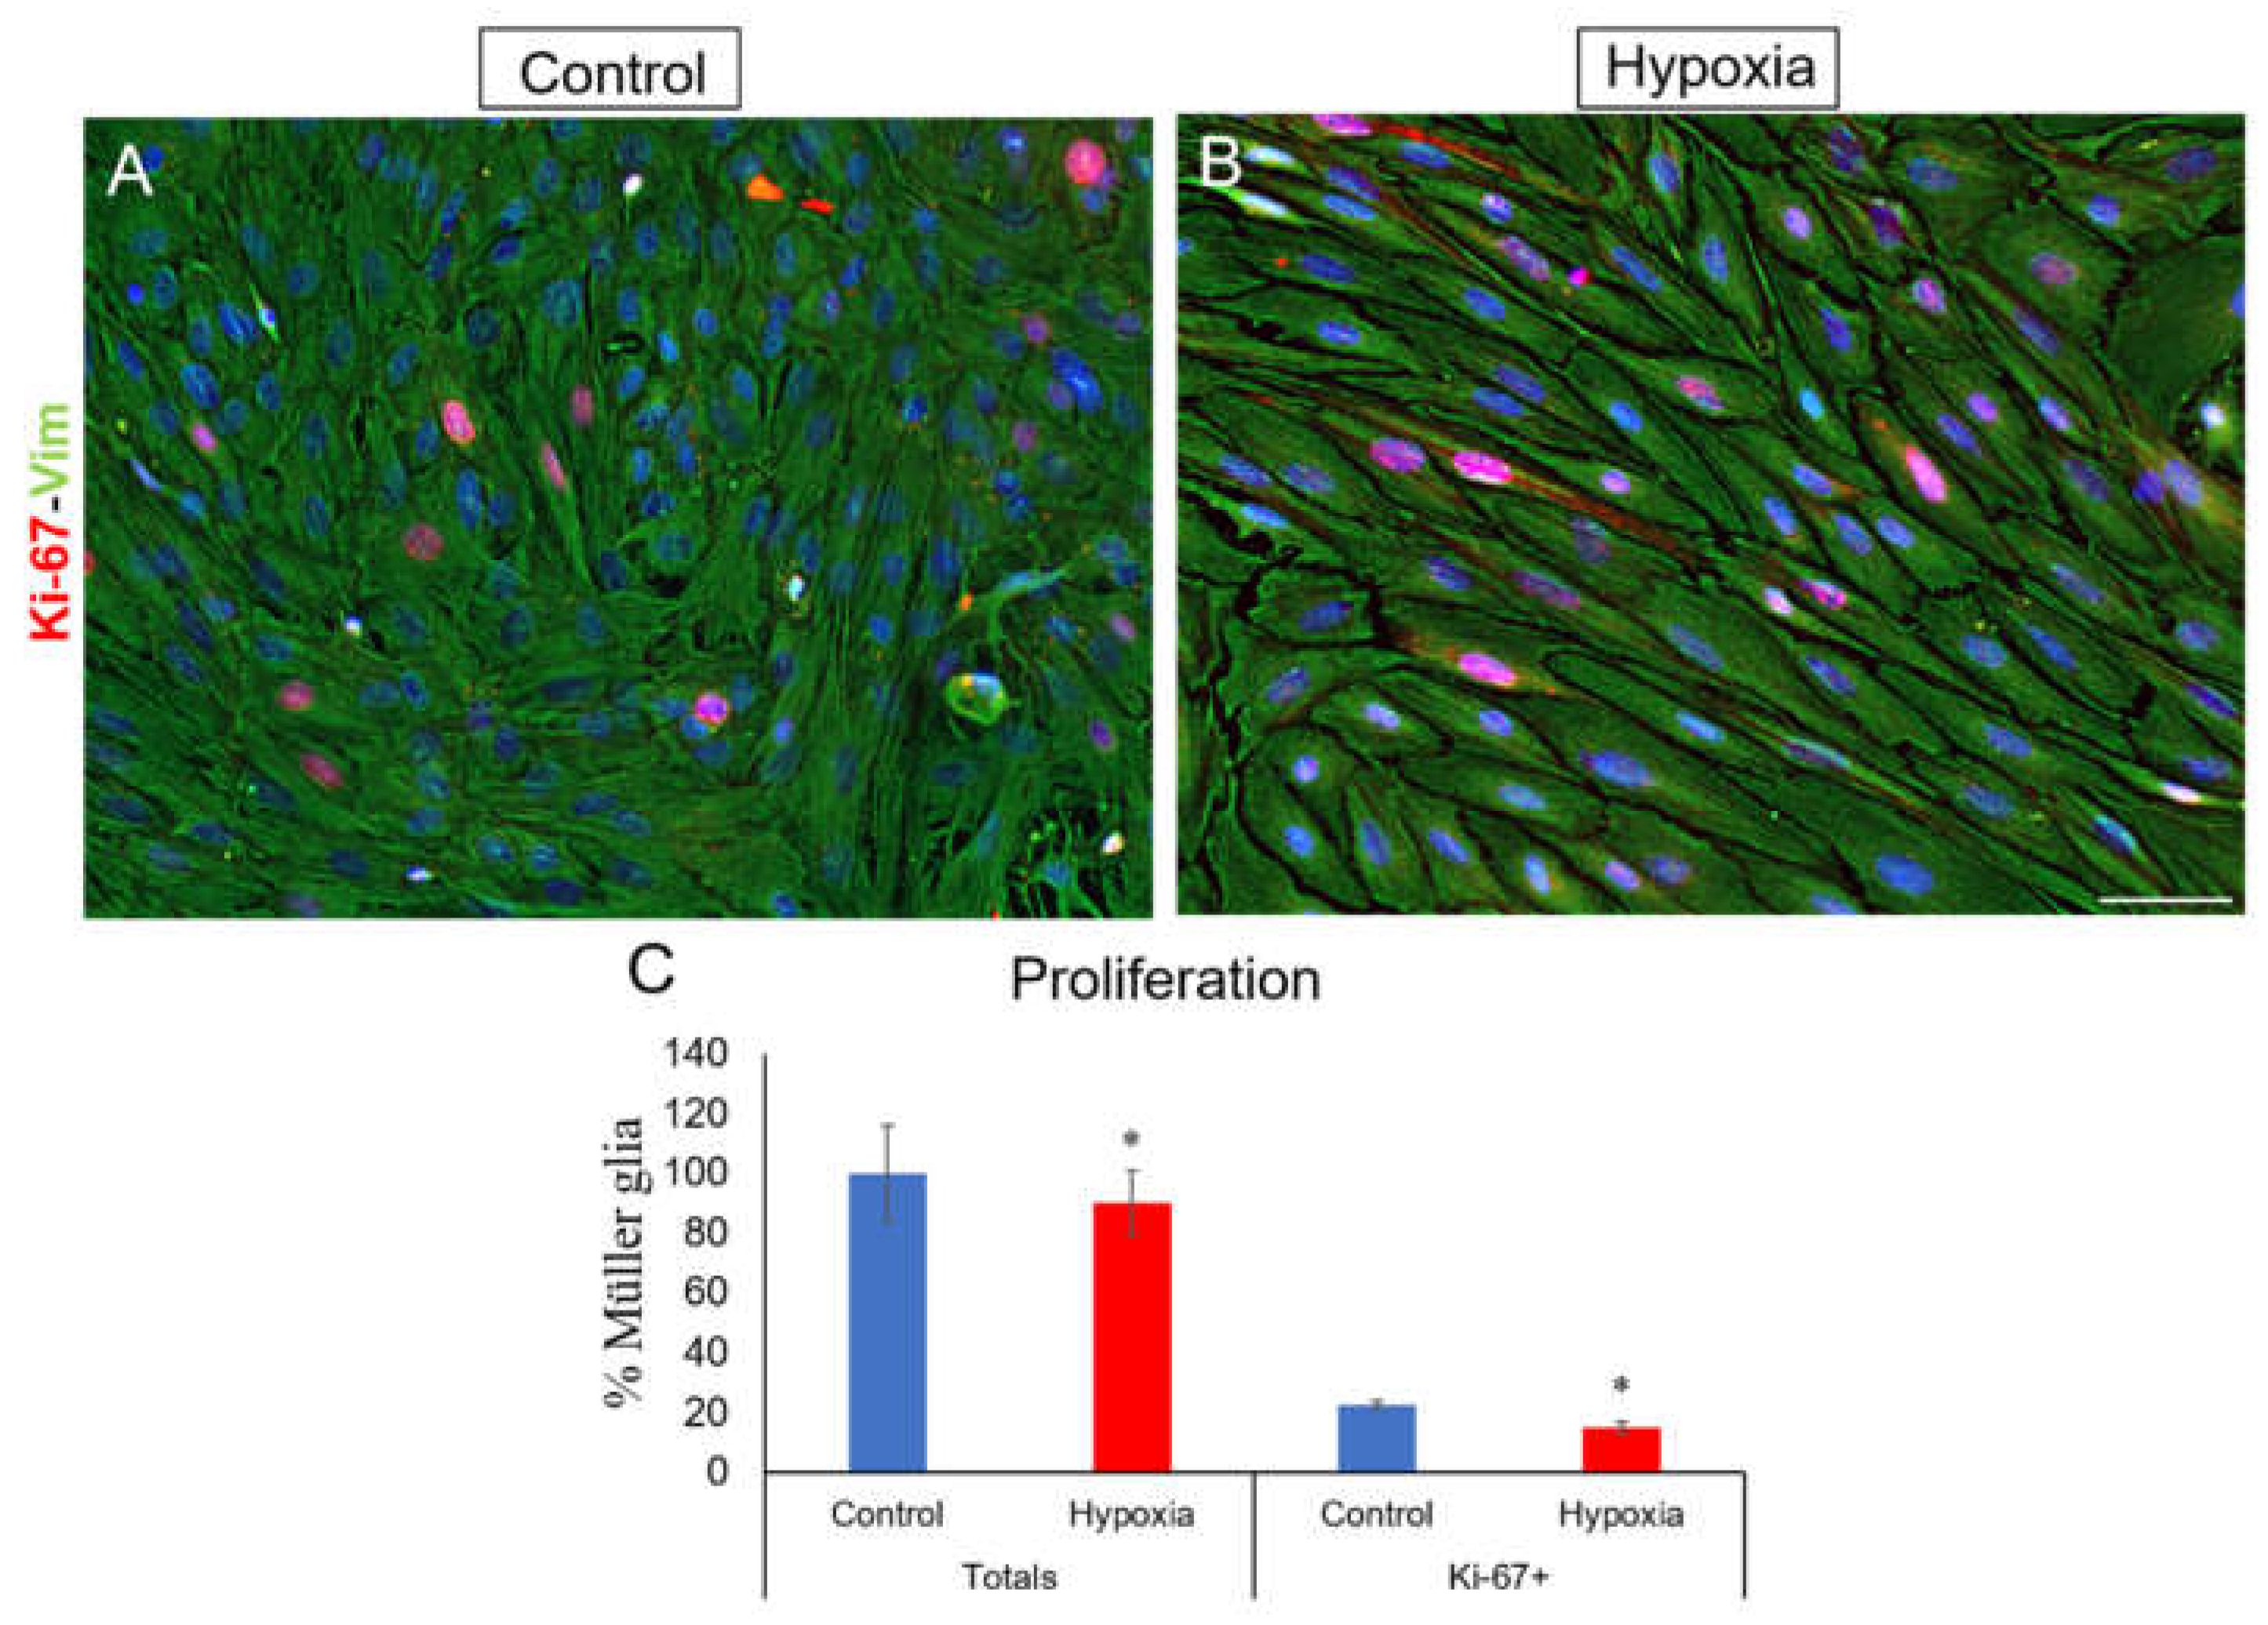
Figure 7.
Analysis of mitochondria from MG by VDAC1 labelling. Images of a MG culture taken under control (A) and hypoxia (B) conditions in which mitochondria labelled with the anti-VDAC1 antibody (red) and vimentin (green) are observed. A significant increase in the number of mitochondria is observed under hypoxic conditions (C). A significant increase in the number of mitochondria per µm2 cell is also observed for the same cell area (D,E). Therefore, it is observed that the number of mitochondria labelled with the anti-VDAC1 antibody increases significantly in hypoxic conditions compared to the control. Nuclei were labelled with DAPI (blue). *p-value ≤ 0.05. Scale bar = 50µm.
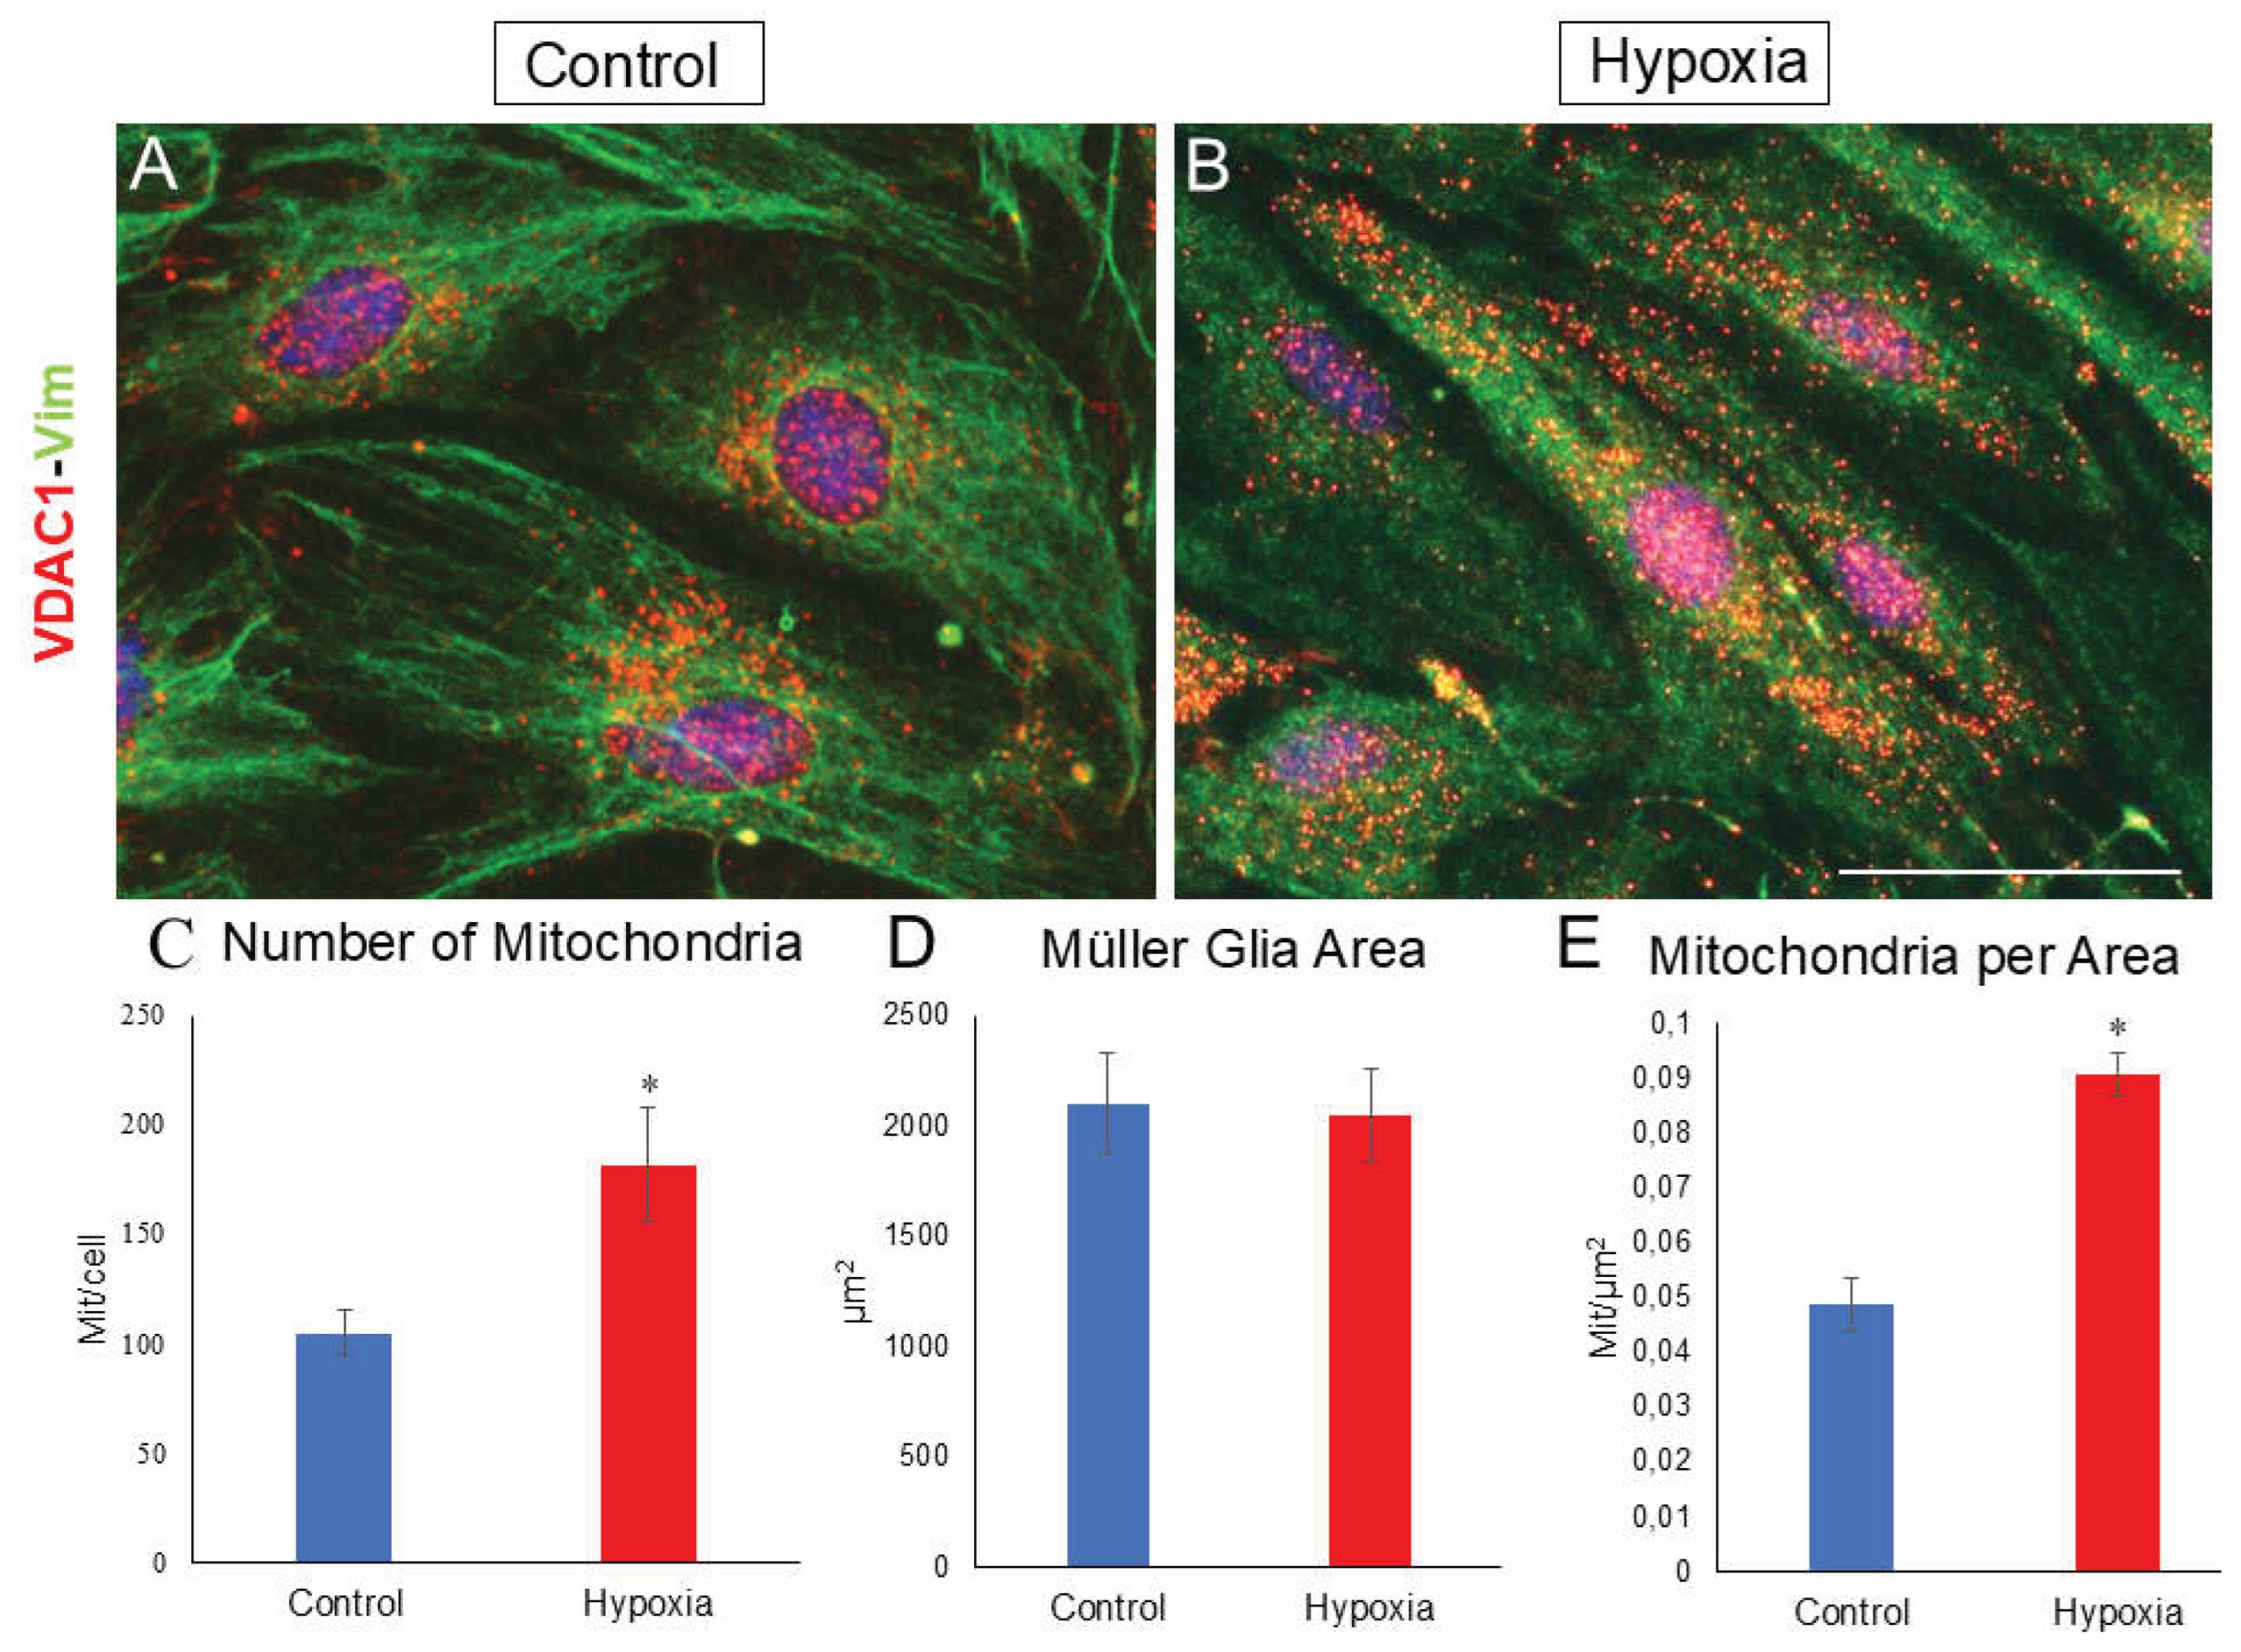

Table 1.
Primary antibodies and the concentration they were used at.
| Antigen | Host | Supplier (Ref) | Concentration |
|---|---|---|---|
| HIF-1α | Mouse | Santa Cruz Biotechnologies (sc-13515) | 1:50 |
| Vimentin | Mouse | Dako (M0725) | 1:1000 |
| Vimentin | Rabbit | Abcam (ab92547) | 1:2000 |
| Glutamine synthetase | Mouse | Abcam (ab64613) | 1:1000 |
| CRALBP | Rabbit | Abcam (ab154898) | 1:1000 |
| Caspase 3 | Rabbit | Cell Signalling (#9661) | 1:10000 |
| GFAP | Mouse | Sigma (G3893) | 1:1000 |
| GFAP | Rabbit | Sigma-Aldrich (G9269) | 1:1000 |
| Ki-67 | Rabbit | Santa Cruz Biotechnologies (sc-23900) | 1:200 |
| VDAC1 | Rabbit | Abcam (ab15895) | 1:200 |
Disclaimer/Publisher’s Note: The statements, opinions and data contained in all publications are solely those of the individual author(s) and contributor(s) and not of MDPI and/or the editor(s). MDPI and/or the editor(s) disclaim responsibility for any injury to people or property resulting from any ideas, methods, instructions or products referred to in the content. |
© 2025 by the authors. Licensee MDPI, Basel, Switzerland. This article is an open access article distributed under the terms and conditions of the Creative Commons Attribution (CC BY) license (http://creativecommons.org/licenses/by/4.0/).
Copyright: This open access article is published under a Creative Commons CC BY 4.0 license, which permit the free download, distribution, and reuse, provided that the author and preprint are cited in any reuse.


