
Submitted:
09 June 2025
Posted:
10 June 2025
You are already at the latest version
Abstract
Smart grid (SG) is increasing in size and complexity with the integration of communication, protection, and other innovative technologies. However, this integration has made SG vulnerable to various new cyber threats, particularly false data injection attacks (FDIAs) and Denial of Service (DoS) attacks. FDIA can deceive the grid operator by subtly corrupting measurement data and misleading control decisions without being detected by the conventional bad data detection (BDD) methods of the state estimation (SE) technique. In contrast, DoS attacks disrupt the availability of critical measurements to mislead control decisions and undermine grid observability. The accurate real-time detection and localization of FDIA and FDIA in the presence of DoS attacks are paramount for maintaining grid reliability and efficiency. This paper presents a novel deep learning-based approach that combines a CNN and a Bi-LSTM-based model for detecting FDIAs, along with a Random Forest(RF)-based model for localizing them. The hybrid CNN and Bi-LSTM method captures both temporal patterns and spatial correlations by learning from historical measurements and employs a threshold-based detection mechanism to detect FDIAs. Meanwhile, the RF maps complex patterns in the forecast error to the corresponding compromised sensor locations, in the process aiding or acting as a replacement for Bad Data Detection (BDD) mechanisms. Unlike a conventional SE technique, this approach is data-driven and does not rely on detailed knowledge of the grid topology. Tests on IEEE benchmark systems show that our method achieves high accuracy and row accuracy (RACC) in identifying attacks and pinpointing affected areas, even under conditions of partial observability caused by DoS. Moreover, comparative analysis with existing deep learning models demonstrates that the proposed approach achieves superior performance over current state-of-the-art methods reported in the literature. The results underscore the potential of the proposed method for improving cybersecurity and situational awareness in SGs.
Keywords:
Smart Grid
; FDIA-DoS
; CNN-Bi-LSTM-RF
; Detection
; Localization
; State Estimation
1. Introduction
The transition from conventional power grids to smart grids, often referred to as the next generation of the power grid, has been driven by the integration of Information and Communication Technologies (ICTs). [1]. This evolution has fostered an automated energy delivery network with bidirectional energy and information flow, distributed generation, self-healing, and pervasive control [2]. The bidirectional information flow has led to the availability of big data in SG. Although it has nurtured real-time monitoring of the SG via Supervisory Control and Data Acquisition (SCADA) systems, increasing the reliability and efficiency of the grid, it has made the SG vulnerable to various cyber threats. SCADA periodically scans the voltage, active power, reactive power, and system topology at a rate of 2 to 10 seconds to monitor the SG [3]. These measurements are also fed to the state estimator for state estimation (SE), which estimates the unknown state variable in SG. The estimated states play a vital role in various Energy Management System (EMS) applications such as optimal power flow, economic dispatch, and security assessment [4]. The state estimator also includes the bad data detector, which acts as a defense layer against cyber attacks. Despite these protections, the SG remains susceptible to multiple classes of cyber attacks, particularly those that compromise data integrity and availability, such as False Data Injection Attacks (FDIAs) and Denial of Service (DoS) attacks.
In recent years, several cyber attacks have reportedly targeted the smart grid [5]. As the energy sector is a critical infrastructure, disruption of SG operations has severe economic consequences. In the worst case, it can initiate a chain of events that results in the collapse of the grid. Cyberattacks in SG generally fall into three main categories: component-wise attacks, which target individual devices or systems; protocol-wise attacks, which exploit vulnerabilities in communication protocols; and topology-wise attacks, which exploit vulnerabilities in network topology[6]. FDIA is a prevalent and severe cybersecurity threat in SG [7]. FDIA aims to compromise the state estimation of SG by introducing malicious data into meter readings. Although a random uncoordinated data injection attack is immediately flagged by BDD, the careful crafting of the injected measurements can bypass the conventional BDD of SE [8,9]. The attacker can perform FDIA and bypass BDD by modifying the values of a small set of sensors with limited knowledge of the grid topology[10]. This stealthy FDIA results in incorrect state prediction and leads to the imbalance of generation and load, ultimately causing a system to collapse. On the other hand, DoS attacks disrupt the availability of the sensor’s measurement, leading to partial observability of the grid [11]. When launched in tandem with FDIAs, DoS attacks reduce redundancy in the measurement set, making it more difficult to detect stealthy data manipulation.
FDIA poses a significant threat to SG, and its detection and mitigation have been the focus of substantial research studies. FDIA detection approaches can be grouped primarily into model-based and data-driven approaches. The model-based approach requires the complete topological information and its mathematical formulation to estimate the states for BDD. In [12], the author developed a Euclidean detector and Kalman filter estimator for FDIA. A chi-square test was suggested in [13] for FDIA detection. Although model-based approaches offers real-time FDIA detection with less computational burden, their dependencies on precise mathematical formulation cause various uncertainties and disturbances[14]. Recently, data-driven approaches have gained traction in the detection of FDIA due to their lack of dependency on system topology information. The data-driven approach learns from historical measurements and employs the classification- or threshold-based approach to detect FDIA [15]. In addition to FDIA detection, the localization of the FDIA attack is instrumental in quickly isolating the compromised sensor and ensuring grid stability and reliability. Various studies have followed the multi-label classification approach to accurately predict FDIA locations [16].
In this paper, an online FDIA detection is proposed using a hybrid model that combines Convolutional Neural Networks (CNN) and bidirectional Long Short Term Memory (Bi-LSTM). The proposed model processes input in parallel by feeding data into separate CNN and Bi-LSTM blocks, leveraging their strengths in handling temporal patterns and sequential dependencies. The hybrid parallel CNN-Bi-LSTM is used to forecast the measurements of the next timestep by learning from a historical dataset. An appropriate threshold is carefully chosen to detect the presence of FDIA. Moreover, a Random Forest (RF) is used to detect the location of the FDIA-poisoned sensors by training on the error between the forecasted and actual measurements. The proposed framework is also extended to operate under DoS scenarios to allow continued operation of the localization module. Our main contributions are as follows.
- A novel data-driven CNN and Bi-LSTM-based model in conjunction with RF is introduced to detect and localize FDIA attacks in SG. To the best of our knowledge, this study is the first to utilize the proposed architecture in this particular research field.
- The proposed approach is universally applicable and does not rely on statistical assumptions about the system parameters and attack model.
- The comparative analysis of our proposed model and other existing models for FDIA detection and localization, reported in various literature, is done to showcase the effectiveness of our proposed model in the IEEE 14 bus and IEEE 30 bus test systems.
- The framework is evaluated under standard FDIA conditions and scenarios where FDIA is combined with DoS attacks, demonstrating its robustness under partial observability. This work is among the few studies that jointly investigate the impact of FDIA and DoS in a unified detection and localization framework.
The remainder of the article is organized as follows. Section 2 provides a comprehensive review of the existing literature. The preliminary information is discussed in detail in Section 3. The framework and architecture of the proposed model are presented in Section 4. The performance of the proposed approach for various scenarios is described in Section 5. Finally, the paper is concluded in Section 6.
2. Related Works
The recent advancement in Artificial Intelligence has encouraged the adoption of various machine learning (ML) and deep learning (DL) techniques to estimate the state, detect, and localize FDIA. This section contains a brief summary of the related works. The authors in [17] investigated the viability of the Feed Forward Neural Networks (FFNNs) and LSTM to estimate the state of the IEEE 14 bus and IEEE 118 bus. The author concluded that the LSTM is superior to FFNNs, WLS, and WLAV against FDIA-poisoned data. A stacked ResNetD method was proposed as an alternative to the state estimator in [18]. The stacked ResNetD outperformed the MLP, CNN, and ProlNet DL techniques to predict the states of the various IEEE benchmarks. In [19], the author proposed exponential GPR over medium Gaussian SVM and fine Gaussian SVM for state estimation using data-driven techniques. However, these studies lacked the implementation of BDD to detect FDIA. In [20], the principal component analysis (PCA) is used to set the optimal threshold of 2.98e-5 to detect the FDIA in the IEEE 118 bus. They reported that PCA is better at detecting BDD than SVM. The authors in [21] concluded that the Stacked Auto Encoder (SAE) was superior to SVM by detecting the 11 anomaly states in contrast to the six anomaly states in several IEEE benchmarks. Although the above approaches are superior to the support vector machine (SVM) technique, their performance is not compared with various DL models. In [22], the author has utilized the hybrid Transformer and LSTM-based architecture to detect and localize the FDIA for hourly and minute data from the IEEE 14 bus system. The proposed model uses the threshold to detect FDIA, but it suffers from the problem of low RACC. The author proposed a Maximum A Posteriori (MAP) approach using sparsity priors to estimate the attack vector, and the likelihood of the data being normal or under FDIA is modeled using a Gaussian Mixture Model (GMM) in [23]. However, this algorithm is iterative and alternates between MAP and GMM steps in an Expectation-Maximization-like fashion for localization, which is computationally burdensome.
In the last decade, the localization of FDIA has been framed as a multilabel classification problem. The multilabel classification approach enables each feature to have its own binary or categorical labels, where each label is independent. One of the earliest works includes multilabel classification using CNN [16]. A CNN-based FDIA location detection algorithm was proposed as a complementary technology to BDD, compared to MLP and LightGBM. The author concluded that CNN is more accurate and scalable by comparing its performance in the IEEE 14 and IEEE 118 buses. In [24], the author reinforced the superior performance of CNN but concluded that the Exiting Mechanism and Mixed-Precision Quantization (EE-MPQ) is time efficient for the evaluation of IEEE 14 and 118 bus systems. The author proposed a hybrid SVM and CNN-based architecture [25], where SVM merges the spatiotemporal CNN’s output. They applied Gradient-weighted Class Activation mapping (Grad-CAM) for better localization and interpretability. However, they pointed out its drawbacks in detecting new zero-day attacks. In [26], the author proposed a spatio-temporal sequence analysis by combining outputs of the Gated Temporal Convolutional Network (GTCN) and the GCN to localize the attack in a Renewable Energy (RE) rich grid. The author investigated the spectral Graphical Neural Network (GNN) using Auto-Regressive Moving Average (ARMA) filters to locate the FDIA across IEEE 57-, 118-, and 300-bus systems [27]. The author in [28] proposed the Recursive Variational Graph Autoencoder (ReVGAE), which uses a Graph Convolutional Network (GCN) as an encoder and decoder to reconstruct data and topology, and denoising. The evaluation of ReVGAE on the IEEE 14 bus generated the ROC-AUC curve of 0.9667. In [29], FDIA is localized by constructing a causality graph assuming that FDIA disrupts the expected causal links. A Graph Attention Network learns attention-weighted node embeddings to highlight suspicious measurements, but this method is very sensitive to noise and non-stationary conditions. In the aforementioned algorithms, topology information was the prerequisite to locate the attacks.
In addition to standalone FDIA, few recent studies have investigated the combined impact of Denial-of-Service (DoS) and False Data Injection Attacks (FDIA), representing a more realistic and dangerous threat model in smart grids. These hybrid attacks aim to degrade the system’s observability by blocking sensor data while simultaneously injecting malicious measurements and confusing detection mechanisms. The authors in [30] proposed a sliding mode observer to co-estimate states and FDI attacks in multi-area load frequency control systems, where they introduced an attack compensation controller to mitigate hybrid attack impacts. Similarly, the study in [31] designed a resilient observer-based controller for stochastic systems to maintain performance under coordinated DoS and FDIA attacks using a Markov jump framework. In the context of DC microgrids, [32] presented a fuzzy switching-type estimator and compensator, while [33] incorporated event-triggered mechanisms to minimize communication overhead during hybrid attack mitigation. A distributed approach was employed in [34] to jointly estimate system states and attacks under multiple adversarial strategies without centralized control. Despite their strengths, most of these methods focus on either control, with limited work tackling the detection and localization of FDIA during DoS-induced observability loss. In [35], the authors employed an attention-enhanced Temporal Convolutional Denoising Autoencoder (TCDAE) combined with an MLP to detect and reconstruct FDIA under combined DoS and FDIA conditions. In contrast, [36] proposed a Graph-based TCDAE model to handle missing data, identify network topology, and localize FDIA simultaneously. Both works focus on distributed networks, and they did not explicitly consider Row Accuracy (RACC), which is critical for evaluating localization reliability in multi-label settings, as a model may exhibit high overall accuracy despite poor localization performance. This broader gap is addressed by our proposed CNN–BiLSTM–RF framework, which is tailored for transmission networks and explicitly accounts for key performance metrics such as RACC, enabling robust and scalable FDIA detection and localization during limited sensor visibility.
In SG, the measurement of each sensor exhibits both spatial and temporal correlations due to the interdependence among sensors and the time-varying nature of load dynamics. While CNN effectively captures spatial patterns and local dependencies across correlated measurements, Bi-LSTM networks are more suitable for capturing temporal dependencies. By training on historical data, the CNN and Bi-LSTM hybrid model leverages both spatial and temporal features, enabling robust detection and localization of stealthy FDIAs under complete and partial observability, as demonstrated by our experimental results.
3. Preliminaries
3.1. State Estimation
SE is the process of determining the unknown states of the grids from the known variables or measurements collected from existing sensors [37]. SE can be framed as an unconstrained optimization problem, where the power flow equations are used to relate the measurement vector[38]. The SG can be analyzed using either AC power or DC power flow analysis. In an AC power flow analysis, the magnitude and angles of voltage and/or currents are used, as opposed to the DC power flow analysis, where the voltage magnitude is assumed to be constant and only voltage phase angles of the buses are considered [39]. AC power flow analysis is a more accurate representation of today’s SG, but it is computationally heavy and raises the issue of nonlinearity [22]. In contrast, DC power flow analysis is simple and commonly used for real-time operations, so we have considered the DC linearized state estimation method for power flow analysis with buses and t transmission lines. Equation (1) shows the relationship between the state vector and the measurement vector.
Here, is the measurement vector, is the state vector, is the nonlinear measurement function that relates the state and the measurement vector, and e is the Gaussian noise of shape . For the linearized DC power flow assumption, the equation modifies to:
Here, represents the Jacobian matrix and . The solution to Equation (2) can be found using Equation (3).
Here, is the state vector when e has a zero mean distribution, and W is the diagonal matrix. For the zero-mean distribution of e, is the measurement estimate. The conventional SE detects malicious data injection with the help of BDD techniques. In a BDD, the residual (R) between the state estimates and the observed measurement vector is compared with predefined thresholds to determine bad data, as shown in Equation (4).
Bad data occurs mainly due to measurement errors such as meter biases, faulty connections, incorrect topology information, and unforeseen noise [40]. These errors do not follow an expected Gaussian distribution, generating a larger error than the threshold, which BDD immediately flags.
3.2. False Data Injection Attack
FDIA is designed to bypass BDD by adding erroneous data to the actual measurements, resulting in a change in the state variable of the system [41]. If a is the injected measurement such that where , the observed measurement vector is denoted by Equation (5).
The stealthy FDIA occurs if the residual of the modified measurement vectors is equal to the residual of the original measurement vectors, as shown in Equation (6). For stealthy FDIA, the attacker can craft the injected measurement with complete or partial knowledge of the H matrix using min-cut methods [42].
3.3. DoS
DoS attack disrupts the availability of the sensor measurements by overwhelming or blocking access to the sensor. The DoS attack can be induced by network flooding, jamming attack, protocol exploitation, and physical isolation of sensors. Let represent the system measurement vector at time t, where N is the total number of sensors. A binary mask vector is defined such that:
The observed measurement vector in the presence of a DoS attack will be:
Here, ⊙ denotes element-wise multiplication. The binary mask effectively zeros out the measurements from the sensors under attack, simulating the effect of a DoS event.
3.4. CNN
CNN was initially proposed for large-scale image processing [43], but is as effective for analyzing time-series data due to its ability to extract local patterns. Since power system measurements are multivariate sequential data, 1D CNN is mostly used in SG applications. In 1D CNN, the input consists of a sequence with n timesteps, where each timestep contains multiple features. The model applies a set of 1D convolutional filters with a predefined window size, sliding over the input sequence at fixed strides. Each convolutional layer is typically followed by batch normalization and a nonlinear transformation using the Rectified Linear Unit (ReLU) activation function. This process generates feature maps that capture local patterns across multiple timesteps and all features. If the network includes L convolutional layers, the first convolution operation applied to the multivariate input sequence z can be mathematically represented as Equation (7) [16].
Here is the output feature map of the first convolutional layer, is the j-th kernel, and is the bias added to the output, and * represents theconvolution operation. Rectified Linear Unit (ReLU) is the activation function adopted to encode the nonlinearity associated with the input kernels. The output after the Pth convolutional layer is as follows.
The batch normalization operation is performed to stabilize and accelerate training by normalizing the intermediate feature maps. It rescales and recenters the data within each mini-batch to have zero mean and unit variance, followed by learnable shift and scale parameters to preserve representational capacity. The global average pooling operation is used to reduce each feature map to a single value by computing the average of all its activations. This down-sampling method preserves the spatially aggregated information while significantly reducing the number of parameters, thus mitigating overfitting. The structure of CNN is shown in Figure 1.
3.5. Bi-LSTM
Long Short-Term Memory (LSTM) networks were originally proposed to model long-range dependencies in sequential data by mitigating vanishing gradient issues [44]. Bidirectional LSTM (BiLSTM) extends the standard LSTM by processing the input sequence in both forward and backward directions, allowing the model to capture context from past and future timesteps [45]. Since power system measurements are temporal and multivariate in nature, BiLSTM has enormous potential in Smart Grid (SG) applications for sequence modeling. To completely comprehend Bi-LSTM, we must first understand the fundamentals of the LSTM architecture. LSTMs extend standard RNNs by introducing a memory cell mechanism that captures long-term dependencies in sequential data. This is achieved through gating mechanisms, including the forget, input, and output gates. The forget gate determines which part of the past memory should be discarded, the input gate regulates the addition of new information, and the output gate controls what information is passed to the next hidden state. The cell state is updated by combining the retained memory and the new candidate values. At each time step t, the LSTM cell takes the input , the previous hidden state , and the previous cell state . The memory cell and hidden state are updated using Equations (9) and (10), respectively [46]:
Each gate is computed as follows:
Here, , , , and are the input gate, forget gate, input node, and output gate, respectively. , , , and denote the weight matrices corresponding to the respective inputs and hidden states of the network’s activation functions. The operator ’.’ indicates element-wise multiplication. The function represents the sigmoid activation, while denotes the hyperbolic tangent (tanh) function. The structure of a single LSTM block is shown in Figure 2.
The BiLSTM consists of two independent LSTM layers that process the input sequence in forward and backward directions. In a BiLSTM network, the input consists of a sequence with n timesteps, where each timestep contains multiple features. The forward LSTM processes the sequence from to n, while the backward LSTM processes it from to 1. The outputs from both directions are concatenated at each timestep to form the final hidden-state representation. This structure enables the model to learn temporal dependencies in both directions, improving performance in forecasting, anomaly detection, and event classification tasks. The structure of the Bi-LSTM block is shown in Figure 3.
At each time step t, the forward LSTM computes the hidden state based on the previous forward hidden state and the current input , while the backward LSTM computes the hidden state based on the subsequent backward hidden state and the same input . Although the parameters of the forward and backward LSTM are independent, both directions share the same input embedding sequence as shown in Equations (17) and (18).
The final hidden state of the BiLSTM at timestep t is obtained by concatenating the hidden states from both directions as shown in equations below.
3.6. RF
A random forest, a supervised ML technique, consists of multiple decision trees , where trees, a unique independent vector , and a dataset of N instances. Each tree is constructed with bootstrap samples. Bootstrap Aggregation is a sampling technique in which multiple datasets are generated by random sampling and replacing samples from the original dataset until the sampled size equals the original dataset size [47]. If there are M features, m features are randomly selected at each node, but the value of m is consistent for all trees in the forest. The division of the node is based on the Gini impurity, as shown in the equations below. The trees grow to the maximum depth unless they are constrained by node size, which controls a minimum number of samples in a leaf node or the minimum samples per leaf. The split continues until the node is pure, and the final output is obtained by averaging the output of each tree for regression or majority voting across all trees for classification.
Here, is the Gini index before the split, , d is the total sample that exists in the D datasets, is the Gini index after the split, and and are the subsets of D. The schematic diagram of the random forest is shown in Figure 4.
4. Methodology
This section provides details on the FDIA detection and localization scheme. In addition, it outlines the proposed hybrid ML architecture.
4.1. Proposed FDIA Detection and Localization Scheme
The FDIA detection using ML techniques is commonly framed as a binary classification task, in which the labels can be either 0 or 1. An alternative to the binary classification approach is to implement threshold-based detection using ML techniques. In our proposed approach, we train a hybrid ML-based forecasting module on historical measurements offline. The forecasting module is trained only on normal data to forecast the variables for the next time steps, and a threshold is extracted for BDD based on the forecast outputs, as shown in Equation (22).
Here, is the error between the Nth forecast variable and the corresponding observed variable. The E represents the Euclidean norm of a vector E between the forecasted and observed variables. For the detection of FDIA in the first stage, the Euclidean norm of observed variables is compared with the threshold to detect FDIA. The threshold-based approach is used as the first stage of detection and is widely reported in various literature [20,22]. The FDIA localization using ML techniques is framed as a multilabel task. In this approach, each label is independent of the others and can have binary or categorical labels [49]. The multilabel classification is data-driven and does not require any information on grid topology or Jacobian matrix H. In our proposed approach, the error between the forecast and the observed input is fed to another ML classifier to identify whether the variable from each sensor is under attack. In the presence of a DoS attack, the sensor is out of operation and does not report any measurements. In such a scenario, the forecast output is considered as an observed output for the corresponding sensors under attack. The modified variables are fed to the Bad Data Detector to evaluate the presence of FDIA. In addition, these outputs are fed to the location detection module or multilabel classifier to localize the FDIA. This evaluation of the observed data, regardless of the triggering of BDD, creates redundancy and enhances the detection and localization of the FDIA. In the presence of FDIA, the FDIA alarm, normal variables, and forecast variables are sent to SCADA, allowing the grid operator to make an informed decision. The flow chart of the proposed scheme is shown in Figure 5.
4.2. Proposed ML Architecture
1D CNN has been widely used in various literature due to its better performance in the time-series classification task [50,51]. On the other hand, Bi-LSTM has been found to be effective in Natural Language Processing [52] and anomaly detection tasks [53,54]. The CNN-Bi-LSTM architecture proposed for forecasting variables for the next time step is shown in Figure 6. The proposed architecture consists of a 1D-CNN in parallel with a 1-layer Bi-LSTM network. The CNN layer is followed by batch normalization, ReLU activation, and Global Average pooling, while the Bi-LSTM layer is followed by the Dropout layer. The output of both dropout and global pooling is concatenated and fed to the dense layer. Batch normalization speeds up the training and stabilizes learning by normalizing activations in each minibatch. The ReLU adds non-linearity to the model and prevents the vanishing gradient problem. Global Average pooling takes the average value from each feature map and reduces its dimensionality in the process, reducing the parameters and preventing overfitting. The dropout layer prevents overfitting by randomly disabling some neurons during training. The proposed architecture demonstrated strong effectiveness for the forecasting task, as evident in the results section. The FDIA localization is done using RF. The input for the RF is the error between the forecasted and observed measurements. The output of the RF is either 0 for normal measurement or 1 for FDIA.
4.3. Dataset
The energy sector is the critical infrastructure, and there is little to no publicly available dataset due to privacy and security concerns. The hourly dataset used in this paper was taken from [55], and the load profile for the dataset is taken from [56]. The dataset was generated using DC state estimation and made publicly available; however, our proposed framework for detection and localization is also applicable to AC state estimation. The normal dataset consists of 8760 samples along with 54 features for the IEEE 14 bus system. The Gaussian noise, up to 4% of the true value, was added to the normal measurement to mimic the presence of real-world noise. The dataset comprises 54 features, each corresponding to specific measurements within the IEEE 14-bus system. The initial 20 features capture the forward power flow across transmission lines, the subsequent 20 reflect the reverse flow on those same lines, and the remaining 14 features represent the power consumption at each of the 14 buses. This study employs an attack vector dataset originally presented in [57]. In addition, the attack vectors in the dataset were scaled further by 1/2, 1/4, and 1/8 to generate more stealthier attacks. For and , where , is also a valid stealthy attack vector. Figure 7 presents the sensor measurements at a randomly selected timestep under different -scaled attack scenarios using the sparsest attack vector.
4.4. Training Procedure
The proposed FDIA detection framework consists of two key modules: a forecasting-based anomaly detection module and a location detection module. The forecasting module uses a hybrid 1D-CNN and Bi-LSTM architecture that exploits both spatial and temporal features in multivariate time-series measurements from the power grid.
The input to the forecasting module is a sequence of past system measurements over a fixed window of 48 hours, denoted by , where M is the total number of sensors. The CNN branch applies a one-dimensional convolutional layer with 128 filters, a kernel size of 3, and ‘same’ padding. The output undergoes batch normalization, followed by ReLU activation and global average pooling. In parallel, the BiLSTM branch contains 128 units and is followed by a dropout layer with a dropout rate of 0.2 to prevent overfitting. The outputs from both branches are concatenated and passed through a dense layer of 128 ReLU-activated neurons before finally projecting onto an output layer of size M, providing the forecasted sensor values for the next hour. The model is trained using the Adam optimizer with a learning rate of , a batch size of 32, and a validation split of 10%. Early stopping is applied with a patience of 10 epochs to prevent overfitting.
Formally, let denote the predicted sensor measurements and represent the actual observed measurements. The forecasting error is calculated as . The L2-norm of the error vector is then computed using Equation (17). Anomaly detection is performed by comparing this norm with a dynamic threshold , determined using the 100th percentile of L2-norm values under benign (non-attacked) conditions, with a safety margin . If , the sample is flagged as anomalous, indicating the likely presence of an FDIA.
To localize the compromised sensors, the error vector is passed to a Random Forest (RF)-based multilabel classifier. Each sensor is associated with a binary output , where 1 indicates that the sensor is under attack. The RF classifier is trained using a one-vs-rest strategy, where the ground truth label vector indicates the attack status of each sensor. The Random Forest consists of 100 estimators per sensor-specific classifier, each trained independently on the forecast error features. During testing, the model outputs a multilabel prediction , indicating the attack status per sensor.
For the CNN–Bi-LSTM forecasting module, the Mean Squared Error (MSE) loss is employed to minimize the difference between the predicted and actual sensor values over the training set. This regression loss function effectively penalizes large deviations and ensures accurate short-term forecasting. For the RF-based model, each sensor’s classifier is trained to minimize classification impurity (e.g., Gini index or entropy) using forecast error features as input.
4.5. Performance Evaluation Metrics
To comprehensively assess the effectiveness of the False Data Injection Attack (FDIA) detection framework, we employ a suite of both regression and classification metrics. These metrics evaluate the forecasting performance of the False Positive Detection Module (FPDM) and its ability to detect the presence and location of attacks accurately.
4.5.1. Forecasting Accuracy Metrics
The forecasting capability of the FPDM is quantified using three standard error metrics: Mean Absolute Error (MAE), Mean Squared Error (MSE), and Root Mean Squared Error (RMSE). Additionally, the Coefficient of Determination () is used to measure the proportion of variance in the true values that is predictable from the model’s outputs . Let and represent the actual and predicted values, respectively, and n denote the number of samples. The metrics are defined as follows:
4.5.2. Attack Detection Metrics
To evaluate the classification performance of the FPDM in detecting attack presence, we compute Accuracy, Precision, Recall, and F1-Score based on the confusion matrix components: True Positives (TP), False Positives (FP), True Negatives (TN), and False Negatives (FN). These quantities are defined as follows:
- TP: Number of correctly detected compromised samples
- FP: Number of benign samples incorrectly labeled as compromised
- TN: Number of correctly detected benign samples
- FN: Number of compromised samples incorrectly labeled as benign
The evaluation metrics are then given by:
4.5.3. Row-wise Accuracy (RACC)
In the context of multi-label attack localization, a stricter evaluation metric, RACC, is used [22]. This metric considers a prediction to be correct only if all sensor labels in a given row (sample) match exactly with the corresponding ground-truth labels. Let and denote the true and predicted binary vectors for the m sensors in the sample i, and n be the total number of samples. RACC is defined as:
Here, is the indicator function, which returns 1 if the prediction matches exactly and 0 otherwise.
5. Simulation Results
The systems considered in this study are the IEEE 14-bus and IEEE 30-bus test systems. For each scenario, the models were trained using an identical dataset comprising 7,992 samples. The final 720 samples, which were not seen during training, were reserved as the test dataset to evaluate model performance on unseen data.
5.1. Scenario 1: FDIA Detection and Location Module in IEEE 14 Bus System
In the first case, we investigated the performance of the proposed forecasting model for the IEEE 14 bus system. The generation of the dataset and the explanation of the attack vectors are described in detail in Section 4. We used a scaling factor of for the strength of the attack vectors. In the first stage of the proposed framework, we trained the novel hybrid CNN and Bi-LSTM-based ML model to forecast the system variables for the next timestep. Table 1 shows the performance of the proposed method compared to the state-of-the-art model for forecasting.
The proposed model outperformed the CNN, CNN-Transformer, CNN-LSTM, and Transformer-LSTM architectures reported in [22]. Although Bi-LSTM, CNN-based Autoencoder, and LSTM or Bi-LSTM-based decoder variants demonstrated improved performance, the proposed model achieved the highest forecasting accuracy overall. Figure 8 shows the comparison between actual and forecasted measurements for sensor 17 over the unseen test horizon to evaluate the temporal generalization capability of the proposed model. The close alignment between predicted and true values demonstrates the model’s ability to maintain forecasting accuracy for unseen test data. Figure 9 illustrates the comparison between the proposed model’s forecast and actual measurements at an 8030 timestep, with a zoomed-in view highlighting three consecutive sensors and their respective absolute errors. The threshold for FDIA detection was determined based on the forecasting error, as defined in Equation (22). Table 2 presents the performance comparison of various models using this thresholding approach.
Each model’s optimal threshold value was determined to maximize detection performance. For the proposed model, we added a 0.02 margin to the maximum L2 norm observed in benign samples to reduce the risk of false negatives. The proposed model achieved perfect precision, recall, and F1-score for the IEEE 14 bus system. This robustness makes it highly suitable for deployment in critical infrastructure environments for smaller transmission systems. The detection performance of the proposed model is further illustrated in Figure 10, which shows the L2 norm distribution of the normal and attacked test samples along with the selected detection threshold.
Following threshold-based FDIA detection, localization of the compromised sensors was performed using multi-label classification models, namely an MLP and a Random Forest. The input to these models consisted of the error vectors derived from the difference between forecasted and observed measurements, enabling sensor-level identification of tampered signals. Table 3 presents a comparative analysis between the proposed multi-label MLP model and a Random Forest (RF) classifier to evaluate their effectiveness in FDIA localization. Although time-series classification models were initially considered, their performance was significantly lower in accuracy. Moreover, due to the requirement for real-time inference, the problem was reframed as a multi-label classification task based on forecast error vectors. Consequently, we focus our analysis on the two best-performing models suited for rapid, sensor-level attack localization.
5.2. Scenario 2: FDIA detection and Location Module in IEEE 30 Bus System
In the second case, we investigated the performance of the proposed forecasting model for the IEEE 30 bus system to evaluate the scalability and robustness of the proposed framework. The same two-stage methodology was employed, where the hybrid CNN-BiLSTM model was first trained to forecast system variables. The performance of the forecasting model for the IEEE 39 bus test system is shown in Table 4.
Figure 11 shows the comparison between actual and forecasted measurements for sensor 17 over the unseen test horizon to evaluate the temporal generalization capability of the proposed model.
Figure 12 shows the comparison between the proposed model’s forecast and actual measurement at 8030 timestep, with a zoomed-in view highlighting three consecutive sensors and their respective absolute errors.
The FDIA detection using a threshold-based approach was implemented, and the performance of the proposed model was evaluated. Table 5 shows the performance of the FDI detection model using a threshold approach.
The detection performance of the proposed model is further illustrated in Figure 13, which shows the L2 norm distribution of the normal and attacked test samples of the unseen test data along with the selected detection threshold.
Subsequently, multi-label classification was used for localizing the compromised sensors based on the forecast error vectors. As before, both an MLP and a Random Forest model were evaluated for comparative localization performance. Table 6 presents a comparative analysis between the proposed multi-label MLP model and RF classifier to evaluate their effectiveness in FDIA localization.
5.3. Scenario 3: FDIA Detection and Localization with Stealthier Attack Vectors
In order to investigate the resilience of the proposed Location Detection Module, we considered a scaling-based stealty attack strategy. The original attack vector A is scaled down to fractions such as , , , and as explained in Section 4.3. These progressively subtler attacks introduce minimal perturbations to the true measurements, making them harder to detect. Table 7 summarizes the performance of the proposed approach across different attack strengths using the threshold-based approach for the IEEE 14 and 30 bus systems. The results highlight the significant drop in the F1-score for the IEEE 30 bus system, which raises concern about the suitability of the threshold-based approach for larger systems.
Table 8 presents the localization performance of the RF and MLP models under different levels of scaled FDIA, highlighting their ability to detect stealthier FDIA attacks. Although the RACC of both RF and MLP dropped similarly to the threshold-based approach, RF was consistent in its performance compared to the MLP and threshold-based approach.
5.4. Scenario 4: FDIA Detection and Localization During DOS Attacks
In order to evaluate the robustness of the proposed detection and localization framework under realistic cyber-attack conditions, we considered DoS and FDIA attacks jointly. During a DoS attack, sensor nodes are out of operation and do not provide any measurements to the central monitoring system. If attackers perform stealthy FDIA during DoS simultaneously, the threshold-based detector or learning-based models will have fewer reference points to validate the authenticity of the incoming data. This will allow false data to bypass the FDIA detection system.
In this evaluation scenario, different combinations of buses are selected to simulate Denial of Service (DoS) attacks, including all single-bus cases, all two-bus combinations, and all three-bus combinations. These attacks render the measurement data from all sensors of the selected buses unavailable. The mapping between each bus and its corresponding sensor is provided in [22]. At the same time, an FDIA is performed on another random subset of the remaining active sensors. Within the proposed framework, missing data from sensors of all DoS-affected buses are replaced with their corresponding forecasted values before being passed to the multiclass classifier, such as an RF or MLP. This strategy ensures that the model can continue processing inputs despite partial data loss. Table 9 presents the average localization performance of the proposed framework in different numbers of DoS-affected buses. For each configuration, we report the average values of Precision, Recall, F1-score, and RACC to evaluate the robustness of the framework under varying levels of sensor unavailability.
Both RF and MLP classifiers demonstrate high precision, recall, and f1-scores in identifying individual FDIA-compromised sensors, confirming their effectiveness in feature-level detection. However, their capabilities differ when evaluating holistic prediction accuracy across all sensors in a given instance. Although the MLP model achieved higher per-sensor precision, RACC dropped significantly for a DoS attack on a single bus. This drop suggests that MLP struggles with consistent multi-label predictions when partial sensor data are missing. In contrast, the RF model consistently maintains a higher RACC for DoS attacks in 1 to 3 buses. This robustness can be attributed to its ensemble structure, which leverages decision trees to better generalize from incomplete or noisy inputs. As a result, RF proves more resilient in handling partial observability, making it more suitable for real-time FDIA localization in operational environments subject to data loss or disruption.
6. Conclusions
This paper presents a robust and scalable machine learning framework for real-time detection and localization of False Data Injection Attacks (FDIAs) in SGs, including scenarios where partial sensor outages are induced by DoS attacks. The proposed two-stage architecture combines a CNN-BiLSTM-based forecasting model with a multilabel classification module that uses RF to locate compromised sensors using forecast error vectors.
Comprehensive evaluations on IEEE 14-bus and 30-bus test systems demonstrate that the proposed framework outperforms existing ML architecture in both forecasting precision and FDIA detection accuracy. In particular, the CNN–Bi–LSTM model exhibits superior temporal generalization, while the RF-based classifier consistently achieves high RACC in sensor-level localization. The L2-norm thresholding mechanism performs well for detecting high-magnitude anomalies, but its performance degrades for the IEEE 30 bus system. As a result, a follow-up learning-based localization strategy is required, where Random Forest classifiers stand out for their robustness and ability to adapt under worsening observability caused by DoS attacks.
Unlike traditional single-stage detection systems, this multi-stage framework can address the evolving nature of FDIAs with greater flexibility and reliability. This study confirms the reliability of a data-driven defense approach by demonstrating its effectiveness across a range of realistic and complex attack scenarios, including subtle intrusions, varying degrees of tampering, and simultaneous FDIA–DoS events in transmission networks. Future work will evaluate the model’s performance under dynamic grid topologies caused by contingency events, maintenance operations, and system reconfigurations. This extension will improve the model’s applicability to real-world transmission systems.
Author Contributions
Conceptualization, R.S.; methodology, R.S., M.C. and M.M.; software, R.S. and M.M.; validation, R.S., M.C., O.A., M.M. and S.B.; formal analysis, R.S. and O.A.; investigation, R.S. and O.A.; resources, R.S., M.C. and S.B.; data curation, R.S. and M.M.; writing—original draft preparation, R.S.; writing—review and editing, R.S., M.C., O.A. and M.M.; visualization, R.S.; supervision, S.B., M.C. and M.M.; project administration, S.B.; funding acquisition, S.B., M.C., and O.A. All authors have read and agreed to the published version of the manuscript.
Institutional Review Board Statement
Not applicable
Informed Consent Statement
Not applicable
Data Availability Statement
Conflicts of Interest
The authors declare no conflicts of interest.
References
- Fang, X.; Misra, S.; Xue, G.; Yang, D. Smart Grid — The New and Improved Power Grid: A Survey. IEEE Communications Surveys & Tutorials 2012, 14, 944–980. [Google Scholar] [CrossRef]
- Ali, S.S.; Choi, B.J. State-of-the-Art Artificial Intelligence Techniques for Distributed Smart Grids: A Review. Electronics 2020, 9. [Google Scholar] [CrossRef]
- Zhu, J.; Gao, W.; Li, Y.; Guo, X.; Zhang, G.; Sun, W. Power System State Estimation Based on Fusion of PMU and SCADA Data. Energies 2024, 17. [Google Scholar] [CrossRef]
- Gou, B.; Shue, D. Advances in Algorithms for Power System Static State Estimators: An Improved Solution for Bad Data Management and State Estimator Convergence. IEEE Power and Energy Magazine 2023, 21, 16–25. [Google Scholar] [CrossRef]
- Alomari, M.A.; Al-Andoli, M.N.; Ghaleb, M.; Thabit, R.; Alkawsi, G.; Alsayaydeh, J.A.J.; Gaid, A.S.A. Security of Smart Grid: Cybersecurity Issues, Potential Cyberattacks, Major Incidents, and Future Directions. Energies 2025, 18. [Google Scholar] [CrossRef]
- Huang, X.; Qin, Z.; Liu, H. A Survey on Power Grid Cyber Security: From Component-Wise Vulnerability Assessment to System-Wide Impact Analysis. IEEE Access 2018, 6, 69023–69035. [Google Scholar] [CrossRef]
- Yan, Y.; Qian, Y.; Sharif, H.; Tipper, D. A Survey on Cyber Security for Smart Grid Communications. IEEE Communications Surveys & Tutorials 2012, 14, 998–1010. [Google Scholar] [CrossRef]
- Liu, Y.; Ning, P.; Reiter, M.K. False data injection attacks against state estimation in electric power grids. ACM Trans. Inf. Syst. Secur. 2011, 14. [Google Scholar] [CrossRef]
- Deng, R.; Xiao, G.; Lu, R.; Liang, H.; Vasilakos, A.V. False Data Injection on State Estimation in Power Systems—Attacks, Impacts, and Defense: A Survey. IEEE Transactions on Industrial Informatics 2017, 13, 411–423. [Google Scholar] [CrossRef]
- Almasabi, S.; Alsuwian, T.; Javed, E.; Irfan, M.; Jalalah, M.; Aljafari, B.; Harraz, F.A. A Novel Technique to Detect False Data Injection Attacks on Phasor Measurement Units. Sensors 2021, 21. [Google Scholar] [CrossRef]
- Huseinović, A.; Mrdović, S.; Bicakci, K.; Uludag, S. A Survey of Denial-of-Service Attacks and Solutions in the Smart Grid. IEEE Access 2020, 8, 177447–177470. [Google Scholar] [CrossRef]
- Foroutan, S.A.; Salmasi, F.R. Detection of false data injection attacks against state estimation in smart grids based on a mixture Gaussian distribution learning method. IET Cyber-Physical Systems: Theory & Applications 2017, 2, 161–171. [Google Scholar] [CrossRef]
- Acuña Acurio, B.A.; Chérrez Barragán, D.E.; López, J.C.; Grijalva, F.; Rodríguez, J.C.; da Silva, L.C.P. Visual State Estimation for False Data Injection Detection of Solar Power Generation. Engineering Proceedings 2023, 47. [Google Scholar] [CrossRef]
- Ashok, A.; Govindarasu, M. Cyber attacks on power system state estimation through topology errors. In Proceedings of the 2012 IEEE Power and Energy Society General Meeting; 2012; pp. 1–8. [Google Scholar] [CrossRef]
- Li, Z.; Xie, Y.; Ma, R.; Wei, Z. Optimizing CNN-LSTM for the Localization of False Data Injection Attacks in Power Systems. Applied Sciences 2024, 14. [Google Scholar] [CrossRef]
- Wang, S.; Bi, S.; Zhang, Y.J.A. Locational Detection of the False Data Injection Attack in a Smart Grid: A Multilabel Classification Approach. IEEE Internet of Things Journal 2020, 7, 8218–8227. [Google Scholar] [CrossRef]
- Wang, L.; Zhou, Q.; Jin, S. Physics-guided Deep Learning for Power System State Estimation. Journal of Modern Power Systems and Clean Energy 2020, 8, 607–615. [Google Scholar] [CrossRef]
- Bhusal, N.; Shukla, R.M.; Gautam, M.; Benidris, M.; Sengupta, S. Deep ensemble learning-based approach to real-time power system state estimation. International Journal of Electrical Power & Energy Systems 2021, 129, 106806. [Google Scholar] [CrossRef]
- Mukherjee, D.; Chakraborty, S.; Ghosh, S. Power system state forecasting using machine learning techniques. Electrical Engineering 2022, 104, 283–305. [Google Scholar] [CrossRef]
- Esmalifalak, M.; Liu, L.; Nguyen, N.; Zheng, R.; Han, Z. Detecting Stealthy False Data Injection Using Machine Learning in Smart Grid. IEEE Systems Journal 2017, 11, 1644–1652. [Google Scholar] [CrossRef]
- Wang, H.; Ruan, J.; Wang, G.; Zhou, B.; Liu, Y.; Fu, X.; Peng, J. Deep Learning-Based Interval State Estimation of AC Smart Grids Against Sparse Cyber Attacks. IEEE Transactions on Industrial Informatics 2018, 14, 4766–4778. [Google Scholar] [CrossRef]
- Baul, A.; Sarker, G.C.; Sadhu, P.K.; Yanambaka, V.P.; Abdelgawad, A. XTM: A Novel Transformer and LSTM-Based Model for Detection and Localization of Formally Verified FDI Attack in Smart Grid. Electronics 2023, 12. [Google Scholar] [CrossRef]
- Zhang, G.; Gao, W.; Li, Y.; Hu, W.; Hu, P.; Hua, F. Detection and Localization of False Data Injection Attacks in Smart Grid Based on Joint Maximum a Posteriori-Maximum Likelihood. IEEE Access 2023, 11, 133867–133878. [Google Scholar] [CrossRef]
- Zhu, J.; Meng, W.; Sun, M.; Yang, J.; Song, Z. FLLF: A Fast-Lightweight Location Detection Framework for False Data Injection Attacks in Smart Grids. IEEE Transactions on Smart Grid 2024, 15, 911–920. [Google Scholar] [CrossRef]
- Dehbozorgi, M.R.; Rastegar, M.; Arani, M.F.M. False Data Injection Attack Detection and Localization Framework in Power Distribution Systems Using a Novel Ensemble of CNNs and Explainable Artificial Intelligence. IEEE Transactions on Industry Applications 2025, 61, 4801–4811. [Google Scholar] [CrossRef]
- Yu, Y.; Liu, C.; Xiong, L.; Tang, Y.; Qian, F. Localization of False Data Injection Attacks in Smart Grids With Renewable Energy Integration via Spatiotemporal Network. IEEE Internet of Things Journal 2024, 11, 37571–37581. [Google Scholar] [CrossRef]
- Boyaci, O.; Narimani, M.R.; Davis, K.R.; Ismail, M.; Overbye, T.J.; Serpedin, E. Joint Detection and Localization of Stealth False Data Injection Attacks in Smart Grids Using Graph Neural Networks. IEEE Transactions on Smart Grid 2022, 13, 807–819. [Google Scholar] [CrossRef]
- Wang, Y.; Lu, Z.; Ma, J.; Jin, Q. Locational False Data Injection Attack Detection in Smart Grid Using Recursive Variational Graph Autoencoder. IEEE Internet of Things Journal 2025, 12, 13697–13708. [Google Scholar] [CrossRef]
- Wu, S.; Yang, C.; Wang, J.; Shi, D. A Lightweight Framework for Measurement Causality Extraction and FDIA Localization. IEEE Transactions on Smart Grid 2025, 16, 2587–2598. [Google Scholar] [CrossRef]
- Chen, X.; Hu, S.; Li, Y.; Yue, D.; Dou, C.; Ding, L. Co-Estimation of State and FDI Attacks and Attack Compensation Control for Multi-Area Load Frequency Control Systems Under FDI and DoS Attacks. IEEE Transactions on Smart Grid 2022, 13, 2357–2368. [Google Scholar] [CrossRef]
- Hu, S.; Chen, X.; Li, J.; Xie, X. Observer-Based Resilient Controller Design for Networked Stochastic Systems Under Coordinated DoS and FDI Attacks. IEEE Transactions on Control of Network Systems 2024, 11, 890–901. [Google Scholar] [CrossRef]
- Yang, F.; Xie, X.; Peng, C. Co-Design of New Fuzzy Switching-Type State-FDI Estimation and Attack Compensation for Dc Microgrids Under Hybrid Attacks. IEEE Transactions on Fuzzy Systems 2024, 32, 1743–1755. [Google Scholar] [CrossRef]
- Yang, F.; Xie, X.; Sun, Q.; Yue, D. FDI Attack Estimation and Event-Triggered Resilient Control of DC Microgrids Under Hybrid Attacks. IEEE Transactions on Smart Grid 2024, 15, 4207–4216. [Google Scholar] [CrossRef]
- Jenabzadeh, A.; Shu, Z.; Huang, T.; Zhu, Q.; Shang, Y.; Cui, Y. Distributed Estimation and Motion Control in Multi-Agent Systems Under Multiple Attacks. IEEE Transactions on Automation Science and Engineering 2025, 22, 12548–12559. [Google Scholar] [CrossRef]
- Raghuvamsi, Y.; Teeparthi, K. Detection and reconstruction of measurements against false data injection and DoS attacks in distribution system state estimation: A deep learning approach. Measurement 2023, 210, 112565. [Google Scholar] [CrossRef]
- Raghuvamsi, Y.; Batchu, S.; Teeparthi, K. Topology and FDIA identification in distribution system state estimation using a data-driven approach. Measurement 2025, 253, 117741. [Google Scholar] [CrossRef]
- Kamyabi, L.; Lie, T.T.; Madanian, S.; Marshall, S. A Comprehensive Review of Hybrid State Estimation in Power Systems: Challenges, Opportunities and Prospects. Energies 2024, 17. [Google Scholar] [CrossRef]
- Zhu, Y.; Xu, X.; Yan, Z. Accelerated Matrix Completion-Based State Estimation for Unobservable Distribution Networks. IEEE Transactions on Industrial Informatics 2024, 20, 13798–13810. [Google Scholar] [CrossRef]
- Yadaraju, V.P.; Kumar, M.S. Advanced AC-DC power flow analysis: evaluating the impact of control parameters on system performance. Microsystem Technologies 2024. [Google Scholar] [CrossRef]
- Rahman, M.; Yan, J.; Thepie Fapi, E. Adversarial Artificial Intelligence in Blind False Data Injection in Smart Grid AC State Estimation. IEEE Transactions on Industrial Informatics 2024, 20, 8873–8883. [Google Scholar] [CrossRef]
- Zhang, G.; Gao, W.; Li, Y.; Liu, Y.; Guo, X.; Jiang, W. Joint detection and localization of False Data Injection Attacks in smart grids: An enhanced state estimation approach. Computers and Electrical Engineering 2024, 120, 109834. [Google Scholar] [CrossRef]
- Hegazy, H.I.; Tag Eldien, A.S.; Tantawy, M.M.; Fouda, M.M.; TagElDien, H.A. Real-Time Locational Detection of Stealthy False Data Injection Attack in Smart Grid: Using Multivariate-Based Multi-Label Classification Approach. Energies 2022, 15. [Google Scholar] [CrossRef]
- Xie, F.; Wen, H.; Wu, J.; Chen, S.; Hou, W.; Jiang, Y. Convolution Based Feature Extraction for Edge Computing Access Authentication. IEEE Transactions on Network Science and Engineering 2020, 7, 2336–2346. [Google Scholar] [CrossRef]
- Hochreiter, S.; Schmidhuber, J. Long Short-Term Memory. Neural Computation 1997, 9, 1735–1780. [Google Scholar] [CrossRef]
- Mienye, I.D.; Swart, T.G.; Obaido, G. Recurrent Neural Networks: A Comprehensive Review of Architectures, Variants, and Applications. Information 2024, 15. [Google Scholar] [CrossRef]
- Gopalakrishnan, T.; Ruby, D.; Al-Turjman, F.; Gupta, D.; Pustokhina, I.V.; Pustokhin, D.A.; Shankar, K. Deep Learning Enabled Data Offloading With Cyber Attack Detection Model in Mobile Edge Computing Systems. IEEE Access 2020, 8, 185938–185949. [Google Scholar] [CrossRef]
- Lee, T.H.; Ullah, A.; Wang, R. , P., Ed.; Springer International Publishing: Cham, 2020; pp. 389–429. https://doi.org/10.1007/978-3-030-31150-6_13.Forest. In Macroeconomic Forecasting in the Era of Big Data: Theory and Practice; Fuleky, P., Ed.; Springer International Publishing: Cham, 2020; Springer International Publishing: Cham, 2020; pp. 389–429. [Google Scholar] [CrossRef]
- Shrestha, R.; Souto, L.; Eisenkraemer, P.; Bhatta, R.; Schmitt, K.; Chamana, M.; Bayne, S.; Bilbao, A. Optimal Phasor Measurement Unit Placement Using Machine Learning Technique. In Proceedings of the 2024 16th Seminar on Power Electronics and Control (SEPOC); 2024; pp. 1–6. [Google Scholar] [CrossRef]
- Herrera, F.; Charte, F.; Rivera, A.J.; del Jesus, M.J. , Metrics and Techniques; Springer International Publishing: Cham, 2016; pp. 17–31. https://doi.org/10.1007/978-3-319-41111-8_2.Classification. In Multilabel Classification : Problem Analysis, Metrics and Techniques; Springer International Publishing: Cham, 2016; Springer International Publishing: Cham, 2016; pp. 17–31. [Google Scholar] [CrossRef]
- Albalooshi, F.A.; Qader, M.R. Deep Learning Algorithm for Automatic Classification of Power Quality Disturbances. Applied Sciences 2025, 15. [Google Scholar] [CrossRef]
- Lu, K.D.; Zhou, L.; Wu, Z.G. Representation-Learning-Based CNN for Intelligent Attack Localization and Recovery of Cyber-Physical Power Systems. IEEE Transactions on Neural Networks and Learning Systems 2024, 35, 6145–6155. [Google Scholar] [CrossRef]
- Xu, G.; Meng, Y.; Qiu, X.; Yu, Z.; Wu, X. Sentiment Analysis of Comment Texts Based on BiLSTM. IEEE Access 2019, 7, 51522–51532. [Google Scholar] [CrossRef]
- Zhang, Y.; Chen, Y.; Wang, J.; Pan, Z. Unsupervised Deep Anomaly Detection for Multi-Sensor Time-Series Signals. IEEE Transactions on Knowledge and Data Engineering 2023, 35, 2118–2132. [Google Scholar] [CrossRef]
- Ben Said, R.; Sabir, Z.; Askerzade, I. CNN-BiLSTM: A Hybrid Deep Learning Approach for Network Intrusion Detection System in Software-Defined Networking With Hybrid Feature Selection. IEEE Access 2023, 11, 138732–138747. [Google Scholar] [CrossRef]
- Shahriar, M.H.; Rahman, M.A.; Haque, N.I.; Chowdhury, B.; Whisenant, S.G. iDDAF: An Intelligent Deceptive Data Acquisition Framework for Secure Cyber-Physical Systems. In Proceedings of the Security and Privacy in Communication Networks; Garcia-Alfaro, J.; Li, S.; Poovendran, R.; Debar, H.; Yung, M., Eds., Cham; 2021; pp. 338–359. [Google Scholar]
- Hebrail, G.; Berard, A. Individual Household Electric Power Consumption. UCI Machine Learning Repository, 2006. [CrossRef]
- Shahriar, M.H.; Khalil, A.A.; Rahman, M.A.; Manshaei, M.H.; Chen, D. iAttackGen: Generative Synthesis of False Data Injection Attacks in Cyber-physical Systems. In Proceedings of the 2021 IEEE Conference on Communications and Network Security (CNS); 2021; pp. 200–208. [Google Scholar] [CrossRef]
Figure 1.
Structure of CNN.
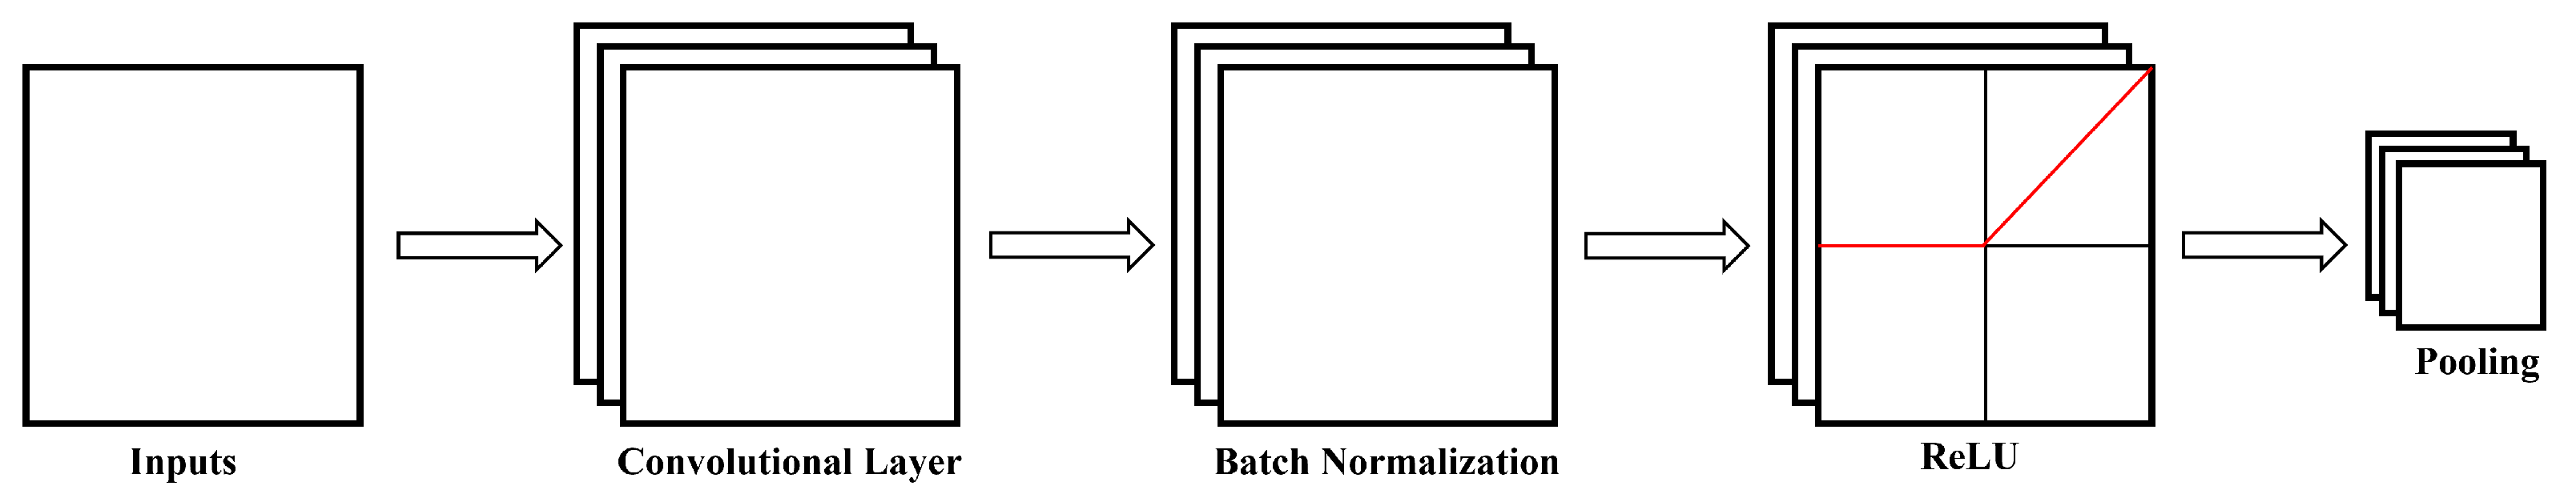
Figure 2.
Structure of an LSTM block.
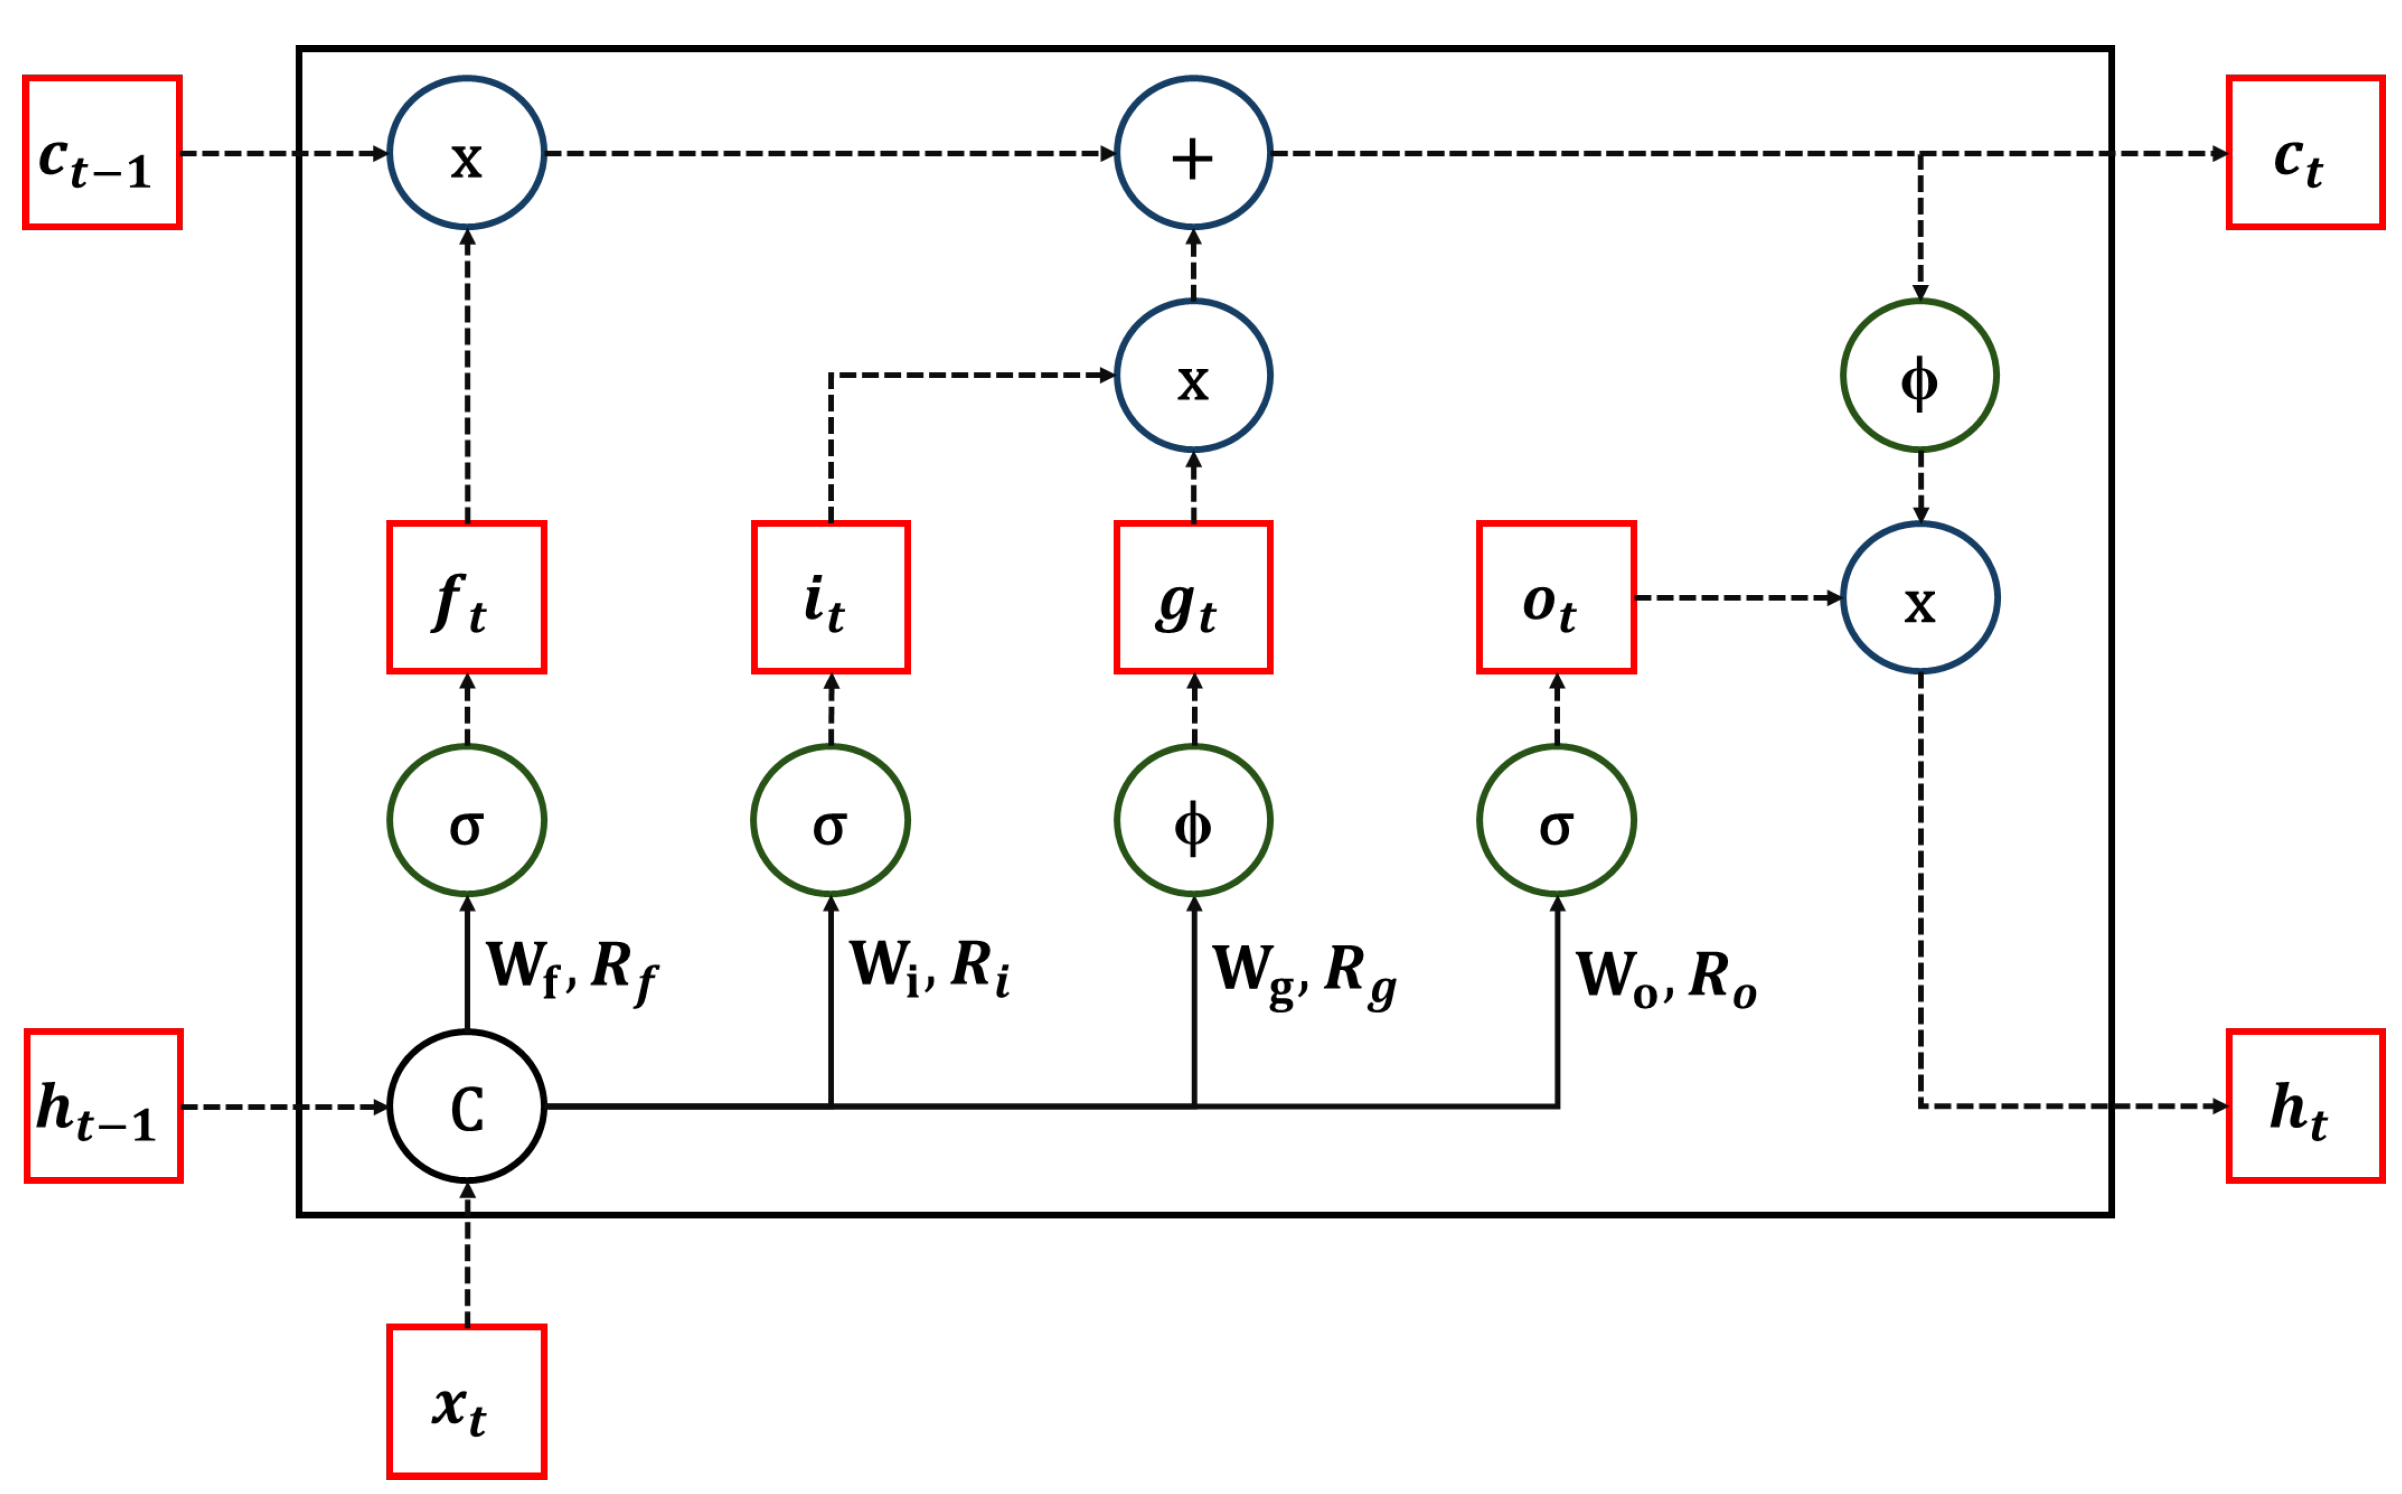
Figure 3.
Structure of a Bi-LSTM block.
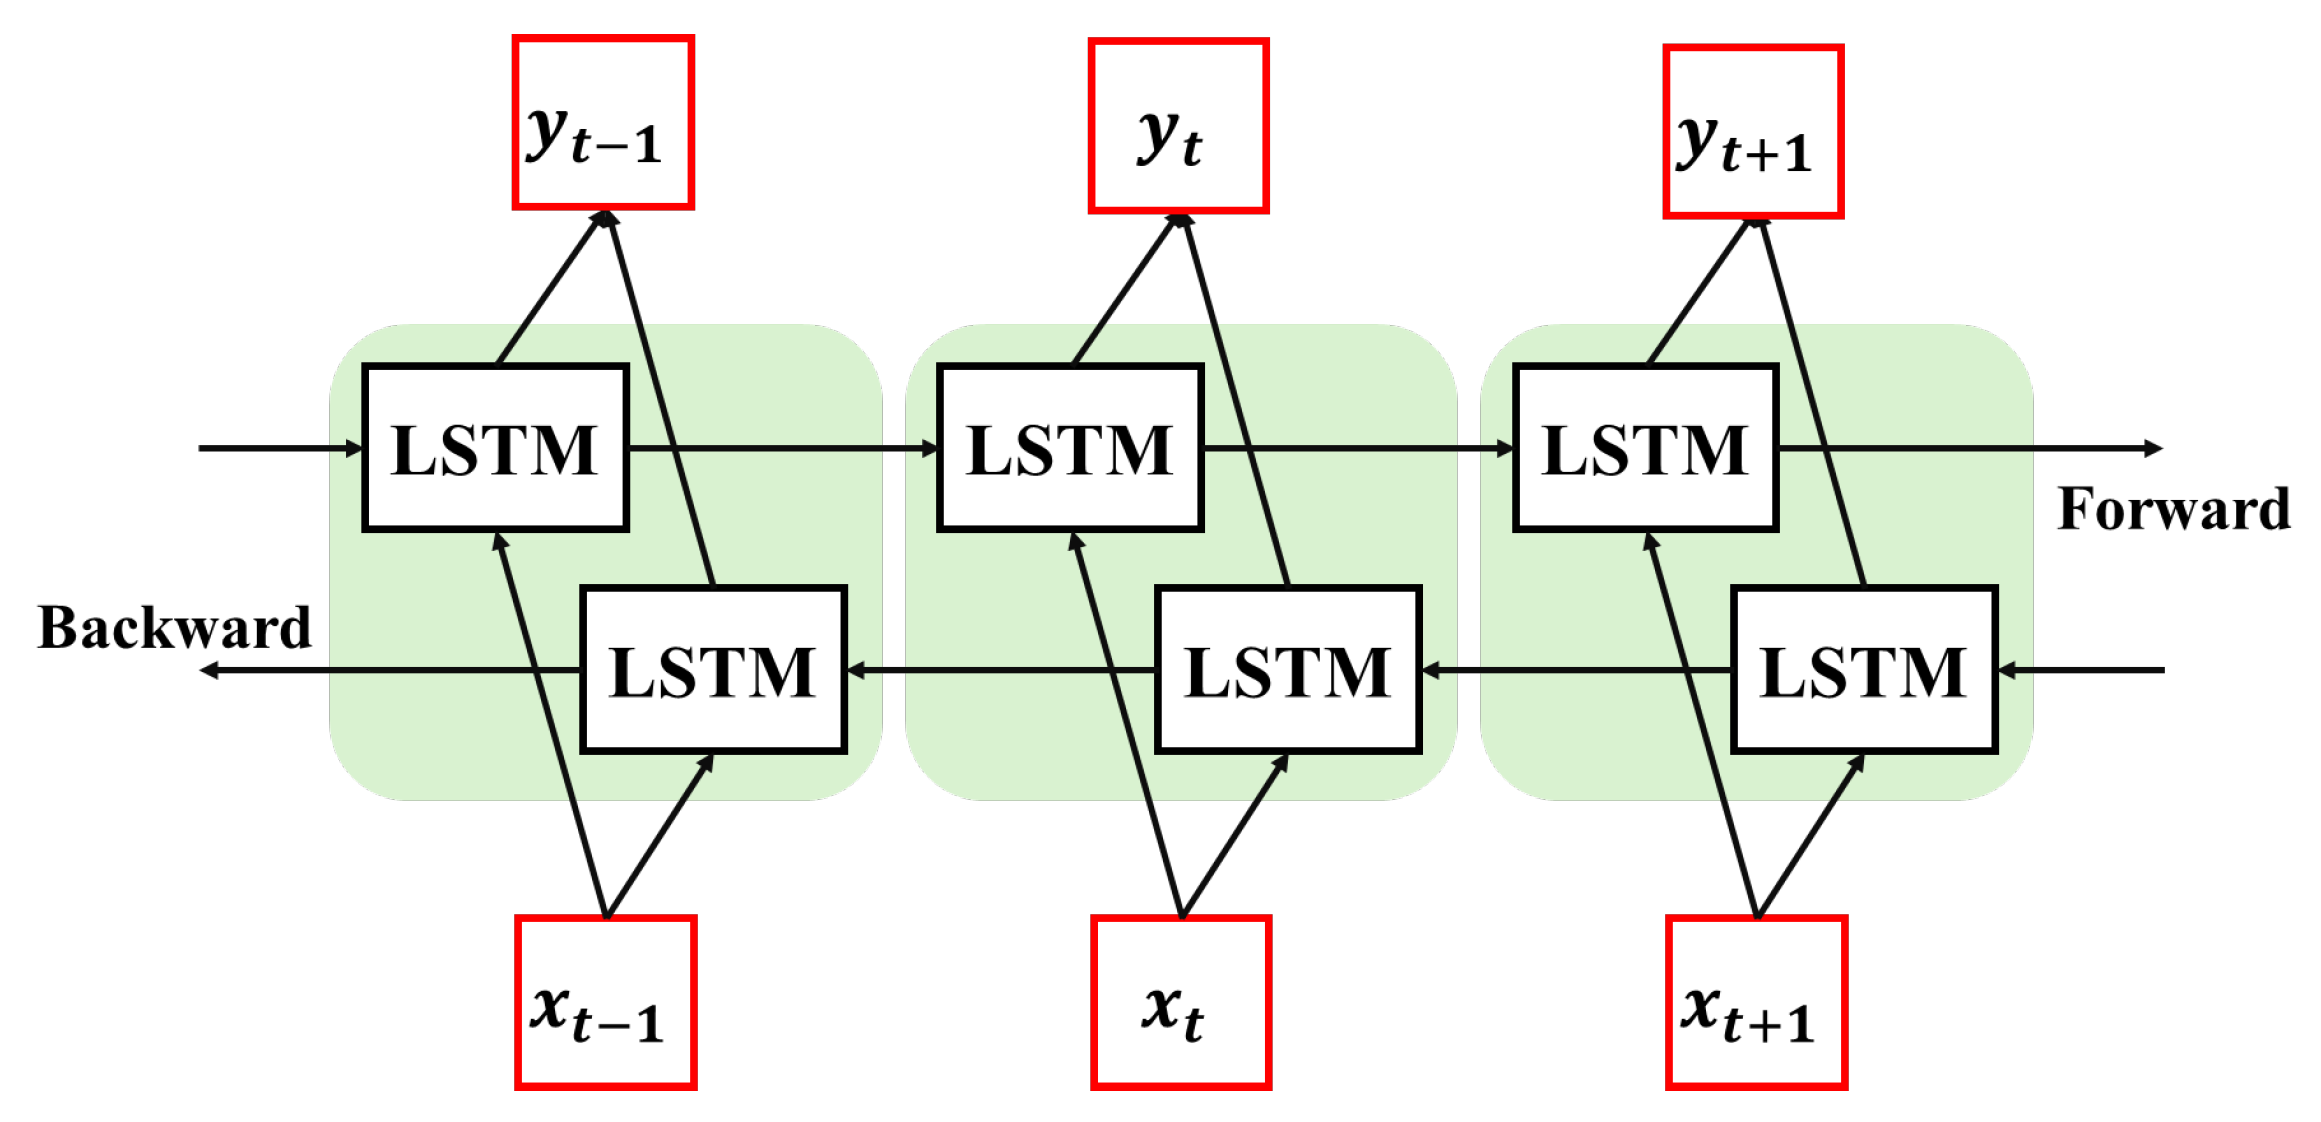
Figure 4.
Schematic diagram of Random Forest [48].
Figure 4.
Schematic diagram of Random Forest [48].
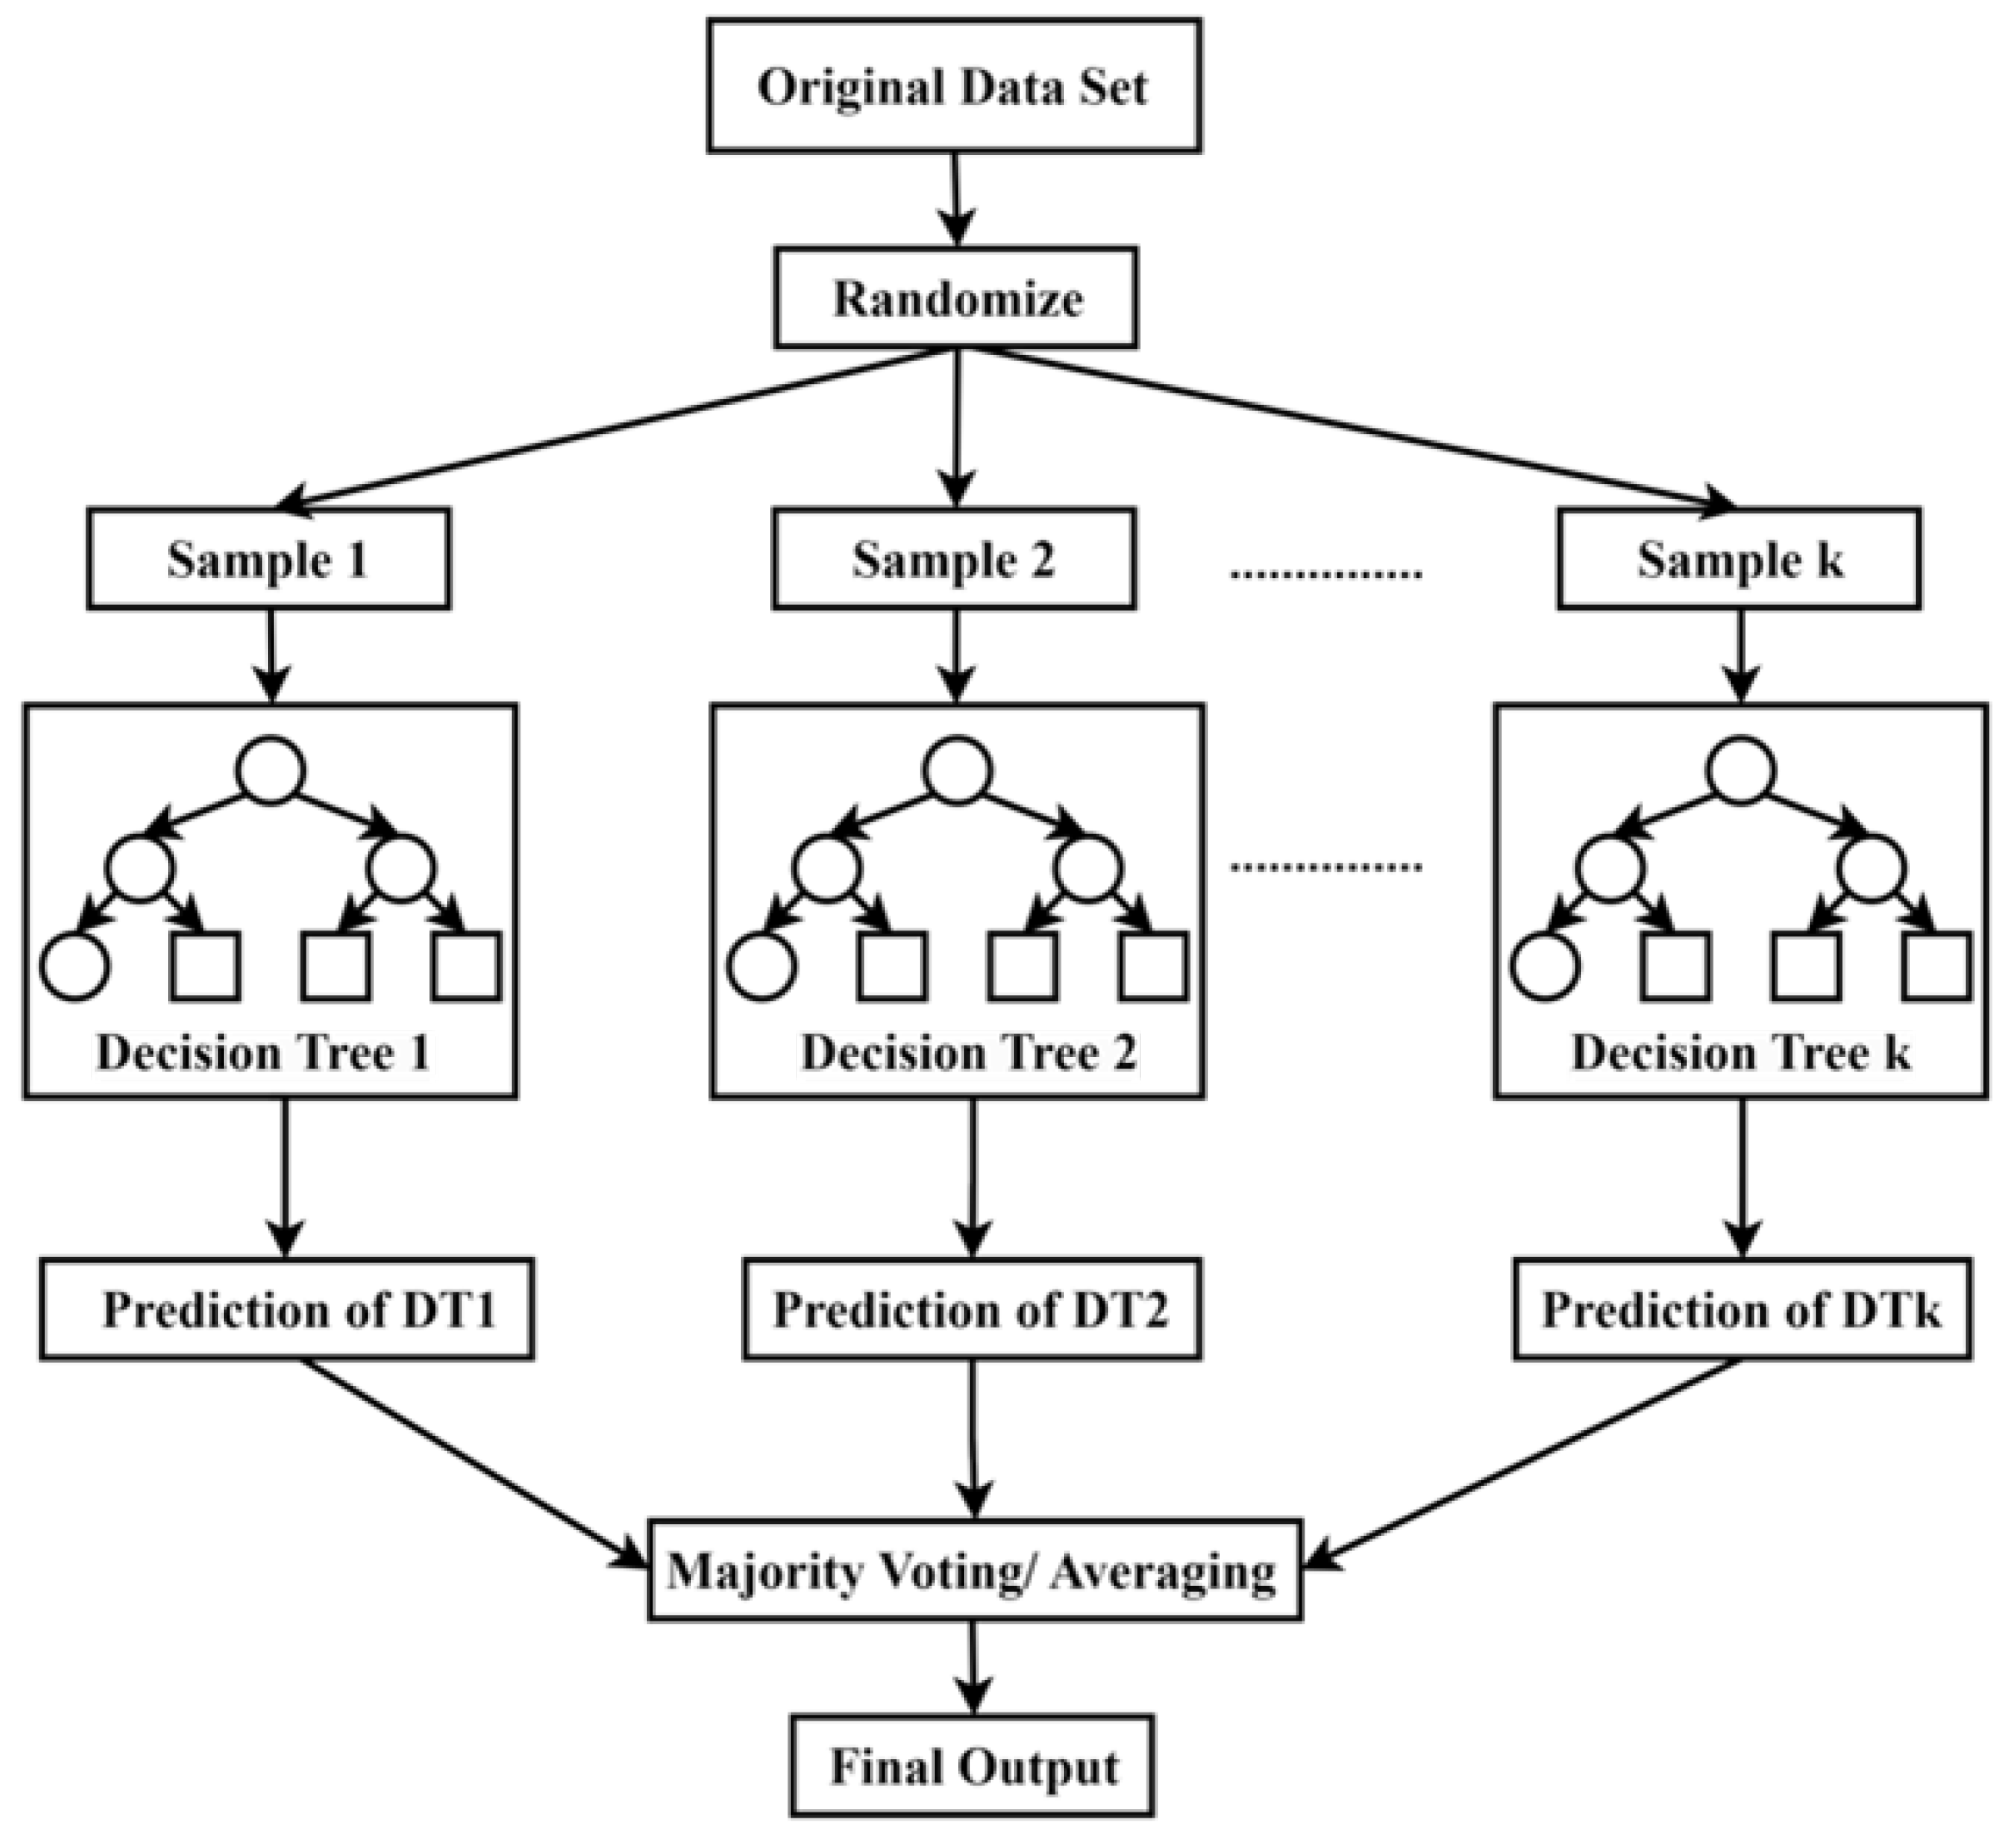
Figure 5.
Framework of FDIA detection and Localization.
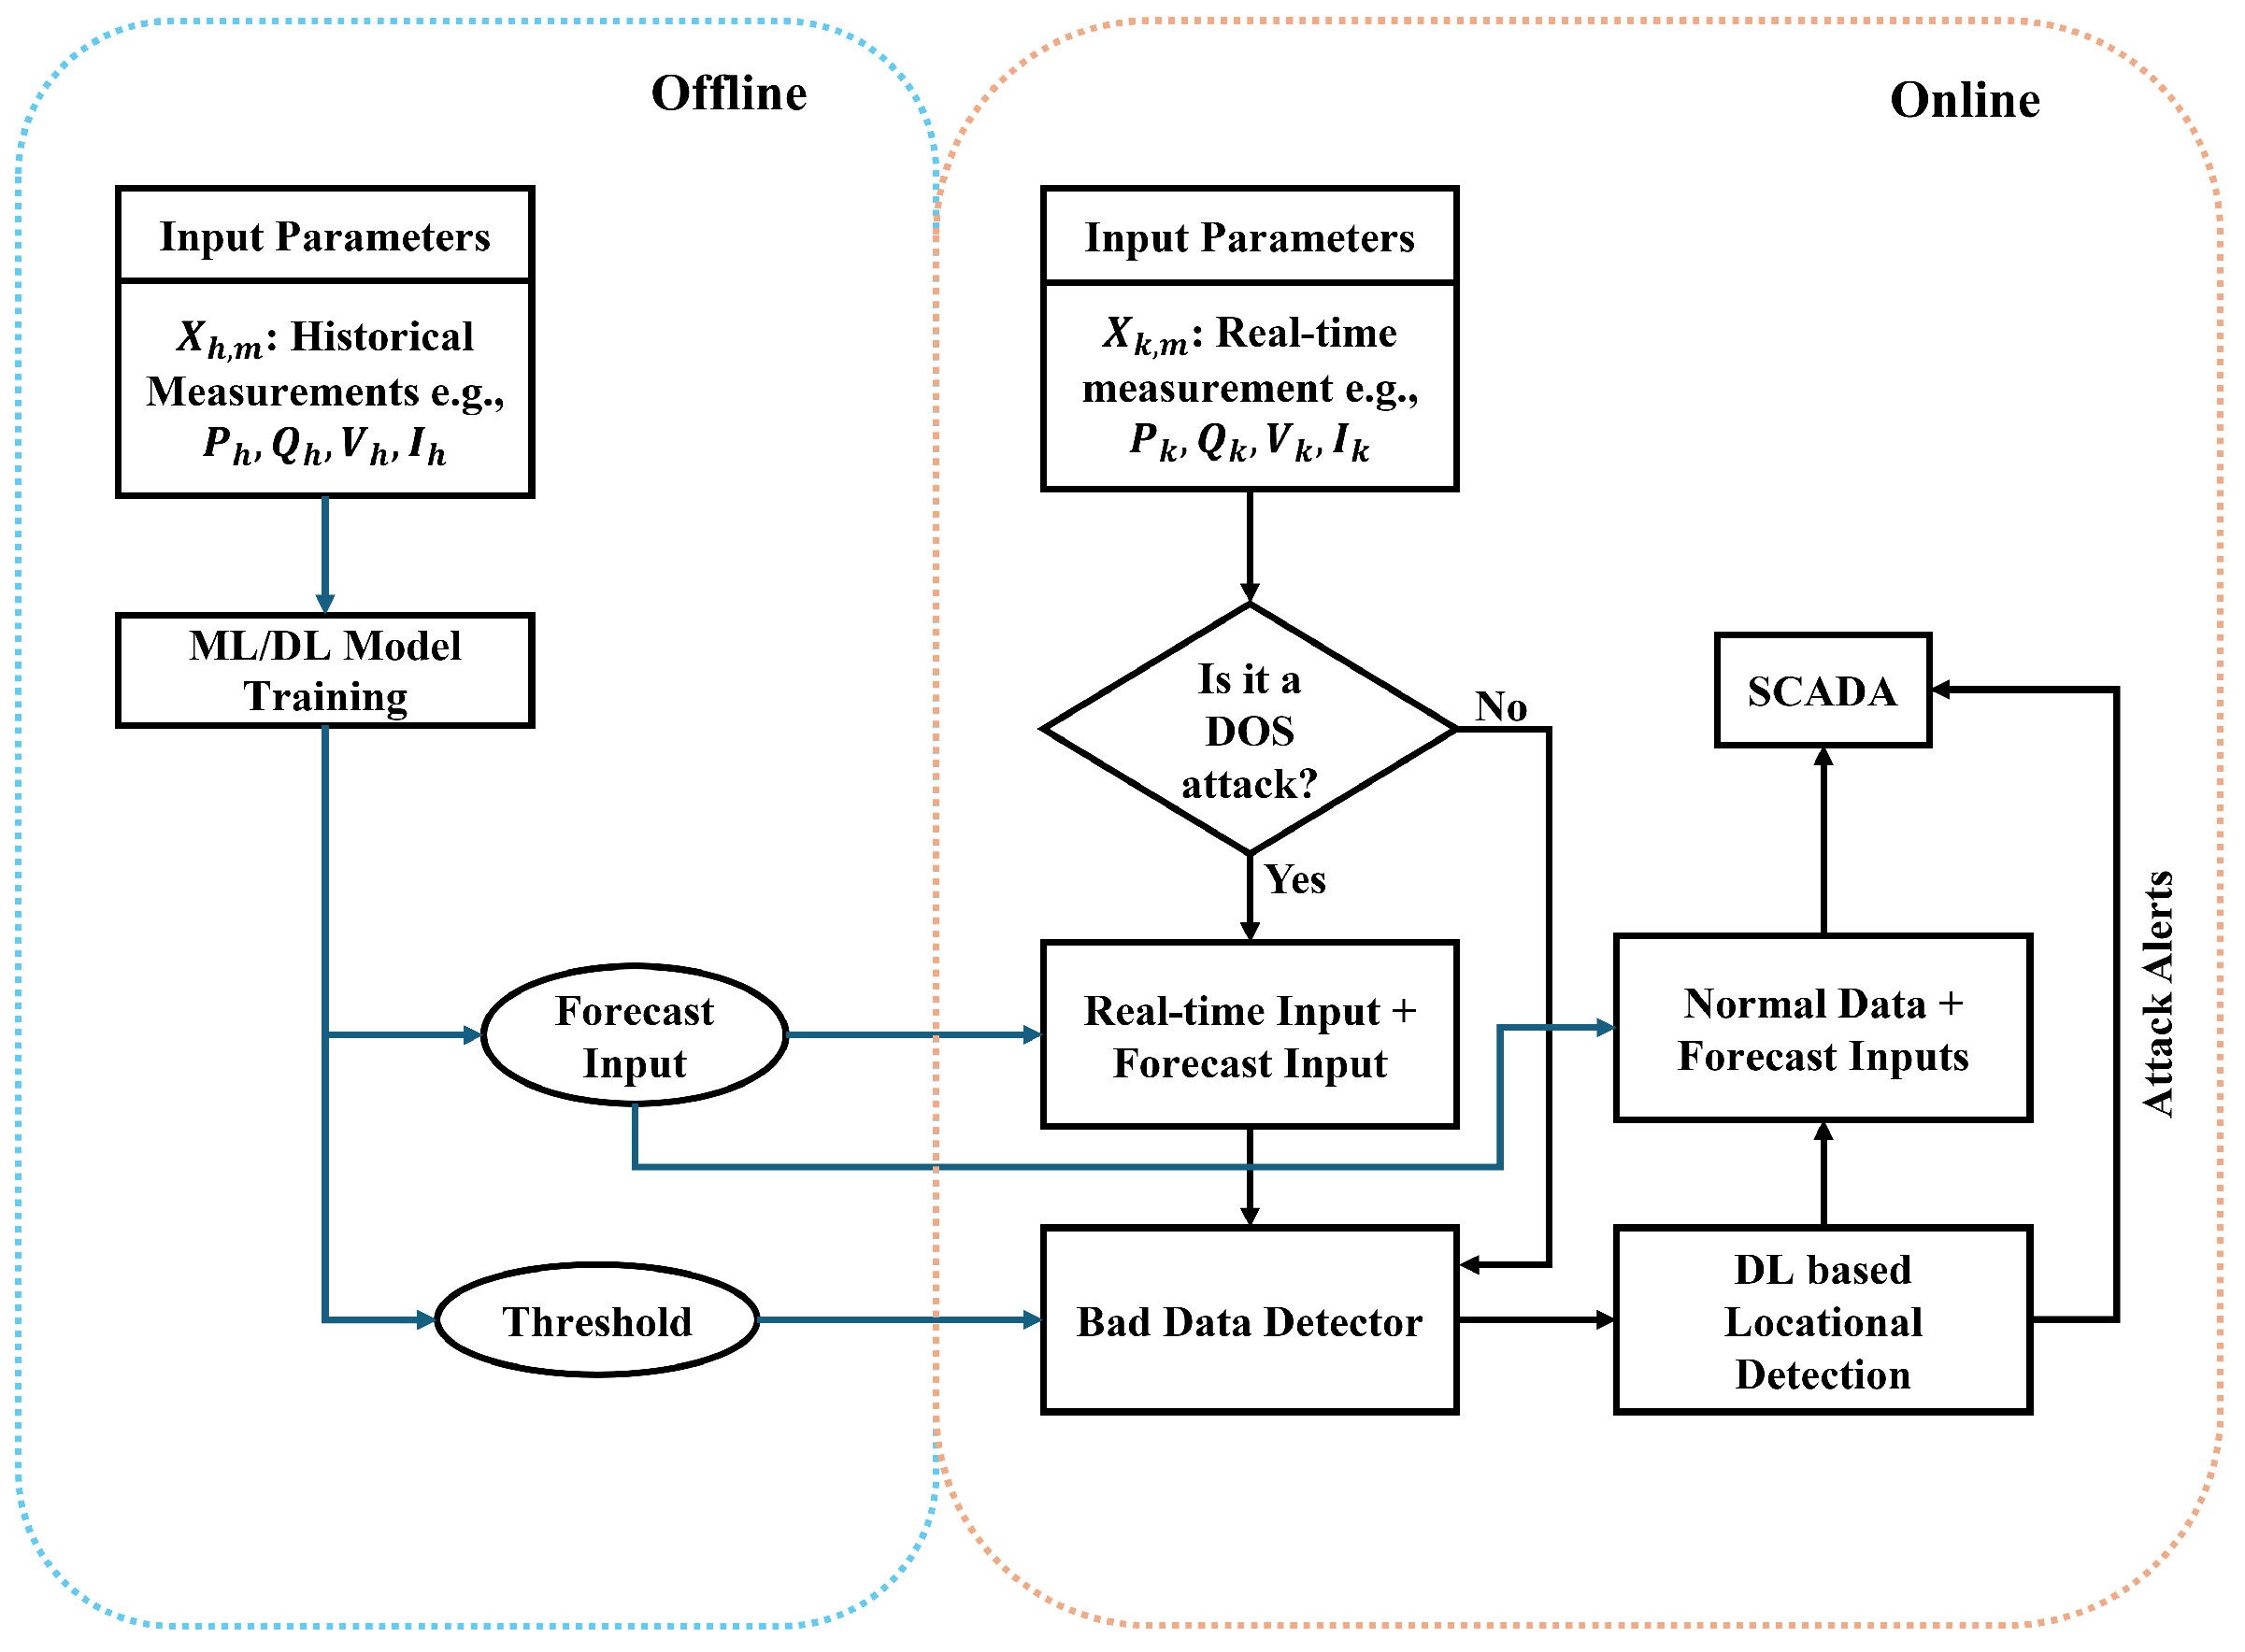
Figure 6.
Architecture of Forecasting and FDIA detection Module.
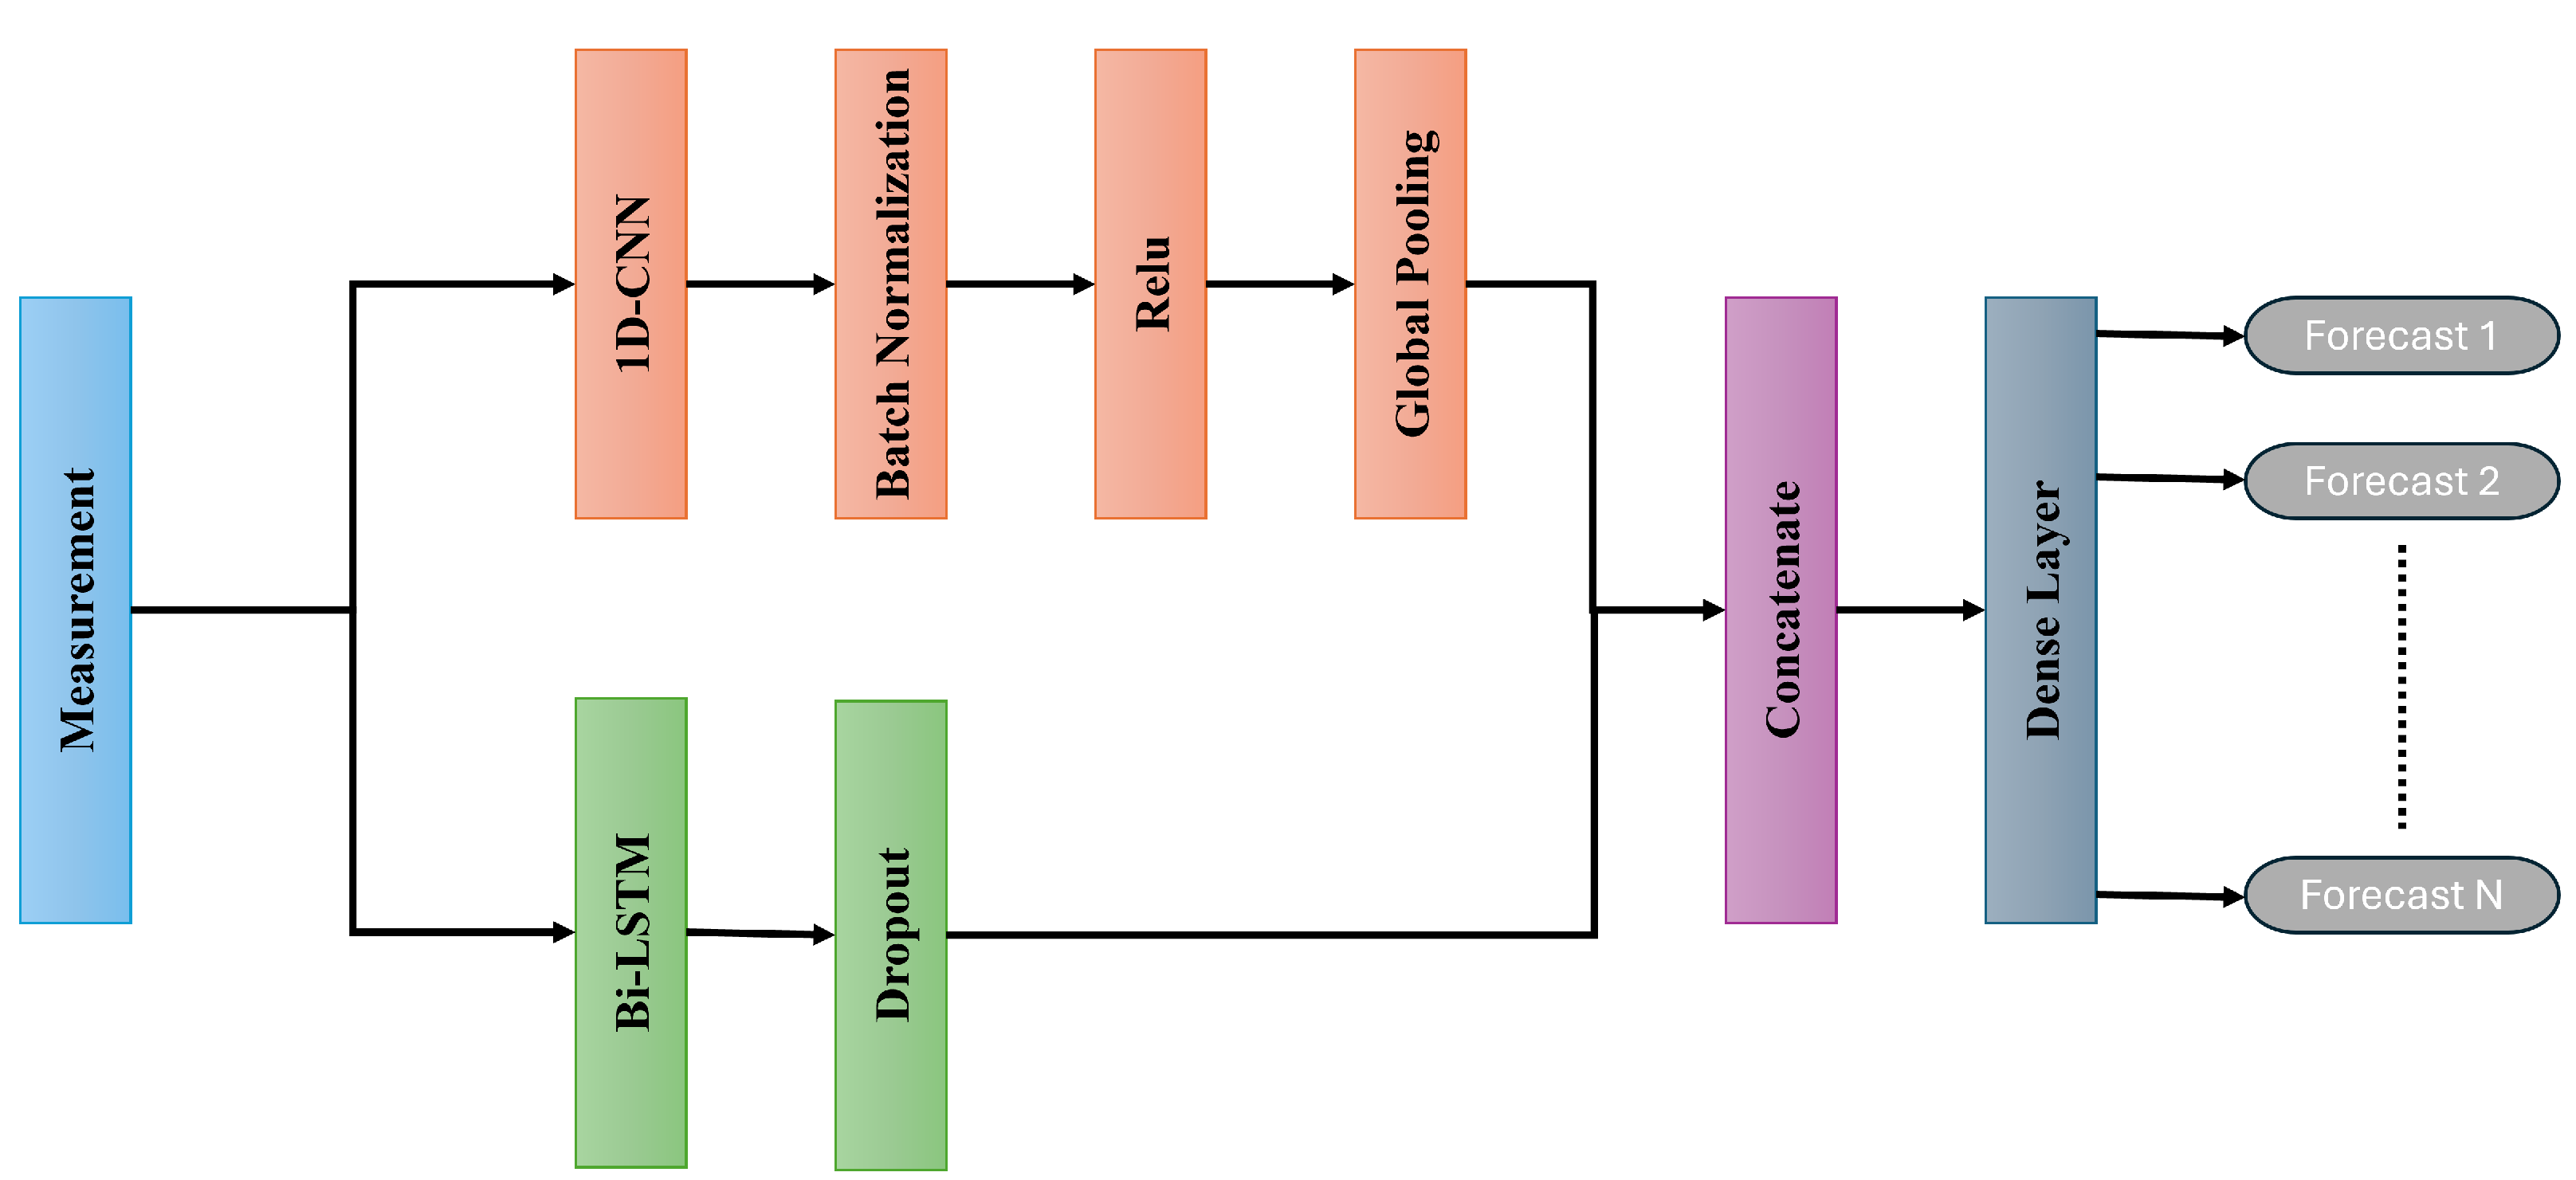
Figure 7.
Architecture of Forecasting and FDIA detection Module.
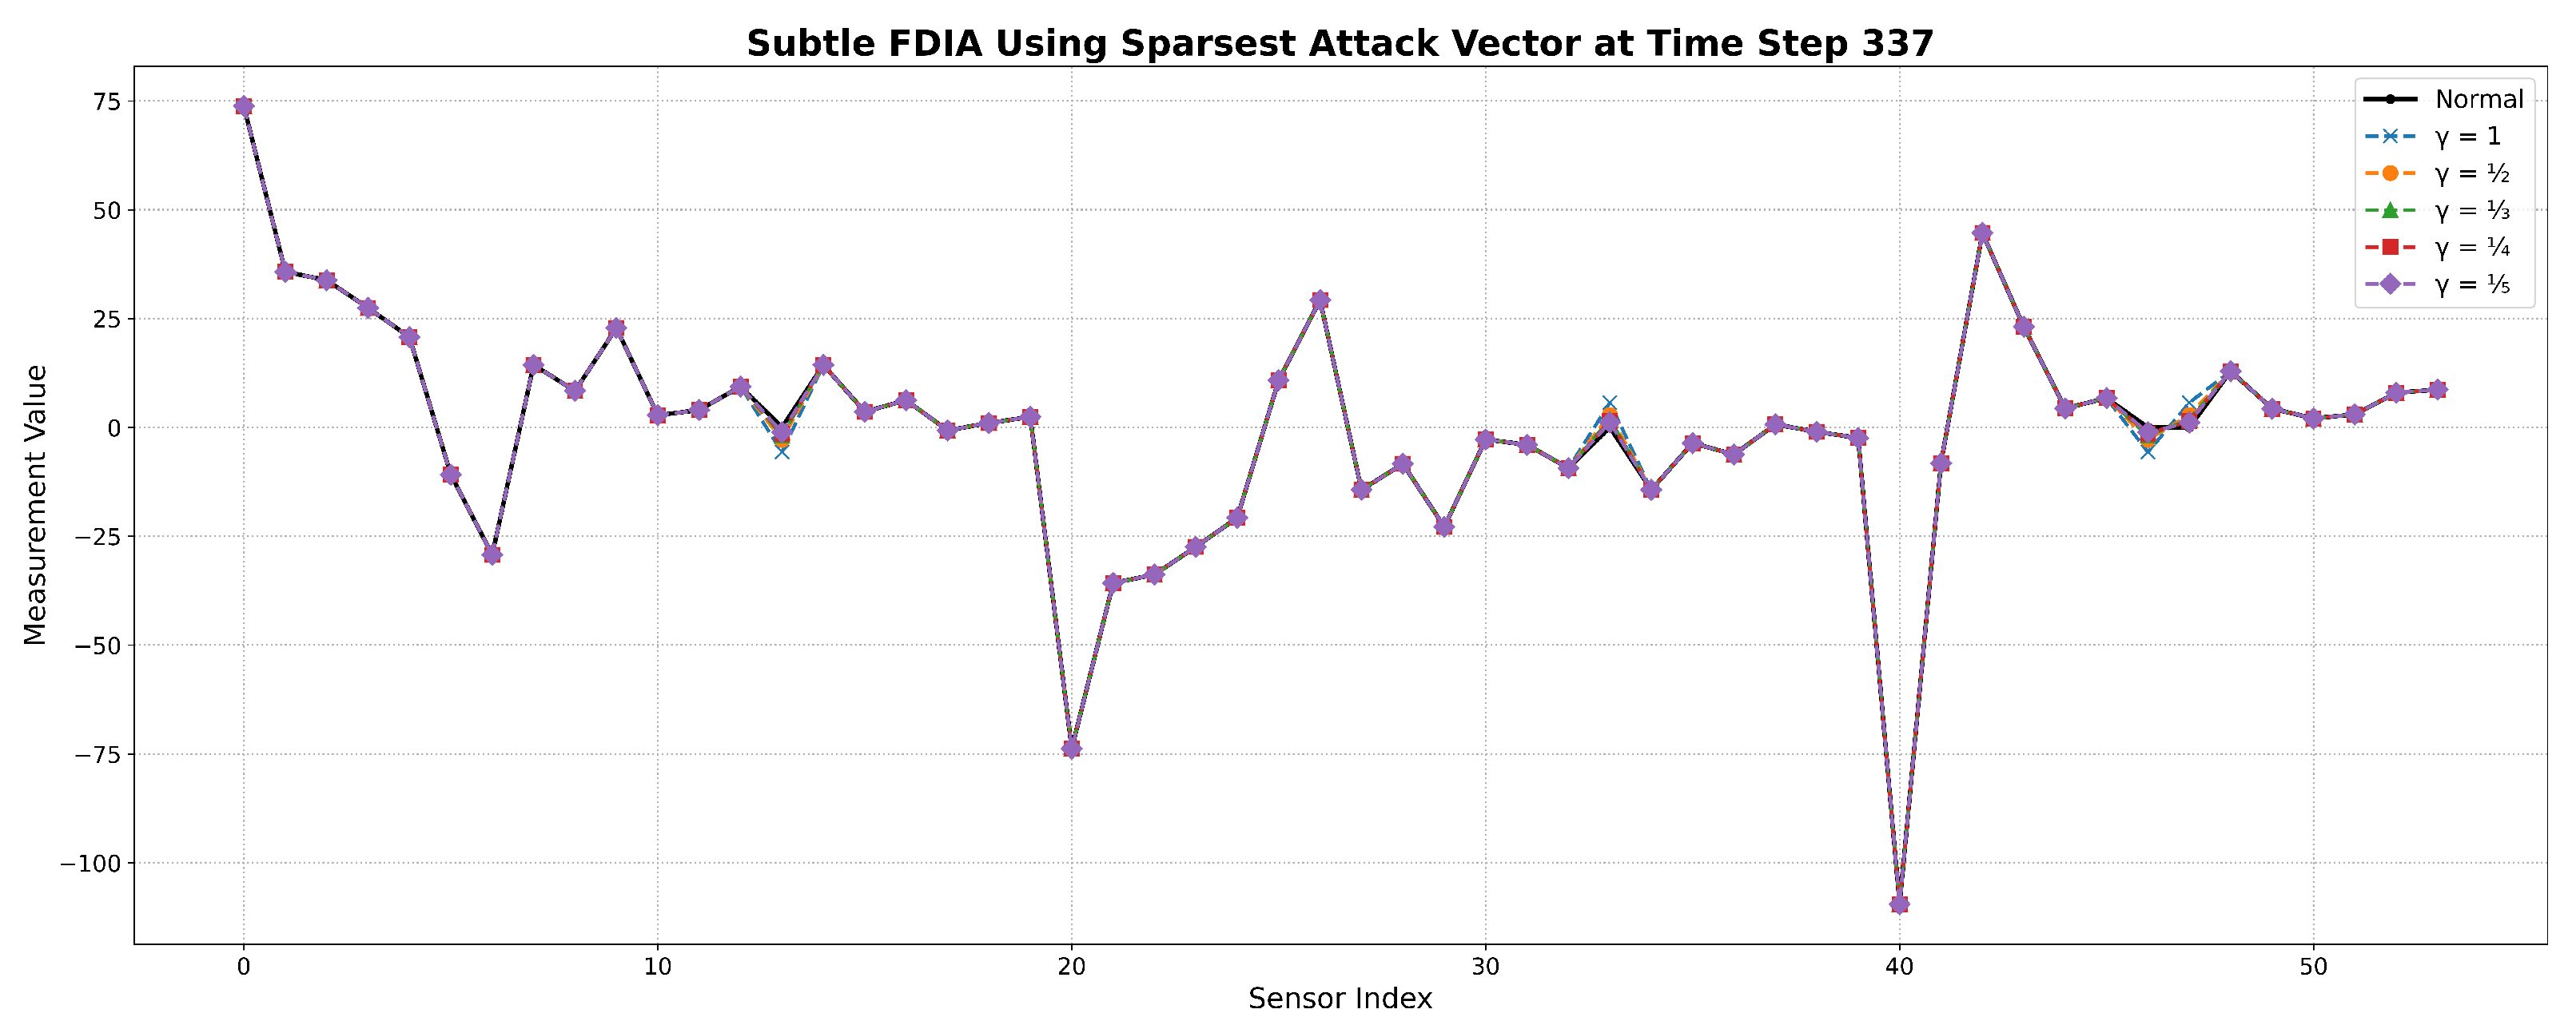
Figure 8.
Sensor 17 - Actual vs Forecasted Power on Unseen Test Data.
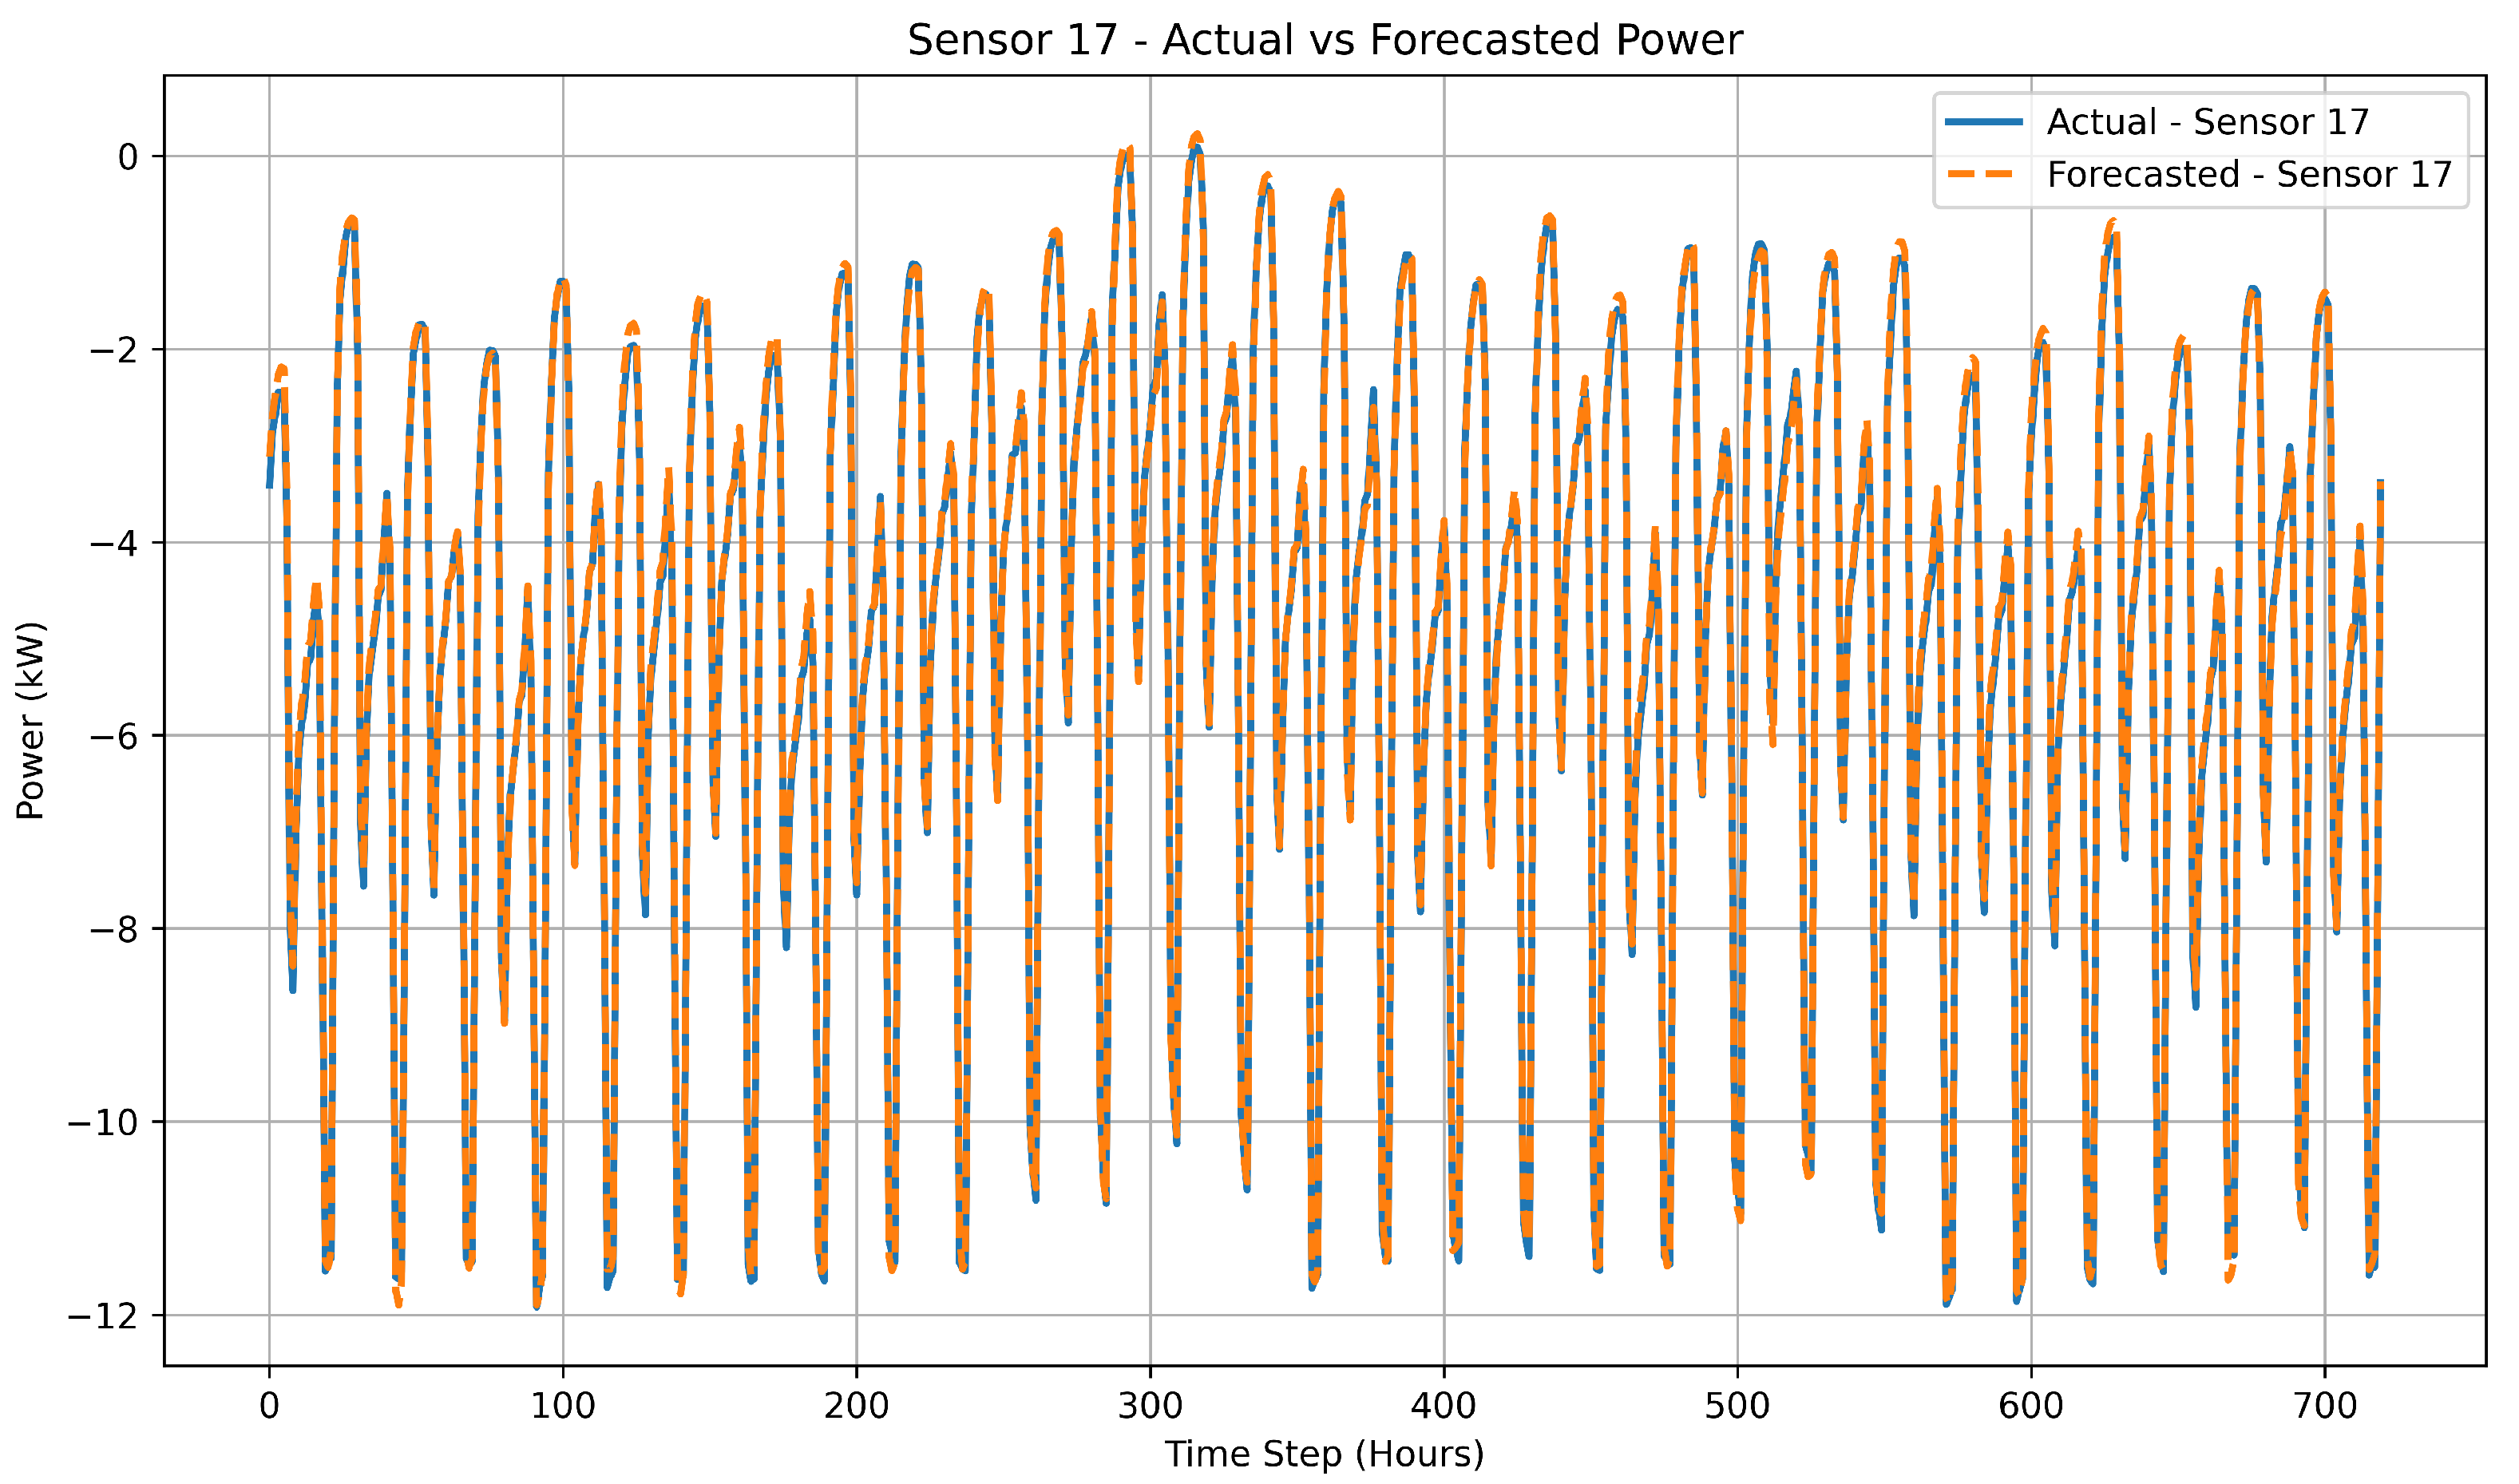
Figure 9.
Sensor 17 - Actual vs Forecasted Power at 8030 timestep.
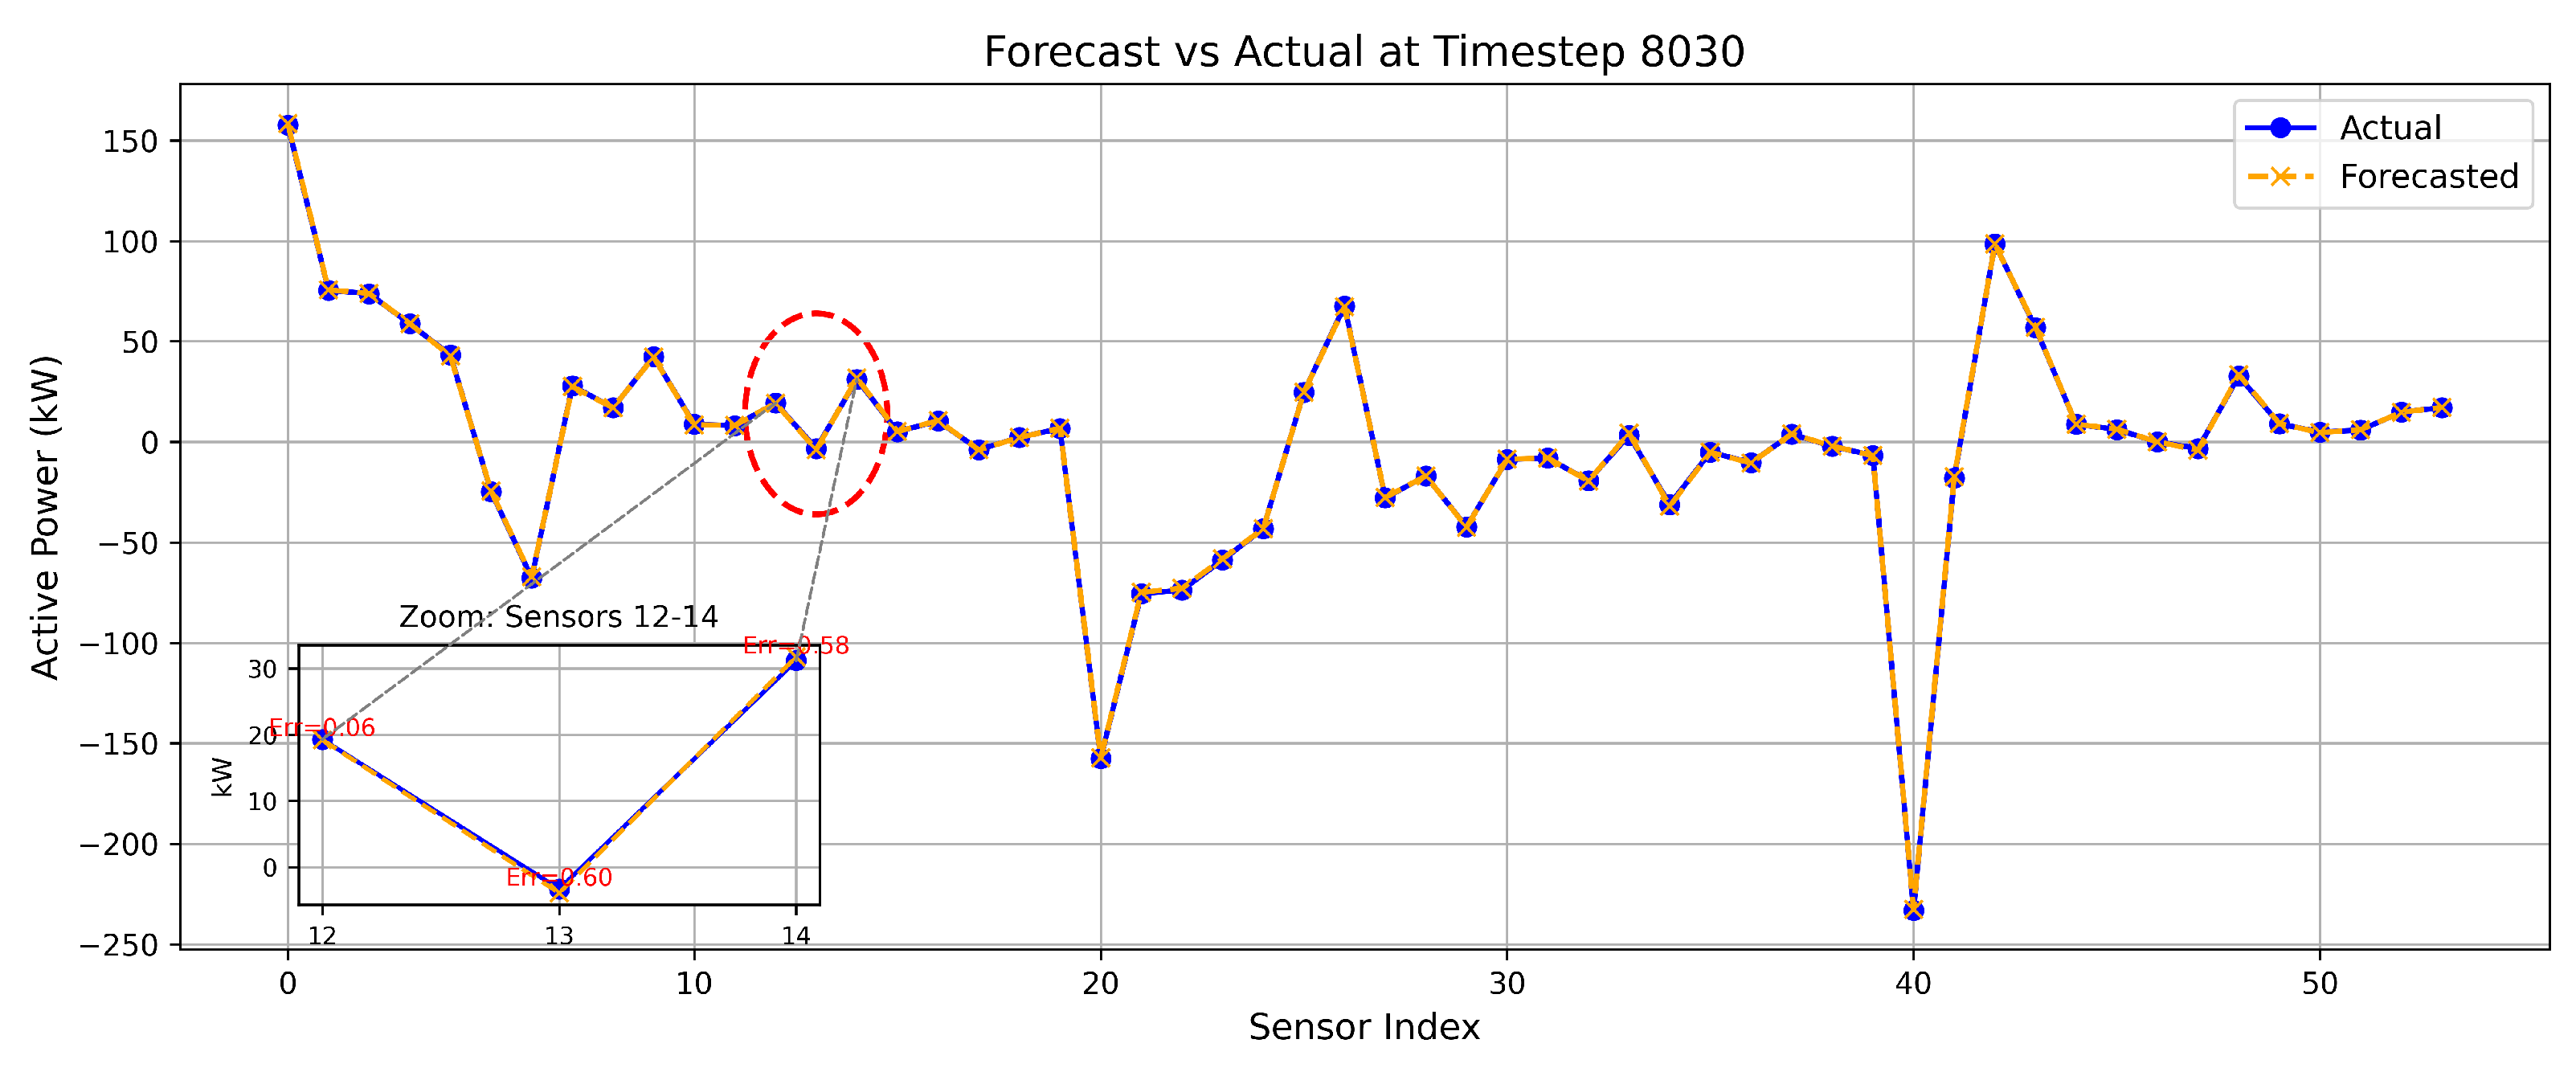
Figure 10.
FDIA detection using L2 Norm Error on Unseen Test Data.
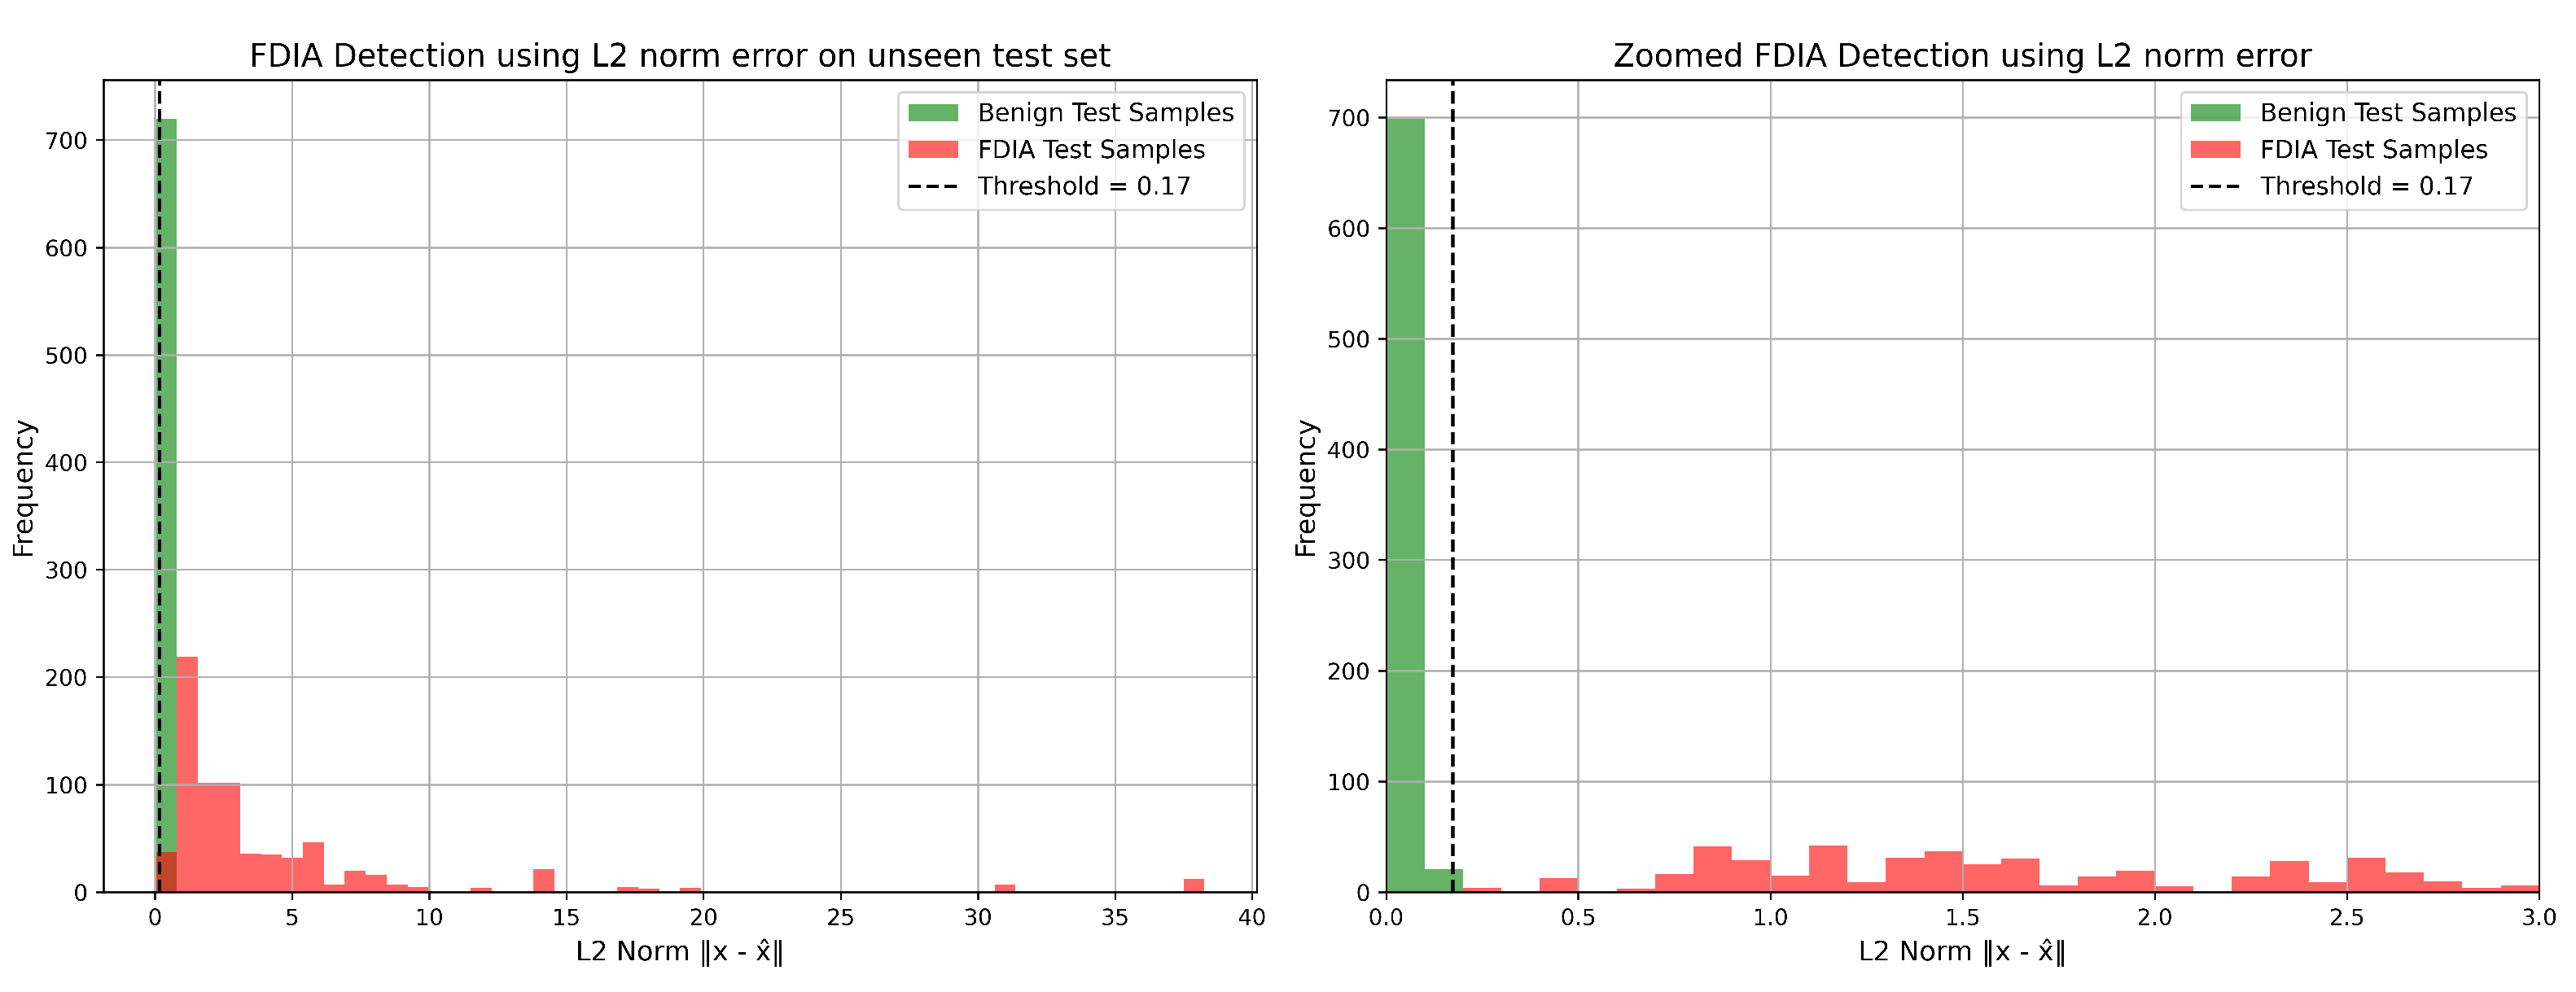
Figure 11.
IEEE 30 bus Sensor 17 - Actual vs Forecasted Power on Unseen Test Data.
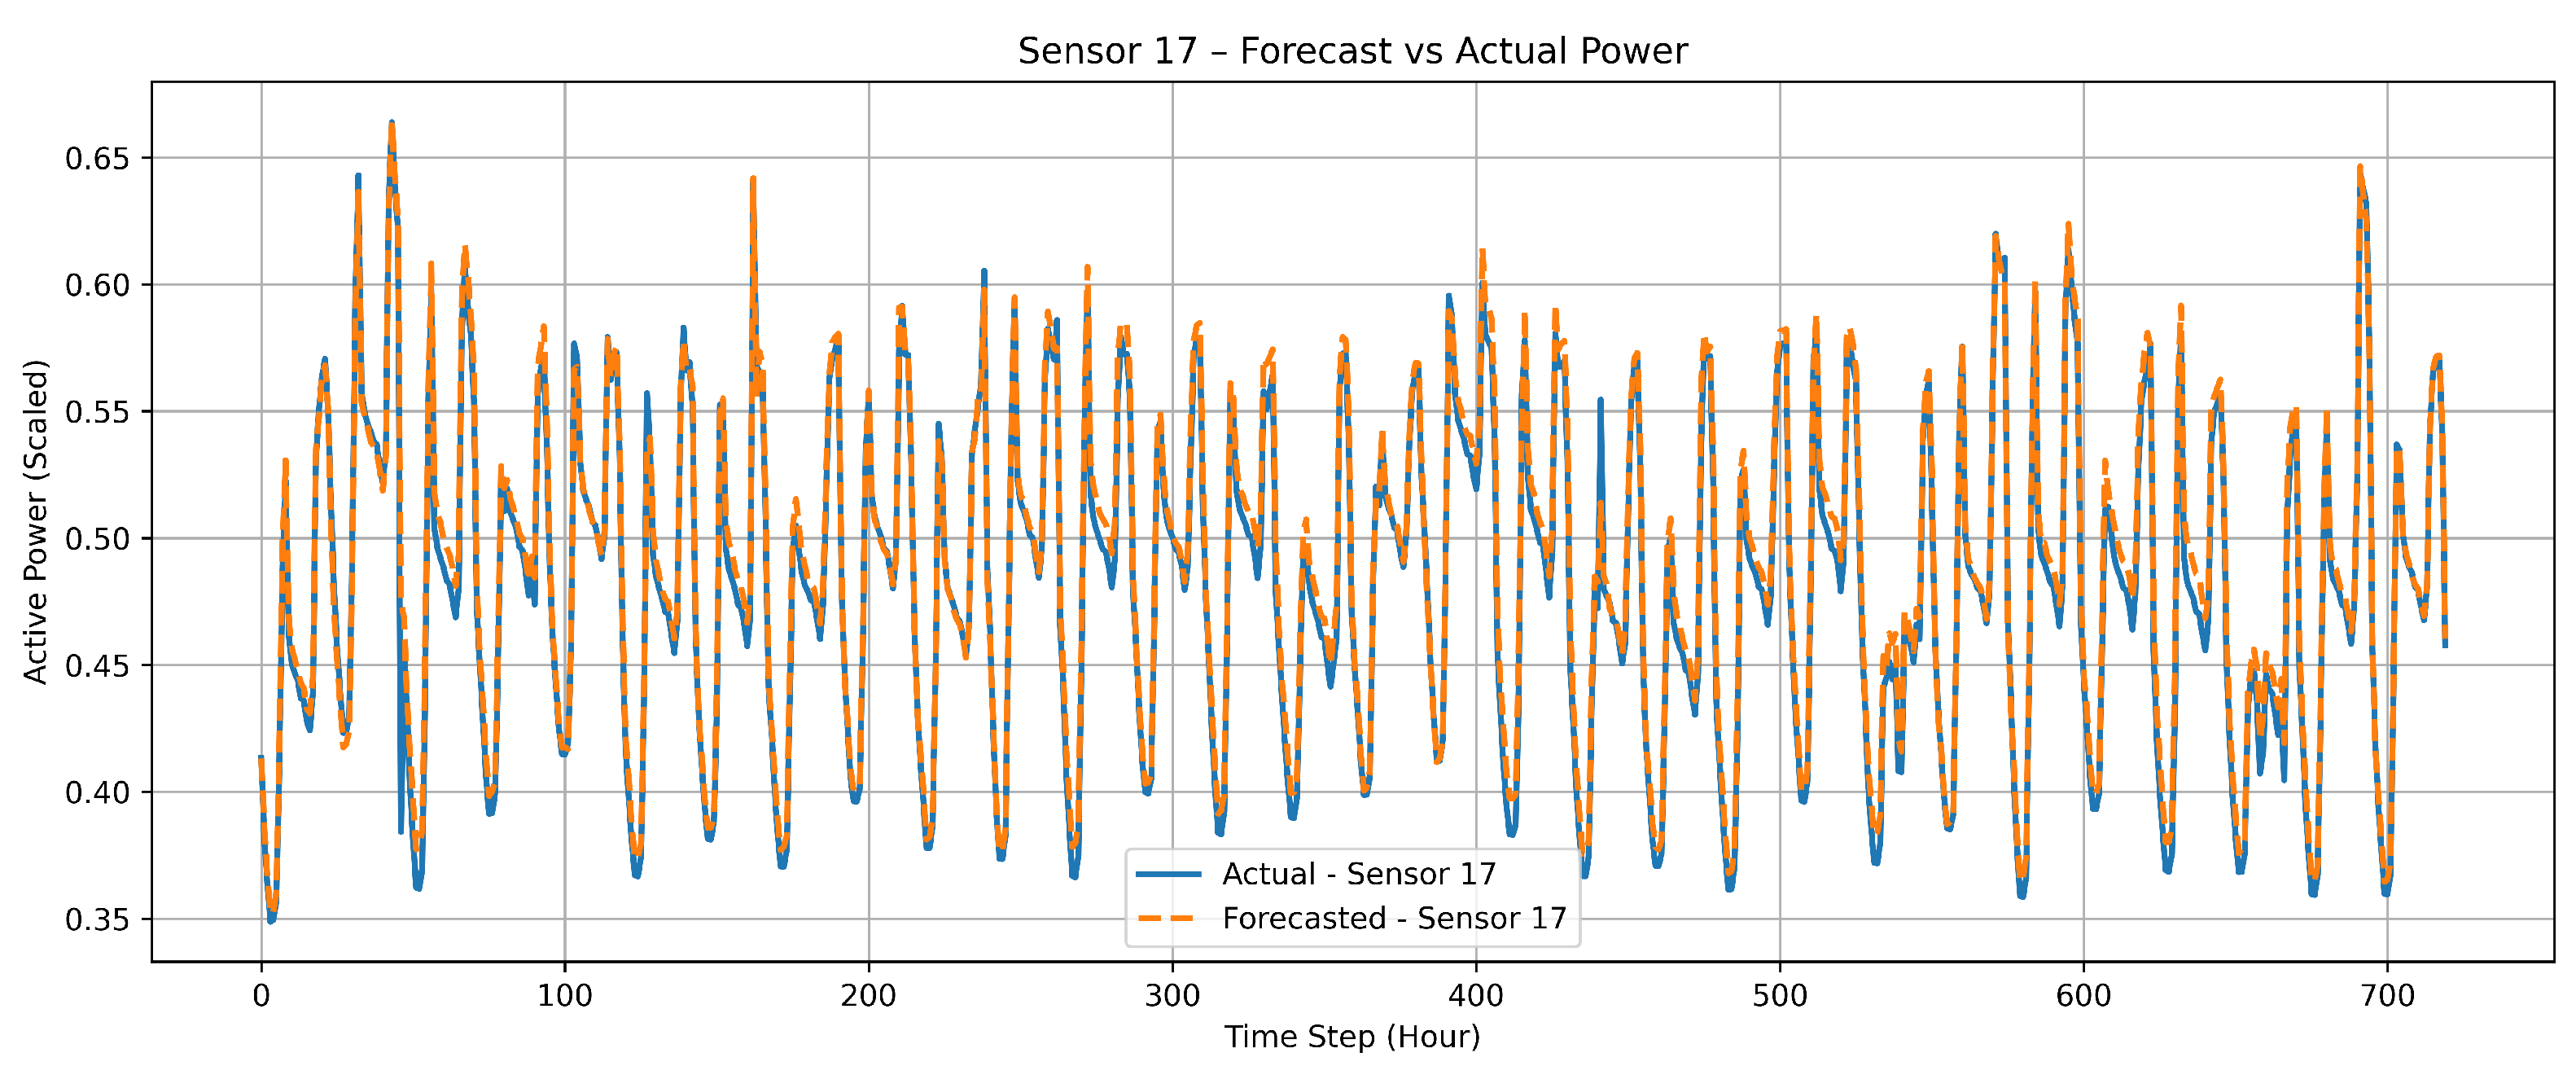
Figure 12.
IEEE 30 bus - Actual vs Forecasted Power at 8030 timestep.
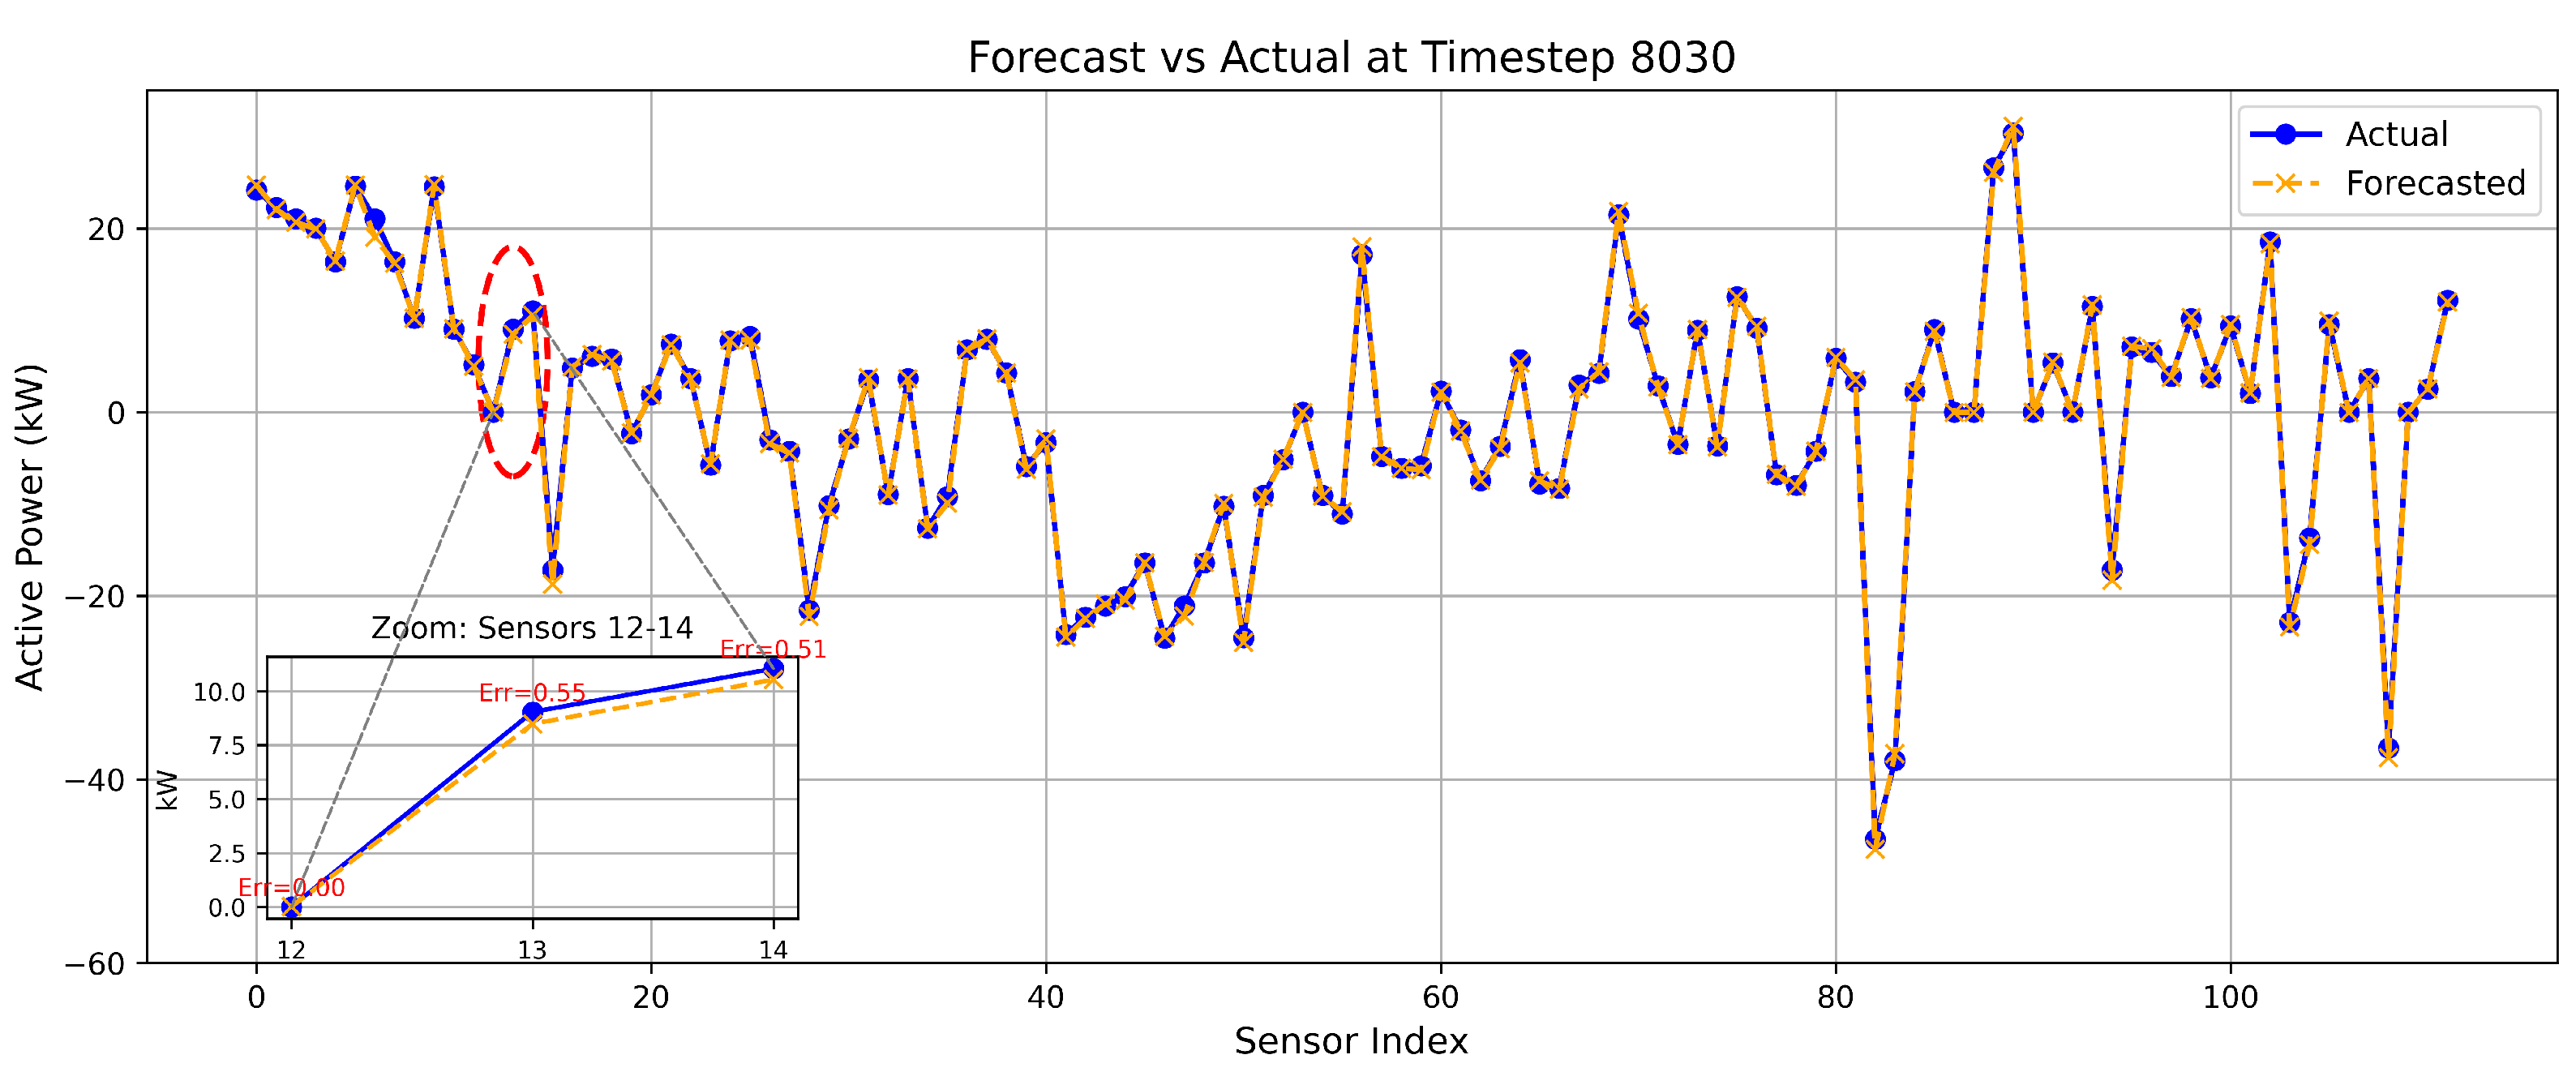
Figure 13.
FDIA detection using L2 Norm Error on IEEE 30 bus.
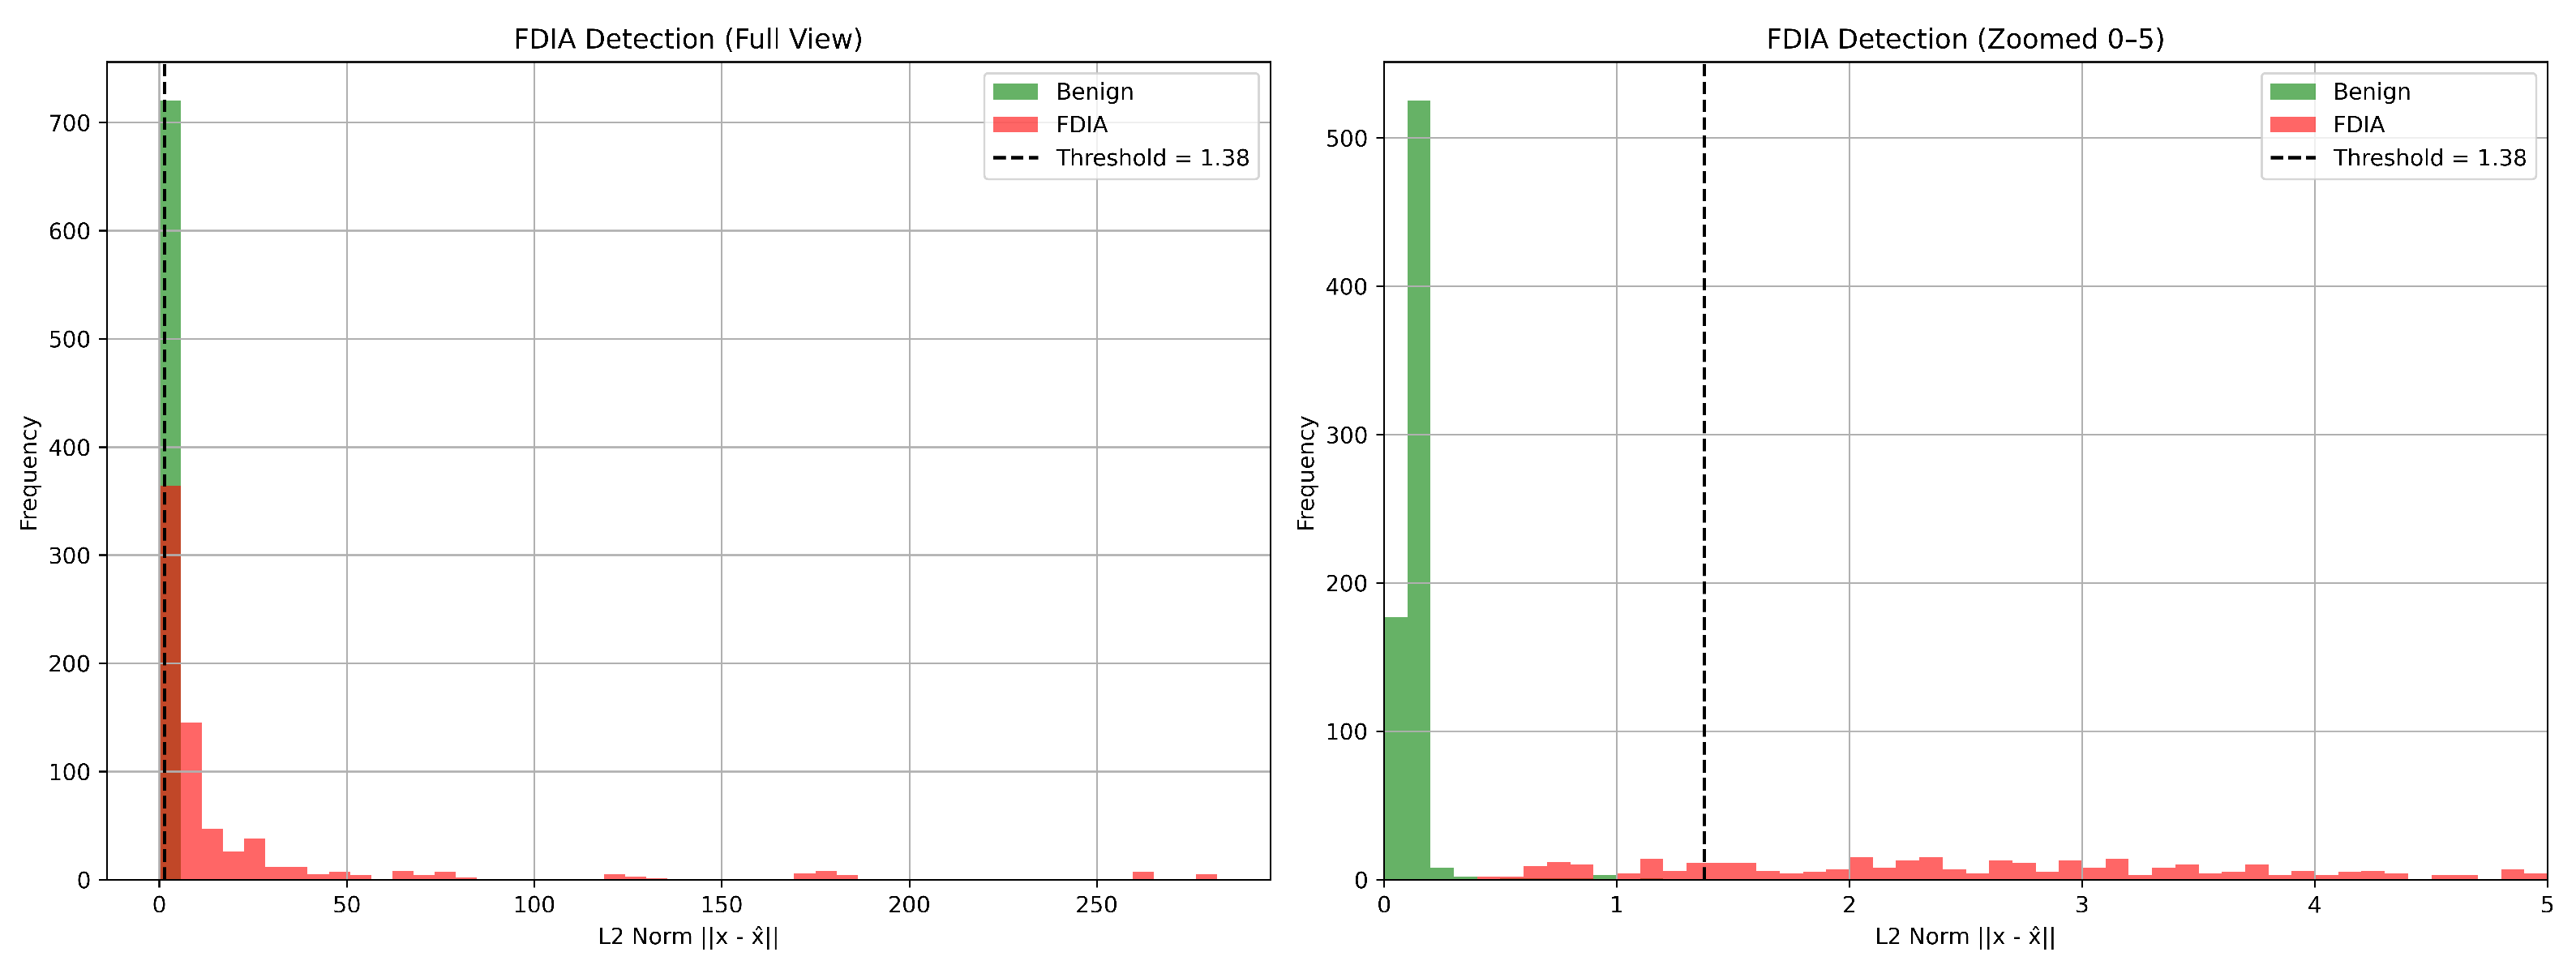

Table 1.
Performance comparison of the Forecasting Module.
| Model | MAE | MSE | RMSE | R2 |
|---|---|---|---|---|
| CNN | 10.2596 | 276.8111 | 12.1323 | N/A |
| CNN-Transformer | 2.5116 | 16.7532 | 3.1835 | N/A |
| Transformer | 10.2524 | 281.6116 | 12.2238 | N/A |
| CNN-LSTM | 1.5055 | 6.0333 | 1.9447 | N/A |
| Transformer-LSTM | 0.9866 | 2.4492 | 1.2365 | N/A |
| AE(CNN)-LSTM | 0.0259 | 0.0012 | 0.0353 | 0.9559 |
| AE(CNN)-Bi-LSTM | 0.0245 | 0.0011 | 0.0336 | 0.9587 |
| Bi-LSTM | 0.0232 | 0.0009 | 0.0304 | 0.9606 |
| Proposed Model | 0.0072 | 0.0001 | 0.0094 | 0.9797 |
Table 2.
Performance comparison of FDI detection model using Thresholds.
| Model | Threshold | Precision | Recall | F1-Score |
|---|---|---|---|---|
| CNN | 1.25 | 0.7632 | 0.8129 | 0.7534 |
| CNN-Transformer | 1.00 | 0.9516 | 0.9547 | 0.9515 |
| Transformer | 1.25 | 0.7379 | 0.7989 | 0.7284 |
| CNN-LSTM | 0.4 | 0.9893 | 0.9893 | 0.9893 |
| XTM (Transformer-LSTM) | 0.4 | 0.9962 | 0.9962 | 0.9962 |
| AE(CNN)-LSTM | 0.4155 | 0.99 | 0.994 | 0.992 |
| AE(CNN)-Bi-LSTM | 0.42 | 0.99 | 0.99 | 0.992 |
| Bi-LSTM | 0.3820 | 0.99 | 0.992 | 0.991 |
| Proposed Model | 0.1534 | 1 | 1 | 1 |
Table 3.
Performance comparison for FDIA localization on Unseen Test Data.
| Model | Precision | Recall | f1-score | RACC |
|---|---|---|---|---|
| RF | 0.9997 | 0.9997 | 0.9998 | 0.9875 |
| MLP | 0.9992 | 0.9991 | 0.9994 | 0.9667 |
Table 4.
Performance comparison of the Forecasting Module for the IEEE 30 bus system.
| Model | MAE | MSE | RMSE | R2 |
|---|---|---|---|---|
| Proposed Model | 0.0079 | 0.0001 | 0.01115 | 0.9183 |
Table 5.
Performance of proposed model for the FDI detection model using thresholds in IEEE 30 Bus System.
Table 5.
Performance of proposed model for the FDI detection model using thresholds in IEEE 30 Bus System.
| Model | Threshold | Precision | Recall | f1-score |
|---|---|---|---|---|
| Proposed Model | 1.3767 | 1 | 0.93 | 0.964 |
Table 6.
Performance comparison for FDIA localization on Unseen Test Data for IEEE 30 Bus System.
| Model | Precision | Recall | f1-score | RACC |
|---|---|---|---|---|
| RF | 0.9993 | 0.9995 | 0.9998 | 0.9889 |
| MLP | 0.9987 | 0.9981 | 0.9994 | 0.9583 |
Table 7.
Performance comparison of proposed model for FDIA localization using Threshold based approach.
Table 7.
Performance comparison of proposed model for FDIA localization using Threshold based approach.
| Model | Threshold | Precision | Recall | f1-score |
|---|---|---|---|---|
| IEEE 14 bus | 0.1734 | 1 | 0.9756 | 0.9875 |
| IEEE 30 bus | 1.3787 | 0.8662 | 0.8174 | 0.8174 |
Table 8.
Performance comparison of RF and MLP for FDIA localization across scaled attack levels.
| Model | System | Precision | Recall | f1-score | RACC |
|---|---|---|---|---|---|
| RF | IEEE 14-Bus | 0.9984 | 0.9991 | 0.9991 | 0.9792 |
| RF | IEEE 30-Bus | 0.9971 | 0.9938 | 0.9984 | 0.9125 |
| MLP | IEEE 14-Bus | 0.9991 | 0.9989 | 0.9989 | 0.9539 |
| MLP | IEEE 30-Bus | 0.9955 | 0.9931 | 0.9980 | 0.8681 |
Table 9.
Performance comparison of RF and MLP for FDIA localization during DoS attack.
| Bus Combination | Model | Precision | Recall | f1-score | RACC |
|---|---|---|---|---|---|
| 1 | RF | 0.9958 | 0.9953 | 0.9955 | 0.9069 |
| 1 | MLP | 0.9980 | 0.9889 | 0.9899 | 0.7635 |
| 2 | RF | 0.9960 | 0.9957 | 0.9959 | 0.9131 |
| 3 | RF | 0.9955 | 0.9958 | 0.9957 | 0.9219 |
Disclaimer/Publisher’s Note: The statements, opinions and data contained in all publications are solely those of the individual author(s) and contributor(s) and not of MDPI and/or the editor(s). MDPI and/or the editor(s) disclaim responsibility for any injury to people or property resulting from any ideas, methods, instructions or products referred to in the content. |
© 2025 by the authors. Licensee MDPI, Basel, Switzerland. This article is an open access article distributed under the terms and conditions of the Creative Commons Attribution (CC BY) license (http://creativecommons.org/licenses/by/4.0/).
Copyright: This open access article is published under a Creative Commons CC BY 4.0 license, which permit the free download, distribution, and reuse, provided that the author and preprint are cited in any reuse.


