
Submitted:
09 June 2025
Posted:
10 June 2025
You are already at the latest version
Abstract
The Internet of Things (IoT) is rapidly advancing toward increased autonomy; however, the inherent dynamism, environmental uncertainty, device heterogeneity, and diverse data modalities pose serious challenges to its reliability and security. This paper proposes a novel framework for embedding security awareness into IoT systems—where security awareness refers to the system’s ability to detect uncertain changes and understand their impact on its security posture. While machine learning and deep learning (ML/DL) models integrated with explainable AI (XAI) methods offer capabilities for threat detection, they often lack contextual interpretation linked to system security. To bridge this gap, our framework maps XAI-generated explanations to a system's structured security profile, enabling the identification of components affected by detected anomalies or threats. Additionally, we introduce a procedural method to compute an Importance Factor (IF) for each component, reflecting its operational criticality. This framework generates actionable insights by highlighting contextual changes, impacted components, and their respective IFs. We validate the framework using a smart irrigation IoT testbed, demonstrating its capability to enhance security awareness by tracking evolving conditions and providing real-time insights into potential Distributed Denial of Service (DDoS) attacks.
Keywords:
IoT
; Change impact
; Importance Factor
; Security awareness
1. Introduction
The rapid advancement of Internet of Things (IoT) technology has profoundly trans-formed modern life, reshaping how we interact with our surroundings and driving innovation across numerous sectors [1]. IoT systems are particularly effective at automating processes and optimizing resource utilization in areas such as smart homes, healthcare, agriculture, and industrial automation. By seamlessly interconnecting a wide range of de-vices—collectively referred to as “things”—over the internet, these systems are designed to sense, analyze, and intelligently respond to both operational and environmental conditions. Continuous monitoring of system attributes enables IoT devices to generate actionable insights, significantly enhancing task management and decision-making processes [1,2,3].
As IoT adoption continues to expand, the exponential increase in connected heterogeneous devices and their complex interactions introduces significant challenges, particularly in terms of security and system resilience. IoT ecosystems comprise a broad spectrum of components, ranging from resource-constrained sensors to high-performance cloud platforms, each characterized by distinct computational capabilities, functionalities, and communication protocols [4,5]. This inherent heterogeneity results in divergent security requirements and protection mechanisms, which can create vulnerabilities exploitable by adversaries. The high degree of interconnectedness within these systems further amplifies the risk; a compromise in a single weak component or an unexpected environmental disturbance can cascade through the network, jeopardizing the overall system’s security and functionality [4]. Moreover, suboptimal security practices by IoT users, coupled with the unpredictable nature of threats stemming from interconnected devices and services, further exacerbate these vulnerabilities.
Conventional static, rule-based decision-making strategies are inadequate for addressing the dynamic and unpredictable nature of IoT environments. In contrast, effective dynamic decision-making requires the ability to accurately interpret changes in the operational environment, reason about their implications for system security and functionality, and adapt strategies accordingly. Researchers [6,7,8] emphasize that embedding security awareness into IoT systems is essential to enable them to reason effectively about appropriate mitigation responses in the face of uncertainty. Security awareness, conceptualized as an extension of self-awareness, empowers IoT systems to detect changes in both environmental conditions and internal system attributes while concurrently assessing their implications for the system’s overall security posture [6,9,10]. This capability involves the real-time extraction of security-relevant insights by analyzing variations in the system's behavior and operating context [6,10].
A key challenge in embedding security awareness lies in processing the large volumes of heterogeneous data generated in real time. In this regard, advanced machine learning (ML) and deep learning (DL) techniques, combined with powerful computational resources, have emerged as critical enablers, driving IoT systems toward greater levels of autonomy [11,12,13]. However, while ML/DL models excel at detecting and predicting changing conditions, data processing alone is insufficient to realize full security awareness. True security awareness must go beyond detection by incorporating robust methods for interpreting the effects of uncertain or unforeseen changes on the system's security profile. This involves identifying the specific functionalities and security requirements affected by such changes and evaluating their significance within the broader application context [6,14,15]. Achieving this level of interpretability requires a formal articulation of the system’s security profile, which includes abstract representations of its security requirements, operational constraints, and the interdependencies among internal components [16].
In this paper, we propose a framework to embed security awareness into IoT systems. This security awareness is a crucial component, providing insights into the system’s security state and changes. These insights are essential for reasoning about appropriate countermeasures to defend against potential threats. Recent advances in ML/DL models have significantly improved the detection and classification of uncertain or anomalous conditions by leveraging domain-specific training data for proactive threat prediction [17,18]. At the same time, explainable artificial intelligence (XAI) techniques have enhanced the interpretability of ML/DL outputs, revealing which system and environmental attributes influence security outcomes. This interpretability helps uncover the root causes of operational anomalies and deviations [19,20].
Despite recent advancements, integrating XAI outputs with a system's security profile remains a significant challenge. Without this integration, the insights generated by XAI lack the contextual grounding necessary to support informed security decisions. In our previous work [6], we proposed a mapping technique and developed a component capable of extracting and interpreting XAI insights from a trained DL model within the context of the system’s security profile. We represent the system’s security profile using a Security Assurance Case (SAC) [16,21], which structures security claims and supporting evidence to demonstrate compliance with defined security requirements. In an SAC, high-level security requirements are articulated as top-level goals, which are then refined into sub-goals, strategies, and solutions. This hierarchical structure enables traceable reasoning about how the system satisfies its security requirements. Strategy nodes define the mechanisms or processes employed to fulfill specific security goals or functions, while solution nodes provide supporting evidence—such as test cases, analysis results, or system logs—that verify the correct operation of these mechanisms. To model the SAC, we use the Goal Structuring Notation (GSN) [22], which explicitly captures the relationships between system goals, implemented security mechanisms, operational processes, and the corresponding evidence that underpins assurance arguments.
The mapping technique from [6] extracts relevant attributes from the XAI output of each prediction instance, maps them to the attribute lists included in the evidence nodes in the SAC, and uses metadata to trace affected components. This allows us to identify which functionalities and security requirements are impacted by changed conditions. However, identifying the affected components alone does not provide a complete picture. To fully understand the impact of these changes, we must also determine the operational significance of the affected components in maintaining system functionality.
In this paper, we introduce a metric called the Importance Factor (IF) as part of our security awareness framework. Each component within the IoT system is assigned an IF value that quantifies its significance in maintaining the system’s overall operation. Identifying affected components alongside their respective IF values provide actionable insights into the impact of changes on system operation and can support the prioritization of protection measures and resource allocation. This ensures that critical functionalities receive prompt attention compared to less essential ones.
Determining the significance of a component in an IoT system is a non-trivial challenge. While components with explicitly critical functionalities are clearly important, seemingly minor components may also play pivotal roles due to the tightly coupled and interconnected nature of IoT architecture. For example, the failure of an ostensibly insignificant sensor could trigger cascading effects across the network, potentially disrupting key security mechanisms or operational processes. Therefore, systematically assigning IF values based on both functional significance and system interdependence is crucial for enhancing resilience, strengthening security, and improving autonomous decision-making in uncertain, dynamic environments.
To address this challenge, we propose a procedural approach for deriving the IF of processes within IoT systems. We model the system’s interconnections as a directed call graph [23,24], which captures structural relationships between processes by representing their invocation dependencies. To assess the criticality of each process, we adopt a weighted PageRank centrality algorithm [25], incorporating both degree centrality [26,27] and PageRank centrality [28]. We develop a procedural method to compute the IF of each process while considering the multi-layer architecture of the IoT system. Building upon our prior work [6], we extend the security profile to incorporate IF values and generate interpretation reports that include both the affected functionalities and their corresponding importance. These enriched interpretation reports serve as the foundation for security awareness, enabling intelligent, prioritized, and context-sensitive responses to evolving threats. However, designing a complete mitigation strategy in response to evolving threats is beyond the scope of this paper. The key contributions of this paper are twofold:
- We develop a procedural approach to assign an Importance Factor (IF) to each system component based on its significance to the system’s overall operation.
- We enhance the security profile by incorporating IF values and extend the security awareness framework to generate enriched interpretations that provide insights into the affected components, their functionalities, and their operational significance.
To evaluate the effectiveness of our approach, we implemented a testbed based on an IoT-enabled smart irrigation system and deployed the developed component. The experimental results demonstrate the component’s effectiveness in extracting information from XAI outputs and generating interpretations that align with the system’s security profile, thereby validating the proposed methodology.
2. Background
The advent of the IoT has transformed interactions between humans and the physical world by enabling seamless connectivity among heterogeneous devices [1]. However, the dynamic and distributed nature of IoT environments presents significant challenges to secure system management [29]. The integration of resource-constrained devices, diverse communication protocols, and vendor-specific technologies has significantly expanded the attack surface [4,29]. Common vulnerabilities stem from unsecured communication channels, physically exposed devices, and inconsistent security practices—particularly in remote or under-resourced deployments. These risks are further exacerbated by dependence on third-party services and the lack of standardized security policies.
IoT systems typically follow a multi-layered architecture, each layer responsible for distinct operational functions—from data sensing to processing, transmission, and end-user services [30,31]. A common five-layer architecture includes:
- Perception (or Physical) Layer: Houses sensing devices and collects raw data.
- Edge/Fog Layer: Offers localized computing resources to reduce latency and offload processing from the cloud.
- Cloud Layer: Manages large-scale data processing, analysis, and storage using heterogeneous cloud services [31].
- Network (or Transport) Layer: Ensures data transmission between layers.
- Application Layer: Delivers services and interfaces to end users.
While this layered architecture improves scalability and performance, it also introduces security risks at each level. For example, the Perception Layer is vulnerable to node capture, replay attacks, eavesdropping, and physical tampering. The Network Layer faces threats such as DDoS attacks, man-in-the-middle attacks, spoofing, Sybil, and sinkhole attacks [32]. Numerous studies have emphasized security as one of the most critical and unresolved challenges in IoT systems [33,34].
Given these challenges, there is a clear need for adaptive and robust security frameworks that can not only protect data and infrastructure but also respond effectively to the evolving threat landscape in IoT environments. Recent literature underscores the critical need to embed security awareness into IoT systems to address the growing complexity and evolving threat landscape [35]. Security awareness builds upon the concept of system self-awareness by enabling autonomous systems to detect and reason about changes in both environmental conditions and internal states—and to assess how these changes impact the system's security posture [6,7,8,9,10]. Achieving this requires continuous monitoring of functional, network, and environmental attributes, along with dynamic assessment of their variations to generate actionable insights. These insights are vital for implementing adaptive and resilient security responses capable of mitigating emerging threats [36].
However, the inherent complexity of IoT ecosystems—combined with the vast volume of heterogeneous and multimodal data—poses significant challenges to achieving effective security awareness. Extracting actionable insights from raw data demands advanced analytical capabilities. Machine learning (ML) and deep learning (DL) techniques have demonstrated considerable success in tasks such as threat prediction and anomaly detection within IoT environments [17,18]. Despite their effectiveness, these models often operate as “black boxes,” which limits their applicability in security-critical domains where trust, transparency, and accountability are paramount.
Explainable AI (XAI) seeks to address this limitation by enhancing the interpretability of ML/DL models, providing insights into which input features influence predictions and why [19,20]. XAI methods are generally categorized into model-specific and model-agnostic approaches. Model-specific techniques are tailored to particular types of models that are inherently more transparent, such as decision trees or linear models [37]. In contrast, model-agnostic methods can be applied to any black-box model regardless of its internal architecture, making them suitable for interpreting complex models like deep neural network (DNN). These methods typically rely on surrogate models to approximate and explain the behavior of the original black-box models [38].
For instance, Local Interpretable Model-Agnostic Explanations (LIME) [39,40,41] constructs simple, locally faithful surrogate models that mimic the behavior of the complex model around a specific instance. Similarly, SHapley Additive exPlanations (SHAP) [42,43], grounded in cooperative game theory, assigns importance to input features by calculating their marginal contributions to a model's prediction. Beyond merely justifying predictions, XAI can reveal hidden data patterns and offer deeper contextual insights [44]. These insights are critical, as mitigation strategies based on opaque or misunderstood model behavior may inadvertently introduce new vulnerabilities [6,45].
Despite its promise, effectively integrating XAI into autonomous IoT systems remains a significant challenge. The interpretation of XAI outputs often requires human expertise, limiting opportunities for automation and scalability. To truly embed security awareness into autonomous IoT environments, there is a need for an automated mechanism that can extract, interpret, and map XAI-derived insights to the system’s security profile. This would enable the identification of affected security requirements, components, or functionalities and support adaptive security decision-making [6]. While advances in XAI have enhanced interpretability, a critical gap remains in contextualizing these insights with respect to a system’s security profile. A security profile defines the system’s security requirements and abstracts the interrelationships among those requirements, along with the corresponding security mechanisms and system functionalities designed to fulfill them [16]. To systematically represent this profile, a structured methodology is required.
Security Assurance Cases (SACs) [16,21], typically modeled using Goal Structuring Notation (GSN) [22], provide a formal framework for articulating and evaluating a system’s security assurance. SACs are hierarchical and traceable structures composed of interrelated elements that collectively demonstrate the argument why a system can be considered secure, supported by both evidence and logical rationale. A SAC begins with high-level Goals that state the system’s primary security claims or objectives. These are incrementally decomposed into Subgoals and Strategies, which outline how the claims will be achieved—often by pointing to specific components, mechanisms, or design decisions. Solutions represent evidence or artifacts (e.g., test results, certificates) that support the claims. Additional elements, such as Context, Justification, and Assumptions, provide relevant environmental information, rationale for decomposition choices, and any underlying assumptions of the argument, respectively. By tracing SAC, stakeholders can clearly understand how the system satisfies its security requirements and identify dependencies between functional and security objectives, associated controls, and the supporting evidence [16,21]. GSN offers a graphical representation of SACs, using standardized shapes and links: Goals and Subgoals are rectangles, Strategies are parallelograms, Solutions are circles, and Contexts are ellipses. These elements are connected using SupportedBy (solid arrow) and InContextOf (hollow arrow) relationships [22]. A SAC template built on GSN, such as the one proposed in [16], formalizes security claims and control statements, providing a robust foundation for modeling a system’s security profile. This structured abstraction is a crucial step toward embedding security awareness into autonomous IoT systems.
Nevertheless, effective security awareness requires more than just interpreting how uncertainty impacts the system’s security profile—it also demands an understanding of how these changes influence overall system functionality. Mapping XAI-generated insights into SAC structures helps bridge the interpretability gap by aligning model decisions with defined system behaviors and security objectives [6]. This alignment strengthens the precision of component-level impact assessments and provides a clearer picture of the system’s evolving security posture. However, merely identifying which components are affected offers a limited view. It is equally important to assess the operational significance of those components within the system. Node centrality measures—widely used in network flow analysis to estimate the importance of nodes—offer a quantitative means to evaluate component criticality [25,27]. To apply these metrics, the system architecture can be modeled as a directed graph using a call graph representation [23,24], which captures process-level interactions between components. Centrality metrics such as Degree Centrality and PageRank [25,26,27,28] can then be employed to evaluate each component's influence and priority in sustaining system operations. This graph-based approach enables more informed and strategic threat response by not only identifying affected components, but also understanding the potential ripple effects of disruptions—how failures may propagate and impact other parts of the system.
3. Approach
This paper presents a systematic approach for determining an Importance Factor (IF) to each component within an IoT system, along with its incorporation into the security awareness framework. We detail the key elements of the proposed framework designed to embed security awareness into the IoT infrastructure. To validate our approach, we have implemented a smart irrigation system testbed and demonstrate the effectiveness of the framework using this real-world scenario.
3.1. IoT Based Smart Irrigation System Testbed
Our designed IoT based Smart Irrigation System testbed has five layers, by adopting general IoT architecture [30,31], as shown in Figure 1. The Physical Layer consists of soil moisture sensors for monitoring soil water content, along with temperature and humidity sensors to capture ambient environmental conditions. These sensors are integrated through a hardware circuit centered around a Raspberry Pi, enabling real-time data acquisition and control. In the testbed environment, a buzzer is used as an actuator to simulate the behavior of an irrigation mechanism. This configuration supports controlled testing and validation of automated decision-making and response strategies within the system. To support data acquisition, the hardware circuit incorporates an Analog-to-Digital Converter (ADC) that converts the analog signals generated by the sensors into digital data. This conversion enables Raspberry Pi devices, positioned at the Edge Layer, to collect and process sensor input effectively. Within the Physical Layer, two primary processes are executed: ReadSensor, which captures real-time data from the sensors, and SendSensorDataToEdge, which transmits the digitized data to the Edge Layer. Communication between the Physical and Edge Layers is facilitated using the User Datagram Protocol (UDP), a lightweight and efficient protocol well-suited for real-time, low-overhead sensor data transmission.
The Edge Layer comprises Raspberry Pi devices responsible for collecting, preprocessing, and aggregating sensor data before forwarding it to a centralized server in the Cloud Layer. Upon receiving sensor data, each Raspberry Pi executes a sequence of processes, illustrated in Figure 1. The CollectSensorData process temporarily stores raw sensor readings for a predefined time window to support temporal analysis. The CleaningSensorData process enhances data integrity by filtering out anomalies such as null values, duplicate entries, and corrupted records. Next, the AggregateSensorData process computes statistical summaries (including average, minimum, and maximum values) to represent prevailing environmental conditions (e.g., soil moisture) over the specified interval. The final step in this layer, SendSensorDataToCloud, transmits the aggregated data to the Cloud Layer using the Transmission Control Protocol (TCP), which ensures reliable and ordered data delivery, and incorporates basic security mechanisms to protect data during transmission.
The Cloud Layer functions as the computational core or “brain” of the IoT system, responsible for executing advanced analytics and managing sensitive data. On the server side, a ML model is deployed to predict soil moisture levels and inform automated control decisions. We designed an automated pipeline that manages the end-to-end flow from data reception to actuator decision-making based on the model's output. The pipeline initiates with the ReceivedSensorData process, which stores aggregated data from the Edge Layer into a local repository and logs the status of each transaction. The subsequent PreProcessSensorData stage formats and encodes the data, transforming it into a valid input instance for the ML model. This instance is then processed by FeedSensorDataToMLModel, which forwards the data to the prediction model. The ExecuteMLModel process activates the model to generate a prediction, which is logged by GetMLModelPrediction. The final stage, DecideToTriggerActuator, evaluates the prediction outcome and determines whether the irrigation valve actuator should be activated or not. The resulting decision is communicated along two paths:
- To ShowAnalysisResult&TriggerDecision at the Application Layer, where the user is notified of the prediction and actuator decision.
- To the Edge Layer, where the SendTriggerToActuator process relays the command to the Physical Layer. In this layer, the TriggerActuatorToActivate process initiates actuator activation, which is simulated in the testbed using a buzzer that represents the irrigation valve.
Communication from the Cloud to the Edge Layer also uses TCP to ensure reliable data transmission, whereas communication from the Edge to the Physical Layer uses UDP, favoring low-latency, lightweight messaging suitable for real-time actuation. The Application Layer hosts the ShowAnalysisResult&TriggerDecision process, which provides a user-friendly interface for visualizing analysis outcomes and system decisions. This interface also supports manual control, allowing users to override or trigger actuators as needed. Data exchange between Cloud and Application Layers is conducted over the Hypertext Transfer Protocol (HTTP), enabling seamless web-based interaction.
The Network Layer forms the foundational infrastructure of the system, comprising routers, Wi-Fi access points, and a network server responsible for managing traffic flow and facilitating end-to-end communication across all layers. To strengthen the system’s resilience against cyberattacks and security threats, it is crucial to secure the communication channels between different layers of the IoT architecture. However, the inherent heterogeneity of IoT ecosystems—characterized by diverse devices, communication protocols, and varying security configurations—introduces vulnerabilities that adversaries can exploit to disrupt system operations.
Addressing these risks requires embedding security awareness into the system, enabling it to detect anomalous changes and assess their potential impact in accordance with the unique characteristics and operational constraints of each architectural component. In our IoT-based smart irrigation system testbed, we focus on uncertain and potentially disruptive events such as Distributed Denial of Service (DDoS) attacks to prevent seamless communication among different layers in the IoT architecture. To mitigate these threats, the testbed integrates a DL model that predicts potential DDoS attacks by analyzing critical attributes of network traffic. The CollectNetworkTraffic process is responsible for capturing traffic data, extracting relevant features, and generating monitoring instances for further analysis.
The testbed leverages the publicly available Edge-IIoTset dataset [46], a comprehensive and heterogeneous collection of IoT cybersecurity traffic data covering multiple layers of IoT applications. This dataset includes both benign and malicious traffic, featuring a broad range of DDoS attack scenarios targeting protocols such as TCP, UDP, and HTTP. Within the testbed, the CollectNetworkTraffic process is configured to load and prepare instances from this dataset for subsequent analysis by the DL-based detection model.
The SendNetworkTrafficDataToCloud process transmits these prepared instances to a DL-based detection model hosted in the Cloud Layer. There, the model analyzes the data and classifies it as either benign or malicious. A dedicated prediction pipeline supports this workflow, comprising several processes—ranging from ReceivedNetworkTrafficData to GetDLModelPrediction, as shown in Figure 1.
Crucially, this pipeline works as a security awareness component that not only detects potential DDoS attacks but also generates interpretive insights into the network traffic attributes contributing to anomalous behavior. Furthermore, it evaluates the impact of these anomalies on the system’s functionality and security posture. At the core of this component lies the GenerateAttackStatus&ConsequenceResult process, which synthesizes detailed reports on the predicted attack, the changed conditions and outlines the potential consequences of detected threats on the system’s operational behavior and overall security profile. This testbed configuration serves as the foundation for describing and validating the proposed methodology for intelligent, security-aware IoT systems.
3.2. IoT DDoS Dataset and DNN Model
As previously outlined, the testbed incorporates a DL pipeline specifically designed to detect DDoS attacks and generate actionable insights that embed security awareness into the testbed. At the core of this pipeline is a Deep Neural Network (DNN) model, trained using 19 carefully selected features from the Edge-IIoTset dataset [46], which contains labeled IoT network traffic spanning three communication protocols. To optimize detection across different DDoS attack types—namely TCP, UDP, and HTTP—protocol-specific feature subsets were identified based on expert recommendations from [47]. For example, in the case of TCP-based DDoS attacks, which exploit the TCP three-way handshake by flooding the target with SYN packets, a set of critical features (referred to as TCP attributes) is selected, as detailed in Table 1. Corresponding feature sets were also derived for UDP and HTTP-based attacks.
The DL pipeline consists of several components starting from ReceivedNetworkTrafficData, which captures traffic data. For simulation purposes within our testbed environment, traffic instances are passed sequentially from the dataset [46].Next, PreprocessNetworkTrafficData filters out irrelevant or noisy features from the network traffic instance and only includes the selected 19 features. Categorical variables like http.request.method, http.referer are label-encoded to facilitate numerical processing. Continuous features are normalized using the MaxAbsScaler, ensuring efficient training convergence. Finally, the FeedNetworkTrafficDataToDLModel module feeds the preprocessed data into the DNN for inference. The model is trained to classify three distinct DDoS attack types, as summarized in Table 2.
For DDoS attack detection, we employ a modified ResNet50-1D-CNN model, an adaptation of the well-established ResNet50 architecture tailored for one-dimensional network traffic data. ResNet50 is widely recognized for its deep residual learning capabilities [48], which allow the construction of very deep networks without suffering from vanishing gradient issues. Training is performed over 50 epochs, with early stopping and learning rate reduction applied to prevent overfitting and enhance generalization. The final trained model achieves a high accuracy of 99%, demonstrating strong performance and robustness across different DDoS attack types. We selected this model due to its high detection accuracy and its effectiveness on our dataset. However, this work does not advocate for ResNet50-1D-CNN as a universal solution. The choice of ML/DL models should be determined by each organization's specific security requirements and the nature of their datasets.
Once deployed in the testbed, the ResNet50-1D-CNN model continuously analyzes incoming network traffic through the ExecuteDLModel process within the pipeline (as illustrated Figure 1). When a potential DDoS attack is detected, both the model’s prediction and the corresponding network traffic instance are passed to the GenerateAttackStatus&ConsequenceResult process. This process generates a structured and insightful report on the system’s current security state. The resulting output can be leveraged to assess system vulnerability and prioritize appropriate responses. While the actual development of mitigation strategies is beyond the current scope of this paper, this structured awareness output lays the foundation for future work in dynamic and informed risk mitigation planning.
3.3. Local Explanation of the DNN Model and Information Extraction
LIME (Local Interpretable Model-agnostic Explanations) [39,40,41] is an XAI technique that provides local explanations for individual model predictions. In the context of DDoS detection, LIME highlights the specific attributes and their values that most influenced the model’s decision for a given network traffic instance. LIME operates by perturbing the input data instance in the vicinity of its original attribute values, generating a neighborhood of synthetic samples. It then fits a sparse linear surrogate model to approximate the behavior of the complex model (in this case, our ResNet50-1D-CNN) within that local region. Each perturbed sample is weighted based on its proximity to the original instance, ensuring the surrogate model focuses on the most relevant variations.
The resulting LIME explanation identifies which attributes had the most significant impact on the model's prediction, along with the specific conditions under which they influence the outcome. These insights help uncover patterns or anomalies that may indicate uncertain or suspicious behaviors potentially leading to a DDoS attack. Thus, LIME not only enhances interpretability but also contributes to a deeper understanding of the factors underlying security threats. As illustrated in Figure 2:
- Left Side (NOT DDoS_UDP): Displays attributes that contributed to the prediction that the instance is not a DDoS_UDP attack.
- Right Side (DDoS_UDP): Highlights attributes that pushed the prediction toward a DDoS_UDP classification.
Figure 2.
LIME explanation for one network traffic instance.
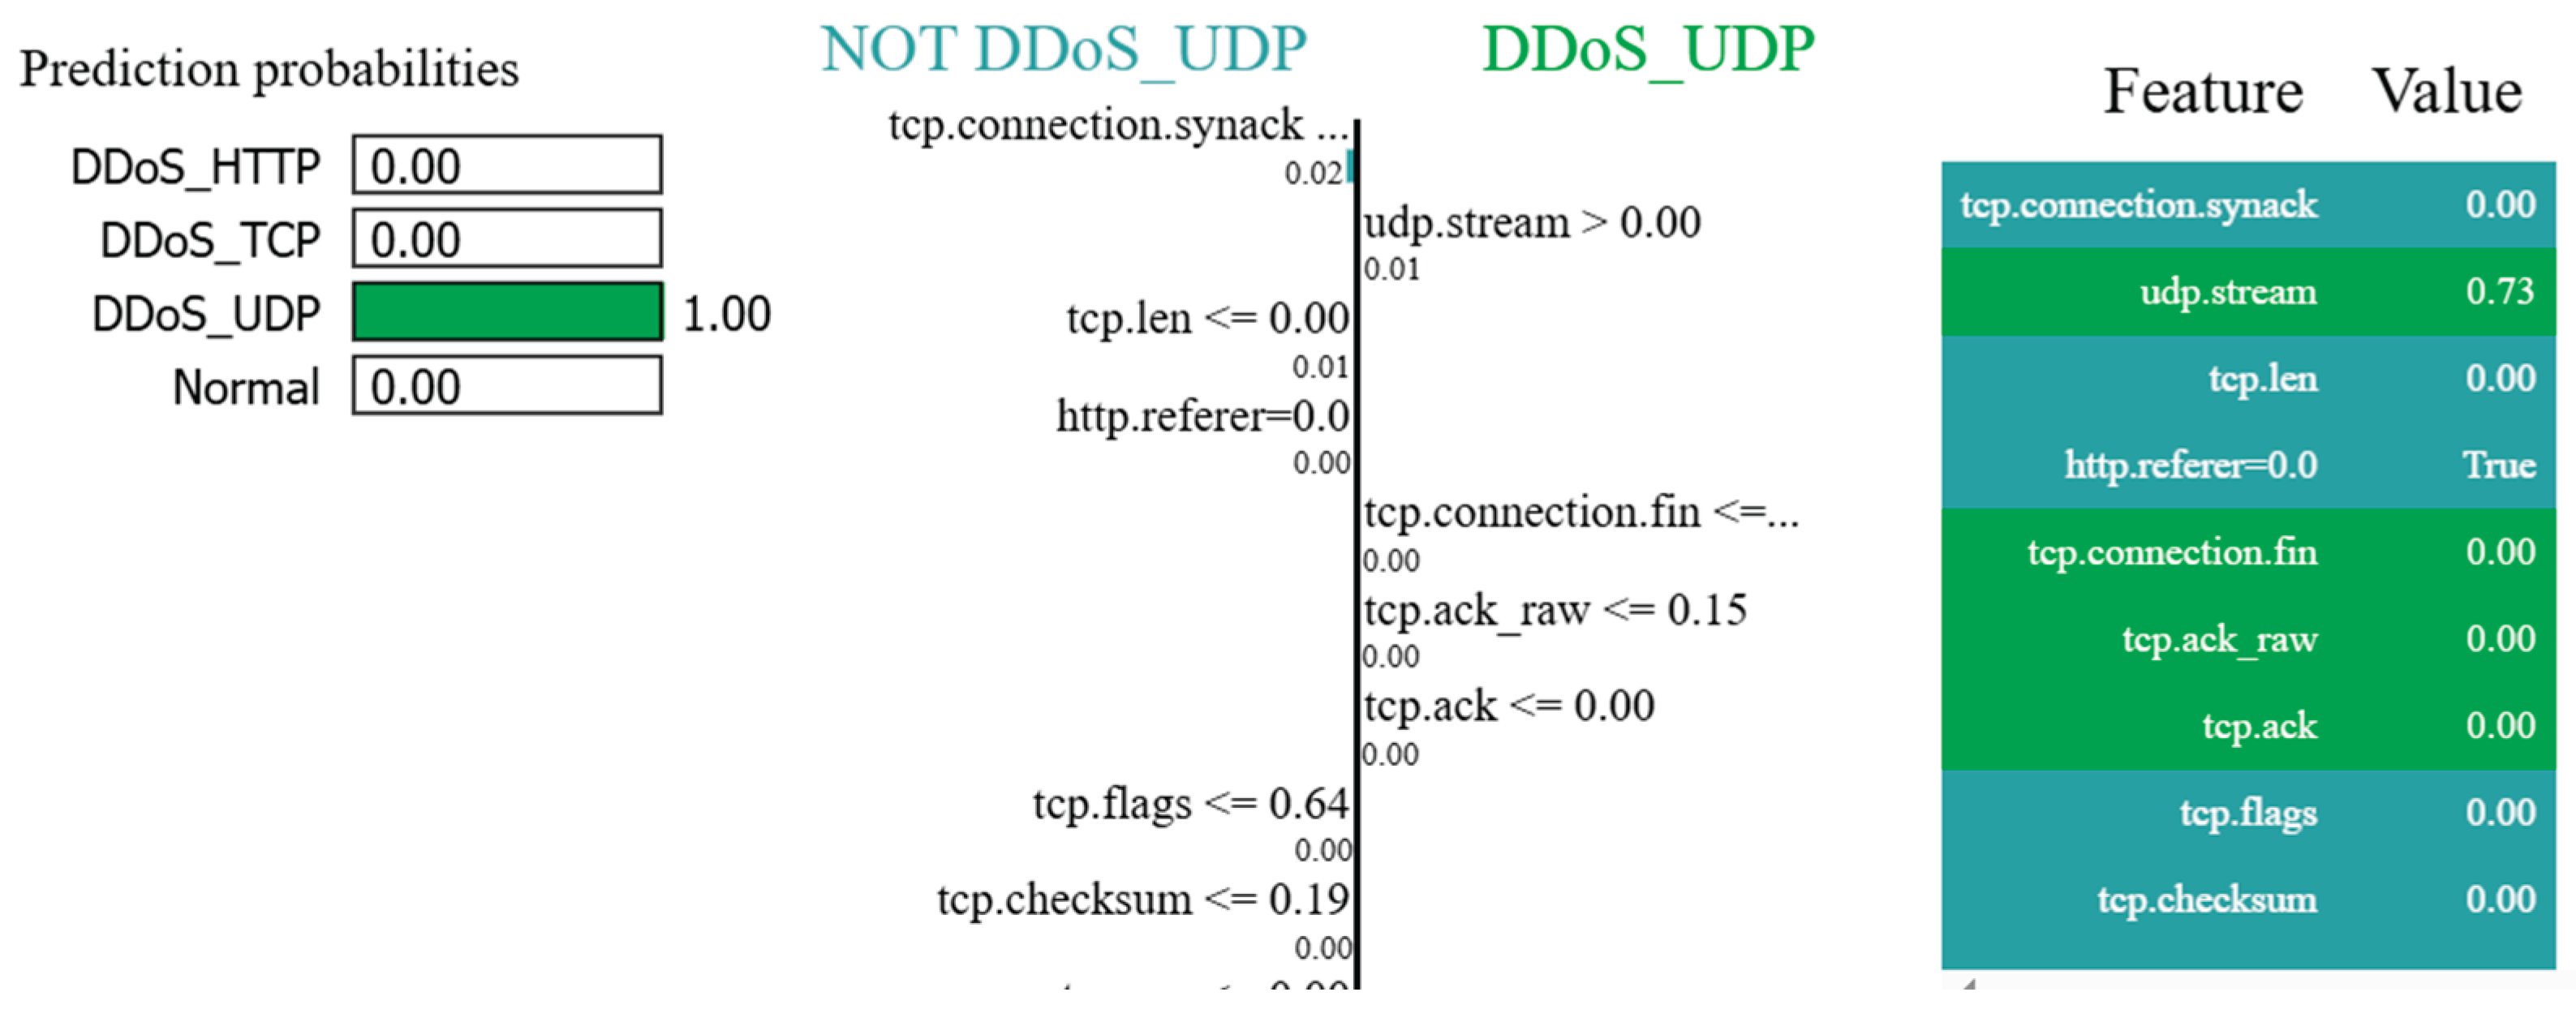
Each horizontal bar represents an attribute, where the length indicates the magnitude of its influence and the direction shows whether it supports or opposes the predicted class. For example: udp.stream > 0.00 (0.01): Indicates that a high volume of UDP packets (where the original value is 0.73) contributes positively to a DDoS_UDP classification. This may reflect an attempt to overwhelm servers through excessive UDP traffic.
While LIME provides valuable instance-level explanations, it does not fully address how these changing conditions affect the system’s broader security posture. To bridge this gap, we integrate an automated interpretation generator within the GenerateAttackStatus&ConsequenceResult process. This component enriches local explanations by mapping them into the system’s overarching security profile, offering higher-level insights into how specific attribute variations impact both system functionality and overall risk exposure.
The GenerateAttackStatus&ConsequenceResult takes two primary inputs: i) local explanations generated by LIME from DNN prediction instances, and ii) a Security Assurance Case (SAC), which serves as the system's security profile, as illustrated in Figure 3. A parsing module, parseExplanation, processes each explanation and generates a set of ordered attribute-state pairs by considering the top 10 attributes which positively contributes to the prediction, denoted as:
Here, refers to an attribute from the explanation, and denotes its corresponding condition. For instance, based on the LIME explanation of a DDoS_UDP attack shown in Figure 2, parseExplanation would produce the set:
This parsing step is repeated for every prediction instance to capture the behavior patterns reflected in the explanation. The GenerateAttackStatus&ConsequenceResult process also takes as input a corresponding SAC instance, which articulates security compliance arguments tied to the system’s security requirements. Within this step, the ExtractGoalAttributeRelation process extracts dependencies between SAC goals and system attributes. The output is a set of tuples:
where: is a goal defined within the SAC,
is the system process responsible for fulfilling that goal,
is the set of attributes linked to the goal via solution nodes in the SAC and used within ,
is the Importance Factor (IF) assigned to each process based on its contribution to the overall system’s operation. Details on how IF is computed are provided in a later section.
The relationships among processes and their respective goals are modeled through SupportedBy links in the SAC structure.
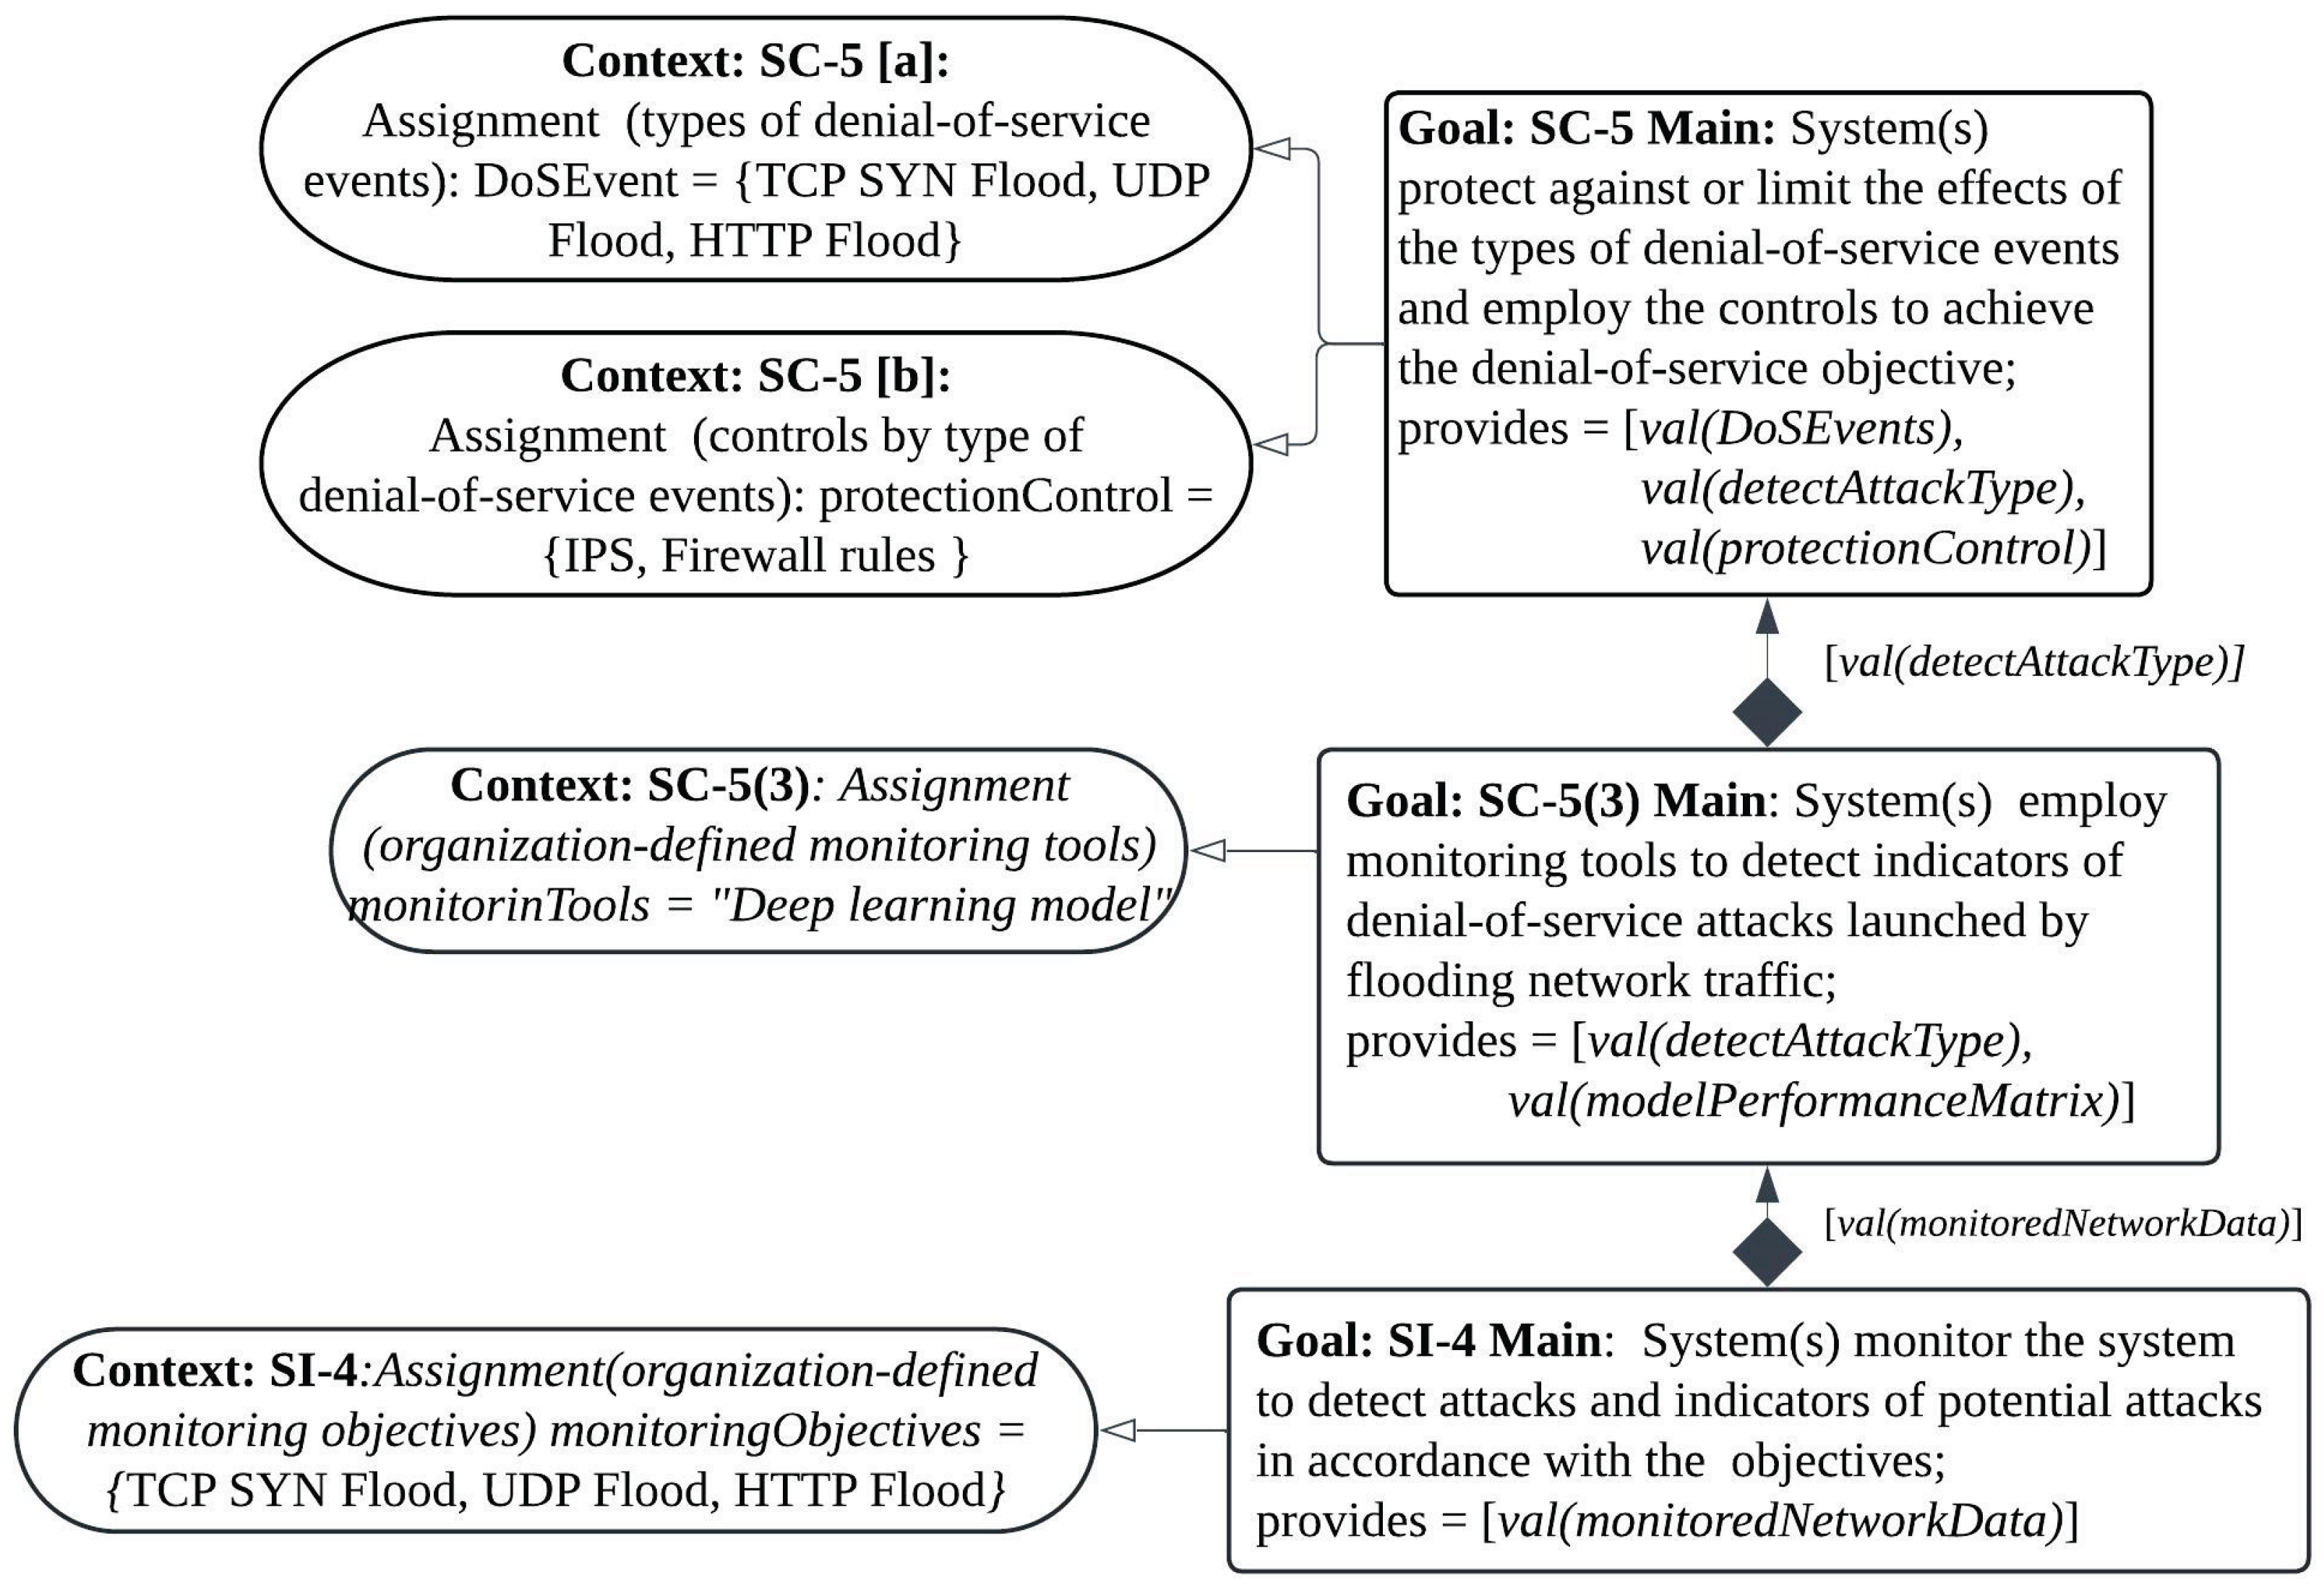
For the testbed, we choose three security controls from the NIST SP 800-53 [49] framework as security requirements with an aim at mitigating DDoS threats. The statements of those security controls are expressed as the top-level goal in the SAC, as shown in Figure 4, Those goals are:
SC-5: “System(s) protect against or limit the effects of denial-of-service events and employ the necessary controls to achieve this objective.”
This goal is supported by two related security control goals:
SC-5(3): “System(s) employ monitoring tools to detect indicators of denial-of-service attacks initiated via network traffic flooding.”
SI-4: “System(s) continuously monitor to detect attacks and potential indicators of compromise in alignment with security objectives.”
Figure 4.
Security controls chosen as security requirements from NIST SP 800-53.
We adopt the GSN [22] template and initialization methodology for constructing SAC as introduced by Jahan et al. in [16]. The SAC instance, structured using GSN, organizes the assurance argument hierarchically to demonstrate compliance with the specified security controls. A partial view of this argument structure is illustrated in Figure 5. In GSN, goals, represented as rectangles, articulate the security requirements that must be satisfied. Each top-level goal is further refined into one or more strategies (parallelograms) or sub-goals, capturing the logical decomposition and interdependencies among system processes involved in fulfilling the requirement. These interdependencies are represented using SupportedBy relationships, visualized as filled arrows connecting related nodes. Solution nodes (circles) provide supporting evidence that specific system processes are functioning as intended and are capable of meeting the corresponding goals. This structured approach allows the SAC to trace how individual processes contribute to overall system assurance and facilitates the integration of explainable AI insights into the broader security argument.
In the ExtractGoalAttributeRelation process, the SAC instance is encoded into a tree structure based on the SupportedBy relationships defined in the GSN model. In this tree, top-level goals act as root nodes, and the leaf nodes represent solution nodes providing evidence. The objective is to trace all possible dependency paths from each root goal to its corresponding solution nodes. To achieve this, a depth-first search (DFS) [50] traversal is employed. For each root node, a stack is maintained, where each stack item holds a list representing the current path from the root to a given node. If a node has no children, it is considered a leaf node, and the path is stored in the set AllPaths. Otherwise, the current path is extended to each child node and pushed back onto the stack for further traversal.
An example, a path extracted through this traversal is:
SI-4 Main | S9 | SI-4 Req | S10 | G-10 | S11 | G-13 | Sn6
This path illustrates that the solution node Sn6, which monitors UDP traffic attributes, provides evidence about behaviors in network traffic conforming to the UDP protocol. From this, it can be inferred that a potential DDoS_UDP attack is launched by manipulating UDP attributes and could compromise goal G-13, which ensures the functionality "Transmit sensor data readings to the edge layer." This, in turn, would affect the SendSensorDataToEdge process (linked via strategy S11), demonstrating how such manipulation cascades through the assurance case, eventually impacting the top-level security control goals such as SI-4 Main. This kind of dependency tracing is critical for understanding the cascading effects of component compromise and identifying affected goals and processes.
The ExtractGoalAttributeRelation process outputs a set of dependencies in the following form:
Here, the tuple denotes that goal G-13 could be degraded since the process, SendSensorDataToEdge, which is associated with the attribute udp.stream has been impacted by the change of udp.stream attribute’s state. And assigned an IF to SendSensorDataToEdge is 0.016.
Next, the MapExplanationWithSAC process maps attributes from the local explanation set to entries in It extracts and compiles information about which goals and processes are affected by the current states of attributes (denoted by st in each tuple). The output of this step is:
This mapping forms the basis for generating a high-level interpretation.
The GenerateInterpretation process uses mapped information to generate a structured interpretation of the explanation, illustrated in Figure 6, in JSON format. The resulting JSON object contains two major substructures:
- interpretation_info: A nested object outlining affected attributes and their states, associated processes, corresponding goals, and IFs.
- traffic_info: A summary of the model's prediction (e.g., DDoS_UDP with 99% confidence) and the relevant attack context.
Figure 6.
Generated JSON report in a structured form.
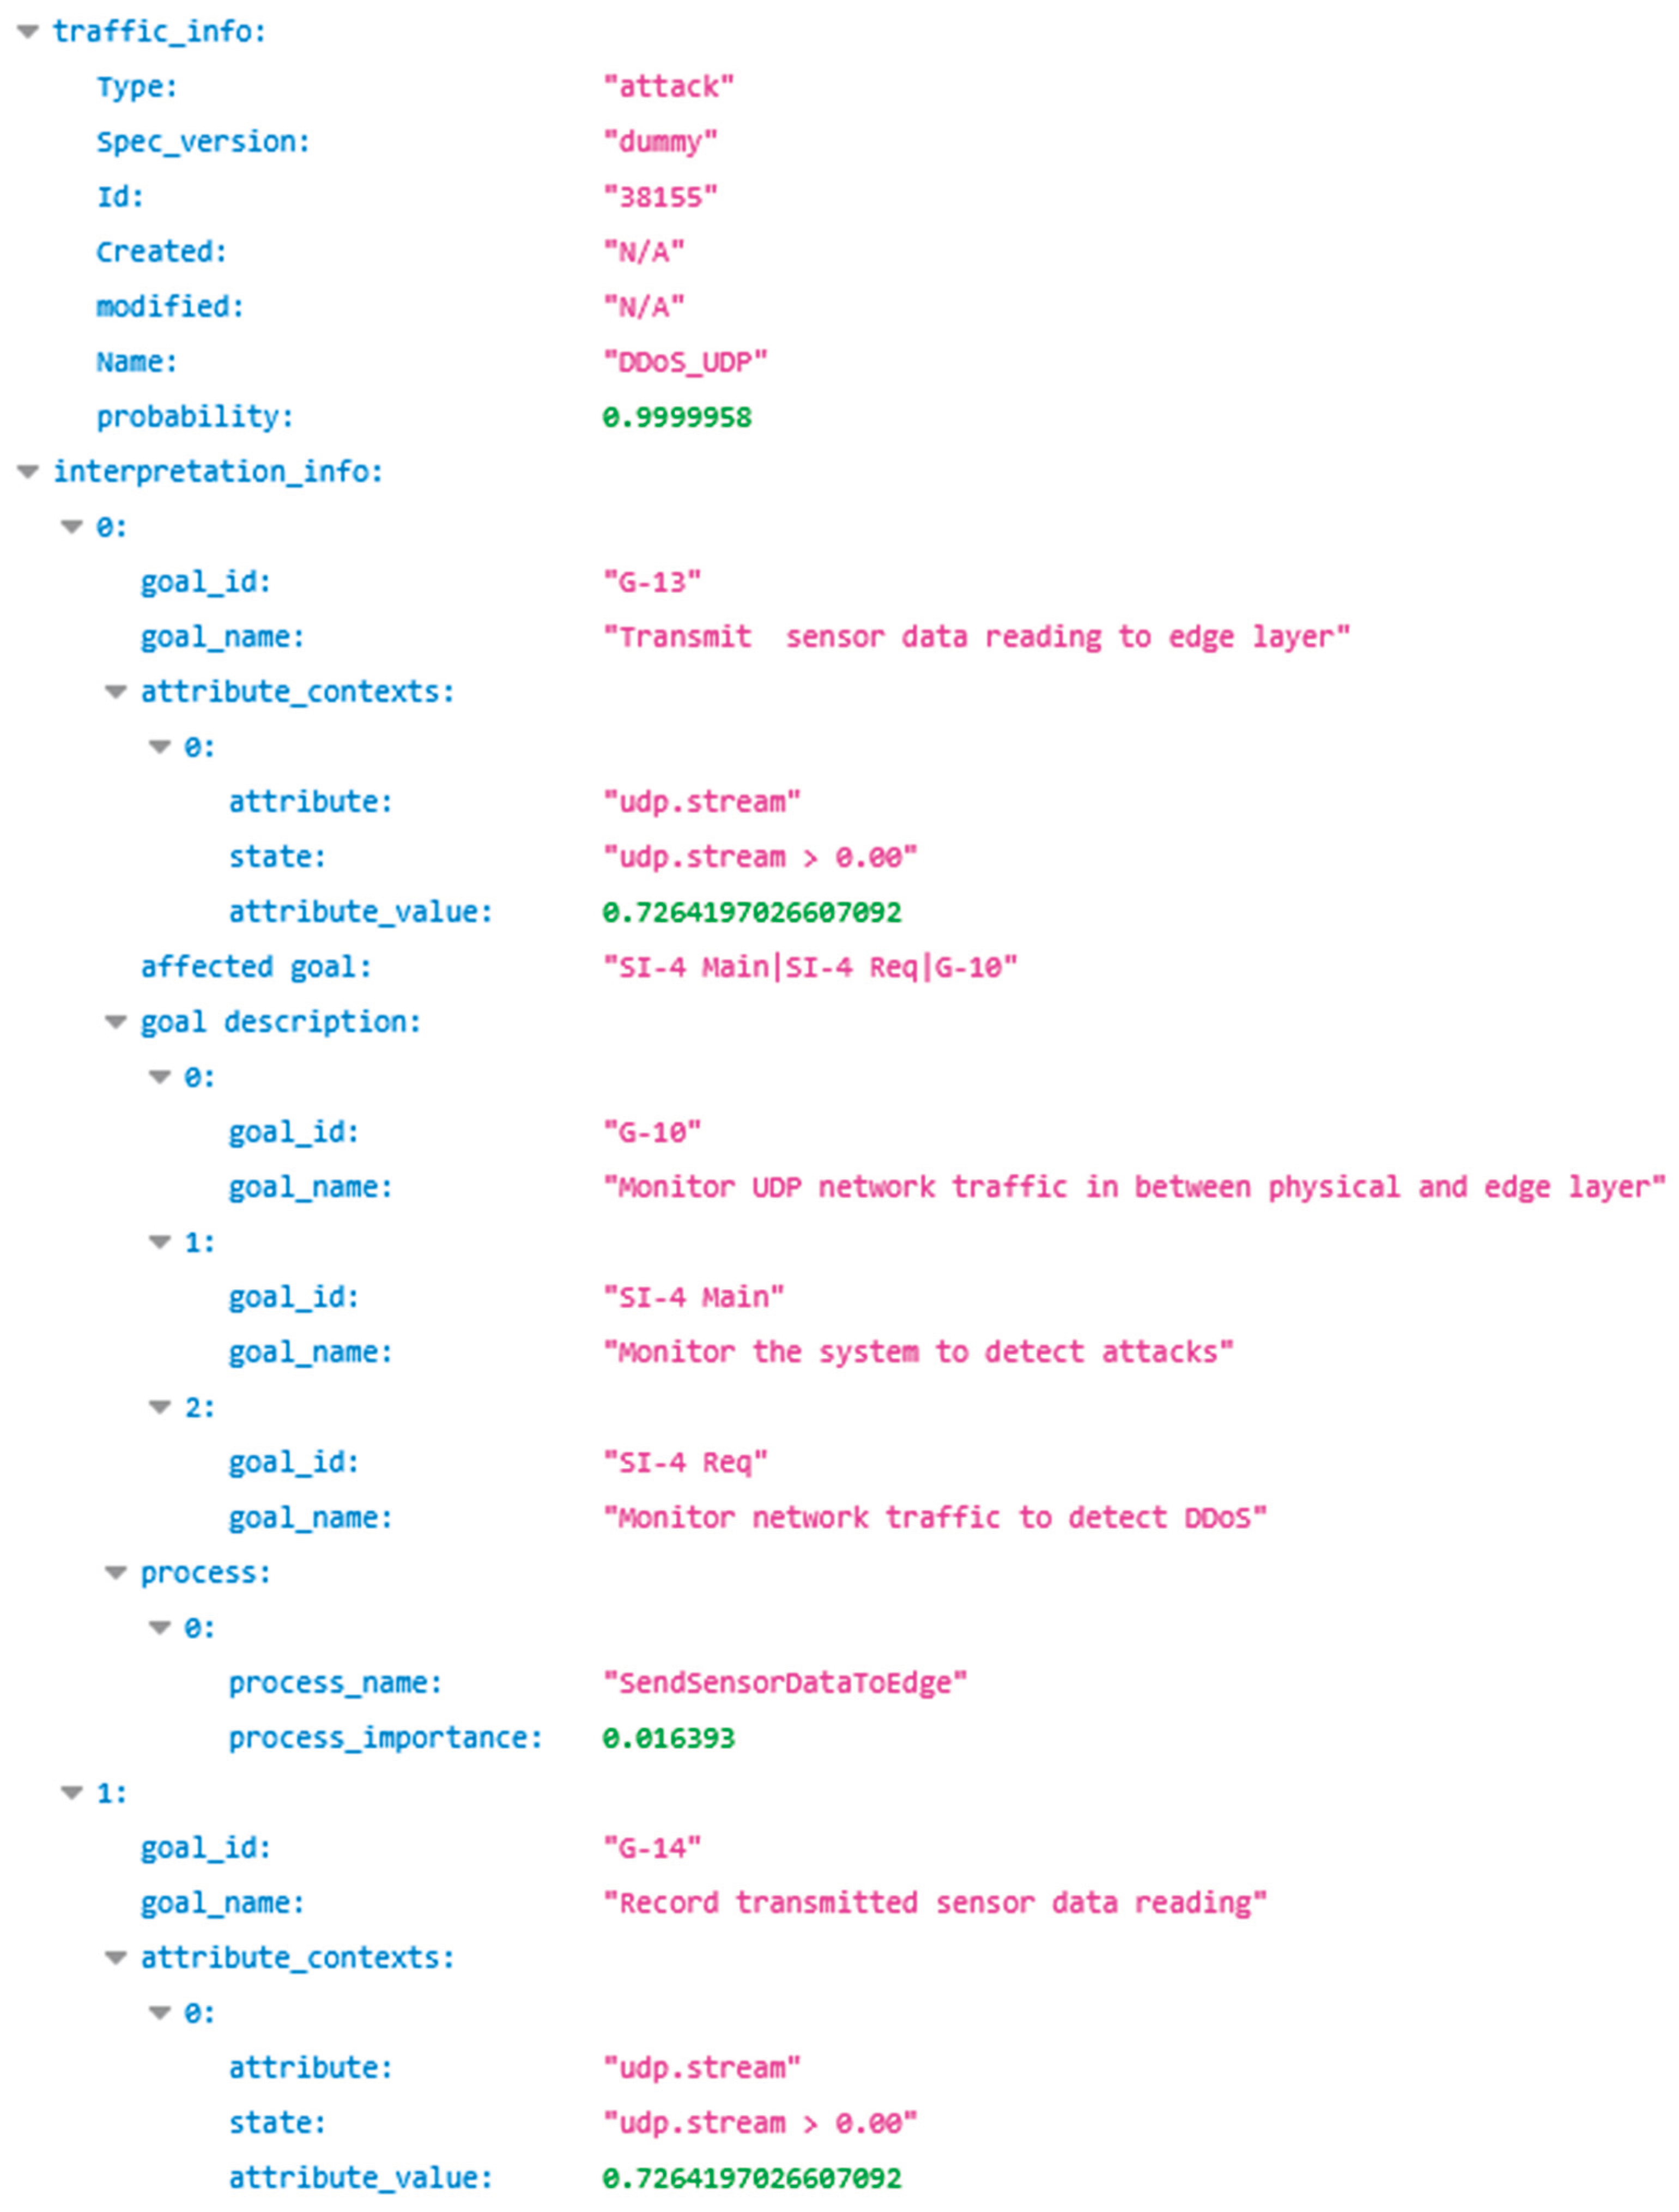
In the example scenario, the interpretation confirms a DDoS_UDP attack with 99.99% confidence. The attack targets the SendSensorDataToEdge process (identified under the process object), which has an IF of 0.016, by manipulating the udp.stream attribute with the condition udp.stream > 0. The objective of this attack is to disrupt the functionality of the SendSensorDataToEdge process, whose purpose is defined in Goal G-13 as “transmit sensor data reading to edge layer,” as indicated in the interpretation_info object of the JSON report.
Due to the interdependencies within the system, this attack also affects other goals—specifically G-10, SI-4 Req, and SI-4 Main—as illustrated in Figure 6 and listed under the affected_goal attribute in the JSON report. These cascading impacts highlight the interconnected nature of system goals within the security profile and the broader consequences of a targeted process disruption.
3.4. Generate System-Call Dependency Graph (ScD Graph) and Calculate Importance Factor (IF) Assigned to Each Process
The outcome of the mapping technique pinpoints the affected functionalities and security requirements due to the changes in the conditions of the system’s attributes. It also includes process importance, which is IF of the process. IF is defined as the significance of those processes in continuing the system’s operation.
We model the IoT system’s internal architecture and interdependencies among the processes as a form of call graph, where is the set of nodes in the graph representing the processes in IoT system and is the set of directed edges connecting the nodes, expressing the calling relationship among the process, thus the control flow from process to process. An edge in E is an ordered pair of nodes , , representing the control flow from node to .
To construct the Call graph, we collect the execution traces of the processes in the IoT system, which is the IoT-based smart irrigation testbed for our case. The execution trace records of all the processes getting invoked and the flow of control, starting from the sensor reads data to finally activate the actuators after analyzing the data if needed. Our testbed call graph includes 15 processes as shown in the graph in Figure 7, in which there are three processes involved in Physical layer, so three nodes are included in the call graph (represented in green circle). Similarly, five nodes (yellow circle) representing the processes in Edge layer, six nodes from Cloud layer (blue circle) and one node for the process from Application layer (no fill circle). The edges reflect how the processes are interconnected in the entire architecture from Physical layer to Application layer.
For example, the node, representing the process, DecidetoTriggerActuator from the Cloud Layer and this node is connected both with the node, from Edge layer and from Application layer, since DecidetoTriggerActuator process is for both notifying the application user about the farm condition and activation of actuator, via ShowAnalysisResult&TriggerDecision process and on the other hand transmitting signal to Edge layer’s process SendTriggerToActuator to enable actuator resides in Physical layer. So, an edge, is connection nodes and . And another edge, is connecting nodes, and . The direction of the edge reflects how the control flows in the operation. Since DecidetoTriggerActuator process notifies user on the decision of activating actuator, so control flows from DecidetoTriggerActuator to ShowAnalysisResult&TriggerDecision process. On the other hand, DecidetoTriggerActuator process also receives command from user when user tries to override the activation of actuator decision. So, there is a control flow from ShowAnalysisResult&TriggerDecision to DecidetoTriggerActuator. So, the edge, is bi-directional. But, the edge, is unidirectional reflecting the control flow from DecidetoTriggerActuator to SendTriggerToActuator.
We have assigned weight to each edge based on how many layers in IoT are merge together via this edge and what’s those layer’s priority. As we know IoT architecture includes multiple layers to accommodate diverse components, each of which are responsible for specific needs [2]. There are some processes involved in connecting one layer with another layer in order to seamless and efficient operation of the IoT system. For example, the edge connecting SendSensorDataToEdge from Physical layer and CollectSensorData from Edge layer is crucial in control flow for seamless operation of our IoT system and also considering an attack surface for attackers targeting the Edge layer by manipulating sensor data from the Physical layer. We have provided higher priority to those edges than the edges managing the control flow within a single layer. So, the weight is assigned to the edge, connecting the nodes as,
Here,
For example, in our testbed’s call graph, there is an edge, connecting nodes and . This DecidetoTriggerActuator node is a process from Cloud layer and ShowAnalysisResult&TriggerDecision is a process from Application layer. So, the weight of that edge, will be,
= 2
The call graph serves as the foundational structure for calculating the IF of each process in the IoT system. To derive IF values systematically, we developed a procedural approach leveraging the PageRank algorithm [28], which evaluates node importance based on incoming links, their respective PageRank scores, and the number of outgoing connections. The standard PageRank formula used is:
Here is the PageRank value of node u,
α is Damping factor(in my method, there is no random teleportation, just pure link-following. So, I consider α = 1)
N is Total number of nodes in the graph
: Set of nodes linking to node u, incoming node to u.
Out-degree (number of outgoing links) of node v.
Since our call graph is a weighted, directed graph, we extended this model using the Weighted PageRank algorithm [25]. This approach better captures the varying significance of edges by incorporating edge weights. For each node, edge weights are normalized by the total weight of all outgoing edges from that node. The formula for the Weighted PageRank becomes:
Here is the weighted PageRank of node u
is the weight of the edge from node to node ,
and is the total weight of all outgoing edges from node .
By applying this algorithm to the call graph, we calculated the IF for each process, treating each process as a graph node. The resulting importance of scores reflects how central a process is to system continuity and overall resilience. A higher IF indicates a more critical process in sustaining secure and functional operations. The complete list of processes with their corresponding IFs is provided in Table 3.
The list of IFs of each process in the systems is stored as Process Importance in GenerateAttackStatus&ConsequenceResult component, as illustrated in Figure 3, and is utilized by the ExtractGoalAttributeRelation process during the generation of the outcome set, . In the final JSON report generated for any detected attack incident, the affected process along with its corresponding IF is included, as shown in Figure 6.
By examining a process’s Importance Factor, we gain insight into the potential impact of uncertain changed conditions on the system’s overall functionality. This metric serves as a valuable indicator of a process’s significance within system operations and provides critical insight for fostering security awareness. It helps identify potential degradation in the system’s security state resulting from the compromise of affected processes. The generated report is a foundational component for promoting security awareness and can be instrumental in evaluating the system’s confidence in meeting its defined security requirements.
4. Performance Analysis
To evaluate the performance of our proposed framework for embedding security awareness into IoT systems, we conducted a detailed analysis of the deep learning (DL) pipeline. This evaluation measured the average execution time for three key components: model prediction, XAI-based explanation generation, and the mapping of XAI outcomes to the system's security profile via the GenerateAttackStatus&ConsequenceResult process. The experiments were performed on a personal computer running Microsoft Windows 10 Pro, equipped with a 12th Gen Intel(R) Core(TM) i9-12900H CPU @ 2.50GHz and 32 GB of RAM. A summary of the execution time analysis is presented in Table 4.
We also assessed performance across different attack types and observed that all three components of the DL pipeline maintained consistent execution times, regardless of the specific attack scenario. However, the XAI explanation generation consistently incurred significantly higher processing time compared to the other components. In future work, we aim to incorporate more advanced ML/DL optimization techniques to improve system efficiency and reduce the latency associated with explanation generation.
5. Conclusions
The rapid integration of IoT technologies holds transformative potential to enhance productivity, sustainability, and resilience across various domains. However, realizing these benefits presents significant challenges—particularly in managing the complexity, dynamism, and security sensitivity inherent to such environments. This paper addresses these challenges by proposing a novel security-aware framework for IoT systems. By integrating contextual intelligence, explainable artificial intelligence (XAI), and structured security assurance modeling, the framework enables real-time reasoning about environmental and operational changes and their implications for system security.
A key innovation of this work is the introduction of a graph-based procedural approach to quantify the importance of individual system components, thereby enhancing the system’s ability to prioritize and adapt its security responses. By combining interpretability, adaptability, and risk-awareness, the framework establishes a foundation for developing intelligent, secure, and trustworthy IoT infrastructures.
We acknowledge that the current implementation of the security awareness component introduces performance overhead, indicating the need for optimization of computational processes. Another concern lies in the framework’s reliance on XAI methods to provide actionable insights. These methods must be rigorously evaluated to ensure their fidelity and reliability. In future work, we aim to address these concerns through performance optimizations and thorough validation of XAI techniques.
To the best of our knowledge, there is currently no existing approach that directly maps XAI outcomes to a system’s security profile to generate insights on uncertain changes and their implications for system security posture. As such, a direct comparison with other methods is not feasible at this stage.
The successful implementation and evaluation of the proposed framework within a smart irrigation testbed demonstrate its practical feasibility and highlight its potential to inform the development of self-aware, security-conscious IoT systems across a range of critical application domains.
Author Contributions
Conceptualization, M.B and S.J., Methodology, M.B. and S.J., Validation, M.B., Writing—original draft, M.B. and S.J., Investigation, M.B. and S.J., Writing—reviewing and editing, S.J., Supervision, S.J. All authors have read and agreed to the published version of the manuscript.
Funding
This research received no external funding. This research was supported by startup funding provided by the Department of Computer Science at Oklahoma State University to promote young faculty research.
Data Availability Statement
The datasets and code used for conducting the experiments and supporting the conclusions of this study are available upon request from the authors.
Acknowledgments
During the preparation of this manuscript, the authors utilized ChatGPT-4.0 for grammar checking and improving the writing flow. The authors have thoroughly reviewed and edited the output and take full responsibility for the content of this publication.
Conflicts of Interest
The authors declare no conflict of interest.
References
- Reggio, G.; Leotta, M.; Cerioli, M.; Spalazzese, R.; Alkhabbas, F. What are IoT systems for real? An experts’ survey on software engineering aspects. Internet of Things 2020, 12, 100313. [Google Scholar] [CrossRef]
- Gubbi, J.; Buyya, R.; Marusic, S.; & Palaniswami, M. Internet of Things (IoT): A vision, architectural elements, and future directions. Future generation computer systems 29.7, 2013; pp. 1645-1660. [CrossRef]
- Taivalsaari, A.; Mikkonen, T. On the development of IoT systems. Third International Conference on Fog and Mobile Edge Computing (FMEC). IEEE, 2018; pp. 13-19. [CrossRef]
- Tawalbeh, L.A.; Muheidat, F.; Tawalbeh, M.; Quwaider, M. IoT Privacy and security: Challenges and solutions. Applied Sciences 2020, 10, 4102. [Google Scholar] [CrossRef]
- Alaba, F. A.; Othman, M.; Hashem, I. A. T.; Alotaibi, F. Internet of Things security: A survey. Journal of Network and Computer Applications 2017, 88, 10–28. [Google Scholar] [CrossRef]
- Jahan, S.; Alqahtani, S.; Gamble, R. F.; Bayesh, M. Automated Extraction of Security Profile Information from XAI Outcomes. In 2023 IEEE International Conference on Autonomic Computing and Self-Organizing Systems Companion (ACSOS-C), IEEE, 2023; pp. 110-115. [CrossRef]
- Petrovska, A. Self-Awareness as a Prerequisite for Self-Adaptivity in Computing Systems. In 2021 IEEE International Conference on Autonomic Computing and Self-Organizing Systems Companion (ACSOS-C), IEEE, 2021; pp. 146-149. [CrossRef]
- Chattopadhyay, A.; Lam, K. Y.; Tavva, Y. Autonomous vehicle: Security by design. IEEE Transactions on Intelligent Transportation Systems, 22(11), 2020; pp. 7015-7029. [CrossRef]
- Li, J.; Yi, X.; Wei, S. A study of network security situational awareness in Internet of Things. In 2020 International Wireless Communications and Mobile Computing (IWCMC), IEEE, 2020; pp. 1624-1629. [CrossRef]
- Lei, W.; Wen, H.; Hou, W.; Xu, X. New security state awareness model for IoT devices with edge intelligence. IEEE Access 2021, 9, 69756–69765. [Google Scholar] [CrossRef]
- Hemmati, A.; Rahmani, A. M. The Internet of Autonomous Things applications: A taxonomy, technologies, and future directions. Internet of Things 2022, 20, 100635. [Google Scholar] [CrossRef]
- Xu, R.; Nagothu, D.; Chen, Y.; Aved, A.; Ardiles-Cruz, E.; Blasch, E. A Secure Interconnected Autonomous System Architecture for Multi-Domain IoT Ecosystems. IEEE Communications Magazine 2024, 62, 52–57. [Google Scholar] [CrossRef]
- Salehie, M.; Tahvildari, L. Self-adaptive software: Landscape and research challenges. ACM transactions on autonomous and adaptive systems (TAAS) 2009, 4, 1–42. [Google Scholar] [CrossRef]
- Hezavehi, S. M.; Weyns, D.; Avgeriou, P.; Calinescu, R.; Mirandola, R.; Perez-Palacin, D. Uncertainty in self-adaptive systems: A research community perspective. ACM Transactions on Autonomous and Adaptive Systems (TAAS) 2021, 15, 1–36. [Google Scholar] [CrossRef]
- Jahan, S.; Riley, I.; Gamble, R. F. Assessing adaptations based on change impacts. In 2020 IEEE International Conference on Autonomic Computing and Self-Organizing Systems (ACSOS), IEEE, 2020; pp. 48-54. [CrossRef]
- Jahan, S. An adaptation assessment framework for runtime security assurance case evolution. Doctoral dissertation, The University of Tulsa, 2021. https://www.proquest.com/docview/2637547876?pq-origsite=gscholar&fromopenview=true&sourcetype=Dissertations%20&%20Theses.
- Gheibi, O.; Weyns, D.; Quin, F. Applying machine learning in self-adaptive systems: A systematic literature review. ACM Transactions on Autonomous and Adaptive Systems (TAAS) 2021, 15, 1–37. [Google Scholar] [CrossRef]
- Janiesch, C.; Zschech, P.; Heinrich, K. Machine learning and deep learning. Electronic markets 2021, 31, 685–695. [Google Scholar] [CrossRef]
- Vilone, G.; Longo, L. Explainable artificial intelligence: a systematic review. arXiv 2020, arXiv:2006.00093. [Google Scholar] [CrossRef]
- Molnar, C. Interpretable machine learning. Lulu. Com, 2020. https://books.google.com/books?hl=en&lr=&id=jBm3DwAAQBAJ&oi=fnd&pg=PP1&dq=Interpretable+machine+learning&ots=EhvWYjHDSY&sig=fJlg8xyZsauRhLjOYF_xUqr8khQ#v=onepage&q=Interpretable%20machine%20learning&f=false.
- Alexander, R.; Hawkins, R.; Kelly, T. Security assurance cases: motivation and the state of the art. High Integrity Systems Engineering, Department of Computer Science, University of York, Deramore Lane York YO10 5GH. 2011. https://citeseerx.ist.psu.edu/document?repid=rep1&type=pdf&doi=623bb1c1ded3860ed1307d45a2a01823b13abff6.
- Kelly, T.; & Weaver, R. The goal structuring notation–a safety argument notation. In Proceedings of the dependable systems and networks 2004 workshop on assurance cases (Vol. 6). Princeton, NJ: Citeseer, 2004. http://dslab.konkuk.ac.kr/class/2012/12SIonSE/Key%20Papers/The%20Goal%20Structuring%20Notation%20_%20A%20Safety%20Argument%20Notation.pdf.
- Averbukh, V. L.; Bakhterev, M. O.; Manakov, D. V. Evaluations of visualization metaphors and views in the context of execution traces and call graphs. Scientific Visualization, 9(5), 2017; pp. 1-18. https://www.researchgate.net/profile/Vladimir-Averbukh/publication/322070685_Evaluations_of_Visualization_Metaphors_and_Views_in_the_Context_of_Execution_Traces_and_Call_Graphs/links/5a4287690f7e9ba868a47bd5/Evaluations-of-Visualization-Metaphors-and-Views-in-the-Context-of-Execution-Traces-and-Call-Graphs.pdf.
- Salis, V.; Sotiropoulos, T.; Louridas, P.; Spinellis, D.; Mitropoulos, D. Pycg: Practical call graph generation in python. In 2021 IEEE/ACM 43rd International Conference on Software Engineering (ICSE). IEEE, IEEE, Madrid, Spain, 2021; pp. 1646-1657. [CrossRef]
- Zhang, P.; Wang, T.; Yan, J. PageRank centrality and algorithms for weighted, directed networks. Physica A: Statistical Mechanics and its Applications 2022, 586, 126438. [Google Scholar] [CrossRef]
- Gómez, S. Centrality in networks: finding the most important nodes. In Business and Consumer Analytics: New Ideas; Moscato, P., de Vries, N., Eds.; Springer: Cham, Switzerland, 2019. [Google Scholar] [CrossRef]
- Freeman, L.C. Centrality in social networks: Conceptual clarification. Social network: critical concepts in sociology. Londres: Routledge, 1(3), 2002; pp. 238-263. https://books.google.com/books?hl=en&lr=&id=fy3m_EixWOsC&oi=fnd&pg=PA238&dq=Centrality+in+social+networks+conceptual+clarification&ots=unHaJzR81U&sig=hG9bkrrpA_B-kQ0r2iy7ISsLvts#v=onepage&q=Centrality%20in%20social%20networks%20conceptual%20clarification&f=false.
- Brin, S.; Page, L. The anatomy of a large-scale hypertextual web search engine. Computer networks and ISDN systems, 30(1-7), 1998; pp. 107-117. [CrossRef]
- Sarker, I. H.; Khan, A. I.; Abushark, Y. B.; Alsolami, F. Internet of things (iot) security intelligence: a comprehensive overview, machine learning solutions and research directions. Mobile Networks and Applications, 28(1), 2023; pp.296-312. [CrossRef]
- Bouaouad, A. E.; Cherradi, A.; Assoul, S.; Souissi, N. The key layers of IoT architecture. In 2020 5th International Conference on Cloud Computing and Artificial Intelligence: Technologies and Applications (CloudTech), IEEE, 2020; pp. 1-4. [CrossRef]
- Mrabet, H.; Belguith, S.; Alhomoud, A.; Jemai, A. A survey of IoT security based on a layered architecture of sensing and data analysis. Sensors 2020, 20, 3625. [Google Scholar] [CrossRef] [PubMed]
- Tukur, Y. M.; Thakker, D.; Awan, I. U. Multi-layer approach to internet of things (IoT) security. In 2019 7th International Conference on Future Internet of Things and Cloud (FiCloud), IEEE, 2019; pp. 109-116. [CrossRef]
- Hassija, V.; Chamola, V.; Saxena, V.; Jain, D.; Goyal, P.; Sikdar, B. A survey on IoT security: application areas, security threats, and solution architectures. IEEE Access 2019, 7, 82721–82743. [Google Scholar] [CrossRef]
- Dargaoui, S.; et al. An overview of the security challenges in IoT environment. Advanced technology for smart environment and energy 2023, 151–160. [Google Scholar] [CrossRef]
- Koohang, A.; Sargent, C. S.; Nord, J. H.; Paliszkiewicz, J. Internet of Things (IoT): From awareness to continued use. International Journal of Information Management 2022, 62, 102442. [Google Scholar] [CrossRef]
- Tariq, U.; Aseeri, A. O.; Alkatheiri, M. S.; Zhuang, Y. Context-aware autonomous security assertion for industrial IoT. IEEE Access 2020, 8, 191785–191794. [Google Scholar] [CrossRef]
- Darias, J. M.; Díaz-Agudo, B.; Recio-Garcia, J. A. A Systematic Review on Model-agnostic XAI Libraries. In ICCBR workshops, 2021; pp. 28-39.
- Lipton, Z.C. The mythos of model interpretability: In machine learning, the concept of interpretability is both important and slippery. Queue 2018, 16, 31–57. [Google Scholar] [CrossRef]
- Ribeiro, M.T.; Singh, S.; Guestrin, C. Why should I trust you? Explaining the predictions of any classifier. In Proceedings of the 22nd ACM SIGKDD International Conference on Knowledge Discovery and Data Mining, San Francisco, CA, USA, 13–17 August 2016; pp. 1135–1144. [Google Scholar] [CrossRef]
- Ng, C.H., Abuwala, H.S., & Lim, C.H. Towards more stable LIME for explainable AI. In 2022 International Symposium on Intelligent Signal Processing and Communication Systems (ISPACS), IEEE, 2022; pp. 1-4. [CrossRef]
- Dieber, J., & Kirrane, S. Why model why? Assessing the strengths and limitations of LIME. arXiv preprint arXiv:2012.00093, 2020. [CrossRef]
- Lundberg, S.M.; Lee, S.I. A unified approach to interpreting model predictions. Advances in neural information processing systems 2017, 30. [Google Scholar] [CrossRef]
- Li, M.; Sun, H.; Huang, Y.; Chen, H. Shapley value: from cooperative game to explainable artificial intelligence. Autonomous Intelligent Systems 2024, 4, 2. [Google Scholar] [CrossRef]
- Miller, T. Explainable ai is dead, long live explainable ai! hypothesis-driven decision support using evaluative ai. In Proceedings of the 2023 ACM conference on fairness, accountability, and transparency; 2023; pp. 333–342. [Google Scholar] [CrossRef]
- Saputri, T. R. D.; Lee, S. W. The application of machine learning in self-adaptive systems: A systematic literature review. IEEE Access 2020, 8, 205948–205967. [Google Scholar] [CrossRef]
- Ferrag, M.A. Edge-IIoTset cyber security dataset of IoT & IIoT. 2023. Available at available at: https://www.kaggle.com/datasets/mohamedamineferrag/edgeiiotset-cyber-security-dataset-of-iot-iiot, Accessed May, 2025.
- Ferrag, M. A., Friha, O., Hamouda, D., Maglaras, L., & Janicke, H. Edge-IIoTset: A new comprehensive realistic cyber security dataset of IoT and IIoT applications for centralized and federated learning. IEEe Access, 10, 2022; pp.40281-40306. [CrossRef]
- Saheed, Y.K.; Abdulganiyu, O.H.; Majikumna, K.U.; Mustapha, M.; Workneh, A.D. ResNet50-1D-CNN: A new lightweight resNet50-One-dimensional convolution neural network transfer learning-based approach for improved intrusion detection in cyber-physical systems. International Journal of Critical Infrastructure Protection 2024, 45, 100674. [Google Scholar] [CrossRef]
- Joint Task Force, “Security and Privacy Controls for Federal Information Systems,” NIST Special Publication 800-53, Revision 5, 2020.
- Reif, J.H. Depth-first search is inherently sequential. Information Processing Letters 1985, 20, 229–234. [Google Scholar] [CrossRef]
Figure 1.
Process flow diagram of IoT-based Smart irrigation system testbed.
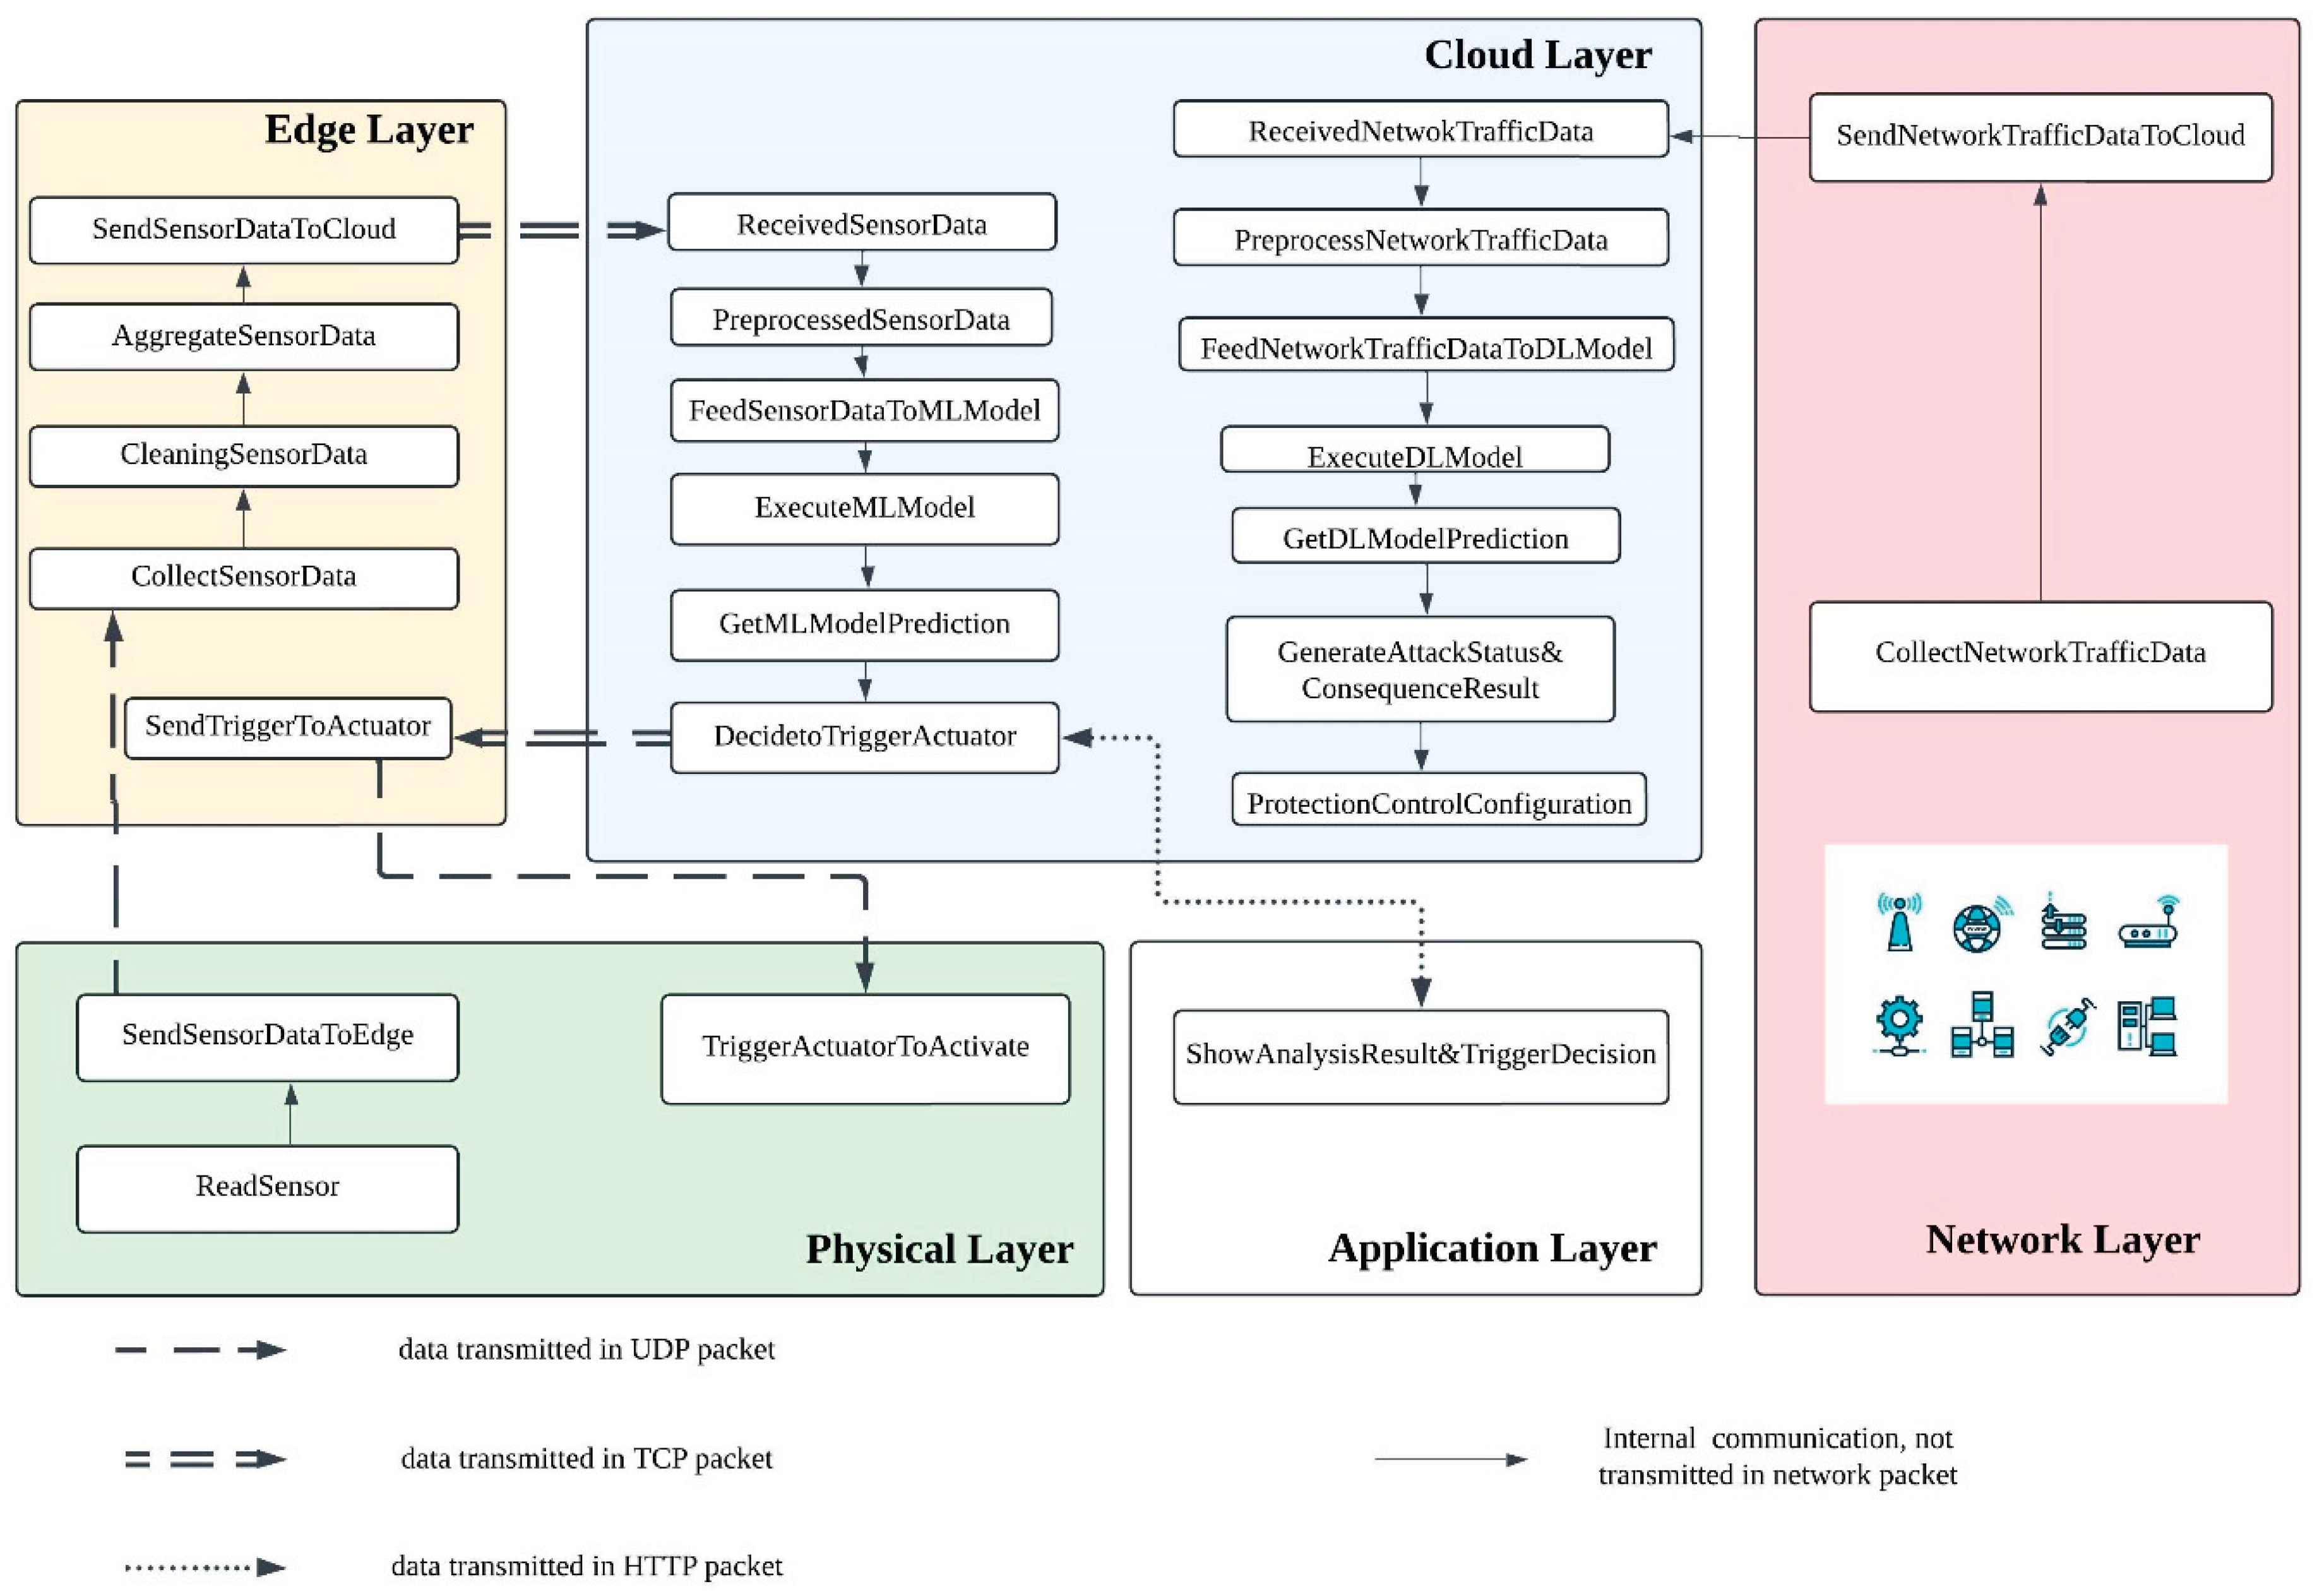
Figure 3.
Dataflow diagram of GenerateAttackStatus&ConsequenceResult component.
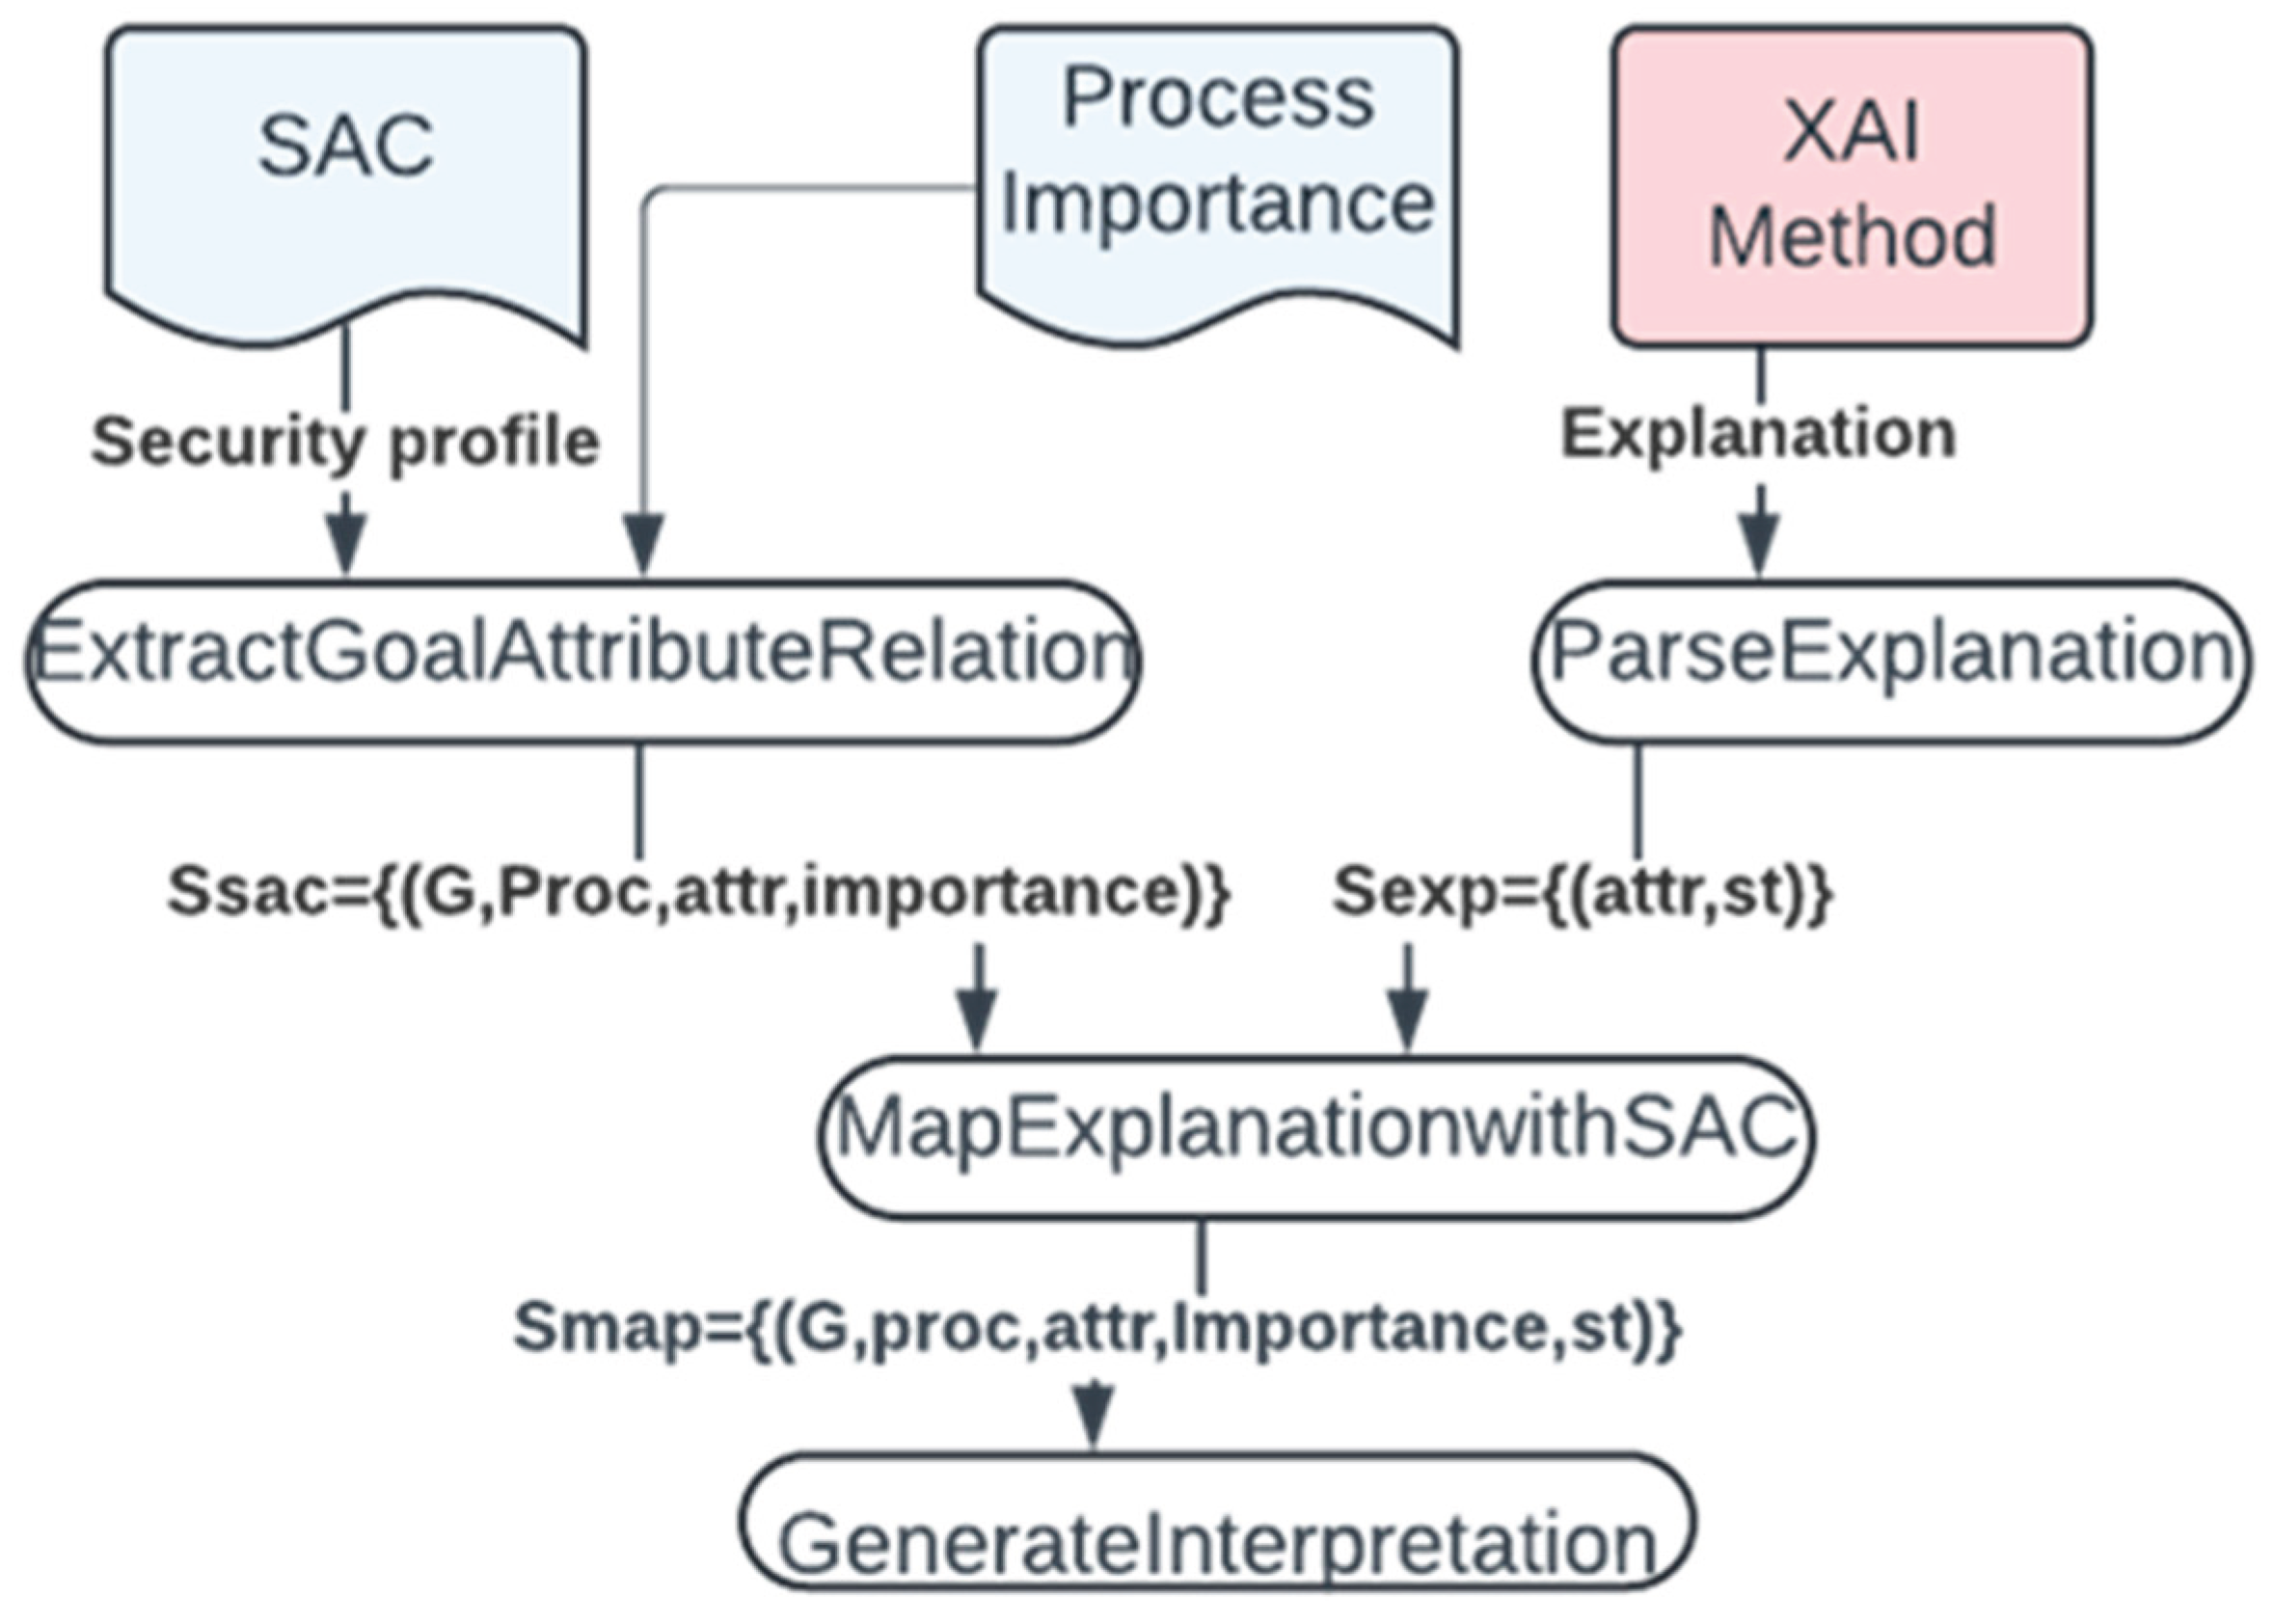
Figure 5.
Partial Security Assurance Case, representing security profile of the system.
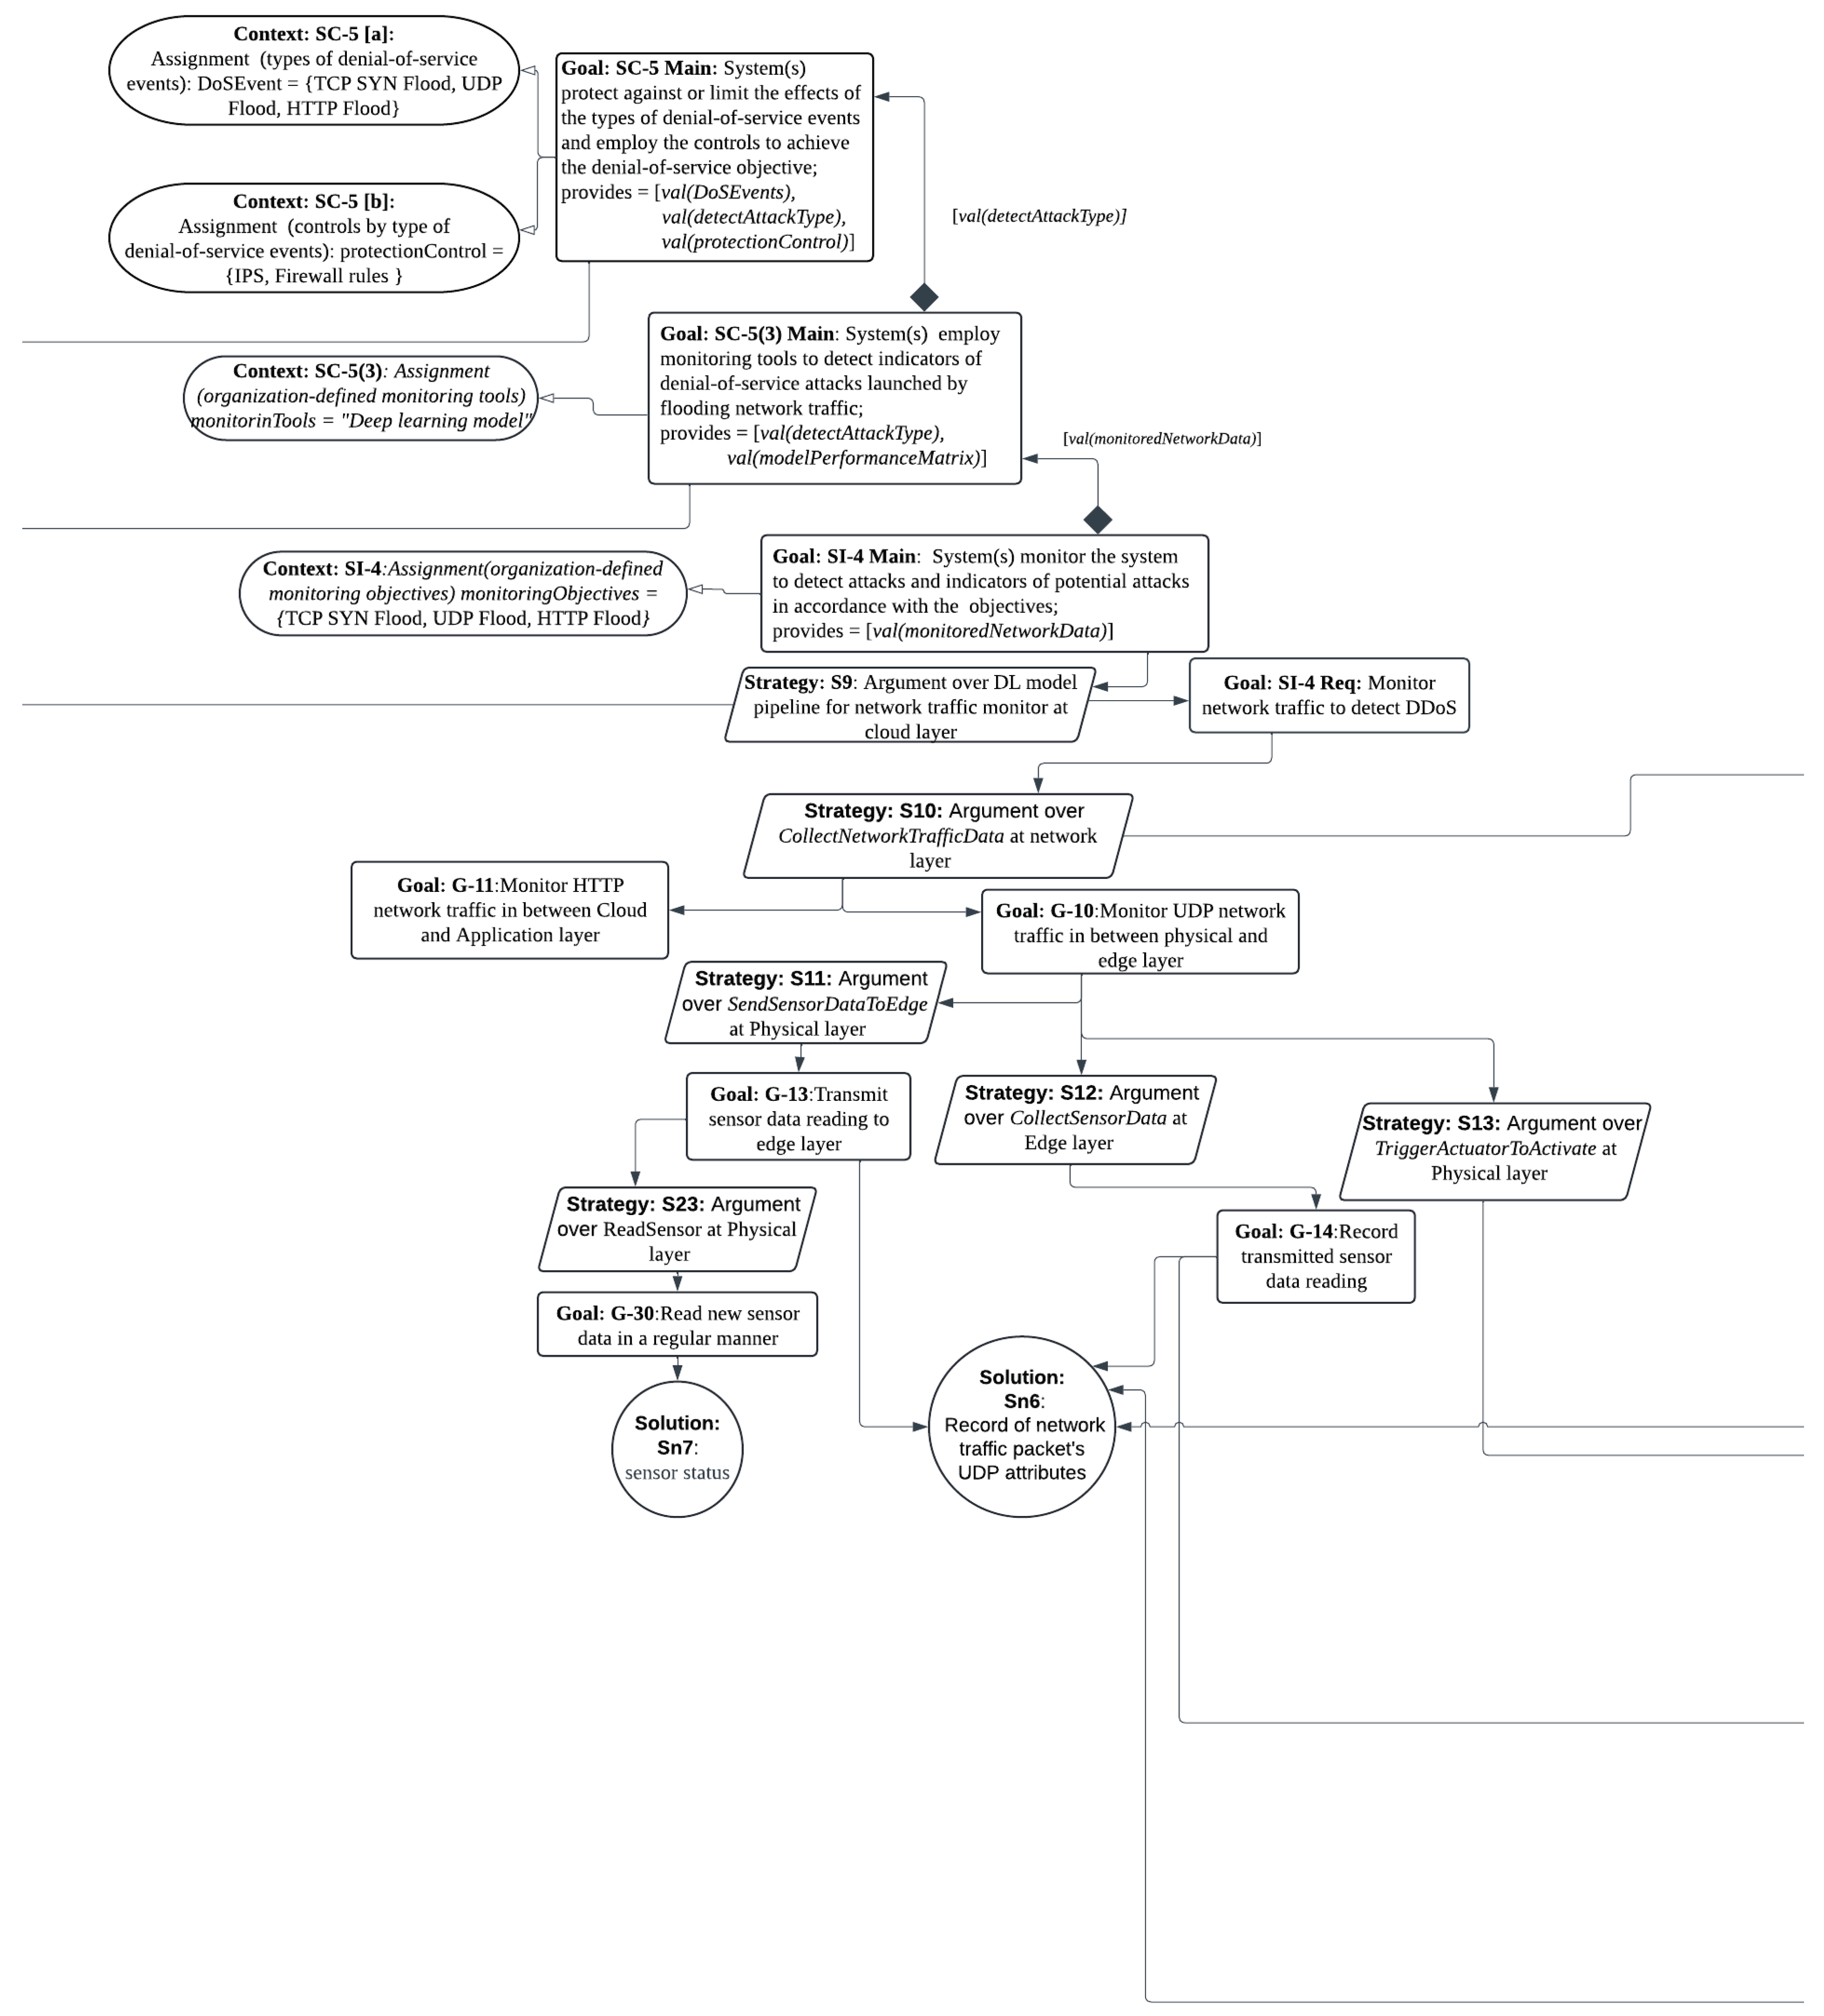
Figure 7.
Call graph of IoT-based smart irrigation system (testbed).
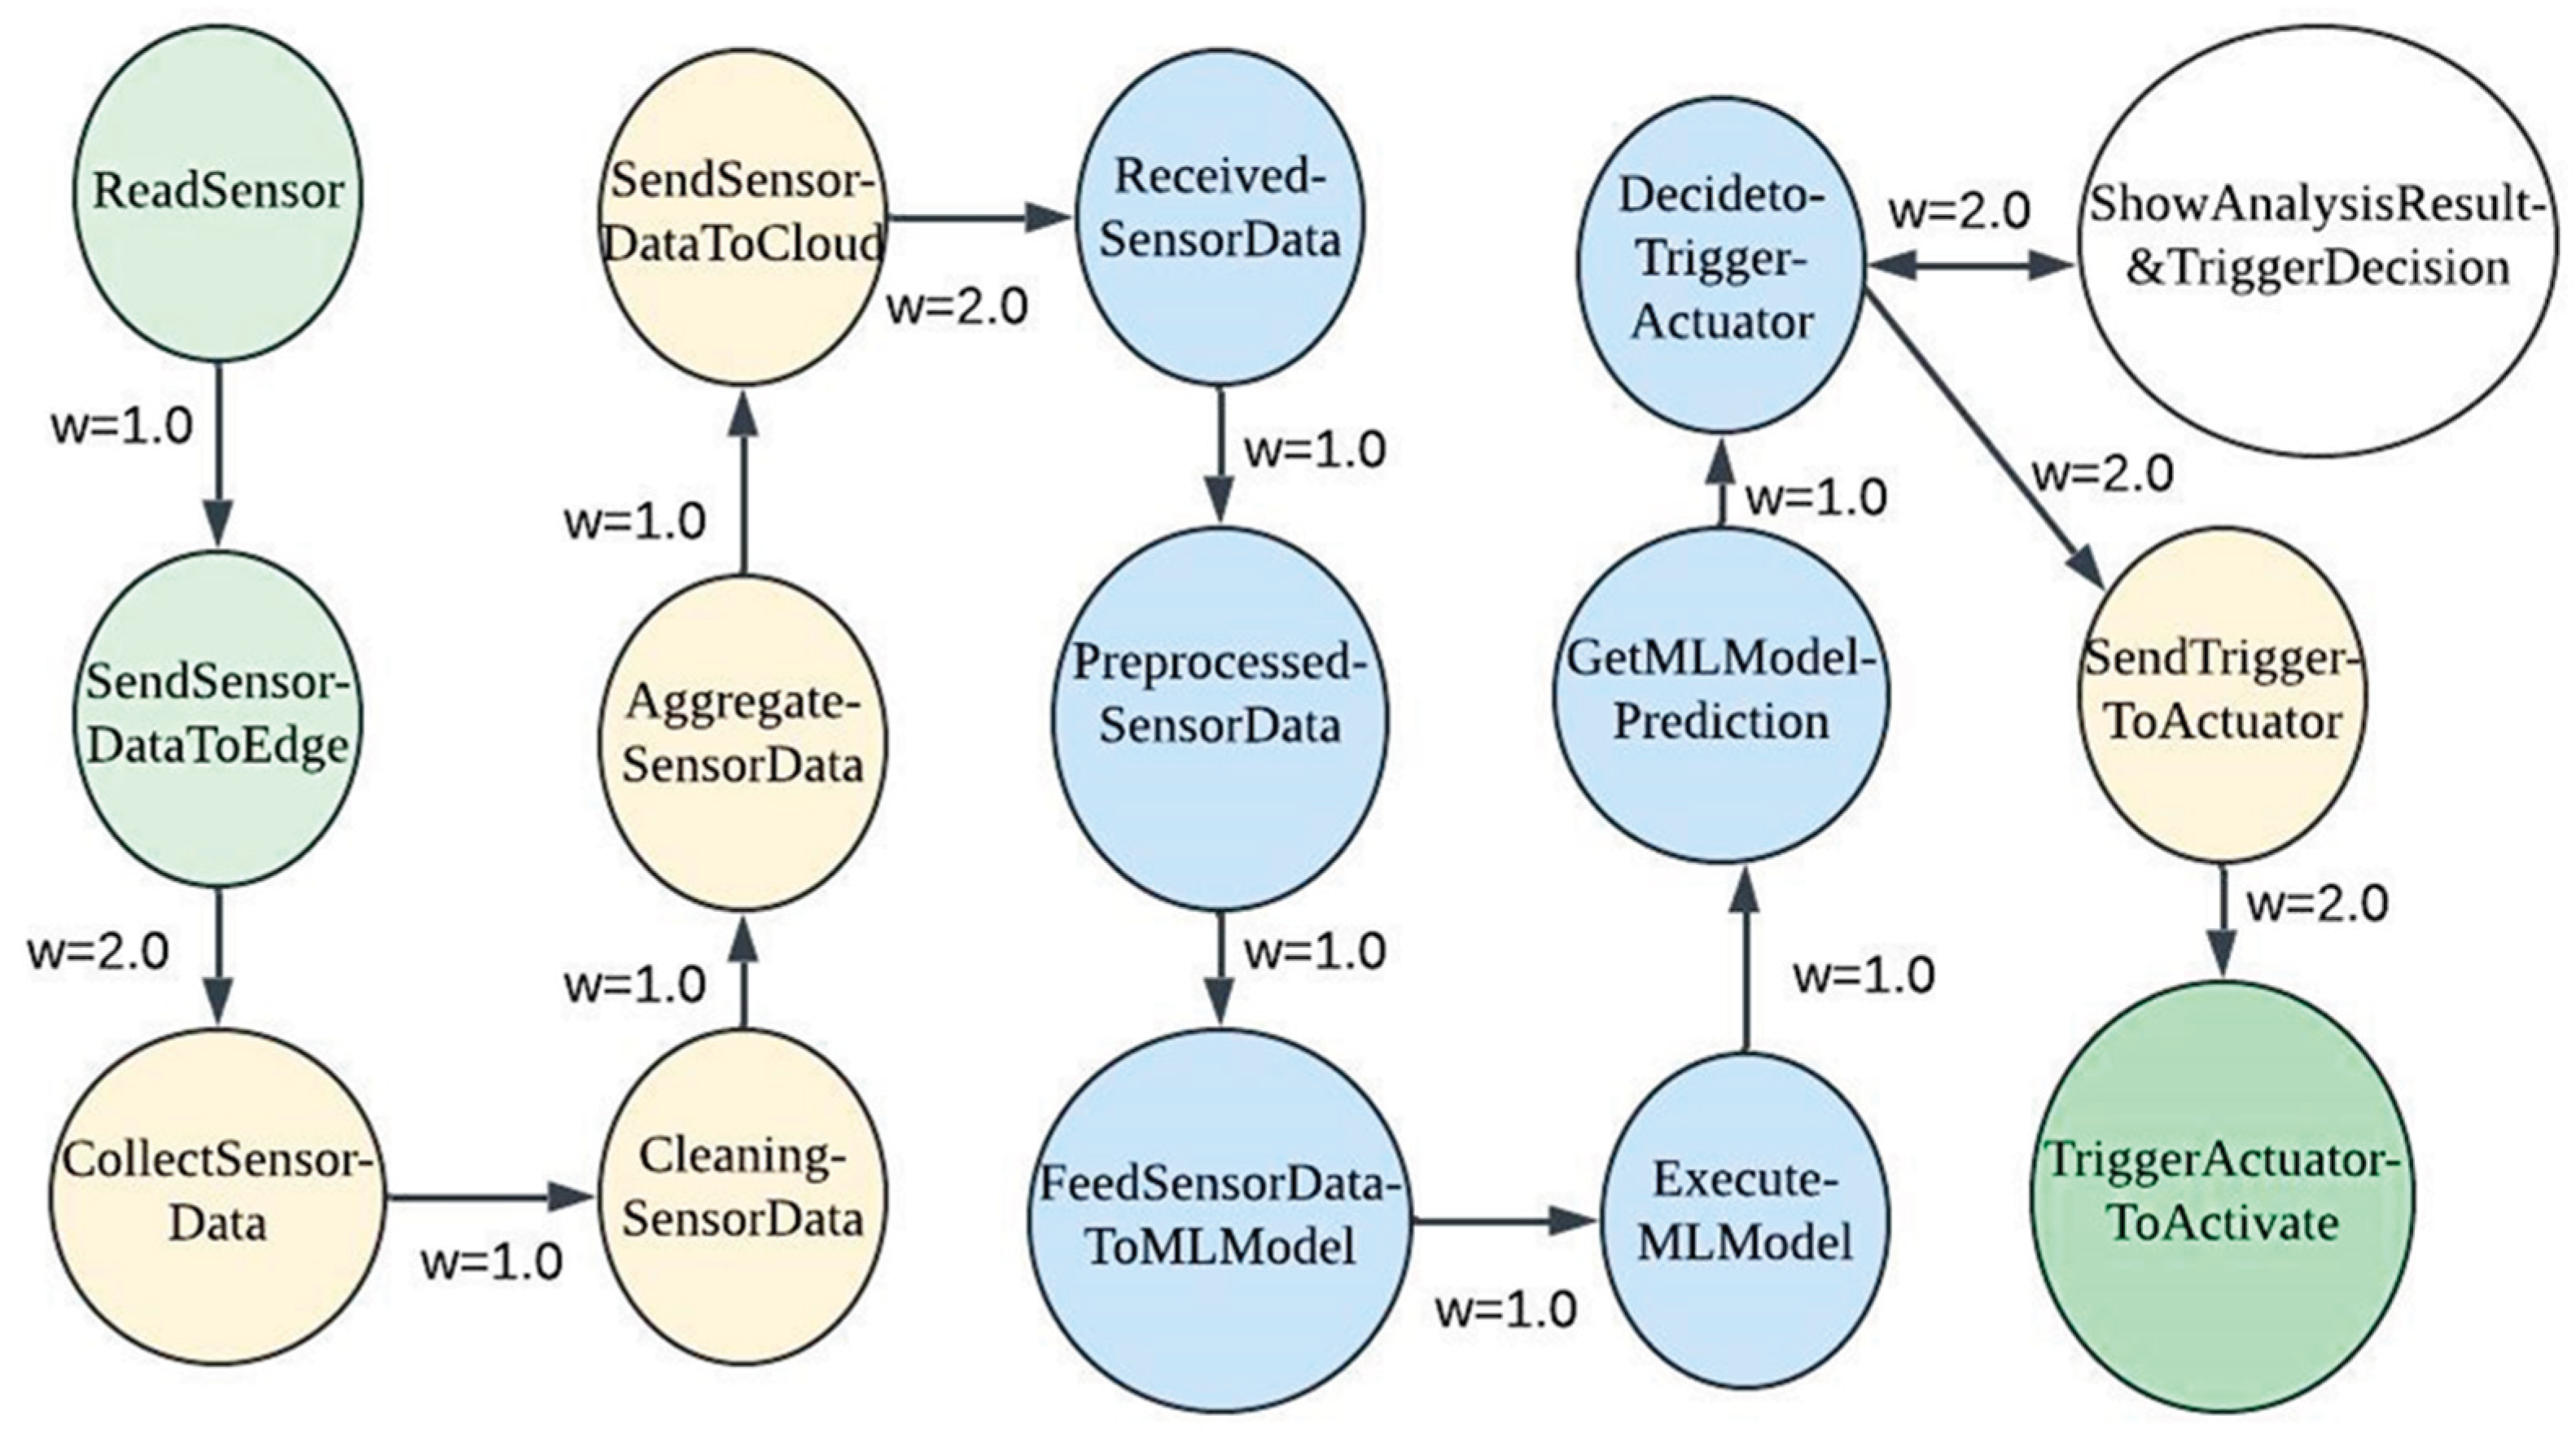

Table 1.
TCP Attribute set.
| TCP attributes | Description |
| tcp.flags | Flags |
| tcp.ack | Acknowledgment number |
| tcp.ack_raw | Acknowledgment number (raw) |
| tcp.checksum | checksum |
| tcp.seq | Sequence number |
| tcp.flags.ack | Acknowledgment |
| tcp.len | TCP segment length |
| tcp.connection.syn | Connection establish request (SYN) |
| tcp.connection.rst | Connection reset (RST) |
| tcp.connection.fin | Connection finish (FIN) |
| tcp.connection.synack | Connection establish request (SYN+ACK) |
Table 2.
DDoS Attack Types and Description.
| Attack type | Description |
| TCP SYN Flood DDoS attack | Make the victim’s server unavailable to legitimate requests |
| UDP flood DDoS attack | Overwhelm the processing and response capabilities of victim devices |
| HTTP flood DDoS attack | Exploits seemingly legitimate HTTP GET or POST requests toattack IoT application |
Table 3.
of Processes in IoT-based Smart Irrigation System (testbed) and their Important Factor.
| Process Name | Importance Factor |
| DecidetoTriggerActuator | 0.156 |
| TriggerActuatorToActivate | 0.094 |
| GetMLModelPrediction | 0.09 |
| ShowAnalysisResult&TriggerDecision | 0.086 |
| SendTriggerToActuator | 0.086 |
| ExecuteMLModel | 0.082 |
| FeedSensorDataToMLModel | 0.074 |
| PreprocessedSensorData | 0.066 |
| ReceivedSensorData | 0.057 |
| SendSensorDataToCloud | 0.049 |
| AggregateSensorData | 0.041 |
| CleaningSensorData | 0.033 |
| CollectSensorData | 0.025 |
| SendSensorDataToEdge | 0.016 |
| ReadSensor | 0.008 |
Table 4.
Performance analysis result.
| Process Name | Average Execution time (in sec) | |
| Overall | Model Prediction | 0.154893 |
| Generate Explanation | 8.426568 | |
| Mapping and Generate Report | 0.151432 | |
| DDoS_UDP | Model Prediction | 0.159036 |
| Generate Explanation | 8.082033 | |
| Mapping and Generate Report | 0.153765 | |
| DDoS_TCP | Model Prediction | 0.152603 |
| Generate Explanation | 8.802392 | |
| Mapping and Generate Report | 0.149118 | |
| DDoS_HTTP | Model Prediction | 0.153175 |
| Generate Explanation | 8.373173 | |
| Mapping and Generate Report | 0.151548 |
Disclaimer/Publisher’s Note: The statements, opinions and data contained in all publications are solely those of the individual author(s) and contributor(s) and not of MDPI and/or the editor(s). MDPI and/or the editor(s) disclaim responsibility for any injury to people or property resulting from any ideas, methods, instructions or products referred to in the content. |
© 2025 by the authors. Licensee MDPI, Basel, Switzerland. This article is an open access article distributed under the terms and conditions of the Creative Commons Attribution (CC BY) license (http://creativecommons.org/licenses/by/4.0/).
Copyright: This open access article is published under a Creative Commons CC BY 4.0 license, which permit the free download, distribution, and reuse, provided that the author and preprint are cited in any reuse.


