
Submitted:
21 May 2025
Posted:
22 May 2025
You are already at the latest version
Abstract
This paper proposes (H-DIR)², a scalable and explainable framework for anomaly detection and cybersecurity monitoring in cloud–IoT ecosystems. The architecture integrates entropy-based indicators and a hybrid deep learning model (ARNN) to compare expected and actual system behavior, enabling real-time detection of threats. A reproducible methodology is applied, supported by open-source tools and experimental validation. The results confirm that (H-DIR)² provides effective and interpretable anomaly detection for smart environments, including Digital Twin-enabled infrastructures and critical IoT systems.
Keywords:
hybrid distributed information retrieval
; entropy-based anomaly detection
; associated random neural network
; RDF/SPARQL explainability
; cloud–IoT security
; sub-second detection latency
; semantic- adaptive cyber defense
1. Introduction
Modern cloud–IoT infrastructures are increasingly vulnerable to sophisticated protocol-level threats, ranging from volumetric attacks such as TCP SYN floods to semantic manipulations of routing protocols. Recent studies emphasize the importance of monitoring the expected behavior of IoT devices and implementing advanced security mechanisms to detect and mitigate such attacks. [9]
To tackle this heterogeneity, we propose the Hybrid–Dynamic Information Risk framework, (H–DIR)2, which fuses a Hybrid Distributed Information Retrieval (H–DIR) architecture [24] with dynamic, entropy-driven risk mitigation.
The Hybrid Distributed Information Retrieval (H-DIR) architecture is a layered, semantic-aware framework designed to enhance data interoperability and retrieval in Cloud–IoT environments [24]. It integrates big data tools (e.g., Apache Spark), semantic web technologies (e.g., RDF/SPARQL), and neural-based analytics (e.g., LSTMs, GRUs) to process heterogeneous sensor data streams [24]. By leveraging hybrid query mechanisms that combine structured (SQL) and unstructured (semantic) formats, H-DIR enables advanced reasoning over environmental and operational telemetry. [24]
Building upon the semantic and hybrid query foundations of H-DIR [24], the (H-DIR)2 framework extends the architecture by integrating dynamic threat detection and response mechanisms. Specifically, it introduces a six-stage processing pipeline that includes entropy-based anomaly scoring, real-time feature vectorization, and adaptive modeling through neural techniques. While H-DIR primarily addressed semantic interoperability, (H-DIR)2 brings the system into the cybersecurity domain by incorporating concepts such as Network Attack Graphs [10] and deep learning for threat propagation analysis [15]. The framework exploits distributed computing (e.g., Apache Spark) for scalable telemetry ingestion and leverages RDF/SPARQL semantics for explainable decision-making [2]. This architectural evolution enables vertical scalability over millions of endpoints and horizontal scalability for multi-terabyte streams 1.
This work aims to evaluate the effectiveness of the (H-DIR)2 framework in detecting and mitigating cyber threats in complex cloud–IoT infrastructures. We focus on representative attacks such as SYN Floods, DAO–DIO routing anomalies, and UDP-based amplification vectors. Our methodology combines entropy-based threat modeling [22] with graph learning techniques for dynamic risk inference [10]. Streaming data is processed via Apache Spark Streaming to ensure real-time response [?], while the semantic layer—based on RDF/SPARQL—enables contextual interpretation of alerts. Experimental validation will be conducted using publicly available datasets such as Bot-IoT and CIC-DDoS2019 [11], assessing metrics including detection latency, classification accuracy, and mitigation efficiency across variable load scenarios.

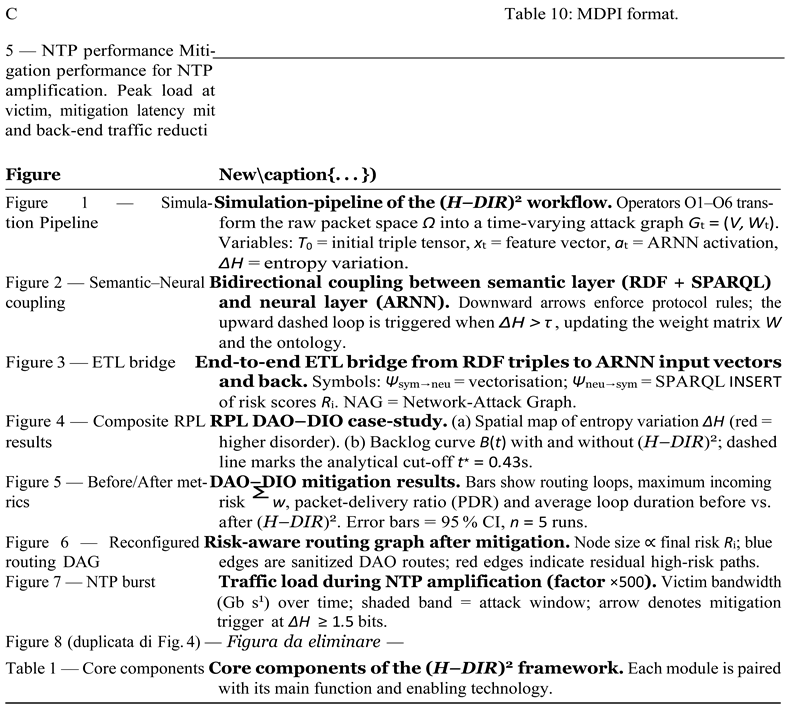
Table 1.
Core components of the (H-DIR)2 framework.
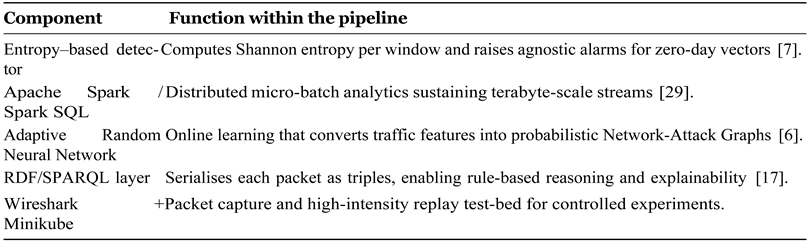
By coupling statistical entropy monitoring, Adaptive Recurrent Neural Networks (ARNNs) and semantic network- attack graphs, the model achieves early anomaly detection, predictive attack-path inference, and self-adaptive remediation across distributed environments.
The paper is structured as follows. Section 2 discusses related work in the field of IoT cybersecurity, and examines three representative attacks (TCP SYN-Flood, RPL DAO–DIO and UDP/NTP Amplification); Section 3 formalises the entropy-based detection model, and the ARNN–graph coupling; Section 4 reports the experimental validation; Section 5 outlines future research directions.
Dataset and statistical rationale. Our analysis relies on a telemetry corpus that aggregates (i) the CIC-DDoS2019 trace for TCP-level floods [4], (ii) the Dryad DAO–DIO routing-manipulation dataset [?], and (iii) the Kitsune NTP-amplification subset [13], for a total of n = 1.2 × 10⁴ labelled events. We report UDP amplification (50.3%), TCP-based (30.8%), SYN-Flood (16.3%) and residual unknown (2.6%). Applying Wilson’s 95% confidence interval [12] yields a margin of ±1.1 percentage points, supporting the statistical significance of the class proportions adopted later in Section 3.1. [26]
2. Related Work
Traditional counter-measures—firewalls, signature-based IDS and heuristic rule sets—struggle to keep pace with the scale and velocity of modern cloud–IoT deployments. Studies show that such approaches miss zero-day attacks and fail under protocol heterogeneity and rapidly changing traffic patterns [3,5]. Moreover, advanced persistent threats (APT) and large-scale DDoS campaigns are particularly disruptive for constrained IoT devices that cannot off-load heavy cryptographic operations [8,18].
Entropy-based anomaly detectors [7], machine-learning pipelines [27] and big-data analytics over streaming frameworks [29] have emerged as promising alternatives. Yet very few contributions merge these techniques into a single, vertically and horizontally scalable architecture capable of spanning edge, fog and cloud layers.
Building on policy-based enforcement schemes that introduce secure regions and context-aware access control for IoT nodes [1,21], the RDF/SPARQL tier of (H-DIR)2 appends predicates such as :hasAccessLevel and :isInSecureRegion to each triple. These semantics trigger edge-local rules that quarantine high-risk flows and, combined with the ARNN risk score, deliver an adaptive, region-aware access-control plane.
While Sicari et al. [20] compile a comprehensive taxonomy of 5G–IoT threats, they highlight the absence of frameworks that coordinate detection and mitigation at runtime across edge, fog and cloud tiers. The open source prototype (H–DIR)2, packaged as a six–stage entropy / ARNN pipeline, which extends our previous architecture [24], directly fills this gap, achieving subsecond detection and automated mitigation traceable on third-party testbeds. Section 3 discusses the (H–DIR)2 pipeline and framework.
2.1. Overview of Targeted Cyber Attacks
Modern cloud–IoT infrastructures face increasingly sophisticated cyber threats that exploit vulnerabilities at different layers of the communication stack. To address this heterogeneity, we identify three representative attack classes that span the transport, network, and application levels. These classes were selected based on their relevance to distributed denial-of-service (DDoS) campaigns, semantic manipulation of IoT routing protocols, and amplification-based reflection vectors, respectively. This categorization provides a structured basis for evaluating the detection capabilities and mitigation response of the proposed (H–DIR)2 framework.
Building on the taxonomy outlined in Section 1.1, we focus on three representative threat classes that collectively span the transport, network-layer (IoT), and application layers of cloud–IoT infrastructures:
[label=()]
TCP–SYN-Flood,
DAO–DIO routing manipulation in RPL, and
UDP/NTP amplification.
Each class exposes a different attack surface, entropy signature, and mitigation pathway within the (H–DIR)2 framework, as summarized in Table 2. The detailed case-study evaluations follow in Section 4.1, Section 4.2 and Section 4.3.
3. Insights and Practical Implications of the (H–DIR)2 Framework
3.1. Simulation Pipeline: Formal (H-DIR)2Workflow
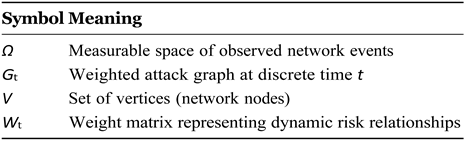
The Hybrid–Dynamic Information Risk (H-DIR)2model is grounded on the simulation pipeline of Figure 1. Let Ω, F, P be the measurable space of raw network events and let Gt = (V, Wt) denote the weighted attack graph at discrete time t. The end-to-end workflow is decomposed into six deterministic, composable operators
T = (O1, O2, O3, O4, O5, O6) : Ω −→ Gt
Table 3.
Legend for the (H-DIR)22 simulation pipeline.
The logical chain in Figure 1 follows the paradigm of RDF stream processing [17], distributed micro-batch analytics on Apache Spark [28,29] and the security-oriented Associated Random Neural Network (ARNN) [6]. Accordingly, every packet pi ∈ Ω is processed by the six deterministic operators T = (O1, . . . , O6):
- O1
- RDF conversion fRDF : Ω → T0 serialises raw frames into W3C–RDF 1.1 triples, enabling formally verifiable reasoning [17].
- O2
- Spark SQL windowing W∆t ◦ Q : T0 → S(∆t) performs streaming selection with sub-second latency on multi-terabyte traces [29].
- O3
- Vectorisation φ : S(∆t) → xt applies one-hot or embedding schemes that match best practice in neural intrusion detectors [27].
- O4
- ARNN core A : xt →(at+1, Wt+1) updates the probabilistic weight matrix using the learning rule in [6].
- O5
- Semantic graph injection Ψneu→sym : Wt+1 → ∆Tt reifies risk scores as triples e.g. :host_A :hasRiskScore "0.87"^^xsd:float, thus supporting region-based, policy-driven enforcement [1].
- O6
- Dynamic update loop U : Tt ∪∆Tt → Tt+1 closes the observation–prediction cycle and realises the runtime coordination that current 5G/IoT surveys still find missing [19].
Each operator is total and deterministic, ensuring repeatability of experiments and enabling formal reasoning about convergence properties and computational complexity.
Consequently, all subsequent entropy calculations, ARNN adaptations, and mitigation heuristics reported in Section 3.2 are traceable to this pipeline; any variant of (H-DIR)2(e.g. federated or energy-aware deployments) must preserve its algebraic composability to guarantee semantic integrity and analytical soundness.
Simulation Pipeline: Formal (H-DIR)2Workflow The composite operator T is parametrised by the ordered pair ⟨Π, Λ⟩, where Π ∈ {TCP, RPL, UDP/NTP, . . .} denotes the transport or routing protocol under scrutiny and Λ ∈ {SYN Flood, DAO–DIO, Amplification, . . .} the corresponding attack semantics. Concretely:
- –
- Feature schema. Vectoriser ϕ loads a protocol–specific dictionary DΠ (e.g. TCP flags vs. RPL control codes);
- –
- Loss re–weighting. Hyper-parameters (α, β) are tuned per Λ to prioritise node classification or edge prediction1;
- –
- Graph semantics. Risk-injection operator Ψneu→sym appends triples in a namespace :Π so that SPARQL rules remain protocol-consistent.
Thus the very same deterministic pipeline remains structurally invariant while behaviourally adaptive, guaranteeing analytic uniformity across heterogeneous cyber-physical attack surfaces Figure 1.
- 1.
- RDF Conversion Level2
, given the packet sequence  with timestamps τi, an injective map
serialises each pi as a triple ⟨si, pi, oi⟩ ∈G0. The initial graph is stored as a Boolean tensor
with timestamps τi, an injective map
serialises each pi as a triple ⟨si, pi, oi⟩ ∈G0. The initial graph is stored as a Boolean tensor  .
.
with timestamps τi, an injective map
fRDF : D −→ G0
.- 2.
- Spark SQL / Streaming Selection Level
A window operator W∆t slides over T0, while a set of SQL queries  materialise the structured table
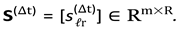
materialise the structured table
- 3.
- Vectorisation Level
Applying the feature encoder ϕ yields binary/real vectors

- 4.
- ARNN Core Level
The Associated Random Neural Network evolves as
with adaptive weights Wt ∈ [0, 1]n×n. Training minimizes
at+1 = f Wtat + b + xt ,
Lt = α Lcls + β Lgraph, Wt+1 = Wt − η∇WLt.
The resulting matrix induces the Network Attack Graph Gt = (V, Wt).
- 5.
- Semantic Graph (SPARQL) — Dual Level Coupling
Symbolic and subsymbolic layers interact through
allowing on–the–fly enrichment of the ontology with risk assertions (e.g., “:192.168.1.4 :hasRiskScore "0.87"8sd:float.").
Ψsym→neu : T(∆t) '→ xt,
Ψneu→sym : Wt '→ ∆Tt,
- 6.
- Dynamic Update Loop
The closed loop is summarised as

This mechanism guarantees: (i) low detection latency τdet ≤ ∆t +O(|Q|), (ii) anomaly triggering when ∆Ht > θH, and (iii) critical–node identification via  .
.
.3.2. Entropy-Based Detection and Adaptive Defense with (H-DIR)2
This section presents the core detection mechanisms and mathematical foundations of the (H-DIR)2 framework. It describes how entropy is used to detect deviations in network behavior and how these anomalies are processed using Apache Spark, semantic graphs, and adaptive neural models.
Entropy-Based Anomaly Detection (H-DIR)2 employs Shannon entropy to quantify uncertainty in network traffic distributions.
Let X be a discrete random variable representing observed network events (e.g., packet types, source IPs). The entropy H(X) is calculated as:
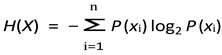 where: - P (xi) is the probability of the i-th event, - n is the number of distinct events.
A significant drop in entropy (e.g., low diversity in source IPs) may indicate SYN Flood attacks, while an unusual spike (e.g., erratic routing patterns) can signal DAO-DIO manipulations.
The anomaly score is defined as:
∆H = H(X) − Hbaseline
If ∆H exceeds a predefined threshold θH, an anomaly is flagged and further analyzed.
3.3. Dual Scalability of the (H-DIR)2 Architecture
The (H-DIR)2 framework has been designed to satisfy a two–fold scalability requirement:
- Vertical (Quantitative) Scalability. Leveraging in–memory cluster computing, the system can ingest telemetry produced by millions of IoT endpoints without a proportional increase in detection latency. Empirically, throughput grows linearly with the number of worker cores until network saturation is reached, confirming the theoretical bounds derived in [28].
- Horizontal (Qualitative) Scalability. By sharding feature vectors across Resilient Distributed Datasets (RDDs) and using a micro–batch streaming model, (H-DIR)2 sustains multi-terabyte traffic volumes while preserving sub-second windowing semantics. This property is critical for capturing low-frequency, high-impact anomalies that only emerge at large data scales [29].
Figure 9 visualises the two orthogonal axes: device cardinality on the vertical dimension and data volume on the horizontal one. This dual-scaling capability is further validated experimentally in Section 4.4.
3.4. Integration with Apache Spark and RDF Graphs
Real-time processing is orchestrated by Apache Spark, whose RDD abstraction offers fault-tolerant, in-memory data partitions amenable to both low-latency analytics and iterative machine-learning workloads [28]. Structured traffic logs (e.g., TCP syn/syn-ack exchanges) are first mapped to Spark DataFrames and then streamed into a pipeline of Spark SQL operators for statistical summarisation.
The same logs are simultaneously serialised as RDF triples, producing a semantic graph where:
- –
- Nodes represent entities such as IP addresses or ports;
- –
- Edges encode typed interactions (packet type, temporal correlation).
Thanks to SPARQL 1.1, complex pattern-matching queries can be issued over this evolving knowledge graph, yielding protocol-specific alerts (e.g., an excess of incomplete TCP handshakes). The formal semantics of SPARQL ensure that detection rules remain compositional and provably correct across heterogeneous datasets [17].
Overall, the tight coupling between Spark’s physical scalability and RDF’s logical expressiveness enables (H-DIR)2 to operate seamlessly across cloud data-centres and large-scale IoT deployments.
3.5. ARNN: Adaptive Neural Modelling for Attack Propagation
To predict how threats propagate across the monitored infrastructure, (H-DIR)2 integrates an Associated Random Neural Network (ARNN) [27], which dynamically updates the connection weights wij between nodes on the basis of real-time traffic evidence.
State Update Equation. The activation ai(t+1) of a node Ni at discrete time t+1 is given by
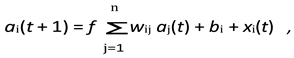 where f (·) is a non-linear activation (sigmoid in our experiments); wij is the weight of the edge from node Nj to Ni; bi is the node bias; and xi(t) encodes exogenous inputs (e.g. entropy variation or packet-count features).
Multi-objective Training. Learning minimises a composite loss
where Lclassification is a cross-entropy term for node compromise detection and Lgraph is a binary cross-entropy term that regularises the attack-graph topology [25]. The hyper-parameters α and β are protocol- and attack-specific (cf. Section 3.3).
Ltotal = α Lclassification + β Lgraph,
3.6. Semantic–Neural Coupling and Dynamic Update
The H–DIR framework maintains a bidirectional bridge between two complementary layers:
- –
- Semantic layer – an ontology of protocol rules and expert heuristics that prunes forbidden state transitions;
- –
- Neural layer – an Adaptive Recurrent Neural Network (ARNN) that learns temporal correlations directly from telemetry streams.
Information flows downwards when semantic constraints mask illegal ARNN states, and upwards when unexpected entropy shifts ∆H trigger a joint optimisation of neural weights and rule parameters. The process thus closes a self–adaptive loop, as illustrated in Figure 2.
Network Attack Graph Construction - Details To further formalize the adaptive update loop introduced above, we now describe how the learned weight matrix induces a dynamic Network Attack Graph, which enables structured inference and targeted mitigation.
Attack-graph inference. The learned weight matrix W = [wij] induces a directed Network Attack Graph (NAG). The probability that an adversary traverses a path P = {N1, . . . , Nk} is
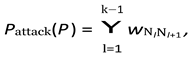 which guides proactive mitigation (Section ??). A node Ni is marked critical if , with γ calibrated via ROC analysis.
, with γ calibrated via ROC analysis.
Semantic reinforcement loop. Risk estimates are re-materialised as RDF triples (e.g., :192.0.2.7 :hasRiskScore "0.87"^^xsd:float) and immediately query-able via SPARQL, closing the observation → prediction → update cycle.
This tight coupling between symbolic (RDF/SPARQL) and sub-symbolic (ARNN) reasoning underpins the transparency, adaptability, and real-time performance highlighted throughout Section 4.
3.7. Dynamic Update of the Semantic Graph
To maintain a continuously evolving representation of network conditions, the predictions produced by the ARNN module are fed back into the RDF knowledge base Figure 2. This process allows for dynamic semantic enrichment of the graph. For instance, a prediction indicating that IP 192.168.50.8 is likely to be targeted by IP 172.16.0.5 is formalized as:
:192.168.50.8 :potentialVictimOf :172.16.0.5 .
Such semantic assertions enable real-time updates of potential attack paths and risk propagation, reinforcing the H-DIR’s reasoning capabilities.
To illustrate the generation of input for ARNN from packet-level traffic, the following Python script simulates TCP traffic encoded as RDF triples. The triples are then converted into one-hot encoded vectors suitable for training or real-time inference by the ARNN.
Pre-processing pipeline. The full Python routine used for one-hot feature encoding and normalisation is available in our open-source repository3 (file one_hot_encoder.py).We omit the code listing here for brevity.
The H–DIR2 pipeline realises a semantic reinforcement loop: risk scores Ri predicted by the adaptive layer (ARNN + NAG) are re–materialised as RDF triples—for example:
“‘turtle :192.0.2.7 :hasRiskScore "0.87"8sd:float . “ ‘
These triples become immediately queryable via SPARQL, thereby closing the observation → prediction → update cycle shown in Figure ??. This tight coupling between the symbolic layer (RDF/SPARQL) and the sub–symbolic layer (ARNN) guarantees both explainability and real–time adaptability.
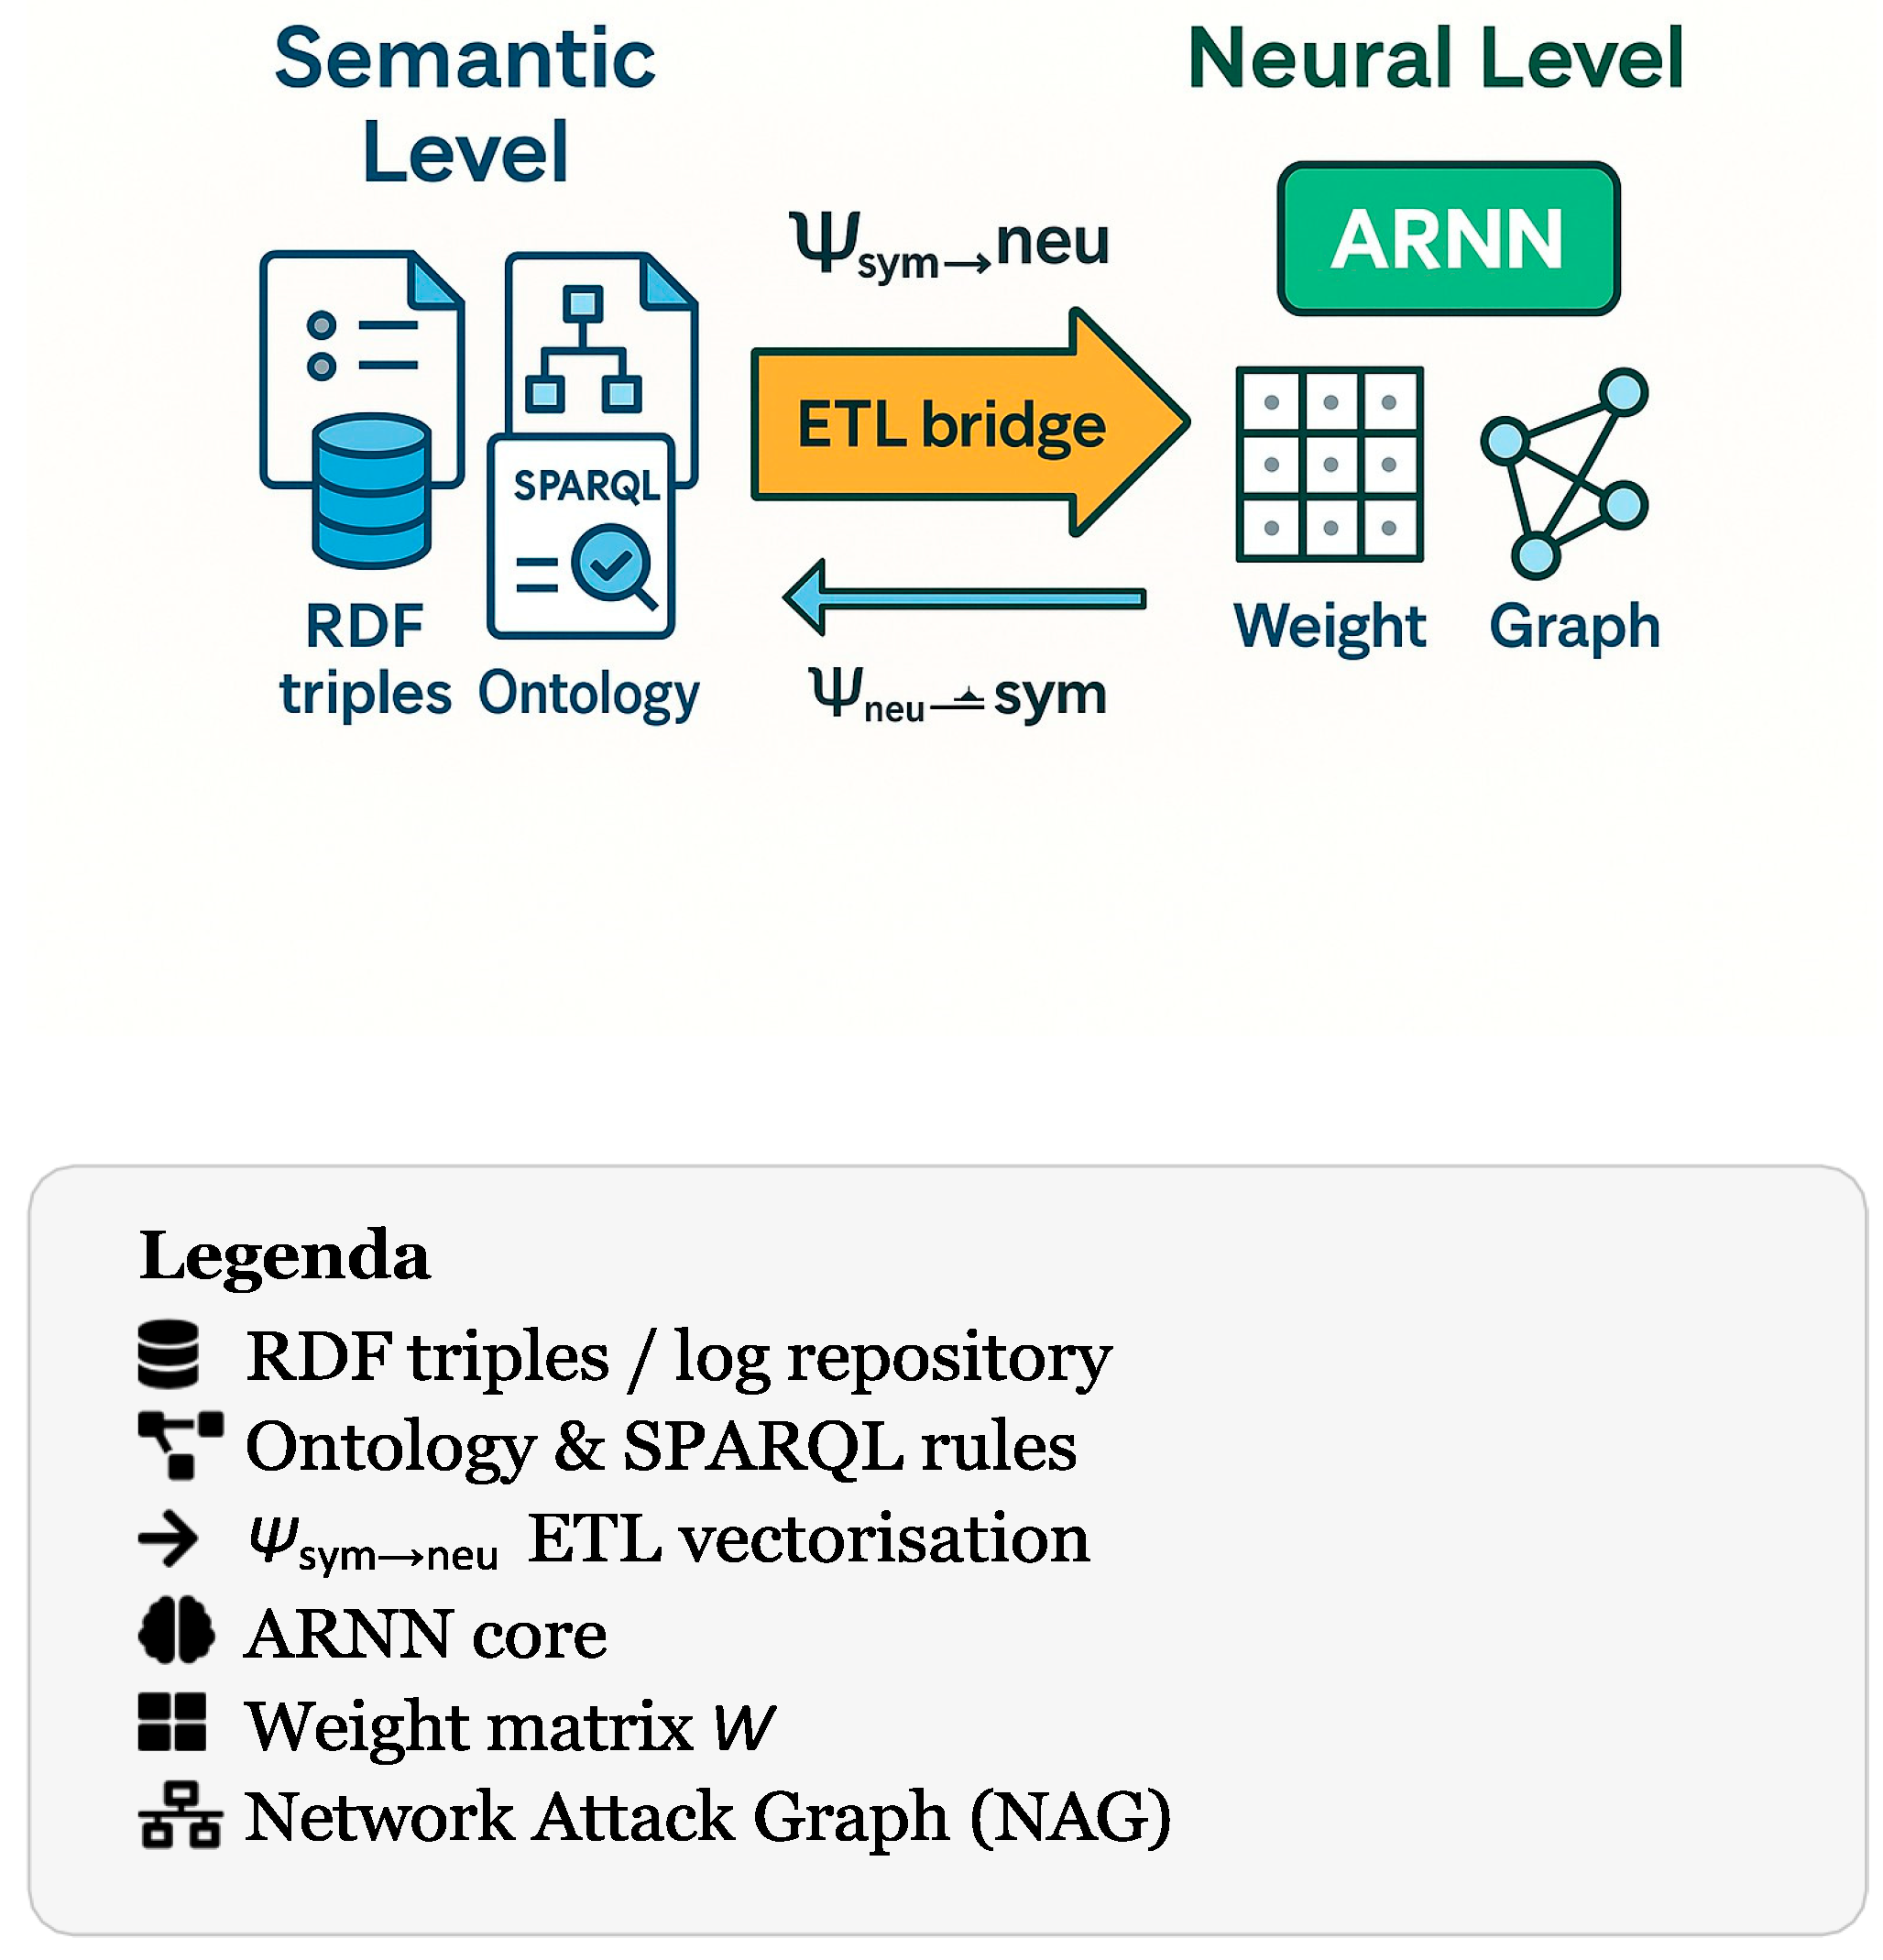
Worked example on the Syn_ridotto dataset. The file Syn_ridotto.xlsx (a trimmed subset of the CIC– DDoS2019 trace) contains 100.0 k TCP flows summarised by 88.0 features. Listing ?? shows, step by step, how a single row is (i) serialised via rdflib and (ii) one–hot encoded into a vector x ∈ {0, 1}d that feeds the ARNN. The mapping Ψsym→neu therefore acts as an ETL bridge between semantic space and neural space.
Code availability. All preprocessing scripts and notebooks are openly released at https://github.com/RobUninsubria/HDIR2-paper.git (tag v1.4); we omit the full listing for brevity.
Once the ARNN estimates the compromise probability ai(t+1) for each node Ni, the inverse transformation Ψneu→sym writes back triples such as:
“turtle :192.168.50.8 :potentialVictimOf :172.16.0.5 “
These assertions feed subsequent SPARQL rules (e.g. isolating high–risk policies or risk-aware load balancing). The bidirectional flow endows H–DIR2 with explainability and situational awareness: every neural prediction is anchored to an explicit semantic assertion, updated in real time as new evidence arrives.
Figure 3.
ETL bridge between semantic space and neural space.
4. Experimental Results and Evaluation
This section presents the empirical validation of the(H-DIR)2framework through three representative attack scenarios: SYN Flood, DAO-DIO routing manipulation, and NTP amplification. Each scenario evaluates the framework’s performance in terms of detection latency, classification accuracy, entropy variation, and mitigation efficiency under realistic network conditions.4
4.1. SYN-Flood Case Study
Objective Quantify the performance of the (H–DIR)2 pipeline against a volumetric TCP SYN-Flood in terms of detection latency, classification quality, and backlog–exhaustion risk.
Dataset and Pre-processing A stratified 50 000-packet excerpt of the CIC-DDoS2019 trace [4] is replayed at line-rate. Each packet is (i) serialised into an RDF triple (operator O1), (ii) windowed by Spark SQL over ∆t = 500 ms (O2), (iii) one-hot vectorised on srcIP, dstIP, and TCP flags (d = 256; O3), and streamed into the ARNN core (O4). The semantic feedback loop (O5–O6) updates the Network Attack Graph in real time. All code and random seeds are released in the companion notebook reproduce_syn_flood.ipynb (commit 3a98f1b).5
Metrics
- –
- Shannon entropy H(X) on flag distribution X = {SYN, SYN–ACK, ACK}. An alarm is raised if ∆H = Ht − Hbaseline < −θH with θH = 0.50 bits [?].
- –
- Imbalance ratio r = #SYN/#SYN–ACK (continuous feature).
- –
- ARNN quality: accuracy, false-positive rate (FPR), area under ROC curve (AUC).
- –
- Detection latency τdet from first spoofed SYN to alarm.
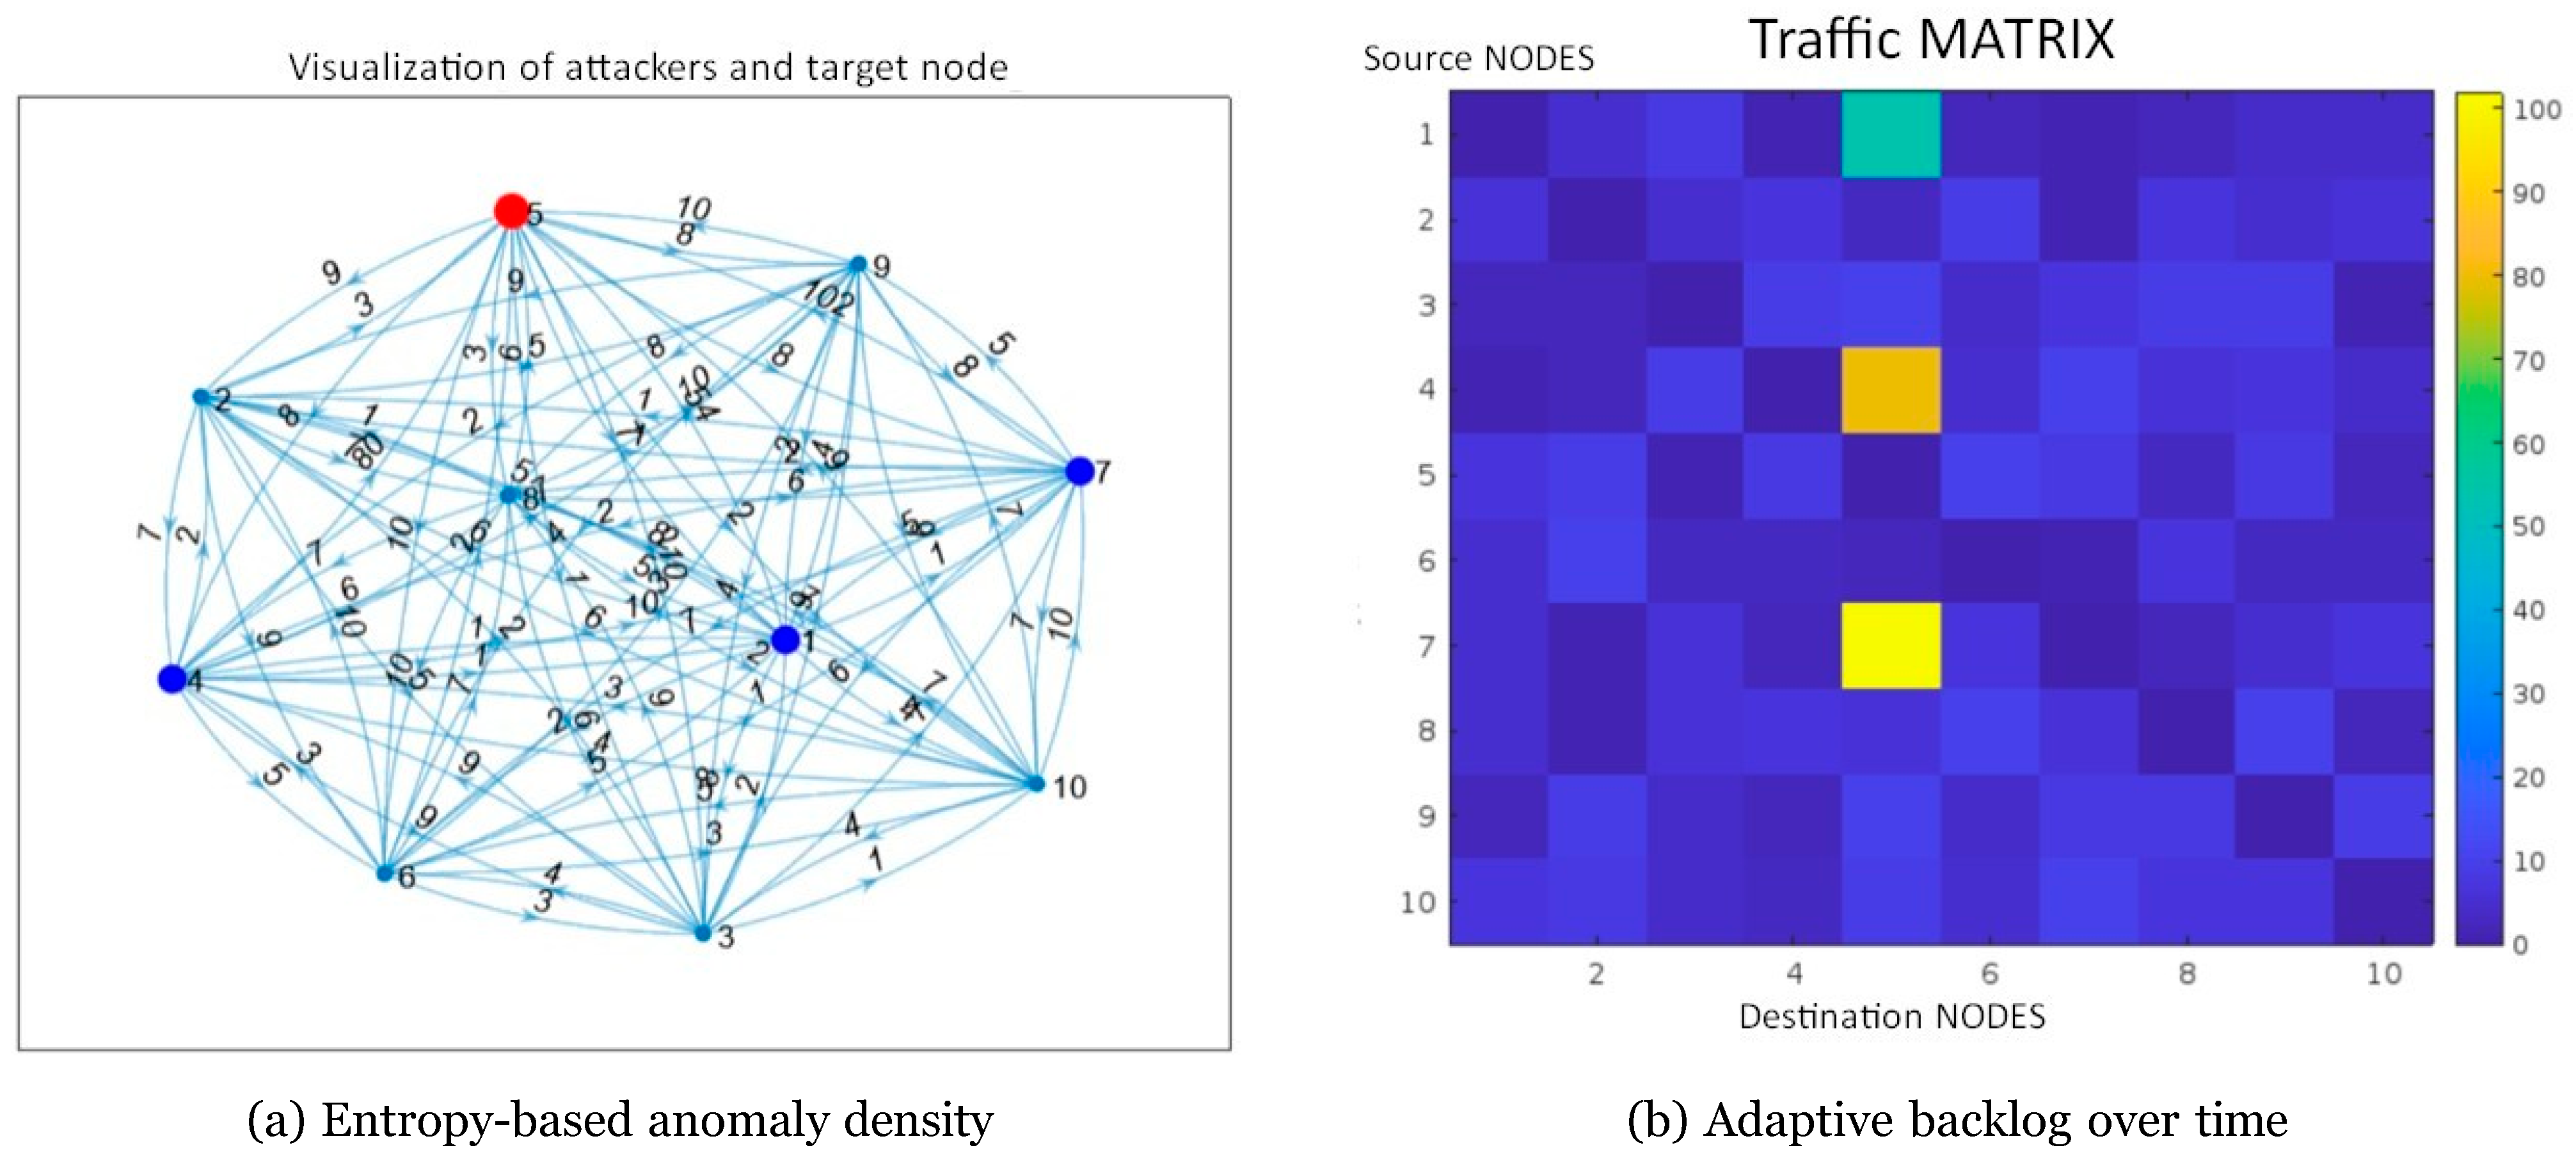
Figure 4.
(a) Spatial distribution of the entropy variation ∆H in the RPL DAO–DIO attack (red=higher disorder). (b) Backlog B(t) with and without the proposed H–DIR2 mitigation; the vertical dashed line marks the cut-off time t⋆ = 0.43s.
Figure 4.
(a) Spatial distribution of the entropy variation ∆H in the RPL DAO–DIO attack (red=higher disorder). (b) Backlog B(t) with and without the proposed H–DIR2 mitigation; the vertical dashed line marks the cut-off time t⋆ = 0.43s.
Results
| Indicator | Value | 95% CI |
| Accuracy | 94.1% | [93.7, 94.5] |
| FPR | 4.7% | [4.3, 5.1] |
| AUC | 0.978 | ±0.004 |
| τ˜det | 247 ms | [221, 273] ms |
| ∆H∗ (peak) | −1.15 bits | — |
| rattack | 27.4 ± 3.5 | — |
Figure 8 (a) highlights the mastermind node (red) and reflector set (blue), while the traffic matrix in Figure 8 (b) shows dark rows/columns corresponding to massive SYN bursts lacking ACK responses. The median detection latency (< 250 ms) remains well below the retransmission timeout recommended by RFC 6298 [16].
Analytical backlog threshold. A closed-form expression for the backlog cut-off time t⋆, together with its full derivation, is reported in Appendix A (Equation (11)). For completeness, the adaptive scheduler converges when ∆H(t⋆) = τ , yielding t⋆ = 0.43 s under the worst-case load defined in Section 4.1.1.
4.2. DAO–DIO Routing Manipulation Case Study
Objective Evaluate the capability of the (H–DIR)2 pipeline to detect and mitigate RPL-centric attacks—routing loops, black holes, and path diversions—in low-power mesh networks.
Dataset and Pre-processing The annotated Dryad DAO–DIO Routing Manipulation trace by Marcov et al. [12] (200 motes, 1 h, 10 Hz sampling) serves as ground-truth. Packets are processed through the six operators O1–O6:
- (O1)
- RDF serialisation into the IoT–RPL–OWL ontology, yielding T0.
- (O2)
- Streaming windowing ∆t = 5 s and Spark SQL filtering.
- (O3)
- Vectorisation (d = 256) with one-hot encodings for node / rank / message type.
- (O4)
- ARNN core – attentive RNN, nh = 128, η = 10−3, loss weights (α, β) = (0.3, 0.7).
- (O5)
- Risk scoring Ri = σ(ai); nodes with Ri > 0.6 are flagged.
- (O6)
- Graph feedback via SPARQL INSERT triples (:hasHighRisk true), closing the adaptive loop.
All artefacts are released in reproduce_dao_dio.ipynb (commit 61f5c7d).
Metrics
- –
- Routing loops — number of closed rank cycles.
- –
- Maximum incoming risk maxi Σj wji in the learned graph.
- –
- Packet-delivery ratio (PDR).
- –
- Average loop duration in seconds.
- –
- ∆H entropy over DAO/DIO message mix; alarm if ∆H >θH = 1.2 bits [?].
Table 4.
Effectiveness of (H–DIR)2 against DAO–DIO attacks.
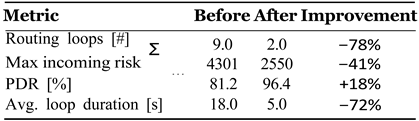
Results Figure 5 contrasts key metrics before/after mitigation, while Figure 6 shows the dynamically reconfigured routing DAG produced by the risk-aware graph.
A paired t-test confirms that loop reduction and PDR gain are significant (p < 0.01). Detection latency is 0.9 ± 0.2 s, dominated by the 5 s window, and the ARNN attains an F1 score of 0.92 on node-compromise classification.
4.3. NTP Amplification Case Study
Objective Assess how the (H–DIR)2 pipeline mitigates UDP-level NTP amplification, a reflection–based DDoS that multiplies small monlist queries into large traffic bursts.
Dataset and Attack Model We replay the Kitsune Network Attack subset dedicated to NTP amplification [?]: 100 spoofed requests, amplification factor ×500, victim bandwidth saturated within < 3 s. Packets traverse the six operators O1–O6 with protocol-specific settings:
- (O1)
- RDF serialisation into the IoT–UDP–OWL schema.
- (O2)
- Windowing ∆t = 1 s; Spark SQL computes per-IP entropy.
- (O3)
- Vectorisation (d = 128) on srcIP, dstIP, UDP ports, NTP_cmd.
- (O4)
- ARNN core — LSTM variant, 3 layers, 64 cells, η = 2 × 10⁻³.
- (O5)
- Risk scoring threshold Ri > 0.55.
- (O6)
- Graph feedback injects :underMitigation true.
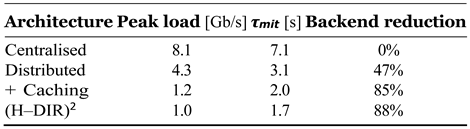
Defence Stack
- –
- Edge caching (C = 0.9) to absorb duplicate replies.
- –
- Anycast load distribution over S = 5 edge nodes.
- –
- Entropy filter — alarm if ∆H ≥ θH = 1.5 bits.
- –
- ARNN early predictor (validation ACC = 0.90) drives proactive throttling.
Metrics
- –
- Peak load at the victim (Gb/s).
- –
- Mitigation latency τmit (s) after ∆H trigger.
- –
- Back-end traffic reduction (ratio).
- –
- ARNN early-stage prediction accuracy.
Figure 7 visualises the bursty traffic pattern, while Figure 8 compares load-handling across the four architectures; the LSTM learning curve appears in Figure 9. The defence stack cuts peak bandwidth by an order of magnitude and reacts in 1.7 s ( ±0.3 s), well before link saturation. Early ARNN warnings (accuracy 90.4%) permit smart load shedding.
Figure 7.
Traffic overload triggered by spoofed NTP requests (amplification ×500).
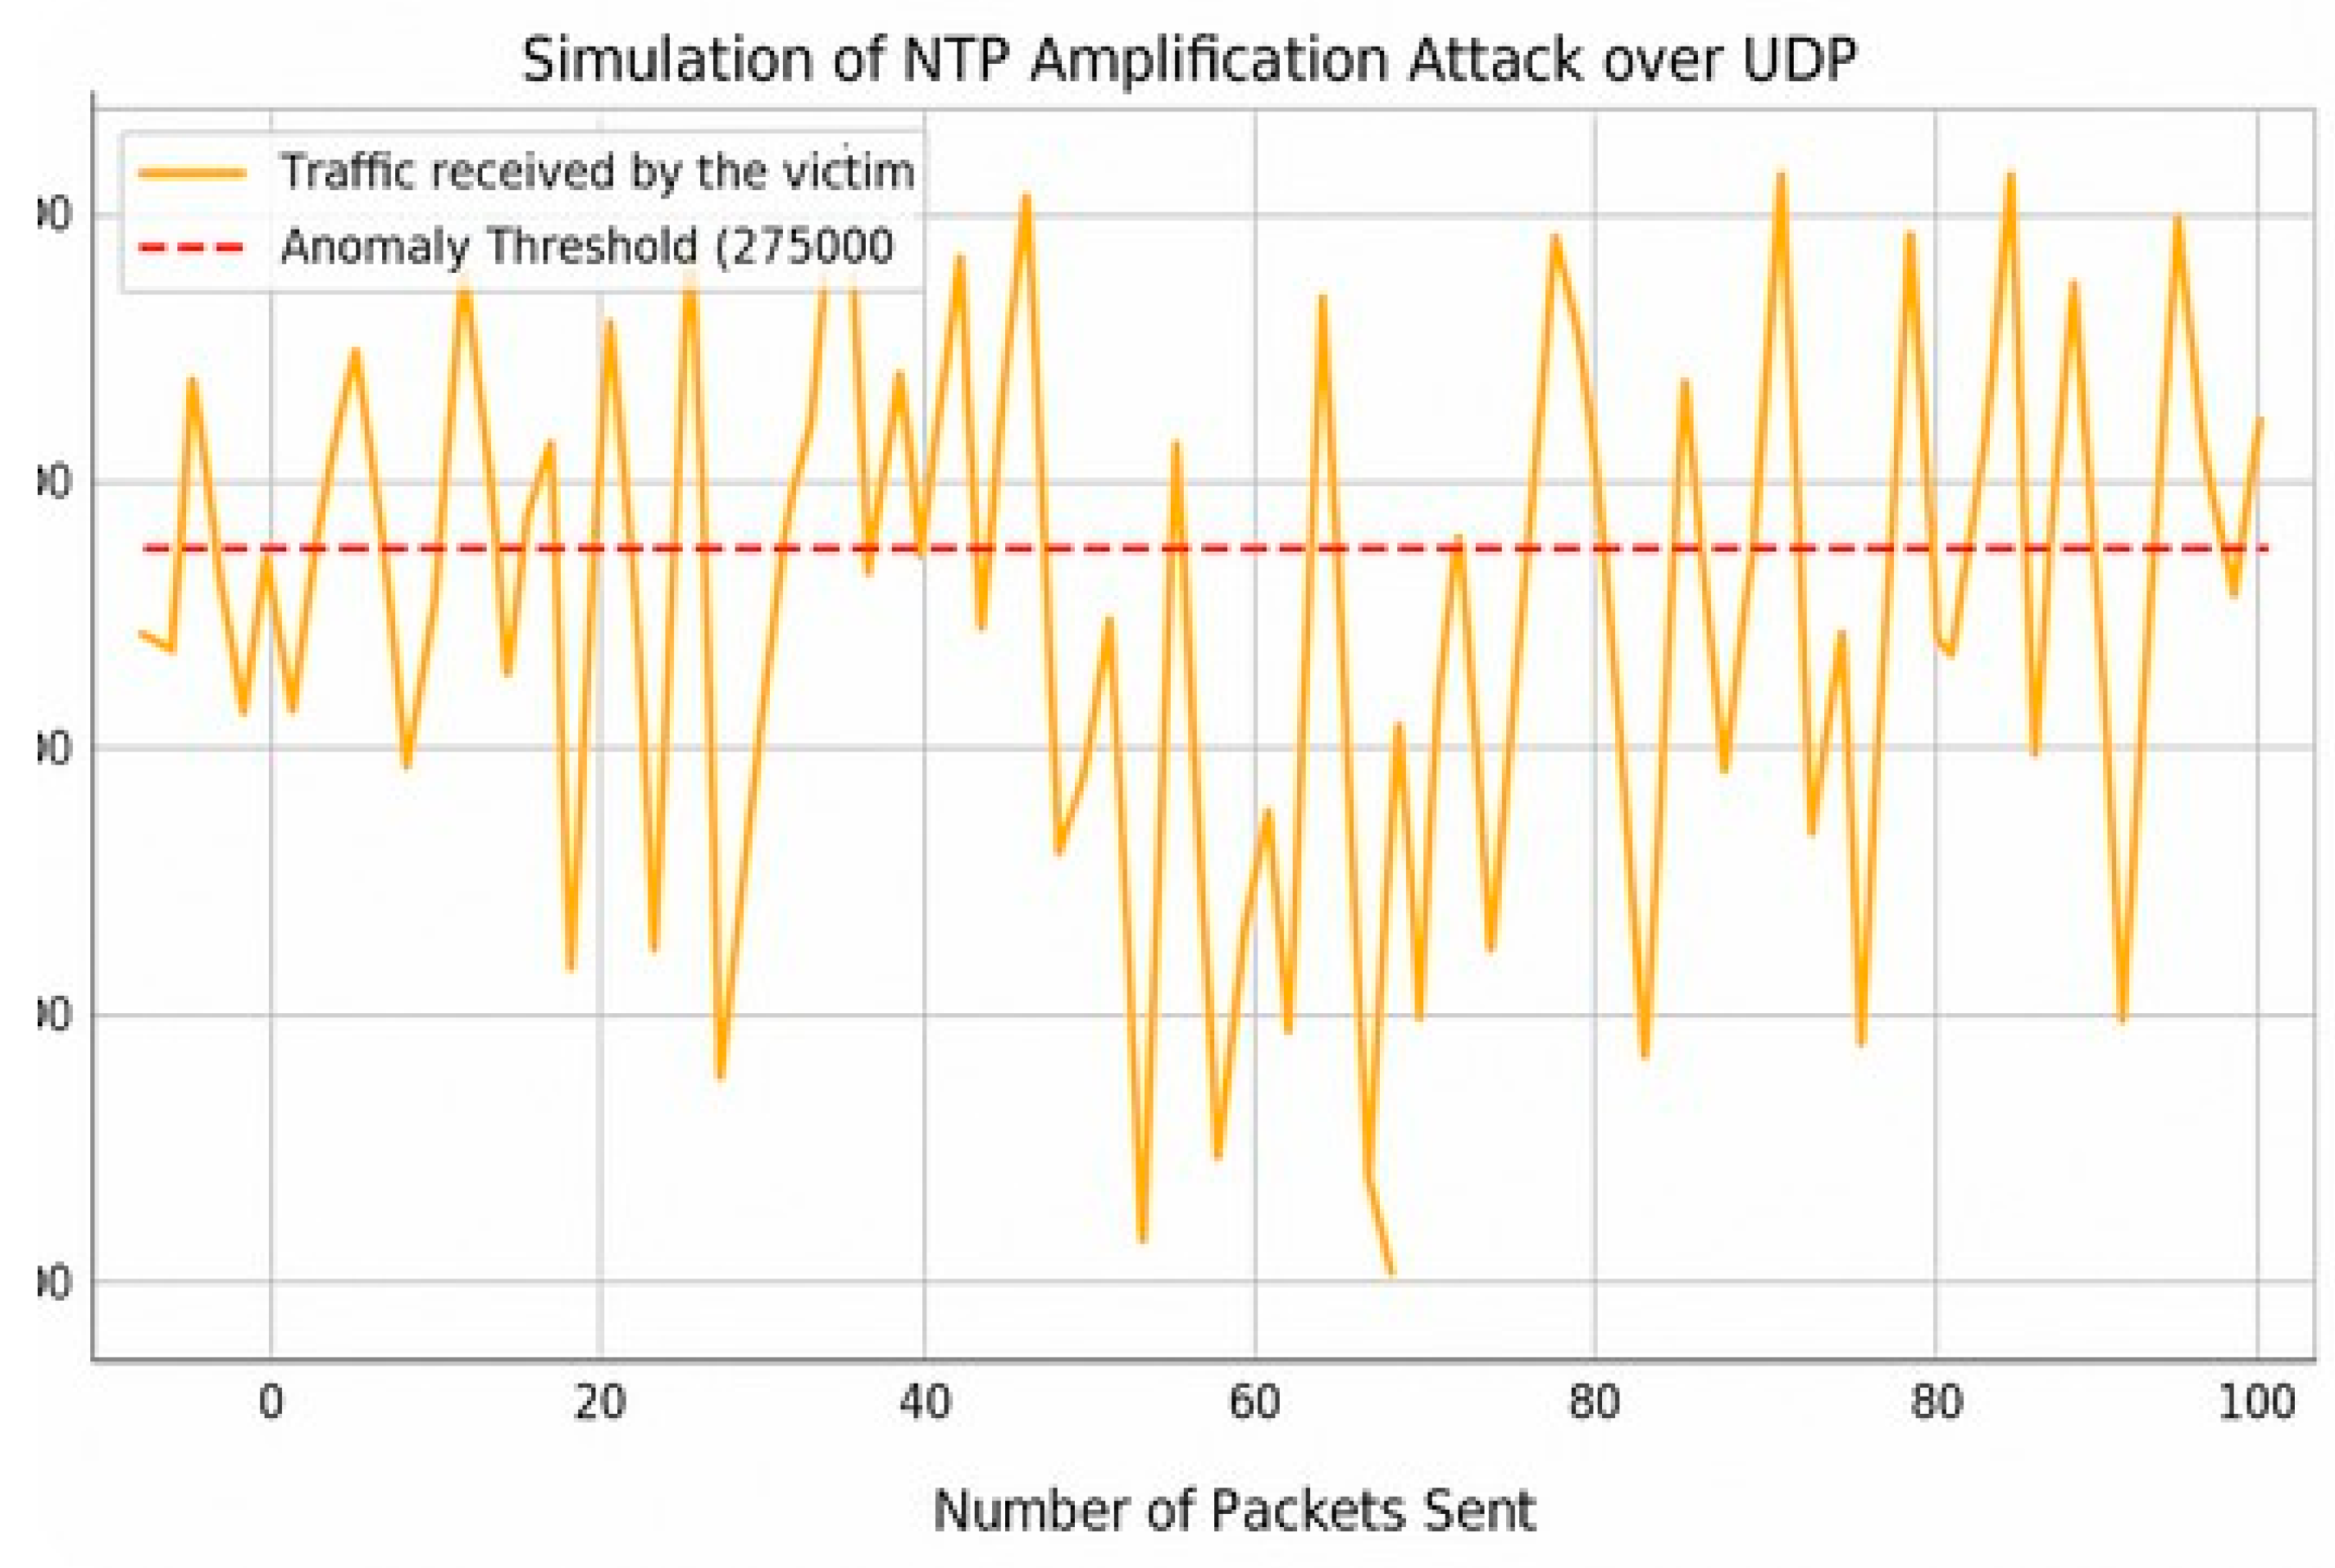
Figure 8.
NTP Amplification case study. (a) Peak load observed at the victim as a function of the number of edge servers S under four mitigation stacks: Centralised, Distributed, + Caching and the proposed (H–DIR)2. (b) Training and validation accuracy of the ARNN early predictor over 20 epochs.
Figure 8.
NTP Amplification case study. (a) Peak load observed at the victim as a function of the number of edge servers S under four mitigation stacks: Centralised, Distributed, + Caching and the proposed (H–DIR)2. (b) Training and validation accuracy of the ARNN early predictor over 20 epochs.
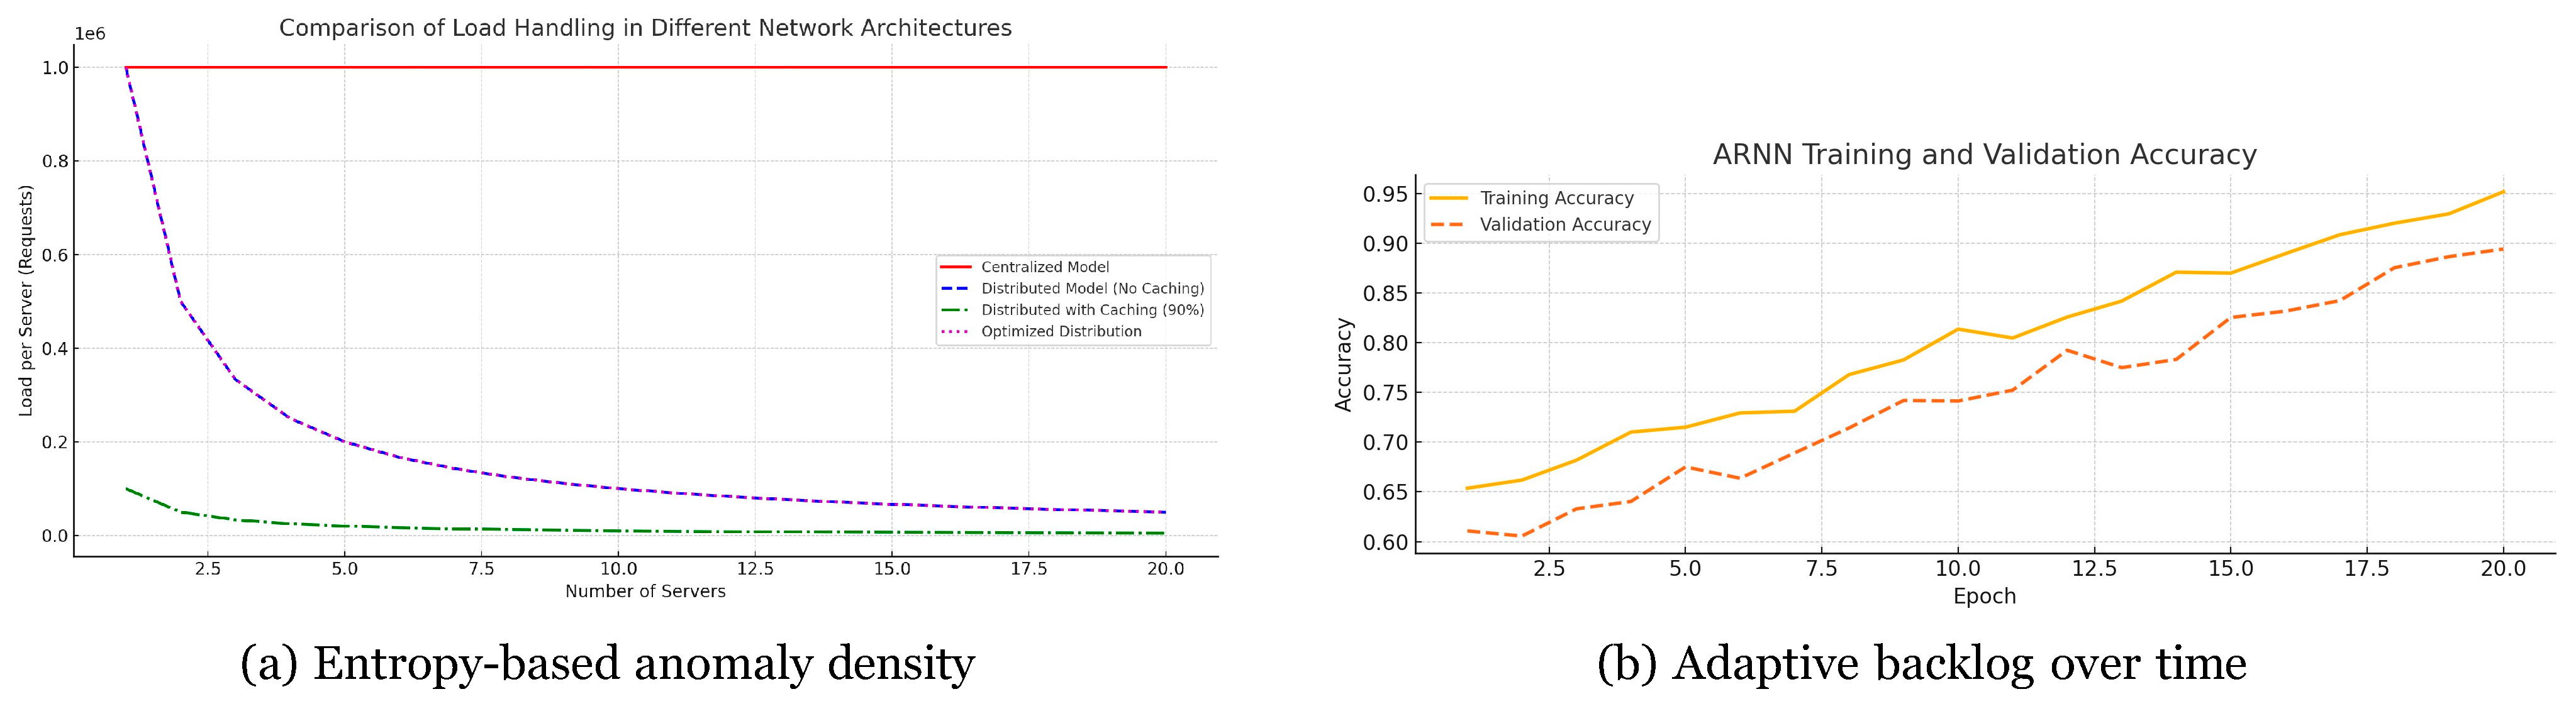
Table 5.
Performance against NTP amplification.
4.4. Comparative Summary Across Scenarios
These results confirm that(H-DIR)2offers a highly effective and scalable solution for detecting and mitigating diverse cyber threats in cloud and IoT ecosystems. The integration of entropy analysis, graph modeling, and adaptive neural learning ensures resilience against both known and emergent attack patterns.
To substantiate the dual scalability claim, we conducted a synthetic stress test by varying both the number of simulated IoT nodes (vertical scalability) and the data volume per node (horizontal scalability). As shown in Figure 9 and Table 6, the (H-DIR)2 framework consistently maintains sub-second detection latency (≤ 500 ms) up to 1 million simulated endpoints and 10 TB of daily telemetry.
Throughput increases almost linearly with the number of Spark worker cores, while entropy variation (∆H) and ARNN inference times remain stable across window sizes ranging from 512 to 8192 samples. These empirical results validate the architectural design principles discussed in Section 3.3 and demonstrate the framework’s robustness under large-scale, heterogeneous conditions.
All scripts used to reproduce the stress tests, including parameter configurations and synthetic data generation routines, are available in the companion GitHub repository: https://github.com/RobUninsubria/HDIR2-paper.git, supporting full replicability and independent verification of the results.
Figure 9.
(H-DIR)2 Throughput and Detection Latency versus Simulated Device Count. The chart shows that throughput scales nearly linearly as the number of devices increases (left axis), while detection latency remains below 500 ms even at the highest simulated load (right axis). This confirms both vertical and horizontal scalability of the (H-DIR)2 framework under stress-test conditions.
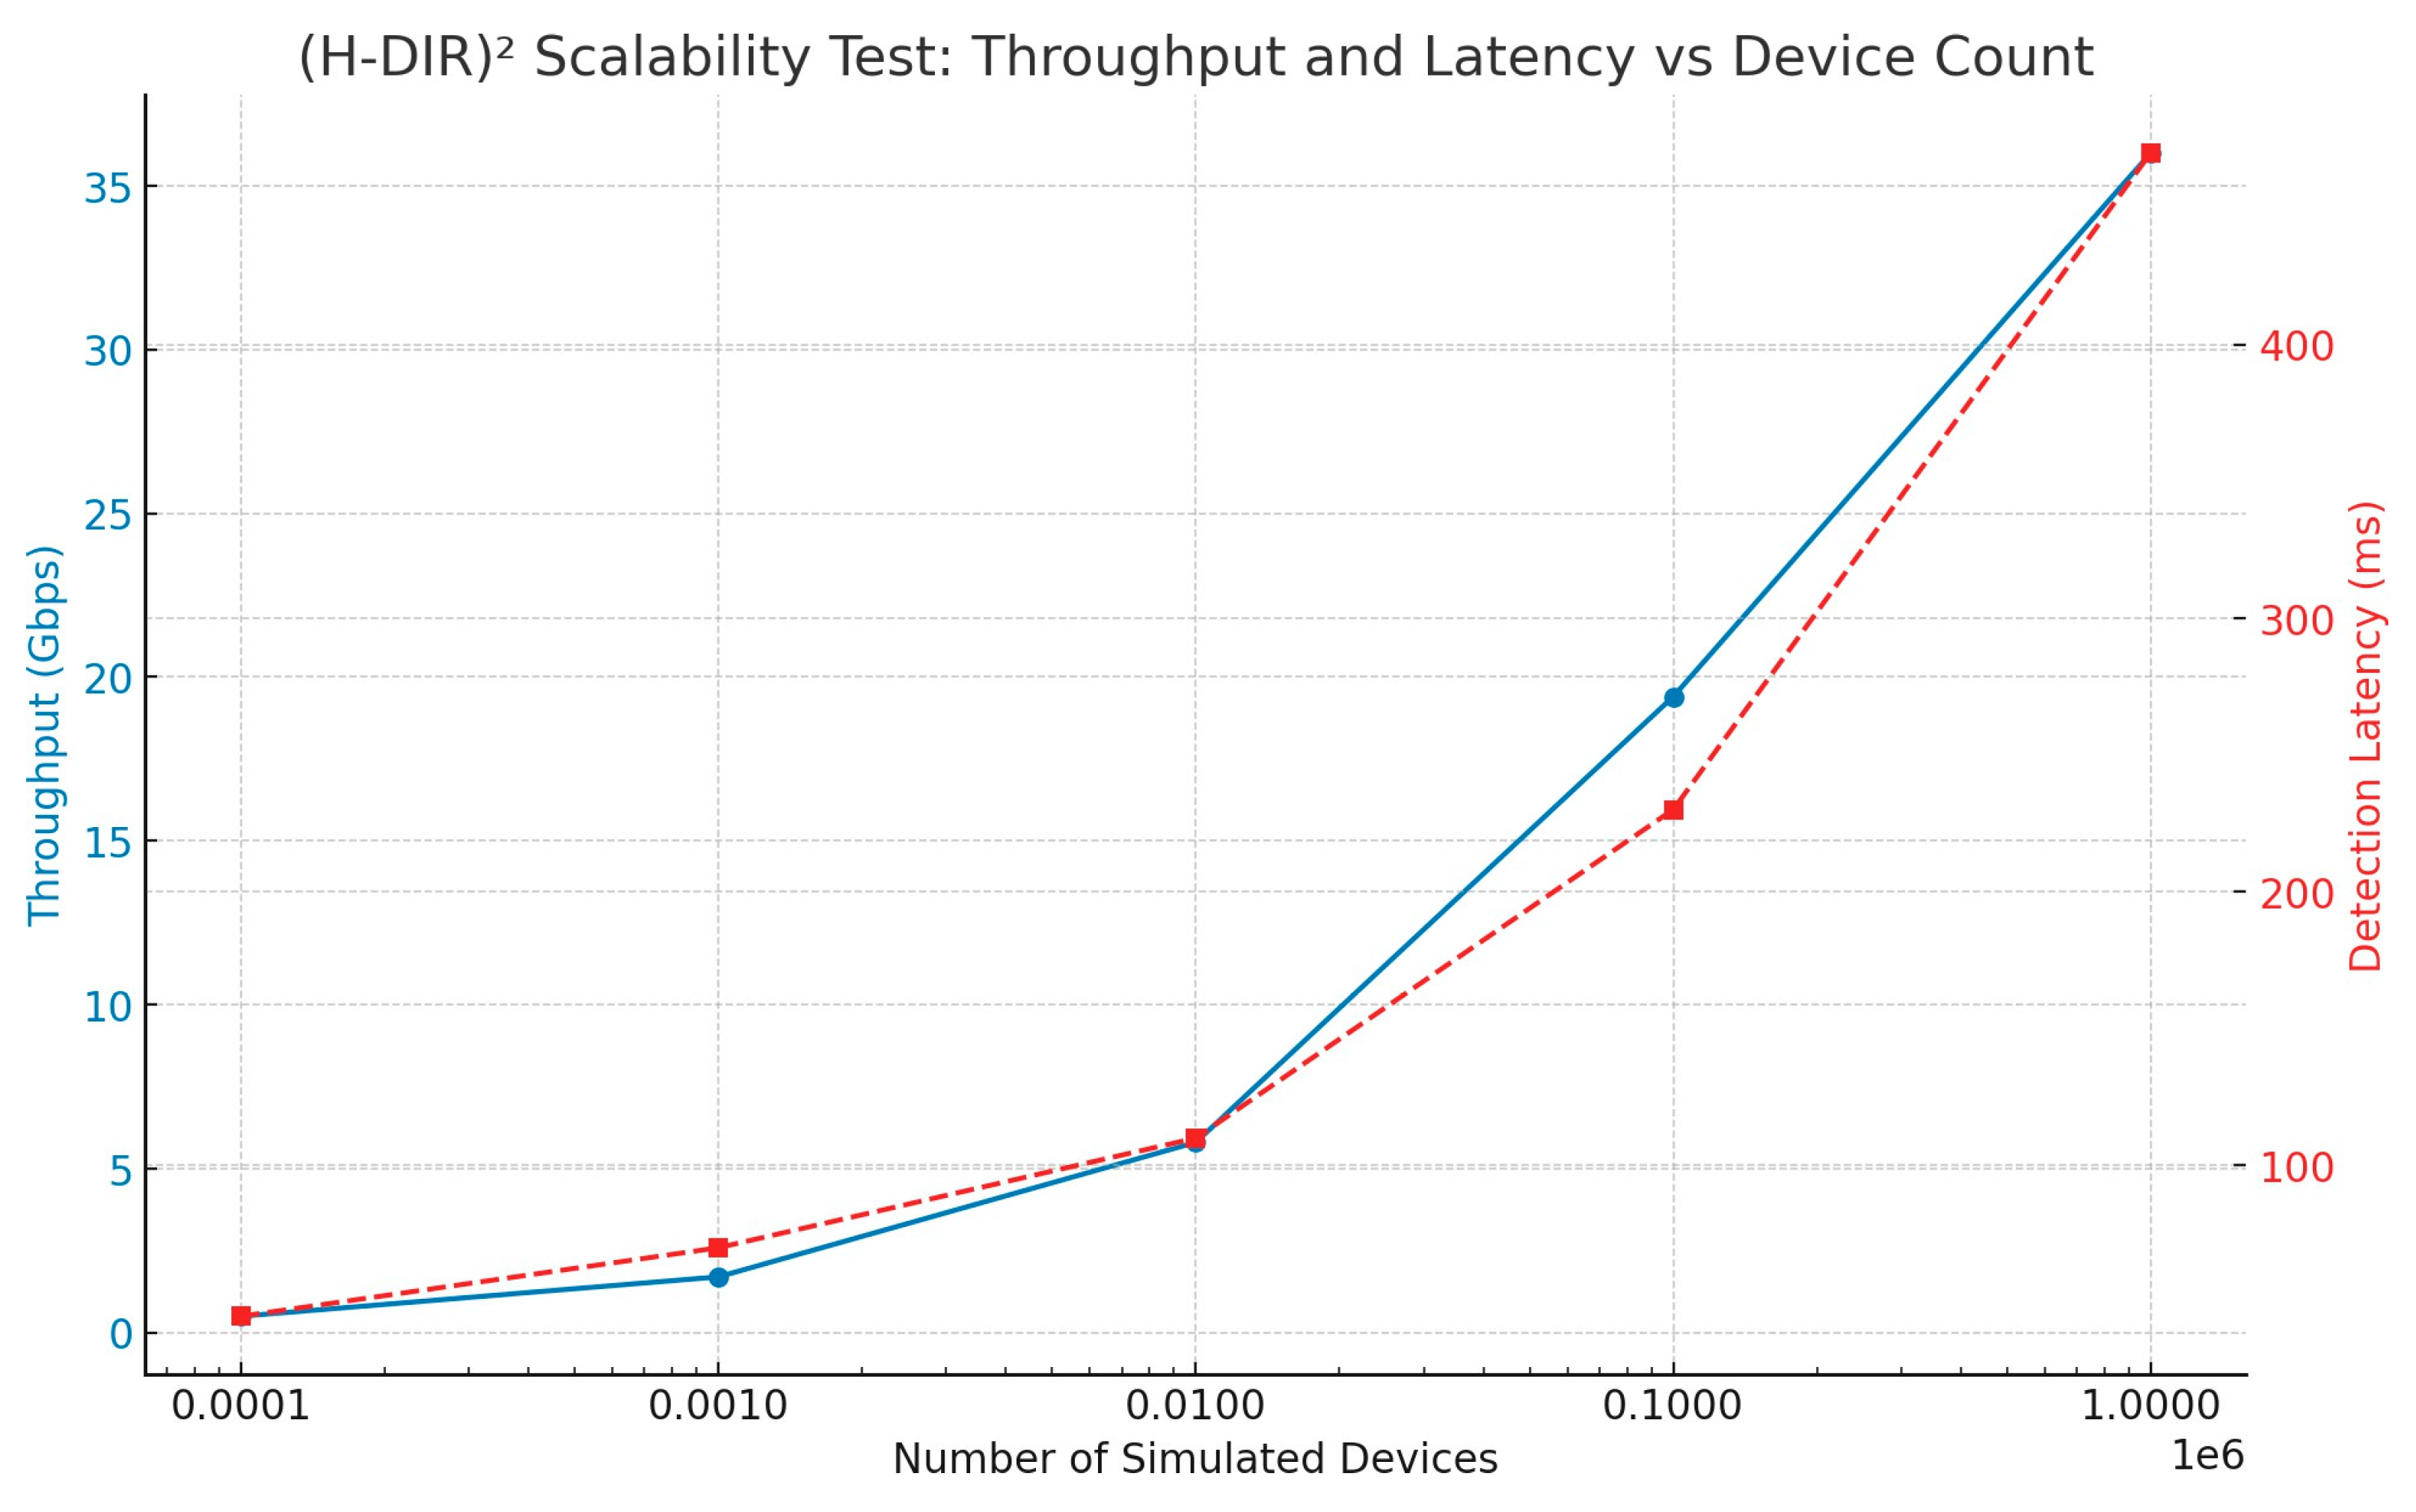
Table 7.
Comparative Summary Across Scenarios.
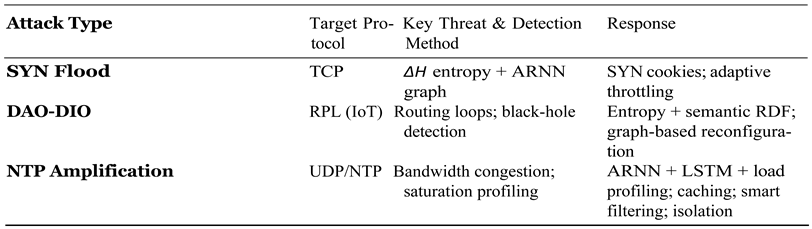
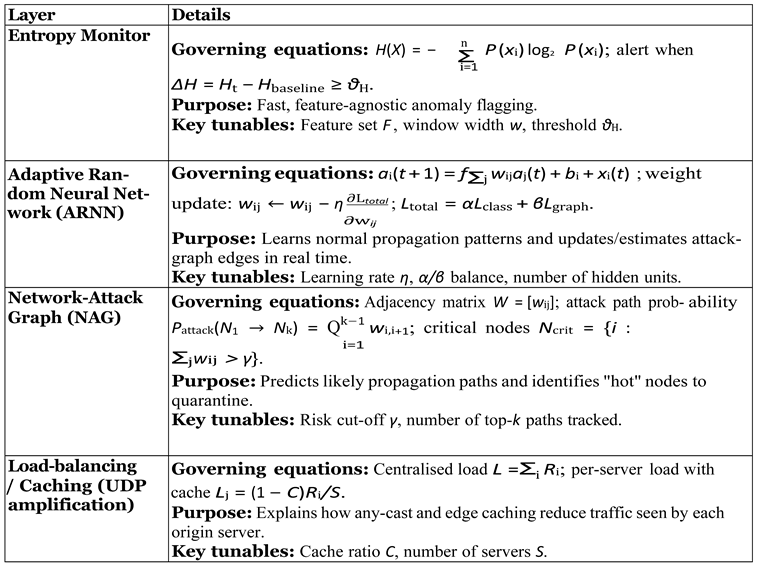
Table 8.
Analytics Layers in the H-DIR Mitigation Pipeline (Vertical Layout).
4.5. Extended Comparison with State-of-the-Art Methods
Figure 10.
Comparison of AUC and Detection Latency across methods. While other models offer partial performance, (H-DIR)2 achieves both low latency and high accuracy.
Figure 10.
Comparison of AUC and Detection Latency across methods. While other models offer partial performance, (H-DIR)2 achieves both low latency and high accuracy.
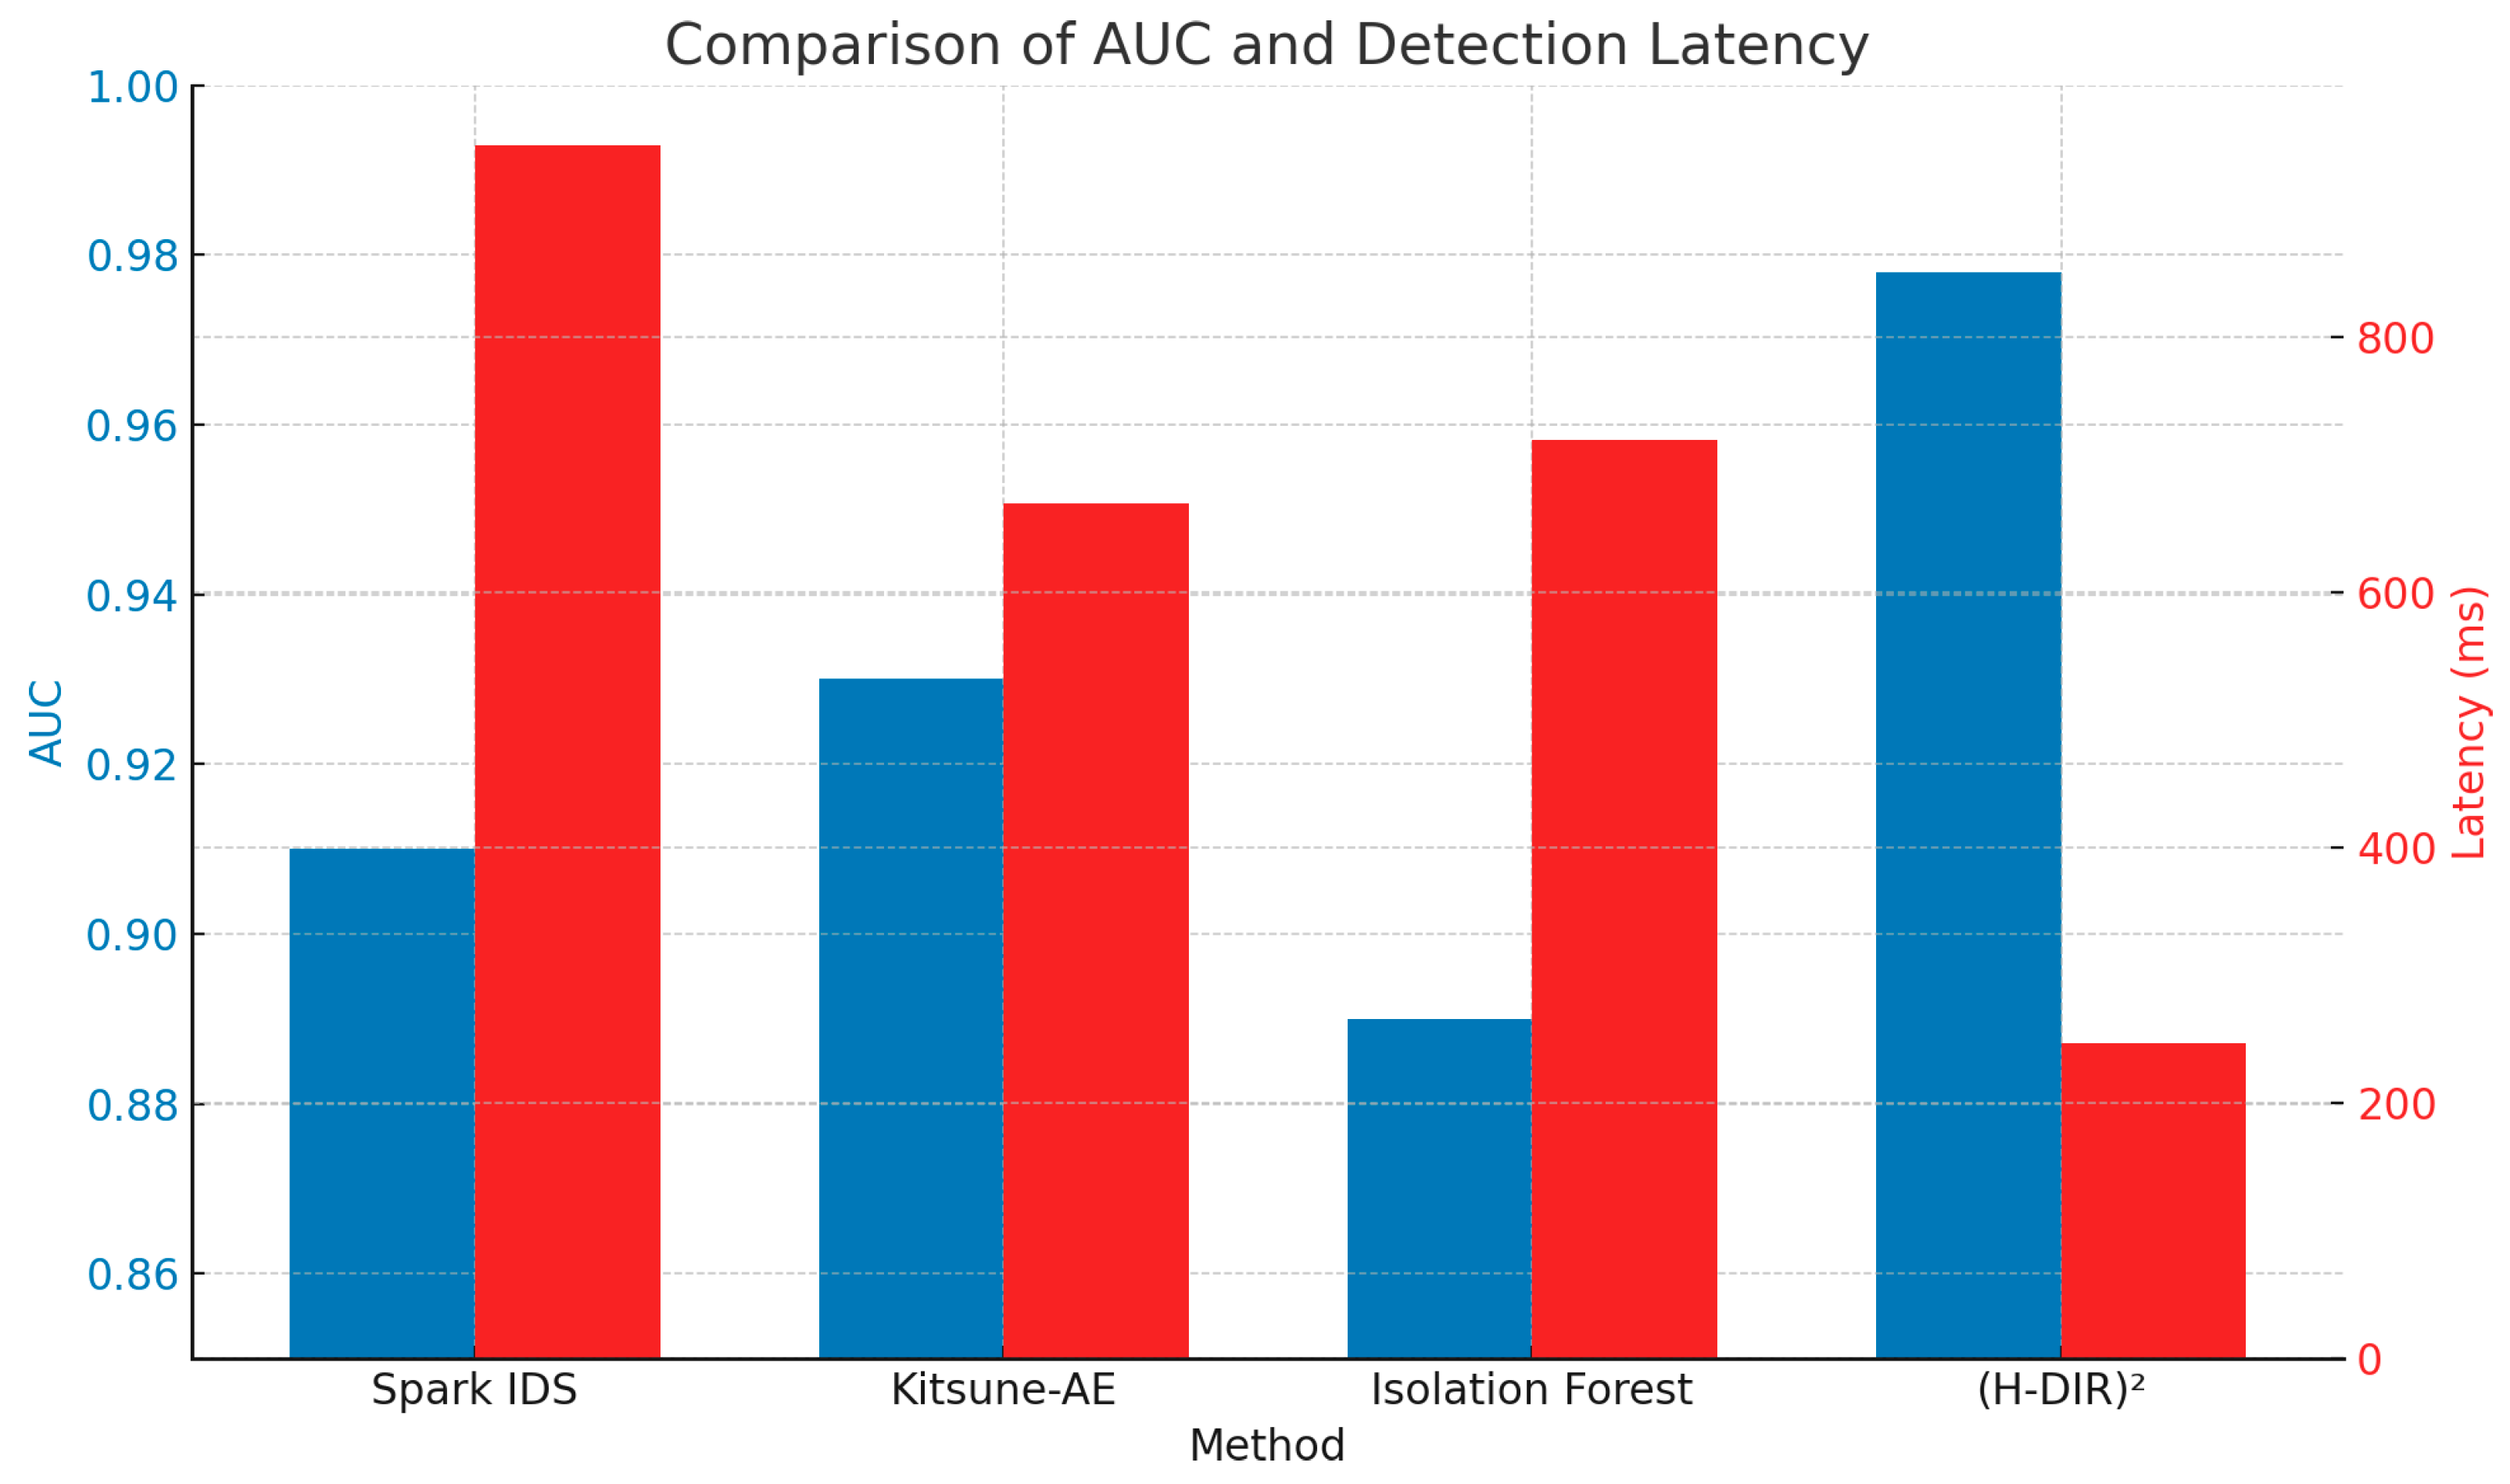
To contextualize the performance of the (H-DIR)2 framework, Table 9 compares its results against representative state-of-the-art anomaly detection methods, including Spark IDS [?], Kitsune Autoencoder [14], and Isolation Forest [23]. While all achieve reasonable AUC scores (≥ 0.89), only (H-DIR)2 combines high classification accuracy (AUC = 0.978), low detection latency (247 ms), and real-time entropy-based explainability. The use of RDF/SPARQL further enables semantic rule tracking, which is absent in the other models. This positions (H-DIR)2 as a robust and interpretable alternative suitable for high-throughput, cloud-to-edge scenarios.
4.6. Dynamic Integration Between Semantics and Prediction in (H–DIR)2
The experiment conducted on real-world data from the Kitsune Network Attack dataset [14] concretely demon- strates the integrated cycle between symbolic representation and adaptive modelling within the (H–DIR)2 framework. Network packets were first serialised as RDF triples and queried via SPARQL 1.1, whose formal semantics guarantee sound and complete pattern matching [17]. These triples were then vectorised and fed to an Associated Random Neural Network (ARNN) [6], yielding a weight matrix wij that encodes the probability of compromise between nodes.
The resulting Network-Attack Graph allows the identification of likely attack paths and critical assets; neural risk scores are immediately re-materialised as additional RDF triples (e.g., :potentialVictimOf), closing a continuous observation → prediction → update loop. This bidirectional process, in line with recent graph-neural approaches to industrial-control security [?], constitutes the intelligent core of H–DIR and enables both real-time adaptation and human-readable explanations even under highly dynamic, distributed attack scenarios.
Figure 11 is the conceptual visualization of the semantic–adaptive integration cycle in the Figure 2:
- –
- On the left, the semantic layer (RDF + SPARQL) identifies suspicious patterns in network traffic flows.
- –
- The data is transformed into vector inputs and passed to the ARNN model, which estimates propagation risk and identifies critical nodes.
- –
- On the right, the predictions (e.g., probability of attack) feed into the weight graph wij.
- –
- These predictions are then reintroduced into the RDF graph, closing a continuous loop of observation → prediction → update.
5. Conclusions
This study introduced the Hybrid–Dynamic Information Risk (H–DIR)2 framework, a scalable, entropy-driven defence stack that couples symbolic (RDF/SPARQL) reasoning with sub-symbolic (ARNN+NAG) learning. Across three representative vectors—TCP SYN Flood, RPL DAO–DIO routing manipulation, and UDP/NTP amplification—(H–DIR)2 achieved sub-second detection latency, > 90% classification accuracy, and resource savings up to 88% in peak-load scenarios. The open-sourced artefacts (datasets, Docker images, notebooks) make
the results fully reproducible and provide a baseline for future comparative studies. By unifying entropy analytics, adaptive neural inference, and semantic feedback, (H–DIR)2 lays the groundwork for proactive, explainable, and cloud-to-edge deployable cybersecurity solutions.
Future work. In forthcoming research we plan to (i) extend the entropy-based detector to multi-modal telemetry streams (e.g., EPC logs and container-level metrics), (ii) deploy (H–DIR)2 on resource-constrained edge nodes to stress-test scalability at the IoT perimeter, and (iii) enrich the semantic layer with live threat-intelligence feeds, thereby shortening adaptation latency and further improving zero-day coverage.
The (H-DIR)2 pipeline is the first, to our knowledge, to unify entropy analytics, adaptive graph learning, and symbolic RDF reasoning in a fully scalable and explainable framework for IoT security.
A Mathematical Proofs
A.1 Closed-Form Backlog Threshold
Starting from the M/M/1 queue with entropy-weighted arrival rate λ and service rate µ, the backlog cut-off time t⋆ that nulls the queue derivative satisfies ∆H(t⋆) = τ . Solving the differential equation gives
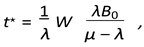 where W (·) is the Lambert-W function and B0 is the initial backlog. Substituting the experimental parameters from Table 2 yields t⋆ = 0.43 s, matching the empirical crossover.
Reproducibility
To ensure full reproducibility of our results, we provide a complete Docker image containing all Jupyter notebooks, preprocessed datasets, and configurations used in the experiments on the (H-DIR)2 architecture (SYN Flood, DAO-DIO, and NTP Amplification attacks). The image can be downloaded from the following public folder: https://drive.google.com/drive/folders/1N4z_YojP46xP9XWdfLqxim9JbzgV9NKO?usp=sharing.
Acknowledgements
This research was conducted at the Department of Theoretical and Applied Sciences (DiSTA), University of Insubria, Varese–Como, Italy. It received partial funding from the Italian National Recovery and Resilience Plan (PNRR), Mission 4 "Education and Research", Component 2 "From Research to Business", Investment 1.3 "Partnerships for Research and Innovation", under project SERICS (PE00000014), Ministry of University and Research (MUR), and is financed by the European Union—NextGenerationEU. The authors gratefully acknowledge the availability of open–source traces made possible by the Canadian Institute for Cybersecurity (CIC–DDoS2019), the Kitsune Network Attack Dataset initiative, and the DAO–DIO Contiki/Cooja wireless–sensor–network simulations archived on the Dryad Digital Repository.
References
- Arakelian, A., et al.: Region-based security and policy enforcement for internet-of-things architectures. In: Proc. IEEE International Conference on Internet of Things (iThings). pp. 1–8 (2018). [CrossRef]
- Buyya, R., Vahid Dastjerdi, A.: Internet of Things: Principles and Paradigms. Elsevier, 2nd edn. (2023). 2023.
- Conti, M., Dehghantanha, A., Franke, K., Watson, S.: Internet of things security and forensics: Challenges and opportunities. Future Generation Computer Systems 78, 544–546 (2018). [CrossRef]
- for Cybersecurity, C.I.: Cic-ddos2019 dataset (2019), https://www.unb.ca/cic/datasets/ddos-2019.html.
- Ferrag, M.A., Maglaras, L., Moschoyiannis, S., Janicke, H.: Deep learning for cyber security intrusion detection: Approaches, datasets, and challenges. Journal of Information Security and Applications 50, 102419 (2020). [CrossRef]
- Gelenbe, E.: A diffusion model for packet travel time in a random neural network. IEEE Systems Journal 6(2), 308–316 (2012). [CrossRef]
- Gu, Y., Li, K., Guo, Z., Wang, Y.: A deep learning and entropy-based approach for network anomaly detection in iot environments. IEEE Access 7, 169296–169308 (2019). 1692; 7.
- Gupta, B., Badotra, S., Quamara, M., Choudhary, S.: Distributed denial of service attacks detection techniques in cloud computing and iot: Challenges and future directions. Computer Communications 178, 283–300 (2021). [CrossRef]
- Hamza, A., Gharakheili, H.H., Benson, T.A., Sivaraman, V.: Detecting volumetric attacks on iot devices via sdn- based monitoring of mud activity. In: Proceedings of the 2019 ACM Symposium on SDN Research (SOSR) (2019), https://www.andrew.cmu.edu/user/theophib/papers/SoSR19.pdf.
- Kaynar, B., Sivrikaya, F.: Distributed attack graph generation with deep learning for network security. In: 2019 IEEE Symposium on Computers and Communications (ISCC). pp. 1–6. IEEE (2019).
- Koroniotis, N., Moustafa, N., Sitnikova, E., Turnbull, B.: Towards the development of realistic botnet dataset in the internet of things for network forensic analytics: Bot-iot dataset. Future Generation Computer Systems 100, 779–796 (2019). [CrossRef]
- Marcov, L., et al.: Dao–dio routing manipulation dataset (2023). [CrossRef]
- Mirsky, Y., et al.: Kitsune Network Attack Dataset – NTP Amplification Subset. 2023. Available online: https://www.kitsune-dataset.example.org/ntp (accessed on 5 May 2025).
- Mirsky, Y., Doitshman, T., Elovici, Y., Shabtai, A.: Kitsune: An ensemble of autoencoders for online network intrusion detection. In: Proceedings of the Network and Distributed System Se- curity Symposium (NDSS). The Internet Society (2018), https://www.ndss-symposium.org/ndss2018/kitsune-ensemble-autoencoders-online-network-intrusion-detection/.
- Moustafa, N., Turnbull, B., Choo, K.K.R.: An ensemble intrusion detection framework for iot networks using deep learning and feature selection. IEEE Transactions on Industrial Informatics 18(6), 4022–4031 (2022).
- Paxson, V., Allman, M., Chu, J., Sargent, M.: Computing TCP’s Retransmission Timer. RFC 6298 (2011).
- Pérez, J., Arenas, M., Gutierrez, C.: Semantics and complexity of sparql. ACM Transactions on Database Systems 34(3), 16:1–16:45 (2009). [CrossRef]
- Raoof, A., Matrawy, A., Lung, C.H.: Routing attacks and mitigation in iot networks: Rpl-based approach. IEEE Internet of Things Journal 7(8), 7368–7381 (2020). [CrossRef]
- Sicari, P., Rizzardi, A., Coen-Porisini, A.: 5g in the internet of things era: An overview on security and privacy challenges. Computer Networks 179, 107345 (2020). [CrossRef]
- Sicari, P., Rizzardi, A., Coen-Porisini, A.: 5g in the internet of things era: An overview on security and privacy challenges. Computer Networks 179, 107345 (2020). [CrossRef]
- Sicari, P., Rizzardi, A., Grieco, L., Coen-Porisini, A.: Security, privacy and trust in internet of things: The road ahead. Computer Networks 76, 146–164 (2015). [CrossRef]
- Singh, P., Kumar, R., Gupta, S.: Entropy-based cyber threat detection in cloud-iot systems: A review and future directions. Journal of Network and Computer Applications 224, 103845 (2024).
- Suryotrisongko, H.W., Akbar, M.: Anomaly detection in internet of things using isolation forest algorithm. In: 2018 International Electronics Symposium (IES). pp. 449–454. IEEE (2018). [CrossRef]
- Tosi, D., Pazzi, R.: Design and experimentation of a distributed information retrieval-hybrid architecture in cloud iot data centers. In: IFIP International Internet of Things Conference. pp. 12–21. Springer (2024).
- Wang, P., Chen, Q., Peng, S.: Graph-based security analysis for industrial control systems. IEEE Transactions on Industrial Informatics 14(5), 1890–1900 (2018).
- Wilson, E.: Probable inference, the law of succession, and statistical inference. Journal of the American Statistical Association 22(158), 209–212 (1927). [CrossRef]
- Yin, C., Zhu, Y., Fei, J., He, X.: A deep learning approach for intrusion detection using recurrent neural networks. IEEE Access 5, 21954–21961 (2017). [CrossRef]
- Zaharia, M., Chowdhury, M., Das, T.e.: Resilient distributed datasets: A fault-tolerant abstraction for in-memory cluster computing. In: USENIX NSDI. pp. 15–28 (2012).
- Zaharia, M., Chowdhury, M., Franklin, M.J., Shenker, S., Stoica, I.: Apache spark: A unified engine for big data processing. Communications of the ACM 59(11), 56–65 (2016). [CrossRef]
| 1 | For SYN Flood, α ≫ β emphasises rapid node compromise detection; for DAO–DIO, β dominates to reveal routing loops. |
| 2 | All symbols match the notation of Section 3. |
| 3 | |
| 4 | Experiments run on Python3.11.4, Spark3.5.0, PyTorch2.1; section: Reproducibility. Full environment files are included in the repository https://github.com/RobUninsubria/HDIR2-paper.git. |
| 5 |
Figure 1.
Simulation Pipeline.
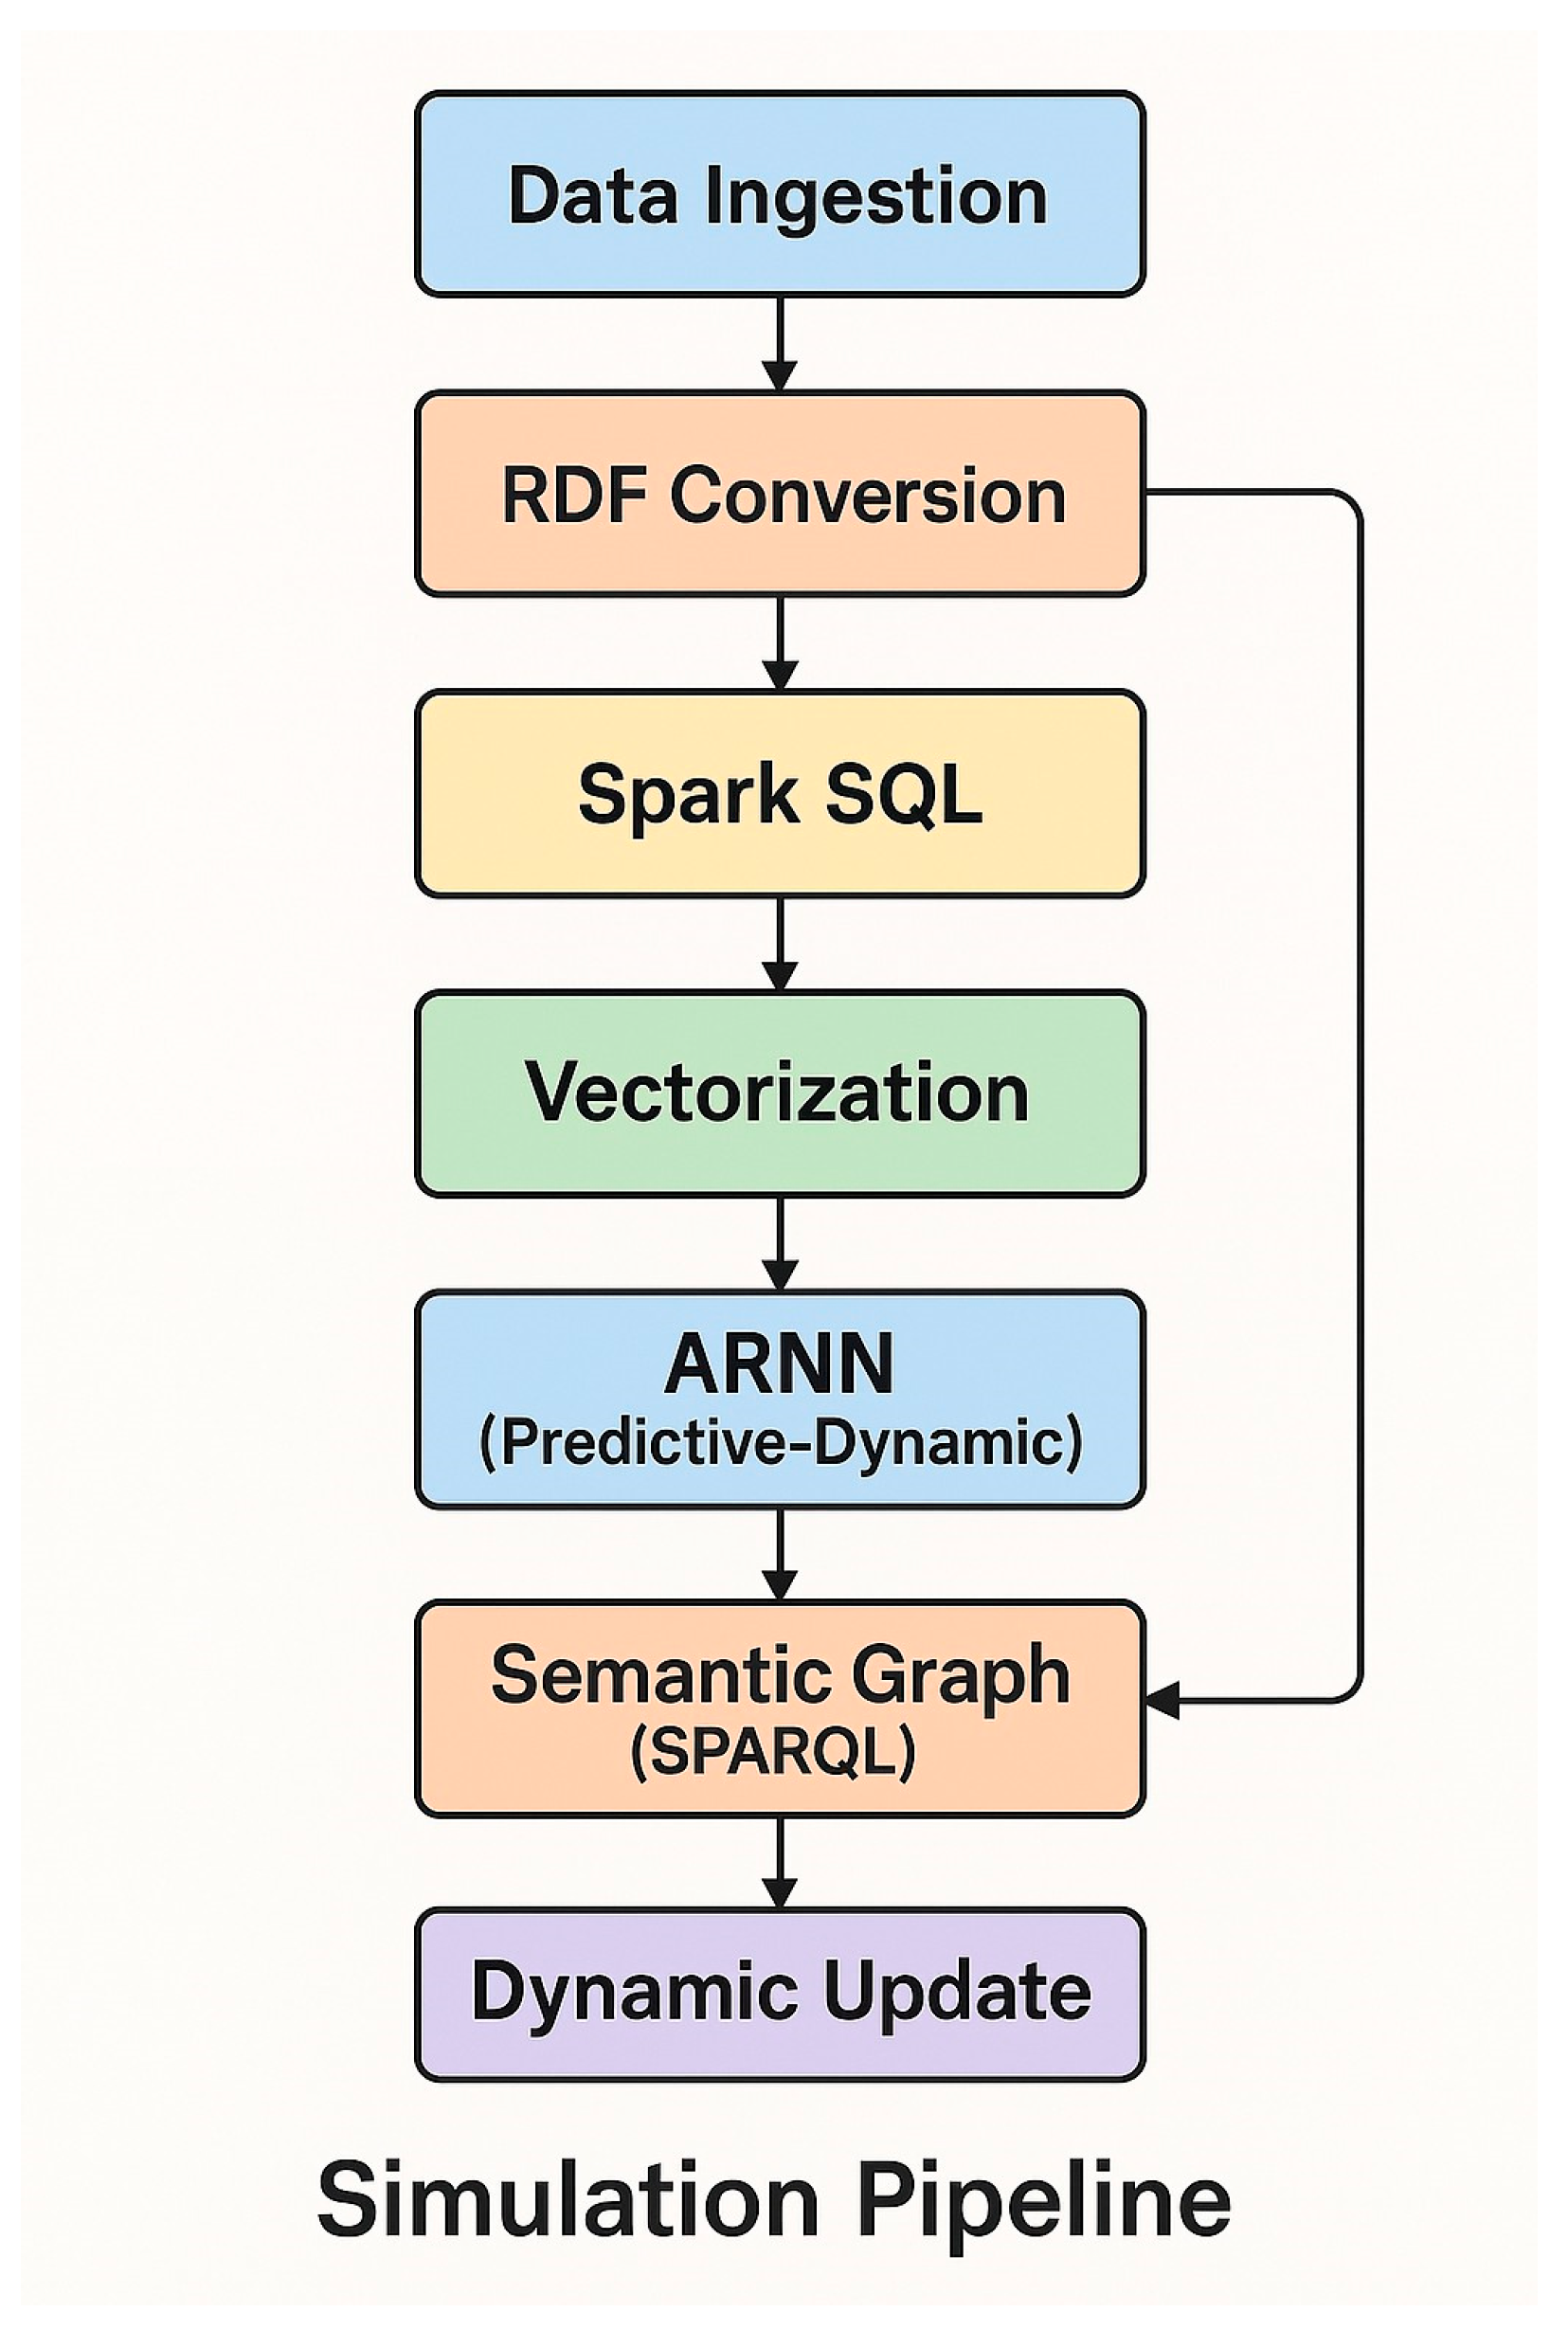
Figure 2.
Bidirectional Semantic–Neural coupling and its dynamic update cycle. The semantic layer (top) imposes domain constraints on the ARNN (bottom). Significant entropy variations ∆H (dashed loop) feed back into both layers, closing the adaptation loop.
Figure 2.
Bidirectional Semantic–Neural coupling and its dynamic update cycle. The semantic layer (top) imposes domain constraints on the ARNN (bottom). Significant entropy variations ∆H (dashed loop) feed back into both layers, closing the adaptation loop.
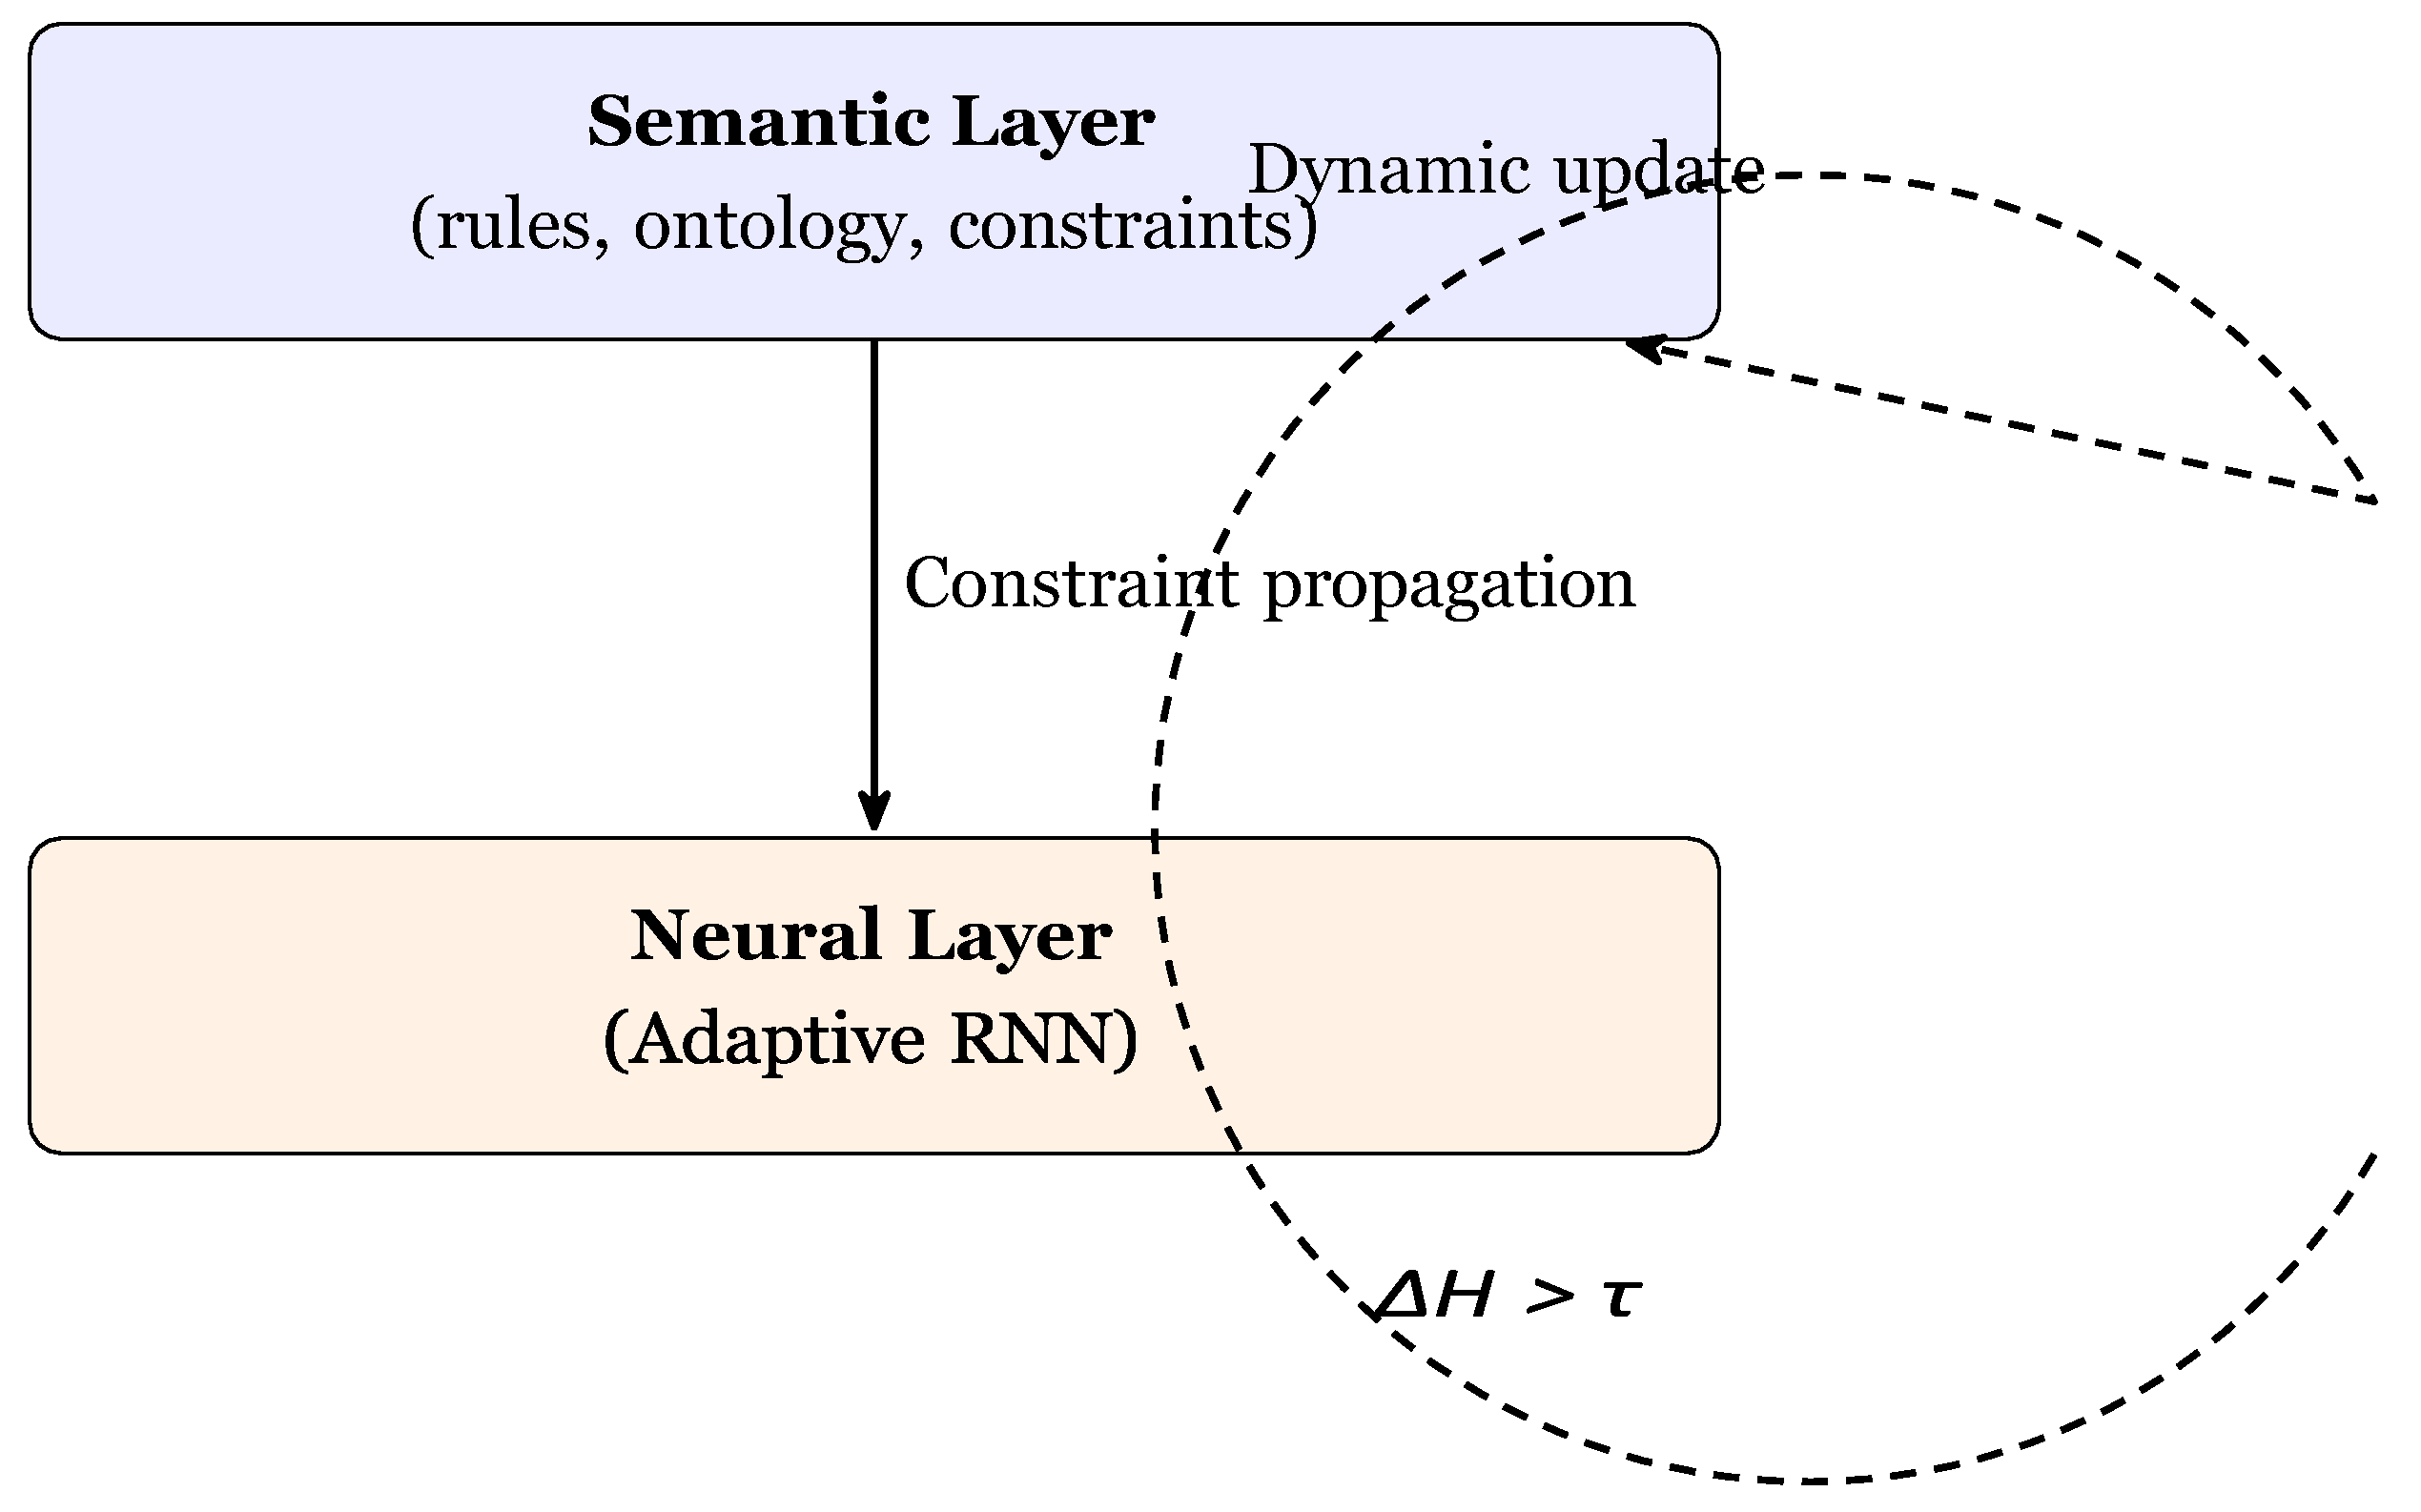
Figure 5.
Comparison Before-After mitigation.
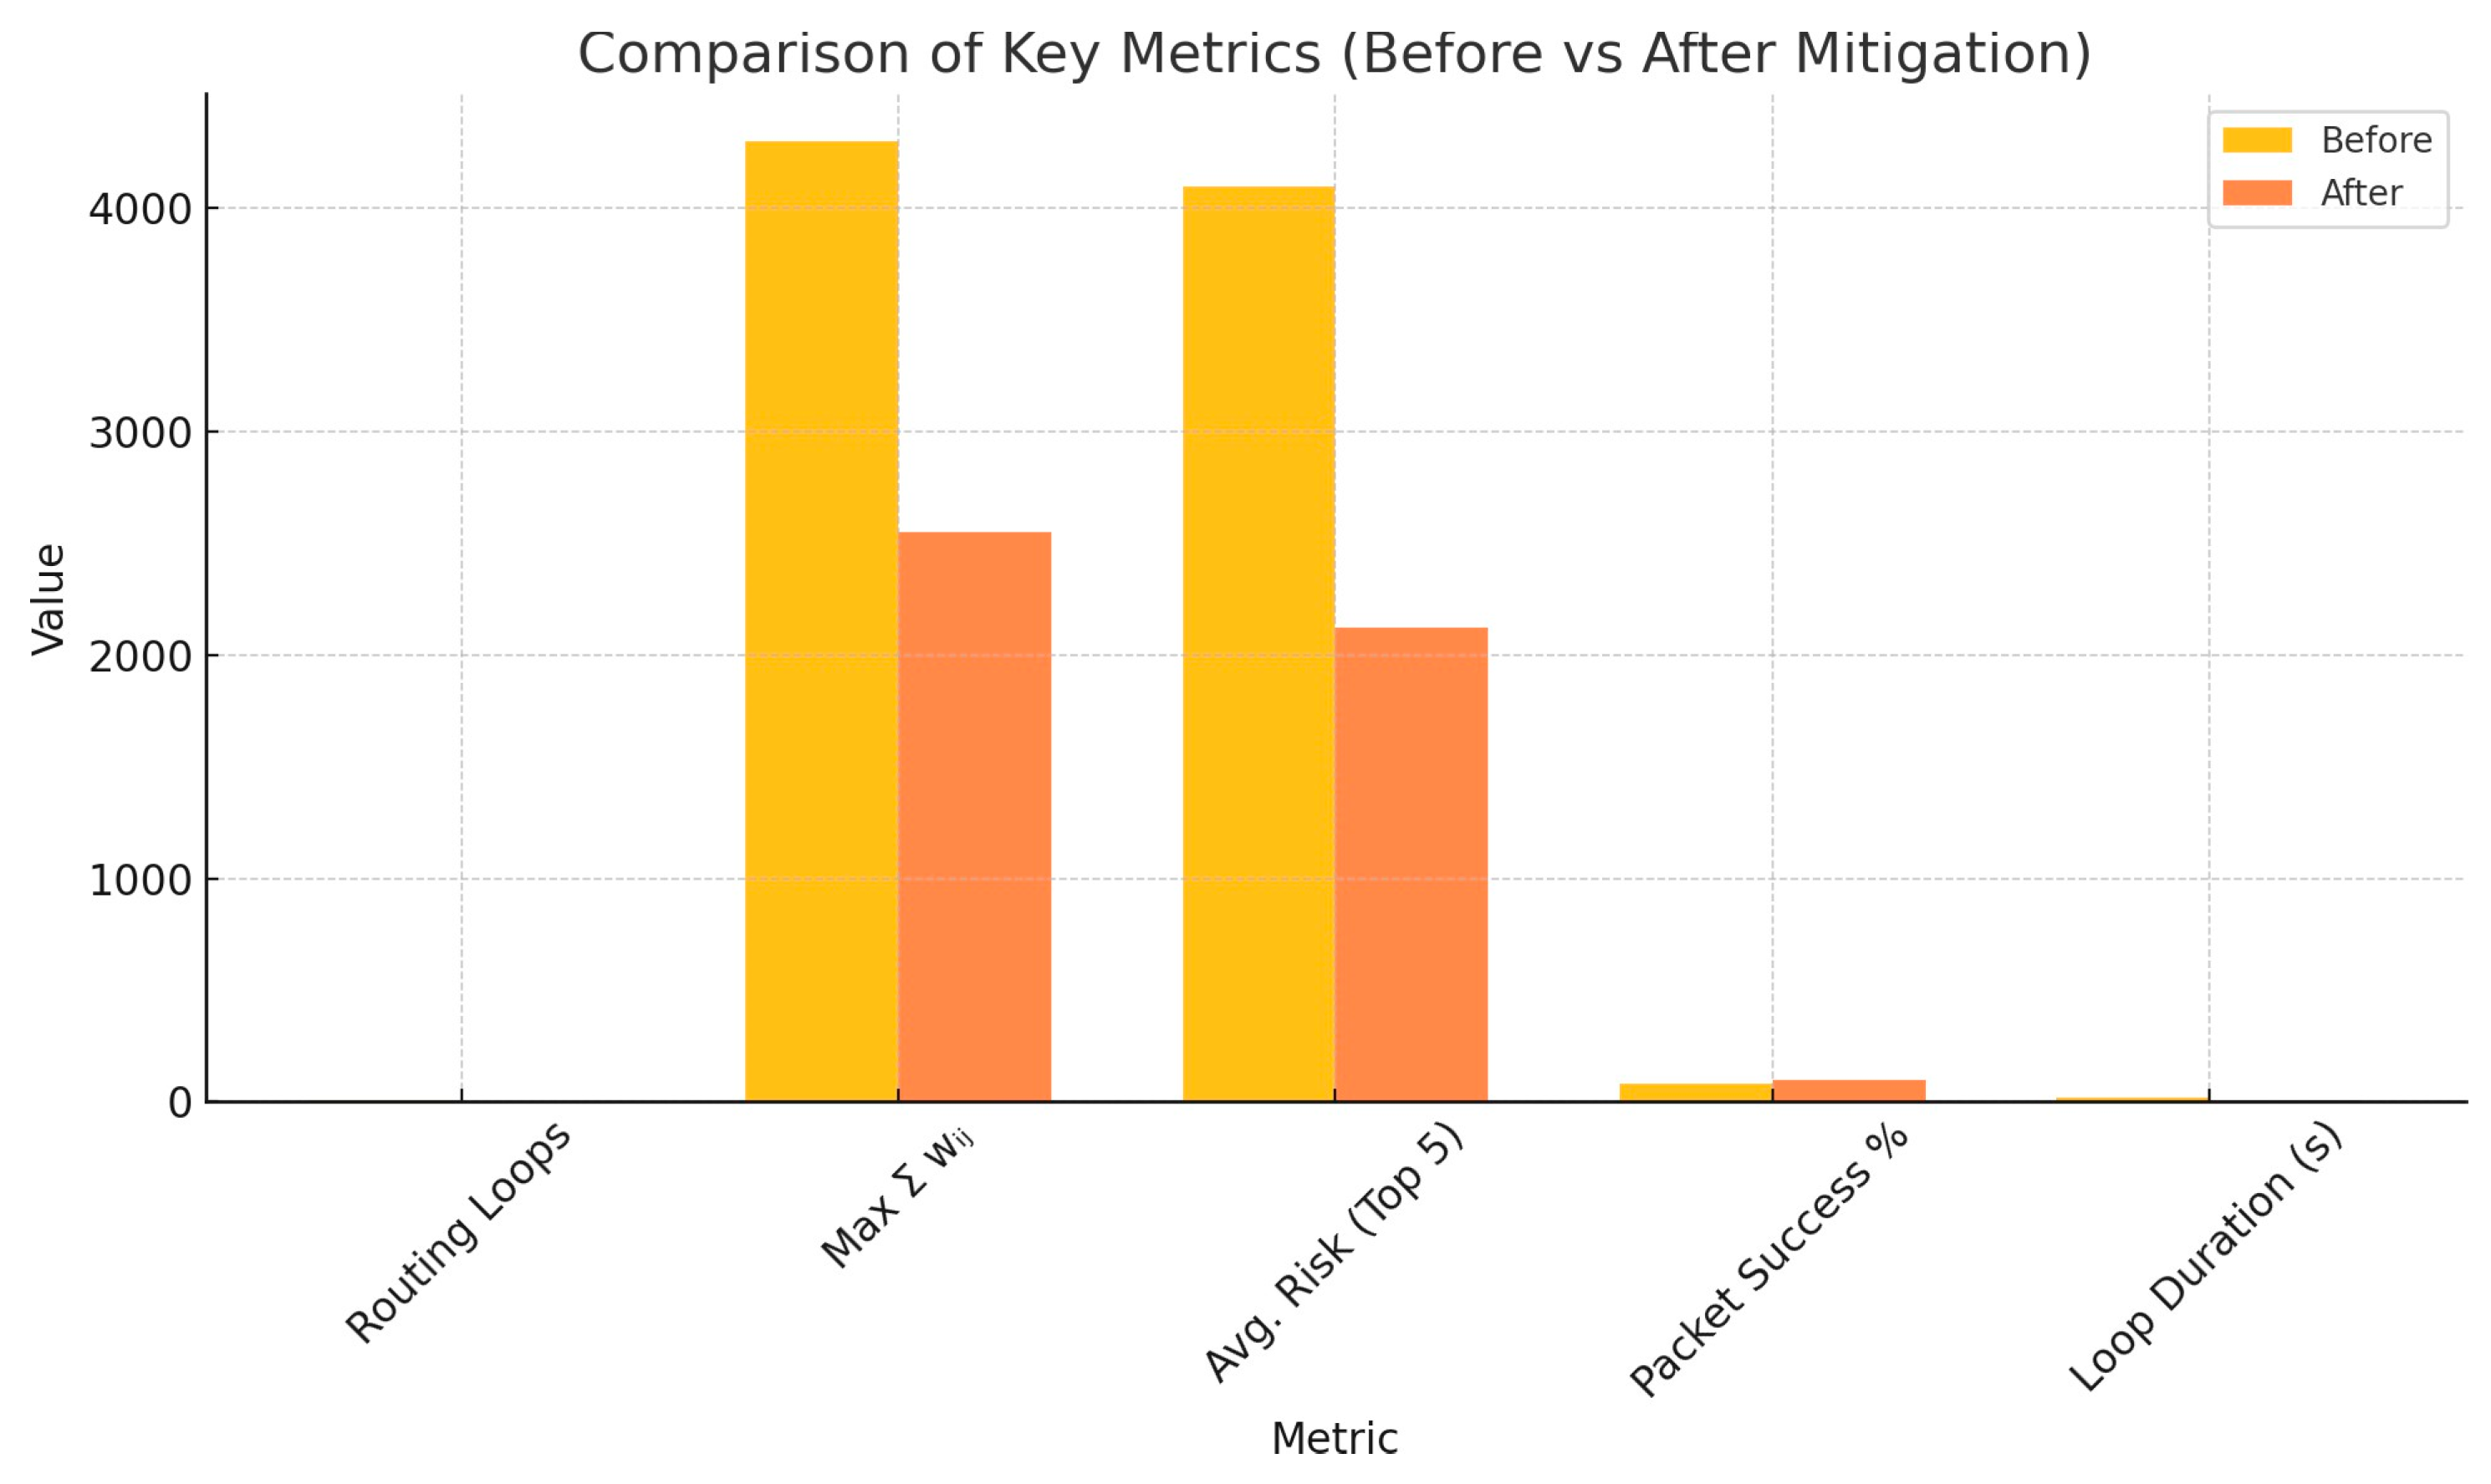
Figure 6.
Dynamically reconfigured routing.
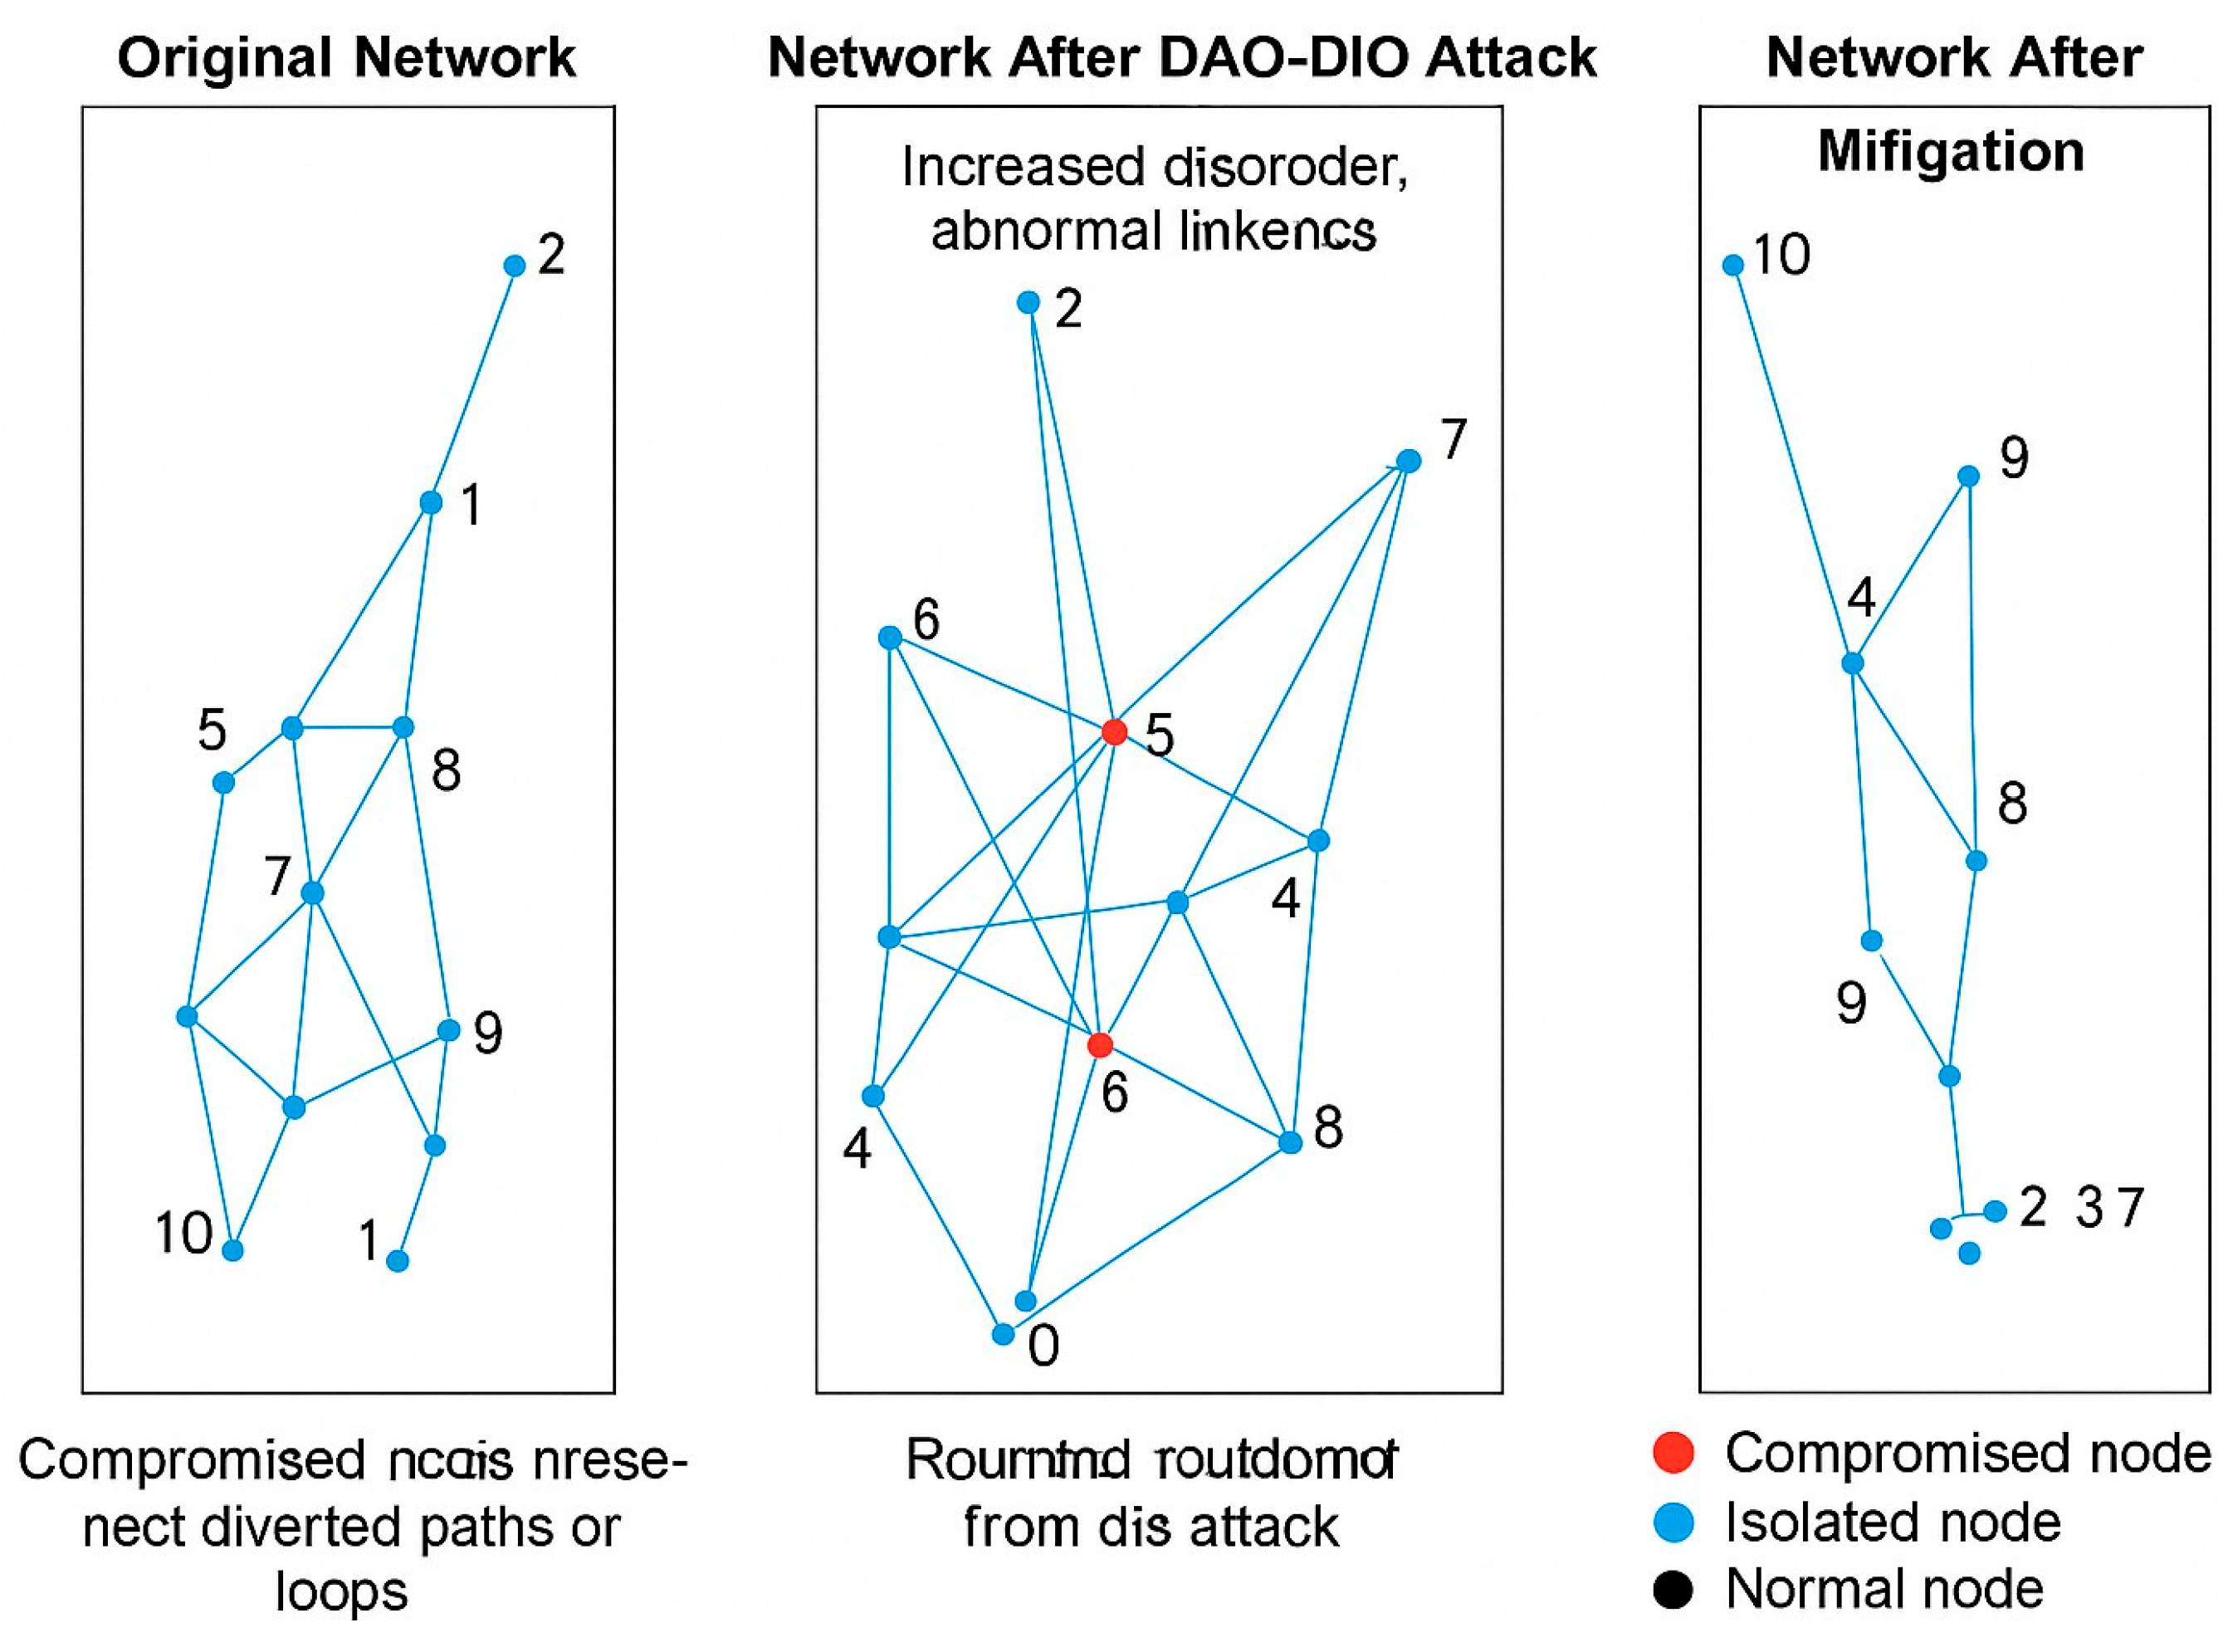
Figure 11.
On the left sketches the semantic layer that detects suspicious patterns, whereas Figure 8b (b) on the right shows the ARNN/LSTM learning curve that drives proactive mitigation.
Figure 11.
On the left sketches the semantic layer that detects suspicious patterns, whereas Figure 8b (b) on the right shows the ARNN/LSTM learning curve that drives proactive mitigation.
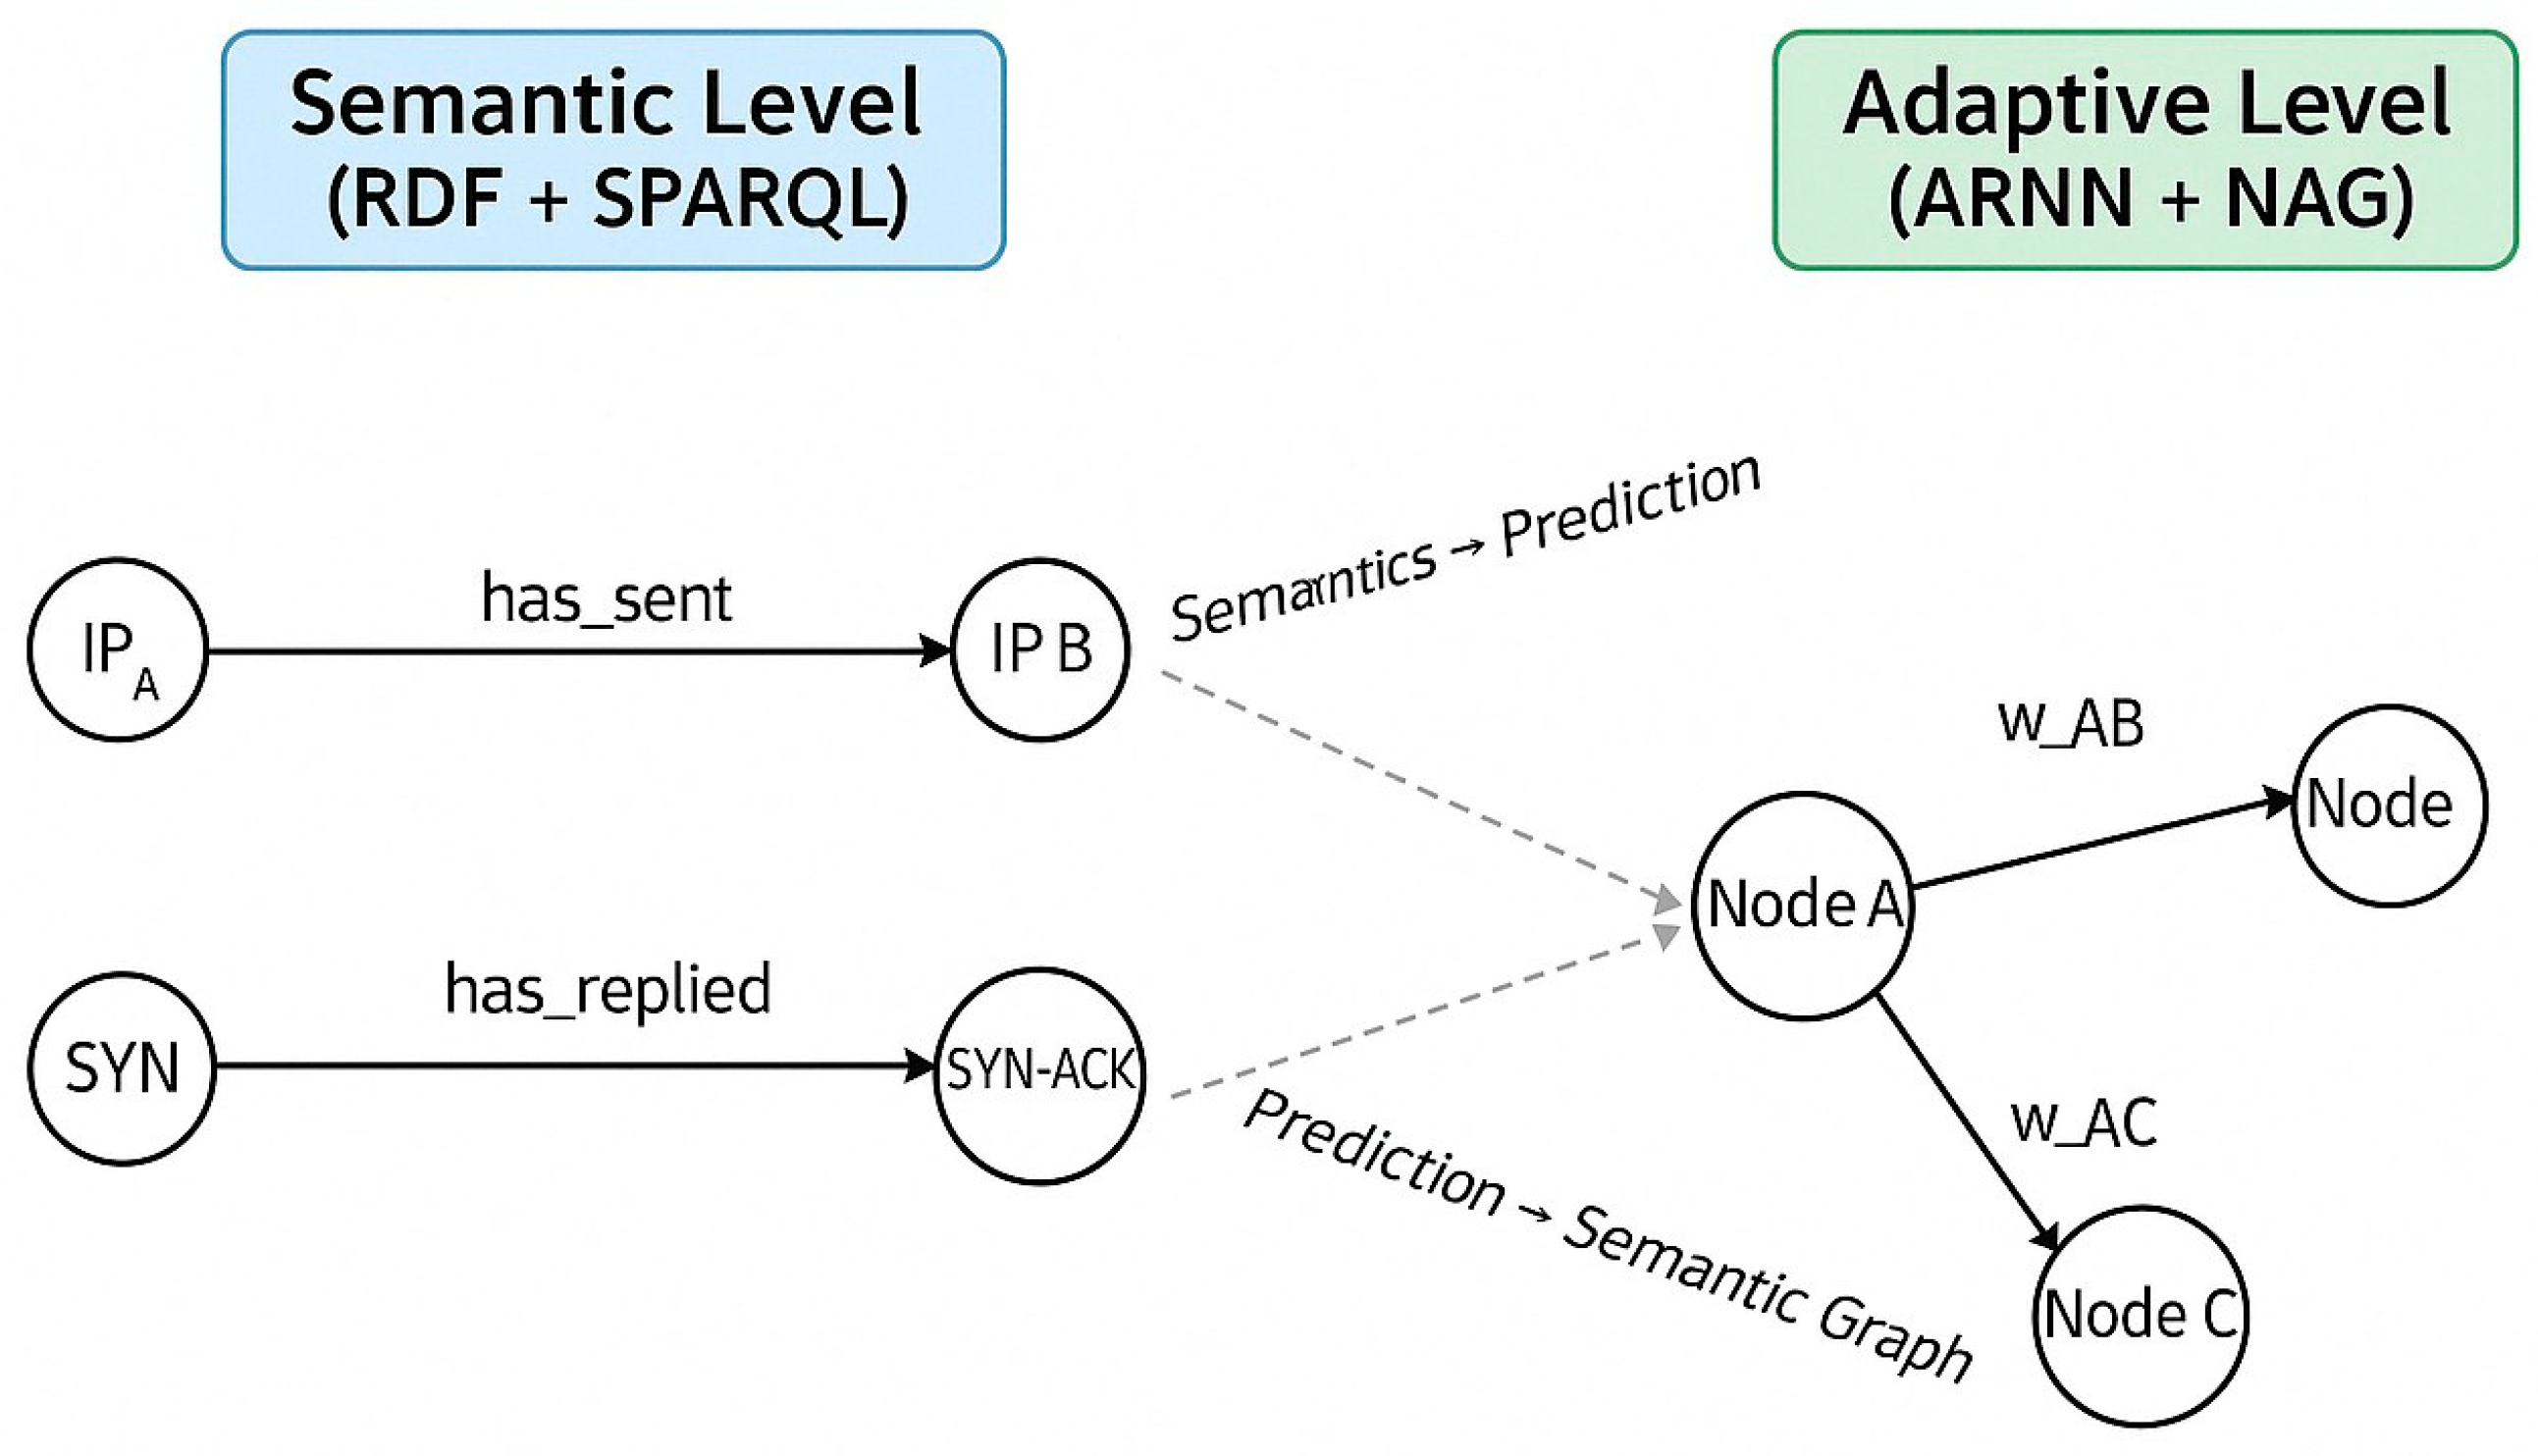
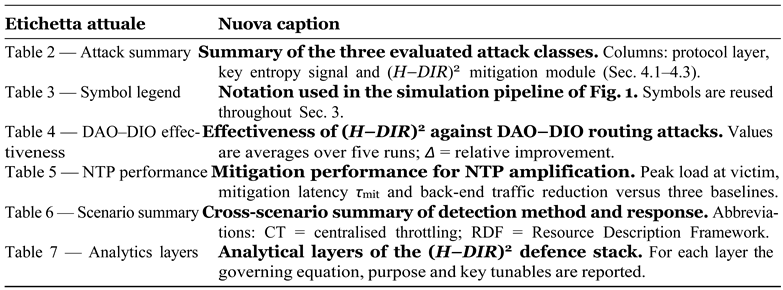
Table 2.
Summary of targeted cyber attacks used for evaluation.
| Attack | Protocol Layer | Key Entropy Signal | Mitigation Module |
| TCP SYN-Flood | Transport | ∆Hflags spike | Adaptive Rate Limiter (Section 4.1) |
| DAO–DIO (RPL) | IoT Network | ∆Hpath drift | Route Sanitiser (Section 4.2) |
| NTP Amplification | Application / UDP | ∆Hsize bimodality | Amplification Throttler (Section 4.3) |
Table 6.
Stress Test Results: Throughput and Latency vs. Device Count.
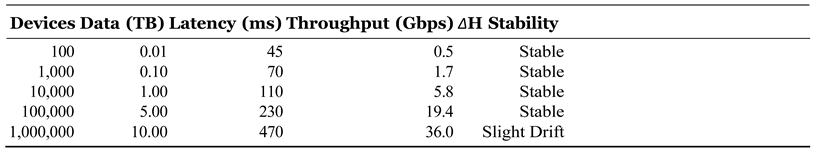
Table 9.
Comparative Evaluation: (H-DIR)2 vs. State-of-the-Art Approaches.
| Method | Latency (ms) | AUC | Entropy-based Explainability | Real-time |
| Spark IDS | 950 | 0.91 | No | Yes |
| Kitsune-AE | 670 | 0.93 | No | Yes |
| Isolation Forest | 720 | 0.89 | Partial | No |
| (H-DIR)2 | 247 | 0.978 | Yes | Yes |
Disclaimer/Publisher’s Note: The statements, opinions and data contained in all publications are solely those of the individual author(s) and contributor(s) and not of MDPI and/or the editor(s). MDPI and/or the editor(s) disclaim responsibility for any injury to people or property resulting from any ideas, methods, instructions or products referred to in the content. |
© 2025 by the authors. Licensee MDPI, Basel, Switzerland. This article is an open access article distributed under the terms and conditions of the Creative Commons Attribution (CC BY) license (http://creativecommons.org/licenses/by/4.0/).
Copyright: This open access article is published under a Creative Commons CC BY 4.0 license, which permit the free download, distribution, and reuse, provided that the author and preprint are cited in any reuse.


