
Submitted:
06 June 2025
Posted:
10 June 2025
You are already at the latest version
Abstract
Sustainable Development Goals (SDGs) were set in 2015 by the UN General Assembly to achieve global economic, social, ecological development until 2030. The Balkan Region in the South-eastern Europe have also accepted these goals. Ten countries in the region have similar geographic, environmental and economic features. This paper aims to compare the progress of Balkan countries in achieving the SDGs by employing a novel Multi Criteria Decision Making (MCDM) model named as “eLeR””. This hybrid model is an integration of six MCDM methods to evaluate better the SDGs progress of Balkan countries than a traditional method. Criterion weights are determined by LOPCOW, LMAW and LBWA and the ranking is made by RAFSI, RAPS and RAWEC methods. As the outcome of the novel LR model, the SDG 1 is the most significant criterion out of 17 goals while Croatia is the best performer among ten Balkan countries in achieving the SDGs.
Keywords:
sustainable development goals (SDGs)
; Balkan region
; SDGs performance
; multi-criteria decision making (MCDM)
; eLeR model
1. Introduction
Sustainability is a dynamic process that aims to sustain the long-term well-being of human societies and natural ecosystems in a fair and balanced way [1]. "Development that fulfills the demands of the present without compromising the potential of future generations to meet their own needs" is a commonly used definition of sustainable development [2]. The idea of sustainability first appeared in the later half of the 20th century and has since become widely accepted worldwide. It emphasizes how crucial it is to satisfy present needs while guaranteeing that future generations have access necessary resources [3]. At its core, sustainability seeks to ensure that future generations can live in a livable and prosperous world while simultaneously guaranteeing fair opportunities in sectors like poverty alleviation and education. Accordingly, addressing global issues such as hunger, poverty, environmental degradation, climate change, and human rights abuses is a top priority for the sustainability agenda [4].
Scholars have interpreted sustainable development in a variety of ways [5,6,7,8]. Alaimo (2018) provides a clear overview of these contrasting viewpoints, characterizing sustainable development as an all-encompassing framework that integrates the economy, society, and environment [9]. A unifying element emerges despite subtle variations in definitions: balancing environmental stewardship with social and economic growth. In order to guarantee the planet's long-term well-being, Sachs (2015) presents sustainable development as a roadmap as well as a prism through which to view global interdependencies. It aims to strike a balance between social inclusion, economic growth, and ecological preservation as a comprehensive approach to human flourishing. As economic expansion quickens, environmental deterioration worsens, and technological advancements alter labor markets, this need grows increasingly pressing. Younger generations may not be able to obtain steady work and income if they do not receive the appropriate education and skill development. As a result, it is anticipated that in the near future, sustainable development will have a greater impact on economic strategies, policy, and frameworks for making moral decisions. The international community recognized its importance and made it a guiding element of the post-2015 development agenda. The Sustainable Development Goals (SDGs) were created to offer a precise framework for dealing with the most important problems facing the globe. The SDGs focus on pressing global issues like renewable energy, food and water security, climate change, and job creation, much like the Millennium Development Goals (MDGs) of 2000, which achieved notable strides in eradicating poverty and illness [10,11,12].
Since 1972, the idea of sustainable development has been a crucial topic on the international agenda for more than 50 years. Two significant events occurred in that year: the first United Nations Conference on the Human Environment, which took place in Stockholm, and the publication of Limits to Growth, which succinctly highlighted the challenges of balancing environmental preservation with economic advancement-problems that have become increasingly urgent in the twenty-first century.
Twenty years later, the world came together again for the Rio Earth Summit, also known as the UN Conference on Environment and Development. Two historic international environmental agreements were adopted as a result of this summit: the Convention on Biological Diversity and the United Nations Framework Convention on Climate Change. The UN Convention to Combat Desertification, which was formally ratified two years later, was the third accord for which the foundation was established [12].
The United Nations Conference on Sustainable Development, also known as the Rio+20 Summit, brought the world community together once more in June 2012. A high-level international panel on sustainability was formed by UN Secretary-General Ban Ki-Moon before the event, and it released a report titled The Future We Want. The Sustainable Development Goals (SDGs) were proposed as a new set of global objectives in the report (Sachs, 2012). The SDGs, sometimes referred to as the "Global Goals" or "the 2030 Agenda" place a strong emphasis on an all-encompassing and inclusive approach to sustainable development that applies to all countries, regardless of their level of development. The SDGs, which seek to end poverty, combat inequality, and safeguard the environment, were formally endorsed by the UN General Assembly in 2015 as a universal framework to be accomplished by 2030 [13].
The 2030 Agenda adds a number of significant differences while still building on the framework established by the MDGs. First, the SDGs completely integrate the environmental and social aspects of sustainability, going beyond economic development. Second, a large range of stakeholders from around the world contributed to their design through a lengthy, transparent, and participatory process [14].
The 17 interrelated Sustainable Development Goals (SDGs) are intended to direct development initiatives in nations with differing degrees of development [15]. The Figure below (Figure 1) provides an illustration of these goals [16].
These 17 goals, together with their 169 associated targets, form a comprehensive framework for tackling global economic, social, and environmental issues. In this study, in the context of multi-criteria decision-making (MCDM) mmodel, each SDG is treated as a performance criterion. The study also seeks to evaluate the relative weight or importance level of each goal in driving sustainable development.
The comparative analysis focuses on ten countries located in Southeastern Europe, commonly referred to as the Balkan region. These countries share many geographical, historical, cultural and economic characteristics [17,18] making them an ideal case for assessing SDG performance. Many of them were previously aligned with the Soviet bloc and have since transitioned from centrally planned economies to market-oriented systems. A solid foundation for comparison is provided by these common transitory events. Additionally, new avenues for growth and access to international markets have been made possible by their memberships in the European Union. The half of them are also EU members.
All SDGs are assumed to be equally important when determining the Report Scores. It is recognized, therefore, that in practice, certain objectives can be more significant than others, and that even little differences in significance can have an impact on the final assessment.
The goal of the paper is to investigate whether it is true to think that all the SDGs have the equal weight in achieving the sustainable development as made by the UN resolution and the Development Report 2024. Another motivation for the research is to know about which country in the region is the best performer in achieving the SDGs. For this, the strength of the new hybrid MCDM model to be applied will be tested.
The structure of the study is organized into several sections: an introduction, a review of relevant literature, a methodology section describing the employed MCDM model and the application of the model, sensitivity analysis, discussion and a conclusion.
2. Literature Review
There are some SDGs studies using certain MCDM methods in literature. For example, Antanasijevic et al. (2017) conducted a sustainability performance assessment of 30 European nations from 2004 to 2014, using the PROMETHEE method to evaluate the outcomes of the EU Sustainable Development Strategies. A total of 38 indicators-both headline and operational-were analyzed. The study revealed that most European countries showed improvements in sustainability performance, with the Czech Republic, Germany, Hungary, and Sweden demonstrating particularly notable progress [19].
Łuczak and Malgorzata (2021) applied the TOPSIS method to evaluate sustainable development in Polish municipalities in 2018. Their analysis assessed economic, social, and environmental sustainability, identifying eight distinct municipality types. Urban-proximate municipalities showed higher economic and social development, while rural and remote areas excelled in environmental sustainability, despite underperforming in the other dimensions [20].
Sousa et al. (2021) examined 143 scholarly articles about the SDGs that were published between 2016- 2020. They were taken from the Scopus database. Multi-Criteria Decision-Making (MCDM) methods were used in majority of these papers, with the hybrid AHP-TOPSIS approach being the most widely used. Interestingly, a sizable percentage of the research also combined the ANP and the DEMATEL methods. With 56 research, the "Society" category has the highest number of MCDM thematic applications under this framework, with 24 of those studies concentrating on SDG 7: "Affordable and Clean Energy." "Biosphere" (36 studies) and "Economy" (33 studies) were the next most represented categories, with 18 studies falling under "The 2030 Agenda" and "Multiple SDGs" [15].
D'Adamo and Gastaldi (2022) assessed 28 targets across 16 SDGs using data from 2019 and 2020 to evaluate regional performance within Italy. Although the study employed a Multi-Criteria Decision Analysis (MCDA) method with equal weighting for all goals, the specific method was not disclosed. Italy was divided into three macro-regions for the analysis: North (e.g., Trentino Alto Adige, Veneto), Center (e.g., Toscana, Lazio), and South (e.g., Campania, Sicilia). The results indicated that regions in Northern Italy performed best overall, while Central regions fared better than most Southern areas-with Abruzzo being a notable exception [21].
Rane et al. (2023) highlighted the application of a variety of MCDM techniques, such as AHP, FAHP, TOPSIS, ELECTRE, and VIKOR, across diverse sustainability domains. Their study emphasized the benefits of using hybrid models, which combine multiple decision-making approaches for more precise evaluations. The fields analyzed included construction, business, industry, renewable energy, water and resource management, agriculture, and materials selection [22].
Brodny and Tutak (2023) conducted an analysis of SDG 9: “Industry, Innovation, and Infrastructure” across European Union member states, utilizing MCDM techniques including TOPSIS, WASPAS, and EDAS to compute sustainability indices. They used methods like SD, CRITIC, and ENTROPY for criterion weighting. According to statistical analyses utilizing the Spearman's and Kendall's Tau tests, the nations with the greatest scores were Denmark, Germany, Luxembourg, the Netherlands, Finland, and Sweden, while the nations with the lowest scores were Bulgaria, Greece, Portugal, and Lithuania [23].
Alkan (2024) employed a hybrid model combining the CRITIC and SWARA methods to determine criteria weights in the context of renewable energy planning in Turkey. Ranking was made by using the CODAS method. Results from this approach ranked wind energy as the most significant renewable energy source for sustainable development, followed by solar, hydro, geothermal, and biomass energy [24].
Burhan (2024) similarly evaluated SDG 9 performance, focusing on both EU nations and Turkey over the 2013–2022 period. The research utilized a hybrid criteria-weighting approach (CRITIC-ENTROPY), coupled with the VIKOR and MAIRCA ranking methods. The first phase analyzed nine criteria within EU countries, while the second included Turkey. Sweden led in SDG 9 performance, followed by the Netherlands, Germany, Denmark, and Finland. Conversely, Greece and Croatia ranked lowest. Turkey’s early performance was weak but improved by 2020, reaching a mid-range position before declining in the final two years [25].
Dwivedi and Sharma (2025) employed the sum-weighted information (SWI) method to rank 28 Indian states as part of the SDG India Index 3.0 (2020–21). The index scores range from 0 to 100, reflecting alignment with the 2030 Agenda, with 15 indicators drawn from 15 of the 17 goals—excluding SDG 14 and SDG 17 due to insufficient data. Kerala emerged as the top performer, while Bihar ranked lowest [26].
Ersoy et al (2026) evaluated the level of sustainable development in EU countries over the 2019-2021 period using two MCDM methods. MPSI and RAFSI methods were used for the analysis. In the study, an analysis was conducted using 15 indicators related to the 17 SDGs. The result of the analysis showed that Sweden, the Netherlands and Germany emerged as the top performers. They hold a significant advantage over other EU countries. Estonia ranked last in terms of SDGs. Four countries of the 26 EU countries are also in the Balkan region consisting of Bulgaria, Greece, Croatia, Hungary and Romania. Ranking of these countries for 2019-2021 emerged as Hungary> Bulgaria> Croatia>Romania>Greece from the best to the worst country in achieving the SDGs. From 15 criteria, the highest criterion weight is on the C10: “Recycling rate of municipal waste” criterion [27].
Despite the extensive literature on SDG assessments, the present study distinguishes itself as the first to evaluate all 17 SDGs and to focus on the SDG performance of the Balkan countries using the novel hybrid εLεR model.
3. Methodology and Application: The Novel Hybrid εLεR Model.
While the origins of multi-criteria thinking date back centuries, most of the well-known Multi-Criteria Decision Making (MCDM) tools such as ELECTRE [28], AHP [29], TOPSIS [30] and PROMETHEE [31] emerged in the second half of the 20th century [32,33,34].
The notion of MCDM was first suggested in 1975 [35]. Four years later, it was explained by Zionts (1979) and gained universal recognition. Sustainability is a natural subject of MCDM, because, by itself, it includes three sub-sets of criteria: economics, environmental, and social aspects [36,37]. It is designed to support optimal decision-making by simultaneously evaluating multiple criteria and viewpoints [30,38,39]. Objective MCDM methods are known for their computational efficiency, while subjective methods prioritize the inclusion of decision-makers' preferences in a transparent manner. These methodologies are broadly accepted as critical decision-support tools across diverse fields such as business, engineering, and environmental systems [33,40,41]. MCDM approaches are commonly employed to resolve problems involving conflicting criteria by either selecting the best option or ranking available alternatives. It is also valid for the SDGs. Policies associated with some SDGs could also have negative spillover effects on other SDGs. For example, investments in water and sanitation advances human well-being and progress on SDG6 (clean water and sanitation) but can also constrain progress on food systems or environment by reducing the water available for environmental flows or irrigation, with trade-offs for SDG2 (food security) and SDG15 (freshwater ecosystems) [42].
The literature provides a robust basis for understanding MCDM approaches, their classifications, distinctions, and practical uses. Recent developments increasingly emphasize adapting existing methods to specific application contexts and merging traditional tools with newer concepts like fuzzy logic, rough set theory, or grey systems [43]. Due to the differing structures of these techniques, MCDM models can produce varying rankings for the same dataset, making it difficult to conclusively validate one method over others. To address this, the current paper presents a novel hybrid model that uses the results from several MCDM approaches to produce a consensus ranking of options. This hybrid framework, called εLεR, combines six different MCDM methods. Criterion weights are determined by the first trio, as the "3L" group: LOPCOW, LMAW, and LBWA. The second trio, known as the "3R" group: RAFSI, RAPS, and RAWEC, is used to assess the alternatives' performance. Every method in its group makes an equal contribution (% 33.33) to the outcome.
The following figure (Figure 2) shows the main steps of the εLεR Model application:
The following table (Table 1) summarized the steps of the components of the Novel Hybrid εLεR Model.
This research explores how Balkan countries located in the southeastern Europa are progressing toward achieving the Sustainable Development Goals (SDGs). The table below highlights several important statistics for the Balkan countries. A striking feature of the Balkan region is its notably lower GDP per capita compared to the European Union (EU) average. In 2023, while the average GDP per capita across EU member states stood at EUR 38,319 while the Balkan countries averaged just EUR 16,441, approximately 43% of the EU figure. This underscores the region’s relatively lower level of economic development. On the environmental front, average greenhouse gas emissions in the Balkans are below the EU average. The proportion of individuals at risk of poverty or social exclusion in the Balkans is roughly on par with the EU average. In addition, the SDG Index (REPORT scores) for the Balkan countries are also presented in the table below. The table below (Table 2) contains some indicators of the Balkan countries.
The criteria influencing the sustainable development performance, which also align with the Sustainable Development Goals (G1…G17). According article 40 of the Agenda 30, each of the Sustainable Development Goals is of equal importance with the other Goals (Agenda 30, p.10). However, the impact of these factors on sustainable development should not be viewed as equally significant. Nevertheless, the Agenda 30 and the Report referenced below assumes that all factors carry the same weight. This study aims to evaluate the relative importance of each factor. The data utilized in this analysis were obtained from the report by Sachs, J. D., Lafortune, G., & Fuller, G. (2024), titled The SDGs and the UN Summit of the Future: Sustainable Development Report 2024, published by Dublin University Press. The complete reference can be found at https://doi.org/10.25546/108572. The 2024 edition of the Sustainable Development Report provides a comprehensive overview of progress toward the SDGs across all UN member states. This report is based on the latest data coming from the year 2023. Focusing on a single year is not a problem because the index scores are calculated in a cumulative manner by containing the past time. Each country’s SDG Index score, ranging from 0 to 100, reflects its level of achievement, with 100 representing full attainment of the goals. The gap between 100 and a country’s score indicates how far it still needs to go to reach full SDG compliance. In the report, all 17 goals-each treated as a separate criterion-are considered equally important, with each being assigned the same weight (Ew = 1/17 = 0.059). The SDG index scores of the Balkan countries for 2023 are shown in the table below (Table 3).
When the assumption of equal importance among criteria is removed, it becomes feasible to apply multi-criteria decision-making (MCDM) techniques. In this study, three MCDM methods-LOPCOW, LMWA, and LBWA-were employed to determine the significance (importance) weights of the criteria (i.e., SDGs or influencing factors) that contribute to achieving the Sustainable Development Goals. Among these, LOPCOW is an objective method that relies purely on numerical computations, whereas LMWA and LBWA are subjective techniques that incorporate expert judgment. For the LMWA method, insights were gathered through face-to-face interviews with 3 academicians specializing in sustainable development. In the case of LBWA, the scale and elasticity coefficients were based on 3 practitioners’ assessments. By integrating both objective (LOPCOW) and subjective approaches (LMWA and LBWA), a more balanced and comprehensive evaluation was achieved. The criteria weights and ranking derived from the application of these three MCDM methods are presented in the table below (Table 4).
The application of these three MCDM methods resulted in the determination of the criteria weights. Based on the LOPCOW method, Goal 1 emerged as the most critical criterion, while Goals 2 were identified as the most significant according to both LMAW and LBWA. On the other hand, Goal 7 was considered the least important by LOPCOW, Goal 17 ranked lowest by LMAW, and Goal 16 was the least significant by LBWA. Using the newly proposed combined approach, referred to as the 3L method (an average of LOPCOW, LMAW, and LBWA results), Goal 1 (No Poverty) was found to be the most influential factor in achieving SDG performance. Conversely, Goal 17 (Partnerships for the Goals) was ranked as the least impactful. These findings are visually represented in the figure below (Figure 3).
Subsequently, the performance of the 10 Balkan countries in achieving the SDGs was evaluated using three distinct MCDM methods: RAFSI, RAPS, and RAWEC-collectively referred to as the 3R methods. By averaging the performance scores derived from these three methods, a hybrid εLεR performance score and corresponding ranking were calculated. A summary of these results is provided in the table below (Table 5).
Based on the hybrid εLεR model, Croatia emerged as the top-performing Balkan country in terms of progress toward the SDGs in 2023. Hungary ranked second, while Greece took the third position. On the other end of the spectrum, Montenegro recorded the lowest performance in achieving the SDGs. These outcomes are represented in the figure below (Figure 4).
4. Sensitivity Analysis
The result validation can be done in two stages: evaluating the stability of the criterion weights and examining the consistency of the performance ranking. The first stage focuses on analyzing the robustness of the weights assigned to each criterion. This involves two sub-analyses, referred to as the w1-sensitivity, w2-sensitivity analysis.
4.1. Stability of Criterion Weights
In the w1-sensitivity analysis, adjustments are made to the weight of Criterion G1, which holds the highest importance based on the εL method. Its weight is gradually reduced in increments of 5% and the removed portion is proportionally redistributed among the remaining criteria based on their initial weights. This process continues until Step 20 (set 20), at which point G1’s weight reaches zero. The corresponding table illustrating these adjustments is provided below (Table 6).
The smaller the variation between the rankings in the set1 and set 20, the more robust the 3L model is considered to be. To evaluate this, a comparative analysis was conducted between the rankings in the first and last columns while G1 was excluded in this comparison. As the ranking values in both sets were identical, the Pearson correlation coefficient between them was calculated to be 1. This outcome demonstrates that the εL method used for weight calculation exhibits a high degree of robustness.
In the w2-sensitivity analysis, the rankings generated by the εL model were evaluated against those produced by other well-established MCDM weighting methods. To conduct this comparison, five widely recognized methods (WENSLO, ENTROPY, CRITIC, MEREC, SD) were employed. Each of these methods was applied to the same dataset. The resulting criterion weight rankings from all six methods are presented in the table below (Table 7).
The ranking of criterion weights produced by the εL model differed significantly from those generated by the other methods. As anticipated, the correlations are generally weak or even negative. This outcome was expected as the alternative methods used here are entirely objective in nature. In contrast, the hybrid εL model introduced in this study incorporates a subjective dimension reflecting the judgments of experts. In other words, the proposed model combines both subjective and objective elements, offering a more balanced and comprehensive evaluation.
4.2. Comparative Analysis
After testing the criterion weights, it is useful to proceed to the stage of testing the ranking of alternatives. For this, a comparative analysis was made. The ranking among the alternatives was compared with both the report results, the new hybrid model and the other 5 MCDM methods, and these comparison results are given in the table below (Table 8).
The performance rankings derived from the Report, the hybrid εLεR model and other MCDM methods (CoCoSo, TOPSIS, EDAS, ARAS, COPRAS) are quite similar. With the exception of CoCoSo, the correlation matrix results show that the rankings derived from the MCDM (including εLεR) models and the report ranking are almost the same. These findings show that the εLεR and REPORT scores have a very close correlation, and the ranking results from the two approaches are the same. The Pearson correlation coefficient between the εLεR model, the Report result and the rankings of the other MCDM methods is shown in the table below (Table 9).
These results indicate that the εLεR ranking, in which each SDG is weighted both objectively and subjectively, and the REPORT ranking, which presumes that all SDGs have equal weight, do not significantly differ from one another. Based on this viewpoint, it can be said that there are no notable variations in the SDG criteria's relative importance that would change the ranking. The SDG criteria are interrelated and carefully chosen by the UN.
4.3. Rank Reversal Issue
Changes to some elements of the decision matrix, like adding or removing an alternative, may have an impact on the ranking. In order to assess the durability of the εLεR model results, a third sensitivity study (rank reversal issue) was carried out. This approach involved reevaluating the ranks of the remaining possibilities after removing the alternative that performed the worst in each scenario. The research was performed after Montenegro, the nation with the lowest score, was eliminated from the first result.
Following the departure of Montenegro, North Macedonia dropped to the bottom of the rankings, while Croatia maintained its top place. After excluding North Macedonia, the research revealed that Croatia remained at the top, while Bosnia and Herzegovina was now at the bottom. As Bosnia and Herzegovina was eliminated, Croatia maintained its top place and Albania dropped to the bottom of the ranking. Then, for the first time, the analysis showed a shift, with Bulgaria moving up to fifth place and over ranking Romania. Romania was found to be the lowest-performing nation, while Croatia continued to lead when Albania was removed from the ranking. Croatia continued to top the ranking after Romania was eliminated, but Bulgaria dropped to the bottom. After removing Bulgaria, the procedure was repeated, with Croatia continuing to lead and Serbia performing the poorest. Greece was now ranked lowest, whereas Croatia continued to perform best when Serbia was eliminated. The performance of Croatia and Hungary was directly compared after Greece was eliminated, demonstrating Croatia's superior performance. Although Croatia continuously surpassed all other nations.
5. Discussion
This paper aims to evaluate the progress to achieve the Sustainable Development Goals (the SDGs) in ten Balkan countries by answering the research questions such as a) “is it true to give the equal weight for each SDG and if not, which criterion has the highest weight in achieving the SDGs?”, b) “which country in the region is the best performer in achieving the SDGs?”, c) “is the novel model robust or not in weighting and ranking ?” and finally d) “is there a correlation between the report ranking and the model ranking?” To answer these four questions, 17 SDGs are used as performance criteria in the multicriteria decision making (MCDM) model. A novel εLεR hybrid model was designed by integrating six individual methods. First, LOPCOW, LMWA, LBWA methods were integrated to determine the weights of the 17 criteria and then, RAFSI, RAPS, RAWEC methods were combined to rank the SDG performance of the Balkan countries in 2023.
The UN 2030 Agenda and the 2024 Development Report accept that all the SDGs are of equal importance for sustainable development. But there may be a slight difference in importance among these 17 goals. In the study a novel “εLεR” hybrid MCDM model was employed. Hybrid MCDM models combine the strengths of different decision-making methods to overcome individual method limitations and provide more accurate and robust results. In addition, hybrid models can present an opportunity of integrating subjective and objective criteria importance methods [22,37]. Therefore, in the study, 3 different methods are integrated to form a novel hybrid εL model for determining weight coefficients. In the end, it turns out that not all SDGs are of equal importance.
In previous SDGs performance studies, no study was found in which all SDGs were included in the analysis. In this study, unlike other studies, all 17 SDGs were included in the analysis. In addition, there was no study focusing on SDGs progress in Balkan region. The closest study to this study is the one conducted by Ersoy et al (2026) in which the SDGs performance in EU countries was examined for the period 2019-2021 and the MPSI-RAPS hybrid MCDM model was applied. However, the SDGs were included indirectly by using the related 15 criteria. The ranking of the 5 Balkan countries among the countries examined was Hungary>Bulgaria>Croatia>Romania>Greece, from best to worst. In our study, the ranking is different such as Croatia>Hungary>Greece>Romania>Bulgaria. The reason for this difference can be explained that the periods examined, the selected criteria and the MCDM methods used are different in two papers.
6. Conclusion
As the first outcome of the employed model, “the SDG1: No poverty” criterion emerged to have the highest weight in achieving of the SDGs. This criterion was followed by “the SDG2: Zero hunger” and “SDG6: Clear water and sanitation” criteria respectively. The criteria weight of “SDG17: Partnerships for the goals” emerged to have the lowest weight. Thus, it turned out that not all SDGs are of equal importance. However, this does not mean that the SDGs are independent of each other and that any one should be given more or less importance.
As the second outcome, Croatia showed the best performance in the process of achieving the SDGs. Hungary took the second and Greece obtained the third place in the ranking. Montenegro emerged to be the last in the ranking.
To answer the third question and to assess the robustness of the model's outputs, the paper included several sensitivity analyses. First, in the w1-Sensitivity analysis, a study was taken to see the potential effects of altering the weights on the results. The results demonstrated that even after the weights were changed, the model's output concerning the criteria weights remained stable. Second, in the w2-Sensitivity analysis, the results of the model was compared the result of other weighting methods such as WENSLO, ENTROPY, CRITIC, MEREC and SD. The analysis showed that weight results were not similar because some of these weighting methods use the objective approach while the others use the subjective (expert opinion) approach. Third, Other popular MCDM ranking techniques, such as COCoSo, TOPSIS, EDAS, ARAS, and COPRAS, were applied to the same dataset in order to further assess the robustness of the novel εLεR method. There was a considerable degree of resemblance between the Balkan nations' SDG performance rankings as measured by the εLεR method and the other five methodologies. The εLεR method, which uses the εL weight system, was shown to be a robust methodology for performance ranking in this comparative examination.
The relationship between the performance rankings based on equal weighting of the criteria from the UN approach together with the report and those produced from the various MCDM methodologies, including the new model, was then evaluated by a correlation study. With the exception of CoCoSo, the rankings derived from the MCDM and report approaches were extremely close, according to the correlation matrix data.
As a result, there is no discrepancy between the UN approach that establishes SDGs and the report approach that compares SDG performance and the results of the model proposed here, which differentiates criterion weights.
References
- IPCC (2014). Climate change 2014: synthesis report. Contribution of working groups i, ii and iii to the fifth assessment report of the intergovernmental panel on climate change [Core Writing Team, R.K. Pachauri and L.A. Meyer (eds.)]. IPCC, Switzerland. https://epic.awi.de/id/eprint/37530/1/IPCC_AR5_SYR_Final.pdf.
- World Commission on Environment and Development (WCED).(1987). Our common future. Oxford. Oxford University Press. https://sustainabledevelopment.un.org/content/documents/5987our-common-future.pdf.
- Soubbotina, T. P. (2000). Beyond economic growth: an introduction to sustainable development. Washington (USA): The International Bank for Reconstruction and Development/The World Bank. https://www.gfdrr.org/sites/default/files/publication/Beyond%20Economic%20Growth_0.pdf.
- Akay, F. (2015). UN SDSN Türkiye’den açık çağrı: tüm paydaşları ağımıza bekliyoruz. https://www.ekoiq.com/un-sdsn-turkiyeden-acik-cagri-tum-paydaslari-agimiza-bekliyoruz/.
- De Mendonca, S.B., & Laques, A.E.(2017). Sustainability Impact assessment - an overview with a holistic and transdisciplinary perspective towards agricultural research. Environmental Management and Sustainable Development. Macrothink Inst. 6 (2), 211–23. [CrossRef]
- Holden, E., Linnerud, K., & Banister, D.(2017). The imperatives of sustainable development. Sustainable Development, 25 (3), 213–226. [CrossRef]
- Kates, R.W., Parris, T.M., & Leiserowitz, A.A. (2005). What is sustainable development? Goals, indicators, values, and practice. Environment. Science and . Policy Sustainable. Development, 47 (3), 8–21. [CrossRef]
- Parris, T.M. & R.W. Kates (2003). Characterizing and measuring sustainable development. Annual Review of Environment and Resources, 28, 559-586. [CrossRef]
- Alaimo, L.S. (2018). Sustainable development and national differences: an European cross-national analysis of economic sustainability. RIEDS-Rivista Italiana di Economia, Demografia e Statistica-Italian Review of Economics. Demography Stat. 72 (3), 101–123. http://www.sieds.it/listing/RePEc/journl/2018LXXII_N3_RIEDS_09_20_Alaimo_ok.pdf.
- Sachs, J.D (2012). From millennium development goals to sustainable development goals. Viewpoint, 379: 9832, 2206-2211. https://www.thelancet.com/journals/a/article/PIIS0140-6736(12)60685-0/abstract.
- Gates, B. (2013). Annual letter 2013—measuring progress. https://www.gatesfoundation.org/ideas/annual-letters/annual-letter-2013.
- Sachs, J.D (2015). The age of sustainable development. New York, Columbia University Press. [CrossRef]
- Gurav, V. P., Bankar, R. S., & Bansode, N. N. (2025). Mapping global sustainable development goals (sdgs) research: a scientometric perspective. Proceedings of National Conference-2025, 8–18. Shivaji University, Kolhapur (IN): Prarup Publication. [CrossRef]
- Stevens, C., & Kanie, Norichika (2016). The transformative potential of the sustainable development goals (sdgs). International Environmental Agreements: Politics, Law and Economics, 16, 393–396. [CrossRef]
- Sousa, M., Almeida, M.F., & Calili, R. (2021). Multiple criteria decision making for the achievement of the un sustainable development goals: a systematic literature review and a research agenda. Sustainability, 13, 4129. [CrossRef]
- United Nations (UN) General Assembly. (2015). Transforming our world: the 2030 agenda for sustainable development. New York. https://www.undp.org/ukraine/publications/transforming-our-world-2030-agenda-sustainable-development.
- McCord, G. C., & Sachs, J.D., (2013). Development, structure, and transformation: some evidence on comparative economic growth. NBER Working Paper No. 19512, Available at SSRN: https://ssrn.com/abstract=2338885.
- OECD (2020), A territorial approach to the sustainable development goals: synthesis report , OECD Urban Policy Reviews, Paris, OECD Publishing. [CrossRef]
- Antanasijevic, D., Pocajt, V., Ristic M., & Peric-Grujic A. (2017). A differential multi-criteria analysis for the assessment of sustainability performance of European countries: Beyond country ranking. Journal of Cleaner Production, 165, 213-220. [CrossRef]
- Luczak, A., & Malgorzata, J. (2021). Sustainable development of territorial units: MCDM approach with optimal tail selection. Ecological Modelling, 457, 109674, 1-21. [CrossRef]
- D’Adamo, I.; & Gastaldi , M. (2022). Sustainable development goals: a regional overview based on multi-criteria decision analysis. Sustainability, 14 (15), 9779. [CrossRef]
- Rane, N.L., Achari, A., & Choudhary, S.P.(2023). Multi-criteria decision-making (mcdm) as a powerful tool for sustainable development: effective applications of ahp, fahp, topsis, electre, and vikor in sustainability. International Research Journal of Modernization in Engineering Technology and Science,5, 5, 427-452. [CrossRef]
- Brodny, J., & Tutak, M. (2023). The level of implementing sustainable development goal "Industry, innovation and infrastructure" of Agenda 2030 in the European Union countries: Application of MCDM methods. Oeconomia Copernicana, 14(1), 47–102. [CrossRef]
- Alkan, N. (2024). Evaluation of sustainable development and utilization-oriented renewable energy systems based on CRITIC-SWARA-CODAS method using interval valued picture fuzzy sets. Sustainable Energy, Grids and Networks, 38. 101263. [CrossRef]
- Burhan, H. A. (2024). Sustainability in industry, innovation and infrastructure: a mcdm based performance evaluation of European Union and Türkiye for sustainable development goal 9 (sdg 9). Verimlilik Dergisi, 21-38. [CrossRef]
- Dwivedi, P.P., & Sharma, D.K. (2025). Performance measures of sustainable development goals using SWI MCDM methods: a case of the Indian states. International Transactions In Operational Research, 1–33. [CrossRef]
- Ersoy, N., Özçalıcı, M. & Trung D.D. (2026). A hybrid MCDM approach for SDGs assessment of EU countries. Spectrum of Decision Making and Applications. 3(1). 164-186. [CrossRef]
- Roy, B. (1990). The outranking approach and the foundations of ELECTRE methods. In Theory and Decision. Berlin, Springer. pp. 49-73. [CrossRef]
- Saaty, T.L. (1980). The analytic hierarchy process. New York, McGraw-Hill.
- Hwang, C.L., & Yoon, K. (1981). Methods for Multiple Attribute Decision Making. In Lecture Notes in Economics and Mathematical Systems; Springer: pp. 58-191. [CrossRef]
- Brans, J.P., Vincke, P., & Mareschal, B. (1986). How to select and how to rank projects: The PROMETHEE method. European Journal of Operational Research, 24, 228-238. [CrossRef]
- Tzeng, G.H., & Huang, J.J. (2011). Multiple attribute decision making methods and applications. New York, Chapman and Hall/CRC. [CrossRef]
- Greco, S., Ehrgott, M., & Figueira, J., (2016). (Ed.) Multiple criteria decision analysis. New York, Springer. [CrossRef]
- Ishizaka, A., & Nemery, P. (2013). Multi-criteria decision analysis: methods and software; New Jersey, John Wiley & Sons. [CrossRef]
- Zeleny, M. (1976). MCDM Bibliography — 1975. In: Zeleny, M. (eds) Multiple Criteria Decision Making Kyoto 1975. Lecture Notes in Economics and Mathematical Systems, vol 123. Springer, Berlin, Heidelberg. [CrossRef]
- Antucheviciene, J., Kala, Z., Marzouk, M., & Vaidogas, E. R. (2015). Solving civil engineering problems by means of fuzzy and stochastic MCDM methods: Current state and future research. Mathematical Problems in Engineering, 3, 1–16. [CrossRef]
- Zavadskas,K.E., Govindan, K, Antucheviciene, J., & Turskis, Z. (2016) Hybrid multiple criteria decision-making methods: a review of applications for sustainability issues, Economic Research-Ekonomska Istraživanja, 29:1, 857-887. [CrossRef]
- Turskis, Z., & Keršulienė, V. (2024). SHARDA–ARAS: A Methodology for Prioritising Project Managers in Sustainable Development. Mathematics, 12(2), 219. [CrossRef]
- Schoemaker, P.J.H; & Waid, C.C. (1982). An experimental comparison of different approaches to determining weights in additive utility models. Management Science, 28, 2, 182–196. [CrossRef]
- Sen, P., & Yang, J.B. (1998). MCDM and the nature of decision making in design, In Multiple Criteria Decision Support In Engineering Design. London, Springer. Pp. 13-20. [CrossRef]
- Sitorus, F., Cilliers, J.J., & Brito-Parada, P.R. (2019). Multi-criteria decision making for the choice problem in mining and mineral processing: applications and trends. Expert Systems With Applications, 121, 393–417. [CrossRef]
- Allen, C., Malekpour, S., Persson, A., & Bennich, T. (2025). Accelerating progress on the SDGs: Policy guidance from the global modeling literature, One Earth. [CrossRef]
- Doumpos, M., Figueira, J.R., Greco, S., & Zopounidis, C. (Eds.). (2019). New perspectives in multiple criteria decision making: innovative applications and case studies; London, Springer.
- Ecer, F., & Pamučar, D. (2022). A novel LOPCOW-DOBI multi-criteria sustainability performance assessment methodology: An application in developing country banking sector. Omega, 112, 102690. [CrossRef]
- Pamucar, D., Zizovic, M., Biswas, S.,A., & Bozanic, D.(2021). New logarithm methodology off additive weights (LMAW) for multi-criteria decision-making: application in logistics. Facta Universitatis- Series Mechanical Engineering, 19(3),361-380. [CrossRef]
- Žižović, M., & Pamucar, D. (2019). New model for determining criteria weights: level based weight assessment (LBWA) model, Decision-making Applications in Management and Engineering, 2(2), 126-137. [CrossRef]
- Žižović, M., Pamucar, D., Albijanic, M., Chatterjee, P., & Pribicevic, I. (2020). Eliminating Rank Reversal Problem Using a New Multi-Attribute Model—The RAFSI Method. Mathematics MDPI. 8(6), 1015. [CrossRef]
- Urošević, K., Gligorić, Z., Miljanović, I., Beljić, Č., & Gligorić, M. (2021). Novel methods in multiple criteria decision-making process (MCRAT and RAPS)—Application in the mining industry. Mathematics, 9(16), 1980. [CrossRef]
- Puška, A, Štilić , A, Pamučar , D., Božanić, D., Nedeljković, M. (2024). Introducing a Novel multi-criteria Ranking of Alternatives with Weights of Criterion (RAWEC) model. MethodsX, 12(2024). 102628. [CrossRef]
Figure 1.
Sustainable Development Goals (SDGs). Source: United Nations (UN) General Assembly. (2015). Transforming our world: the 2030 agenda for sustainable development. New York. https://www.undp.org/ukraine/publications/transforming-our-world-2030-agenda-sustainable-development.
Figure 1.
Sustainable Development Goals (SDGs). Source: United Nations (UN) General Assembly. (2015). Transforming our world: the 2030 agenda for sustainable development. New York. https://www.undp.org/ukraine/publications/transforming-our-world-2030-agenda-sustainable-development.
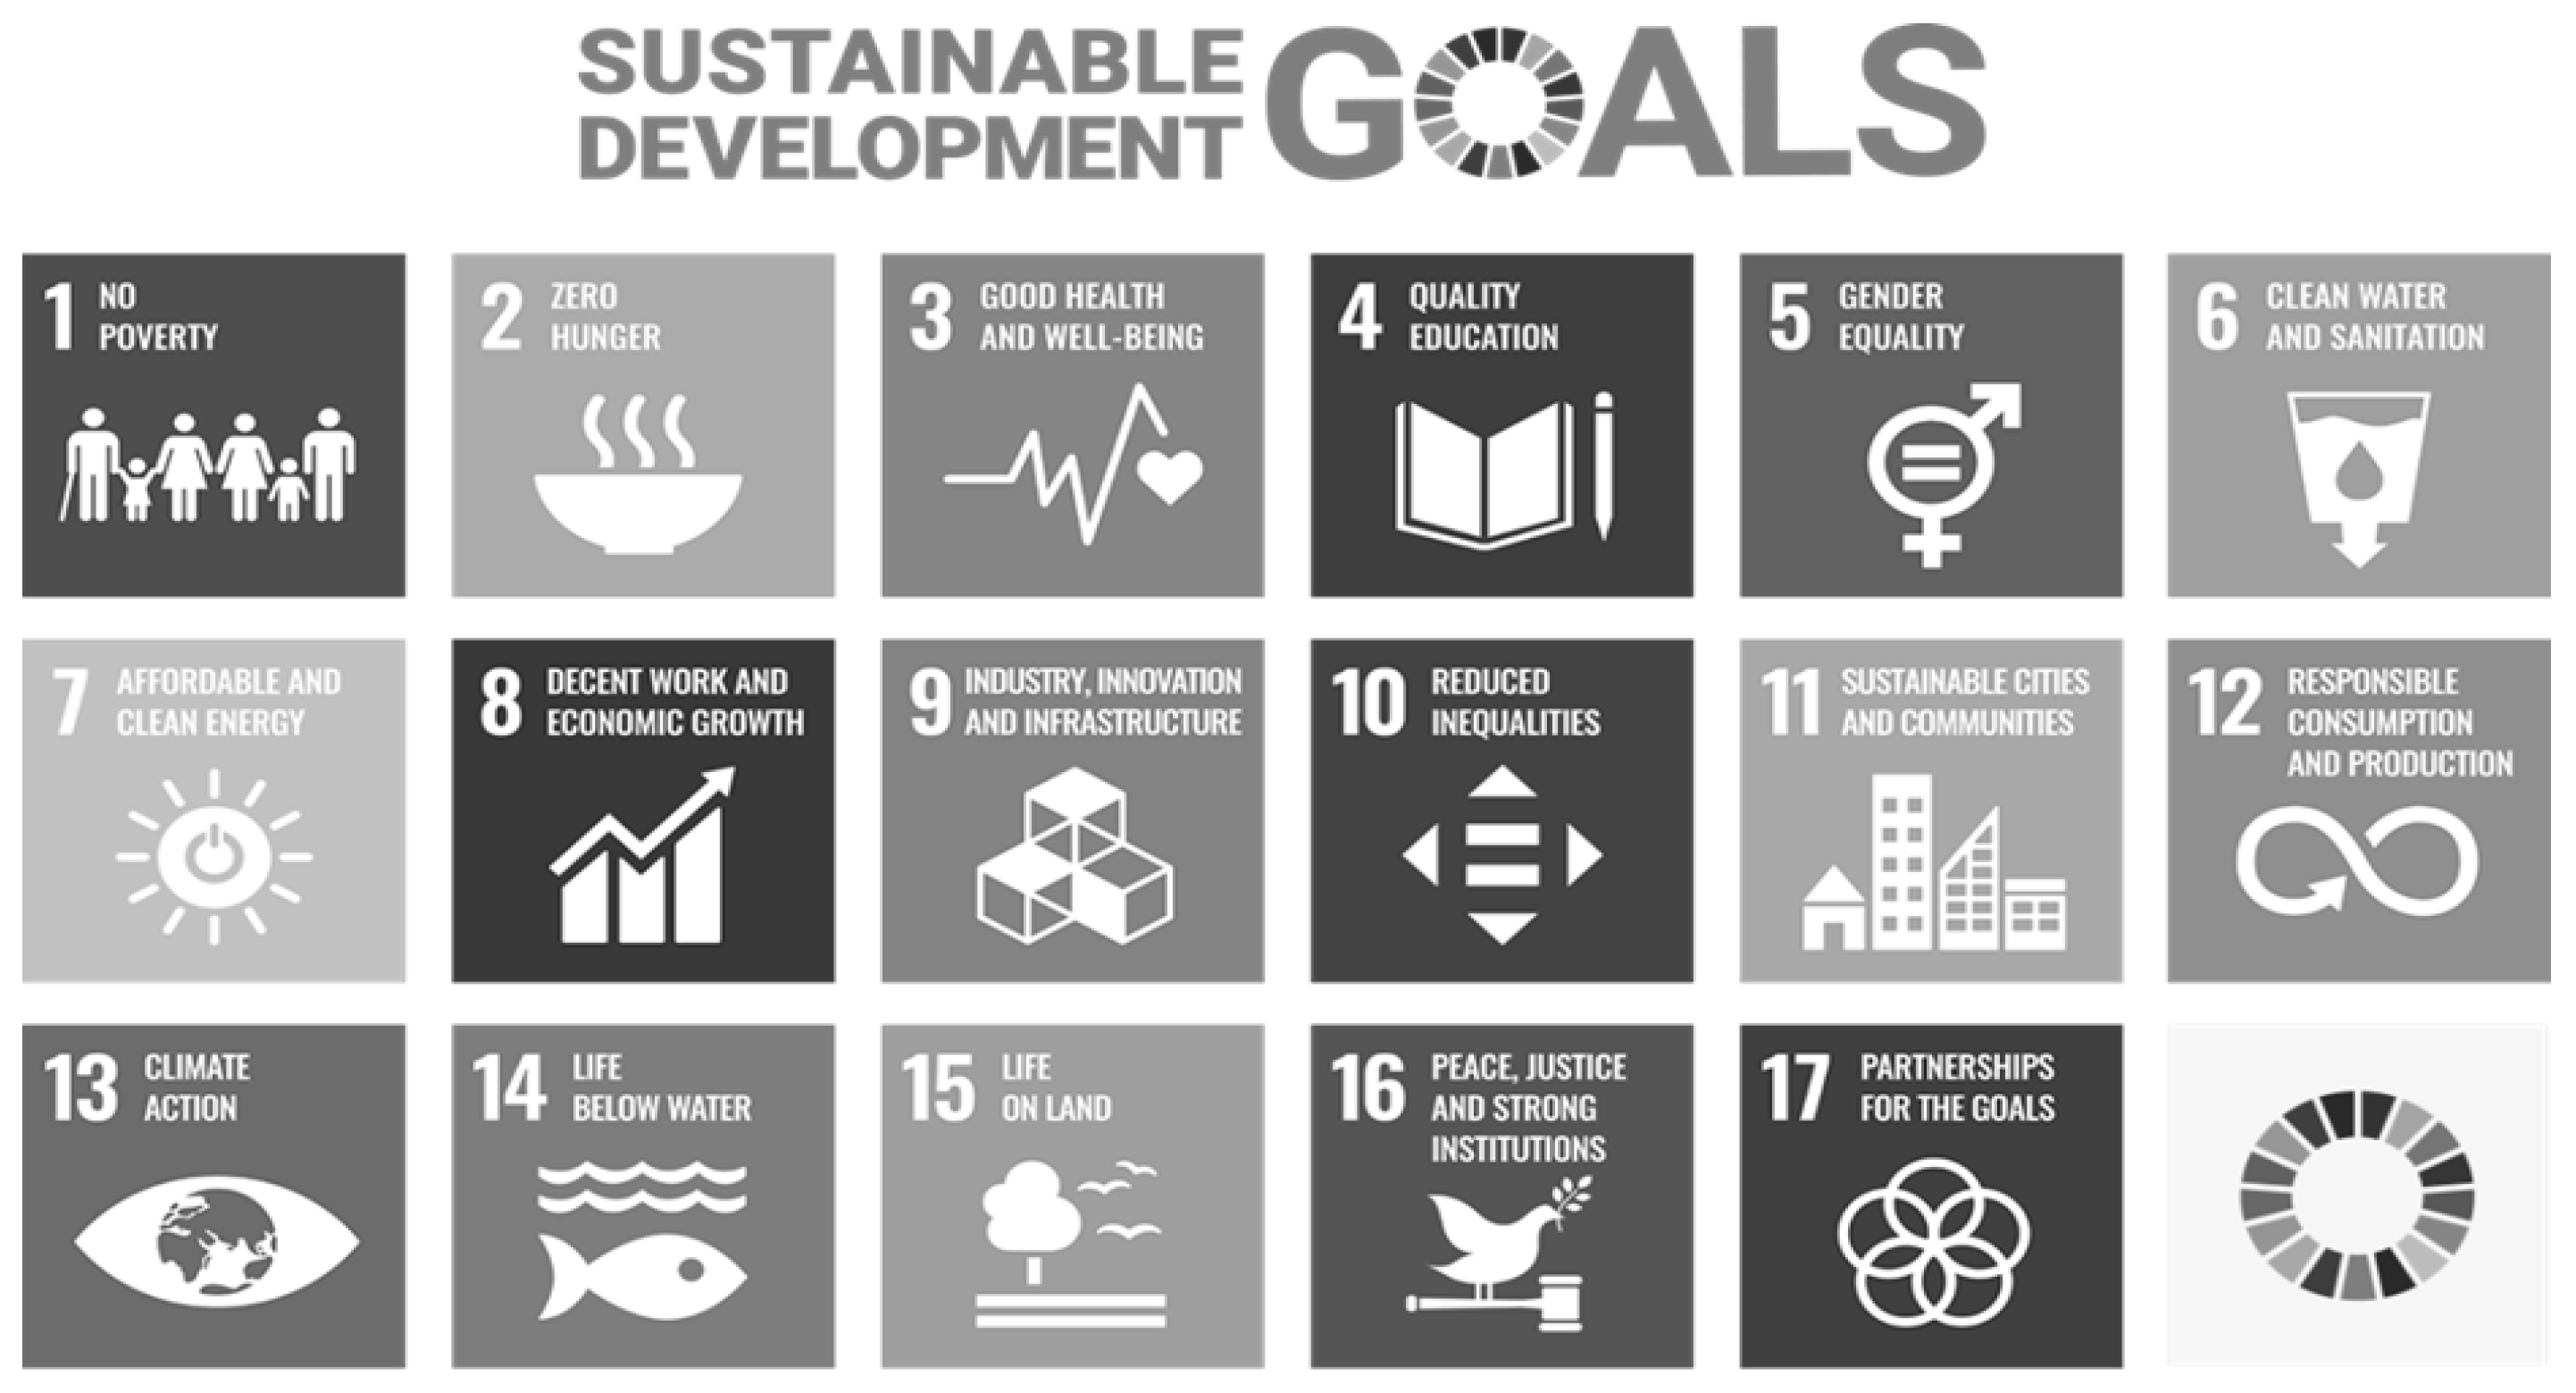
Figure 2.
The Stages of the Model Application.
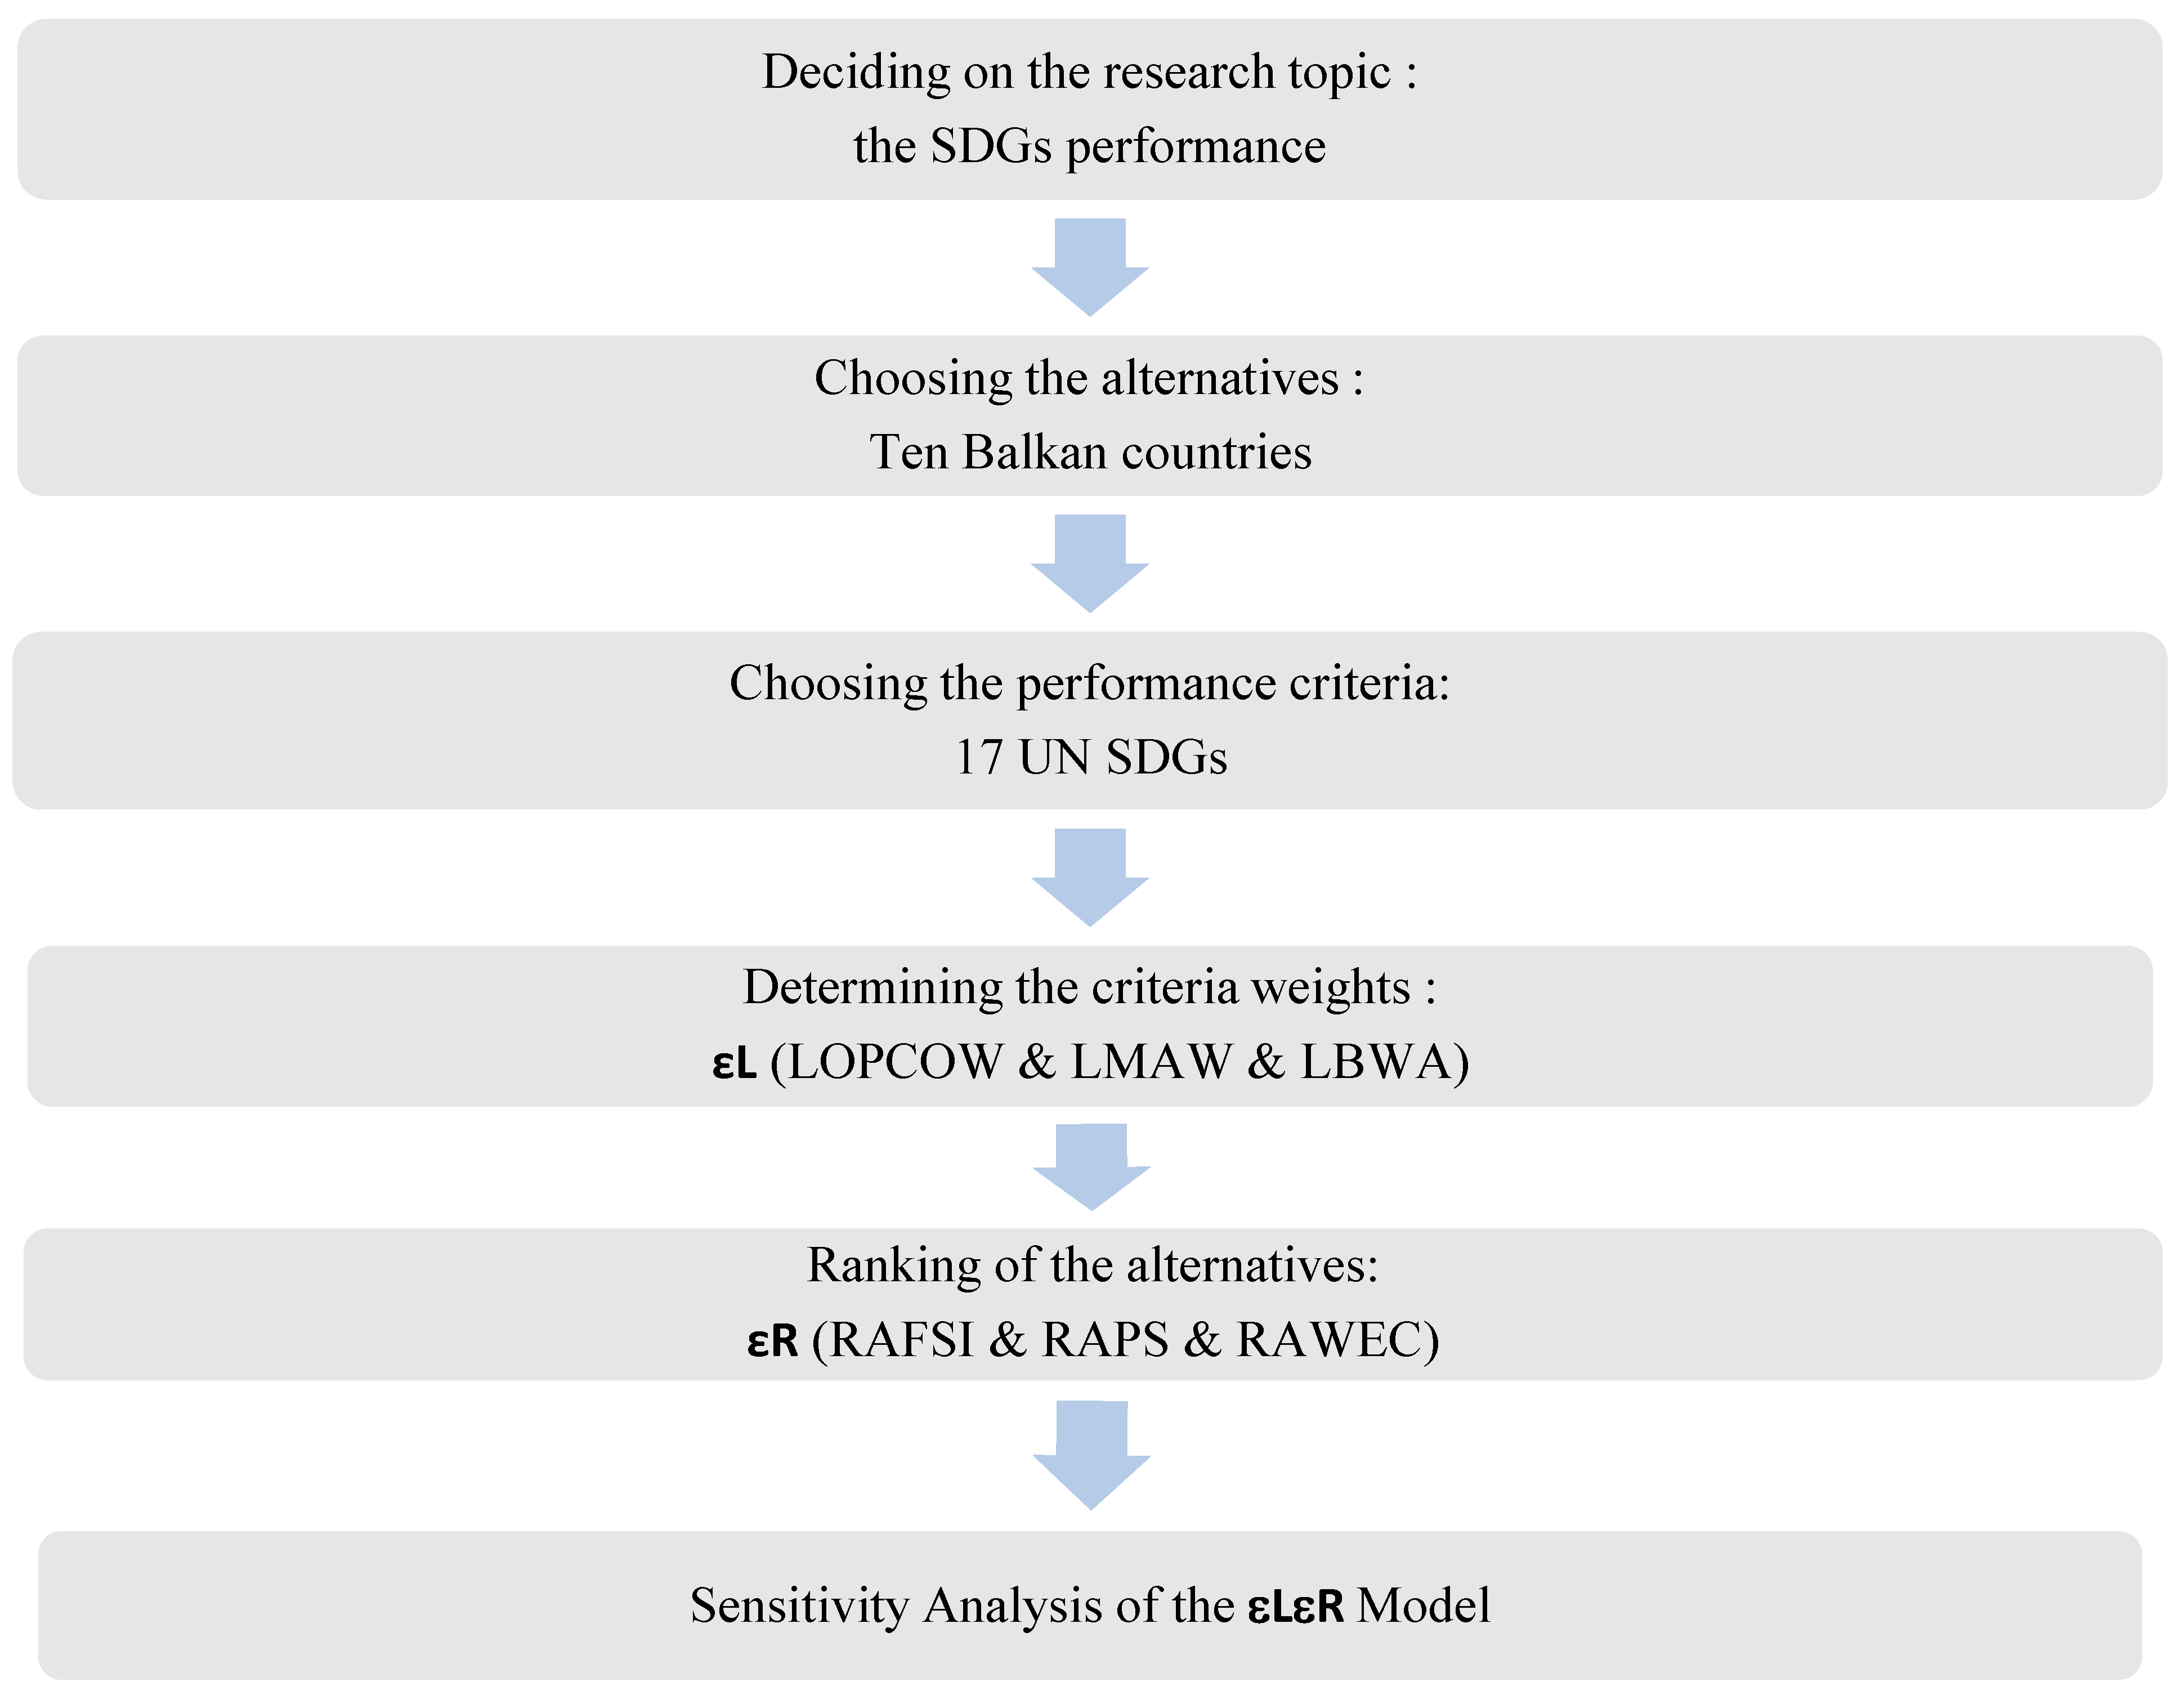
Figure 3.
Criteria weights.
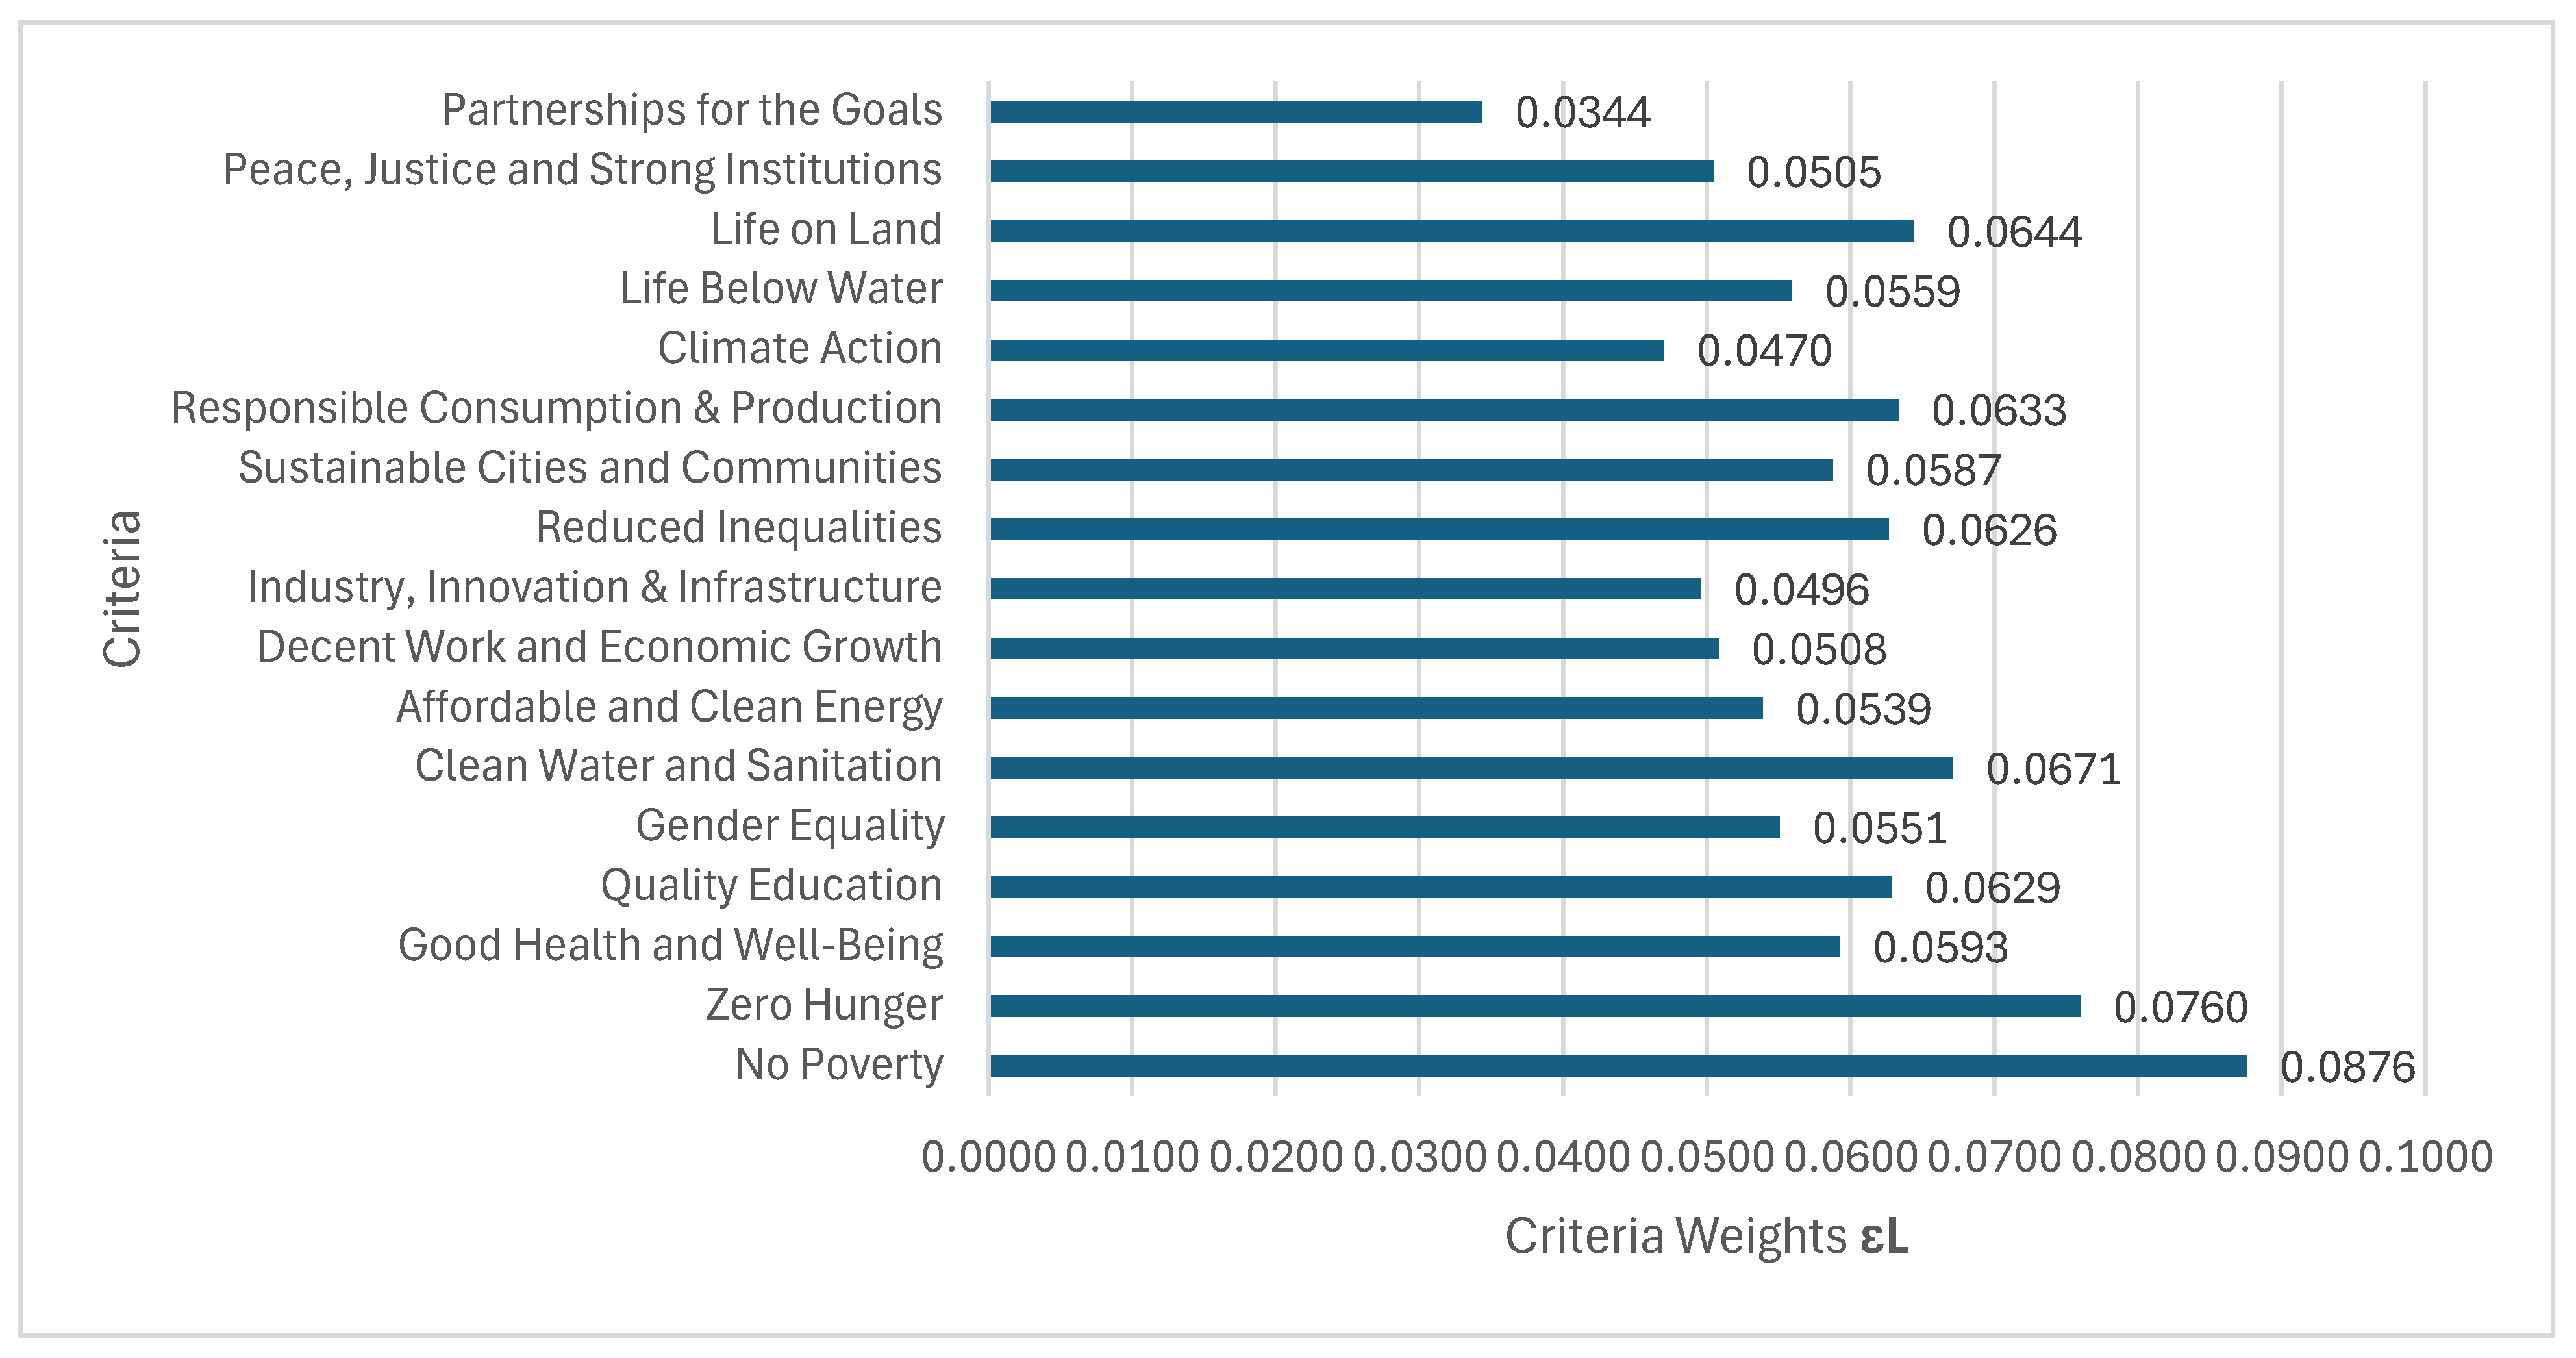
Figure 4.
Performance Score of the Balkan Countries on SDGs.
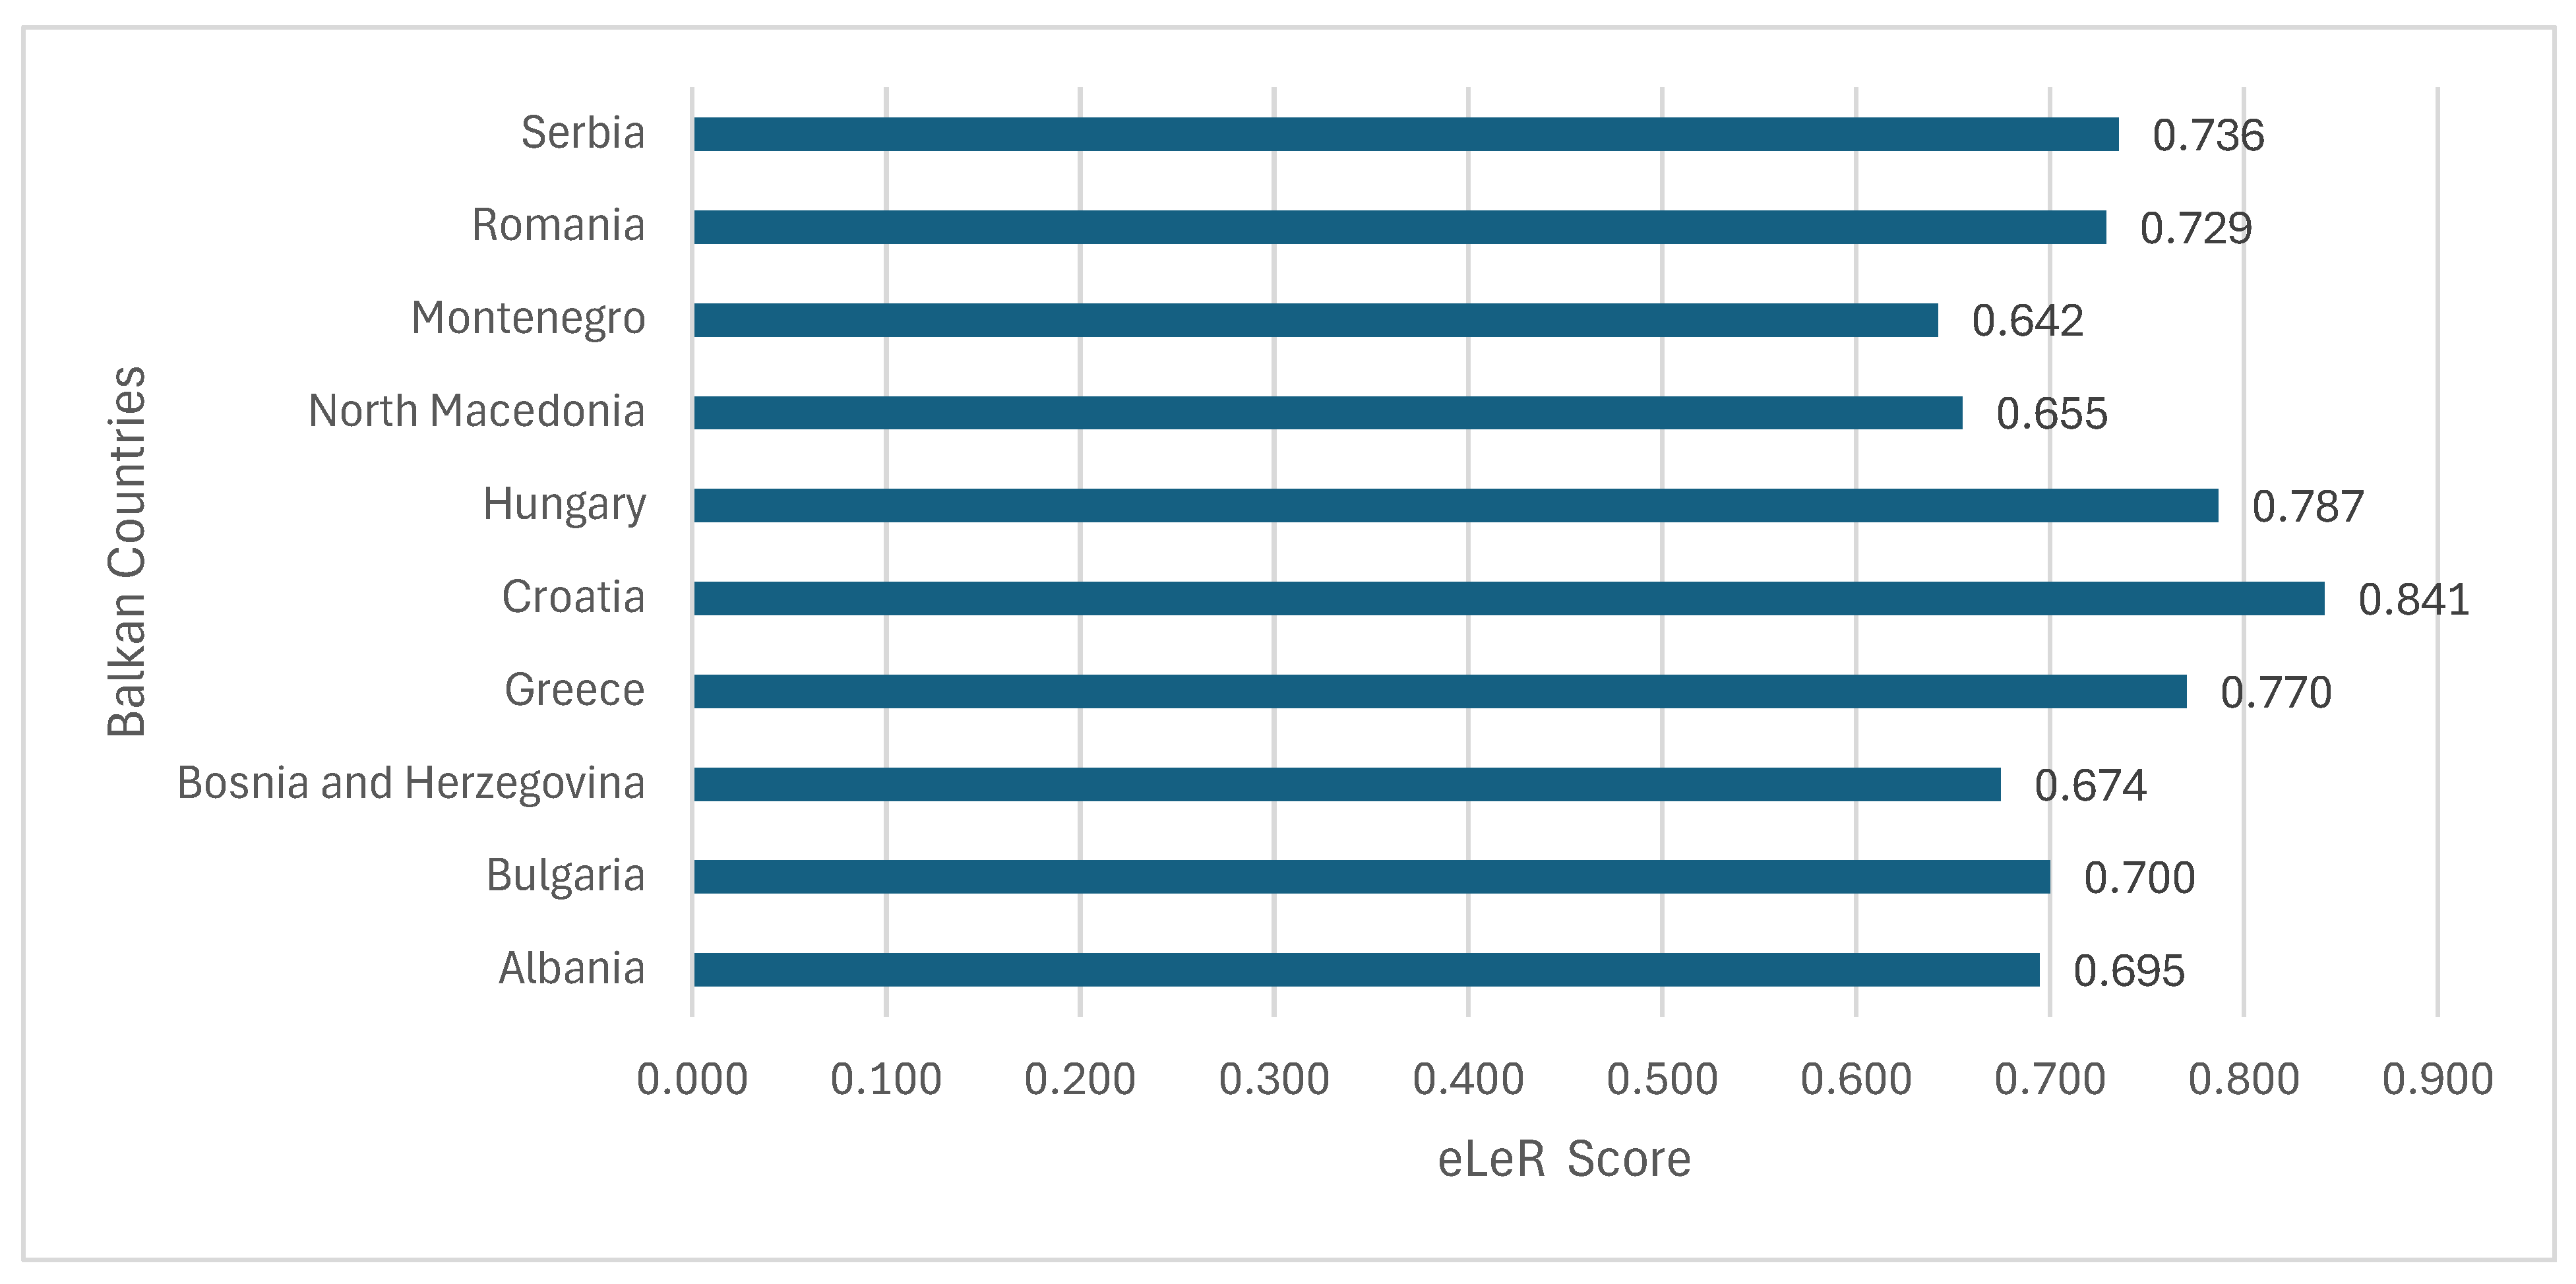
Figure 5.
The Rank Reversal Issue.
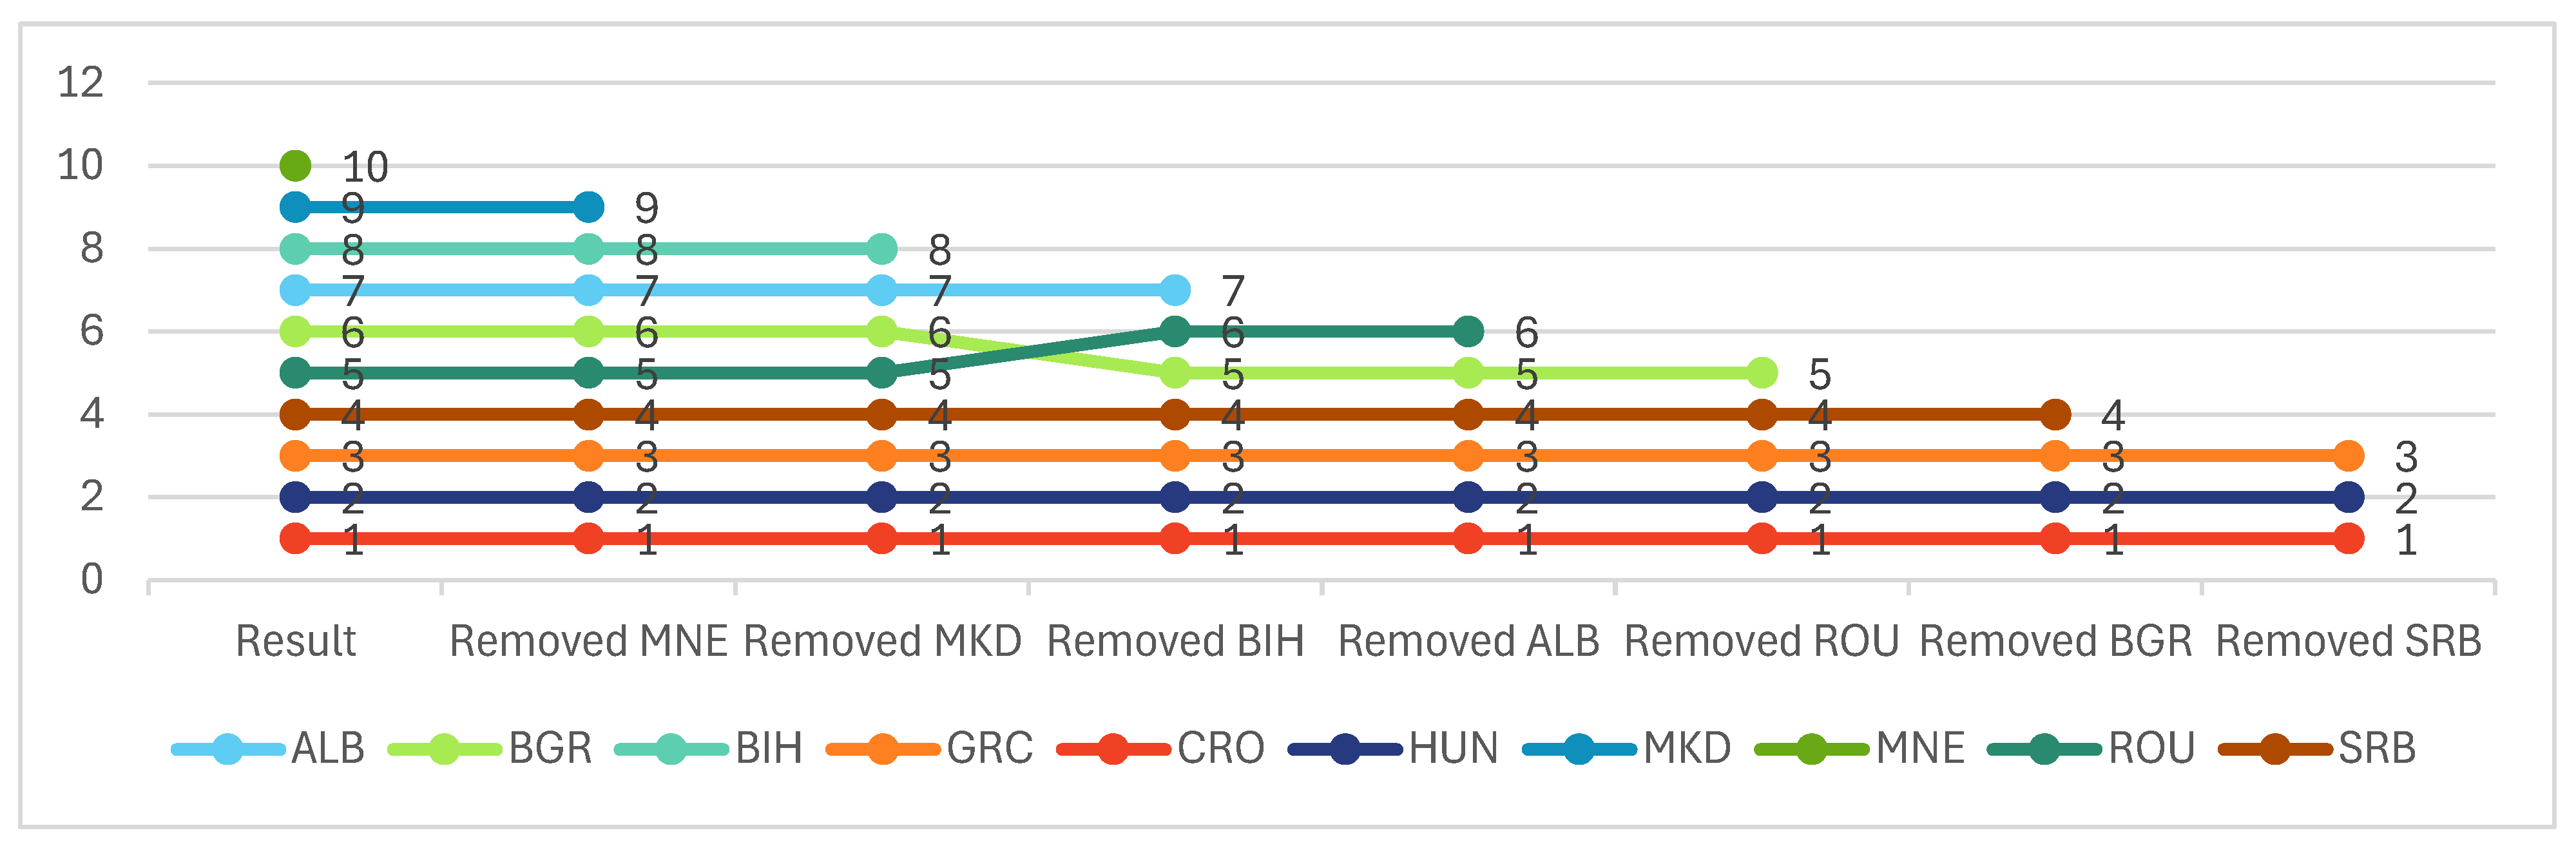

Table 1.
The Steps of the Metods in the Hybrid εLεR Model.
| Criterion Weights Methods (3L)εL | Ranking Methods (3R)εR |
|
LOPCOW (LOgarithmic Percentage Change-driven Objective Weighting) |
RAFSI (Ranking of Alternatives through Functional mapping of criterion sub-intervals into a Single Interval) |
| Step 1: Create the decision matrix | Step 18: Identify ideal and anti-ideal points |
| Step 2: Normalize the matrix | Step 19: Map values into defined intervals |
| Step 3: Calculate percentage values per criterion | Step 20: Compute arithmetic and harmonic means |
| Step 4: Derive the weights [44] | Step 21: Normalize the data |
|
LMAW (Logarithm Methodology of Additive Weights) |
Step 22: Calculate criteria-based functions for alternatives [47] |
| Step 5: Create the decision matrix |
RAPS (Ranking Alternatives by Perimeter Similarity) |
| Step 6: Compute preliminary weight coefficients | Step 23: Create the decision matrix |
| Step 7: Normalize the matrix | Step 24: Normalize the matrix |
| Step 8: Identify the anti-ideal solution | Step 25: Apply weights |
| Step 9: Define the priority vector | Step 26: Define the ideal solution |
| Step 10: Calculate final weights | Step 27: Segment and measure alternative perimeters |
| Step 11: Generate the weighted matrix [45] | Step 28: Score the alternatives |
|
LBWA (Level Based Weight Assesment) |
Step 29: Rank based on scores [48] |
| Step 12: Identify the most significant criterion |
RAWEC (Ranking of Alternatives with WEights of Criterion) |
| Step 13: Group criteria by importance level | Step 30: Create decision matrix |
| Step 14: Perform pairwise comparisons | Step 31: Normalize the matrix |
| Step 15: Define the comparison scale and elasticity coefficient | Step 32: Calculate the deviation from the criterion weight |
| Step 16: Calculate influence functions | Step 33: Rank the alternatives based on their performance scores [49] |
| Step 17: Derive optimal weight coefficients [46] |
Table 2.
Balkan Countries (2023).
| CODE | Country | SDG Index | Population |
GDP (mio. EUR) |
GDP per person |
Greenhouse Gases (Kg per capita) |
Persons at risk of poverty or social exclusion (percentage) |
| ALB | Albania | 75,0 | 2,761,785 | 21,782.2 | 7,887 | NA | NA |
| BGR | Bulgaria | 75,5 | 6,447,710 | 94,709.3 | 14,689 | 6,634 | 30.0 |
| BIH | Bosnia and Herzegovina | 74,0 | 3,441,194 | 25,523.8 | 7,417 | NA | NA |
| GRC | Greece | 78,7 | 10,413,982 | 225,196.9 | 21,624 | 6,428 | 26.1 |
| CRO | Croatia | 82,2 | 3,850,894 | 78,048.5 | 20,268 | 4,515 | 20.7 |
| HUN | Hungary | 79,5 | 9,599,744 | 196,639.0 | 20,484 | 4,806 | 19.7 |
| MKD | North Macedonia | 73,8 | 1,829,954 | 14,582.7 | 7,969 | NA | 32.6 (2020) |
| MNE | Montenegro | 73,1 | 616,695 | 6,963.6 | 11,292 | NA | 34.1 |
| ROU | Romania | 76,7 | 19,054,548 | 324,368.6 | 17,023 | 4,660 | 32 (2022) |
| SRB | Serbia | 77,0 | 6,641,197 | 75,204.0 | 11,324 | NA | 28.1 (2022) |
| TOTAL (or Average) | 64,657,703 | 1,063,019 | 16,441 | 5,409 | 26 | ||
| EU Total (or Average) | 448,803,078 | 17,197,821.5 | 38,319 | 5,965 | 21.3 | ||
| Percent of the EU | 0.14 | 0.06 | 0.43 | 0.91 | 1.23 |
Source: Eurostat. https://ec.europa.eu/eurostat/web/main/data/database (March 12, 2025) and Sachs, J. D., Lafortune, G., & Fuller, G. (2024). The SDGs and the UN Summit of the Future. Sustainable Development Report 2024. Dublin: Dublin University Press. https://doi. org/10.25546/108572 (Sustainable Development Report 2024).
Table 3.
SDG Index (Report) Scores of the Balkan Countries (2023).
| SDGs | G1 | G2 | G3 | G4 | G5 | G6 | G7 | G8 | G9 | G10 | G11 | G12 | G13 | G14 | G15 | G16 | G17 |
|---|---|---|---|---|---|---|---|---|---|---|---|---|---|---|---|---|---|
| Country | Max | Max | Max | Max | Max | Max | Max | Max | Max | Max | Max | Max | Max | Max | Max | Max | Max |
| ALB | 99 | 58 | 82 | 91 | 58 | 75 | 88 | 64 | 48 | 92 | 89 | 79 | 90 | 49 | 82 | 62 | 68 |
| BGR | 99 | 68 | 79 | 84 | 71 | 67 | 73 | 80 | 70 | 57 | 90 | 64 | 82 | 66 | 94 | 71 | 69 |
| BIH | 100 | 71 | 75 | 63 | 43 | 76 | 72 | 72 | 54 | 81 | 82 | 72 | 86 | 84 | 80 | 67 | 79 |
| GRC | 99 | 65 | 90 | 94 | 65 | 88 | 78 | 75 | 86 | 83 | 96 | 60 | 79 | 66 | 84 | 73 | 58 |
| CRO | 99 | 71 | 88 | 97 | 72 | 88 | 84 | 83 | 75 | 94 | 93 | 62 | 83 | 85 | 88 | 72 | 63 |
| HUN | 99 | 65 | 84 | 94 | 67 | 87 | 75 | 80 | 81 | 94 | 96 | 69 | 84 | 66 | 86 | 70 | 54 |
| MKD | 97 | 59 | 80 | 67 | 56 | 71 | 72 | 68 | 58 | 80 | 90 | 79 | 89 | 66 | 79 | 70 | 73 |
| MNE | 99 | 60 | 76 | 89 | 53 | 65 | 80 | 63 | 63 | 73 | 90 | 70 | 91 | 55 | 59 | 71 | 83 |
| ROU | 99 | 64 | 81 | 79 | 53 | 77 | 79 | 78 | 71 | 82 | 90 | 70 | 87 | 87 | 78 | 77 | 52 |
| SRB | 99 | 73 | 82 | 86 | 62 | 77 | 75 | 79 | 71 | 77 | 86 | 85 | 84 | 66 | 66 | 66 | 76 |
| Max | 100 | 73 | 90 | 97 | 72 | 88 | 88 | 83 | 86 | 94 | 96 | 85 | 91 | 87 | 94 | 77 | 83 |
| Min | 97 | 58 | 75 | 63 | 43 | 65 | 72 | 63 | 48 | 57 | 82 | 60 | 79 | 49 | 59 | 62 | 52 |
Source: Sachs, J. D., Lafortune, G., & Fuller, G. (2024). The SDGs and the UN Summit of the Future. Sustainable Development Report 2024. Dublin: Dublin University Press. https://doi. org/10.25546/108572 (Sustainable Development Report 2024).
Table 4.
Criteria Weights- eL.
| W LOPCOW | Rank | W LMAW | Rank | W LBWA | Rank | W εL | Rank | |
| Weight | 33,33% | 33,33% | 33,33% | 100% | ||||
| G1 | 0,0909 | 1 | 0,0741 | 2 | 0,0978 | 2 | 0,0876 | 1 |
| G2 | 0,0459 | 15 | 0,0745 | 1 | 0,1075 | 1 | 0,0760 | 2 |
| G3 | 0,0463 | 14 | 0,0717 | 4 | 0,0597 | 9 | 0,0593 | 8 |
| G4 | 0,0674 | 5 | 0,0723 | 3 | 0,0489 | 10 | 0,0629 | 6 |
| G5 | 0,0674 | 6 | 0,0529 | 12 | 0,0448 | 12 | 0,0551 | 11 |
| G6 | 0,0477 | 13 | 0,0709 | 5 | 0,0827 | 4 | 0,0671 | 3 |
| G7 | 0,0316 | 17 | 0,0532 | 11 | 0,0768 | 5 | 0,0539 | 12 |
| G8 | 0,0526 | 11 | 0,0672 | 6 | 0,0326 | 13 | 0,0508 | 13 |
| G9 | 0,0567 | 9 | 0,0604 | 9 | 0,0316 | 14 | 0,0496 | 15 |
| G10 | 0,0789 | 2 | 0,0623 | 8 | 0,0468 | 11 | 0,0626 | 7 |
| G11 | 0,0677 | 4 | 0,0453 | 16 | 0,0633 | 8 | 0,0587 | 9 |
| G12 | 0,0452 | 16 | 0,0551 | 10 | 0,0896 | 3 | 0,0633 | 5 |
| G13 | 0,0620 | 8 | 0,0484 | 14 | 0,0307 | 15 | 0,0470 | 16 |
| G14 | 0,0545 | 10 | 0,0461 | 15 | 0,0672 | 7 | 0,0559 | 10 |
| G15 | 0,0721 | 3 | 0,0494 | 13 | 0,0717 | 6 | 0,0644 | 4 |
| G16 | 0,0649 | 7 | 0,0626 | 7 | 0,0239 | 17 | 0,0505 | 14 |
| G17 | 0,0481 | 12 | 0,0305 | 17 | 0,0244 | 16 | 0,0344 | 17 |
W: Weight (significance) of criterion (SDG). RANK: Ranking of Criterion.
Table 5.
SDG Ranking of the Balkan Countries.
| Country | RAFSI Score | Rank | RAPS Score | Rank | RAWEC Score | Rank | eLeR Score | FINAL RANK |
| Weight | 33,33% | 33,33% | 33,33% | 100,00% | ||||
| CRO | 0.68 | 1 | 0.95 | 1 | 0.89 | 1 | 0.84 | 1 |
| HUN | 0.60 | 2 | 0.93 | 2 | 0.83 | 2 | 0.79 | 2 |
| GRC | 0.58 | 3 | 0.92 | 3 | 0.81 | 3 | 0.77 | 3 |
| SRB | 0.54 | 4 | 0.90 | 4 | 0.77 | 4 | 0.74 | 4 |
| ROU | 0.53 | 5 | 0.89 | 5 | 0.76 | 5 | 0.73 | 5 |
| BGR | 0.48 | 7 | 0.88 | 6 | 0.74 | 6 | 0.70 | 6 |
| ALB | 0.48 | 6 | 0.88 | 7 | 0.72 | 7 | 0.69 | 7 |
| BIH | 0.46 | 8 | 0.87 | 8 | 0.70 | 8 | 0.67 | 8 |
| MKD | 0.42 | 10 | 0.85 | 9 | 0.69 | 9 | 0.65 | 9 |
| MNE | 0.42 | 9 | 0.84 | 10 | 0.66 | 10 | 0.64 | 10 |
Note: 2,4,6,8th columns show the performance scores calculated by each method, and the “Rank” columns show the performance rankings of the countries based on the performance scores. A higher performance score indicates a lower ranking count.
Table 6.
w1-Sensitivity Analysis-Varying weights.
| set1 | set2 | set3 | set4 | set5 | … | set17 | set18 | set19 | set20 | |
| G1 | 0.083 | 0.079 | 0.074 | 0.070 | 0.066 | … | 0.013 | 0.009 | 0.004 | 0.000 |
| G2 | 0.076 | 0.077 | 0.077 | 0.077 | 0.078 | … | 0.082 | 0.083 | 0.083 | 0.083 |
| G3 | 0.060 | 0.060 | 0.060 | 0.060 | 0.061 | … | 0.064 | 0.064 | 0.065 | 0.065 |
| G4 | 0.063 | 0.063 | 0.064 | 0.064 | 0.064 | … | 0.068 | 0.068 | 0.069 | 0.069 |
| G5 | 0.055 | 0.056 | 0.056 | 0.056 | 0.056 | … | 0.060 | 0.060 | 0.060 | 0.060 |
| G6 | 0.067 | 0.068 | 0.068 | 0.068 | 0.069 | … | 0.073 | 0.073 | 0.073 | 0.074 |
| G7 | 0.054 | 0.054 | 0.055 | 0.055 | 0.055 | … | 0.058 | 0.059 | 0.059 | 0.059 |
| G8 | 0.051 | 0.051 | 0.052 | 0.052 | 0.052 | … | 0.055 | 0.055 | 0.055 | 0.056 |
| G9 | 0.050 | 0.050 | 0.050 | 0.051 | 0.051 | … | 0.054 | 0.054 | 0.054 | 0.054 |
| G10 | 0.063 | 0.063 | 0.064 | 0.064 | 0.064 | … | 0.068 | 0.068 | 0.068 | 0.069 |
| G11 | 0.059 | 0.059 | 0.060 | 0.060 | 0.060 | … | 0.064 | 0.064 | 0.064 | 0.064 |
| G12 | 0.064 | 0.064 | 0.064 | 0.065 | 0.065 | … | 0.068 | 0.069 | 0.069 | 0.069 |
| G13 | 0.047 | 0.047 | 0.048 | 0.048 | 0.048 | … | 0.051 | 0.051 | 0.051 | 0.052 |
| G14 | 0.056 | 0.056 | 0.057 | 0.057 | 0.057 | … | 0.060 | 0.061 | 0.061 | 0.061 |
| G15 | 0.065 | 0.065 | 0.065 | 0.066 | 0.066 | … | 0.070 | 0.070 | 0.070 | 0.071 |
| G16 | 0.051 | 0.051 | 0.051 | 0.051 | 0.052 | … | 0.055 | 0.055 | 0.055 | 0.055 |
| G17 | 0.035 | 0.035 | 0.035 | 0.035 | 0.035 | … | 0.037 | 0.037 | 0.037 | 0.038 |
| SUM | 1.00 | 1.00 | 1.00 | 1.00 | 1.00 | … | 1.00 | 1.00 | 1.00 | 1.00 |
Table 7.
Criteria Rankings of the MCDM Weight Methods.
| Criteria | eL Model | WENSLO | ENTROPY | CRITIC | MEREC | SD |
| G1 | 1 | 17 | 17 | 16 | 16 | 17 |
| G2 | 2 | 11 | 11 | 4 | 10 | 3 |
| G3 | 8 | 14 | 14 | 17 | 13 | 10 |
| G4 | 6 | 5 | 6 | 10 | 6 | 5 |
| G5 | 11 | 6 | 4 | 13 | 2 | 12 |
| G6 | 3 | 9 | 9 | 9 | 8 | 2 |
| G7 | 12 | 12 | 12 | 6 | 15 | 7 |
| G8 | 13 | 10 | 10 | 7 | 9 | 1 |
| G9 | 15 | 2 | 2 | 14 | 4 | 9 |
| G10 | 7 | 4 | 5 | 11 | 1 | 13 |
| G11 | 9 | 15 | 15 | 15 | 12 | 14 |
| G12 | 5 | 8 | 8 | 2 | 7 | 8 |
| G13 | 16 | 16 | 16 | 3 | 14 | 11 |
| G14 | 10 | 1 | 1 | 5 | 3 | 6 |
| G15 | 4 | 7 | 7 | 8 | 5 | 15 |
| G16 | 14 | 13 | 13 | 12 | 16 | 16 |
| G17 | 17 | 3 | 3 | 1 | 11 | 4 |
Table 8.
Rankings of Different Methods.
| REPORT | εLεR | CoCoSo | TOPSIS | EDAS | ARAS | COPRAS | |
| ALB | 7 | 7 | 8 | 7 | 7 | 7 | 7 |
| BGR | 6 | 6 | 6 | 6 | 6 | 6 | 6 |
| BIH | 8 | 8 | 10 | 8 | 8 | 8 | 8 |
| GRC | 3 | 3 | 4 | 3 | 3 | 3 | 3 |
| CRO | 1 | 1 | 1 | 1 | 1 | 1 | 1 |
| HUN | 2 | 2 | 2 | 2 | 2 | 2 | 2 |
| MKD | 9 | 9 | 7 | 9 | 9 | 9 | 9 |
| MNE | 10 | 10 | 9 | 10 | 10 | 10 | 10 |
| ROU | 5 | 5 | 5 | 5 | 5 | 5 | 5 |
| SRB | 4 | 4 | 3 | 4 | 4 | 4 | 4 |
Table 9.
Correlation Between εLεR Model, Report and MCDM Rankings.
| Report | εLεR | CoCoSo | TOPSIS | EDAS | ARAS | COPRAS | |
| Report | 1 | ||||||
| εLεR | 1 | 1 | |||||
| CoCoSo | 0.927273 | 0.927273 | 1 | ||||
| TOPSIS | 1 | 1 | 0.927273 | 1 | |||
| EDAS | 1 | 1 | 0.927273 | 1 | 1 | ||
| ARAS | 1 | 1 | 0.927273 | 1 | 1 | 1 | |
| COPRAS | 1 | 1 | 0.927273 | 1 | 1 | 1 | 1 |
Table 10.
The Rank Reversal Issue.
| Scenarios | Ranking | Best Perf. | Worst Perf. |
| eLeR Result | CRO>HUN>GRC>SRB>ROU>BGR>ALB>BIH>MKD>MNE | CRO | MNE |
| Removed MNE | CRO>HUN>GRC>SRB>ROU>BGR>ALB>BIH>MKD | CRO | MKD |
| Removed MKD | CRO>HUN>GRC>SRB>ROU>BGR>ALB>BIH | CRO | BIH |
| Removed BIH | CRO>HUN>GRC>SRB>BGR>ROU>ALB | CRO | ALB |
| Removed ALB | CRO>HUN>GRC>SRB>BGR>ROU | CRO | ROU |
| Removed ROU | CRO>HUN>GRC>SRB>BGR | CRO | BGR |
| Removed BGR | CRO>HUN>GRC>SRB | CRO | SRB |
| Removed SRB | CRO>HUN>GRC | CRO | GRC |
Disclaimer/Publisher’s Note: The statements, opinions and data contained in all publications are solely those of the individual author(s) and contributor(s) and not of MDPI and/or the editor(s). MDPI and/or the editor(s) disclaim responsibility for any injury to people or property resulting from any ideas, methods, instructions or products referred to in the content. |
© 2025 by the authors. Licensee MDPI, Basel, Switzerland. This article is an open access article distributed under the terms and conditions of the Creative Commons Attribution (CC BY) license (http://creativecommons.org/licenses/by/4.0/).
Copyright: This open access article is published under a Creative Commons CC BY 4.0 license, which permit the free download, distribution, and reuse, provided that the author and preprint are cited in any reuse.


