
Submitted:
06 June 2025
Posted:
10 June 2025
You are already at the latest version
Abstract
At the Politecnica Salesiana University (UPS) in Guayaquil, Ecuador, urban mobility challenges were addressed in order to improve quality of life and promote sustainability. The feasibility of implementing a shared transportation system for students was evaluated using a quantitative and descriptive approach. To this end, data on the transportation habits of a representative sample of 256 students were collected and analyzed using surveys. The methodology included the use of the deductive method to approach the mobility problem from a general perspective to the specific, and the analytical method to identify causes and effects related to such habits. An exhaustive theoretical review was also conducted and surveys were used to collect quantitative data describing the current state of transportation. The study route was designed using ArcGIS software, while initial and recurrent costs were calculated using Microsoft Excel. Social impact was assessed through focus groups and analysis of demographic and socioeconomic data. Preliminary findings revealed significant difficulties in student mobility, suggesting that ridesharing is not only financially viable, but also widely accepted due to its ability to save time and reduce stress.
Keywords:
Shared transportation
; Methodology
; Innovation
; Academic Environments
1. Introduction
Traffic congestion in Guayaquil represents a significant problem affecting both residents and visitors to the city [1]. The increasing number of vehicles in circulation has led to main arteries and secondary streets experiencing heavy traffic for much of the day, especially during rush hour [2]. This congestion not only delays travel time and increases stress levels among drivers and passengers, but also contributes to environmental pollution and degradation of air quality [3]. In addition, heavy traffic negatively impacts the efficiency of public and private transportation, increasing operating costs and reducing the overall productivity of the city. As Guayaquil continues to grow, the need for effective solutions to mitigate traffic congestion becomes increasingly urgent, requiring a combination of infrastructure improvements, sustainable transport policies and the promotion of alternatives such as ride-sharing.
E-commerce has been evolving more and more, because the business world moves so fast that companies must always be up to date with new technologies and trends to stay competitive [4]. In this circumstance, mobility solutions and reducing traffic congestion are not only important to improve the quality of life of students, but also to facilitate economic development and the growth of e-commerce in the city, since efficient transportation can reduce travel time and optimize the supply chain. The Politecnica Salesiana University (UPS) in Guayaquil faces a significant challenge in relation to the mobility of its students [5]. Vehicle congestion in the city, especially during rush hour,makes it difficult for students to get to campus in a timely manner, affecting their punctuality and participation in academic activities [6]. This situation not only generates stress and loss of time, but can also negatively impact their academic performance [7].
The study evaluated the feasibility of shared transportation using a quantitative and descriptive approach, applying surveys to a representative sample of 256 students to analyze their transportation habits. The sample was selected from a total population of 4,123 students from morning and evening shifts, using stratified sampling. Routes were designed using ArcGIS software, while initial and recurring costs were calculated using Microsoft Excel. Social impact was also assessed through focus groups and analysis of demographic and socioeconomic data. Furthermore, travel time on public transport and the lack of accessible alternatives exacerbate the problem, limiting mobility options for many students [8]. Those who rely on urban transport face long and unsafe routes, which increases their vulnerability and reduces their quality of life [9]. The lack of an efficient and safe transport system creates additional barriers to accessing higher education, especially for low-income students [10].
2. Materials and Methods
The shared transportation system proposal was defined as a solution to improve student mobility at the Universidad Politécnica Salesiana (UPS), Guayaquil campus. The shared transportation system, also known as "carpooling", aims to optimize student travel through the joint use of vehicles, thus reducing the number of cars in circulation, minimizing transfer times and decreasing traffic congestion. Therefore, in this type of research section, quantitative research is included, used to collect numerical and statistical data on students’ transportation habits, associated costs and their willingness to participate in a shared transportation system. Likewise, descriptive research provides a detailed description of the current state of transportation at the university and the city of Guayaquil, identifying problems and opportunities to improve the transportation system through the implementation of shared transportation or also called Carpooling [11].
Regarding the research methods, the deductive method is used to analyze the problem from the general to the specific, providing a complete view of mobility to the Salesian Polytechnic University (UPS). The analytical method focuses on breaking down the problem into its constituent parts to identify underlying causes and effects. In addition, a thorough theoretical review of relevant literature was carried out to collect information. Finally, the descriptive method was used to systematically collect and process data, guaranteeing a clear and precise synthesis of the findings. In Figure 1, the systematization of processes is presented to fulfill the research topic, detailing each stage necessary to achieve an effective implementation of the shared transportation system at the Politecnica Salesiana University, Guayaquil campus. This comprehensive approach will ensure that all relevant aspects are considered and addressed efficiently.
2.1. Study Area
The Politecnica Salesiana University, Guayaquil campus, Centenario campus, has been selected as the specific site for conducting surveys and implementing the pilot plan within the framework of this research.
2.2. Population
To assess the demand for transportation on the Centenario campus of Politecnica Salesiana University, a representative sample of 4,123 individuals from the morning and evening academic sections was selected, including exclusively students. This approach ensured a comprehensive and varied analysis of university transportation needs, facilitating a comprehensive understanding of the magnitude and scope of the challenge.
2.3. Sample Size
Determining the sample size involves providing data specific to the population under study. To do this, a specialized formula is used to calculate the appropriate sample size, as described in the research on sample calculation in education [12].
The sample size was determined using the calculation method that considers the following equation.
| n: Sample size |
| N: 4123 Population size |
| : 1.65 Confidence (90%) Coefficient (1.65) |
| P: 0.5 Probability of occurrence (50%) |
| Q: 0.5 Probability of failure (1-p) |
| D: 0.05 Precision, maximum admissible error values between 1% and 9% |
Once the application of the specified equation was carried out, the following result was obtained:
It is established that the population to be surveyed corresponds to 256 people.
2.4. Stratified Sampling
As mentioned by Otzen [13] the stratum composes the target population to select and extract representative samples from each of them. Therefore, this type of sampling was used to determine the number of people to be surveyed in each section, as detailed in Table 1. To do this, the following calculation was performed using the following equation:
Where:
ni = Sample size of each stratum
Ni = Population of each stratum
n = Sample size
N = Total Sample size
The calculation was performed by stratum to determine the number of students to be surveyed on each day of the class. This allows for an accurate and equitable representation of each group, ensuring that the results adequately reflect the characteristics and opinions of the students.
According to Bauce [14], the operationalization of variables is the process of converting abstract concepts into concrete and observable measures. It serves to clearly define what is being measured and how it is being measured, which facilitates the reproducibility of studies, increases objectivity in the interpretation of the results, and facilitates statistical analysis. Therefore, Table 2 details the variables that were identified according to each of the objectives.
2.5. Data Collection
2.5.1. Evaluate the Technological Needs for the Implementation of the Shared Transportation System
For the development of a mobile ride-sharing application, it is crucial to choose frameworks that are robust, easy to use, and offer the necessary functionalities for an academic environment. The following in Table 3 are the three main frameworks to be evaluated:
2.5.1.1. Defining Evaluation Criteria
Defining evaluation criteria is conclusive because it provides an objective and structured basis for making informed decisions. These criteria allow identifying and prioritizing the specific needs of the project, ensuring that the selected framework is aligned with the technical, operational and strategic requirements [18]. In addition, an evaluation based on clear criteria helps anticipate potential challenges, optimize resources and maximize development performance and efficiency [19], the following criteria should be followed:
- Compatibility: This criterion refers to the framework’s ability to develop apps that run efficiently on both iOS and Android from a single codebase. Cross-platform support ensures that you can reach the widest possible audience without duplicating development and maintenance efforts.
- Performance and efficiency: This criterion evaluates how well the framework can create applications that run quickly and efficiently, optimally using device resources (memory, CPU, battery). Good performance is crucial for a smooth and satisfying user experience, especially in applications that require real-time access to data and geolocation.
- Ease of use and learning: This criterion analyzes how easy it is for developers to learn and use the framework. This includes the availability of documentation, learning resources, and the learning curve associated with the framework. A framework that is easy to learn and use can significantly reduce development time and facilitate long-term maintenance.
- Access to native functionalities: This criterion focuses on the framework’s ability to access and use native mobile device functionalities such as GPS, camera, push notifications, sensors, and more. Efficient access to these functionalities is essential for ridesharing applications that rely heavily on geolocation and real-time interaction with the user’s device.
- Stability and maintenance: This criterion evaluates how well the framework supports the growth of the application in terms of functionality and user base, and the ease with which the application can be maintained and updated over time. A scalable and maintainable framework ensures that the application can continually evolve and improve without facing significant performance or compatibility issues.
2.5.2. Cost Estimate for the Implementation of the Carpooling System
2.5.2.1. Identification of project modules
- Developing a ride-sharing app requires a modular architecture to deliver a seamless, efficient, and secure user experience. Each module plays a crucial role in providing end-to-end services to users and administrators. The key modules are summarized below:
- User profile: facilitates the management of personal information, travel history and preferences, improving personalization and data management.
- Trip Booking: Allows you to select pickup points, schedule trips, choose vehicles, and get trip details, offering a convenient booking experience.
- Real-time tracking: reports the location of the vehicle on a map in real time and allows communication between user and driver.
- Payment and Billing: Supports multiple payment methods, automatically calculates fees, and generates detailed invoices, ensuring transparent transactions.
- Notifications: Keep users informed with real-time notifications about bookings, trip status, and promotions.
- Rating and feedback: Allows users to rate their experience and leave comments to improve the quality of service.
- Administration and support: offers a control panel to manage users, drivers, vehicles and reservations, as well as customer support.
- Analytics and Reporting: Provides tools to analyze usage data and generate reports for strategic decisions and efficient management.
- Integrations: supports integration with external APIs and services, facilitating expansion and adaptation to new technological functionalities.
2.5.3. Social Impact of the Implementation of the Transport System Shared
To obtain real data, a survey was applied, as shown in Appendix A.1, directed at 256 students from the Centenario campus of the Politecnica Salesiana University, Guayaquil headquarters.
2.5.4. Evaluate the Convenience of Implementing a Pilot Plan
The assessment of the technical, economic and social feasibility of implementing a shared transport pilot scheme was essential to ensure the success and sustainability of the project in the study area. In terms of technical feasibility, a detailed analysis of the existing road infrastructure, the availability of vehicles and drivers, as well as the operational capacity to efficiently manage shared transport was carried out. This analysis made it possible to ensure that the pilot scheme could be implemented in a practical and effective manner, minimising potential obstacles and optimising its operation.
3. Results
3.1. Technological Needs
To make a comparison between React Native, Flutter, and Ionic based on the five previously defined criteria, a score of 1 to 5 is used for each criterion. A score of 1 indicates that the framework minimally meets the criterion, while a score of 5 indicates that it meets it excellently, as shown in Table 4.
3.1.1. Criterion Comparison Summary Between React Native Flutter and Ionic
The benchmarking conducted between React Native, Flutter, and Ionic frameworks revealed significant differences in terms of compatibility, performance, ease of use, access to native features, and scalability. Flutter emerged as the most robust framework, scoring the highest overall score of 24 points, particularly in performance and scalability, suggesting it was best suited for developing efficient and scalable applications across multiple platforms. React Native, with an overall score of 22, demonstrated solid performance across all categories, presenting itself as a competitive option for its access to native features and ease of use. Ionic, although scoring a lower overall score of 20, was considered viable for projects requiring rapid prototyping and a less steep learning curve, especially for applications that did not demand high performance, as shown in Table 5.
3.2. Project Cost
This process involves a detailed analysis of the resources required, the estimated development time, and the costs associated with the use of specific technologies and tools. Below is the cost of each module of the system, using the Flutter framework, which covers software development and infrastructure, for which the following items are considered, as shown in Table 6.
3.2.1. Operating Costs for the Operation of the Transport System Shared
To ensure that the mobile ride-hailing app works for 4123 users, it is crucial to consider the expenditures on technologies that will ensure the performance, security, and scalability of the system. The following are the technological expenditures.
Cloud Infrastructure
- Servers and Storage: $500/month
- Network Services (CDN, DNS): $200/month
- APIs and External Services: $4,585/month
- Total Cloud Infrastructure: $5,285/month
Security and Backup
- Security Services: $250/month
- Backup and Data Recovery Solutions:$200/month
- Total Security and Backup: $450/month
Technological Monitoring and Maintenance
- Performance Monitoring Tools: $250/month
- Maintenance and Technical Support Services: $400/month
- Total, Monitoring and Maintenance: $650/month
3.3. Analysis of the Social Impact of the Implementation of the Shared Transport System
To determine the reliability of the survey, the Minitab program was used to calculate the reliability coefficient, also known as Cronbach’s alpha. The result obtained was a value of 0.9235 as observed in Equation 2, and in the same way, Table 7. details the statistics of elements that must be omitted to increase the value of Cronbach’s alpha. According to what Toro [20] mentioned, for the survey to be reliable, Cronbach’s alpha must have a value equal to or greater than 0.7.
Subsequently, a test route was established that goes from the Politecnica Salesiana University to Durán canton and, subsequently, to Samborondón and different points within the canton. The travel time between these points was measured and the students’ satisfaction with the service was evaluated with a survey, as detailed in the Appendix A.3.
3.3.1. Survey Results
The results of the surveys applied are detailed below:
-
Indicate the university campus in Guayaquil that you attend.100% of the students surveyed came from the Centenario campus. This sample exclusively reflects the opinion and situation of the students of this campus, ensuring that the results are representative of this specific population.
-
Indicate your gender.20% of respondents identified as women and 80% as men. This data highlights the gender distribution among survey participants, providing a clear perspective on the representation of each gender in the study and allowing for a more accurate analysis of the needs and opinions of each group.
-
Have you heard about car sharing?50.8% of respondents indicated that they do have knowledge or experience with car sharing, while 49.2% indicated that they do not.
-
Would you prefer to share a vehicle with men, women, or both?74.6% of the people surveyed expressed their willingness to share a vehicle with people of both genders, that is, with both men and women. 20.4% indicated that they would prefer to share a vehicle with men, women, or both. only with women, while a minority of 5with men.
-
Please indicate your UPS entry times.The data collected in the survey showed that 39.45% of students enter classes at 6:00 PM, which is the busiest time. On the other hand, 21.09% of students enter at 7:00 AM, while only 3.91% do so at 2:00 PM. These results reflect a clear preference for evening schedules, which could have significant implications for the organization and demand of services such as shared transportation, especially during the afternoon rush hours, as evidenced in Figure 2.
-
Please indicate your current academic level (please indicate the lowest level you are currently studying).The highest student demand are the first, fifth, sixth and seventh, respectively. In contrast, the other semesters show significantly lower participation, with the ninth semester registering one of the lowest percentages, not exceeding 2%.
-
Please indicate your academic schedule.In the survey, 61.7% of the students surveyed belong to the evening section, while 38.3% belong to the morning section.
- Please indicate what range of your cell phone you have. 34.2% of students reported owning a mid-range phone, while 30.8% used a mid-high range phone. 15.4% owned a high-end phone, 13.8% used a low-mid range device, and 5.8% owned a lowend phone. These data reflect a variety in the types of devices students use, which could influence their access to digital apps and services.
-
What is the main type of internet access you use?The main method of accessing the Internet used by students at the Salesian Polytechnic University is Wi-Fi. 60.4% of students connect to the Internet through this network, while 39.6% use mobile data.
-
During the study week, what type of transportation do you mainly use to get to your destination?During the study week, 31.4% of students use the Metrovía means of transport, 30.3% use private vehicles, 18.4% travel by city bus, 10.3% use taxis and 9.7% opt for other types of transport.
-
What would be your main reason for choosing ridesharing over other forms of transportation?Students indicated that 25.2% would be willing to use the shared transport system mainly for cost reasons, 25% would do so for convenience, 18.5% would value the reduction in travel time, 6.4% would favor the environmental impact, and 24.9% for safety reasons.
-
Would you be willing to participate in a pilot plan for a shared transportation system?Regarding willingness to participate in a pilot plan for a shared transportation system, 82.7% of students said they were willing to participate, while 17.3% indicated they would not be interested.
3.4. Interview with Students to Assess the Convenience of Applying the Pilot Plan
An interview was conducted with 11 randomly selected students using convenience sampling [13]. This survey was conducted with the aim of designing the path to implement the pilot plan. The interview questions are found in Appendix A.2.
-
Indicate your genderOf those surveyed, 18.2% said they were female, while 81.8they were male.
-
Have you had experience or knowledge about shared vehicles as sustainable mobility?Of the people interviewed, four mentioned that they have had some kind of experience with shared mobility, while seven said they had not, but that they are willing to participate in the pilot plan as a new experience.
-
Could you tell me in which canton your home is located?Of those interviewed, three mentioned that they belong to Durán and Samborondón, while five indicated that they belong to the Guayaquil canton.
3.4.1. Proposed Route for the Shared Transport System
The project consisted of establishing a shared transportation route that connects the cantons of Guayaquil, Durán and Samborondón. This route was designed with the aim of meeting the mobility demand of the students of the Polytechnica Salesiana University through the ArcGIS software, guaranteeing their safety and optimizing their travel time between these cantons.
For the implementation of the project, the Carpoolworld application was used as shown in Figure A1, through which students had to register. Once registered, they were assigned a vehicle that covered the aforementioned route. This shared mobility system not only facilitated the students’ travel, but also offered them a safe and efficient service, allowing them to save time on their daily trips, as shown in Figure A2 .
3.4.2. Safety of Journey
Travel safety using a shared transportation system between students from the same university offers several significant advantages. First, familiarity between students contributes to a safer and more trustworthy environment, as travelers are likely to know each other or have mutual friends, fostering an environment of trust and collaboration. These measures not only increase safety, but also offer peace of mind to both students and their families [21].
3.4.3. Travel Time
Travel time for students using a shared transportation system has been identified to be significantly reduced when they reside near established routes [22]. According to the survey results, 14.3% of participants said they were satisfied with the reduction in travel time, while 85.7% said they were completely satisfied, the travel time show in Table 8
3.4.4. Comfort
The people who participated in the pilot plan expressed their satisfaction with the new shared transport system, highlighting improvements compared to conventional means of transport (urban bus, metrovia). In contrast, the students expressed their dissatisfaction with traditional means of transport due to the uncomfortable seats and the poor condition of the vehicles, such as urban buses and metrovias.
According to a study by the World Health Organization (WHO),the quality of public transport can significantly affect users’ satisfaction and their perception of comfort [23]. The study highlights that poor vehicle condition and lack of comfort are key factors influencing users’ preference for more modern and efficient alternatives. This supports the need to improve the conditions of conventional public transport to better meet user expectations and reduce environmental impact, in case of this study, the vehicle used is shown in the Figure A3.
3.4.5. Costs
Although the cost of shared transport is higher than that of conventional transport (urban bus, metrovia), they are considered more favorable due to improvements in safety and comfort. According to a study by Prieto [24], users of shared transport systems often value the greater safety and comfort they offer. The culture of online payments in Ecuador is evolving, driving the growth and development of shared transport, even if the cost is higher [25]. The study points out that the perception of safety and comfort in shared transport is a determining factor in the choice of means of transport, especially in academic communities where trust and knowledge among passengers is greater. This academic support underlines the importance of the quality of the service in the user’s preference, justifying the additional cost based on the perceived benefits.
3.4.5.1. Tariff calculation
The base price, set by the driver, is static for each trip and is usually $0.75. In addition, for each kilometer of detour the driver makes to pick up or drop off a passenger, the fare increases by $0.40 per kilometer. Also, the distance traveled by the passenger with the driver generates an additional increase of $0.10 per kilometer. To calculate the rate to be charged, the following expenses were considered:
| Base price | $0.75 |
| Driver detour for drop users off per km | $0.40 |
| Cost per kilometer route | $0.10 |
Pricing is calculated on a personalized basis for each user, ensuring that everyone receives a fair rate.All these values were previously established, and the pilot plan was developed based on them. Therefore, a rate had to be calculated that would take into account all vehicle maintenance costs, as well as other additional costs. Below are the variables for the cost of travel for each of the users.
Table 9 reflects the estimated costs and profits for a trip involving different stops. The cost per detour, the distance traveled, the base price per passenger, and the total calculated for two passengers at each stop are considered. The stops include places such as the Naval Base, CC Riocentro, Duran-El Recreo, and Duran-Ciudadela Panorama, with distances ranging from 7.4 km to 17.1 km. The total cost per passenger varies by stop, with prices ranging from $2.10 to $2.86, and an estimated total profit of $12.81 for the entire trip. This information is useful for calculating the profitability of the trip by including variable costs based on distance and number of passengers.
Table 10 shows a detailed analysis of the monthly costs associated with the use and maintenance of a vehicle, considering both fuel consumption and other operating factors. Fixed expenses such as cleaning and oil changes are highlighted, which together with air conditioning maintenance represent a cost of $60 per month. In addition, the monthly fuel cost, calculated based on a consumption of 10.7 L/100 km and an estimated monthly travel distance of 440 km, amounts to $35.2. These expenses add up to a monthly total of $65.2, which excludes costs such as insurance, licenses, fines or parking, which in this case are assumed to be nil or nonexistent.
3.4.5.2. Cost - Income Ratio
4. Discussion
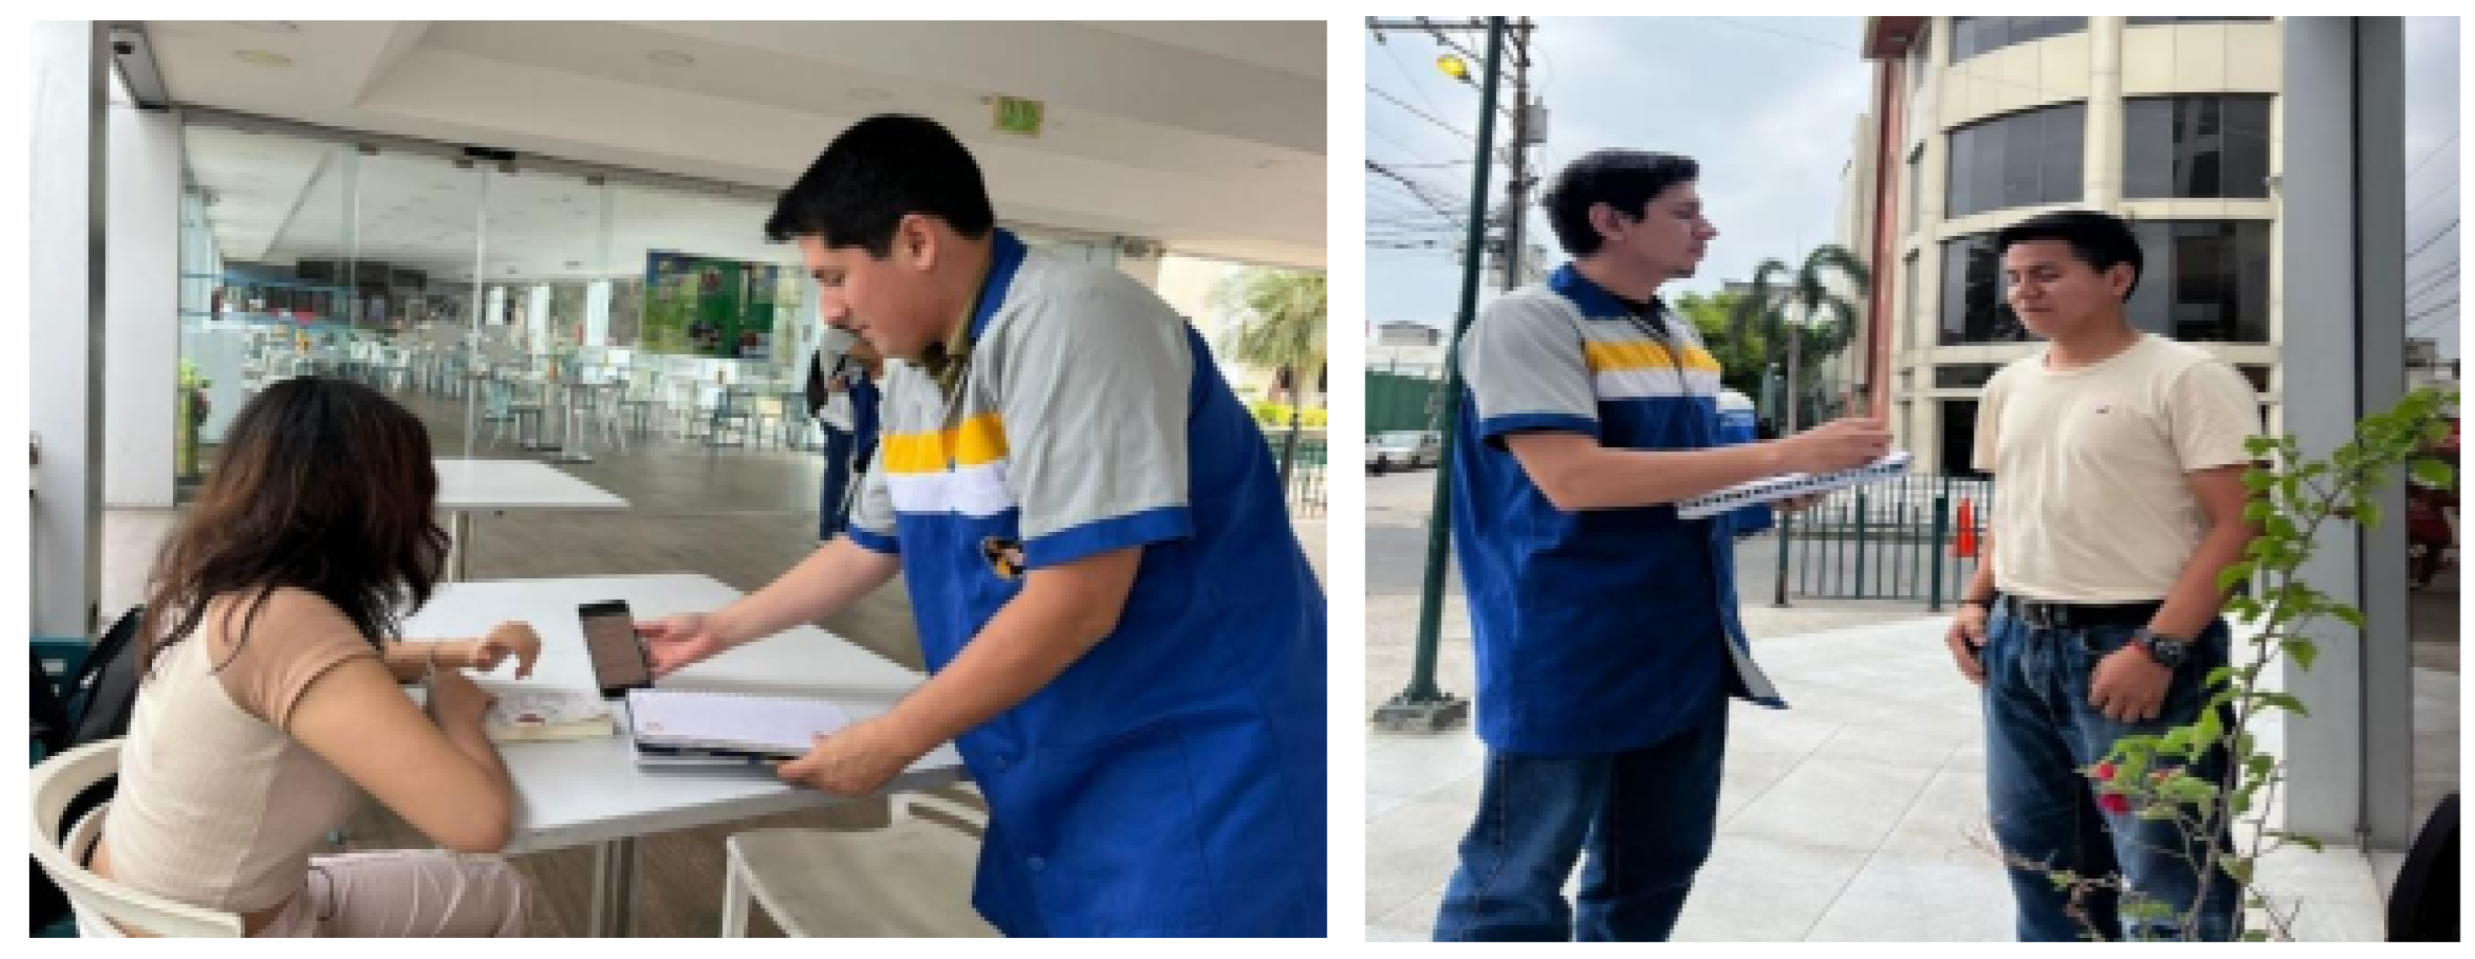
The high acceptance of students in participating in the shared transportation system for Politecnica Salesiana University students is evidenced by the high Cronbach’s alpha index obtained (0.9235), which indicates a high reliability in the surveys conducted. A Cronbach’s alpha greater than 0.9 reflects excellent internal consistency in the participants’ responses, which strengthens the validity of the results obtained in this study [26]. Surveys applied to 256 students at the Centenario campus (Figure A4) show high satisfaction with the shared transportation system, compared to conventional methods. User satisfaction with public transportation is closely linked to the perception of comfort and safety [27]. Students highlighted the greater safety and comfort of shared transportation, which supports the hypothesis that these factors are determinants in their preference for this system.
Interviews conducted with a group of students who participated in the pilot plan highlight that they feel safer traveling with peers from the same university. The perception of safety is essential in the choice of means of transportation, especially in community settings such as universities [28]. This aspect is fundamental to understand why students prefer shared transportation, despite a possible increase in cost. Although the cost of shared transport is higher than that of conventional transport (urban bus, metrovias), respondents consider that the additional benefits justify the extra expense. transport system users are willing to pay more for services that offer greater safety and comfort [28]. This finding is reflected in the responses of students, who value the improved quality of travel and the reduction of stress associated with traditional public transport and reduced travel time.
In a previous research, it was proposed the implementation of a transportation system adjusted to the schedules of greater demand and with routes designed to benefit the community, especially those residents outside the city, this measure sought to improve the movement of the university community both inside and outside Guayaquil [29]. Robert S. Kaplan [30] stresses the importance of understanding the relationship between costs and revenues to optimize profitability and improve organizational performance. In his work, Kaplan stresses that traditional cost systems are insufficient to reflect the complexity of modern operations. They propose the use of integrated costing systems, such as activity-based costing (ABC), which allow a more accurate allocation of costs to products or services.
5. Conclusions
According to the results obtained on the possible creation of the application, the React Native, Flutter and Ionic frameworks were evaluated using a comparative scale. These frameworks were analyzed according to evaluation criteria that included compatibility, performance, efficiency, ease of use and learning, access to native functionalities, stability and maintenance. Through this comparative scale, the features and advantages of each framework were verified, determining that Flutter obtained the highest score compared to its competitors, Ionic and React Native. For the demographic analysis, 256 surveys were conducted, distributed between 98 in the morning and 158 in the evening. These surveys allowed us to know the degree of satisfaction of students with conventional transportation services and their perception of the implementation of a shared transportation system among UPS students. The results showed that students were willing to support the creation of a shared transportation application, especially valuing safety, comfort and efficiency in travel times.
Based on the results of the surveys to implement the pilot plan, a route was proposed with a starting point at UPS and destination in Durán, Guayas, with three stops: Base Naval Norte, C.C. Riocentro, Durán - El Recreo, and Durán - Panorama. With the help of the carpooling application, user and driver profiles were created. The 6 participants showed satisfaction with the decrease in average travel time, improved comfort and safety compared to the use of conventional transportation (express, buses and subway). However, the students observed that the application used presented low ease of use and profile management. For participants whose stop was the Naval Base, travel time ranged from 10 to 15 minutes. For those who arrived at the Rio Centro Shopping Center, the estimated time was 20 to 25 minutes. Those who went to El Recreo took between 30 and 35 minutes, while those who arrived at Panorama needed between 40 and 45 minutes to complete the trip.
Among the characteristics mentioned by the participants, waiting for transportation, the number of stops made, and detours to drop off other students, especially on UPS-regulated express trains, were highlighted. These factors contribute to increased travel time, highlighting the feasibility of ridesharing as an effective solution. In order to optimize transportation routes, it was essential for students to adapt to the destinations set by the drivers. This adaptation helped to increase efficiency and reduce costs, as it was more economical for drivers to avoid significant detours or, ideally, not to make detours at all. These factors depended on the individual needs of each driver and the business model each driver wished to implement through ridesharing. In our research, it was observed that, although detours of a few kilometers were made, they decreased arrival time.
Despite the high acceptance by students, the administrative and maintenance costs are not significant, since the maintenance of the application during the first semester is minimal. Once the APP is developed, the only recurring costs will be monthly maintenance, necessary to familiarize users with the ridesharing system. It is recommended to create groups on platforms such as WhatsApp or Telegram to disseminate the application and capture the interest of students with vehicles, promoting the use of shared transportation and the planning of coordinated routes. These tools will facilitate organization and communication among users, optimizing resources, reducing costs and improving efficiency in the management of trips.
An exclusive parking lot could be set aside for high occupancy vehicles (HOV), which would promote more efficient and sustainable mobility by encouraging students to share their vehicles instead of traveling alone. This measure would not only reduce vehicle congestion, but also, by offering preferential parking for HOVs or priority access in certain areas, it would encourage participation in these initiatives, promoting a culture of carpooling among students.
Appendix A
Appendix A.1. Social Impact survey of the Implementation of the Ride-Sharing System
- 1.
-
Indicate the university campus in Guayaquil you attend:
- □
- María Auxiliadora
- □
- Centenario
- 2.
-
Indicate your gender:
- □
- Male
- □
- Female
- 3.
-
Are you aware of shared vehicle services?
- □
- Yes
- □
- No
- 4.
-
Would you prefer to share a vehicle with men, women, or both?
- □
- Men
- □
- Women
- □
- Both
- 5.
-
Please indicate your arrival time at UPS:
- □
- 7:00 AM
- □
- 9:00 AM
- □
- 11:00 AM
- □
- 2:00 PM
- □
- 4:00 PM
- □
- 6:00 PM
- □
- 8:00 PM
- 6.
-
Indicate your current academic level (please mark the lowest level you are currently taking):
- □
- 1
- □
- 2
- □
- 3
- □
- 4
- □
- 5
- □
- 6
- □
- 7
- □
- 8
- □
- 9
- □
- 10
- 7.
-
Please indicate your academic shift:
- □
- Morning
- □
- Evening
- 8.
-
Please indicate the range of your mobile phone:
- □
- High-end
- □
- Upper mid-range
- □
- Mid-range
- □
- Lower mid-range
- □
- Low-end
- 9.
-
What is your primary type of internet access?
- □
- Wi-Fi
- □
- Mobile data
- 10.
-
During the school week, what type of transportation do you mainly use to get to your destination?
- □
- Metrovía
- □
- Public bus
- □
- Taxi
- □
- Private vehicle
- □
- Others
- 11.
-
What would be your main reason for choosing shared transportation over other modes?
- □
- Cost
- □
- Comfort
- □
- Reduced travel time
- □
- Environmental impact
- □
- Safety
- 12.
-
Would you be willing to participate in a pilot plan for a shared transportation system?
- □
- Yes
- □
- No
Appendix A.2. Interviewing Students Willing to Participate in the Pilot Plan
- What is your gender?
- Have you had experience or knowledge about car sharing as sustainable mobility?
- Could you tell me in which canton you live?
Appendix A.3. Satisfaction Survey to Pilot Test Participants
- 1.
-
Indicate your level of satisfaction (with 5 being the highest and 1 the lowest):
- □
- 1
- □
- 2
- □
- 3
- □
- 4
- □
- 5
- 2.
-
Indicate the time saved compared to traditional transportation:
- □
- 10–15 minutes
- □
- 20–25 minutes
- □
- 30–35 minutes
- □
- 40–45 minutes
- □
- More than 1 hour
- 3.
-
Based on your experience, what do you think would be the most important improvement for an app designed for university students?
- □
- Ease of use
- □
- Safety
- □
- GPS-based vehicle location tracking
- □
- Display of occupied seats
- □
- Profile of fellow ride sharers
Appendix B. Photographic Records
Figure A1.
APP demonstration to pilot test participants.
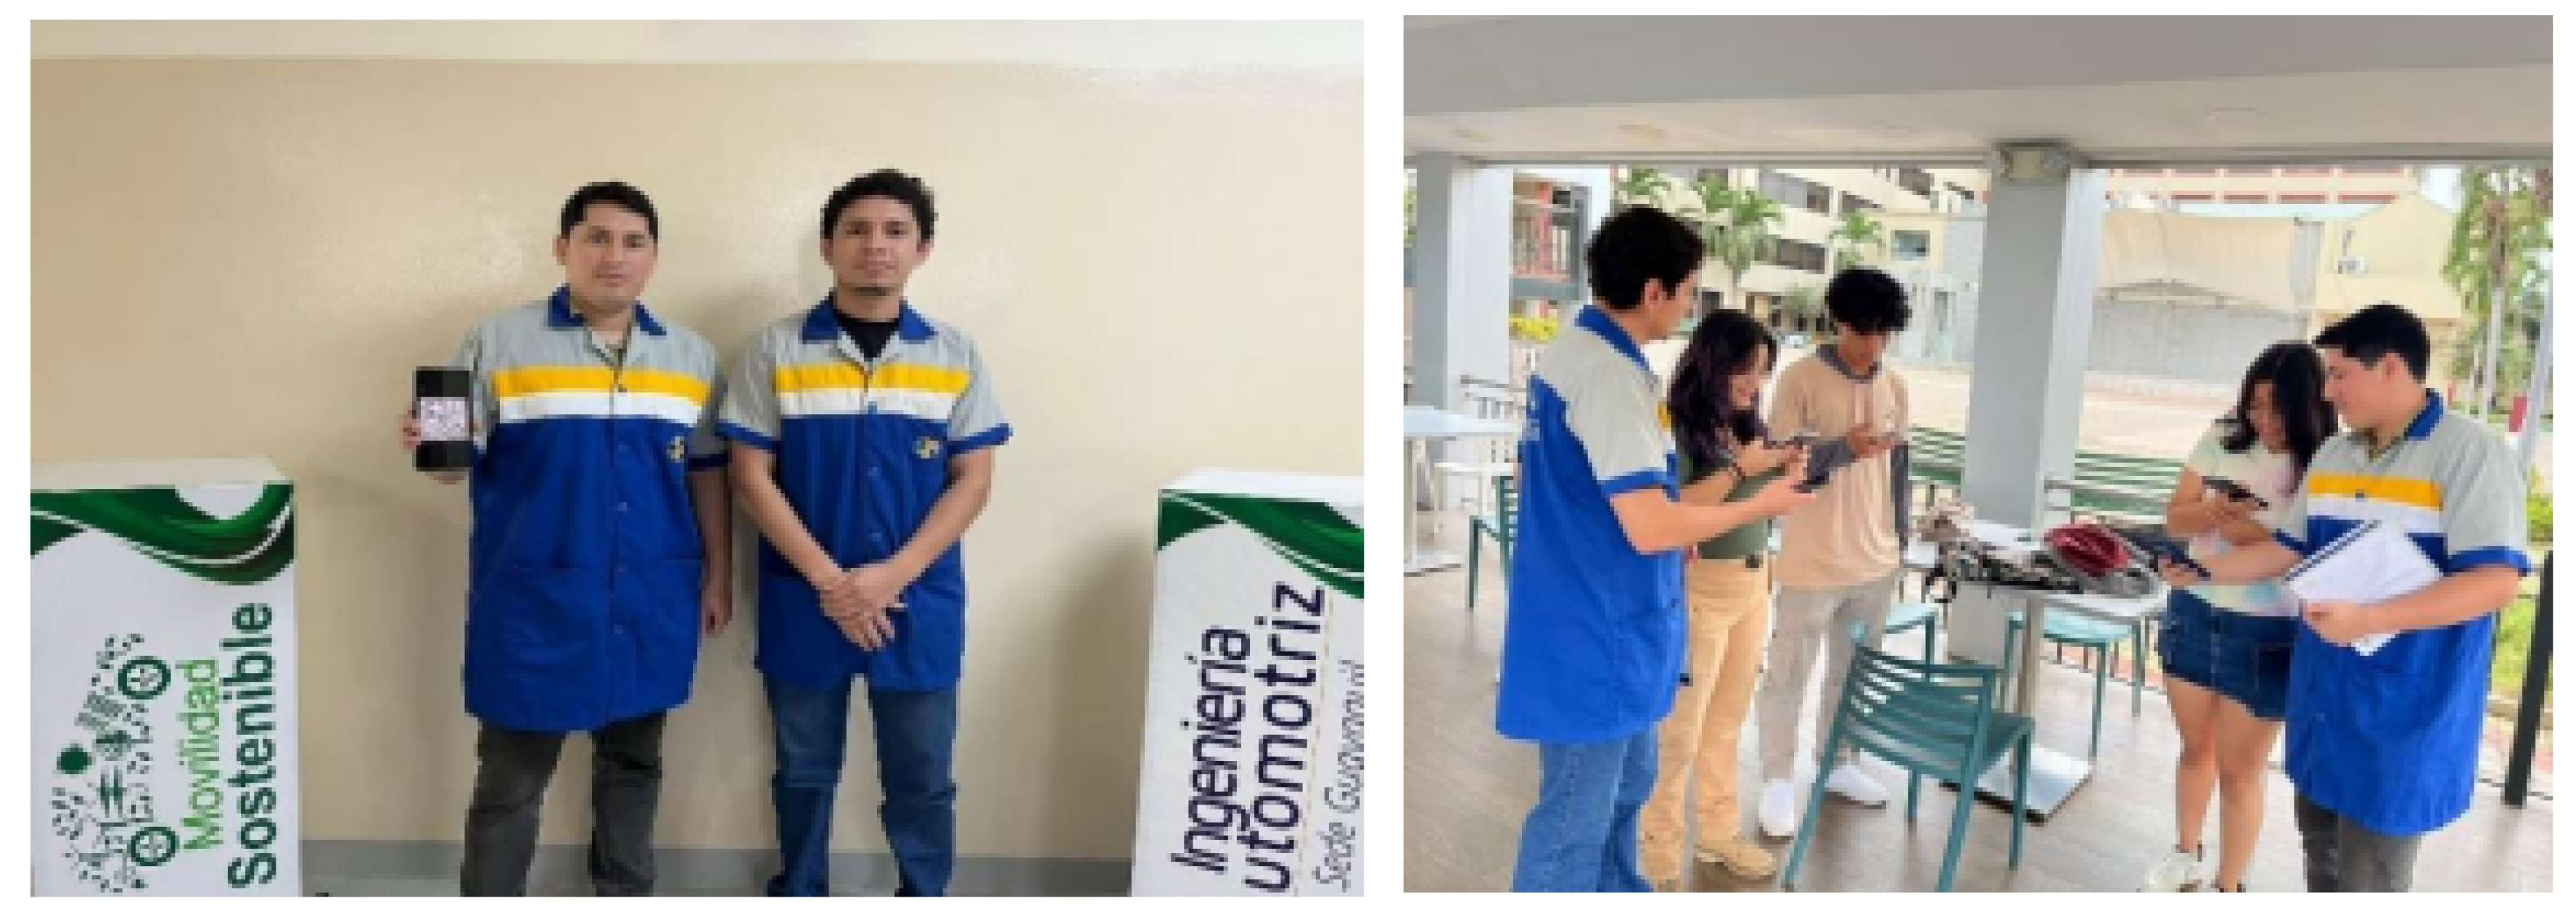
Figure A2.
App. designed.
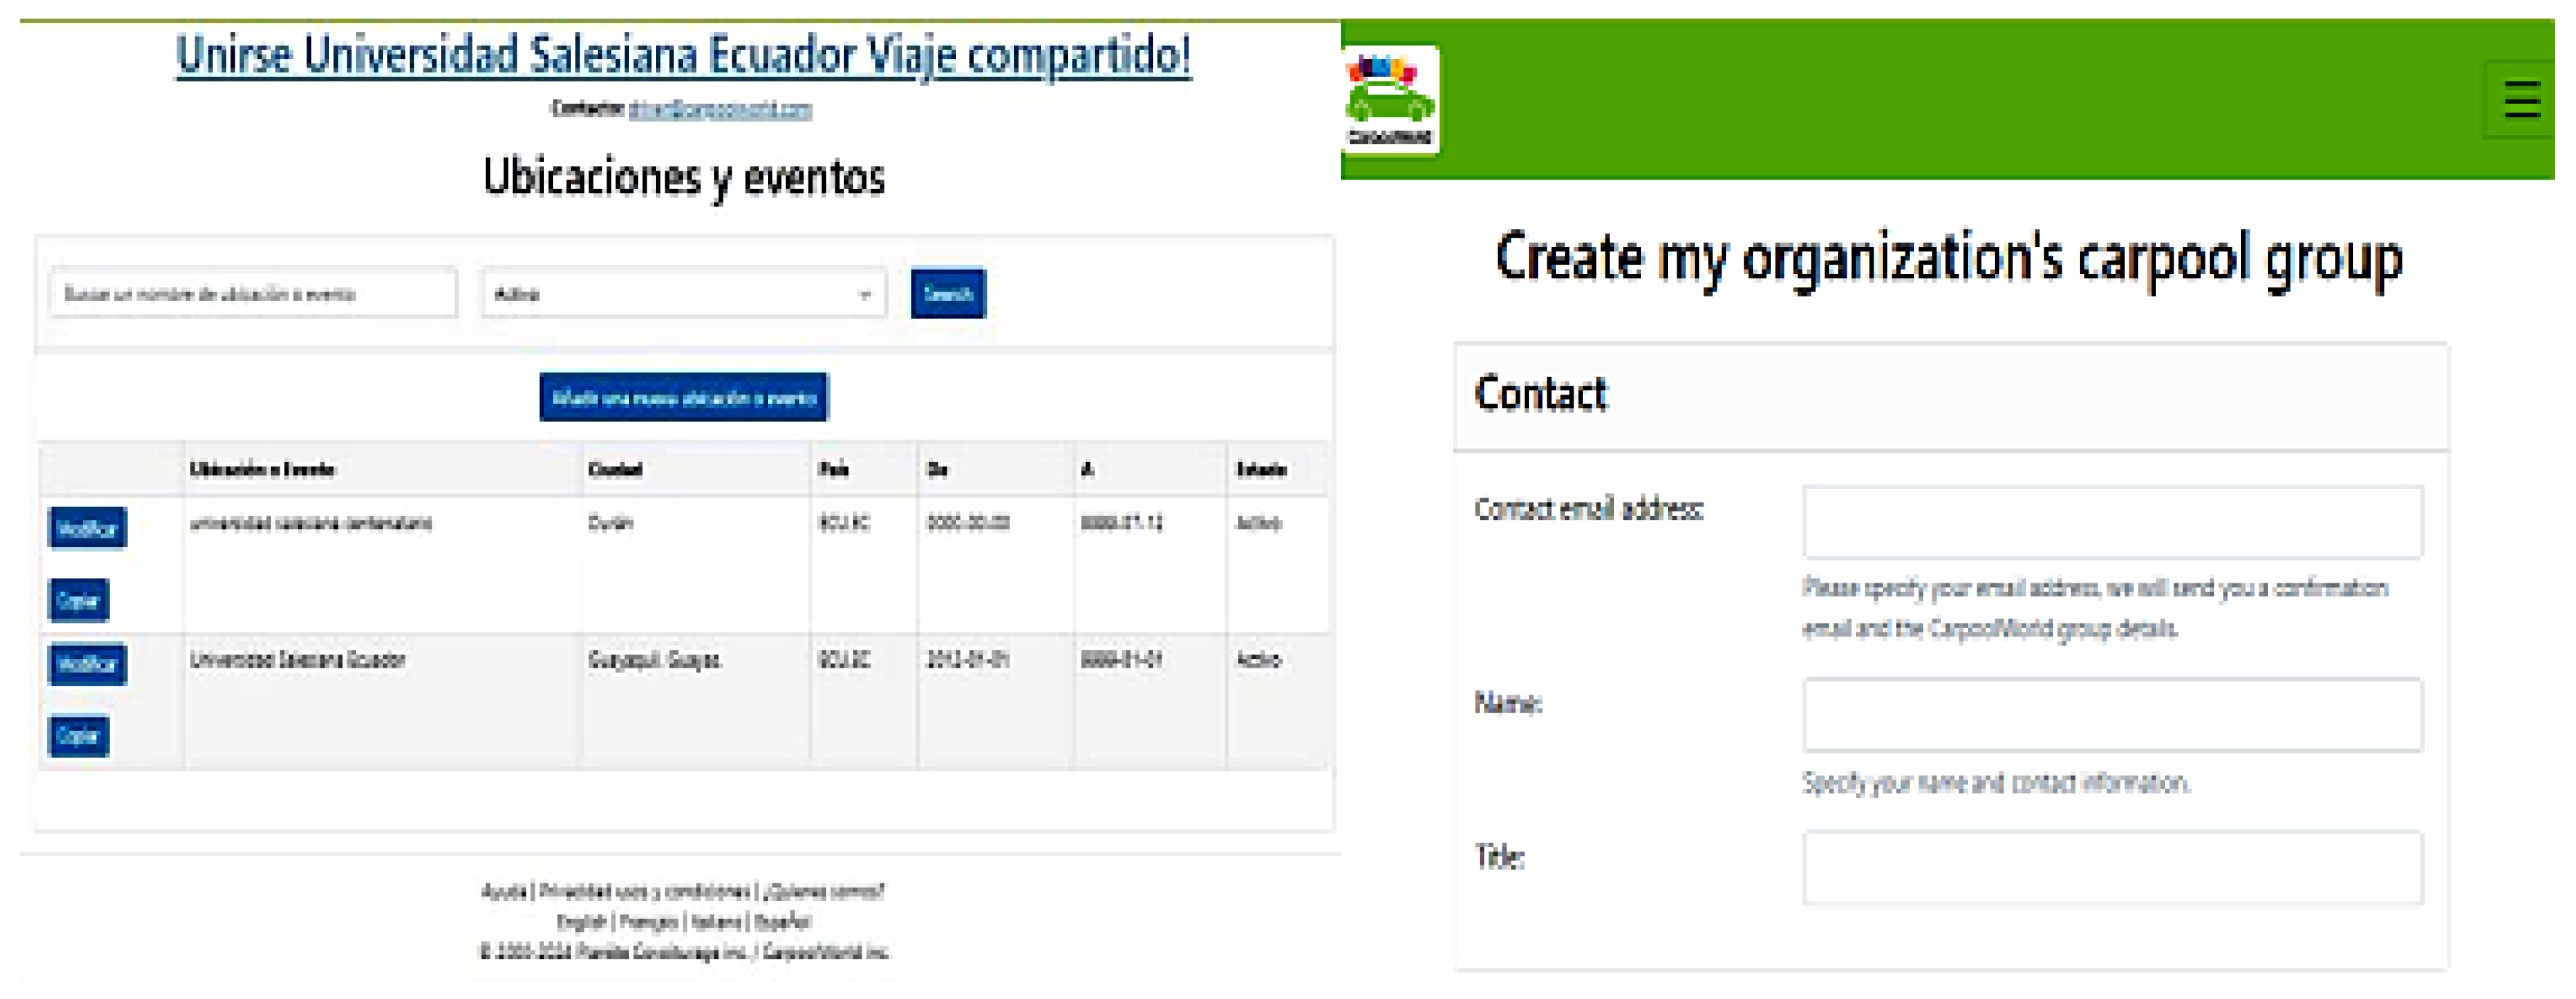
Figure A3.
Car used in the pilot test.
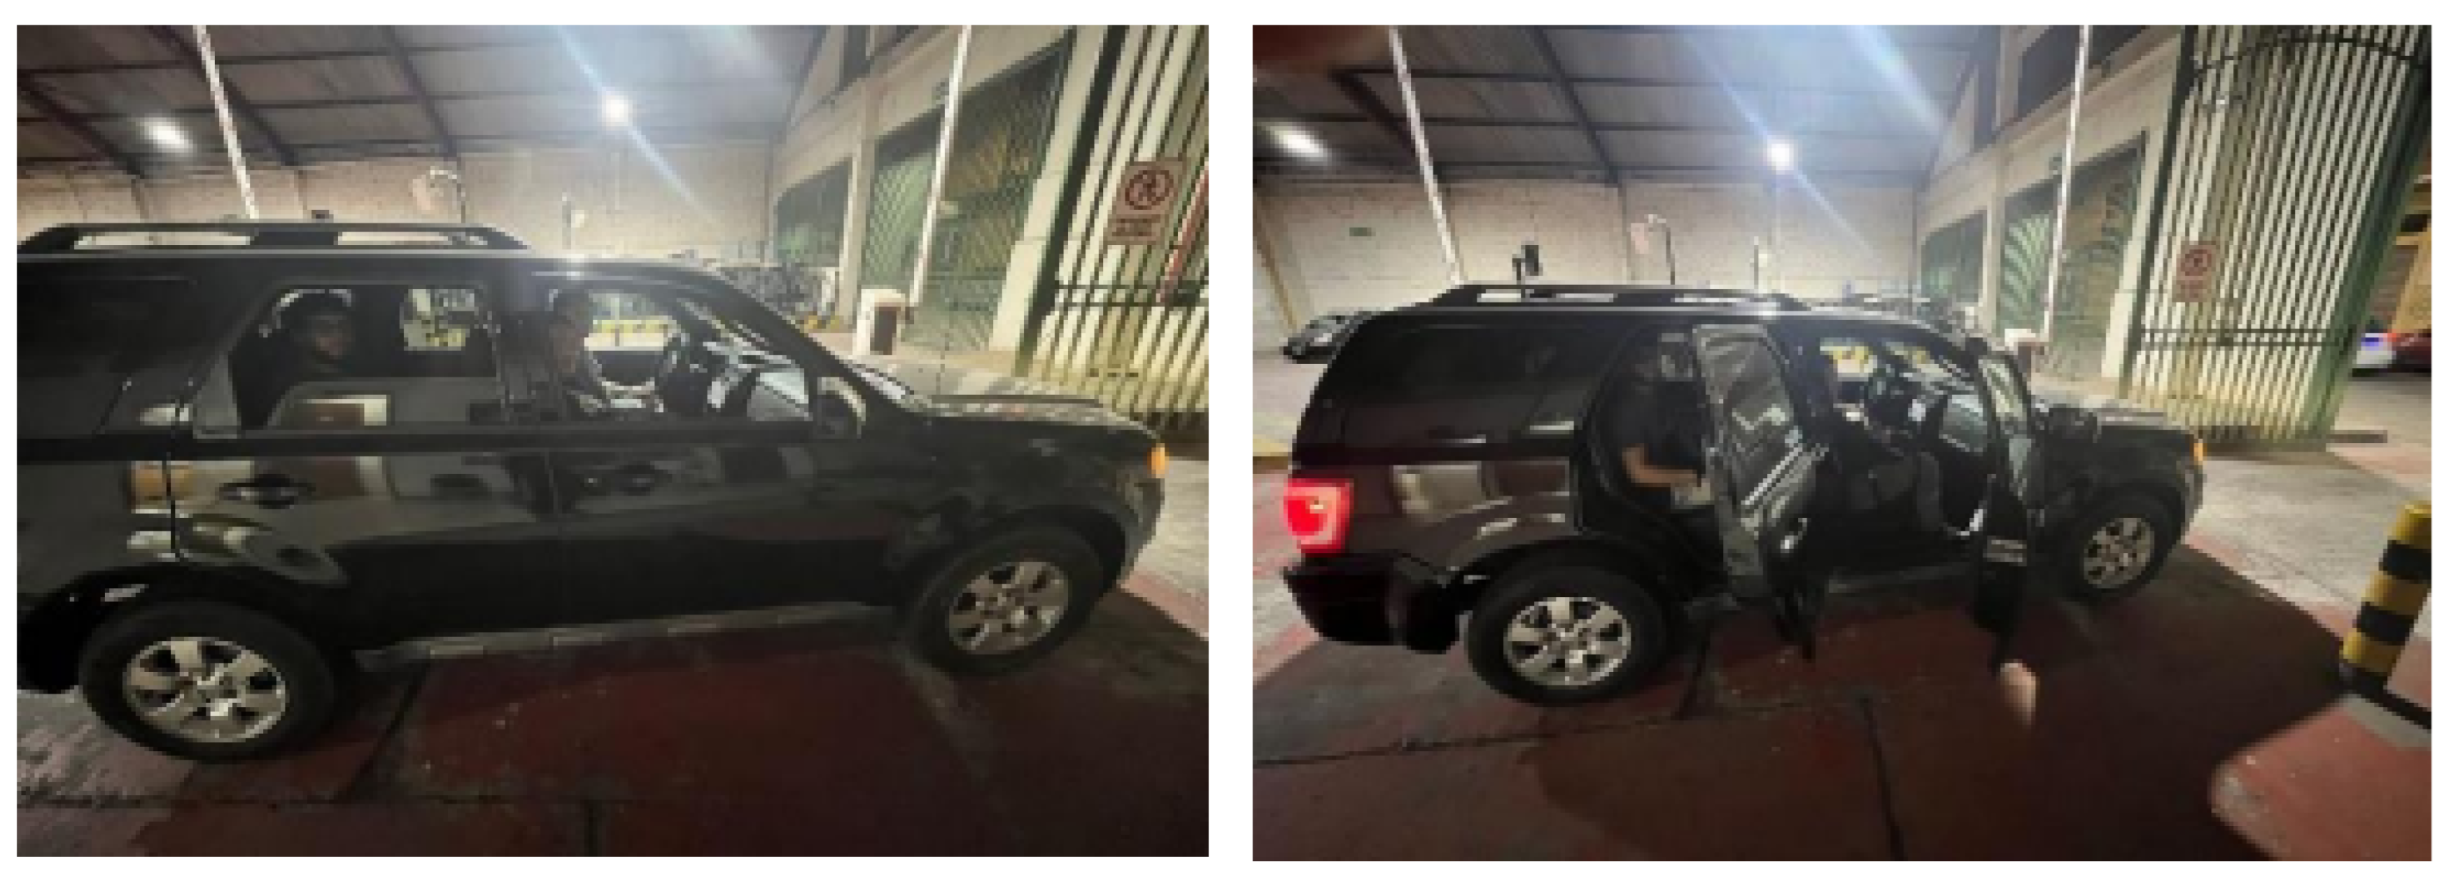
Figure A4.
Satisfaction survey application.
References
- T. Ziad, A. Verdezoto, F. Felix, C. Montes, O. Beatriz, and R. Medina, “Análisis del congestionamiento vehicular para el mejoramiento de vía principal en Guayaquil-Ecuador,” Artículo de Investigación, vol. 21, no. 2, pp. 201602–4730, 2020. [CrossRef]
- R. Fernández and J. Dextre, Elementos de la teoría del tráfico vehicular. 2022. [CrossRef]
- S. Alam and A. Khan, “The Impact Study Of Vehicular Pollution On Environment,” Int J Sci Adv Res Technol, vol. 6, no. 12, 2020, Accessed: Jun. 03, 2024. [Online]. Available online: https://www.researchgate.net/profile/Md-Alam-277/publication/346946690_The_Impact_Study_Of_Vehicular _Pollution_On_Environment/links/5f.
- R. López and M. Peñafiel, “Estudio sobre la utilización y efectividad del comercio electrónico (e-commerce) y propuesta para su implementación en las pymes del sector comercial de Guayaquil.,” 2012.
- J. Herrán et al., “La Salesiana frente a la movilización popular de octubre de 2019,” 2020.
- G. Ramón and L. Suquinagua, “Análisis y solución al congestionamiento vehicular producido en la intersección av. 24 de mayo y max uhle de la ciudad de Cuenca,” 2023.
- I. Quinapanta, “Estrés y rendimiento académico en estudiantes universitarios de la ciudad de Ambato,” 2024. Accessed: Jun. 03, 2024. [Online]. Available online: https://repositorio.uti.edu.ec/handle/123456789/6583.
- E. Flores, estefania Mora, J. Chica, and M. Balseca, “Evaluación de la movilidad de estudiantes y accesibilidad espacial a centros de educación en zonas periurbanas,” NOVASINERGIA REVISTA DIGITAL DE CIENCIA, INGENIERÍA Y TECNOLOGÍA, vol. 5, no. 1, 2022. [CrossRef]
- W. Aliaga, “Congestión vehicular de transporte urbano y su incidencia en salud y medio ambiente en la ciudad de Puno,” Escuela Profesional de Contabilidad, Universidad Andina Néstor Cáceres Velásquez. Puno, Perú., 2019, Accessed: Jun. 03, 2024. [Online]. Available online: https://revistas.uancv.edu.pe/index.php/RCIA/article/view/746.
- E. Gallardo, “Análisis general del acceso al sistema de educación superior del Ecuador 2009-2018,” Magazine de las Ciencias: Revista de Investigación e Innovación, vol. 8, no. 1, 2023. [CrossRef]
- “Carpoolword.” Accessed: Jul. 28, 2024. [Online]. Available online: https://www.carpoolworld.com/create_my_group.html?t=University.
- J. García, A. Reding, and J. López, “Cálculo del tamaño de la muestra en investigación en educación médica,” Investigación en Educación Médica, vol. 2, no. 8, 2013. [CrossRef]
- T. Otzen and C. Manterola, “Técnicas de Muestreo sobre una Población a Estudio,” International Journal of Morphology, vol. 35, no. 1, 2017. [CrossRef]
- G. Bauce, M. Córdova, and A. Avila, “Operacionalización de variables,” Revista del Instituto Nacional de Higiene “Rafael Rangel,” vol. 49, no. 2, 2018, Accessed: Jun. 03, 2024. [Online].
- Read Native, “Get a head start with a framework,” React Native Learn once, write anywhere. Available online: http://saber.ucv.ve/ojs/index.php/rev_inhrr/article/view/18686.
- Flutter, “Build for any screen.”.
- Ionic, “The mobile SDK for the Web.”.
- R. Espinosa, “Análisis comparativo para la evaluación de frameworks usados en el desarrollo de aplicaciones web,” CEDAMAZ, vol. 11, no. 2, pp. 133–141, Dec. 2021. [CrossRef]
- R. Garcia and H. Zurita, “Comparativa de Frameworks para el Desarrollo Web en el lado del cliente basado en métricas de desempeño Web Vitals,” 2023.
- R. Toro, M. Peña, B. Avendaño, S. Mejía, and A. Bernal, “Análisis Empírico del Coeficiente Alfa de Cronbach según Opciones de Respuesta, Muestra y Observaciones Atípicas,” Revista Iberoamericana de Diagnóstico y Evaluación – e Avaliação Psicológica, vol. 63, no. 2, 2022. [CrossRef]
- R. García Pérez, “El carpooling o viaje en coche compartido. Especial referencia a BlaBlaCar, de Pablo Fernández Carballo-Calero. Prólogo de Anxo Tato Plaza (Thomson Reuters Aranzadi, Cizur Menor, 2019),” CIRIEC-España, revista jurídica de economía social y cooperativa, no. 36, 2020. [CrossRef]
- K. Gkiotsalitis and A. Nikolopoulou, “The multi-vehicle dial-a-ride problem with interchange and perceived passenger travel times,” Transp Res Part C Emerg Technol, vol. 156, Nov. 2023. [CrossRef]
- OMS, “Organización Mundial de la Salud,” 2020.
- R. Prieto, J. Vassallo, and S. Gil, “Transporte Sostenible en Argentina Costos e impactos ambientales de los distintos combustibles,” 2021, Accessed: Jul. 20, 2024. [Online]. Available online: https://www.researchgate.net/profile/Salvador-Gil2/publication/381478976_Transporte_Sostenible_en_Argentina_- _Costos_e_impactos_ambientales_de_los_distintos_combustibles/ links/66703d0aa54c5f0b9468ed1 f/Transporte-Sostenible-en-Argentina-Costos-e-impactos-ambientales-de-los-distintoscombustibles.pdf.
- R. Lopez and A. Andrade, “E-commerce, Rival o Aliado para las Comercializadoras Textiles de Guayaquil.,” Editorial Universitaria Abya-Yala, pp. 146–176, Jun. 2020.
- L. J. Cronbach, “Coeficiente alfa y la estructura interna de pruebas,” Psychometrika, vol. 16, no. 3, 1951.
- L. Eboli and G. Mazzulla, “A methodology for evaluating transit service quality based on subjective and objective measures from the passenger’s point of view,” Transp Policy (Oxf), vol. 18, no. 1, 2011. [CrossRef]
- T. A. Litman and T. Litman, Evaluating Public Transit Benefits and Costs. 2024. [Online]. Available online: www.vtpi.org.
- R. López-Chila, K. Caiza Medinay R. Zurita Peñaloza, "Methodology to manage mobility factors and optimize university transportation in the Ecuadorian context", Estrategia y Gestión Universitaria, vol. 13, n.º 1, p. e.8734, abr. 2025. [CrossRef]
- R. Van Hoek, “Review of: ‘Cost & amp; Effect: using integrated cost systems to drive profitability and performance,’” International Journal of Logistics Research and Applications, vol. 1, no. 3, pp.315–317, Nov. 1998. [CrossRef]
Figure 1.
Systematization of processes.
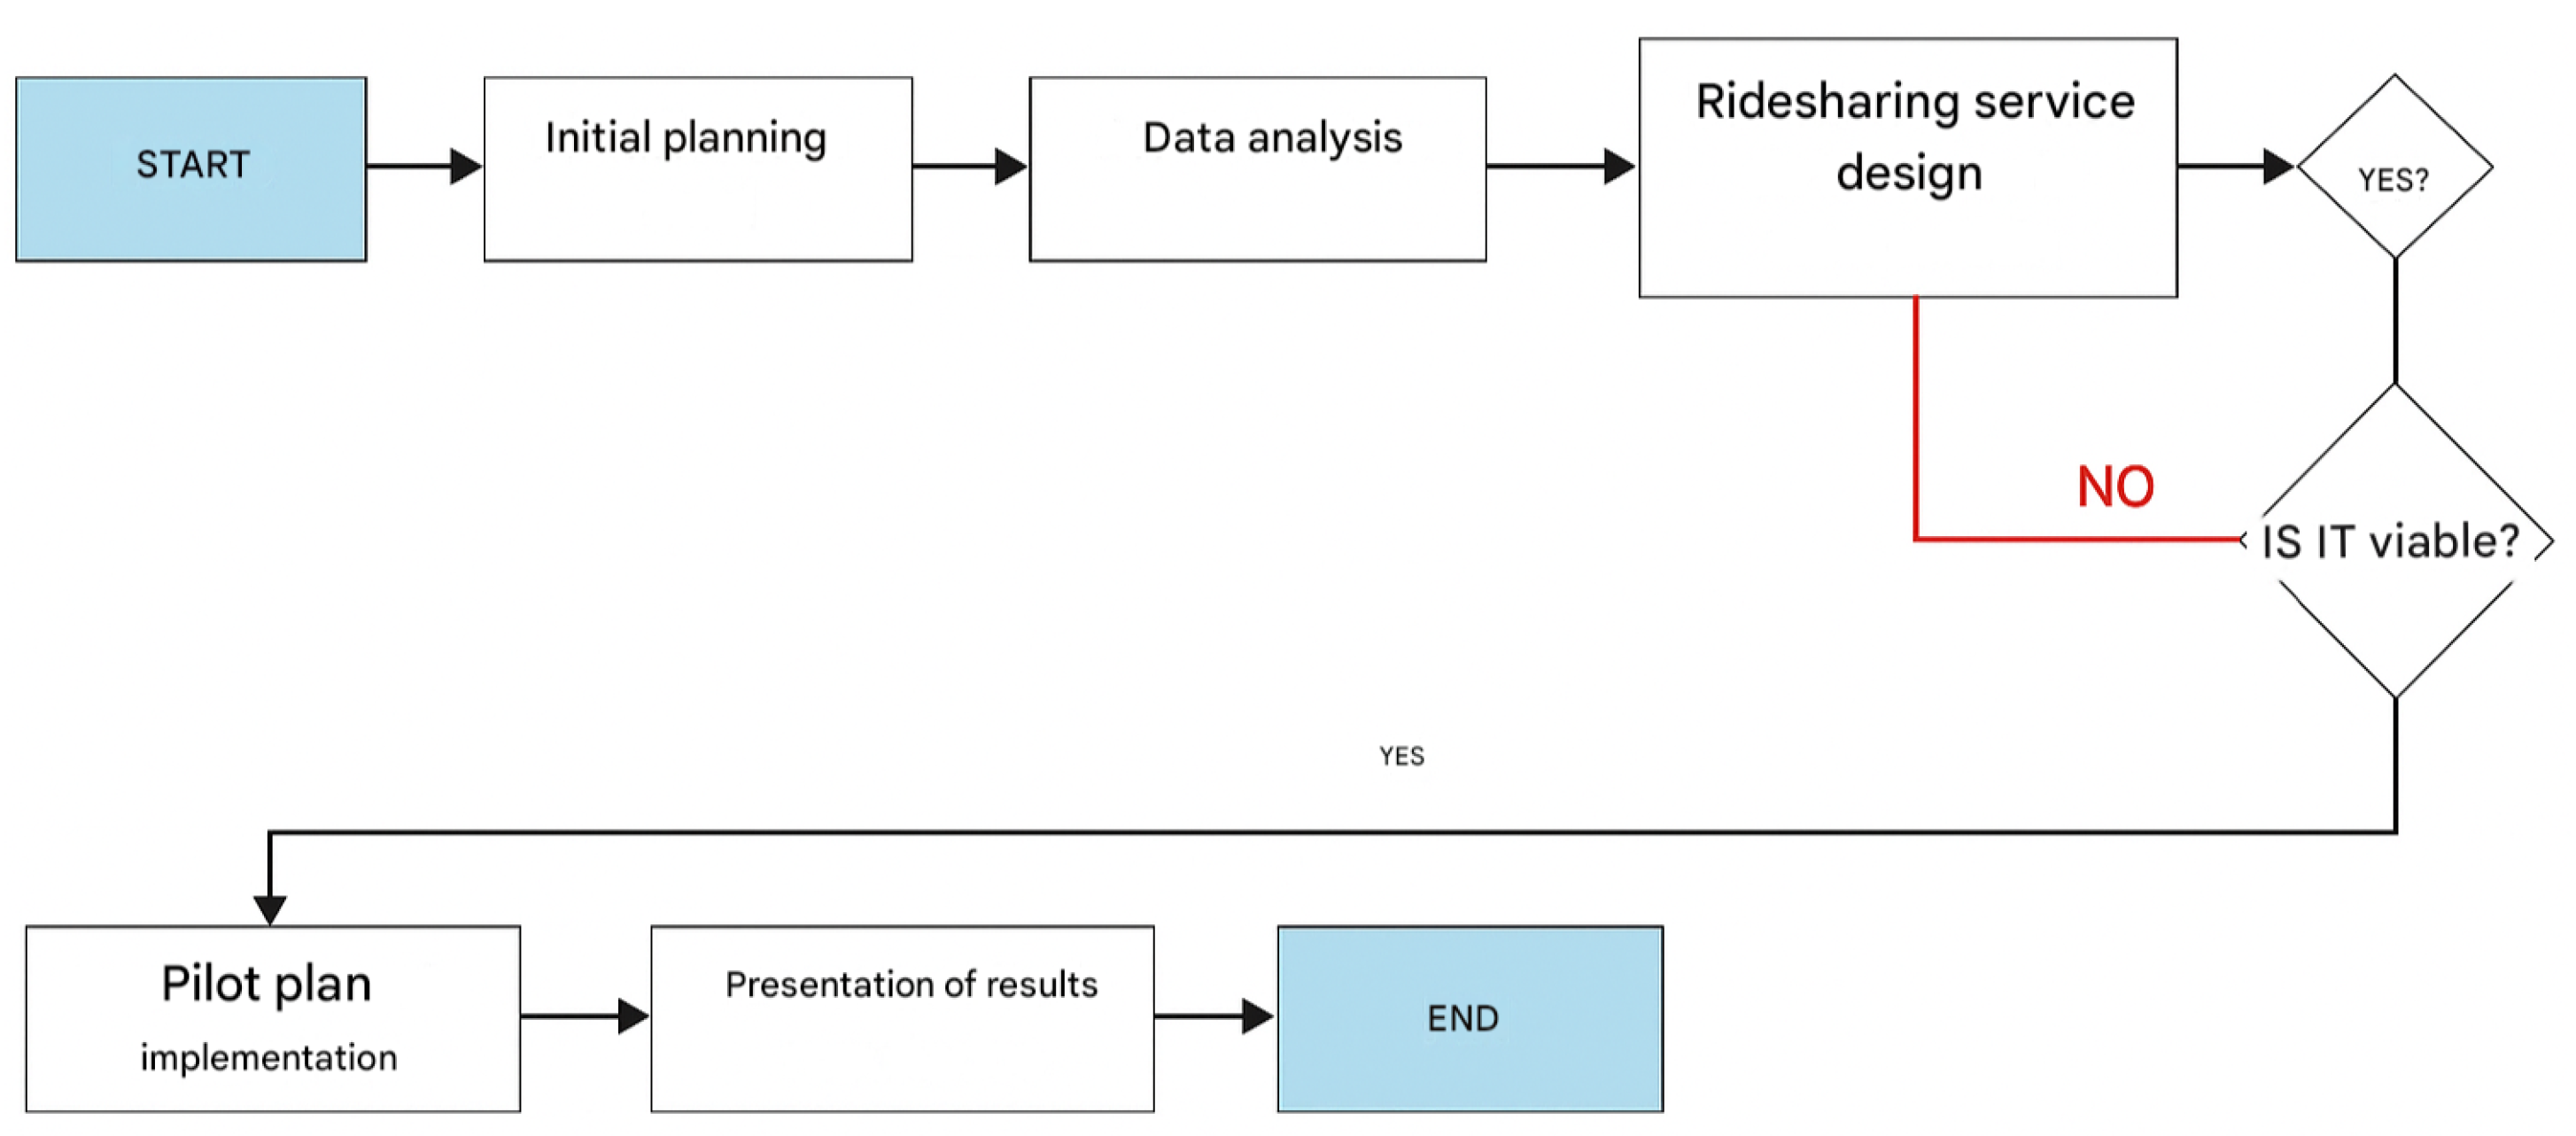
Figure 2.
Check-in time.
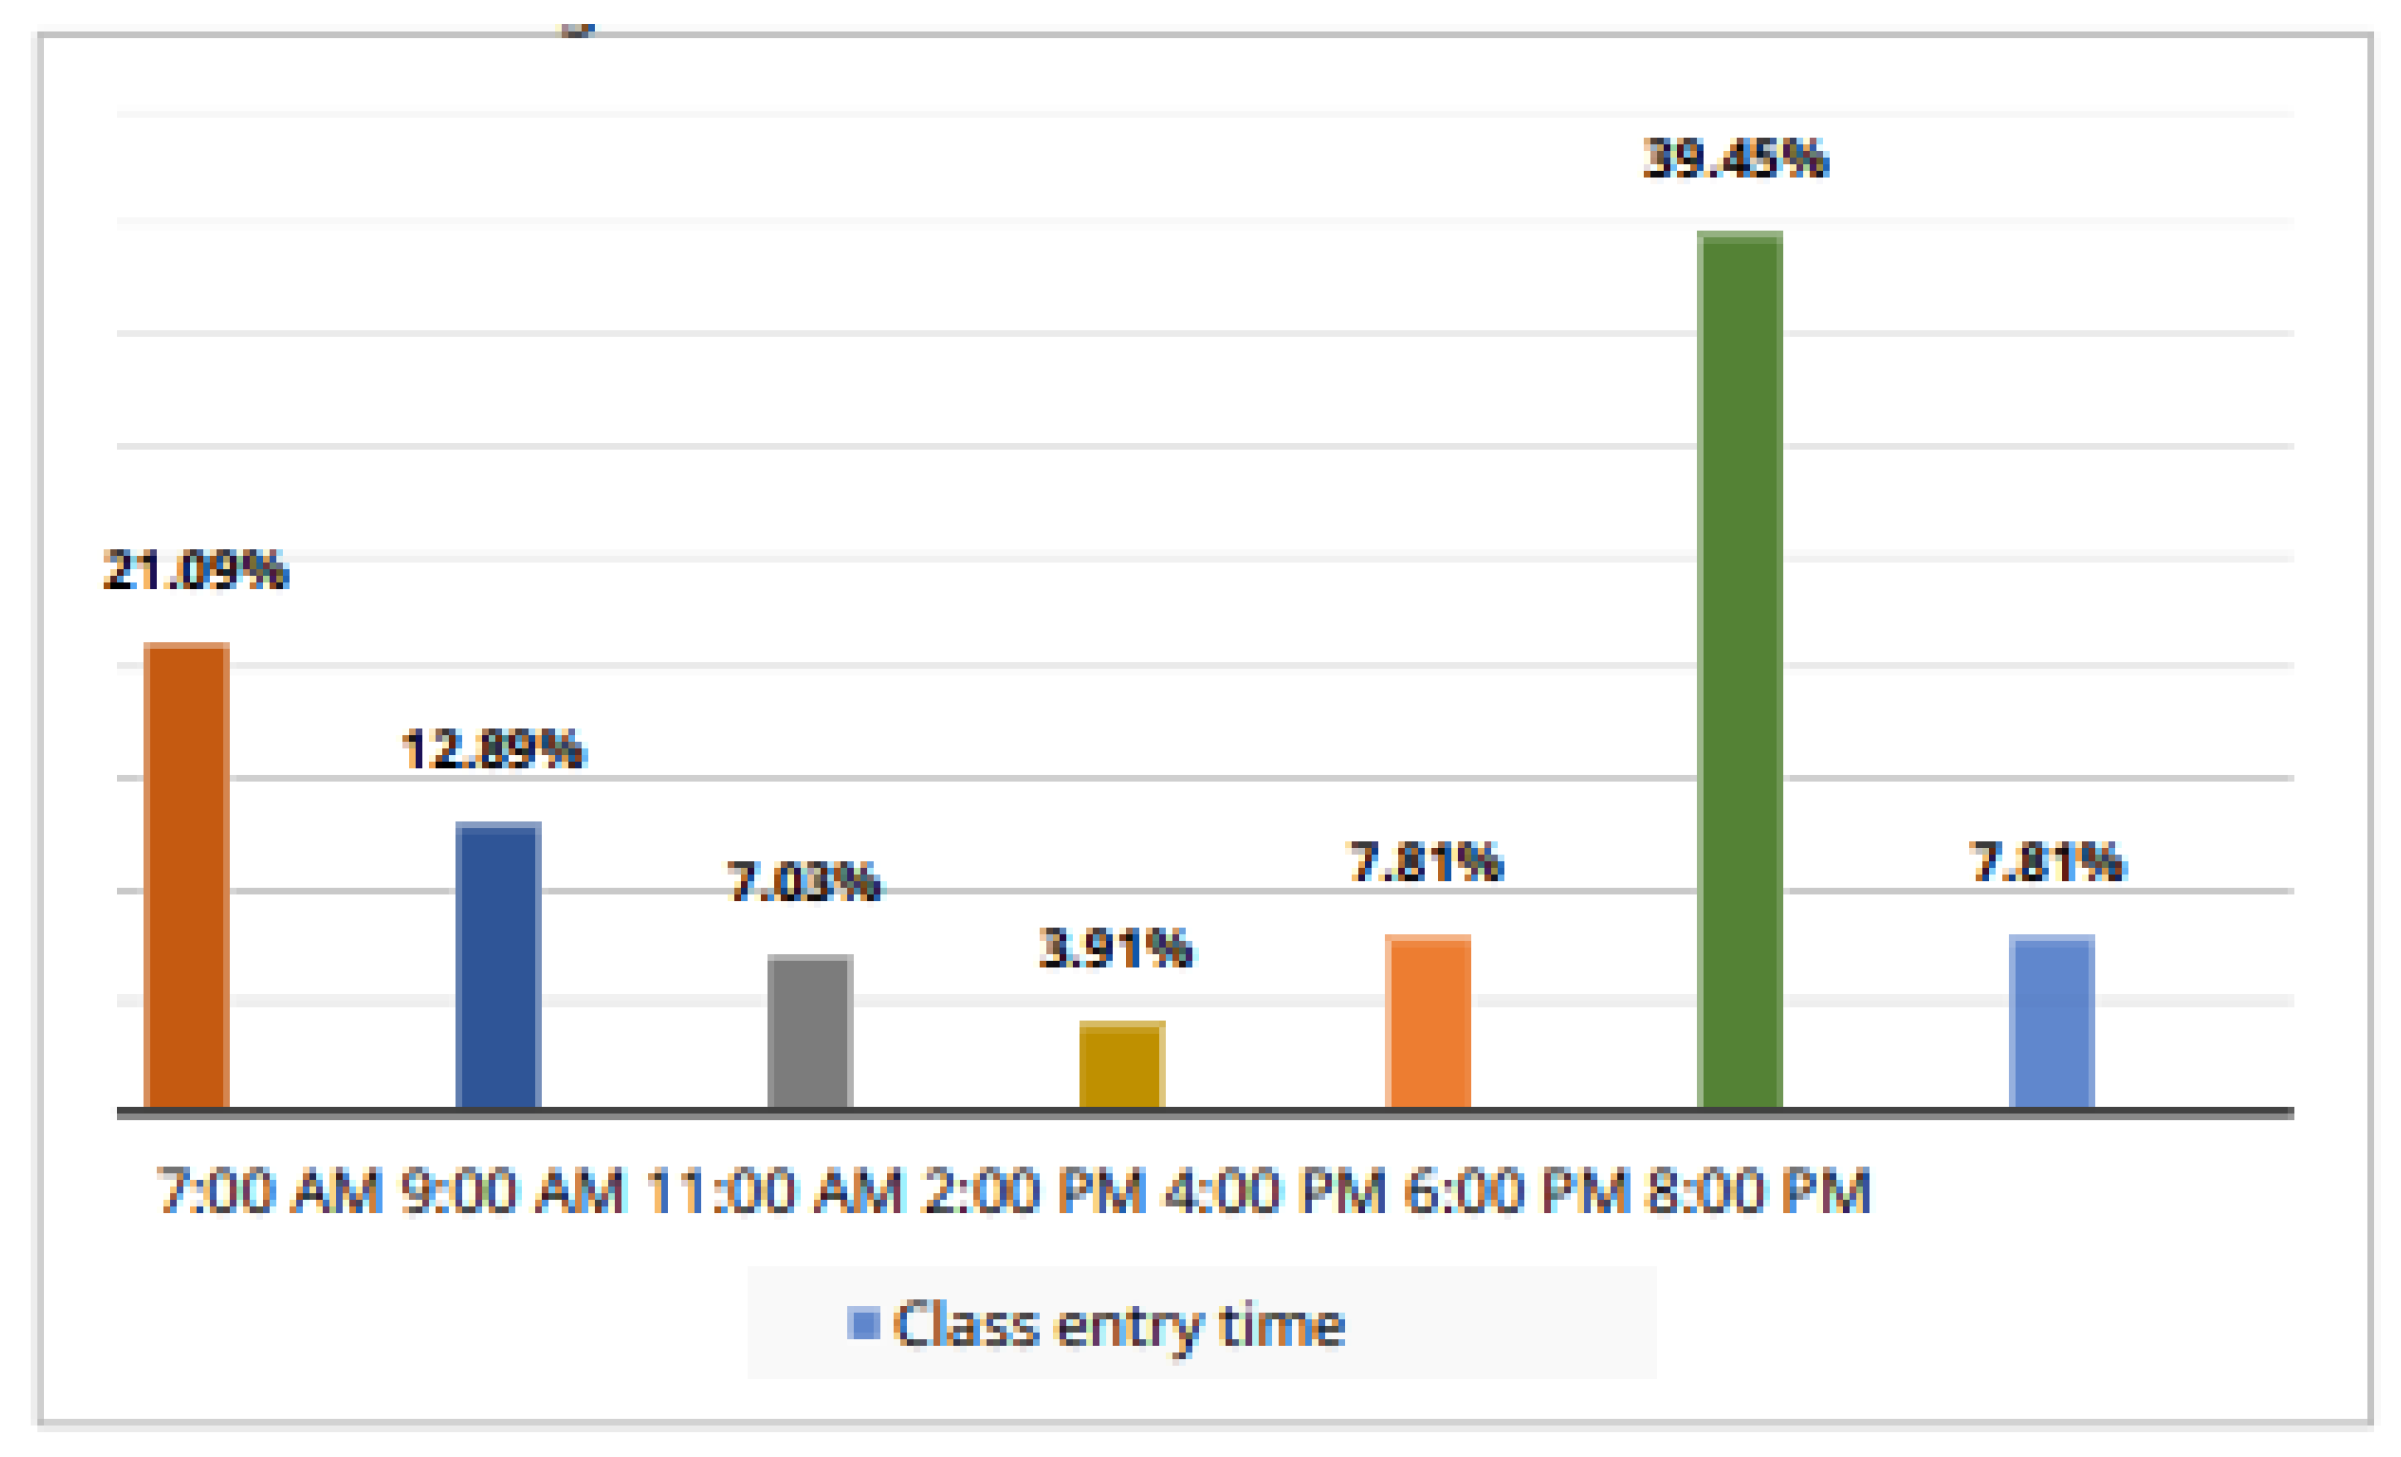

Table 1.
Segmentation table by stratum.
| Stratum | Sample size | Number of surveys to apply | Instrument |
|---|---|---|---|
| Morning | 1571 | 98 | Survey |
| Night | 2552 | 158 | Survey |
| Total | 4123 | 256 |
Table 2.
Operationalization of Variables.
| Specific Objective | Dimension | Variable | Indicator | Variable Type | Level | Measurement Instrument |
|---|---|---|---|---|---|---|
| Evaluate the technological needs for implementing the shared transport system. | Technical Capabilities of Tools | Functionality and Features | Level of customization and flexibility that the tools allow to adapt to specific needs | Qualitative | Nominal | Literature review: Comparative scale |
| Integration and Extensibility | Number of APIs available for integration with other systems | Qualitative | Nominal | |||
| Calculate the implementation costs of the shared transport system. | Development and Technology Costs | Software Development | Cost per hour of the development team (measured in USD/hour) | Quantitative | Ordinal | Price evaluation |
| System Operations | Operating and administrative costs | Quantitative | Ordinal | Price evaluation | ||
| Analyze the social impact of implementing the shared transport system. | Social Impact of the Implementation | Changes in Mobility Patterns | Changes from regular transport to shared transport | Qualitative | Nominal | Surveys |
| Student Acceptance | Percentage of respondents supporting the pilot shared transport plan | Qualitative | Likert Scale | Surveys | ||
| Evaluate the feasibility of implementing a pilot plan. | Feasibility of a Pilot Plan | Travel Time | Reduction in travel time during peak hours | Quantitative | Likert Scale | Survey |
| Experience with Shared Mobility | Acceptance of carpooling | Qualitative | Ordinal | Poll |
Table 3.
Frameworks to Be Developed
| Framework | Description | Advantages |
|---|---|---|
| React Native | React Native is an open-source framework developed by Facebook that enables the development of native mobile applications for iOS and Android using JavaScript and React [15]. |
|
| Flutter | Flutter is an open-source framework developed by Google that supports mobile, web, and desktop development from a single codebase using the Dart programming language [16]. |
|
| Ionic | Ionic is an open-source mobile app development framework that enables hybrid apps using web technologies such as HTML, CSS, and JavaScript [17]. |
|
Table 4.
Comparison of Development Frameworks.
| Criterion | Framework | Score | Explanation |
|---|---|---|---|
| Compatibility | React Native | 5 | React Native allows development with a single codebase that works well on both iOS and Android, with access to native components to ensure compatibility. |
| Flutter | 5 | Flutter also allows development for iOS and Android with a single codebase, compiling to native code for optimal performance on both platforms. | |
| Ionic | 4 | Ionic enables cross-platform development using web technologies. However, performance may be slightly lower than React Native and Flutter on older devices. | |
| Performance and Efficiency | React Native | 4 | Offers near-native performance, although some optimization may be needed for highly complex applications. |
| Flutter | 5 | Provides high performance by compiling directly to native code. Ideal for apps requiring complex animations and graphics. | |
| Ionic | 3 | Good performance for basic apps, but may present limitations for demanding apps due to its hybrid nature. | |
| Ease of Use and Learning | React Native | 4 | Easy to learn for developers familiar with JavaScript and React. Good documentation and active community. |
| Flutter | 4 | Medium-to-high learning curve due to Dart, but excellent documentation and Google-backed resources. Growing community. | |
| Ionic | 5 | Very easy to learn for web developers (HTML, CSS, JavaScript). Good documentation and an active community. | |
| Access to Native Features | React Native | 5 | Excellent access to native features via native modules and third-party libraries. |
| Flutter | 5 | Full access to native features, with the ability to write native code when needed. | |
| Ionic | 4 | Good access via Capacitor, though some features may require additional plugins. | |
| Scalability and Maintenance | React Native | 4 | Highly scalable with many tools and best practices available. May need optimization as the app grows. |
| Flutter | 5 | Excellent scalability and maintainability. Google provides robust tools for lifecycle management. | |
| Ionic | 4 | Scalable, but may face challenges with very large or complex applications due to its hybrid nature. |
Table 5.
Summary of the Comparison.
| Criterion | React Native | Flutter | Ionic |
|---|---|---|---|
| Compatibility and Cross-Platform Support | 5 | 5 | 4 |
| Performance and Efficiency | 4 | 5 | 3 |
| Ease of Use and Learning Curve | 4 | 4 | 5 |
| Access to Native Functionalities | 5 | 5 | 4 |
| Scalability and Maintenance | 4 | 5 | 4 |
| Total | 22 | 24 | 20 |
Table 6.
Details of Mobile App Development Costs.
| Module | Development | Infrastructure | Total |
|---|---|---|---|
| User Registration and Authentication | $1,800 (200 hrs at $9/hr) | $500 | $2,300 |
| User Profile | $1,350 (150 hrs at $9/hr) | $400 | $1,750 |
| Trip Booking | $2,250 (250 hrs at $9/hr) | $600 | $2,850 |
| Real-Time Tracking | $2,700 (300 hrs at $9/hr) | $750 | $3,450 |
| Payment and Billing | $1,800 (200 hrs at $9/hr) | $500 | $2,300 |
| Notifications | $900 (100 hrs at $9/hr) | $450 | $1,350 |
| Ratings and Feedback | $900 (100 hrs at $9/hr) | $250 | $1,150 |
| Admin and Support | $1,800 (200 hrs at $9/hr) | $500 | $2,300 |
| Analytics and Reporting | $1,350 (150 hrs at $9/hr) | $400 | $1,750 |
| Integrations | $1,350 (150 hrs at $9/hr) | $400 | $1,750 |
| Total | $16,200 | $4,750 | $20,950 |
Table 7.
Statistics of Omitted Items.
| Omitted Item | Adj. Total Mean | Adj. Std. Dev. | Item-Total Corr. | Squared Mult. Corr. | Cronbach’s Alpha |
|---|---|---|---|---|---|
| Have you heard about carpooling? | 12.743 | 3.552 | 0.1616 | 0.1685 | 0.9475 |
| Would you prefer to share a vehicle? | 12.560 | 3.212 | 0.6543 | 0.4604 | 0.9221 |
| Please indicate your available time slots | 12.673 | 3.244 | 0.7451 | 0.5850 | 0.9133 |
| Please indicate your academic schedule | 12.560 | 3.320 | 0.7070 | 0.6103 | 0.9160 |
| Please indicate your preferred fare range | 12.704 | 3.220 | 0.8775 | 0.8745 | 0.9050 |
| What is your main mode of transportation? | 12.669 | 3.215 | 0.8941 | 0.8716 | 0.9040 |
| During the study week, how do you usually travel? | 12.646 | 3.218 | 0.8967 | 0.9222 | 0.9039 |
| What would be your main reason for using carpooling? | 12.630 | 3.221 | 0.8963 | 0.9287 | 0.9040 |
| Would you be willing to participate in a pilot test? | 12.712 | 3.252 | 0.8040 | 0.7819 | 0.9097 |
Table 8.
Travel Time.
| Answers | Travel Time | Stop |
|---|---|---|
| 2 | 10–15 min | Guayaquil North Naval Base |
| 2 | 20–25 min | CC Riocentro |
| 1 | 30–35 min | The Recreation - Duran |
| 1 | 40–45 min | Overview - Duran |
Table 9.
Variable for travel cost.
| Costs of the 6 passengers of the pilot plan | |
|---|---|
| Cost per deviation | $0.50/km |
| Base price | $0.75 |
| Distance traveled | $0.10/km |
| Price to Naval Base stop | |
| Number of passengers | 2 |
| Distance | 7.4 km |
| Base price | $0.75 |
| Total per passenger | $1.50 |
| Total 2 passengers | $3.00 |
| Price at the CC Riocentro stop | |
| Number of passengers | 2 |
| Distance | 11.4 km |
| Base price | $0.75 |
| Detour | $0.40 |
| Total per passenger | $2.30 |
| Total 2 passengers | $4.60 |
| Price at the Duran-El Recreo stop | |
| Number of passengers | 1 |
| Distance | 16 km |
| Base price | $0.75 |
| Total | $2.35 |
| Price at the Duran stop – Panorama citadel | |
| Number of passengers | 1 |
| Distance | 17.1 km |
| Detour | $0.20 (2 km) |
| Base price | $0.75 |
| Total per passenger | $2.86 |
| Total profit from the trip | $12.81 |
Table 10.
Usage and Maintenance Expenses.
| Usage and Maintenance Expenses | |
|---|---|
| Vehicle fuel consumption | 10.7 L / 100km |
| Fuel cost per kilometer | $0.08/km |
| Vehicle cleaning and care | $20 / month |
| Oil changes | $30 approx. / month |
| A/C maintenance (filters) | $10 (filters) / month |
| Insurance | $0 |
| Licenses and permits | $0 |
| Fines and penalties | $0 |
| Parking and garage | $0 |
| Monthly fuel cost | $35.20 |
| Monthly distance traveled | 440 km |
| Total | $65.20 |
Disclaimer/Publisher’s Note: The statements, opinions and data contained in all publications are solely those of the individual author(s) and contributor(s) and not of MDPI and/or the editor(s). MDPI and/or the editor(s) disclaim responsibility for any injury to people or property resulting from any ideas, methods, instructions or products referred to in the content. |
© 2025 by the authors. Licensee MDPI, Basel, Switzerland. This article is an open access article distributed under the terms and conditions of the Creative Commons Attribution (CC BY) license (http://creativecommons.org/licenses/by/4.0/).
Copyright: This open access article is published under a Creative Commons CC BY 4.0 license, which permit the free download, distribution, and reuse, provided that the author and preprint are cited in any reuse.


