

Submitted:
08 June 2025
Posted:
09 June 2025
You are already at the latest version
Abstract
This article investigates macroeconomic factors that support the adoption of Artificial Intelligence (AI) technologies by large European Union (EU) enterprises. In this analysis, panel data regression is combined with machine learning to investigate how macroeconomic variables like health spending, domestic credit, exports, gross capital formation, and inflation, along with health spending and trade openness, influence the share of enterprises that adopt at least one type of AI technology (ALOAI). The results of the estimations—based on fixed and random effects models with 151 observations—show that health spending, inflation, and trade and GDP per capita have positively significant associations with adoption, with significant negative correlations visible with and among domestic credit, exports, and gross capital formation. In adjunct to this, the regression of machine learning models (KNN, Boosting, Random Forest) is benchmarked with MSE, RMSE, MAE, MAPE, and R² measures with KNN performing perfectly on all measures, although with some concerns regarding data overfitting. Furthermore, cluster analysis (Hierarchical, Density-Based, Neighborhood-Based) identifies hidden EU country groups with comparable macroeconomic variables and comparable ALOAI. Notably, those with characteristics of high integration in international trade, access to credit, and strong GDP per capita indicate large ALOAI levels, whereas those with macroeconomic volatility and under-investment in innovation trail behind. These findings suggest that securing the adoption of AI is not merely about finance and infrastructure but also about policy alignment and institutional preparedness. This work provides evidence-driven policy advice by presenting an integrated data-driven analytical framework to comprehend and manage AI diffusion within EU industry sectors.
Keywords:
artificial intelligence adoption
; macroeconomic indicators
; panel data regression
; machine learning models
; EU policy and innovation
1. Introduction
Over the last few years, artificial intelligence (AI) has developed into a transformational general-purpose technology with the potential to transform economies, modify production systems, and reorient the roles of innovation and competitiveness. Its spread to different sectors—manufacturing to health care, finance to public administration—holds out the hope of dramatic increases in efficiency, new business models, and better decision support. Yet with increasing interest in the economics of AI, much of the literature to date has concentrated on microlevel applications, sector-specific illustrations, or normative treatments of moral and institutional standards. Little is left to explore regarding how macro structures of the economy and national policy settings are influencing the spread of AI among large organizations (Hoffmann & Nurski, 2021). This is especially relevant in the case of the European Union, where there is considerable heterogeneity of digital preparedness, institutional capability, and economic structure between member states. Most contemporary research on AI adoption tends to focus on firm-specific factors, like managerial capabilities, R&D intensity, or digital expertise, and treat aggregate macroeconomic factors as exogenous or only contextual (Gualandri & Kuzior, 2024). Consequently, we know little about the ways in which systemic factors—like access to finance, globalization, public investment policies, or institutional quality—interact with firm incentives and country-specific innovation systems to impact the diffusion of AI technologies. In addition, those few that do deal with macro-factors tend to concentrate on narrow measures like GDP or innovation indicators, and not on the more nuanced and multidetermined nature of economic development and how this translates to digital transformation (Popović et al., 2025). In the EU, where supranational guidelines in digital policy are complemented by national implementation, understanding more about these macro factors in depth is essential to designing effective policies to facilitate the deployment of AI in different economic contexts.
This paper was needed to fill that research gap by posing the following broad question: To what extent are macro factors responsible for accounting for heterogeneity in AI adoption among large EU member state firms between 2018 and 2023? Specifically, it inquires about how such variables as GDP per capita, access to domestic credit, health expenditure, exports, openness to trade, inflation, and fixed capital formation influence adoption of AI technology, as measured by the ALOAI index—percent of large enterprises embracing one of three AI methods (machine learning, image recognition, or natural language processing). In selecting large enterprises (250+ staff), the analysis identifies a sub-population of large, economically significant, and presumably more capable-to-adopt advanced digital technologies but also in and impacted by aggregate macro factors. The novelty of this research is both in method and content. Method-wise, the research applies dual empirical methodology that combines familiar econometric panel specifications (random and fixed effects) and those of machine learning (K-Nearest Neighbors (KNN) algorithm and other clustering measures). The resulting method allows both explanation and prediction, capturing linear and also non-linear relationships and interaction effects likely to be out of the scope of standard regression analysis (Ma et al., 2023). Additionally, by employing a mixed bag of different evaluation measures—such as from R² and AIC/BIC to geometrical measures like silhouette scores, Dunn index, and entropy—to measure clustering quality, the paper is able to supply strong cross-methodological validation of algorithmic results, such that results are not only statistically compelling but also interpretable and effective on policy (Tudor et al., 2025). At the substance level, the evidence draws several new insights from prevailing conjecture about the digital transformation, such as the fact that although although GDP per capita is positively related with adoption of AI, it is not the chief determinant. Instead, such variables as health spending and domestic credit to the private sector are increasingly stable in their correlations, such that institutional capability and efficiency of the financial structure are essential in allowing the application of AI. Interestingly, the analysis also identifies unanticipated effects—like the negative link between gross fixed capital formation and adoption of AI—which indicate that investments in capital can be skewed towards physical rather than digital assets in certain economies. These findings reinforce the need to move beyond headline economic indicators and consider orientation, composition, and institutional context of macro variables in quantifying readiness to adopt AI.
A second key contribution of the paper is its cluster analysis of EU member states into seven distinct profiles based on macroeconomic characteristics and the rate of adoption of AI. This typology reveals how economic characteristics with identical indicators can result in quite different conclusions on the adoption of AI depending on how they align and are implemented (Czeczeli et al., 2024). We provide an example by describing some of the clusters with both low and high income levels and excellent integration into world markets and public investment and access to finance as characterised by low diffusion of AI as a result of institutional barriers or underdevelopment of the stock of human capital. Other clusters with average income levels and moderate public investment and access to finance, on the other hand, possess better-than-average uptake (Andrejovská & Andrejkovičova, 2024). These findings highlight the importance of policy coordination and ecosystem alignment in translating economic potential into technological transformation. Importantly, the research also addresses policy implications of the findings. By identifying which macroeconomic situations are optimally positioned to support diffusion of AI, it suggests actionable advice to national and EU policy decision-makers aiming to create successful and inclusive digital transformation. Targeted policies in digital infrastructure, access to finance of innovations, and investments in the stock of human capital are highlighted by the analysis as capable of generating more return on investment than generic policies of growth (Iuga & Socol, 2024). Additionally, the paper contributes to the existing literature on the interaction between economic development and technological innovation in putting the challenge of AI into the perspective of not solely technological but systemic transformation which has to be supported by policies in concert and of different dimensions. Generally, this research contributes to the research literature in the novel way of relating macroeconomic structures to results of adoption of AI within European comparison. It contributes to the literature by jumping beyond firm-specific factors and supplying multi-country and multi-factor analysis blending both economics and machine learning. This research negates oversimplified assumptions about the interaction between national wealth and digitalisation and instead stresses institutional quality, access to finance, and strategic policy coordination. For that purpose, the research is theoretically and practically important in advancing scholarly knowledge of digital transformation and offering evidence-driven insights to support policymaking in the era of AI-driven innovation
The article proceeds as follows: the second section presents a critical analysis of the relevant literature, the third section presents the methodology and data used in the analysis, the fourth section shows the results of the panel data model comparing fixed effects with random effects, the fifth section shows the comparative analysis of various prediction-oriented machine learning algorithms, the sixth section compares machine learning algorithms for clustering, the seventh section analyzes the policy implications, the eighth section concludes.
2. Literature Review
Artificial intelligence (AI) is moving swiftly to transform macroeconomic theory, as well as to emerge as a structural force with the potential to reshape productivity, redesign labor markets, and raise new challenges to public policy. Recent research converges on the fundamental insight that the macroeconomic implications of AI are not predetermined, nor are they neutral, but are profoundly influenced by governance, regulation, and institutions. From growth and wage polarization to market concentration and inequality risks, AI is coming to be regarded as a general-purpose technology with the potential to drive sustainable and inclusive development—under appropriate guidance. The section provides a critical overview of the scholarly literature on the subject of greatest relevance, with identification of theoretical developments and empirical results that frame the role of AI in macroeconomic transformation. Through this review, we draw out the primary tensions and policy challenges at the convergence of innovation, employment, and economic governance.
Artificial intelligence (AI) is remapping macro economic theory both by increasing productivity and by posing policy challenges. Literature confirms consensus regarding the restructuring of growth, labor markets, inequality, and inflation by AI. Abrardi, Cambini, and Rondi (2019) denominate AI as general-purposed technology with sector spillovers and emphasize institutional and capital considerations. Acemoglu (2025) provides macro equilibrium between substitution by automation and productivity increases, and tension is palpable in Autor et al. (2022), finally concluding that employment by AI-related tasks is predominantly skill-biased and brings about wage polarization. Aghion, Jones, and Jones (2017) contend that AI is capable of sowing seeds in the long-term induced by innovation, but diffusion is bogged down by institutional frictions. Agrawal, Gans, and Goldfarb (2019) conceptualize AI as prediction engine and frame bases of sector productivity increases. Albanesi et al. (2023) argue uneven employment effects in Europe, where technology adoption is yet to fully offset lost traditional employment. Aldasoro et al. (2024) provide comfort that AI increases output with moderate reduction of inflation, of ultimate concern to monetary policymakers. In development economies, Aromolaran et al. (2024) emphasize that investments in AI cut poverty provided in equitable form. Microeconomic-wise, Babina et al. (2024) trace back to extension and innovation by AI, yet raise specter of threats of concentration to low-distortion-adjusting enterprises. Finally, Bickley et al. (2022) expose growing influences of AI on economic research itself. Within these findings, macroeconomic effects of AI are neither neutral nor inherent; rather, orientation is institution- and policy-sensitive. As Acemoglu presents, macro-economists are to grapple with AI neither as outside shock, nor static phenomenon; rather, it is to be managed as dynamic, policy-sensitive phenomenon in post-busk economies.
Bonab, Rudko, and Bellini (2021) outline both the two-pronged risk and potential of AI and the necessity to "anticipatory regulate" in order to not exacerbate inequality. Bonfiglioli et al. (2023) outline how U.S. commuting region take-up of AI reinforces labour polarisation, especially in cognitive work, and accentuates divergence of places concerns. As Bresnahan and Trajtenberg (1995) outline in accordance with theory of Generalised Pooled Transversals, AI drives growth in the case of complementarity of innovation—a stance reaffirmed by Brynjolfsson and Unger (2023), who regard AI as structural. However, as Brynjolfsson, Rock, and Syverson (2018) observe, growth in productivity is out of sight due to under measurement and delayed diffusion. Generative AI, in the view of Brynjolfsson, Li, and Raymond (2023), can increase productivity of low-skilled workers, but is uneven in diffusion. A behavioural factor is added by the argument of Camerer (2018), who suggests that macroeconomic behaviour can be revolutionised by algorithmic decision switching. Chen et al. (2016, 2024) outline world economy impact projections of economic impact of AI but refer to disparities in infrastructure and absorptive capability. Last but not least, Cockburn et al. (2018) outline AI as meta-technological in spurring R&D but warning of concentration of benefits. Overall, as is seen, with potential to transform, macroeconomic impact from AI is premised on equal policy, concerted governance, and design responsiveness to risk of distribution. Central to Cockburn et al. (2019) is to draw out how innovation is remade by AI and how it is capable of benefiting skilled-learning systems and exacerbating gaps between frontrunner and laggard places. Comunale and Manera (2024) outline possible rules lag, and delayed policy adjustment will exacerbate macro-level risk such as frictions in the labor market. Czarnitzki et al. (2023) outline how productivity growth in companies with increased intensity in knowledge is spurred by AI, although uneven growth is observed. Dirican's (2015) early work defines AI as carrying with it "creative destruction" of GDP structures. Eloundou et al. (2023) outline automation of tasks by large-language models and infer large-scale reskilling. Similarly, Ernst et al. (2019) put forward emerging markets' weakness. Felten et al. (2018) provide mapping of tasks within jobs to capabilities of AI in order to enable sectoral employment projections. Gazzani and Natoli (2024) simulate shocks of AI and illustrate how augmentative AI can enable inclusive growth. Potential deskilling of tasks in skilled employment based on usage of AI, particularly in finance, is discussed by Grennan and Michaely (2020). Finally, hybrid economic models to fit the complexity of AI systems are suggested by Gries and Naudé (2022). These articles collectively portray AI as both the source of macroeconomic asymmetry and as potential for transformation with strong recognition of need for forward-looking governance.Ruiz-Real et al. (2021) report growing use of AI in economics and finance but mention fragmentation of disciplines and recommend growing integration. Szczepanski (2019) cautions about unlimited use of AI with potential of increasing job loss and unevenness in places and Trabelsi (2024) identifies risk of digital divides in poor economies if inclusion policies are not followed. Varian (2018) identifies potential improvement in efficiency of companies by AI with risk of monopolies to be formed and raise questions about regulation. Wagner (2020) contends that AI triggers nonlinear macro-behavior and needs institutional infrastructure to handle systemic risk. Wang et al. (2021, 2025) project impacts of AI on development with special mention of digital infrastructure and demographic transition. Webb (2019) identifies disproportionate offshoring of cognitive work by AI threaten mid-skill employment and doubles polarization. In health, Wolff et al. (2020) mention selectively large efficiency impacts of AI but write about dependency on trust and government. Zekos (2021) concludes by identifying coordination by countries to balance societal advantages of AI and public risk. On aggregate, these researches challenge adaptive institutions to guide use of AI to bring about more equal and sustainable economic development.
A synthesis of the literature review by macro-themes is presented in the following Table 1.
In summary, the literature reviewed here emphasizes how artificial intelligence is not simply a technological innovation but is instead a force of transformation in macroeconomics that magnifies underlying structural dynamics and injects new uncertainties. Failing to produce automatic or identical results, the macroeconomic impacts of AI are influenced by institutional settings, policy options, and socio-economic environments. As illustrated, AI has the potential to raise productivity, underpinning inclusive growth and innovation, but with notable prospects of inequality, polarization, and market concentration. The key challenge of the future is to create forward-looking, adaptive governance that is resilient enough to realize the benefits of AI and neutralize the distributional and systemic threats.
3. A Methodologically Integrated Approach to Analyzing AI Adoption: Panel Econometrics Meets Machine Learning
Methodologically, the joint use of fixed and random effects panel data models along with machine learning regression and clustering models is not merely appropriate but methodologically justified in the study of AI adoption in macroeconomic contexts. Their panel data nature—between countries and multiple years—naturally demands econometric techniques capable of handling both cross-section as well as time-series heterogeneity. Fixed effects models are methodologically appropriate if the aim is to control for unobserved, time-constant heterogeneity between countries, e.g., institutional contexts, judicial systems, or country-specific innovation-related mindsets. Random effects models are more efficient on the proviso that country-specific heterogeneity is uncorrelated with regressors. Using both and testing with the Hausman test, the research maximises robustness and minimises the risk of model misspecification (Popović et al., 2025). Concurrent with this, use of machine learning models such as K-Nearest Neighbors (KNN), Random Forest, Boosting, and SVM to regression adds another valuable layer of methodological robustness.
These are not strict parametric models and are particularly robust in capturing subtle, non-linear relationships which more orthodox econometric models are likely to overlook (Tapeh & Naser, 2023). Their use is methodologically justified in those contexts where the aim is not merely to explain but to predict the rate of adoption of AI conditional on several macroeconomic inputs. Furthermore, comparing models on the basis of a set of measures of fit (MSE, RMSE, MAE, MAPE, R²) allows data-driven, nuanced choice of optimal algorithm in data-rich decision spaces such as cybersecurity and economic modeling (Ozkan-Okay et al., 2024).
Clustering techniques like Hierarchical, Density-Based, and Neighborhood-Based enrich the analysis with latent groupings of countries with comparable economic profiles and adoption behavior towards AI. Methodologically, this is necessary in order to transcend averages and reveal structural patterns important to analysis of policy comparability. These techniques of unsupervised learning are capable of segmenting the data in such a manner as to bring out hidden structure and policy-focused clusters (Shokouhifar et al., 2024). That convergence of techniques is not coincidental, but methodological. Panel regression provides causal inference and interpretability, machine learning supplies flexible and precise prediction, and clustering provides structural insights into heterogeneity. In the domain of AI in finance, to take an example, research has demonstrated how convergence of topic modeling and clustering reveals distinct thematic patterns which would be lost to us (Olasiuk et al., 2023). Their convergence fulfils several analytic roles—description, explanation, prediction, and categorization—within and in the same, enveloping process. That multi-method is itself well suited to the phenomenon as fluid and multi-dimensional as adoption of AI, where linearity and isolationist models would be powerless to describe interaction between financial factors, institutional bias, and international competitiveness. As highlighted by more recent bibliometric evaluations, pushing forward the use of AI in public administration is in line with growing demand for integrated, multi-method analyses to guide decision-making on large scale (Popescu et al., 2024). Application of panel econometrics and machine learning in tandem is thus therefore a solid, justified, and methodological sophisticated way of knowing macroeconomic drivers of digital transformation.
We have used the following variables as showed in the following Table 2.
4. Understanding AI Diffusion in EU Enterprises: Evidence from Fixed and Random Effects Models
To investigate the macroeconomic determinants influencing the adoption of artificial intelligence (AI) technologies among large European Union enterprises, this study employs a metric-driven panel data approach using both fixed-effects and random-effects estimations. The dependent variable, ALOAI, reflects the percentage of enterprises with at least 250 employees adopting at least one form of AI technology, based on Eurostat data and excluding agriculture, mining, and finance sectors. The analysis is based on a panel of 28 European countries observed over the period from 2018 to 2023. The objective of the research is to quantify the effect of key macroeconomic indicators—including health expenditure, domestic credit, exports, GDP per capita, capital formation, inflation, and trade openness—on AI diffusion across countries and over time. By comparing the performance and coefficients of both fixed-effects and generalized least squares (GLS) random-effects models, the analysis aims to identify statistically significant predictors of AI adoption and assess their relative impact.
We have estimated the following equation:
where i=281 and t=[2018;2023].
The econometric results are showed in the following Table 3.

Table 3.
Results of the econometric panel data model.
| Fixed-effects, using 151 observations | Random-effects (GLS), using 151 observations | |||||
|---|---|---|---|---|---|---|
| Coefficient | Std. Error | t-ratio | Coefficient | Std. Error | z | |
| const | 232.103 | 187.502 | 1.238 | 1.43750 | 11.7344 | 0.1225 |
| HEAL | 3.96946*** | 0.894018 | 4.440 | 3.69032*** | 0.789923 | 4.672 |
| DCPS | −0.286226*** | 0.0982208 | −2.914 | −0.159030** | 0.0697545 | −2.280 |
| EXGS | −2.15202*** | 0.583538 | −3.688 | −1.72654*** | 0.490134 | −3.523 |
| GDPC | 0.000579674** | 0.000262903 | 2.205 | 0.000752955*** | 0.000157700 | 4.775 |
| GCFG | −1.02356*** | 0.351578 | −2.911 | −0.751295*** | 0.289279 | −2.597 |
| INFD | 0.213992*** | 0.0718891 | 2.977 | 0.223578*** | 0.0647466 | 3.453 |
| TRAD | 1.05806*** | 0.286420 | 3.694 | 0.85472*** | 0.245487 | 3.482 |
| Statistics | Mean dependent var | 26.99636 | Mean dependent var | 26.99636 | ||
| Sum squared resid | 2984.013 | Sum squared resid | 21868.54 | |||
| LSDV R-squared | 0.924381 | Log-likelihood | −589.9118 | |||
| LSDV F(34, 116) | 41.70631 | Schwarz criterion | 1219.962 | |||
| Log-likelihood | −439.5324 | rho | 0.574965 | |||
| Schwarz criterion | 1054.670 | S.D. dependent var | 16.21961 | |||
| rho | 0.574965 | S.E. of regression | 12.32335 | |||
| S.D. dependent var | 16.21961 | Akaike criterion | 1195.824 | |||
| S.E. of regression | 5.071908 | Hannan-Quinn | 1205.630 | |||
| Within R-squared | 0.345539 | Durbin-Watson | 0.596079 | |||
| P-value(F) | 1.78e-50 | |||||
| Akaike criterion | 949.0648 | |||||
| Hannan-Quinn | 991.9670 | |||||
| Durbin-Watson | 0.596079 | |||||
| Test | Joint test on named regressors - Test statistic: F(7, 116) = 8.74929 with p-value = P(F(7, 116) > 8.74929) = 1.3237e-08 | 'Between' variance = 265.282 'Within' variance = 19.761 mean theta = 0.882933 Joint test on named regressors - Asymptotic test statistic: Chi-square(7) = 75.88 with p-value = 9.50198e-14 | ||||
| Test for differing group intercepts - Null hypothesis: The groups have a common intercept Test statistic: F(27, 116) = 17.3621 with p-value = P(F(27, 116) > 17.3621) = 2.98603e-29 | Breusch-Pagan test - Null hypothesis: Variance of the unit-specific error = 0 Asymptotic test statistic: Chi-square(1) = 158.842 with p-value = 2.02581e-36 | |||||
| Hausman test - Null hypothesis: GLS estimates are consistent Asymptotic test statistic: Chi-square(7) = 8.05723 with p-value = 0.327574 | ||||||
The panel data analysis of adoption of artificial intelligence (AI) by large European Union enterprises, as the share of companies with more than 250 staff utilizing any kind of AI technology (ALOAI), provides important evidence on macroeconomic drivers of technological diffusion among EU member countries. The version of the analysis based on the fixed effects and random effects (GLS) econometric models, with 151 observations and on the complete range of macroeconomic indicators available (current health expenditure, HEAL; domestic credit to the private sector, DCPS; exports of goods and services, EXGS; gross domestic product (GDP) per capita, GDPC; gross fixed capital formation, GFCF; inflation as captured by the GDP deflator, INFD; and trade openness, TRAD), provides strong evidence of the economic variables' influence. Empirical work by Doran et al. (2025) provides support to the methodological approach. These authors analyze EU industry automation systems and confirm the key role of economic sector structures in dictating technology take-up. Buglea et al. (2025) apply panel data on Central and Eastern European countries to analyze the adoption of digital transformation and confirm the role of structural and macro variables in shaping technology adoption. The fixed effects estimation, accounting for unobserved heterogeneity of countries, identifies various variables with statistically significant impacts on adoption of AI. Health expenditure has a highly significant and positive impact (coefficient = 3.969, p < 0.01), implying that increased public spending on health might reflect both wider institutional capabilities or investment in personnel not independently contributing to the potential deployment of AI. The same significance and positive impact is replicated in the random effects estimations (coefficient = 3.690), establishing the robustness of results to different estimation techniques.
A second key result is the statistically significant and negative effect of domestic credit to the private sector (DCPS), with coefficient –0.286 in the fixed effects and –0.159 in the random effects, both significant to conventional levels. This perverse result can be interpreted to be evidence of situations in which extensive availability of financing is not necessarily translated into finance to support innovation or digital transformation, or could reflect inefficiency in the use of capital in some economies. A similar complexity is addressed by Wagan and Sidra (2024), who highlight differences in venture capital efficiency between countries despite huge investment in AI. Goods and service exports (EXGS) also produce consistent and significant negative correlation with adoption of AI in both models, with coefficients –2.152 and –1.726 respectively. This can be interpreted to mean that economies more engaged in traditional export-oriented economic efforts tend to fall behind in digital innovation due to either path dependency in low-tech or labor-intensive economies or structural rigidity inhibiting disruptive technology adoption. This is in line with work by Abdelaal (2024), who observes that economies with prevailing traditional production bases tend to be more sluggish in redirecting resources to use in high-tech areas of application of AI. GDP per capita (GDPC) has small but statistically significant positive impact, meaning richer economies, as expected, are more likely to adopt AI technologies. At the same time, the magnitude is low (0.000579 in fixed effects and 0.000753 in random effects), meaning that by itself, the issue of GDP is not the overriding factor but part of some wider set of enabling factors. This is consistent with Žarković, Ćetković, and Cvijović (2025), who observe that the impact of GDP per capita on economic modernization varies unevenly in existing and new EU member states and draw on the theoretical argument that deeper structural factors drive growth paths and technology diffusion.
Gross fixed capital formation (GFCF), quantifying investment in infrastructure and productive assets, unexpectedly produces a negative and significant coefficient in both specifications. This is open to questions about whether such investment is targeted towards physical capital in the usual sense rather than to intangible or digital assets that would enable the integration of AI. The result is consistent with evidence from Giannini and Martini (2024) on enduring regional heterogeneity in economic structure and innovation preparedness throughout the EU and many of which are likely to bias the efficiency of traditional spending. Inflation (INFD), quantified by the GDP deflator, has a positive and significant impact on the adoption of AI, perhaps capturing the instance of moderate inflation accompanying vigorous investment environments or policies with the aim of expansion that support digital innovation. Last, trade openness (TRAD) exerts strong positive and highly significant influence in both specifications (estimates of 1.058 and 0.855), affirming that access to world markets is a stimulus to the adoption of AI. This is likely to be the result of such mechanisms as exposure to foreign competition, technology transfer, and integration in foreign-made global value chains, supported by empirical evidence from Nguyen and Santarelli (2024), who reveal that open economies in Europe gain considerably from spillovers from AI since they are more integrated with the world. Statistically, the fixed effects specifications present significant explanatory power with an R-squared of 0.924 and significant F-statistic (F = 41.706), reflecting well-specified models with large fractions of the variance in the dependent variables resolved by the included regressors. The random effects specifications are respectable too, with joint chi-square tests (Chi2 = 75.88, p < 0.00001) affirming significance, though the Hausman test (Chi2 = 8.057, p = 0.328) is not significant to indicate any difference between fixed and random effects estimators, meaning that the random effects specifications are statistically consistent. Still, with the highly significant F-test of different group intercepts (F = 17.36, p ≈ 0.00) and Breusch-Pagan test rejecting homoscedasticity's null (Chi2 = 158.842, p ≈ 0.00), the fixed effects specifications are still preferred in eliciting country-level heterogeneity that remains unobserved. The low Durbin-Watson statistic in both models (~0.59) suggests some degree of autocorrelation, though this does not seem to undermine either the significance or the signs of the coefficients.
Ultimately, these results affirm a multi-dimensional and sometimes non-monotonic correlation between macroeconomic markers and adoption of AI. Structural drivers such as spending on health, financial stability, and integration into trade are available to underpin digital innovation, while variables traditionally associated with development, such as capital and the formation of credit, are not necessarily positively correlated in all cases. Such is consistent with evidence by Tiutiunyk et al. (2021) who argue that although digital transformation is good with macroeconomic stability in EU economies, interaction with such traditional variables of growth such as credit and capital is more complicated and circumstance-variant. This implies that boosting levels of access to investment or credit is not sufficient unless and jusqu'à targeted to support activity of facilitating innovation and backed by institutional preparedness. For example, Iuga and Socol (2024) demonstrate how institutional variables play heavily into readiness of EU member states to adopt AI and complacency in such bridging of gaps will leave brain drain exposed in especially the less-developed regions of the Union. Furthermore, goodness of fit of the models reinforces importance of macroeconomic policy in shaping the digital competitiveness of EU economies. With rising salience placed on adoption of AI as driver of industrial modernity and economic resilience, such macro-booster to adoption can feed into more targeted and effective intervention both in member states and in the EU. For example, spurring adoption of AI is not about more investment of assets but strategic coordination of finance systems, policy on trade, health infrastructure, and digital plans to provide the canvas onto which innovation can seize. Such holistic strategic coordination is consistent with evidence by Challoumis (2024) who argues that AI is remaping economic fundamentals and calling on fiscal and innovation policies to make space in turn to accommodate new finance paradigm. Macro-econometric robustness of the models, in particular the large R-squared of the fixed-effects formulation and p-value convergence between estimators, reinforces importance of such inferences. Notably, the conclusions push policy to be strategic and dimensional, balancing macroeconomic planning and digital innovation ambitions. This is not just about enhancing health systems and participating in international trade but about aligning the lending and investment channels to facilitate capabilities fully digitally. While among the major sources of economic competitiveness and resilience, especially in the EU's wider digital and green transformations, this question confirms policymakers' need to underpin macroeconomic foundations that lead to the success of AI technologies in business.
5. Decoding AI Adoption in the EU: A Comparative Evaluation of Predictive Models and Macroeconomic Drivers
This section presents comparative analysis of eight regression models—Boosting, Decision Tree, K-Nearest Neighbors (KNN), Linear Regression, Neural Networks, Random Forest, Regularized Linear Regression, and Support Vector Machines (SVM)—using standard measures like MSE, RMSE, MAE/MAD, MAPE, and R². The aim is to analyze the prediction capability and generalizability of each of these models in the forecasting of large EU firm adoption of AI. In addition to benchmark models, the section provides KNN-based feature importance measure based on mean dropout loss to rank macro variables with the utmost impact in prediction of AI adoption. These analyses provide both methodological and policy insights into structural economic indicators shaping the diffusion of AI in various country contexts.
The results of the comparison among different algorithms is showed in the following Table 3.
Table 3.
Performance Comparison of Regression Algorithms Based on Standard Evaluation Metrics.
| Metric | Boosting | Decision Tree | KNN | Linear Regression | Neural Network | Random Forest | Regularized Linear | SVM |
|---|---|---|---|---|---|---|---|---|
| MSE | 0.187 | 0.31 | 0.000 | 0.23 | 1.000 | 0.293 | 0.293 | 0.214 |
| RMSE | 0.222 | 0.388 | 0.000 | 0.298 | 1.000 | 0.374 | 0.374 | 0.242 |
| MAE / MAD | 0.247 | 0.361 | 0.000 | 0.357 | 1.000 | 0.242 | 0.242 | 0.241 |
| MAPE | 0.100 | 0.107 | 0.000 | 0.477 | 0.658 | 0.750 | 0.750 | 1.000 |
| R² | 0.650 | 0.370 | 1.000 | 0.510 | 0.000 | 0.841 | 0.841 | 0.248 |
In comparing the performances of eight regression models—Boosting, Decision Tree, K-Nearest Neighbors (KNN), Linear Regression, Neural Networks, Random Forest, Regularized Linear Regression, and Support Vector Machines (SVM)—our consideration is on the same five basic statistical measures of Mean Square Error (MSE), Root Mean Square Error (RMSE), Mean Absolute Error/Mean Absolute Deviation (MAE/MAD), Mean Absolute Percentage Error (MAPE), and Coefficient of Determination (R²). These measures are essential indicators of how well the models fit, are stable, and generalize to unseen data. Lower values in MSE, RMSE, MAE/MAD, and MAPE, and the greater the R², the better the prediction accuracy, the stability of the model, and the more they generalize to unseen data. Of all the models tested, KNN shines with near-perfection in all the measures of evaluation with MSE, RMSE, MAE/MAD, and MAPE of 0.000 and R² of 1.000. This implies perfectly matching predictions of observed values with zero error. Though such kinds of performances are exceptionally rare in actual practical use and might be suggestive of overfitting, data leakage, or data with too low complexity, the results as they are set put KNN in the list of best performers and the top algorithm in this comparison. This is in accordance with the application of KNN in the environmental disciplines, like Raj and Gopikrishnan (2024), who showed how the algorithm performs in vegetation dynamics modeling, which emphasizes how the algorithm is effective with highly ordered, rich-feature data. The second-best is Boosting, which performs well with MSE of 0.187, RMSE of 0.222, MAE/MAD of 0.247, MAPE of 0.100, and R² of 0.650. These indicate that Boosting provides excellent balance of low deviation and decent explanation of variance, making it well suited for practical use, especially in complicated or more noisy environments. This is in accordance with time series finance use, like the work by Jenifel, Jasmine, and Umanandhini (2024), which employed Boosting in forecasting Bitcoin prices with successful results in noisy data. SVM performs reasonably well based on mean deviation with MAE/MAD of 0.241, better than Boosting and Random Forest. But it has the worst MAPE of 1.000 and thus greatly loses credibility in matters of percent-based precision, like that of financial prediction or health prediction. In addition, R² of 0.248 is quite low and represents little power to explain the dependent variable's variance. Such volatility in SVM is also witnessed in education analytics, where Kumah et al. (2024) observed such shortcomings in identifying nonlinear behavior in prediction of students' performance, especially with the involvement of categorical variables or in the case of badly scaled variables.
Conversely, Regularized Linear Regression and Random Forest have almost identical MSE of 0.293, RMSE of 0.374, MAE/MAD of 0.242, and R² of 0.841. However, both models have big errors in the form of MAPE (0.750), with poor relative prediction precision. Despite that, their big R², though not always linked with low MSE, reveals they are perhaps useful where capturing general trend, not specific values, is the objective. Such balance between measures based on errors and measures in explaining the variance has also been shown by Chandra, Vimal, and Rajak (2024) in comparing relative merits of different machine learning models employed in prediction of the production processes, where Random Forest was praised on trend matching but is criticized on the basis of sensitivity to outliers. Decision Tree is no better on the majority of the measures. Its MSE and RMSE (0.310 and 0.388, respectively) are among the largest, with MAE/MAD (0.361) and R² (0.370) of the same. Only on the measure of MAPE (0.107) is it decent, with slightly better relative error than Random Forest and SVM. Such frailties of Decision Tree models have also been shown by Vijayalakshmi et al. (2023) in prediction of medical insurance prices, where regression models yielded more stable relative performances in both the measures of absolute and percentage. Little better results are found in Linear Regression with MSE of 0.230, RMSE of 0.298, MAE/MAD of 0.357, and R² of 0.510. These are average measures and respectable balance between complexity and generalizability, though not great in any of the measures. Last, best of all the models (though still very poor) is the Neural Network with greatest possible MSE, RMSE, and MAE/MAD (all equal to 1.000) and lowest possible R² (0.000), to suggest that it is not able to learn any useful mapping of the features to the target. Its MAPE of 0.658 only supports this. Such low performance can be due to either poor optimization of the architecture, insufficient training data, or too deep of a network to be processed by the dataset. Balila and Shabri (2024) also show the same weakness in property price prediction, with deep models performing poorly with lesser simple models owing to over fit and data poor generalization.
Upon comparison of all models based on holistic interpretation of metrics, KNN is by far the best performer. It not only minimizes both types of errors and explains 100% of target data's variance. Yet, such flawless performance is suspicious on grounds of both overfitting and generalizability, especially if the model has memorized data instead of learning patterns. To confirm KNN’s performance thus, it would be crucial to validate it on hold-out test set or by cross-validation before it is implemented into production. Hypothetically, under the assumption of results' stability between different data partitions, KNN would be best to implement due to rock-bottom accuracy and zero-error metrics. Boosting is a strong second best in case both the robustness of the model and generalizability are more essential and with perfect prediction not. Then follow Regularized Linear Regression and Random Forest, which are similar (especially in explaining variance), though with relative errors that are greater. SVM’s rare combo of low MAE and high MAPE is less dependable in practical use where proportional errors are paramount. In this specific setting, Neural Networks should be avoided or heavily re-optimized to further improve learning. This is in support of research by Elnaeem Balila and Shabri (2024), warning of application of highly intricate models such as deep learning where simple programs are both accurate and reliable—as was the case with the prediction of property price in Dubai via traditional application of machinel learning techniques. In practical use in the world outside, not only numerical performance but also computational cost, scalability, interpretability, and sensitivity to noise need to be considered. KNN, as instance, is unlikely to be able to work with large data due to lazy learning and sensitivity to feature scaling. Boosting and Random Forest are scalable and robust but more computationally expensive. Linear models provide interpretability, very crucial in regulated fields such as medicine and finance though with marginally less favorable prediction capability. For instance, Zeleke et al. (2023) used Gradient Boosting to predict prolonged hospital stays and demonstrated how their strength and explanation of variance made it well suited to more complex, high-risk domains where interpretability was also of concern. Similarly, Kaliappan et al. (2021) observe that public health use case performance evaluations—like prediction of reproduction rate of COVID-19—must be more concerned with generalizability than optimality of errors and thereby confirm Boosting's second best in such use. In this use, optimal algorithm selection heavily depends on goals and limitations of the use case. On purely performance metrics here, however, KNN is plainly best performing, outperforming all else in all tested categories. Boosting is second best, giving a fast and stable mix of low errors and interpretability. Random Forest and Regularized Linear Regression both claim third place, excelling in explanation of variance but falling in relative precision. SVM and Decision Tree both perform in the middle ranks, with Linear Regression performing decently enough but not notably so. The Neural Network model, based on currently available performances, is best not implemented without extreme modification. The above observations are of utility as decision bases in optimal selection of models, hyper parameter optimization, and tuning of models in future endeavors in predictive modelling. The level of mean dropout loss is presented in the following Table 4.
Application of K-Nearest Neighbors (KNN) models to the adoption of artificial intelligence (AI) by large European Union companies—defined as the proportion of companies with more than 250 employees that are utilizing at least one AI technology—provides insights into the relative significance of various macroeconomic indicators in prediction. Analysis is based on a matrix of variables such as health expenditure (HEAL), domestic credit to the private sector (DCPS), exports (EXGS), GDP per capita (GDPC), gross fixed capital formation (GFCF), inflation (INFD), and trade openness (TRAD), which are indicators of structural and financial features of EU countries' economies. The mean dropout loss is the main measure of the importance of variables, defined as the root mean squared error (RMSE) on 50 permutations. This is the measure of how much prediction effectiveness is lost by excluding any particular variable from the model, thereby providing data-driven insight into how each of the features contributes to estimating AI adoption. Of the variables under investigation, domestic credit to the private sector (DCPS) is found to be the most important with the largest mean dropout loss of 12.451, implying that excluding this variable results in the best reduction in the performance of the model. This points to access to finance contributing to AI-related investments and innovation capabilities in large enterprises. It is also possible that it points to the significance of liquid financial systems that support risk taking and technologically intensive financial investments. Kotrachai et al. (2023) confirm this interpretation in their analysis of models of detecting credit card fraud, where explanation techniques highlighted financial features as key to algorithmic functionality, and the significance of internal financial circumstances in the prediction. By contrast, factors like trade openness (TRAD) and exports of goods and services (EXGS) have low dropout losses of 6.106 and 6.239 respectively, to imply that although still useful, removal results in a less significant reduction in model prediction. This can be interpreted to mean that external economic activity, though significant, is not as key to understanding the adoption of AI as are internal finance and development structures. The relative importance of these internal drivers is also reflected in the health sector, wherein Sehgal et al. (2024) illustrate that internal clinical factors are considerably more predictive of early AI-based systems of diabetes prediction than external behavioral inputs.
Furthermore, KNN's effectiveness in identifying patterns of adoption of a structured nature is mirrored in the work of Chaurasia et al. (2022), who employed analogous modeling approaches to understand the uptake of mobile technology among dementia patients—how proximity-based models are well-positioned to identify complex yet consistent patterns of adoption among socio-economic segments. Notably, both health spending (HEAL) and economic prosperity (GDP per capita, or GDPC) have the same dropout loss of 9.269 and are in the middle range of importance. This coincidence implies both economic well-being and investment in health (proxying institutional and human capital capabilities) both play equally in the formation of the economic environments in which adoption of AI is possible. These results are reflected in the argument of Siddik et al. (2025) that institutional preparedness—measured in the form of health and education infrastructure—is a key enabler of technology-facilitated sustainable growth, including in the tourism and more macro economic cycles. Gross fixed capital formation (GFCF) maintains some lesser loss of 8.077, implying that investment in infrastructure and fixed capital is important but perhaps not as crucial as credit access and investment in health and education. Inflation (INFD) lies in between with a dropout loss of 6.682, perhaps mirroring its contributory but by no means small role in mediating economic environments either favorable to or restrictive of innovation. Moderate inflation might be seen as measuring economic dynamism, whereas excessive and idiosyncratic inflation can be deterring to investment in long-term AI projects. Gonzalez (2025) corroborates the inflation-AI link, observing in his work that the application of machine learning to inflation forecasting more and more emphasizes the intricate dynamics between macro volatility and technological investment judgments. In turn, KNN algorithm-based analysis appears to demonstrate that although all of these variables play meaningful roles in estimating the adoption of AI, there is clearly some gradient of importance. Financial health, more so access to credit, are the strongest predictors in the KNN model, followed by national wealth and institutional capacity indicators. While the latter are still of importance, they seem to have less of an explanation in this machine learning economic mode. These results underscore the complexity of AI adoption and imply that internal finance systems and public investment frameworks are more likely to be of immediate influence than external economic exposure. This observation can guide targeted policy intervention to encourage the diffusion of AI by giving preference to local credit systems, enhancing institutional preparedness, and harmonizing macroeconomic policy with digital innovation.
The predictive values of the model are indicated in Table 5
The additive explanations from the application of the K-Nearest Neighbors (KNN) algorithm to the prediction of ALOAI—the share of large European Union companies making use of one or more of the three selected AI technologies—are of use in understanding macroeconomic drivers of AI adoption in five different test cases. Based on data from Eurostat, the baseline prediction (titled "Base") by the model is supplemented by measuring the additive effectiveness of seven macro variables in isolation: current health spending (HEAL), domestic private sector credit (DCPS), exports of goods and services (EXGS), economic output per capita (GDPC), gross fixed capital formation (GFCF), inflation (INFD), and trade (TRAD). In Case 1, the final prediction of 28.210 represents modest improvement from the baseline of 26.351, courtesy of mostly positive marginal effects from GFCF (+4.913) and HEAL (+2.395), implying that investment and government spending on health facilitate AI takeoff. This is, in turn, nearly reversed by large negative marginal effects from DCPS (–6.413) and TRAD (–1.041), meaning poor access to finance and low integration in external markets cut down on the prospects of AI diffusion, despite other encouraging circumstances. These are in accordance with findings by Okoye (2023), who demonstrates how underinvestment in institutional infrastructure such as education critically degrades the explicative power of machine learning models in the presence of systemic financing restrictions. The more stable economic profile in Case 2 results in a final prediction of 33.490, where the increase is driven by HEAL (+2.969), GFCF (+3.040), and INFD (+1.839), and other variables have little marginal effect. The single negative marginal contribution of note is from DCPS (–1.807), implying some financial constraint but otherwise robust economic fundamentals supporting the uptake of AI. The inflation effects observed are also in accordance with results from Maccarrone, Morelli, and Spadaccini (2021), who highlighted that macro volatility—where moderate and reliable—is supportive of innovation since it sends the message of a dynamic and growth-oriented setting. Case 3 possesses very poor macro fundamentals and is characterized by large drops from the baseline, with a forecast of ALOAI equal to 15.690. This is characterized by large negative marginal effects from DCPS (–8.334) and GFCF (–5.020), which imply low financial flexibility and underdevelopment of assets. These patterns substantiate the sensitivity of KNN prediction models to internal economic structure and capital restrictions, as seen in Wang et al. (2024), wherein enhanced KNN models in stock prediction highlighted the pivotal role of economic input variables on model variance stability and accuracy (Figure 1).
While minor positive effects are triggered by EXGS (+0.658), HEAL (+0.334), and TRAD (+1.182), these are insufficient to balance the overall downward pressures, such that this economy is not in favorable position to be undergoing technological transformation. Case 4 is more nuanced: although its final estimate of 23.030 is slightly below the base, under the influence of downward pulls of HEAL (–2.654), GFCF (–8.331), DCPS (–5.391), and GDPC (–0.204), the large positive influence of TRAD (+9.229) and INFD (+2.877) provides partial alleviation. This suggests an economy with poor home investment but superior international integration, with international trading dynamics providing partial alleviation from internal weaknesses—isolated in the profile of potential emerging market with selective digital development. These tendencies are in line with those of Alayo, Iturralde, and Maseda (2022), who found that internationalization in weak structural contexts can improve innovation performance, especially where organizational form is flexible. Case 5 is a self-evident exception, with the highly boosted ALOAI prediction of 66.220 being a large, better-than-base departure. This is supported by very strong support from all of GFCF (+18.006), DCPS (+15.768), GDPC (+2.582), EXGS (+1.517), TRAD (+5.173), and INFD (+1.513), except from HEAL (–4.690), such that in this case, perhaps government spending priorities are unbalanced. In any event, it is well and truly outgunned by the pro-innovation influences of the other variables. In each case, some consistencies are evident: both GFCF and DCPS are always the largest in magnitude variables, with very elevated levels of investment having greatest impact on disclosed use of AI, and negative levels of credit having greatest depressing influence. TRAD always contributes constructively inasmuch as it is strong, such that international integration is clearly an important facilitatory factor of AI diffusion. INFD, although traditionally viewed as risk factor, is found to be used here as euphemism of managed economic expansion in support of investing in AI under certain assumptions. This is consistent with new work by Benigno et al. (2023) and Stokman (2023), in which it is illustrated that inflation—is it certain and anchored—can be used as evidence of favorable investment environments and not economic chaos. Accordingly, Erdoğan et al. (2020) verify the complexity of inflation dynamics in crisis periods (like COVID-19), with warnings to broad assumptions of all inflation harming innovation. GDP per capita has weak and mixed effects, such that aggregated wealth is not in itself highly determinant of technological adoption by enterprises. In similar veins, health expenditures are found to have mixed effects, beneficial in some settings and negative in others, and perhaps depending on whether such spending complements or crowds out innovation funding. In conclusion, these additive explanations reveal that the adoption of AI is driven less by overall economic prosperity and more by the structural investment makeup, degree of exposure to international trade, and access to finance. Countries wishing to expand enterprise-level adoption of AI need to therefore prioritize policies increasing productive capital formation, securing strategic access to credit, and further integration into world markets. These results also highlight the usefulness of interpretable machine learning techniques in policy design, in which knowing the specific impact of individual variables can facilitate more optimal intervention design than black-box prediction. Overall, the KNN-based additive explanation model uncovers the subtle and setting-specific interaction between macroeconomic circumstance and dispersion of AI, and offers evidence from data to support ongoing progress towards digital transformation in Europe.
6. Evaluating Clustering Algorithms for AI Adoption Analysis in the EU: A Multimetric Approach
To assess relative performance of various clustering techniques in capturing large European Union firm artificial intelligence (AI) adoption patterns, standardized evaluation measures were employed to assess six different algorithms, including Density-Based, Fuzzy C-Means, Hierarchical, Model-Based, Neighborhood-Based, and Random Forest clustering. These measures—ranging from explanatory power (R²) to statistical efficiency (AIC, BIC), from measures of geometric cohesion (Silhouette Score, Dunn Index) to cluster structure (Entropy, Maximum Diameter, Calinski-Harabasz Index)—allow the relative merits and demerits of each algorithm to be assessed in detail. The aim of this is to identify the algorithm that best achieves balance between model fit, interpretability, and the geometric integrity of the resulting clusters and thereby offers the best of all possible instruments to analyze AI diffusion along macroeconomic patterns (Table 6).
Comparison of six clustering techniques—Density-Based Clustering, Fuzzy C-Means Clustering, Hierarchical Clustering, Model-Based Clustering, Neighborhood-Based Clustering, and Random Forest Clustering—has different performance profiles on various standardized evaluation measures. These measures are R², AIC, BIC, Silhouette Score, Maximum Diameter, Minimum Separation, Pearson’s Gamma, Dunn Index, Entropy, and the Calinski-Harabasz Index, all standardized to between 0 and 1 to enable direct comparison. The objective of the analysis here is to identify the algorithm with the best balance between statistical quality and geometrical clustering quality. Beginning with R², which is the ratio of the amount of the variance in the data that is explained by the clustering model, to the total amount of variance in the data, we have the best possible score by Neighborhood-Based Clustering, reflecting excellent explanation of data. Hierarchical Clustering is next with the best possible score, followed by moderate scores from Random Forest Clustering. Lower in the ranks are Model-Based and Fuzzy C-Means, and lowest in the ranks is Density-Based Clustering, implying failure to explain the data’s variance structure. These are in line with the observations by Sarmas, Fragkiadaki, and Marinakis (2024), who highlighted the superiority of ensemble and neighborhood-aware clustering to capturing subtle consumer behavior to be used in demand response in transport systems. With regards to criteria in selecting models such as the Akaike Information Criterion (AIC) and the Bayesian Information Criterion (BIC), measuring both the goodness of fit and the complexity of models, Hierarchical Clustering and Neighborhood-Based Clustering get the best possible scores, implying optimal performance. In turn, Density-Based Clustering and Fuzzy C-Means get the worst possible scores, implying low efficiency of the models and possible overfit or lack of parsimony. When comparing the Silhouette Score, which is how similar an object is to its own cluster in contrast to other clusters, we have the best possible score by Density-Based Clustering, implying forming well-separated and well-defined clusters. Hierarchical Clustering is next best, followed by moderate cohesion by Neighborhood-Based Clustering. Fuzzy C-Means, Model-Based, and Random Forest get poor scores in this dimension, meaning that their cluster boundaries are not well defined. These findings are in line with general trends found in comparative clustering research such as that of Thamrin and Wijayanto (2021), who illustrated different kinds of performance trade-off between soft and hard clustering models based on the data structure and population homogeneity.
Looking in particular at Maximum Diameter, which measures the greatest intra-cluster distance and ideally would be minimized, Model-Based Clusters, Density-Based Clusters, and Neighborhood-Based Clusters exhibit the tightest clusters with the lowest diameters. Conversely, Fuzzy C-Means measures the largest value, reflecting large and perhaps poor clusters. This trend is in line with the application of clustering observed in Elkahlout and Elkahlout (2024), wherein spatial clustering of groundwater wells necessitated diligent consideration of intra-cluster variability to obtain meaningful geographic boundaries. Hierarchical Clusters and Random Forest Clusters are in the middle of the spectrum. Minimum Separation, which is the measure of the minimum distance between cluster centers and optimally would be large, positions Density-Based Clusters on top, with excellent cluster separation. Hierarchical Clusters perform in the middle, and while Neighborhood-Based Clusters scores low, this is perhaps suggestive of overlapping or close clusters. Fuzzy C-Means ranks lowest, further evidence of the former's poor intra- and extra-class definability. Pearson’s Gamma, reflecting data distance correlations with cluster assignments, places Density-Based Clusters in top position, with Hierarchical Clusters and Neighborhood-Based Clusters performing reasonably well. Random Forest and Fuzzy C-Means are lowest on this list, and imply poor spatial correspondence. Dunn Index, which integrates both the cluster compactness and separation and serves as a strong measure of overall cluster quality, yet again positions Density-Based Clusters on top, with Hierarchical Clusters and Neighborhood-Based Clusters immediately in second and third positions. This measure is in keeping with observations from Silhouette, Separation, and Pearson’s Gamma. Fuzzy C-Means and Model-Based Clusters lag behind, reflecting poor intra-class compactness and inter-class distinctness. This is consistent with observations by Da Silva, Melton, and Wunsch (2020), who highlighted the importance of dynamic and incremental measures of validity to rank hard partitioning techniques, particularly where clusters undergo changes or update in the online setting. Entropy, reflecting here the degree of disorder or randomness in cluster assignments and optimally would be low, further penalizes Fuzzy C-Means, which measures the greatest value, and suggests overlapping and noisy clusters. In contrast, Density-Based Clusters, Neighborhood-Based Clusters, and Model-Based Clusters obtain the lowest entropies and more ordered cluster assignments. These findings confirm the warning uttered by Gagolewski, Bartoszuk, and Cena (2021) that cluster validity indexes can differ in significant ways between and among different algorithms and are best interpreted in their specific contexts and not comparatively in isolation. Lastly, the Calinski-Harabasz Index, the variance ratio measure that penalizes low between-cluster and within-cluster dispersion, ranks Hierarchical Clustering in first position, and Fuzzy C-Means next. This is partially at odds with the rest of the measures but suggests that Hierarchical Clustering works exceptionally well if viewed from a variance-based dimension. On this measure, the lowest rank is occupied by Density-Based Clustering and it is possible to speculate that although spatially well-defined, such clusters will not meet traditional expectations of statistical variance—a difference expressing the model-agnostic findings highlighted by Sarmas, Fragkiadaki, and Marinakis (2024) in their research on explainable ensemble clustering on the modeling of complex systems.
Together, the results demonstrate that no algorithm excels the rest on all measures but that different patterns are clear. Density-Based Clustering behaves well in clustering quality in terms of geometry with leading scores in measures of structure, separation, and coherence such as Silhouette Score, Dunn Index, Pearson’s Gamma, and Minimum Separation. These findings are in line with those of Auliani, Novita, and Afdal (2024), who demonstrated the superiority of the former in creating well-separate clusters in car sales data, especially in the data with noise. But the weak behavior of Density-Based Clustering in statistical measures such as R², AIC, BIC, and Calinski-Harabasz Index identifies it as lacking in explanation and statistical efficiency in pursuit of robust model-based inference. Hierarchical Clustering, on the other hand, has top-performing overall behavior with top ratings in R² and Calinski-Harabasz coupled with decent performance in structural measures such as Dunn Index and Pearson’s Gamma. This is in line with findings by Azkeskin and Aladağ (2025), who viewed hierarchical clustering to be effective in identifying regional energy patterns with statistical cohesiveness. Hierarchical Clustering is thus found to be a balanced algorithm with the potential to produce statistically sound and geometrical meaningful clusters. Neighborhood-Based Clustering has the best statistical profile with leading results in R², AIC, and BIC and decent results in diameter, entropy, and compactness. It does not have the lead in measures of geometrical separation, but is strong enough on all sides to be a serious runner. The balanced statistical foundation and decent structure of the models provide it with the potential to bridge the gap between interpretability and performance. Random Forest Clustering is found in the middle ground with decent behavior in all sides except in excelling in any specific area. Similarly, Model-Based Clustering has mixed results with some decent statistical behavior but poor geometrical cluster properties—a trend observed by Ambarsari et al. (2023) in comparing fuzzy versus probabilistic clustering methods in population welfare segmentation. Fuzzy C-Means Clustering, on the other hand, performs mixed results on nearly all measures, especially in terms of cohesion, separation, entropy, and statistical fit. This is consistent with findings by Sarmas, Fragkiadaki, and Marinakis (2024), who demonstrated fuzzy clustering methods to be lacking in situations where clear delineation and strong interpretability is needed. Considering all of these findings collectively as a whole, Neighborhood-Based Clustering is the best performer overall. Its balance of strong statistical fit, computational efficiency, simple cluster shape, and moderate but sufficient structural preservation makes it the best overall and most consistent algorithm to use to cluster in this context. While Density-Based Clustering generates well-separate and spatially coherent clusters, the lack of statistical stability decreases the utility of this algorithm in contexts that require both interpretability and inferability. Hierarchical Clustering is still another strong option, particularly under the application of the use of variance-based measures or hybrid approaches. Ultimately, whichever algorithm to employ would best be dictated by the specific aims of the analysis—whether statistical explanation, geometric simplicity, and/or implementation ease is of utmost importance. But with the application of the normalization measures here, Neighborhood-Based Clustering provides the best overall and strongest balance of performance in all of the measures of evaluation (Table 7).
Clustering outcomes here, based on macroeconomic indicators, attempt to provide explanations of patterns of adoption of artificial intelligence (AI) technologies—reflected in ALOAI—among large EU companies in different industrial and country contexts. Such explanation is based on standardized macroeconomic indicators such as current health expenditures (HEAL), domestic credit to the non-financial sector (DCPS), exports (EXGS), GDP per capita (GDPC), gross fixed capital formation (GFCF), inflation (INFD), and trade openness (TRAD). Derived clusters of seven are quite dissimilar in size, within-cluster homogeneity/similarity, and silhouette score, reflecting great heterogeneity in how macroeconomic environments are related to adoption of AI among European countries. Cluster 5 is the largest (n = 58), and with moderate within-cluster heterogeneity proportion (0.384), reasonably large within-cluster sum of squares (124.42), and moderate silhouette (0.346). Rather strikingly, it has negative ALOAI center of –0.837, reflecting below-average use of AI despite containing the largest number of countries. Its economic profile of uniformly negative or near-zero on salient variables such as GDP per capita (–0.821), domestic credit (–0.826), and trade openness (–0.074) reflects countries that are perhaps economically constrained, locked into traditional systems, or less integrated with the world, and lag behind on spread of AI. This is consistent with Popović, Todorović, and Milijić (2024), who illustrate how adoption of AI is positively linked with circular use of material and innovation-driven economies—factors which Cluster 5 countries could be lacking. Furthermore, Brey and van der Marel (2024) suggest the strategic role of human capital in enabling the integration of AI, and that Cluster 5 underperformance can also be traced to educational infrastructure and digital preparedness deficits. On the opposite side, Cluster 2, among better-defined clusters (n = 25, var. exp. 0.187), is characterized by very-high ALOAI center of 1.407, reflecting above-average enterprise level use of AI. Its macroeconomic profile of strong GDP per capita, moderate management of inflation, and healthy and favorable levels of both domestic and external credit and trade reflect dynamic economies. Such countries are also bound to be privileged with more developed financial and strategic digital systems and more exposure to international markets and innovation systems. Czeczeli et al. (2024) note that such countries are more likely to be resistant to inflation and policy flexible—two properties that foster economic stability and support investment in AI (Figure 2).
Their economic profile is comprised of favorable values on nearly all of the indicators, with special characteristics including strong home credit (1.512), moderate exports (–0.453), and respectable GDP per capita (0.907). Such a cluster is expected to be comprised of developed, mid-sized EU economics with stable access to capital and balanced external trade profiles that support moderate to high AI adoption. Such findings are supported by Bosna et al. (2024), who used clustering and ANFIS analysis to reveal macroeconomic balance to be the primary determinant of supporting growth and innovation following eurozone membership. Cluster 6 is small (n=24) but shares comparable structural characteristics with Cluster 2 with the exception of low ALOAI centre (0.379), meaning that, although macroeconomic fundamentals are reasonably favorable such as health spending (0.39), trade openness (0.837), and exports (0.857), other variables such as labor market rigidity, policy gaps, or low industrial digital maturity are likely to curb AI diffusion. These structural barriers are likely to be symptomatic of institutional preparedness challenges as discovered in the regression EU inflation study of Czeczeli et al. (2024), where clustering untangled different preparedness profiles to economic shocks. Cluster 3 is the largest low-ALOA cluster with large silhouette score (n = 35, silhouette = 0.334, ALOAI = 0.018). It has marginally positive health and credit indicators but negative exports (–0.741), trade openness (–0.776), and GDP per capita (–0.095), signifying internal economic development with minimal external market integration. Such findings are in consonance with observations by Arora et al. (2024), who showed by correlation and clustering that macroeconomic groupings of variables tend to divide along lines of internal vs. external orientation with implications on preparedness to innovate. Cluster 4 is small (n = 6) but is different in having high silhouette score (0.894) and above-mean ALOAI (0.693). It is marked by exceptionally strong exports (3.619), trade openness (3.579), and very high GDP per capita (2.933) but poor health spending (–1.533) and GFCF (–1.215). This is indicative of a group of high-income, export-dependent economies where dynamism of the private sector is capable of compensating poor public investment and infrastructure in health. Such configurations are representative of those influenced by industrial competitiveness rather than by institutional support, and also by Merkulova and Nikolaeva (2022) within their cluster membership of EU taxes indicators and fiscal capacity. Cluster 1, small in number (n = 2), has highly elevated measures of GDP per capita (1.809), trade (1.693), exports (1.653), and GFCF (5.168), but with very low health spending (–0.897) and domestic credit (–1.156). ALOAI is flat (0.018), inferring under-adoption of AI due to underdeveloped policy ecosystems or mismatch between financial and innovation systems. Nenov et al. (2023) see similar mismatch in their neural model predictions, noting how successful economies have low innovation outcomes if institutional or behavioral factors are not appropriately in balance with structural capabilities. Cluster 7 includes the extreme dataset in isolation, with highly elevated inflation (10.237) and negative scores in credit, GDP per capita, and trade. Its negative ALOAI (–0.527) is evidence of systemic economic volatility and infers best to be interpreted as representing simply an extreme (outlier) or abnormal macroeconomic regime not reflecting wider tendencies. Such extremes are in support of the application of unsupervised clustering analysis to reveal macroeconomic outliers, as previously demonstrated in multidimensional cluster research such as Bosna et al. (2024) and Czeczeli et al. (2024).
Figure 3.
Cluster Membership Visualization in Two-Dimensional Projection with Case Labels.
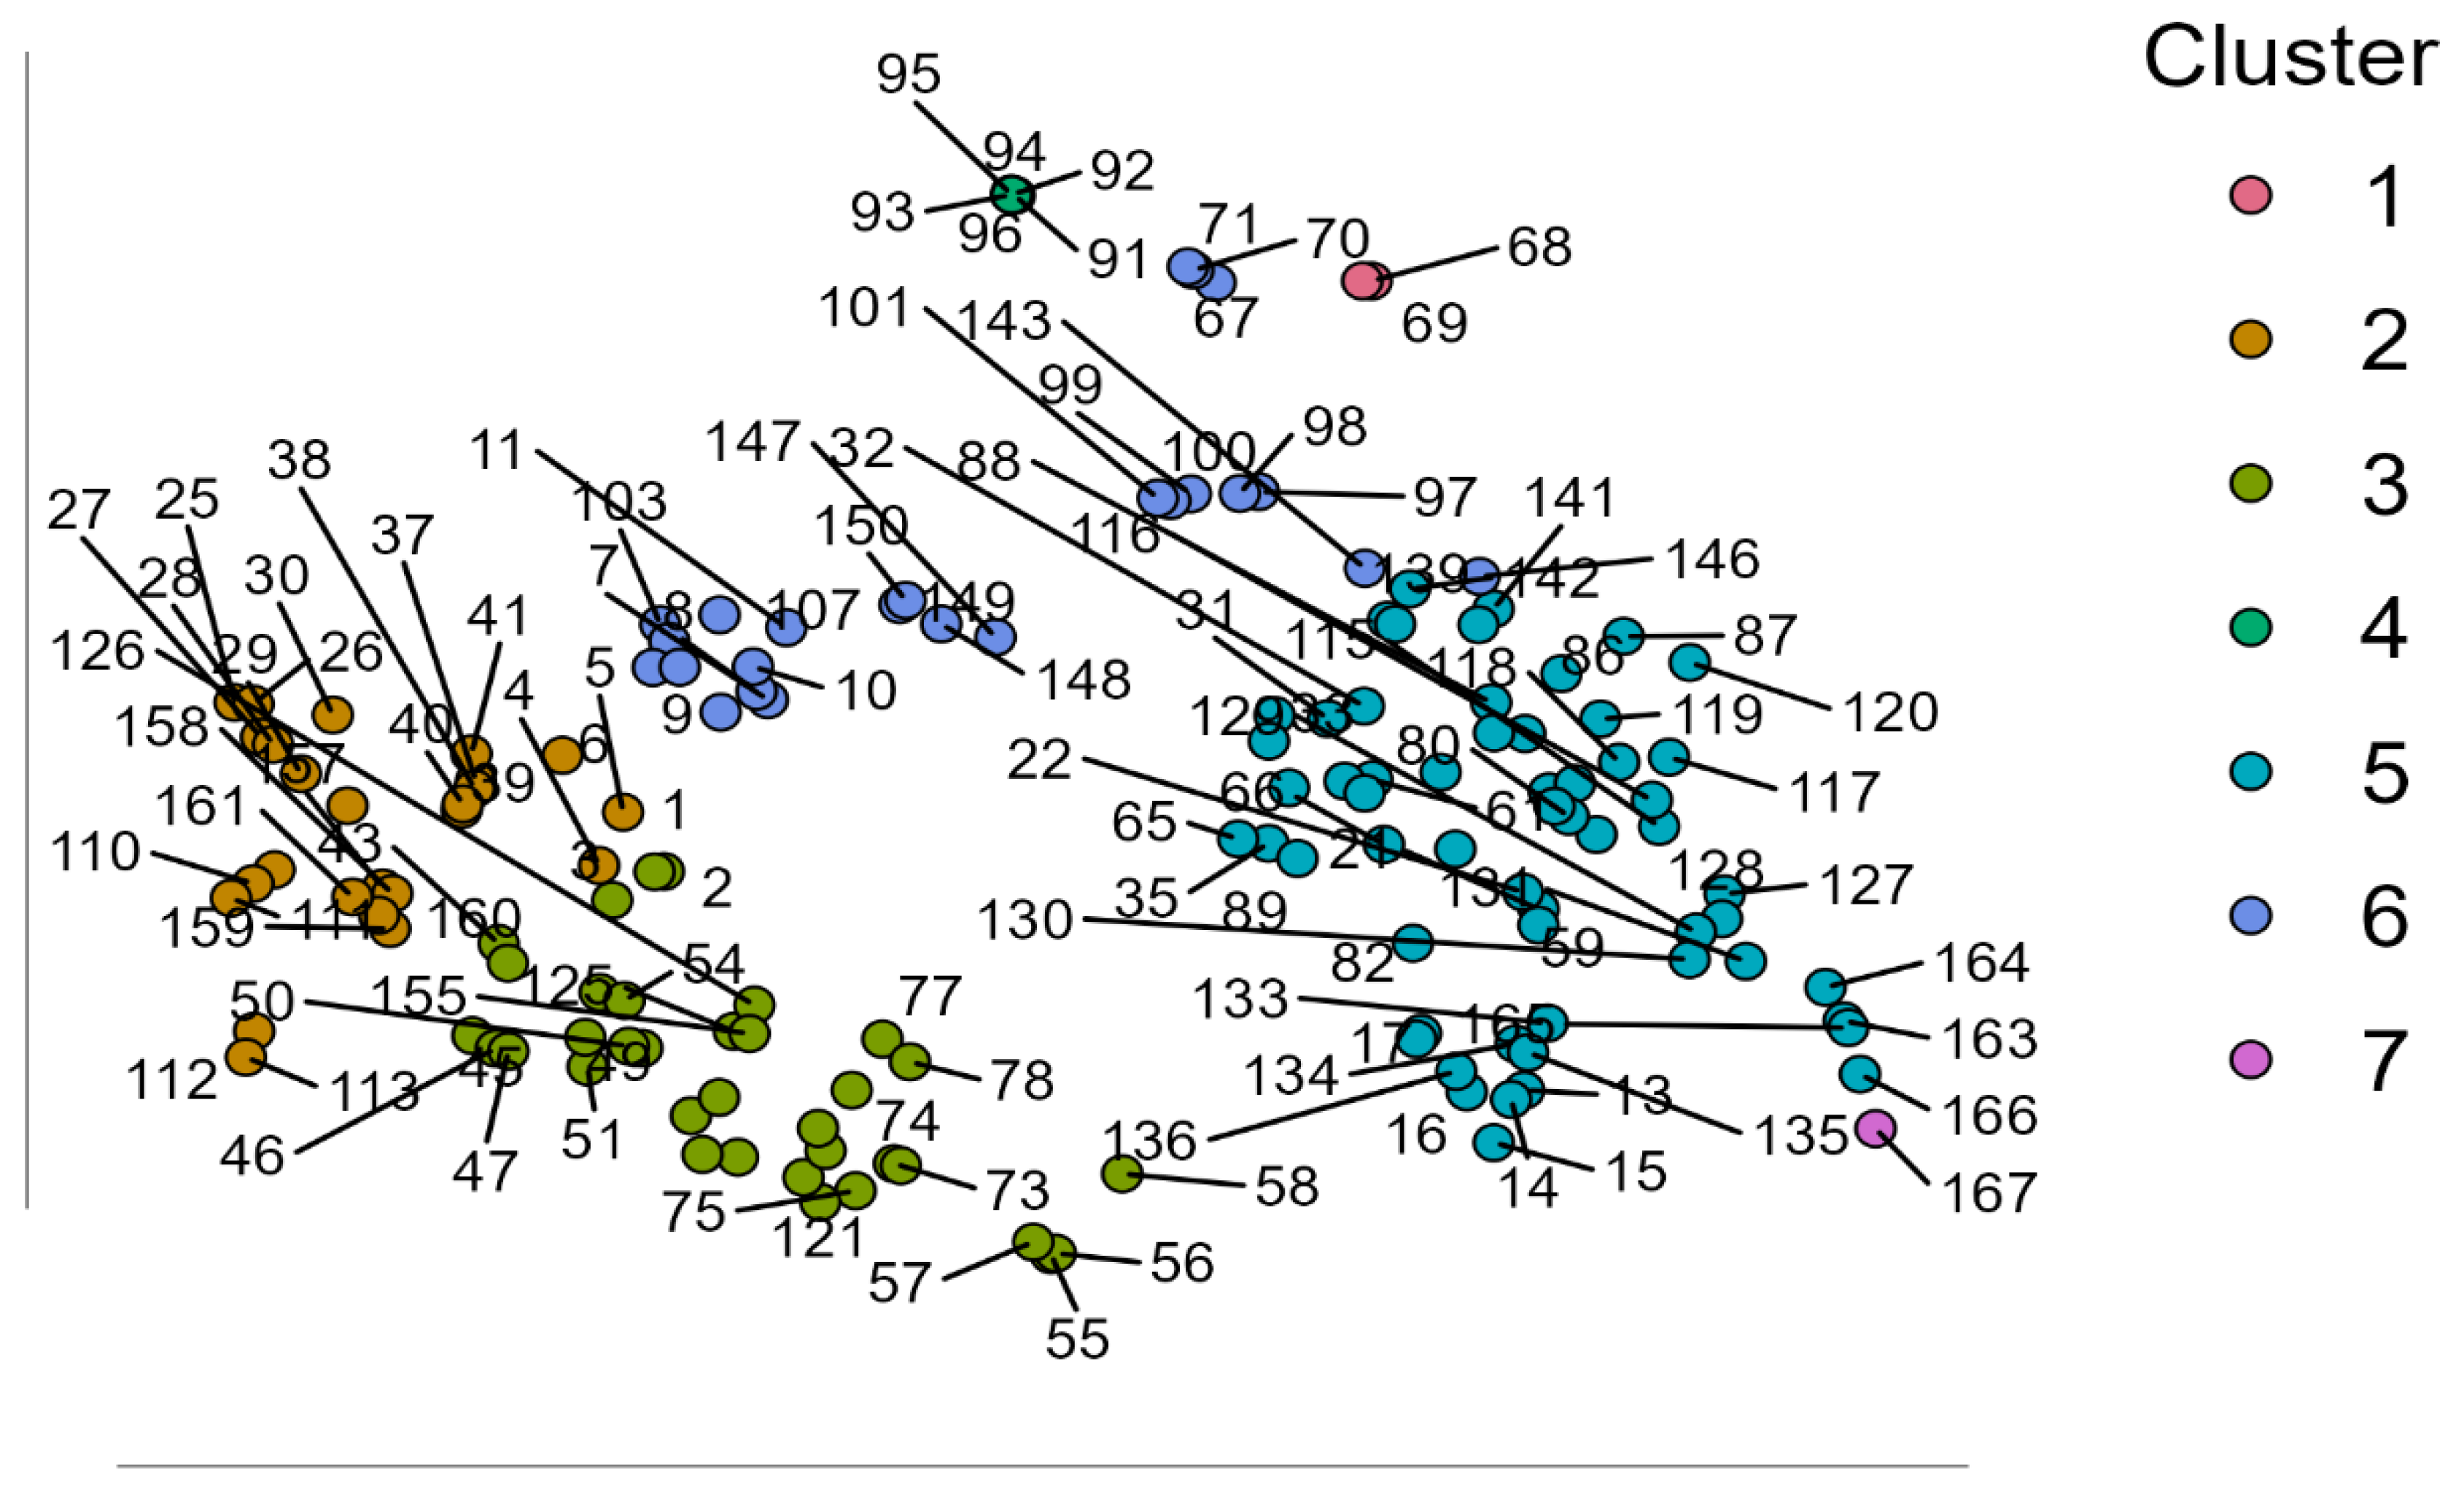
Conversely, the least adopter clusters (Clusters 5 and 3) are characterized by poor access to finance, low productivity, and low international integration. This is in line with the cross-EU country analysis by Popović et al., which revealed how extremely sensitive AI adoption is to material use strategies and economic environment, especially in environments with restricted access to material inputs. The evidence supports the suggestion that economic sophistication, access to finance, and external orientation (through exports and international trade) are positively associated with AI adoption in large enterprises. There are exceptions, though—like Cluster 1's very macro indicators with low adoption and Cluster 4's external orientation and high GDP with low public spending—highlighting that economic factors are not sufficient to secure innovation adoption. Rather, as emphasized by Uren & Edwards (2023), organizational maturity and technology readiness mediate the role. Preparedness of the institution, sector patterns, and the prevailing digital cultural environment mediate crucially whether economic slack is turned into technological adoption. Such influences are evidenced in the work by Kochkina et al. (2024), who found that industry-specific strategic fit, enhanced by sector-matched application of AI and preparedness assessments, plays an influent role in shaping successful integration of AI—even within technologically developed environments. The silhouette scores also verify the heterogeneity of these clusters. Cluster 4, with a score of 0.894, is the internally best-coherent cluster and is marked by stable and replicable profile features—i.e., distinct macro indicators and adoption of AI. Cluster 2 and Cluster 6, on the other hand, although prospective in economic orientation, have poor silhouette scores, exemplifying more internal heterogeneity and perhaps more intricate dynamics. Cluster 5 and Cluster 3, although with the number of entities, are low-adopting domains and require targeted intervention in policy. Such clusters are likely to enjoy the greatest benefits from strategic intervention in the form of targeted investment in infrastructure; digital skills and education programs; and international competitiveness-enhancing programs. In essence, such cluster analysis reveals that large EU firm adoption of AI is positively associated with access to financing, external orientation, and GDP per capita, though they are not determinant factors. Institutional power, technological readiness, and strategic fit—through and especially public-private investment systems—are essential to the macroeconomic levers' translation into successful digital transformation.
Table 8.
Cluster Centroids for Standardized Macroeconomic Variables.
| ALOAI | HEAL | DCPS | EXGS | GDPC | GCFG | INFD | TRAD | |
|---|---|---|---|---|---|---|---|---|
| Cluster 1 | 0.018 | -1.156 | 1.653 | 5.168 | 1.809 | -0.897 | -0.504 | 1.693 |
| Cluster 2 | 1.407 | 1.512 | -0.453 | 0.365 | 0.907 | 0.762 | -0.080 | -0.512 |
| Cluster 3 | 0.018 | 0.415 | -0.741 | -0.588 | -0.095 | 0.797 | -0.320 | -0.776 |
| Cluster 4 | 0.693 | 0.849 | 3.619 | -1.215 | 2.933 | -1.533 | -0.191 | 3.579 |
| Cluster 5 | -0.837 | -0.826 | -0.131 | 0.157 | -0.821 | -0.739 | 0.167 | -0.074 |
| Cluster 6 | 0.379 | -0.277 | 0.857 | -0.130 | 0.326 | 0.390 | -0.191 | 0.837 |
| Cluster 7 | -0.527 | -0.576 | -0.747 | 2.406 | -0.814 | -2.450 | 10.237 | -0.714 |
The data analysis of the result of the implementation of the K-Nearest Neighbors (KNN) clustering algorithm on the set of macroeconomic and financial variables provides insightful observations regarding the patterns of artificial intelligence (AI) adoption—through the ALOAI indicator—among large enterprises (250+ staff) with European Union economies. Not accounting for agriculture, mining, and finance, the ALOAI indicator records the proportion of enterprises utilizing any of the AI technologies such as machine learning or recognition of images. The standard variables on which the clustering is performed are current health spending (HEAL), domestic credit to the non-financial sector (DCPS), exports of goods and services (EXGS), Gross Domestic Product (GDP) per capita (GDPC), gross fixed capital formation (GFCF), inflation (INFD), and trade openness (TRAD). The seven cluster centroids represent the average standardized figures of each of the variables from the member countries. Cluster 2 is characterized by the greatest ALOAI indicator (1.407), which validates strong adoption of AI by its constituents. This cluster records high-availability credit (DCPS = 1.512), significant health spending (HEAL = 1.512), robust GDP per capita (GDPC = 0.907), and robust investment in capital formation (GFCF = 0.762). Despite slightly low values in exports and trade, the economies' internal resilience regarding infrastructure, investment, and access to finance seems to be adequate to facilitate digital transformation. The observed patterns are consistent with Iuga & Socol (2024), who emphasize how readiness in the use of artificial intelligence and preventing brain drain are inextricably connected with institutional investment and availability of finance. That such uptake is observed in the cluster suggests collaboration of macroeconomic stability, investment in the provision of social services, and financial capability to produce technological innovation, regardless of whether they have macroeconomic orientation towards international trade. This supports arguments in Czeczeli et al. (2024), who observe that economic resilience and preparedness—especially in situations of macroeconomic volatility—are intricately ingrained in the fiscal and lending architecture of a nation. Cluster 4 also features the ALOAI indicator with a high score (0.693), although with differences in the economic profile. It features the highest levels of exports (EXGS = 3.619) and trade openness (TRAD = 3.579), as well as the highest level of GDP per capita (GDPC = 2.933). On the contrary, it features low health spending (HEAL = –1.533) and negative capital formation (GFCF = –1.215), reflecting low investment in public infrastructure or long-term assets. This reflects that economic models are based on private-sector dynamism, high competitiveness, and international integration. As the analysis by Papagiannis et al. (2021) of intelligent infrastructure and public-private preparedness in Eastern Europe reveals, robust adoption of AI is even possible in market-exposure and innovation-pressure-driven systems lacking public investment. Cluster 6 features an ALOAI of moderate magnitude (0.379) and is a mixed-transitional group. It features mixed signs, with positive values of credit availability (DCPS = 0.857), modest health spending (HEAL = –0.277), and robust trade openness (TRAD = 0.837), but other factors are near- or slightly below-average. The profile identifies emerging and converging economies that have the macroeconomic fundamentals of digital transformation but have not yet translated them into elevated levels of AI adoption. As Iuga & Socol (2024) highlight, such economies tend to require stronger institutional infrastructure, targeted policy instruments, and brain drainage countermasures to leverage their AI preparedness more effectively. Additionally, workforce competences and support structures of innovation may not yet be fully compatible with the demands of digital transformation. Cluster 3, with very low ALOAI (0.018), is characterized by the economic profile of structural weakness. While it features modest health and credit indicators, it features clearly negative values of exports (–0.741), trade (–0.776), and GDP per capita (–0.095). This reflects underdeveloped and weakly integrated economies into international markets, with low external exposure and low national income levels that heavily hamper technological diffusion. These findings are corroborated by Guarascio et al. (2025), who illustrate that regional heterogeneity in exposure to AI and employment is disproportionately driven by macroeconomic underdevelopment and sectoral inflexibility. Even with some government investment in health and/or credit, structural weaknesses prevent firms from rolling out cutting-edge technologies on large scale. Cluster 5 has the lowest ALOAI score (–0.837), and it is characterized by very weak digital transformation. The economic indicators are unambiguously negative or low on average, such as GDP per capita (–0.821), availability of credits (–0.131), low health spending (–0.826), and low capital formation (–0.739). These economies are presumably faced with several systemic barriers—economic, institutional, and infrastructure—that severely impinge on the capabilities of businesses to access digital instruments and invest in AI technologies. As demonstrated by Rađenović et al. (2024) from their cluster analysis of eco-innovation, such underdevelopment is typically an indicator of overall policy inertness and poor coordination of innovation ecosystems. In the absence of targeted fiscal measures, support to private sector digitalization, and inclusion into EU innovation policies, these economies are unlikely to escape low adoption equilibria.
Figure 4.
Cluster-Wise Standardized Means of Macroeconomic Variables with Error Bars.
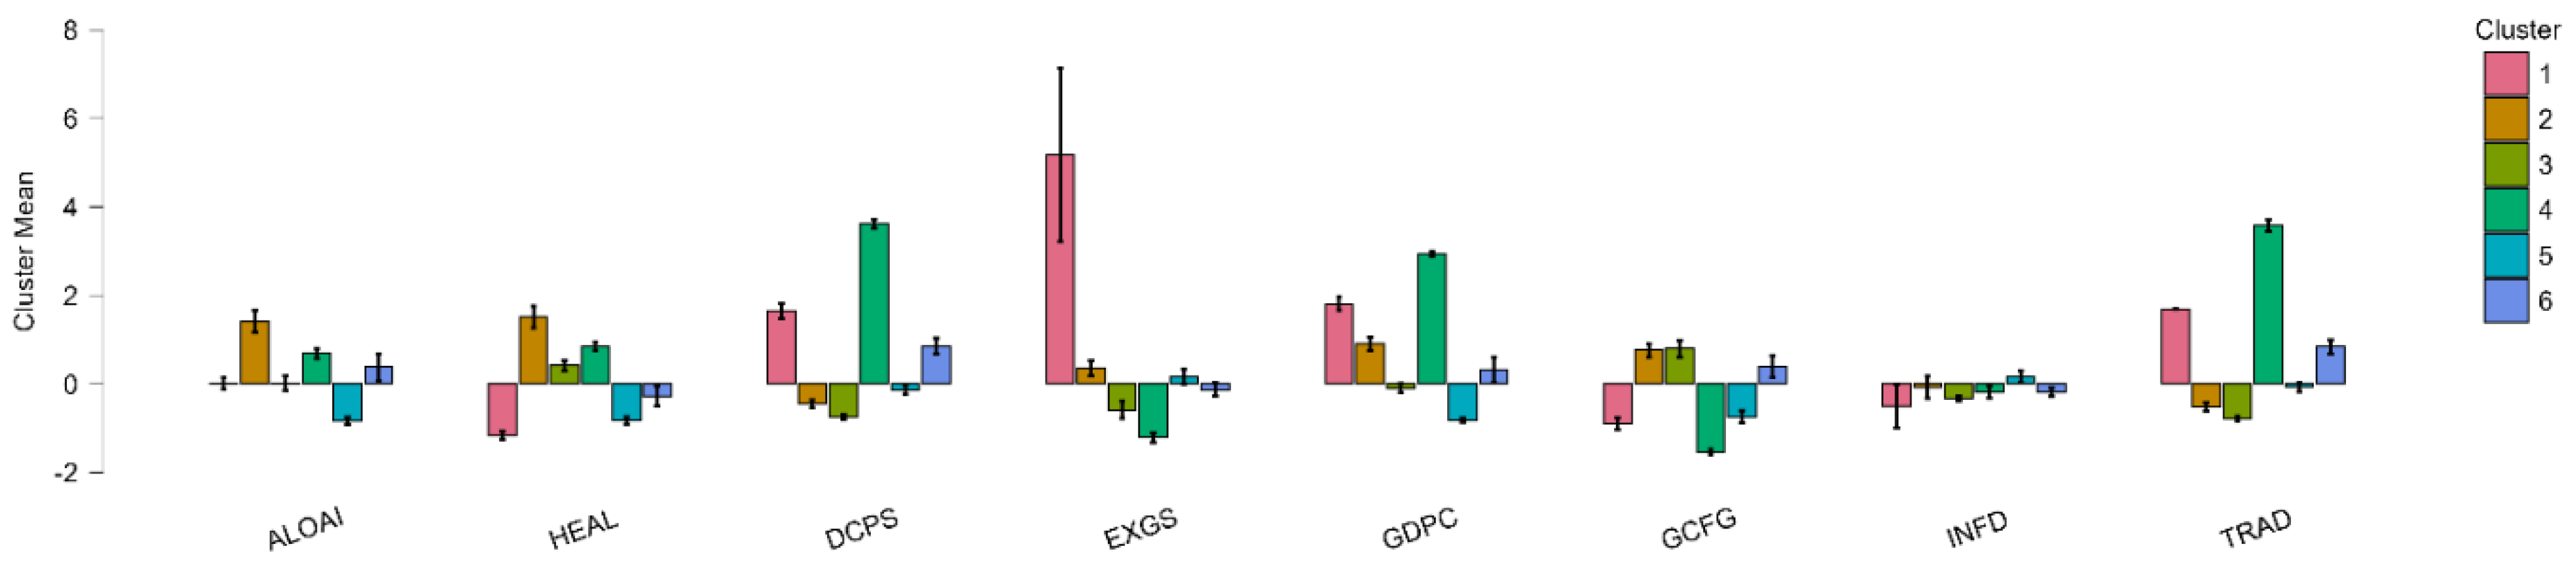
Cluster 1 is an intriguing and educational example in which a low ALOAI (0.018) is found with exceptionally favorable macroeconomic indicators. It is the best performer in GDP per capita (1.809), exports (1.653), and trade integration (1.693), and in gross fixed capital formation (GFCF = 5.168), reflecting a structural wealth and integration profile. But it also manifests stark weaknesses in health spending (HEAL = –0.897) and access to credit (DCPS = –1.156). Such dualities imply that macroeconomic prosperity is not in itself enough to provide successful AI adoption. As Uren & Edwards (2023) contend, organisational preparedness in the form of digital competency, strategic alignment, and institutional flexibility is paramount in converting advantageous macro settings into innovation results. Likewise, Baumgartner et al. (2024) note the requirement of essential digital capabilities and transformation competencies on the firm level, which in turn might be scarce even in ostensibly prosperous economies. Hence, the example of Cluster 1 serves to illustrate that the diffusion of AI is demonstrably dependent on the convergence of financial accessability, institutional backing, and technological preparedness. Cluster 7 consists of a single extreme outlier. It is characterized by anomalously high inflation (INFD = 10.237) and negatively skewed values on all of the remaining indicators, including GDP per capita, access to credit, and international integration. The attendant negative ALOAI (–0.527) reinforces the hypothesis that macro dysfunction generates a setting hostile to digital innovation. Such settings are typically associated with brain drain (Iuga & Socol (2024)), policy ambiguity, and low institutional capability, which together constitute a feedback cycle of suboptimality in AI preparedness. Here, any push to support the adoption of AI would not be merely about altering digital policy, but macroeconomic stabilization. Cluster 7 is thus best interpreted as structural abnormality, and presents in itself a cautionary reminder of technological transformation's foundational prerequisites.
7. Aligning Macroeconomic Policy with AI Adoption: Strategic Priorities for the European Union
The quantitative analysis of macroeconomic drivers of adoption of AI by large enterprises in 28 European Union member states from the years 2018 to 2023 provides rich lessons of policy to facilitate digital transformation. Based on both the use of both econometric panel models and on machine learning techniques including KNN, they support the multidimensionality and complexity of AI diffusion in institutional, economic, and technological contexts. Most notably, they illustrate how macro indicators such as GDP per capita, inflation control, and ease of access to credit are important inputs but cannot implement integration of AI on their own. Instead, such inputs need to be supplemented by strategic fit with institutional capacity, sector maturity, and organization preparedness. As emphasized by Agrawal, Gans, and Goldfarb (2021), adoption of AI is not about accessing technology—it in many cases involves organizational and sector transformation of the entire machinery with policies of adaptive nature going beyond the use of classic economic levers. Perhaps the best evidence is between health spending and adoption of AI. This points to the fact that public health spending supports not only the evolution of human capital but institutional maturity as well, both of which are key requisites to uptake. In that regard, European Journal of Public Health (2024) identifies public health modernization and digital innovation as inseparable policies that need to be reconciled with in national policies, and more so with systemic shocks such as the COVID-19 crisis. Rather than regarding them as two distinct policy arenas, digital transformation and social infrastructure need to be conceptualised in integrated national plans. This argument is favorable to the hypothesis that an overall plan of development with investment in education, health, and digital capability is more efficient than single innovation policies. That is to say, adoption of AI is more effective in those settings where societal development and digital transformation are in want in tandem. This argument is supported by Übellacker (2025), who presents evidence regarding perceptions of shortages of AI by individuals, particularly by underprepared institutions, to in turn impact preparedness despite overall economic resilience. EU policymakers thus need to use instruments like the Recovery and Resilience Facility to balance macro-financial planning with such technological ambitions. As evidenced with Kochkina et al. (2024), sector digital maturity and leadership initiative are determinant in the translation of congenial macro environments to technological implementation. Secondly, evidence of negative correlation between banking sector credit to the home country's private sector and adoption of AI requires more specific analysis of financial allocation and policy design. In orthodox theory, access to finance is meant to stimulate technological progress. However, evidence from the data suggests otherwise. A plausible explanation is in the form of misallocation of capital with financial funds redirected into low-tech or traditional sectors not related to innovation. As demonstrated by Criste, Lupu, and Lupu (2021) in their analysis of the consistency of the credit cycle, structural inefficiencies and asynchronous dynamics of euro area credit will be a barrier to the effective use of available financial funds to growth-enhancing sectors. Beyond this divergence, this is also symptomatic of institutional bias in lending patterns or underdevelopment of systems of finance innovation. To be able to effectively use financial liquidity to finance AI development, policymakers need to redirect credit and capital flows to innovation sectors and startups, in the form of instruments like AI-specific guarantees, innovation funds, or blended finance platforms. As demonstrated by Ferraro, Männasoo, and Tasane (2023), intervention by the public sector in the form of EU Cohesion Framework on R&D and innovation has measurable impacts on SME productivity, employment, and exports—highlighting the potential of targeted finance in raising digital competitiveness.
Third, the uniformly negative coefficients attached to exports of goods and services in both fixed and random effects models indicate the existence of structural inertia in economies heavily dependent on traditional export bases. Such economies might be prone to path dependency, in which incumbent sectors resist digital disruption in order to protect existing comparative advantages. Consistent with results by Dudzevičiūtė (2021), such exports are observed to contribute to aggregate economic growth, yet only if their composition matters—standardized, low-tech exports are found to stifle innovation-driven transformation unless they are combined with digital capabilities. To get beyond such barriers, “smart specialization” is required. These entail coordinating industrial policy to be in accordance with digital innovation ecosystems, such that traditional export bases are able to transform by incorporating AI and associated technologies into production and service provision. Incentivizing exporters to upgrade from commoditized to technological and data-driven output assures digital transformation is not simply in parallel, yet rather ingrained within export-oriented growth models. Conversely, trade openness is found to have a strong, positive impact on AI adoption, reinforcing the proposition that economies with increased integration into the world economy are more likely to innovate more intensively. As illustrated by Marčeta and Bojnec (2023), trade openness is a key driver of world competitiveness and convergence among EU economies. It provides knowledge spillovers, raises competitive pressure, and allows access to new technologies—all of which serve as drivers of enterprise-level AI integration. EU external and internal policies are thus required to transform beyond providing tariff-free market access and instead integrate digital standards, intellectual property rights, and cross-border data protocols into bilateral and multilateral trade agreements. In addition, these external measures need to be backed by internal policies facilitating both SMEs and large corporates to take advantage of innovation opportunities generated by trade by investing in digital infrastructure, engendering cross-border digital preparedness, and advancing governance cohesiveness throughout the single market. Notably, although frequently employed as a measure of national wealth, GDP per capita is found to have only marginal influence in the KNN-based importance assessments below both goods and health expenditure. The evidence here implies economic prosperity is not enough to assure digital transformation. This aligns with the findings of Dritsaki et al. (2023), who established that macro factors play a part in innovation but their influence is contingent on environmental and institutional enablers. The implication is that resource abundance is to be complemented by efficient allocation measures and institutional coordination in order to produce innovation results.
Such evidence is supported by Costantini, Delgado, and Presno (2023), who observe convergence in eco-innovation in countries with institutional support and focused policy contexts. Applied to the adoption of AI, it is obvious that absorptive capacity, institutional quality, and incentives are key drivers. EU Cohesion Policy must also redirect efforts to equalize not only physical infrastructure in lag regions, but also assistance to administrative modernisation, skills ecosystems, and regulation streamlining—a basis on which to facilitate digital absorption and sustainable innovation. Gross fixed capital formation (GFCF) presents evidence of counterintuitive but statistically significant negative correlation with the adoption of AI. It is evidence with implications that investment in EU economies is perhaps biased in the direction of familiar tangible assets, such as physical infrastructure and machinery, and not intangible digital assets like AI algorithmic content, cloud infrastructure, or workforce skills upgrade. In Licchetta and Meyermans (2022) analysis, investment in the COVID-19 era remained focused on traditional capital, in particular infrastructure and public buildings—sectors not immediately open to digital transformation. It is evidence of mismatch between investment type and digital transformation aim. EU and member state fiscal policies thus need to redirect to stimulate capital deepening in digital and AI-related technology. Targeted tax incentives to the acquisition of AI software and digital R&D is one such possible avenue, along the lines of the argument in Morina, Misiri, and Alijaj (2024) on strategic investment incentives. A further step is that the EU's digital chapter in the green taxonomy has the potential to direct investment by the private sector to sustainable and digitally oriented outcomes, and that public procurement mechanisms can be re-engineered to create incentives for AI-driven innovation in health, public administrations, and infrastructure. The statistical influence of inflation on the adoption of AI is to be viewed with circumspection. Although not suggestive of direct causality, it can be exercising investment dynamism in moderate inflation times, and causing adaptive economic behavior and capital transference realism. Results in Bańkowski et al. (2023) demonstrate that in periods of inflation, government has the potential to adjust policies of public finance and strive to increase investment in innovation so as to sustain competitiveness. Thus, inflation is not inherently an obstacle to adoption of AI provided that macroeconomic stability is ensured and countercyclical digital investment is maintained. Other than these macroeconomic considerations, results of the clustering and machine learning results also affirm that adoption patterns of AI are not taking place in all structurally comparable economies. For instance, Cluster 2—where macro indicators are well-balanced and intensive use of AI is taking place—is in contrast with Cluster 5, where access to finance is poor, and low trade integration and low investment in capital restrain the spread of AI. This difference is in affirmation of results by Usman et al. (2024), who argue that economic openness is required to be complemented by sectoral capacity and policy consensus in order to translate into results in the form of innovation or productivity growth.
These observations require different policy approaches. Top-performing clusters need to concentrate on securing and leveraging competitive strengths, such as leadership in AI regulation or standard-setting within the EU. By contrast, underperforming clusters need institutional restructuring, investment in digital infrastructure, and capability development, including in skills related to digital competences and local ecosystems of innovation. Without such targeted support measures, the EU digital divide can grow deeper, imperiling Digital Europe Programme and European innovation strategy cohesion goals. EU coordination plays a particularly significant role in the digital transformation of the continent in the areas of emerging policy instruments such as the AI Act, Chips Act, and the Digital Decade policy programme. These instruments need to be regarded not as distinct initiatives, but as complementary elements in one integrated strategy for diminishing digital fragmentation, enhancing technological convergence, and enhancing pan-Europe-wide competitiveness in AI. As described by Pehlivan (2024), the AI Act proposes to implement a risk-analysis-based governance plan to handle artificial intelligence in member states, with provision of a legal support structure to facilitate trustworthy and secure AI. Analogously, Schulz, Pehl, and Trinitis (2024) portray the Chips Act as aiming to upgrade the semiconductor ecosystem in Europe—a key facilitator of enhanced use of AI and European digital sovereignty. To complement such regulation and investment plans, the European Commission urgently needs to put harmonisation on both technical and institutional levels on priority. This entails harmonising benchmarking tools for AI, like the ALOAI indicator, and benchmarking dashboards providing policymakers with in-real-time information on the adoption and readiness of regions to adopt and use AI. Such evidence-based tools would improve comparability, transparency, and accountability and facilitate ex-ante planning and ex-post policy analysis. Notably, the policy process itself can be enhanced with the help of AI-driven decision support. The K-Nearest Neighbors (KNN) algorithm coupled with explainable AI measures like SHAP values permits interpretable models of adoption drivers. As this research exemplifies, variables like access to finance, openness to trade, and capital formation play important roles in influencing enterprise-level adoption of AI. With such models-based governance, the EU can better design and customize intervention with much finer grained granularity, allocating funds to contexts in which macroeconomic alignment and readiness of the institutional infrastructure is best. But such application of machine learning to policy design also has to be balanced by methodological caution. Hazards such as overfitting, data bias, and the ecological fallacy are still paramount, especially in cross-country research in which structural heterogeneity is ever present. As Kezlya et al. (2024) indirectly note in biodiversity research, capturing the complexity of ecosystem contacts is as challenging as capturing the dynamics of AI uptake: systems are connected, local factors count, and prediction is not policy. In conclusion, Europe's shift to an economy driven by AI requires an intricate, multidimensional policy response. Financial measures need to be redirected to support intangible innovation; public spending needs to build institutional capability; industrial and trade policies need to unlock digital competition. Most importantly, policy design itself needs to be more adaptive, data-driven, and evidence-based—deploying AI not merely as a research object but as an instrument of governance.
8. Conclusions
This analysis in the study presents an exhaustive understanding of the macroeconomic drivers of artificial intelligence (AI) adoption by big business in the European Union. With the use of an interactive approach of panel data econometrics and machine learning, the evidence underscores how adoption of AI is driven not by single factors but by the complex web of economic, institutional, and structural factors. The exceptionally positive correlation between health expenditures and diffusion of AI, for instance, suggests the likely enhancement of overall institutional and human capital bases to support technological advances by investing in public health systems. Similarly, the same way, open trade is found to be crucial in explaining adoption of AI with the suggestion that more integrated economies are better placed to absorb and adopt new technologies and to realize spillovers and competition pressures. Other findings, contrary to prevailing assumptions, undermine some assumptions. The seen negative correlations between domestic credit and adoption of AI and between gross fixed capital formation and adoption of AI suggest that financial and investment flows are not in and of itself supportive of digital transformation. Rather, the targeting of investment and credit matters more than their quantity. Credit systems with goals targeted to traditional or low-productive areas can inadvertently inhibit technological upgrading, with investments in physical capital and not in intangible digital assets in turn perhaps not being effective in providing beneficial contexts to disseminate AI. These lessons suggest more strategic and innovation-oriented industrial and finance policies to redirect capital allocation in accordance with digital horizons. The findings of machine learning, particularly those based on application of the K-Nearest Neighbors algorithm, substantiate and provide more depth and nuance to the evidence provided by the econometrics. By sorting macroeconomic indicators of relative magnitude, these models confirm the decisive role of financial access, institutional investment, and trade in explaining country heterogeneity in adoption of AI. Significantly, the cluster composition provides that both countries with similar macroeconomic profiles need not have similar adoption rates of AI. It suggests the role played by factors that are not quantifiable such as governance quality, institutional coordination in law and policy, and sector-specific configurations in influencing digital readiness. Clusters with balance in macroeconomic fundamentals and targeted policy programs are more likely to have increased levels of adoption of AI, while those with structural economic vulnerabilities or institutional weaknesses always lag behind. Individually and collectively, evidence requires policy intervention to be multi-dimensional and nuanced. Moving the EU to increased adoption of AI cannot be founded on increasing aggregate investment or technological capability; it requires strategic interoperability of macroeconomic policy with digital policy, institutional resilience, and sectoral adjustment. Financial instruments have to be calibrated to support innovation, public investment has to be compatible with complementary digital programs by the private sector, and trade policies have to be employed to support technological upgrading. Additionally, EU-wide coordination by the likes of the AI Act and the Digital Decade is required to cut disparities within member states and usher in an inclusive digital transformation. Ultimately, adoption of AI in Europe is not merely a determinant of economic capability, but of policy orientation, institutional readiness, and strategic synergy. The future of the EU is based on leveraging macroeconomic potential into functional, targeted, and adaptive schemes that support businesses in innovating and competing in the international arena of AI.
| 1 | Countries are: Austria, Belgium, Bosnia and Herzegovina, Bulgaria, Denmark, Estonia, Finland, France, Germany, Greece, Hungary, Ireland, Italy, Latvia, Lithuania, Luxembourg, Malta, Netherlands, Norway, Poland, Portugal, Romania, Serbia, Slovakia, Slovenia, Spain, Sweden, Turkey. |
References
- Abdelaal, M. (2024). AI in Manufacturing: Market Analysis and Opportunities. arXiv preprint arXiv:2407.05426.
- Abrardi, L. , Cambini, C., & Rondi, L. (2019). The economics of artificial intelligence: A survey.
- Acemoglu, D. (2025). The simple macroeconomics of AI. Economic Policy, 40(121), 13-58.
- Acemoglu, D. , Autor, D., Hazell, J., and Restrepo, P. (2022). Artificial intelligence and jobs: Evidence from online vacancies. Journal of Labor Economics, 40(S1):S293–S340.
- Adhikari, P. , Hamal, P., & Jnr, F. B. (2024). The impact of AI on personal finance and wealth management in the US.
- Aghion, P. , Jones, B. F., & Jones, C. I. (2017). Artificial intelligence and economic growth (Vol. 23928). Cambridge, MA: National Bureau of Economic Research.
- Agrawal, A. K. , Gans, J. S., & Goldfarb, A. (2021). Ai adoption and system-wide change (No. w28811). National Bureau of Economic Research.
- Agrawal, A. , Gans, J., & Goldfarb, A. (Eds.). (2019). The economics of artificial intelligence: An agenda. University of Chicago Press.
- Alayo, M. , Iturralde, T., & Maseda, A. (2022). Innovation and internationalization in family SMEs: Analyzing the role of family involvement. European Journal of Innovation Management, 25(2), 454-478.
- Albanesi, S. , Silva, A. D., Jimeno, J. F., Lamo, A., and Wabitsch, A. (2023). New Technologies and Jobs in Europe. IZA Discussion Papers 16227, Institute of Labor Economics (IZA).
- Aldasoro, I. , Doerr, S., Gambacorta, L., & Rees, D. M. (2024). The impact of artificial intelligence on output and inflation. Bank for International Settlements, Monetary and Economic Department.
- Ambarsari, E. W. , Dwitiyanti, N., Selvia, N., Cholifah, W. N., & Mardika, P. D. (2023). Comparison Approaches of the Fuzzy C-Means and Gaussian Mixture Model in Clustering the Welfare of the Indonesian People. KnE Social Sciences, 16-22.
- Andrejovská, A. , & Andrejkovičova, I. (2024). TAX REVENUES AND TAX RATES IN THE CONTEXT OF MACROECONOMIC DETERMINANTS. Journal of Entrepreneurship & Sustainability Issues, 12(1).
- Aromolaran, O. , Ngepah, N., & Saba, C. S. (2024). Macroeconomic determinants of poverty in South Africa: the role of investments in artificial intelligence. Access Journal, 5(2), 288-305.
- Arora, G., Tiwari, S., Wu, Y., & Mei, X. (2024). An Exploration to the Correlation Structure and Clustering of Macroeconomic Variables. arXiv preprint arXiv:2401.10162.
- Auliani, S. N. , Novita, R., & Afdal, M. (2024). Implementation of Density-Based Spatial Clustering of Applications with Noise and Fuzzy C–Means for Clustering Car Sales. The Indonesian Journal of Computer Science, 13(4).
- Azkeskin, S. A., & Aladağ, Z. (2025). Evaluating regional sustainable energy potential through hierarchical clustering and machine learning. Environmental Research Communications, 7(1), 015002.
- Babina, T. , Fedyk, A., He, A., and Hodson, J. (2024). Artificial intelligence, firm growth, and product innovation. Journal of Financial Economics, 151:103745.
- Bańkowski, K. , Checherita-Westphal, C. D., Jesionek, J., Muggenthaler, P., Briodeau, C., Schoonackers, R.,... & Prammer, D. (2023). The effects of high inflation on public finances in the euro area.
- Baumgartner, M. , Horvat, D., Kinkel, S., & Kick, E. (2024). Key competences for the adoption of AI-based innovations in organisations. International Journal of Innovation Management, 28(09n10), 2440002.
- Benigno, P. , Canofari, P., Bartolomeo, G., & Messori, M. (2023). Inflation dynamics and monetary policy in the euro area. Economic Governance and EMU Scrutiny Unit.
- Bickley, S. J., Chan, H. F., & Torgler, B. (2022). Artificial intelligence in the field of economics. Scientometrics, 127(4), 2055-2084.
- Bonab, A. B. , Rudko, I., & Bellini, F. (2021). A review and a proposal about socio-economic impacts of artificial intelligence. In Business Revolution in a Digital Era: 14th International Conference on Business Excellence, ICBE 2020, Bucharest, Romania (pp. 251-270). Springer International Publishing.
- Bonfiglioli, A. , Gancia, G., Papadakis, I., and Crin`o, R. (2023). Artificial intelligence and jobs: Evidence from us commuting zones. Technical report, CESifo Working Paper.
- Bosna, J. , Valčić, S. B., & Peša, A. (2024). Measuring the effect of entry into the eurozone on economic growth–data storytelling using clustering and ANFIS. Technological and economic development of economy, 30(3), 646-666.
- Bresnahan, T. F. and Trajtenberg, M. (1995). General purpose technologies ‘engines of growth’? Journal of Econometrics, 65(1):83–108.
- Brey, B. , & van der Marel, E. (2024). The role of human-capital in artificial intelligence adoption. Economics Letters, 244, 111949.
- Brynjolfsson, E. , & Unger, G. (2023). The macroeconomics of artificial intelligence.
- Brynjolfsson, E. , Li, D., and Raymond, L. R. (2023). Generative ai at work. Technical report, National Bureau of Economic Research.
- Brynjolfsson, E. , Rock, D., and Syverson, C. (2018). Artificial Intelligence and the Modern Productivity Paradox: A Clash of Expectations and Statistics, pages 23–57. University of Chicago Press.
- Buglea, A. , Cișmașu, I. D., Gligor, D. A. G., & Jurcuț, C. N. (2025). Exploring the Impact of Digital Transformation on Non-Financial Performance in Central and Eastern European Countries. Electronics, 14(6), 1226.
- Camerer, C. F. (2018). Artificial intelligence and behavioral economics. In The economics of artificial intelligence: An agenda (pp. 587-608). University of Chicago Press.
- Challoumis, C. (2024). AI AND THE ECONOMY-A DEEP DIVE INTO THE NEW FINANCIAL PARADIGM. In XVI International Scientific Conference (pp. 176-200).
- Chandra, M. , Vimal, K. E. K., & Rajak, S. (2024). A comparative study of machine learning algorithms in the prediction of bead geometry in wire-arc additive manufacturing. International Journal on Interactive Design and Manufacturing (IJIDeM), 18(9), 6625-6638.
- Chaurasia, P. , McClean, S., Nugent, C. D., Cleland, I., Zhang, S., Donnelly, M. P.,... & Tschanz, J. (2022). Modelling mobile-based technology adoption among people with dementia. Personal and Ubiquitous Computing, 26(2), 365-384.
- Chen, N., Christensen, L., Gallagher, K., Mate, R., & Rafert, G. (2016). Global economic impacts associated with artificial intelligence. Analysis Group, 1.
- Chen, W. , Xinyuan, Terrence Tianshuo, S., and Srinivasan, S. (2024). The Value of AI Innovations. Harvard Business School Working Paper No. 24-069.
- Cockburn, I. M. , Henderson, R., & Stern, S. (2018). The impact of artificial intelligence on innovation (Vol. 24449). Cambridge, MA, USA: National bureau of economic research.
- Comunale, M. and Manera, A. (2024). The economic impacts and the regulation of ai: A review of the academic literature and policy actions.
- Costantini, V. , Delgado, F. J., & Presno, M. J. (2023). Environmental innovations in the EU: A club convergence analysis of the eco-innovation index and driving factors of the clusters. Environmental Innovation and Societal Transitions, 46, 100698.
- Criste, A., Lupu, I., & Lupu, R. (2021). Coherence and entropy of credit cycles across the euro area candidate countries. Entropy, 23(9), 1213.
- Czarnitzki, D. , Fern´andez, G. P., and Rammer, C. (2023). Artificial intelligence and firm-level productivity. Journal of Economic Behavior & Organization, 211:188–205.
- Czeczeli, V. , Kolozsi, P. P., Kutasi, G., & Marton, Á. (2024). Exposure and preparedness for wartime inflation in the EU: Retrospective cluster analysis. Society and Economy, 46(3), 236-255.
- Da Silva, L. E. B. , Melton, N. M., & Wunsch, D. C. (2020). Incremental cluster validity indices for online learning of hard partitions: Extensions and comparative study. IEEE Access, 8, 22025-22047.
- Dirican, C. (2015). The impacts of robotics, artificial intelligence on business and economics. Procedia-Social and Behavioral Sciences, 195, 564-573.
- Doran, N. M., Badareu, G., & Puiu, S. (2025). Automation Systems Implications on Economic Performance of Industrial Sectors in Selected European Union Countries. Systems, 13(1), 26.
- Dritsaki, M., Dritsaki, C., & Tsianaka, E. (2023). The effect of macroeconomic and environmental factors on innovation in EU member countries. Journal of Infrastructure, Policy and Development, 7(3), 2560.
- Dudzevičiūtė, G. (2021). Does causality exist between exports and economic development? Evidence from selected EU countries. Journal of International Studies, 14(4), 56-66.
- Elkahlout, G. R., & Elkahlout, M. A. (2024). Employing cluster analysis in defining groundwater wells patterns in Rafah. Edelweiss Applied Science and Technology, 8(6), 3542-3555.
- Elnaeem Balila, A., & Shabri, A. B. (2024). Comparative analysis of machine learning algorithms for predicting Dubai property prices. Frontiers in Applied Mathematics and Statistics, 10, 1327376.
- Eloundou, T. , Manning, S., Mishkin, P., and Rock, D. (2023). GPTs are GPTs: An Early Look at the Labor Market Impact Potential of Large Language Models. Papers 2303.10130, arXiv.org.
- Erdoğan, S. , Yıldırım, D. Ç., & Gedikli, A. (2020). Dynamics and determinants of inflation during the COVID-19 pandemic period in European countries: A spatial panel data analysis. Duzce Medical Journal, 22(Special Issue), 61-67.
- Ernst, E. , Merola, R., & Samaan, D. (2019). Economics of artificial intelligence: Implications for the future of work. IZA Journal of Labor Policy, 9(1), 1-35.
- Felten, E. W. , Raj, M., and Seamans, R. (2018). A method to link advances in artificial intelligence to occupational abilities. AEA Papers and Proceedings, 108:54–57.
- Ferraro, S. , Männasoo, K., & Tasane, H. (2023). How the EU Cohesion Policy targeted at R&D and innovation impacts the productivity, employment and exports of SMEs in Estonia. Evaluation and Program Planning, 97, 102221.
- Gagolewski, M. , Bartoszuk, M., & Cena, A. (2021). Are cluster validity measures (in) valid?. Information Sciences, 581, 620-636.
- Gazzani, A. G. , & Natoli, F. (2024). The macroeconomic effects of AI innovation. Available at SSRN 493 8014.
- Giannini, M., & Martini, B. (2024). Regional disparities in the European Union. A machine learning approach. Papers in Regional Science, 103(4), 100033.
- Gonzalez, D. A. (2025). Exploring the Impact of Machine Learning and AI on Inflation Prediction: A Bibliometric Approach. Studies of Applied Economics, 43(1).
- Grennan, J. and Michaely, R. (2020). Artificial intelligence and high-skilled work: Evidence from analysts. Swiss Finance Institute Research Paper, (20-84).
- Gries, T., & Naudé, W. (2022). Modelling artificial intelligence in economics. Journal for labour market research, 56(1), 12.
- GUALANDRI, F. , & KUZIOR, A. (2024). Drivers of AI adoption in enterprises: A European-wide analysis. Materials Research Proceedings, 45.
- Guarascio, D. , Reljic, J., & Stöllinger, R. (2025). Diverging paths: AI exposure and employment across European regions. Structural Change and Economic Dynamics, 73, 11-24.
- Hatzius, J. (2023). The potentially large effects of artificial intelligence on economic growth (briggs/kodnani). Goldman Sachs, 1.
- Hoffmann, M. , & Nurski, L. (2021). What is holding back artificial intelligence adoption in Europe?. Bruegel.
- Hui, X., Reshef, O., and Zhou, L. (2023). The short-term effects of generative artificial intelligence on employment: Evidence from an online labor market. Available at SSRN 4527336.
- Ilkka, T. (2018). The impact of artificial intelligence on learning, teaching, and education. European Union.
- Ilzetzki, E. and Jain, S. (2023). The impact of artificial intelligence on growth and employment. Technical report, VoxEU.
- Iuga, I. C. , & Socol, A. (2024). Government Artificial Intelligence readiness and brain drain: influencing factors and spatial effects in the European Union member states. Journal of Business Economics and Management, 25(2), 268-296.
- Jenifel, M. G. , Jasmine, R. A., & Umanandhini, D. (2024, June). Bitcoin Price Predictive Dynamics Using Machine Learning Models. In 2024 15th International Conference on Computing Communication and Networking Technologies (ICCCNT) (pp. 1-6). IEEE.
- Kaliappan, J. , Srinivasan, K., Qaisar, S. M., Sundararajan, K., Chang, C. Y., & Suganthan, C. (2021). Performance Evaluation of Regression Models for the Prediction of the COVID-19 Reproduction Rate. Frontiers in Public Health, 9.
- Kezlya, E. M. , Glushchenko, A. M., & Kulikovskiy, M. S. (2024). Diatom Diversity from Watercourses of North-Eastern Kamchatka with Description of One New Species. Diversity, 16(9), 592.
- Kochkina, N. , Andriushchenko, I., & Gatto, G. (2024, October). Strategic AI Adoption: Economic Impact, Case Studies from Handy. ai, and Industry Readiness. In 2024 IEEE International Conference on Artificial Intelligence & Green Energy (ICAIGE) (pp. 1-6). IEEE.
- Korinek, A. , & Stiglitz, J. E. (2021). Artificial intelligence, globalization, and strategies for economic development (No. w28453). National Bureau of Economic Research.
- Kotrachai, C. , Chanruangrat, P., Thaipisutikul, T., Kusakunniran, W., Hsu, W. C., & Sun, Y. C. (2023, November). Explainable AI supported Evaluation and Comparison on Credit Card Fraud Detection Models. In 2023 7th International Conference on Information Technology (InCIT) (pp. 86-91). IEEE.
- Kumah, M. S. K. , Fiakumah, W. K., Gozah, E. K. A., & Edekor, L. K. Key Factors That Predict Students’ Mathematics Competence in A College of Education in Hohoe, Volta Region of Ghana.
- Licchetta, M. , & Meyermans, E. (2022). Gross fixed capital formation in the euro area during the COVID-19 pandemic. Intereconomics, 57(4), 238-246.
- Lu, C. H. (2021). The impact of artificial intelligence on economic growth and welfare. Journal of Macroeconomics, 69, 103342.
- Ma, X. , Hao, Y., Li, X., Liu, J., & Qi, J. (2023). Evaluating global intelligence innovation: An index based on machine learning methods. Technological Forecasting and Social Change, 194, 122736.
- Maccarrone, G. , Morelli, G., & Spadaccini, S. (2021). GDP forecasting: Machine learning, linear or autoregression?. Frontiers in Artificial Intelligence, 4, 757864.
- Maestro, S. , & Rana, P. (2024). Variables Impacting the AI Adoption in Organizations. International Journal of Science and Research Archive.
- Manshur Al Ahmad, A. S. , Judijanto, L., Tooy, D., Putra, P., Hermansyah, M., Kumalasanti, M., & Agit, A. (2024). Integration of Artificial Intelligence and Macro-Economic Analysis: A Novel Approach with Distributed Information Systems. EAI Endorsed Transactions on Scalable Information Systems, 11(2).
- Marčeta, M., & Bojnec, Š. (2023). Trade openness, global competitiveness, and catching up between the European Union countries. Review of International Business and Strategy, 33(4), 691-714.
- Marwala, T. , & Hurwitz, E. (2017). Artificial intelligence and economic theory: Skynet in the market (Vol. 1). Cham: Springer International Publishing.
- Mateos-Garcia, J. C. (2018). The complex economics of artificial intelligence. Available at SSRN 3294552.
- Merkulova, T., & Nikolaeva, O. (2022). Cluster analysis of tax indicators in Europien countries. Bulletin of VN Karazin Kharkiv National University Economic Series, (102), 69-81.
- Morikawa, M. (2016). The Effects of AI and Robotics on Business and Employment: Evidence from a Survey on Japanese Firms. Technical Report 16-E-066, RIETI Discussion Paper.
- Morina, F. , Misiri, V., & Alijaj, S. (2024). Examining the relationship between public debt and private consumption in European OECD countries (2011–2020). Quantitative Finance and Economics, 8(1), 75-102.
- Navigating the AI Wave: Overcoming Barriers and Unleashing the Potential of Artificial Intelligence in Transforming European Public Health. European Journal of Public Health, 34(Supplement_3), ckae144-001.
- Nenov, I. , Simeonova-Ganeva, R., Ganev, K., & Mengov, G. (2023, October). A Neural Model Forecasts Macroeconomic Indicators. In 2023 International Conference Automatics and Informatics (ICAI) (pp. 156-159). IEEE.
- Nguyen, D. , & Santarelli, E. (2024). Trade Openness and the Diffusion of Artificial Intelligence Technologies in Europe: A Panel Data Approach. European Economic Review, 154, 104218.
- Okoye, K. (2023, October). Technology-mediated method for prediction of global government investment in education toward sustainable development and aid using machine learning and classification. In 2023 IEEE Global Humanitarian Technology Conference (GHTC) (pp. 151-158). IEEE.
- Olasiuk, H. , Kumar, S., Singh, S., & Ganushchak, T. (2023, December). Mapping research clusters of artificial intelligence for financial services using topic modelling: A machine learning insight. In 2023 Global Conference on Information Technologies and Communications (GCITC) (pp. 1-6). IEEE.
- Ozkan-Okay, M. , Akin, E., Aslan, Ö., Kosunalp, S., Iliev, T., Stoyanov, I., & Beloev, I. (2024). A comprehensive survey: Evaluating the efficiency of artificial intelligence and machine learning techniques on cyber security solutions. IEEe Access, 12, 12229-12256.
- Papagiannis, F. , Gazzola, P., Burak, O., & Pokutsa, I. (2021). A European household waste management approach: Intelligently clean Ukraine. Journal of environmental management, 294, 113015.
- Parkes, D. C., & Wellman, M. P. (2015). Economic reasoning and artificial intelligence. Science, 349(6245), 267-272.
- Pehlivan, C. N. (2024). Report: The EU Artificial Intelligence (AI) Act: An Introduction. Global Privacy Law Review, 5(1).
- Popescu, R. , Corboș, R.-A., & Bunea, O. (2024). From bytes to insights through a bibliometric journey into AI's influence on public services. Applied Research in Administrative Sciences.
- Popović, A. , Todorović, A., & Milijić, A. ARTIFICIAL INTELLIGENCE ADOPTION AND ITS INFLUENCE ON CIRCULAR MATERIAL USE: AN EU CROSS-COUNTRY ANALYSIS.
- Qin, Y. , Xu, Z., Wang, X., & Skare, M. (2024). Artificial intelligence and economic development: An evolutionary investigation and systematic review. Journal of the Knowledge Economy, 15(1), 1736-1770.
- Rađenović, Ž. , Janjić, I., & Talić, M. (2024). Targeting eco-innovation performance among EU countries: Cluster outcome. SCIENCE International Journal, 3(1), 189-194.
- Raj, D. K., & Gopikrishnan, T. (2024). Soft computing techniques for predicting vegetation dynamics in Delhi. Journal of Earth System Science, 133(4), 241.
- Ruiz-Real, J. L. , Uribe-Toril, J., Arriaza Torres, J. A., & de Pablo Valenciano, J. (2021). Artificial intelligence in business and economics research: Trends and future. Business Economics and Management (JBEM), 22(1), 98-117.
- Sarmas, E. , Fragkiadaki, A., & Marinakis, V. (2024). Explainable AI-Based Ensemble Clustering for Load Profiling and Demand Response. Energies, 17(22), 5559.
- Schulz, M., Pehl, M., & Trinitis, C. (2024, May). The European Chips Act and its Impact on Teaching. In Proceedings of the 21st ACM International Conference on Computing Frontiers: Workshops and Special Sessions (pp. 146-146).
- Sehgal, D. , Kaur, I., Sharma, V., Gautam, B., Singh, A., & Kumar, N. (2024). AI-Driven Early Diabetes Prediction. 2024 IEEE 3rd World Conference on Applied Intelligence and Computing (AIC), 40–48.
- Shokouhifar, M. , Fanian, F., Rafsanjani, M. K., Hosseinzadeh, M., & Mirjalili, S. (2024). AI-driven cluster-based routing protocols in WSNs: A survey of fuzzy heuristics, metaheuristics, and machine learning models. Computer Science Review, 54, 100684.
- Siddik, A. B., Forid, M. S., Yong, L., Du, A. M., & Goodell, J. W. (2025). Artificial intelligence as a catalyst for sustainable tourism growth and economic cycles. Technological Forecasting and Social Change, 210, 123875.
- Stokman, A. (2023). Accelerating inflation expectations of households in the euro area: sources and macroeconomic spending consequences. Applied Economics Letters.
- Szczepanski, M. (2019). Economic impacts of artificial intelligence (AI).
- Tapeh, A. T. G. , & Naser, M. Z. (2023). Artificial intelligence, machine learning, and deep learning in structural engineering: a scientometrics review of trends and best practices. Archives of Computational Methods in Engineering, 30(1), 115-159.
- Thamrin, N. , & Wijayanto, A. W. (2021). Comparison of Soft and Hard Clustering: A Case Study on Welfare Level in Cities on Java Island: Analisis cluster dengan menggunakan hard clustering dan soft clustering untuk pengelompokkan tingkat kesejahteraan kabupaten/kota di pulau Jawa. Indonesian Journal of Statistics and Its Applications, 5(1), 141-160.
- Tiutiunyk, I. , Drabek, J., Antoniuk, N., Navickas, V., & Rubanov, P. (2021). The impact of digital transformation on macroeconomic stability: Evidence from EU countries. Journal of International Studies (2071-8330), 14(3).
- Trabelsi, M. A. (2024). The impact of artificial intelligence on economic development. Journal of Electronic Business & Digital Economics, 3(2), 142-155.
- Tudor, C. , Sova, R., Stamatiou, P., Vlachos, V., & Polychronidou, P. (2025). Future-Proofing EU-27 Energy Policies with AI: Analyzing and Forecasting Fossil Fuel Trends. Electronics, 14(3), 631.
- Übellacker, T. (2025). Making Sense of AI Limitations: How Individual Perceptions Shape Organizational Readiness for AI Adoption. arXiv preprint arXiv:2502.15870.
- Uren, V. , & Edwards, J. (2023). Technology readiness and the organizational journey towards AI adoption: An empirical study. International Journal of Information Management, 68, 102588.
- Usman, M. , Saeed, A., Latif, A., & Zakir, A. (2024). Energy Consumption and Trade Liberalization: Investigating Performance of Economic Growth for French Economy. Journal of Asian Development Studies, 13(1), 402-411.
- Varian, H. R. (2018). Artificial intelligence, economics, and industrial organization (Vol. 24839). Cambridge, MA, USA:: National Bureau of Economic Research.
- Vijayalakshmi, V. , Selvakumar, A., & Panimalar, K. (2023, January). Implementation of medical insurance price prediction system using regression algorithms. In 2023 5th International Conference on Smart Systems and Inventive Technology (ICSSIT) (pp. 1529-1534). IEEE.
- Vujović, D. (2025). Generative AI: A new general-purpose technology for growth and research. Ekonomika preduzeća, 73(1-2), 97-114.
- WAGAN, S. M. , & SIDRA, S. (2024). EXPLORING THE IMPACT OF AI RESEARCH, VENTURE CAPITAL INVESTMENT, AND ADOPTION ON PRODUCTIVITY: A MULTI-COUNTRY PANEL DATA ANALYSIS. Journal of European Economy, 23(4), 688-713.
- Wagner, D. N. (2020). Economic patterns in a world with artificial intelligence. Evolutionary and Institutional Economics Review, 17(1), 111-131.
- Wang, L. , Sarker, P., Alam, K., & Sumon, S. (2021). Artificial intelligence and economic growth: A theoretical framework. Scientific Annals of Economics and Business, 68(4), 421-443.
- Wang, X., He, T., Wang, S., & Zhao, H. (2025). The impact of artificial intelligence on economic growth from the perspective of population external system. Social Science Computer Review, 43(1), 129-147.
- Wang, Y. , Xie, Y., Wu, Y., & Yang, Y. (2024). Improved KNN-based Stock Price Prediction. Academic Journal of Computing & Information Science, 7(6), 38-43.
- Webb, M. (2019). The Impact of Artificial Intelligence on the Labor Market. Available at SSRN: https://ssrn.com/abstract=3482150.
- Wolff, J. , Pauling, J., Keck, A., & Baumbach, J. (2020). The economic impact of artificial intelligence in health care: systematic review. Journal of medical Internet research, 22(2), e16866.
- Žarković, M., Ćetković, J., & Cvijović, J. (2025). Economic growth determinants in old and new EU countries. Panoeconomicus, 72(2), 183-210.
- Zekos, G. I. (2021). Economics and law of artificial intelligence. Finance, Economic Impacts, Risk Management and Governance.
- Zeleke, A. J. , Palumbo, P., Tubertini, P., Miglio, R., & Chiari, L. (2023). Machine learning-based prediction of hospital prolonged length of stay admission at emergency department: a Gradient Boosting algorithm analysis. Frontiers in Artificial Intelligence, 6.
Figure 1.
K-Nearest Neighbors (KNN) Regression Performance: Predicted vs. Observed Values and Error by Number of Neighbors.
Figure 1.
K-Nearest Neighbors (KNN) Regression Performance: Predicted vs. Observed Values and Error by Number of Neighbors.
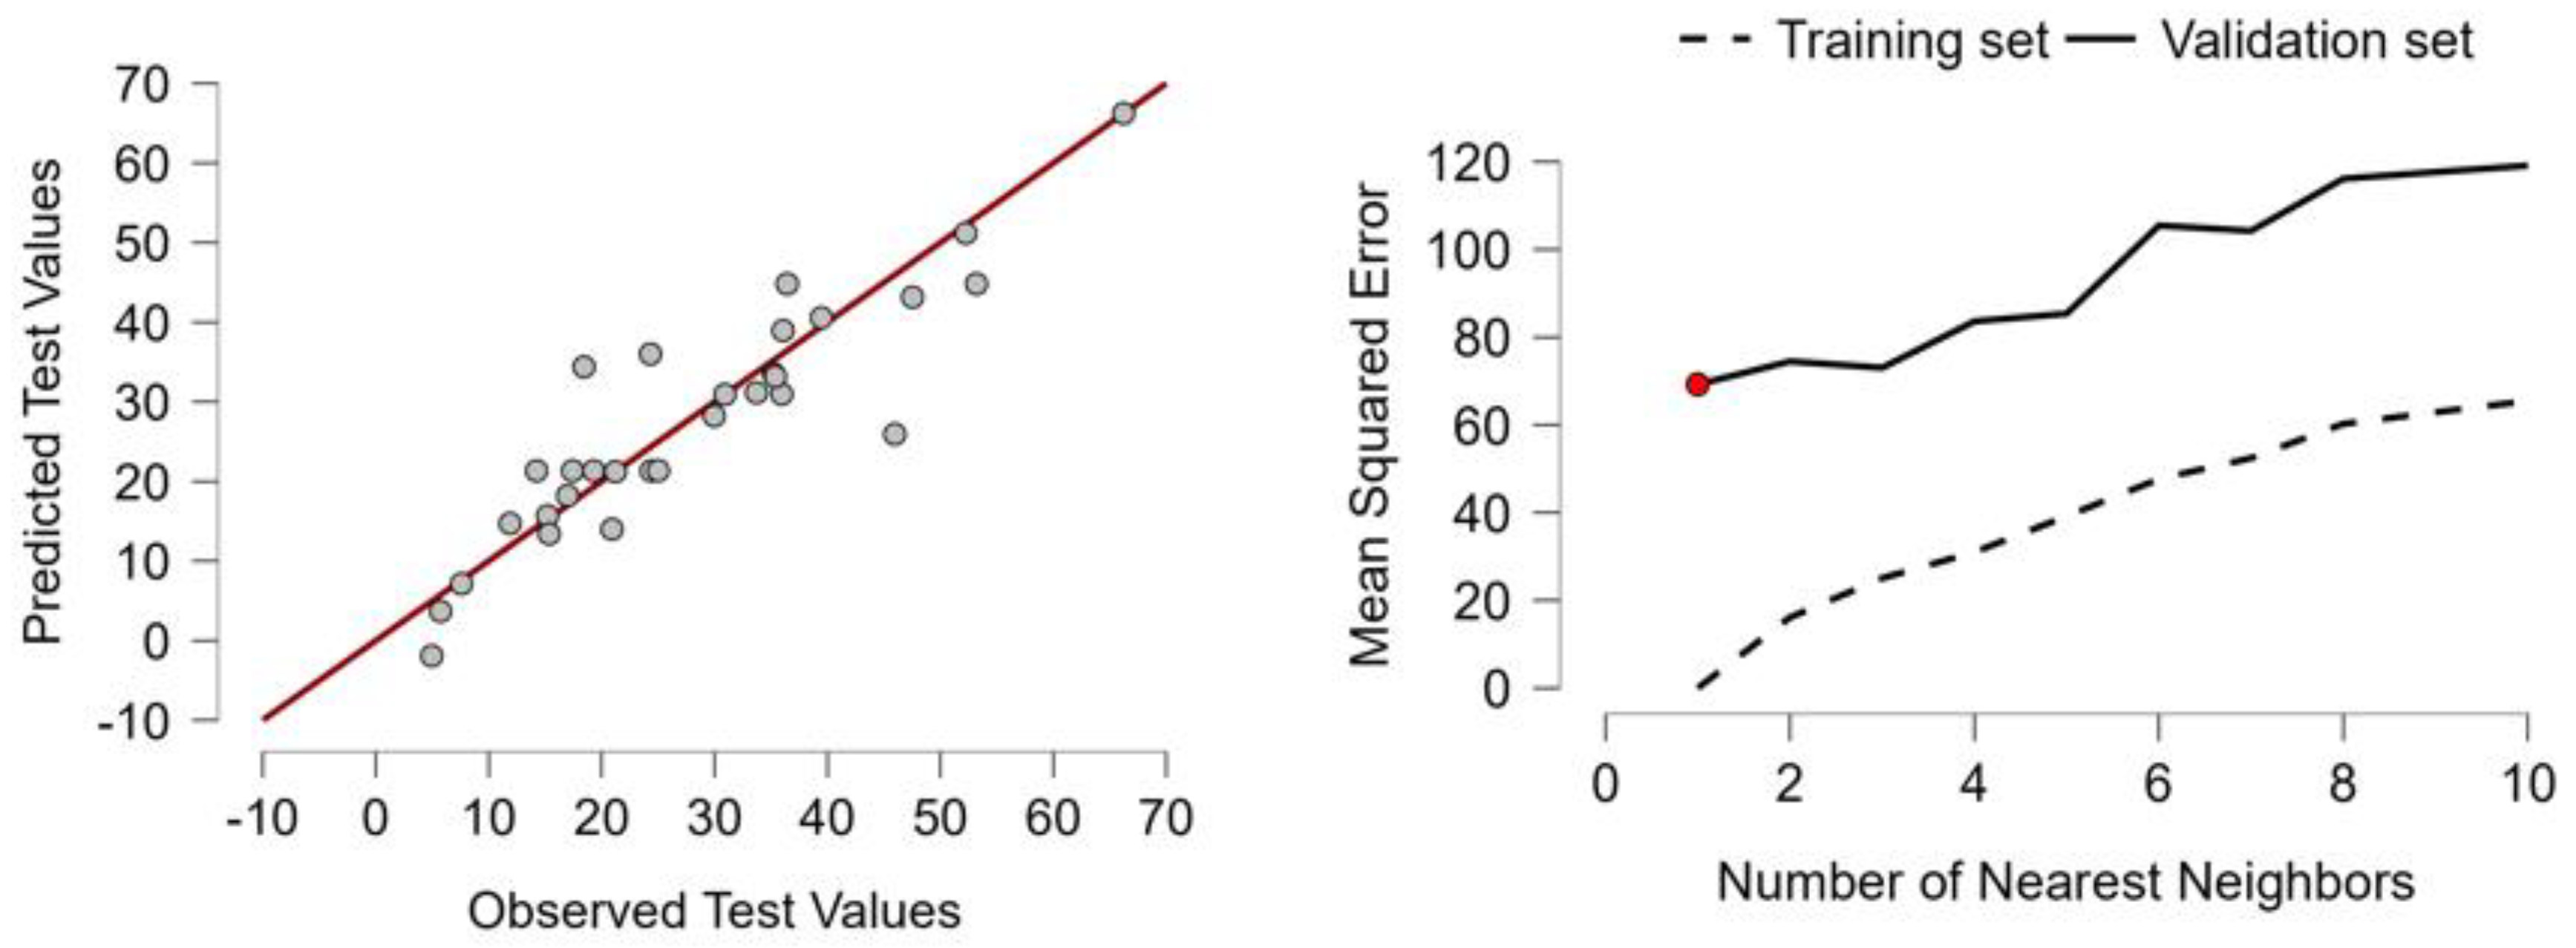
Figure 2.
Pairwise Scatterplot Matrix of Standardized Macroeconomic Variables by Cluster.
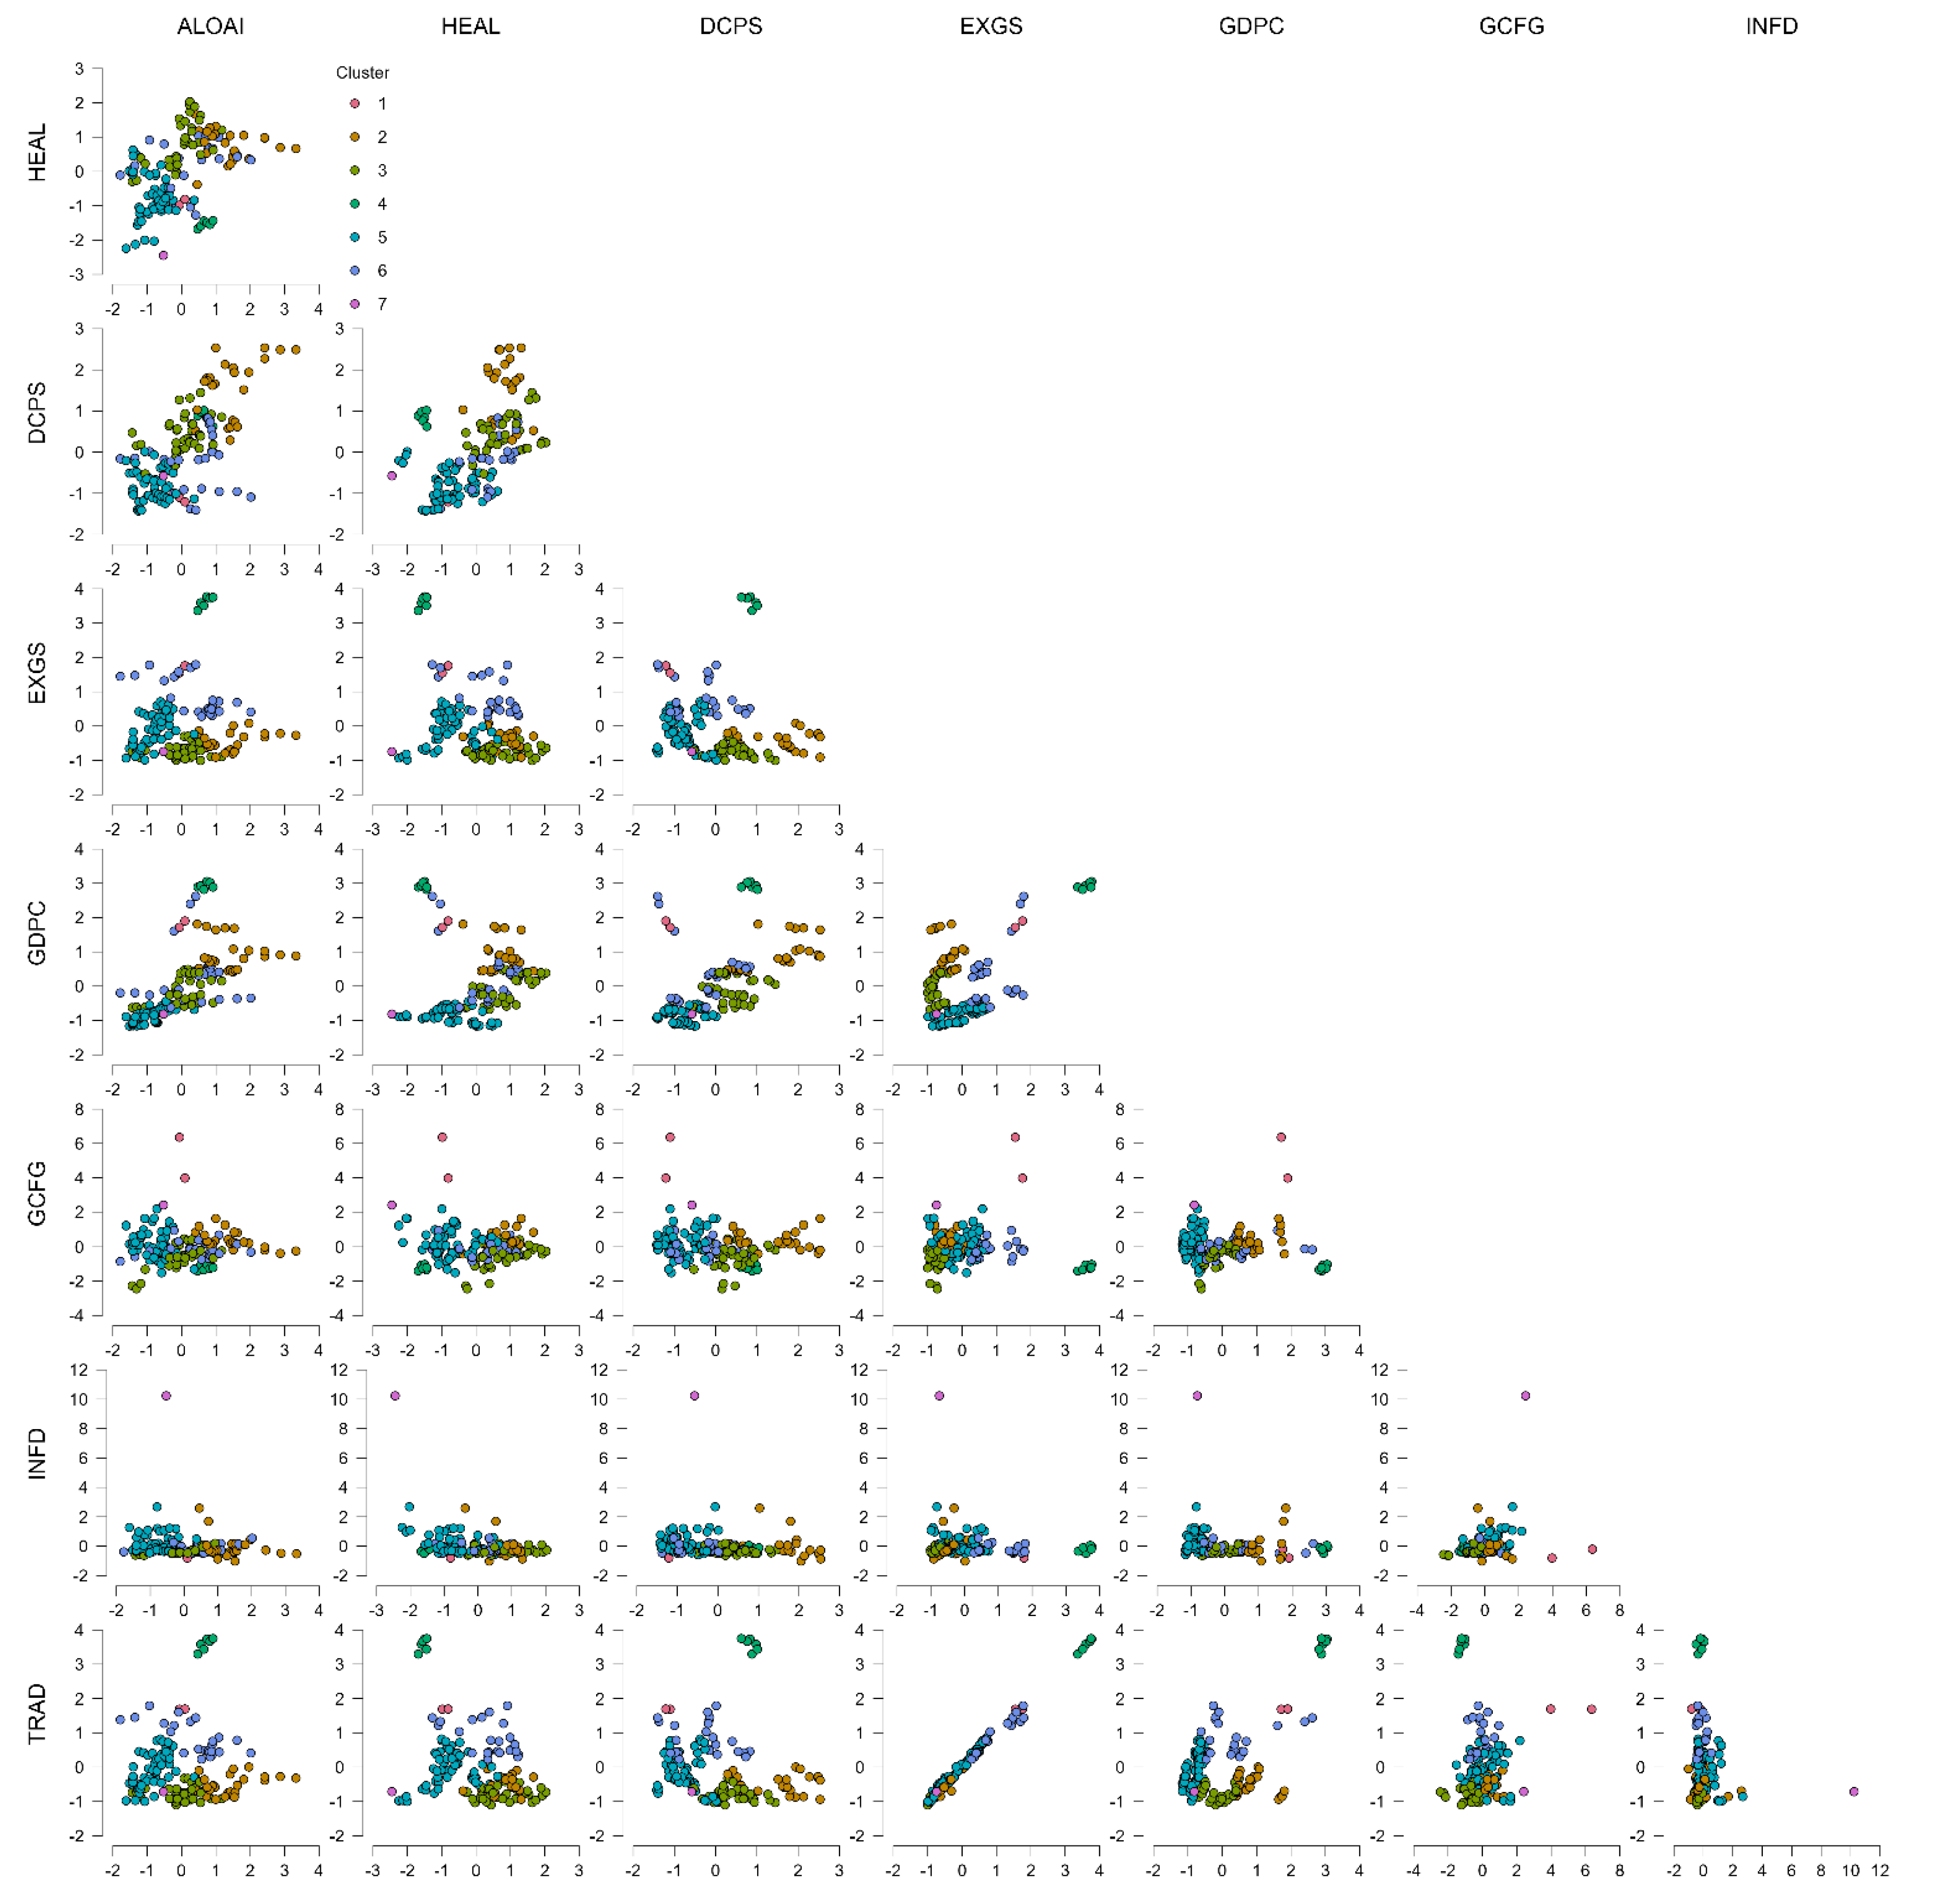
Table 1.
Synthesis of the literature.
| Macro Theme | Key Findings | Representative Authors | Comparison with Our Study | Originality of Our Study |
|---|---|---|---|---|
| Growth & Productivity | AI can drive long-term growth but requires complementary investments and supportive institutions | Aghion, Jones & Jones (2017); Agrawal et al. (2019); Brynjolfsson & Unger (2023) | Our study finds strong links between AI and productivity, though uneven across clusters. | Applies KNN clustering to macroeconomic indicators across EU countries, a novel method for analyzing growth impacts. |
| Labor Markets & Inequality | AI adoption leads to labor polarization and wage inequality; reskilling is essential | Acemoglu (2025); Autor et al. (2022); Eloundou et al. (2023) | Our study shows AI adoption varies by region and is skill-biased, reinforcing polarization. | Provides quantitative cluster-based evidence on labor polarization and sectoral inequality, unlike most theory-based papers. |
| Inflation & Monetary Policy | AI adoption may modestly reduce inflation and is influenced by macroeconomic stability | Aldasoro et al. (2024); Gazzani & Natoli (2024) | Inflation has a modest but positive effect on AI adoption in our findings. | Includes inflation as a predictive feature in AI adoption modeling, a relatively unexplored relationship. |
| Institutional & Policy Coordination | Coordinated governance and regulatory frameworks are necessary for AI benefits to scale | Pehlivan (2024); Bonab et al. (2021); Wagner (2020) | The study emphasizes EU-level coordination and benchmarking as essential. | Integrates policy instruments (AI Act, Digital Decade) directly with machine learning insights for governance evaluation. |
| Sectoral Disruption & Industrial Transformation | AI causes structural shifts in GDP and employment patterns across industries | Dirican (2015); Webb (2019); Wolff et al. (2020) | Clustering reveals sectoral shifts, especially in trade and capital investment patterns. | Uses economic clustering to identify hidden sectoral dynamics across EU regions, enhancing practical relevance. |
| Firm-Level Innovation | AI boosts innovation in data-rich firms, but risks concentrating benefits | Cockburn et al. (2019); Czarnitzki et al. (2023); Babina et al. (2024) | AI adoption aligns with firm-level innovation, especially in tech-ready clusters. | Empirically links firm-level innovation to national macroeconomic clusters, offering cross-scale insight. |
| Global Development & Digital Divide | AI may exacerbate global inequalities; inclusive strategies and digital infrastructure are key | Trabelsi (2024); Wang et al. (2025); Zekos (2021) | Our study stresses the digital divide across EU regions and policy needs in lagging areas. | Focuses on EU regional divergence using standardized indicators and clustering, adding depth to global inequality literature. |
Table 2.
Variable, acronyms and sources of data.
| Acronym | Variable | Definition | Source |
|---|---|---|---|
| ALOAI | AI adoption in major firms | This variable shows the percentage of large EU enterprises (250+ employees) using at least one AI technology. It excludes agriculture, mining, and finance sectors. Measured annually, it reflects AI adoption—such as machine learning or image recognition—across major industries, based on Eurostat. | EUROSTAT |
| HEAL | Current health expenditure (% of GDP) | This variable represents total public and private health spending as a share of gross domestic product, reflecting a country’s financial commitment to healthcare services, infrastructure, and policy. | WORLD BANK |
| DCPS | Domestic credit to private sector (% of GDP) | This variable measures financial resources provided to the private sector by financial institutions, expressed as a percentage of GDP, indicating access to credit and financial system development. | |
| EXGS | Exports of goods and services (% of GDP) | This variable captures the total value of goods and services exported by a country, relative to its GDP, reflecting trade openness, external demand, and global economic integration. | |
| GDPC | GDP per capita (constant 2015 US$) | This variable represents a country's gross domestic product divided by its population, adjusted for inflation to 2015 US dollars, reflecting average economic output and living standards over time. | |
| GFCF | Gross fixed capital formation (% of GDP) | This variable measures investment in fixed assets such as buildings, machinery, and infrastructure, expressed as a percentage of GDP, indicating long-term economic growth potential and capital accumulation. | |
| INFD | Inflation, GDP deflator (%) | This variable reflects the annual percentage change in the GDP deflator, capturing overall inflation by measuring price changes in all domestically produced goods and services within an economy. | |
| TRAD | Trade (% of GDP) | This variable represents the sum of exports and imports of goods and services as a percentage of GDP, indicating a country's trade openness, economic integration, and global market exposure. |
Table 4.
Mean dropout loss.
| Variables | Mean dropout loss |
|---|---|
| DCPS | 12.451 |
| GDPC | 9.269 |
| HEAL | 9.269 |
| GCFG | 8.077 |
| INFD | 6.682 |
| EXGS | 6.239 |
| TRAD | 6.106 |
Note. Mean dropout loss defined as root mean squared error (RMSE) is based on 50 permutations.
Table 5.
Additive Explanations for Predictions of Test Set Cases.
| Case | Predicted | Base | HEAL | DCPS | EXGS | GDPC | GCFG | INFD | TRAD |
|---|---|---|---|---|---|---|---|---|---|
| 1 | 28.210 | 26.351 | 2.395 | 4.957 | -3.652 | 4.913 | 0.699 | -6.413 | -1.041 |
| 2 | 33.490 | 26.351 | 2.969 | -0.020 | 0.912 | 3.040 | 1.839 | -1.807 | 0.206 |
| 3 | 15.690 | 26.351 | 0.334 | -8.334 | 0.658 | -5.020 | 0.605 | -0.085 | 1.182 |
| 4 | 23.030 | 26.351 | 1.153 | -5.391 | -0.204 | -8.331 | -2.654 | 2.877 | 9.229 |
| 5 | 66.220 | 26.351 | -4.690 | 15.768 | 1.517 | 18.006 | 2.582 | 1.513 | 5.173 |
Note. Displayed values represent feature contributions to the predicted value without features (column 'Base') for the test set.
Table 6.
Comparative Evaluation of Clustering and Classification Algorithms Across Multiple Performance Metrics.
Table 6.
Comparative Evaluation of Clustering and Classification Algorithms Across Multiple Performance Metrics.
| Metric | Density-Based | Fuzzy C-Means | Hierarchical | Model-Based | Neighborhood-Based | Random Forest |
|---|---|---|---|---|---|---|
| R² | 0.000 | 0.147 | 0.689 | 0.507 | 1.000 | 0.615 |
| AIC | 1.000 | 0.767 | 0.000 | 0.368 | 0.000 | 0.288 |
| BIC | 1.000 | 1.157 | 0.000 | 0.925 | 0.000 | 0.395 |
| Silhouette | 1.000 | 0.000 | 0.692 | 0.115 | 0.346 | 0.115 |
| Max Diameter | 0.000 | 1.000 | 0.517 | 0.000 | 0.000 | 0.001 |
| Min Separation | 1.000 | 0.000 | 0.334 | 0.218 | 0.192 | 0.222 |
| Pearson's γ | 1.000 | 0.347 | 0.724 | 0.492 | 0.574 | 0.317 |
| Dunn Index | 1.000 | 0.000 | 0.862 | 0.231 | 0.692 | 0.269 |
| Entropy | 0.000 | 1.000 | 0.730 | 0.001 | 0.000 | 0.002 |
| Calinski-Harabasz | 0.000 | 0.675 | 1.000 | 0.015 | 0.065 | 0.028 |
Table 7.
Cluster Characteristics and Centroid Profiles.
| Cluster | 1 | 2 | 3 | 4 | 5 | 6 | 7 |
| Size | 2 | 25 | 35 | 6 | 58 | 24 | 1 |
| Explained proportion within-cluster heterogeneity | 0.010 | 0.187 | 0.182 | 0.003 | 0.384 | 0.234 | 0.000 |
| Within sum of squares | 3.089 | 60.513 | 58.997 | 0.926 | 124.420 | 75.809 | 0.000 |
| Silhouette score | 0.584 | 0.265 | 0.334 | 0.894 | 0.346 | 0.164 | 0.000 |
| Center ALOAI | 0.018 | 1.407 | 0.018 | 0.693 | -0.837 | 0.379 | -0.527 |
| Center HEAL | -0.897 | 0.762 | 0.797 | -1.533 | -0.739 | 0.390 | -2.450 |
| Center DCPS | -1.156 | 1.512 | 0.415 | 0.849 | -0.826 | -0.277 | -0.576 |
| Center EXGS | 1.653 | -0.453 | -0.741 | 3.619 | -0.131 | 0.857 | -0.747 |
| Center GDPC | 1.809 | 0.907 | -0.095 | 2.933 | -0.821 | 0.326 | -0.814 |
| Center GCFG | 5.168 | 0.365 | -0.588 | -1.215 | 0.157 | -0.130 | 2.406 |
| Center INFD | -0.504 | -0.080 | -0.320 | -0.191 | 0.167 | -0.191 | 10.237 |
| Center TRAD | 1.693 | -0.512 | -0.776 | 3.579 | -0.074 | 0.837 | -0.714 |
Note. The Between Sum of Squares of the 7 cluster model is 876.25. Note. The Total Sum of Squares of the 7 cluster model is 1200.
Disclaimer/Publisher’s Note: The statements, opinions and data contained in all publications are solely those of the individual author(s) and contributor(s) and not of MDPI and/or the editor(s). MDPI and/or the editor(s) disclaim responsibility for any injury to people or property resulting from any ideas, methods, instructions or products referred to in the content. |
© 2025 by the authors. Licensee MDPI, Basel, Switzerland. This article is an open access article distributed under the terms and conditions of the Creative Commons Attribution (CC BY) license (http://creativecommons.org/licenses/by/4.0/).
Copyright: This open access article is published under a Creative Commons CC BY 4.0 license, which permit the free download, distribution, and reuse, provided that the author and preprint are cited in any reuse.


