

Submitted:
28 September 2023
Posted:
28 September 2023
You are already at the latest version
Abstract
Amidst China's new economic normal, the real economy faces various domestic and global challenges. Technological innovation, with its capital intensity and uncertain returns, is crucial to rejuvenate emerging industries and revamp the industrial structure. Meanwhile, financial agglomeration plays a dual role: directly fostering real economic development and indirectly affecting it through technological innovation. This study analyzes data from 30 mainland Chinese provinces and cities between 2011 and 2018, utilizing fuzzy matter-element analysis and location entropy method. Relying on a spatial econometric model, we explore the impact of technological innovation and financial clustering on real economic growth, including spatial ripple effects. The conclusions are derived from Chinese evidence and offer valuable insights into the evolving innovation and financial dynamics within the participating nations.
Keywords:
technological innovation
; financial agglomeration
; real economy growth
; space spillover effect
1. Introduction
The real economy, anchored by the manufacturing industry, is pivotal to a nation's economic competitiveness and growth (Cavalieri et al., 2021; Wang et al., 2023). China's real economy has grappled with weakened demand, the virtual economy's lagging functions, and an imbalanced industrial structure (He et al., 2021). Given these challenges, realizing quality growth in the real economy during China's transformation phase is paramount (Wang et al., 2021).
China's economic trajectory is at a juncture marked by growth stabilization, structural recalibration, and engine transformation, necessitating a shift from its erstwhile expansive development approach (Khan et al., 2021). Technological innovation emerges as the linchpin for this change. It fosters the genesis of nascent industries, realigns industrial structures, and rejuvenates demand. Simultaneously, it stimulates economic evolution by optimizing resource distribution and enhancing production efficiency (Zhang, 2021). In recent years, China's financial industry has developed rapidly, not only increasing in size, but also gradually getting rid of the limitations of the market by virtue of its high liquidity characteristics, showing the characteristics of regional agglomeration (Wang et al.,2023). Examining the interplay between technological innovation, financial clustering, and real economic growth not only underpins theoretical comprehension but also guides practical strategies for boosting economic quality and transforming developmental modalities (Xie, 2021).
2. Literature review and theoretical mechanism analysis
2.1. Research on the growth of real economy
Different types of labor can influence an item's value differently. Labor that adds value is termed "productive labor," contrasting with "unproductive labor" (Laibman, 1996; Bernat, 1996; Mohun, 1996). This concept mirrors the broader real economy. Drucker (1958) differentiated between the real and symbolic economies, highlighting their intrinsic relationship. Empirically, Hausmann et al. (2013) posited that a nation's manufacturing complexity correlates with long-term economic growth, underlining the significance of the manufacturing-centric real economy for sustainable national economic progress.
2.2. The impact of technological innovation on economic growth
Schumpeter laid the groundwork for innovation theory(Sweezy,1943; Drucke,2008)., which subsequent scholars, like Lucas (1989) and Romer (1994), expanded upon, particularly emphasizing technological innovation's role in sustained economic growth. The consensus in both theory and empirical research is that technological innovation can enhance total factor productivity and drive economic growth (Bravo et al., 2011). Studies reveal its positive impact on countries like Mexico, Turkey, and those in Latin America, aided by the global diffusion of technological knowledge (Koh, 2007; Adak, 2015; Bujari et al., 2016). However, through empirical analysis of relevant data of developing countries from 2004 to 2011, scholars show that technological innovation in developing countries is not conducive to economic growth in the short term (Feki &Mnif., 2016).
2.3. The impact of financial agglomeration on economic growth
The blossoming of new economic geography sparked interest in the correlation between industrial agglomeration and economic growth (Krugman, 1991; Fujita et al., 2001). Specifically, the phenomenon of financial agglomeration became a focal point. Theoretically, the concentration of financial entities can influence regional economic expansion (Greenwood & Jovanovic, 1990; Iyare & Moore, 2011), driven by its ability to bolster capital accumulation, foster technological innovation, and streamline financing processes, thereby reducing risks and transaction costs (Levine, 1996; Tadesse, 2002). Empirical studies have further endorsed the positive link and spatial spillover effects between financial agglomeration and regional growth (Bernat, 1996; Baldwin et al., 2004). Moreover, analyses leveraging panel data regression have cemented the idea that financial clusters spur economic growth (Hassan et al., 2011; Ottaviano, 2011). Furthermore, investigations into regions such as South Africa and Europe highlight the enduring relationship between financial development and sustained economic expansion (Anwar & Cooray, 2012; Pradhan et al., 2016).
2.4. Theoretical mechanism analysis
Innovation and credit are linchpins of economic advancement, with the former serving as the driving force and the latter ensuring its execution (Sweezy,1943). This paper delves into the symbiotic relationship between technological innovation and financial agglomeration on the real economy's growth, drawing inspiration from economic development theories. Technological innovation boosts local real economic growth through creative destruction and benefit effects but can also impede it through cost effects. Notably, its knowledge spillover effect can generate a spatial spillover, influencing surrounding areas. Financial agglomeration spurs local real economic growth via agglomeration and financial function effects but may also act as a deterrent through its siphon effect. Its spatial diffusion can also ripple into surrounding areas, and intriguingly, its agglomeration effect can influence technological innovation, indirectly impacting real economic growth.
In conclusion, the significance of technological innovation and financial agglomeration in steering economic growth is unequivocal (Yu et al.,2023). Yet, current researches exhibit two primary lacunae. Firstly, the intertwined nature of financial agglomeration's direct and indirect (through technological innovation) effects on economic growth necessitates a unified theoretical framework. Secondly, the mounting shift of the financial sector "from real to virtual" diminishes the supportive role of financial agglomeration in the real economy. Given this context, does the relationship between financial agglomeration and real economic growth deviate from the idealized theoretical presumptions? This paper endeavors to dissect these pertinent issues.
3. Measurement of technological innovation and financial agglomeration
3.1. Measurement of technological innovation
The accurate quantification of China's technological innovation level is pivotal for strategic planning and policy implementation. This study employs the fuzzy matter-element analysis complemented by the entropy method, aiming for a more comprehensive and precise measurement of China's technological innovation magnitude. The fusion of these methodologies provides a robust framework that captures the multifaceted aspects of innovation while also addressing potential uncertainties inherent in traditional measurements. This approach ensures a holistic understanding of China's innovation landscape, shedding light on areas of strength and potential opportunities for growth.
3.1.1. Fuzzy matter-element analysis method
Fuzzy matter-element analysis is based on thing M, feature C and its corresponding magnitude xij (i=1,2,... ,m; J = 1, 2,... ,n) These three basic elements describe the research problem, and the matter elements in the research problem can be denoted as R=(M,C, xij). Its basic idea is to analyze the quantity value corresponding to different characteristics of different things on the basis of fully considering the incompatibility between multiple influencing factors of things, that is, to solve the problem of numerous and fuzzy incompatibility of indicators faced in the evaluation of things.
If matter-element R contains m things M1,M2,... Mm, things Mi(i=1,2,... ,m) corresponds to n features C1,C2,... Cn, then the matter element R has a total of m×n magnitude values xij(i=1,2,... ,m; J = 1, 2,... ,n), which can be called the n-dimensional complex element of m things(Sun et al.,2022), namely:
In modern research, the task of accurately determining the weight of different indices becomes critical, especially when the nature of data is complex and multi-dimensional. This paper introduces an innovative approach to this problem by applying the fuzzy matter-element analysis underpinned by the entropy method. Such a methodology is not only adept at capturing the intrinsic value of each index but also ensures that the weight assigned is a reflection of the true importance and variability of the data. Through this method, biases associated with conventional weighting approaches are minimized, and the calculated weights become more representative of the real-world scenarios. This paper elucidates the detailed procedure and justifies the superiority of this combined technique over traditional methods.
3.1.2. Index selection and data source
Building on prior research, this paper gauges the technological innovation level across 30 Chinese provinces and cities, encompassing the production, commercialization, and economic input stages of innovation. Measurements consider three dimensions: patent output (reflected in the number of patents granted in ten thousand yuan), technology market transactions (in ten thousand yuan), and the revenue from scientific and technological achievements, indicated by new product sales revenue (in ten thousand yuan). Given that the latter two are nominal variables, they're adjusted using the GDP deflator and PPI to the 2011 base year to account for inflation.
Post-deflation, the weights for these three indicators within the technological innovation measurement system are determined using formula (1) The measurement system of technological innovation index and the weights of each index are shown in Table 1.
3.1.3. The evaluation and evolution characteristics of China's technological innovation level based on the measurement results
In Figure 1, based on the data from measurement result, we present an average line chart depicting the technological innovation level (INNO) across 30 Chinese provinces and cities from 2011 to 2018. The chart reveals a consistent growth in China's average INNO, ascending from 0.0531 in 2011 to 0.1287 in 2018, reflecting a geometric annual average growth rate of 13.46%. This steady rise underscores the effectiveness of China's technology-driven strategies, emphasizing a consistent enhancement in its innovation capabilities.
Figure 2 showcases the geographical distribution of the technological innovation level (INNO) across Chinese provinces and cities, utilizing the evaluation results from measurement result. For clarity and space constraints, only the evaluation maps for the initial and terminal years of the study period, specifically 2011 and 2018, are depicted.
In the maps, a loci classification method is employed to segment the INNO of each province and city into four distinct tiers. A gradient color scheme represents these tiers, with deeper shades signifying higher levels of technological innovation. This visualization method allows for an intuitive understanding of the innovation landscape and its evolution over the span of the study.
Figure 2 illustrates the regional disparities in the technological innovation level (INNO) of the 30 provinces and cities in China for the year 2011. The clear gradient and clustered distribution from east to west underline the knowledge spillover effects inherent in technological innovation.
The eastern coastal regions, with their strategic location and mature economic foundations, form the vanguard in INNO. They have magnetized a wealth of technological innovation resources. Among these, the provinces of Shandong, Jiangsu, Shanghai, and Zhejiang stand out for their pronounced innovation clusters. However, areas like Beijing, Tianjin, and Guangdong, while being in the east, don't showcase the same level of clustered innovation as their counterparts.
The second and third tiers span across the central regions, with provinces like Hubei, Hunan, Sichuan, Chongqing, and Shaanxi revealing a distinct cluster distribution. Contrarily, Jiangxi province contrasts with its neighbors, indicating a pronounced negative spatial correlation in innovation.
Lastly, the trailing tier is predominantly in the western parts of the country.
Comparing the two timelines in Figure 2, it becomes evident that the national INNO distribution in 2018 remains largely consistent with that in 2011, still exhibiting a pronounced gradient distribution pattern. This suggests that while innovation may have grown, the fundamental regional disparities in innovation capabilities have been retained over the years.
3.2. The measurement of financial agglomeration
3.2.1. The measurement method of financial agglomeration
The location entropy index, as suggested by Haggett (1977), is an analytical tool used to measure the spatial concentration or dispersion of an activity or phenomenon across different locations or regions. When applied to financial agglomeration, this index can be instrumental in understanding the concentration of financial activities in various provinces and cities.
Using the extended version of the location entropy index allows for a more nuanced analysis, adapting the original concept to better suit the specifics of financial agglomeration. By employing this formula, we can determine which provinces or cities in China serve as major hubs for financial activity and which ones are less concentrated.The specific formula is shown in equation (2).
In the numerator of equation (2), represents the industrial resource index of province i in year t, and represents the permanent population of province i at the end of year t. In the denominator, represents the nationwide industrial resource index in year t, and represents the national permanent population at the end of year t. That is, the index reflects the ratio of the per capita industrial resources of a certain province to the per capita industrial resources of the country. The larger the index is, the larger the per capita scale of industrial resources in the region is in the national industrial scale, and the higher the degree of industrial agglomeration.
3.2.2. Evaluation and evolution characteristics of China's financial agglomeration level based on the measurement results
Figure 3 plots the financial agglomeration level (FINA) of 30 Chinese provinces and cities from 2011 to 2018. The trend reveals a fluctuating growth in China's financial agglomeration. After a slowing growth from 2011 to 2014, there was a notable dip in 2015. Post-2015, the growth stabilized and continually rose, going from 0.9851 in 2011 to 1.1683 in 2018, representing a 2.47% geometric average annual growth rate. This underscores the evolving concentration of China's financial resources amidst the robust expansion of its financial sector.
Figure 4 illustrates the financial agglomeration levels across Chinese provinces and cities using evaluation maps from 2011 and 2018. Due to space constraints, only these two years, marking the start and end of our study period, are depicted. Using the loci classification, each province and city's financial agglomeration level is categorized into four tiers: the darker the shade, the higher the level of financial agglomeration.
From Figure 4's left diagram, the 2011 financial agglomeration levels across China's 30 provinces and cities highlight a clustered distribution with clear polarization. Predominantly, the first tier is evident in the eastern coastal regions such as Beijing, Tianjin, Jiangsu, Zhejiang, Shanghai, and Guangdong. Their geographical perks combined with an export-driven industry structure magnetized a significant portion of financial resources. Notably, Chongqing, the central region's transportation nexus, also attracted immense financial resources. This first-tier concentration drew resources from neighboring provinces, relegating areas like Henan, Anhui, Jiangxi, Hunan, and Guangxi Zhuang Autonomous Region to the fourth tier. Meanwhile, the second and third tiers are interspersed across the central and western zones. Contrasting the two diagrams from 2011 to 2018, it's evident that by 2018, China's financial agglomeration had begun to depict a trickle-down effect.
4. Analysis of the spatial spillover effect of technological innovation and financial agglomeration on economic growth
4.1. Construction of spatial econometric model
Technological innovation and financial agglomeration are spatially correlated in boosting real economic growth. To ensure our empirical research mirrors real-world dynamics, it's imperative to integrate New Economic Geography insights. Employing a spatial econometric model will then effectively elucidate the relationship among these factors.
Firstly, the generalized nested space model of static panel data is constructed.
Where represents the spatial lag of the explained variable, represents the explanatory variable and its regression coefficient, represents the spatial lag of the explanatory variable, and represents the spatial lag of the random disturbance term. 、and represent the i row of the corresponding spatial weight matrix, is the spatial autoregressive coefficient, is the spatial hysteresis coefficient of the explanatory variable, and λ is the spatial correlation coefficient of the disturbance term. and are individual effects and time effects, respectively. By adding different constraints to equation (3), the general generalized nested space model can be simplified to a more special spatial econometric model.
If the Spatial correlation coefficient is 0, then the Spatial Durbin Model (SDM) is obtained as shown in equation (4).
If the Spatial lag coefficient of the explanatory variable is 0, the Spatial Autocorrelation Model (SAC) is obtained, as shown in equation (5).
If the Spatial correlation coefficient and the spatial lag coefficient of explanatory variables are both 0, then the Spatial Autregression Model (SAR) is obtained, as shown in equation (5).
If the Spatial autoregressive coefficient and the spatial lag coefficient of explanatory variable are both 0, then the Spatial Error Model (SEM) is obtained, as shown in equation (7).
In the process of empirical research, the likelihood ratio (LR) test can be used to choose between the above models.
4.2. Index selection and data source
Owing to data constraints, this study utilizes panel data from 30 provinces and cities across mainland China spanning from 2011 to 2018. The Tibet Autonomous Region was excluded because of data unavailability. We define the variables as follows:
4.2.1. Dependent variable
This study employs the per capita real economic GDP (PGDP) of each province and city as a measure for the real economic growth of each region. Specifically, the calculation deducts the added values of the financial and real estate sectors from the GDP, yielding the real economy. With 2011 as the base year, we adjusted the GDP using the GDP deflator, then normalized it by the end-of-year population. All data regarding China's GDP, financial and real estate sectors, and population were sourced from the National Bureau of Statistics. The GDP deflator is referenced from the World Bank's database.
4.2.2. Primary explanatory variables
This encompasses technological innovation (INNO) and financial agglomeration (FINA).
4.2.3. Control variables
Based on prior research, we've incorporated the following control variables:
- (1) Government Intervention (GOV): Defined as the local public finance expenditure's proportion to the GDP of the respective provinces and cities. Data was sourced from the Wind database.
- (2) Fixed Asset Investment Intensity (INV): Quantified by the ratio of the adjusted total fixed asset investment to the adjusted GDP, which uses the 2011-based GDP deflator. The fixed asset investment and its associated price index are referenced from the National Bureau of Statistics.
- (3) Infrastructure (FRU): Represented by the combined railway and road mileage relative to the provincial land area. The data for both mileages are derived from the National Bureau of Statistics, while land area statistics are from the Yearbook of China Regional Economic Statistics.
- (4) Urbanization Level (URB): Measured by the urban population's ratio to the year-end permanent residents of each province or city, with data sourced from the National Bureau of Statistics.
- (5) Labor Force Intensity (LAB): Determined by the ratio of urban unit employees to the year-end permanent residents in each province or city. Data was obtained from the National Bureau of Statistics.
- (6) Foreign Trade Intensity (TRAD): Defined by the business unit location's total import and export volume's ratio to the GDP of each province and city. It's noteworthy that this metric is computed in USD. To mitigate the influence of exchange rate volatility, we first discerned the annual exchange rate from 2011-2018 by dividing the RMB-based national GDP by the USD-based one. We then converted the USD-valued total imports and exports using this rate. The resulting value's proportion to the provincial GDP quantifies foreign trade intensity. The USD-based national GDP data was sourced from the World Bank. The panel data descriptive statistics of the above variables are shown in Table 3.
4.3. Panel unit root check
LLC test and ADF-based Fisher type test are used to perform unit root test on panel data. The test results are shown in Table 4.
The findings presented in Table 4 confirm that each panel data variable is stationary and is therefore suitable for subsequent empirical evaluations.
4.4. Empirical analysis based on spatial econometric model
4.4.1. Global spatial autocorrelation test
The Global Moran's I test assesses the overall spatial correlation of sample variables. Fundamentally, the Global Moran's I index, typically ranging between -1 and 1, calculates the product of the deviations between two regional observations. A result greater than 0 suggests positive interregional correlation, indicating spatial clustering. Conversely, a value less than 0 signifies negative interregional correlation, pointing to spatial dispersion. If the value is near 0, it implies negligible spatial correlation. The formula for the Global Moran's I index is provided in equation (8).
Where n is the sample size, xi is the observed value of variable x in region i, is the sample mean, is the sample variance, and wij is the spatial weight matrix. In this paper, 0-1 spatial weight matrix is used for calculation. Since there is no province bordering Hainan Province, Guangdong Province and Guangxi Zhuang Autonomous Region are set as the neighboring provinces of Hainan Province.
Initiating our analysis, we apply the bilateral global Moran test to three pivotal variables: real economy growth (PGDP), technological innovation (INNO), and financial agglomeration (FINA). This study incorporates data sourced from 30 distinct provinces and cities across China, spanning the years 2011-2018. Detailed outcomes of this examination are tabulated in Table 5.
Table 5's analysis reveals that from 2011 to 2018, there exists a pronounced spatial positive correlation between China's real economy growth (PGDP) and its financial agglomeration (FINA). Both metrics achieved significance in the global Moran 'I test at the 5% level. Such results suggest that if a specific province experiences growth in its real economy and financial agglomeration, neighboring provinces are likely to be positively influenced, highlighting a potential trickle effect. In contrast, the spatial correlation for technological innovation (INNO) appears negligible during the same period.
Observing the temporal shifts in the global Moran 'I index, we note a stark decline in the spatial correlation of real economy growth between 2011 and 2014. This correlation plateaus from 2015 to 2016, only to surge in 2017 and stabilize in 2018. Overall, the fluctuations in this index remained within the range of 0.23 to 0.29, showcasing relative consistency. Interestingly, the spatial relationship of financial agglomeration has been on a decline since 2014, suggesting a diminishing spatial spillover effect on proximate regions.
4.4.2. Local spatial autocorrelation test
To delve deeper into the spatial distribution nuances of real economic growth and financial agglomeration across China's provinces and cities, we utilized the local Moran test. This examination was undertaken for the years 2011 and 2018 across 30 provinces and cities. The local Moran's I test elucidates the spatial correlation dynamics of the sample variables for individual regions. Equation (9) details the mathematical representation of the local Moran's I index
Given the spatial autocorrelation patterns observed in China's real economic growth and financial agglomeration, this study employs a spatial econometric model. This approach aims to provide a nuanced understanding of how technological innovation and financial agglomeration influence real economic growth.
4.4.3. The model estimation results and analysis
This study utilizes the maximum likelihood estimation (MLE) for regression estimations of various spatial models: the spatial Durbin model (SDM), spatial autoregressive model (SAR), spatial autocorrelation model (SAC), and spatial error model (SEM). Notably, the SDM focuses solely on the spatial lag of the core explanatory variables, INNO and FINA. The outcomes of these regressions can be viewed in Table 6.
Table 6's empirical results indicate that the four models' fitting outcomes are consistent, confirming model robustness. Notably, the spatial autoregressive coefficient ρ stands at 0.2100 and is 1% significant, highlighting a distinct spatial positive autocorrelation in the real economy's growth. The LR test establishes the SDM's superior fit over other models, making it our primary analysis framework.
(1) Technological Innovation (INNO): It significantly bolsters real economic growth. Directly, as an economic production input, it enhances societal productivity and real economic operations. Indirectly, it fosters high-tech entrepreneurship, facilitating China's industrial structural upgrade, thus optimizing market resource allocation.
(2) Financial Agglomeration (FINA): While it theoretically enhances real economic growth by streamlining financial resource allocation, its coefficient isn't statistically significant. Excessive financial agglomeration might dilute this effect due to its inherent siphon effect.
(3) Government Intervention (GOV): It poses a notable dampening effect on real economic growth. Driven by societal equity goals, such intervention may "crowd out" real economy operations, resulting in growth impediments.
(4) Fixed Asset Investment (INV): There's a robust positive relationship with real economic growth, underlining its pivotal role in fostering sustainable societal development.
(5) Urbanization Level (URB): It potentially drives real economic growth, though its P-value isn't significant.
(6) Labor Force Level (LAB): A significant enhancer for real economic growth as an integral operational input.
(7) Foreign Trade Level (TRAD): Exhibits a pronounced negative correlation with real economic growth. Given escalating trade protectionism and growing anti-globalization sentiments, China's foreign trade faces unprecedented challenges, impacting real economic growth.
(8) Infrastructure Development (FRU): Its correlation with real economic growth isn't statistically robust.
From a spatial perspective, technological innovation's spatial lag (W*INNO) notably propels real economic growth, implying that surrounding regions' innovation boosts a region's economy through knowledge spillovers. Furthermore, financial agglomeration's spatial lag (W*FINA) has a 1% significance level, suggesting that adjacent provinces' financial agglomeration can amplify a province's real economic growth via trickle effects. These spatial spillovers underline the growth pole's potential in bridging regional economic disparities.
4.4.4. Spatial spillover effect decomposition
The partial differential decomposition, based on the spatial Durbin model's estimation results, offers insights into the direct and indirect effects each variable exerts on real economic growth. The detailed outcomes are elucidated in Table 7.
In light of the detailed breakdown presented in Table 7, we can surmise the following pivotal points:
(1)Technological Innovation (INNO)
The direct, indirect, and cumulative effects of technological innovation on real economic growth are palpably positive.Intrinsically, technological advancements augment a region's industrial structure and real economy's efficiency, catalyzing its economic progression.Externally, due to regional economic integration and the knowledge spillover effect, a particular region's technological strides can permeate surrounding areas. This essentially allows adjacent regions to benefit from these innovations without having to expend equivalent resources, resulting in a "free rider" effect. Hence, the growth impetus derived from neighboring regions' technological advancements supersedes the direct benefits.
(2)Financial Agglomeration (FINA)
Directly, financial agglomeration doesn't render a statistically significant impact on real economic growth. Contrarily, financial agglomeration in proximate areas can amplify the growth of the local real economy, likely due to the trickle-down effect and the interconnected financial network.
(3)Government Intervention (GOV)
Both local and external government interventions curtail the real economic growth of a province. The domestic ramifications, especially due to the "crowding out effect," are markedly pronounced.
(4)Fixed Asset Investment (INV)
Investments in fixed assets, be it within the province or in surrounding provinces, substantially bolster the province's real economic growth. Local investments, in particular, exhibit a salient amplifying effect.
(5)Urbanization Level (URB)
While urbanization tends to exert positive direct and indirect influences on real economic growth, the effects are statistically inconclusive.
(6)Labor Force Level (LAB)
The significance of the labor force on real economic growth is evident both directly within the province and indirectly from surrounding regions, substantiating the integral role labor plays in economic dynamism.
(7)Foreign Trade Level (TRAD)
Both directly and indirectly, foreign trade exhibits a dampening effect on real economic growth, significant at the 5% level. This suggests external trade dynamics, perhaps influenced by global protectionist sentiments, adversely impact regional economic performance.
(8)Infrastructure Development (FRU)
Infrastructure investments appear to correlate negatively with real economic growth both directly and indirectly, though these results are not statistically robust.
These insights provide a comprehensive understanding of the multifaceted interactions at play in shaping the real economic growth of a region, taking into account both intrinsic and extrinsic factors.
5. Conclusions
The findings and conclusions derived from this comprehensive research shed light on the intricate interplay of technological innovation, financial agglomeration, and other macroeconomic variables in shaping the trajectory of China's real economy in the "new normal" phase. Summarizing the crucial takeaways.
(1)Dual roles of technological innovation(INNO) and financial agglomeration(FINA)
Both technological innovation and financial agglomeration can be a boon or bane to the real economy. While the former invigorates the economy through creative destruction and income effects, it may simultaneously act as a drag due to the associated cost effects. Similarly, financial agglomeration, though being a bedrock by offering resources through agglomeration and financial function effects, can have a reverse siphoning effect. Financial agglomeration also indirectly influences the real economy by modulating technological innovation, and both these pillars influence neighboring regions due to the knowledge spillover and spatial diffusion effects.
(2)Predominance of technological innovation
Technological innovation stands out as a major propellant for the growth of China's real economy, exhibiting strong direct and indirect positive influences. Financial agglomeration, although instrumental, isn't a cardinal driver. Its spatial spillover effects, however, reinforce the importance of interconnected growth among provinces and cities.
(4) Investment(INV) and Labor (LAB)Remain Integral
Fixed asset investments and labor levels continue to be pivotal for China's real economic growth. Meanwhile, urbanization and infrastructure levels aren't bottleneck factors anymore, reflecting China's progress in these domains.
(5)Diminishing government intervention(GOV) and foreign trade level(TRADE)concerns
Over-reliance on government interventions and the challenges in the foreign trade arena (especially in the light of global trade frictions) could be counterproductive. China must steer towards more market-led reforms and bolster its endogenous growth engines for sustainable, high-quality economic evolution.
In essence, as China traverses its "new normal" phase, the emphasis should be on harnessing technological innovations as the lynchpin for high-quality economic growth. While financial agglomeration is vital, its role is complementary, necessitating a recalibration of strategies across financial sectors. Additionally, a shift towards more market-centric reforms and focusing on endogenous growth factors will be pivotal in navigating the evolving economic landscape.
Data available statement
The data that support the findings of this study are openly available in http://www.stats.gov.cn/sj/.
Geolocation information
Graduate School of International Studies, Hanyang University,04763, Seoul, Republic of Korea.
Disclosure statement
No potential conflict of interest was reported by the authors.
References
- Adak, M. (2015). Technological progress, innovation and economic growth; the case of Turkey. Procedia-Social and Behavioral Sciences, 195, 776-782. [CrossRef]
- Aali Bujari, A., & Venegas Martínez, F. (2016). Technological innovation and economic growth in Latin America. Revista mexicana de economía y finanzas, 11(2), 77-89.
- Anwar, S., & Cooray, A. (2012). Financial development, political rights, civil liberties and economic growth: Evidence from South Asia. Economic Modelling, 29(3), 974-981. [CrossRef]
- Bernat Jr, G. A. (1996). Does manufacutring matter? a spatial econometric view of kaldor's laws. Journal of regional science, 36(3), 463-477.
- Bravo-Ortega, C., & Marín, Á. G. (2011). R&D and productivity: A two way avenue?. World Development, 39(7), 1090-1107. [CrossRef]
- Cavalieri, A., Reis, J., & Amorim, M. (2021). Circular economy and internet of things: Mapping science of case studies in manufacturing industry. Sustainability, 13(6), 3299. [CrossRef]
- Croitoru, A. (2012). Schumpeter, JA, 1934 (2008), The theory of economic development: An inquiry into profits, capital, credit, interest and the business cycle. Journal of comparative research in anthropology and sociology, 3(02), 137-148.
- Drucker, P. F. (1958). Marketing and economic development. Journal of Marketing, 22(3), 252-259.
- Feki, C., & Mnif, S. (2016). Entrepreneurship, technological innovation, and economic growth: Empirical analysis of panel data. Journal of the Knowledge Economy, 7(4), 984-999. [CrossRef]
- Fujita, M., Krugman, P. R., & Venables, A. (2001). The spatial economy: Cities, regions, and international trade. MIT press. 1(1): 283-285.
- Greenwood, J., & Jovanovic, B. (1990). Financial development, growth, and the distribution of income. Journal of political Economy, 98(5, Part 1), 1076-1107.
- Haggett, P. (1977). Geography in a steady-state environment. Geography, 159-167.
- Hausmann, R., Hidalgo, C. A., Bustos, S., Coscia, M., & Simoes, A. (2014). The atlas of economic complexity: Mapping paths to prosperity. MIT Press.2(1):18-26.
- Hassan, M. K., Sanchez, B., & Yu, J. S. (2011). Financial development and economic growth: New evidence from panel data. The Quarterly Review of economics and finance, 51(1), 88-104. [CrossRef]
- He, F., Ma, Y., & Zhang, X. (2020). How does economic policy uncertainty affect corporate Innovation?–Evidence from China listed companies. International Review of Economics & Finance, 67, 225-239. [CrossRef]
- Iyare, S., & Moore, W. (2011). Financial sector development and growth in small open economies. Applied Economics, 43(10), 1289-1297. 10. [CrossRef]
- Khan, S. A. R., Razzaq, A., Yu, Z., & Miller, S. (2021). Industry 4.0 and circular economy practices: A new era business strategies for environmental sustainability. Business Strategy and the Environment, 30(8), 4001-4014. [CrossRef]
- Koh, W. T. (2007). Terrorism and its impact on economic growth and technological innovation. Technological forecasting and social change, 74(2), 129-138. [CrossRef]
- Krugman, P. (1991). Increasing returns and economic geography. Journal of political economy, 99(3), 483-499. [CrossRef]
- Laibman, D. (1999). Productive and unproductive labor: A comment. Review of Radical Political Economics, 31(2), 61-73.
- Levine, R. (1997). Financial development and economic growth: views and agenda. Journal of economic literature, 35(2), 688-726.
- Lucas Jr, R. E. (1988). On the mechanics of economic development. Journal of monetary economics, 22(1), 3-42.
- Mohun, S. (1996). Productive and unproductive labor in the labor theory of value. Review of Radical Political Economics, 28(4), 30-54. [CrossRef]
- Ottaviano, G., Robert-Nicoud, F., Baldwin, R., Forslid, R., & Martin, P. (2011). Economic geography and public policy. Princeton University Press, 1(2): 6-9.
- Pandit, N. R., Cook, G. A., & Swann, P. G. M. (2001). The dynamics of industrial clustering in British financial services. Service Industries Journal, 21(4), 33-61. [CrossRef]
- Pradhan, R. P., Arvin, M. B., Hall, J. H., & Nair, M. (2016). Innovation, financial development and economic growth in Eurozone countries. Applied Economics Letters, 23(16), 1141-1144. [CrossRef]
- Romer, Paul M. "Two strategies for economic development: using ideas and producing ideas." The strategic management of intellectual capital. Routledge, 2009. 211-238.
- Sun, Z., Wang, T., Xiao, X., Zhang, Q., & Guo, H. (2022). Research on the Measurement of Logistics Capability of Core Cities along “the Belt and Road” in China. Advances in Mathematical Physics, 2022.1-1. [CrossRef]
- Tadesse, S. (2002). Financial architecture and economic performance: international evidence. Journal of financial intermediation, 11(4), 429-454. [CrossRef]
- Wang, S., Tian, W., & Lu, B. (2023). Impact of capital investment and industrial structure optimization from the perspective of" resource curse": Evidence from developing countries. Resources Policy, 80, 103276. [CrossRef]
- Wang, S., Yi, X., & Song, M. (2022). The interrelationship of air quality, investor sentiment, and stock market liquidity: A review of China. Environment, Development and Sustainability, 1-19. [CrossRef]
- Wang, T., Wang, D., Yu, L. N., Ryoo, J., Min, K. S., & Guo, H. W. (2023). Relationship between Vaccination in Covid-19 and the Number of Patients and Serious Illnesses in the Republic of Korea from a Financial Risk Transmission Perspective: An Analysis Based on Var Model. Medicine, 17-17.
- Yu, L., Sun, Y., Liu, X., & Wang, T. (2023). Does regional value chain participation affect global value chain positions? Evidence from China. Economic Research-Ekonomska Istraživanja, 36(2), 2108474.
Figure 1.
Average technological innovation level.
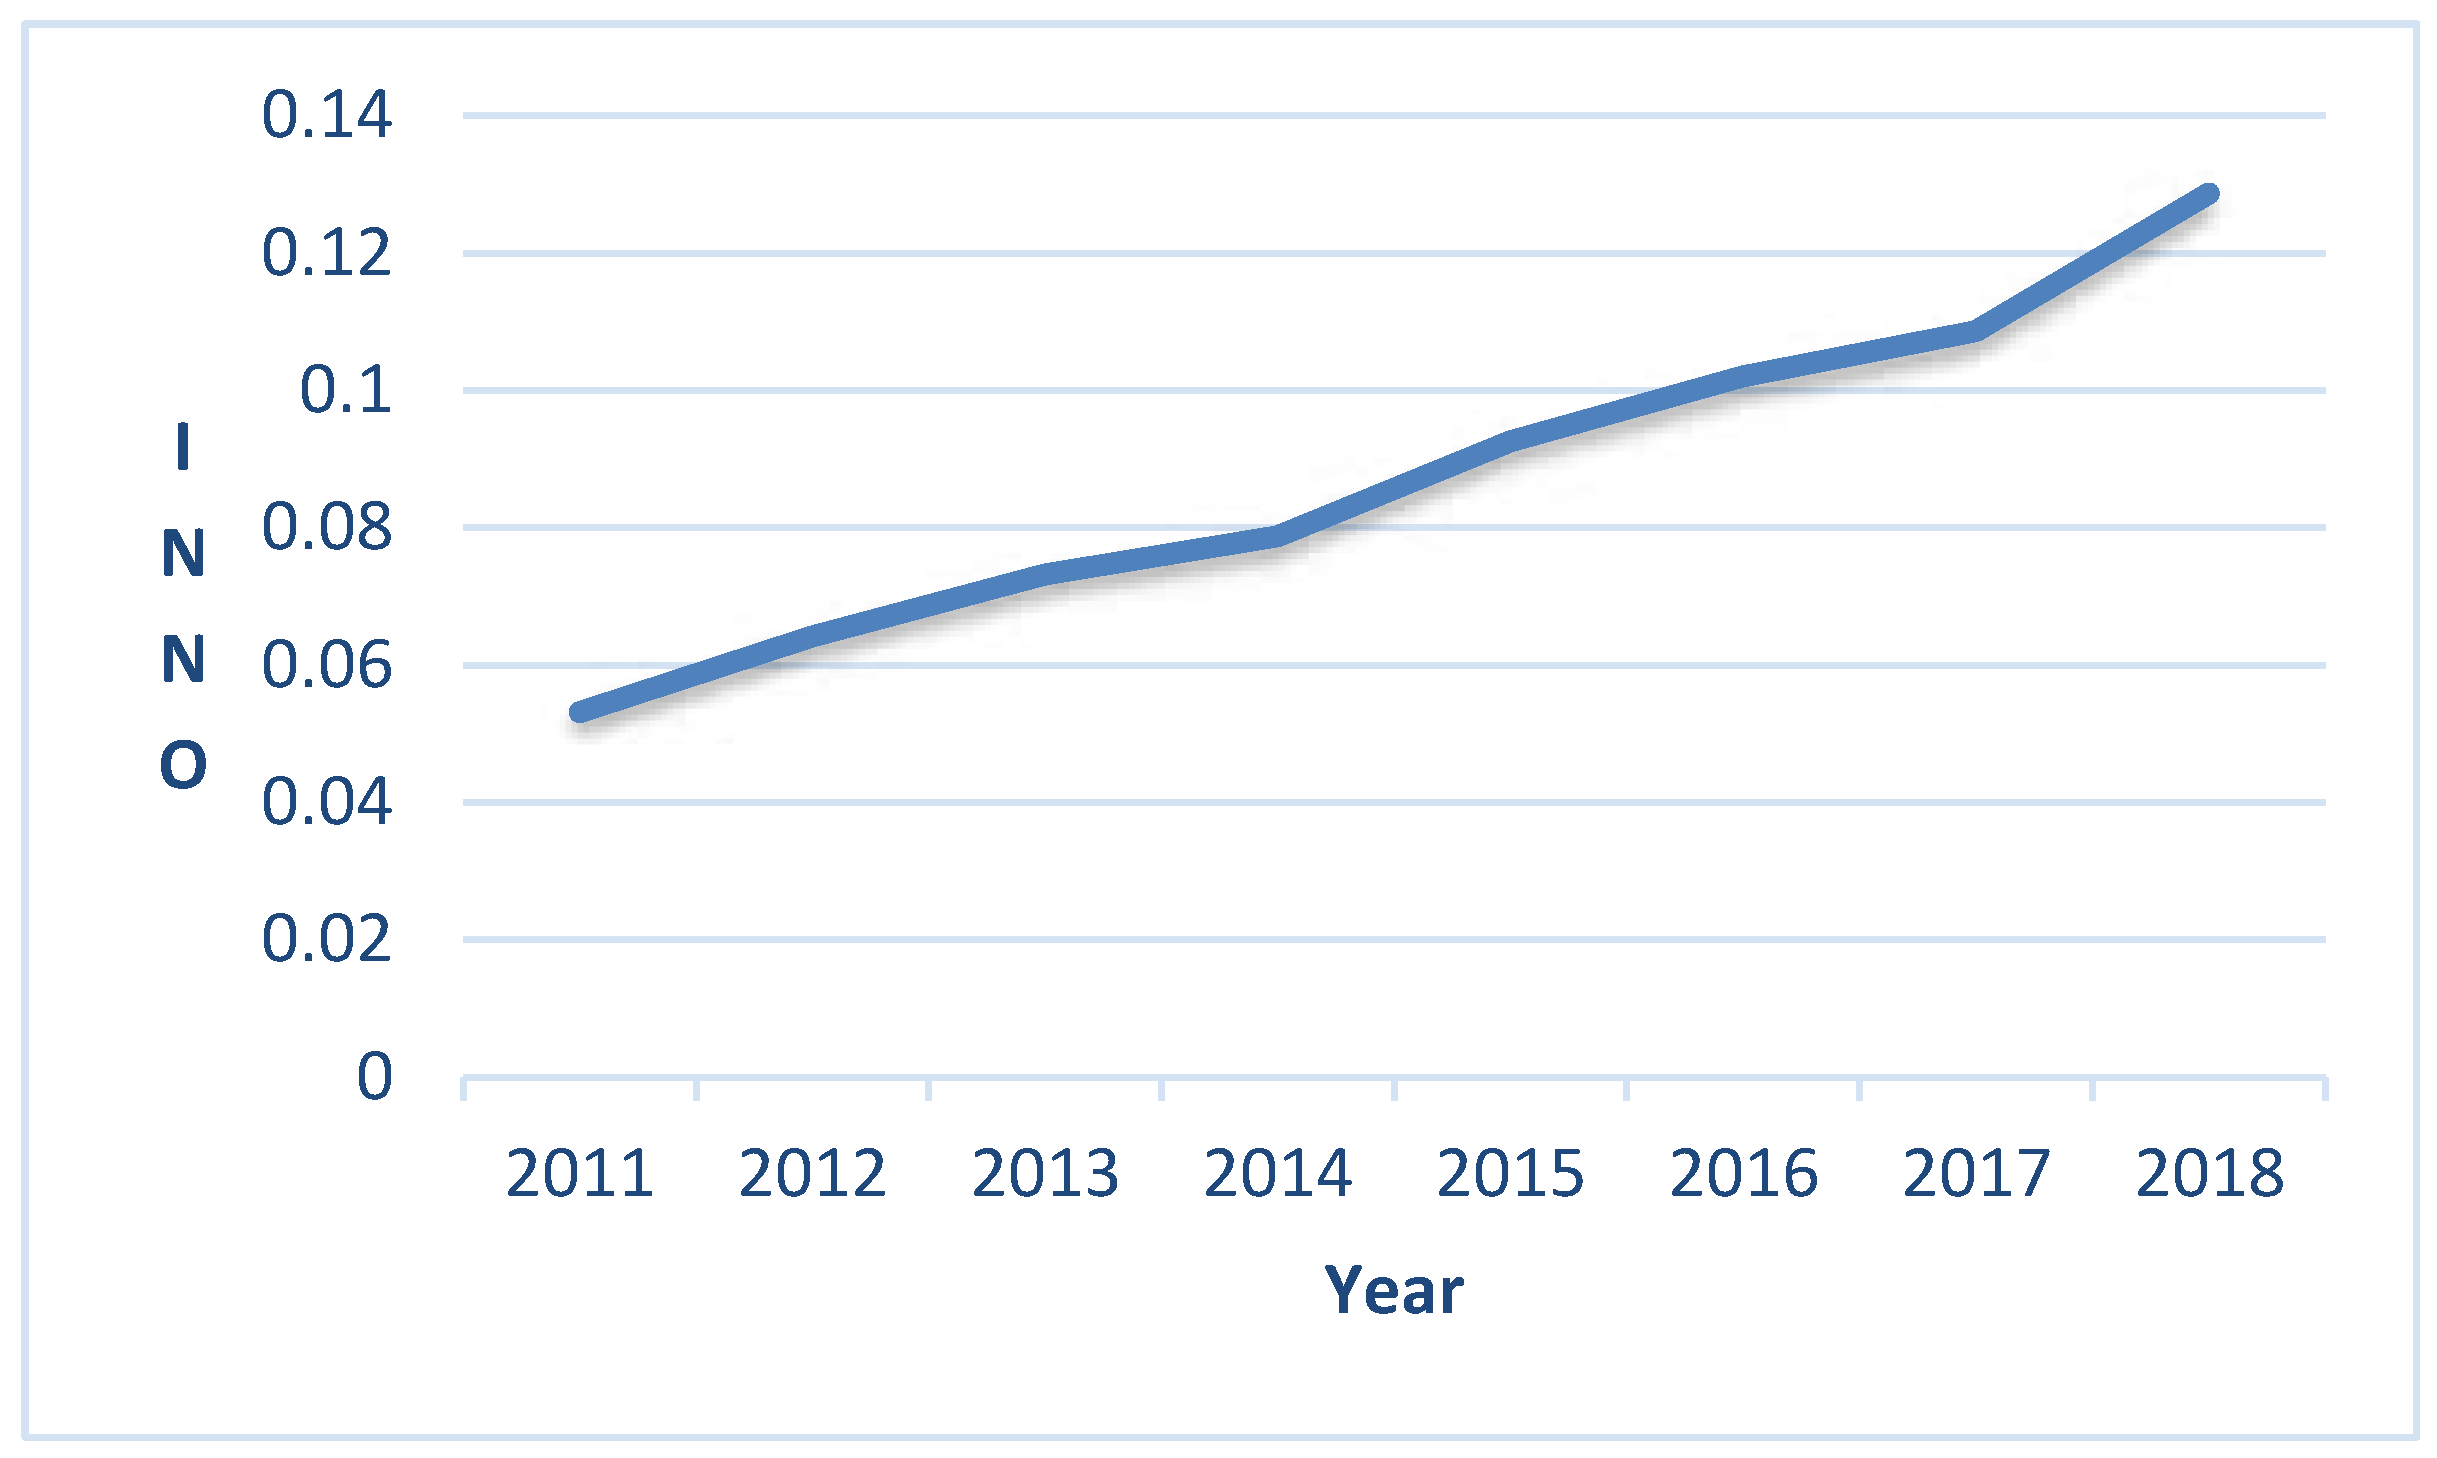
Figure 2.
Technology innovation level in 2011 (left) and 2018 (right).
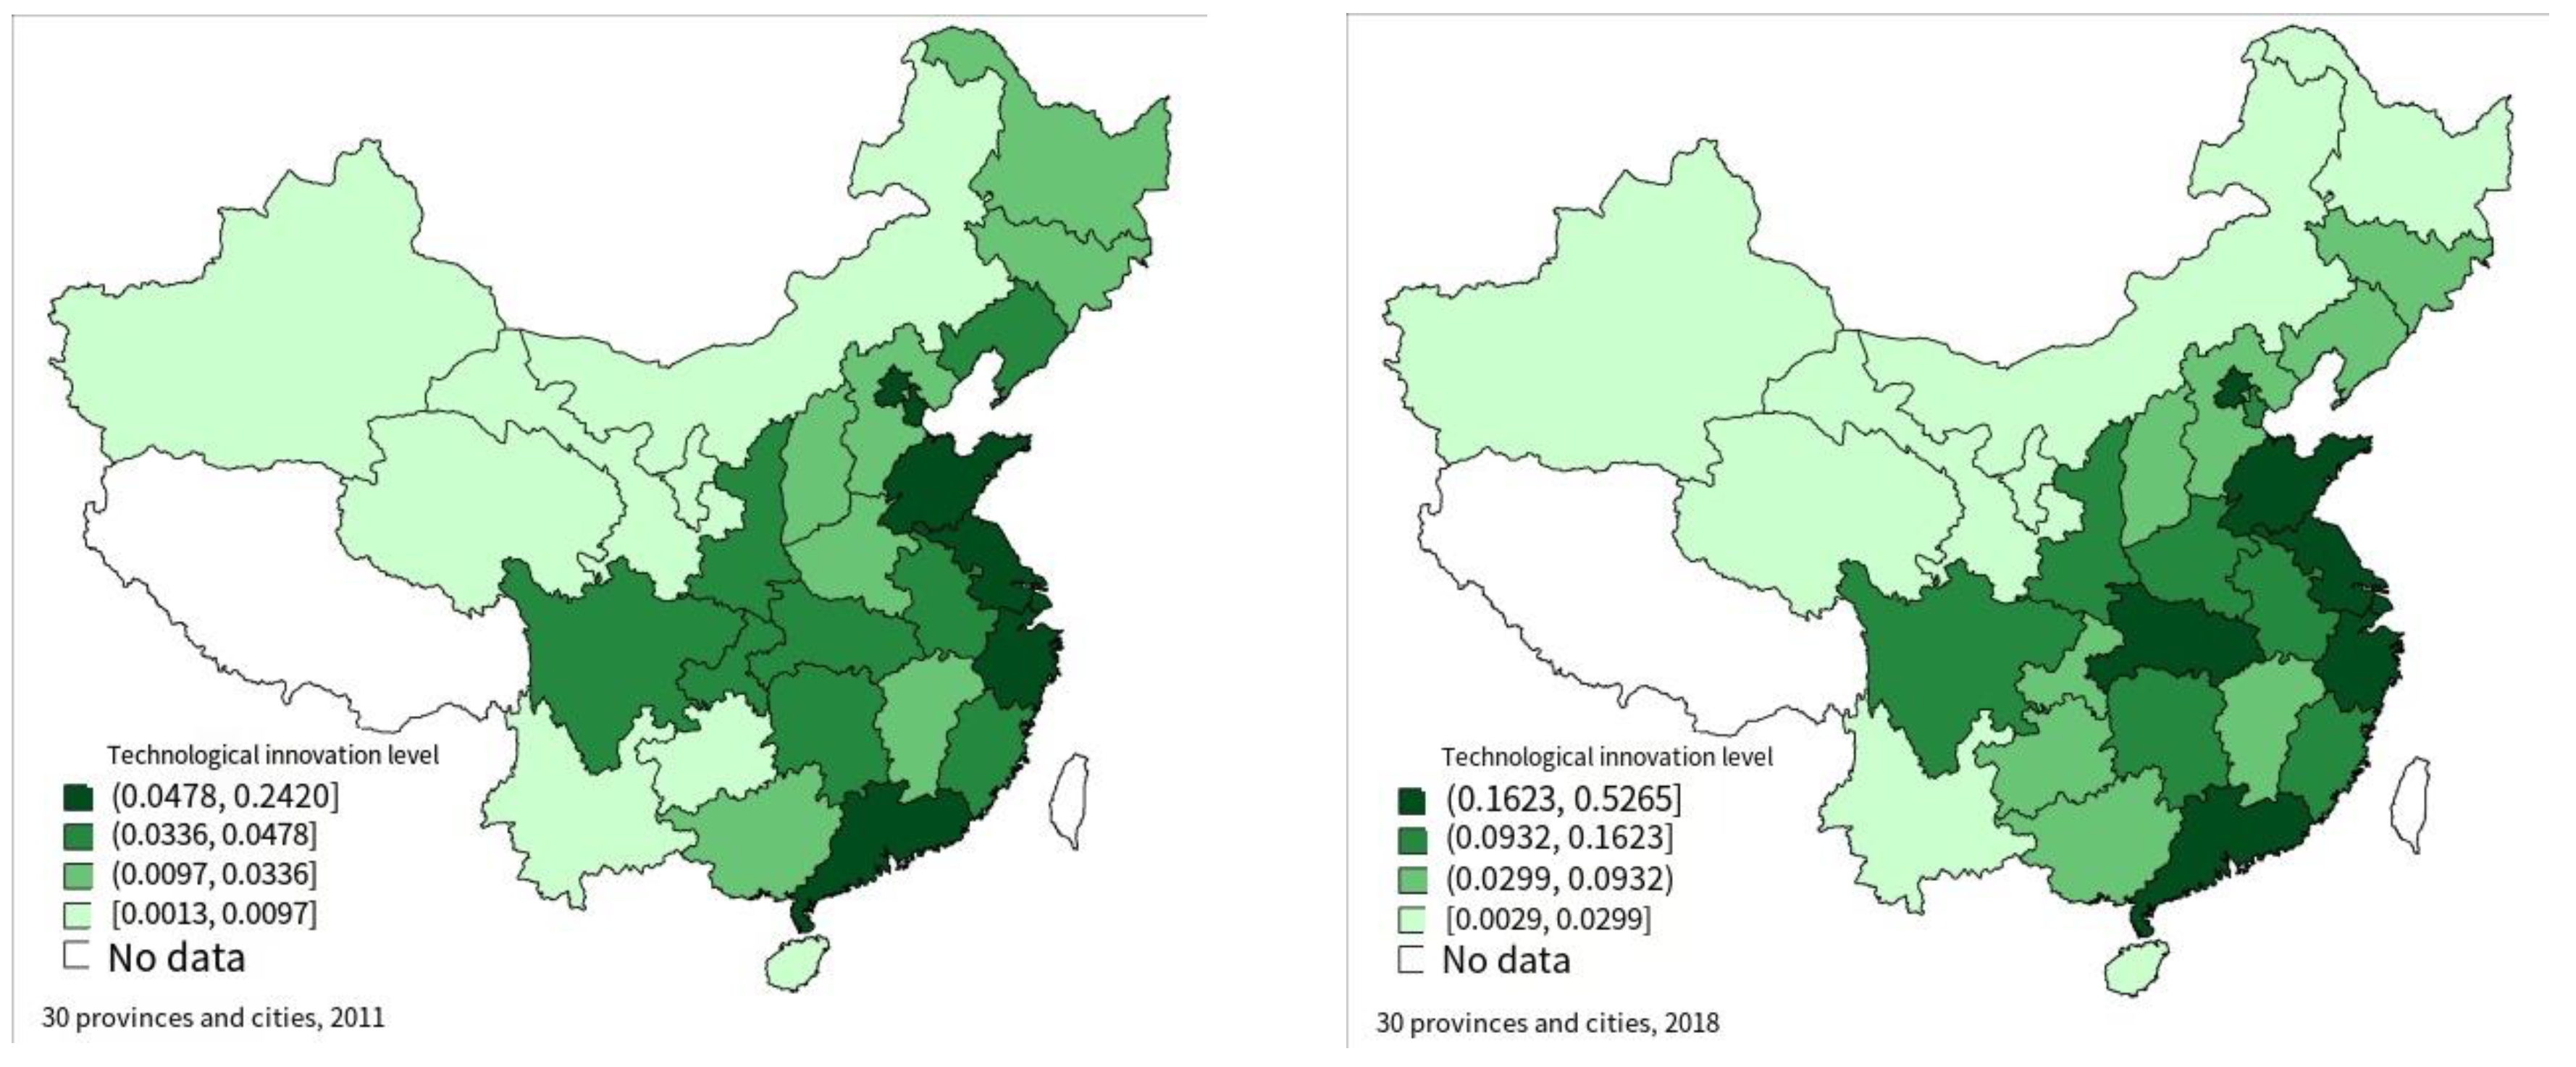
Figure 3.
Average level of financial agglomeration.
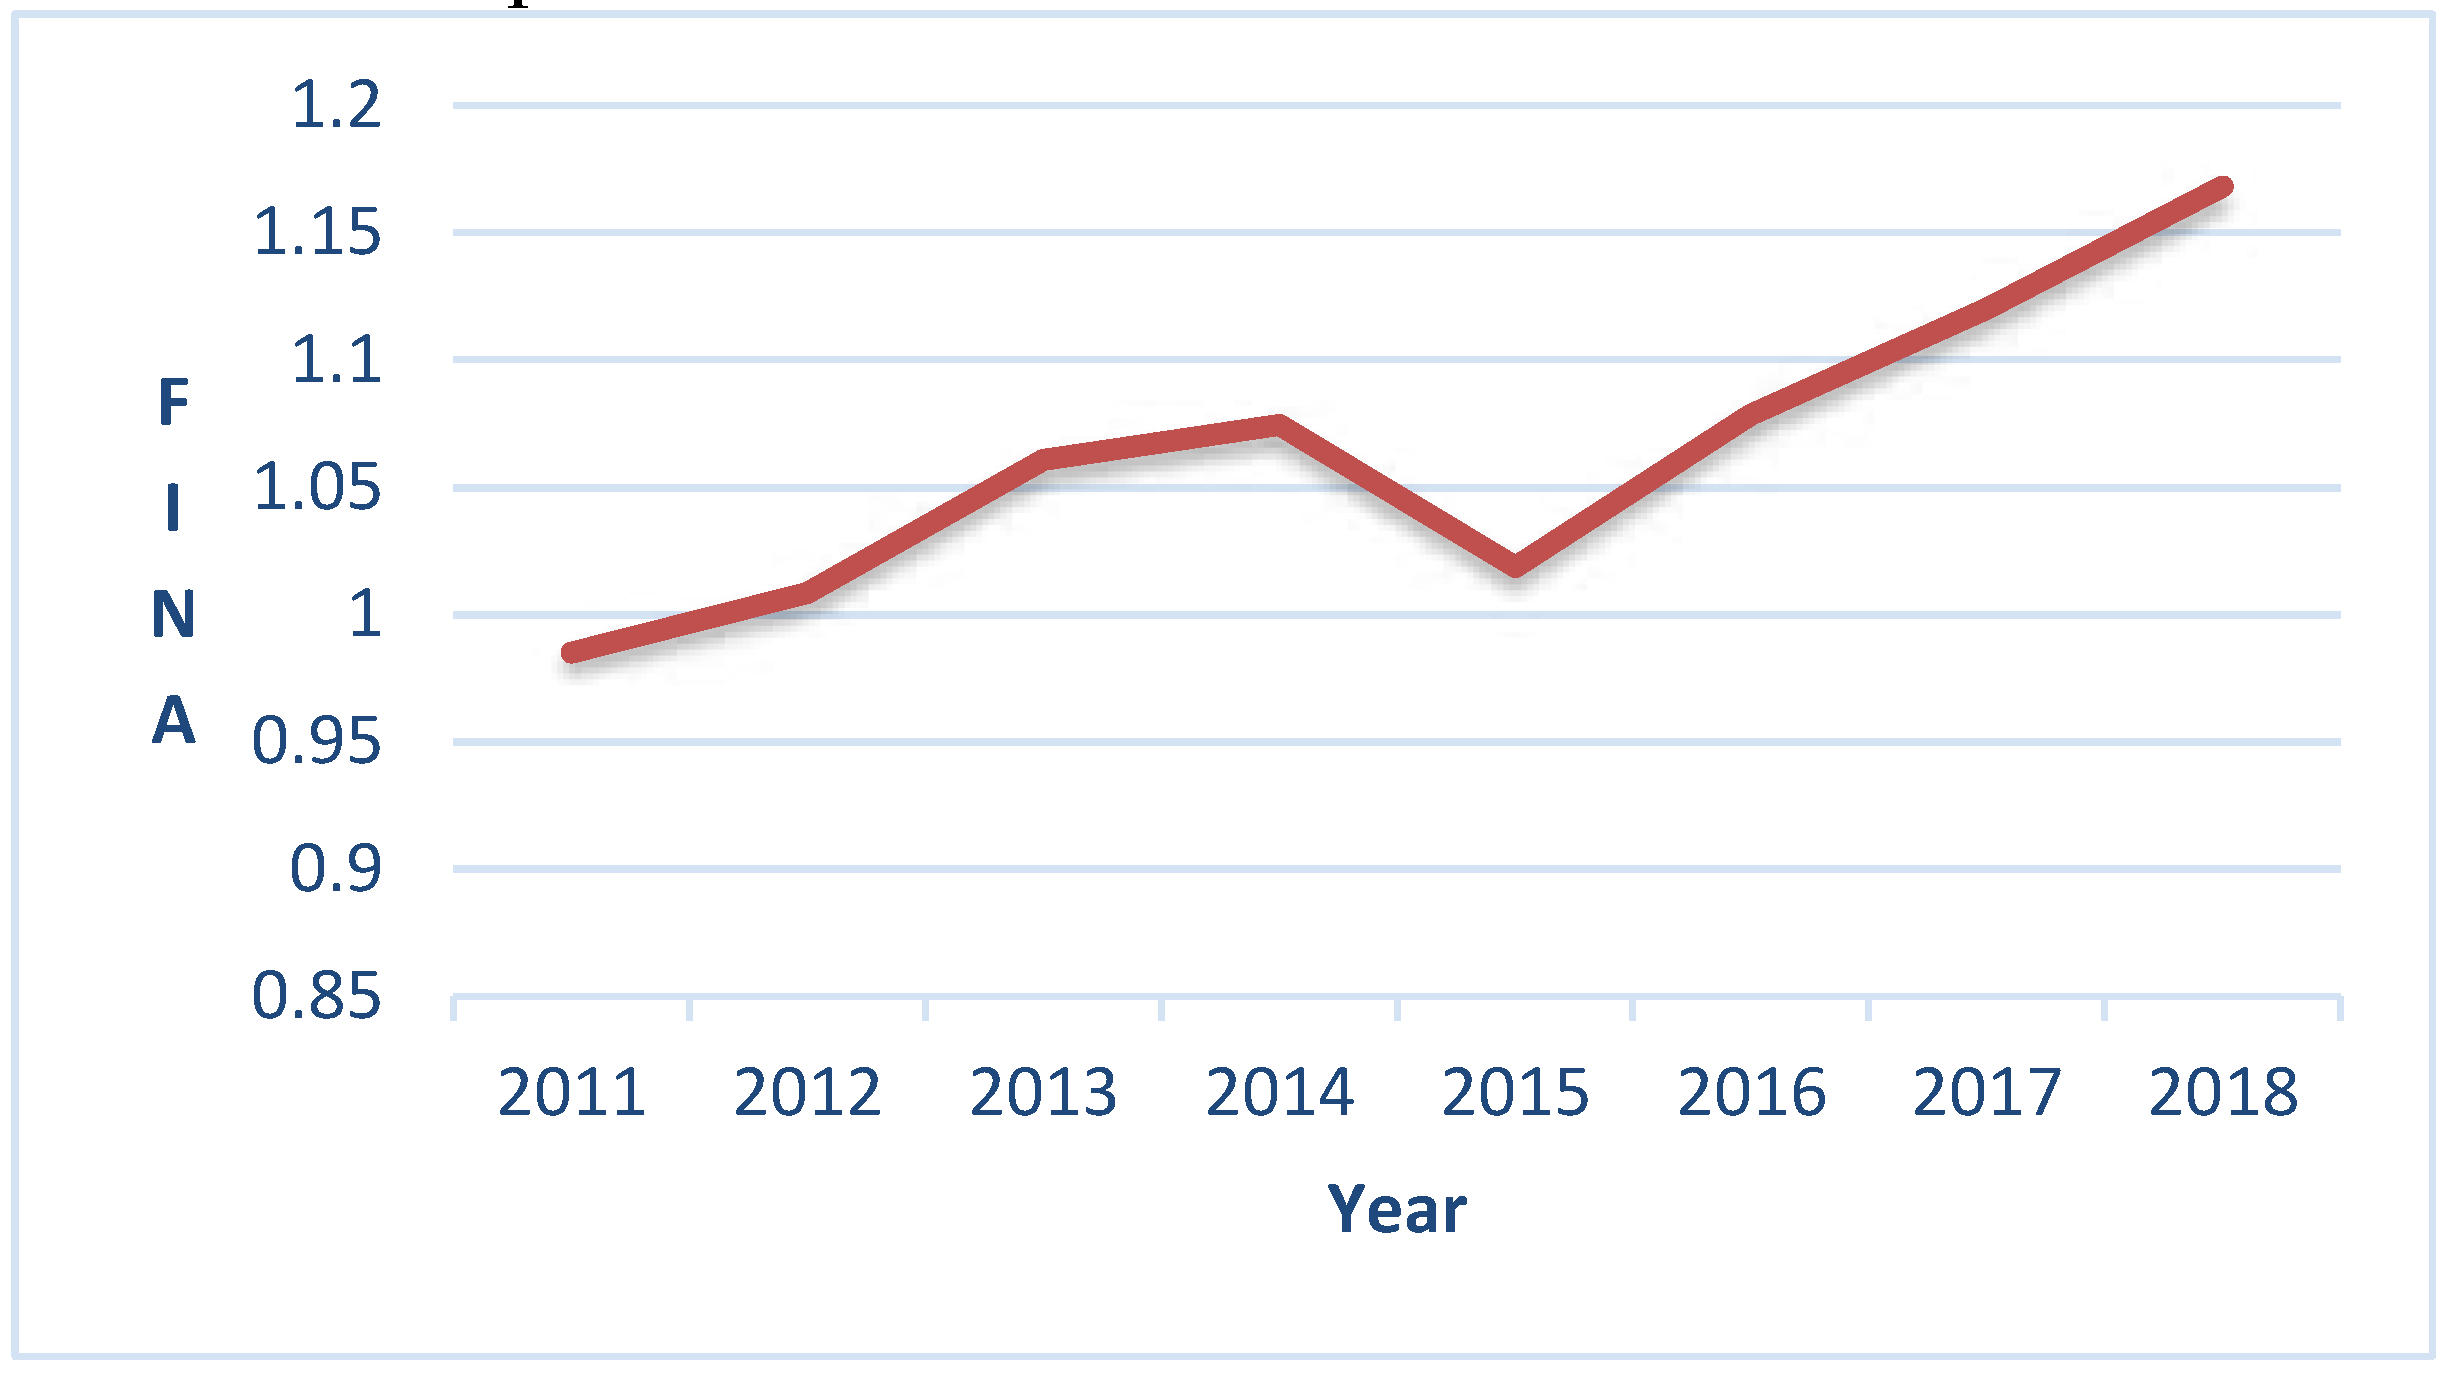
Figure 4.
Distribution of financial agglomeration level in 2011 (left) and 2018 (right).
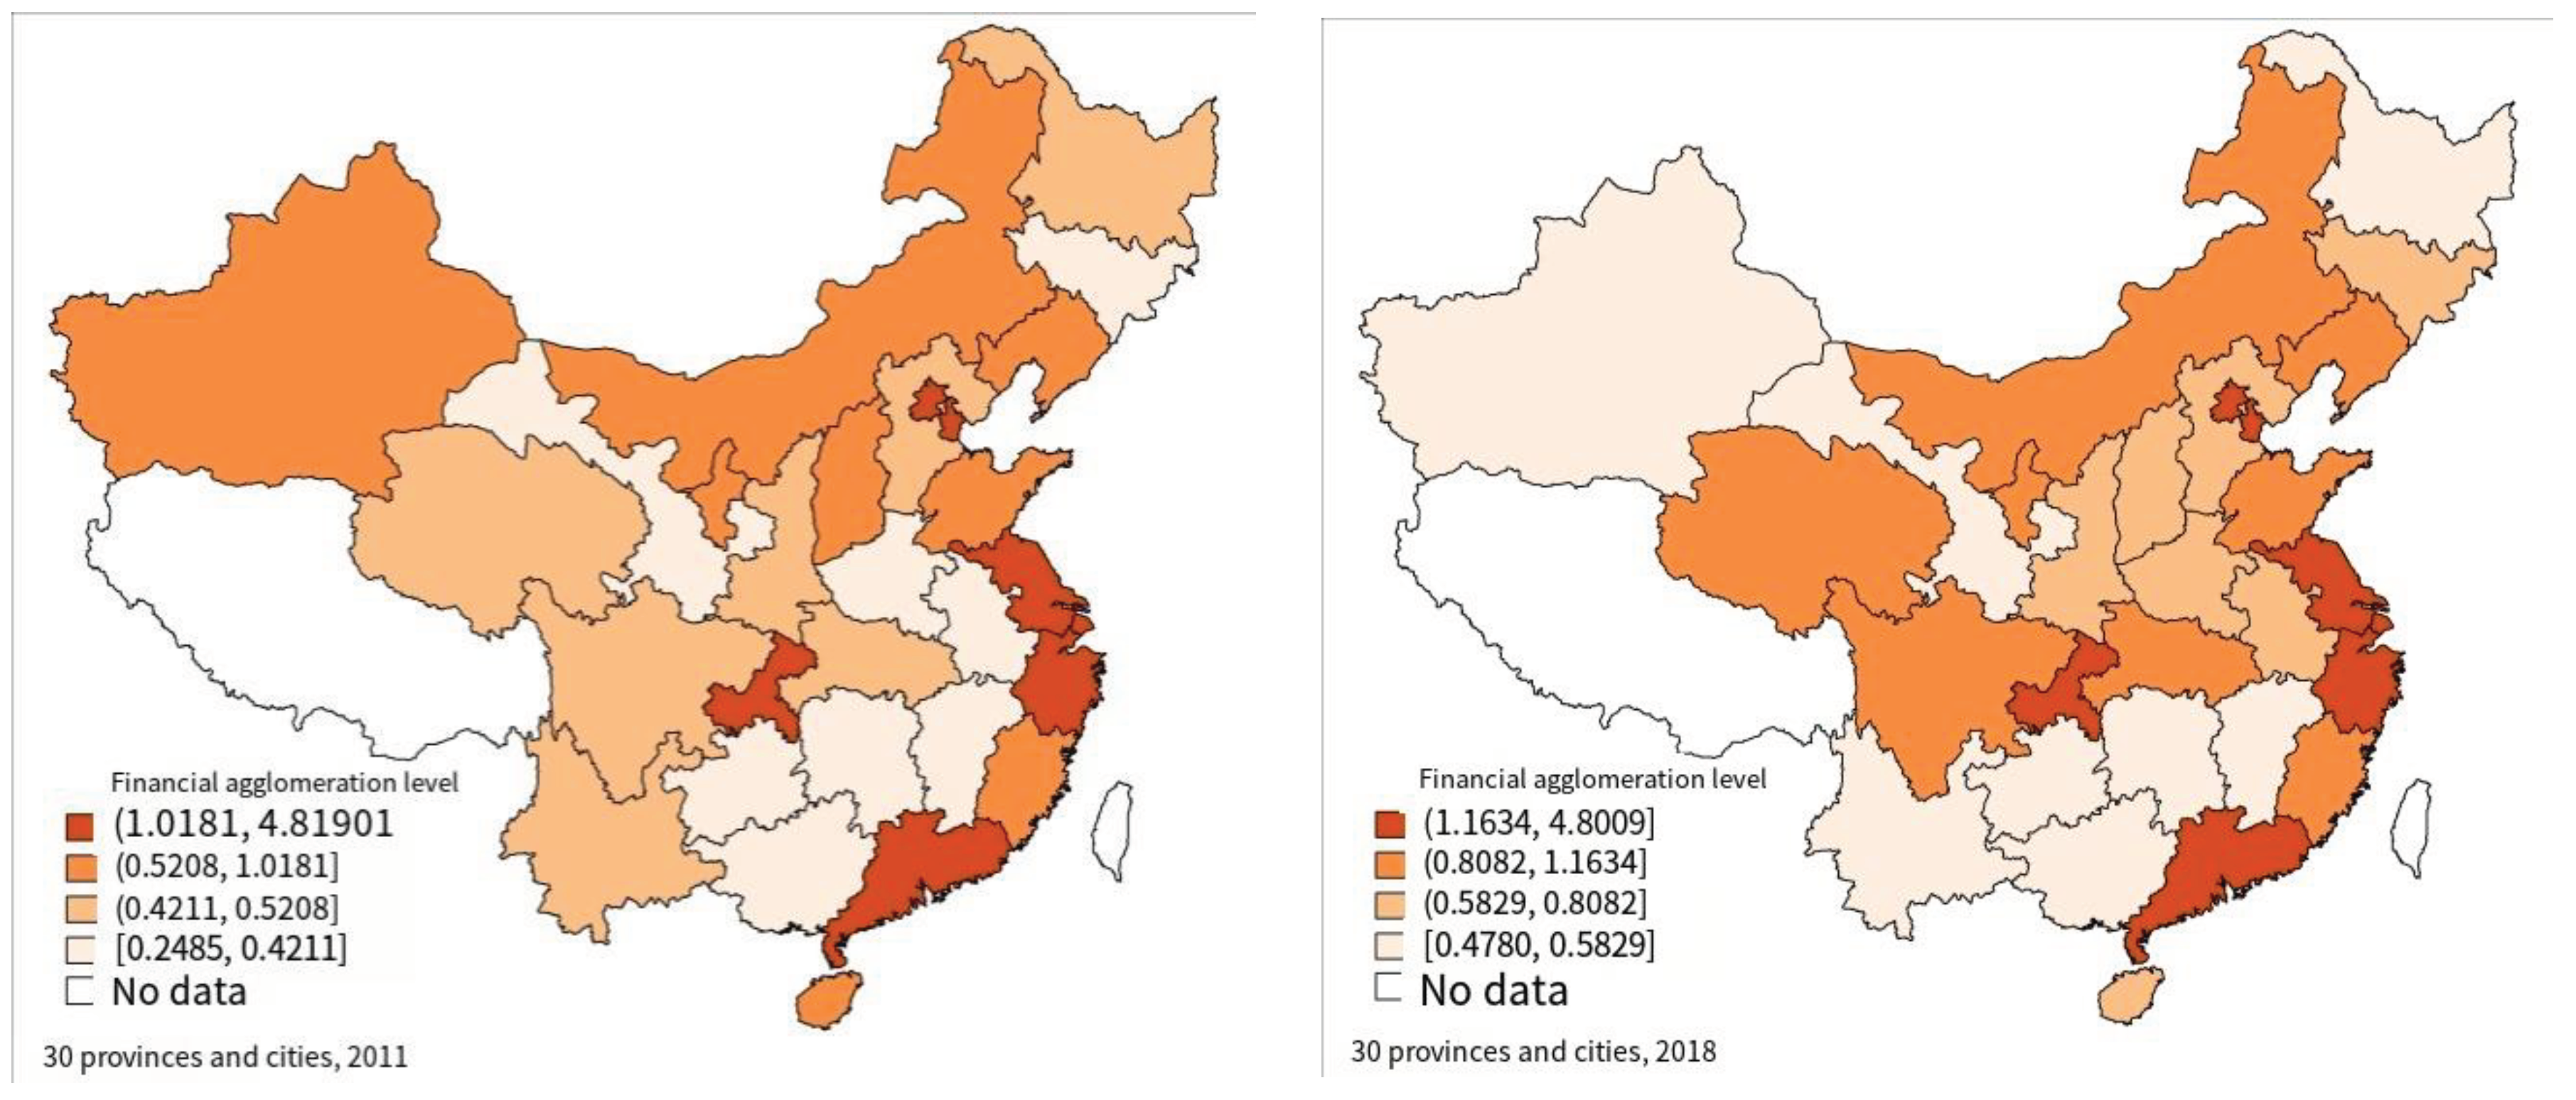

Table 1.
Index system of technological innovation.
| Secondary index | Indicator Description | Data sources | Weights |
|---|---|---|---|
| Patent output levels | Number of patents granted | Wind Database | 0.2917 |
| Technical market closed | Technology market turnover /GDP deflator after fixed basis | Wind Database World Bank |
0.4269 |
| Income from scientific and technological achievements | New product sales income/PPI after fixed base | National Bureau of Statistics | 0.2814 |
Table 3.
Description the panel data descriptive statistics of variables.
| Variables | Categories | Mean value | Standard deviation | Minimum | Maximum | Observed value |
|---|---|---|---|---|---|---|
| PGDP | overall | 4.3417 | 1.7923 | 1.5119 | 9.5438 | N=240 |
| between | 1.7261 | 2.1943 | 8.5302 | n =30 | ||
| within | 0.5659 | 2.7874 | 6.1107 | T=8 | ||
| INNO | overall | 0.0877 | 0.1032 | 0.0012 | 0.5265 | N=240 |
| between | 0.0991 | 0.0019 | 0.3351 | n =30 | ||
| within | 0.0334 | 0.0494 | 0.2812 | T=8 | ||
| FINA | overall | 1.0643 | 1.0253 | 0.2485 | 4.8190 | N=240 |
| between | 1.0333 | 0.3874 | 4.5982 | n =30 | ||
| within | 0.1216 | 0.6481 | 1.7225 | T=8 | ||
| GOV | overall | 0.2460 | 0.1030 | 0.0458 | 0.6274 | N=240 |
| between | 0.1022 | 0.1237 | 0.5935 | n =30 | ||
| within | 0.0216 | 0.0809 | 0.3003 | T=8 | ||
| INV | overall | 0.8264 | 0.2583 | 0.2296 | 1.5066 | N=240 |
| between | 0.2230 | 0.2603 | 1.2389 | n =30 | ||
| within | 0.1358 | 0.3925 | 1.1902 | T=8 | ||
| FRU | overall | 0.0094 | 0.0047 | 0.0009 | 0.0194 | N=240 |
| between | 0.0047 | 0.0011 | 0.0168 | n =30 | ||
| within | 0.0006 | 0.0070 | 0.0122 | T=8 | ||
| URB | overall | 0.5711 | 0.1230 | 0.3497 | 0.8961 | N=240 |
| between | 0.1216 | 0.4112 | 0.8864 | n =30 | ||
| within | 0.0280 | 0.5095 | 0.6352 | T=8 | ||
| LAB | overall | 0.1309 | 0.0587 | 0.0690 | 0.3804 | N=240 |
| between | 0.0584 | 0.0809 | 0.3582 | n =30 | ||
| within | 0.0118 | 0.0651 | 0.1637 | T=8 | ||
| TRAD | overall | 0.2747 | 0.3121 | 0.0168 | 1.5488 | N=240 |
| between | 0.3072 | 0.0355 | 1.1923 | n =30 | ||
| within | 0.0763 | 0.0951 | 0.7228 | T=8 |
Table 4.
Panel data unit root check.
| Variables | LLC test | Fisher type test | Smoothness | |||
|---|---|---|---|---|---|---|
| Adj-t* statistic | P statistic | Z statistic | L* statistic | Pm statistics | ||
| PGDP | 13.3879 * * * | 108.1377 * * * | 2.9261 * * * | 3.0758 * * * | 4.3944 * * * | Smooth and steady |
| (0.0000) | (0.0001) | (0.0017) | (0.0012) | (0.0000) | ||
| INNO | 23.8554 * * * | 85.5163 * * | 1.7125 * * | 1.7969 * * | 2.3293 * * * | Smooth |
| (0.0000) | (0.0169) | (0.0434) | (0.0372) | (0.0099) | ||
| FINA | 11.4934 * * * | 145.8741 * * * | 6.9268 * * * | 6.8433 * * * | 7.8392 * * * | Smooth |
| (0.0000) | (0.0000) | (0.0000) | (0.0000) | (0.0000) | ||
| GOV | 30.1765 * * * | 103.4039 * * * | 4.3320 * * * | 4.1405 * * * | 3.9622 * * * | Smooth |
| (0.0000) | (0.0004) | (0.0000) | (0.0000) | (0.0000) | ||
| INV | 7.4903 * * * | 147.4878 * * * | 6.4990 * * * | 6.5015 * * * | 7.9865 * * * | Smooth |
| (0.0000) | (0.0000) | (0.0000) | (0.0000) | (0.0000) | ||
| FRU | 8.6623 * * * | 128.5222 * * * | 4.9756 * * * | 5.1003 * * * | 6.2552 * * * | Smooth |
| (0.0000) | (0.0000) | (0.0000) | (0.0000) | (0.0000) | ||
| URB | 13.5586 * * * | 87.2865 * * | 2.1589 * * | 2.1005 * * | 2.4909 * * * | Smooth |
| (0.0000) | (0.0123) | (0.0154) | (0.0187) | (0.0064) | ||
| LAB | 37.0871 * * * | 222.3900 * * * | 9.3152 * * * | 10.6654 * * * | 14.8241 * * * | Smooth |
| (0.0000) | (0.0000) | (0.0000) | (0.0000) | (0.0000) | ||
| TRAD | 11.5037 * * * | 117.9598 * * * | 5.2625 * * * | 5.0328 * * * | 5.2910 * * * | Smooth |
| (0.0000) | (0.0000) | (0.0000) | (0.0000) | (0.0000) | ||
Note: P values in parentheses; *** indicates significant at the 1% significance level.
Table 5.
Global Moran 'I index.
| 2011 | 2012 | 2013 | 2014 | 2015 | 2016 | 2017 | 2018 | |
|---|---|---|---|---|---|---|---|---|
| PGDP | 0.284 * * * | 0.269 * * * | 0.257 * * * | 0.238 * * | 0.236 * * | 0.241 * * | 0.281 * * * | 0.279 * * * |
| (2.913) | (2.772) | (2.657) | (2.475) | (2.451) | (2.505) | (2.875) | (2.850) | |
| INNO | 0.000 | 0.003 | 0.004 | 0.004 | 0.022 | 0.009 | 0.034 | 0.065 |
| (0.627) | (0.574) | (0.506) | (0.631) | (0.713) | (0.570) | (0.853) | (1.055) | |
| FINA | 0.213 * * | 0.218 * * | 0.212 * * | 0.205 * * | 0.178 * * | 0.172 * * | 0.175 * * | 0.167 * * |
| (2.522) | (2.554) | (2.498) | (2.435) | (2.179) | (2.123) | (2.155) | (2.070) |
Note: Z-values in parentheses; ***, **, and * are significant at the significance level of 1%, 5%, and 10%, respectively.
Table 6.
Estimation results of spatial econometric model.
| Variables | SDM | SAR | SAC | SEM | |
| INNO | 3.7127 * * * | 3.5048 * * * | 3.7354 * * * | 3.0961 * * * | |
| (0.7327) | (0.7280) | (0.7360) | (0.8035) | ||
| FINA | 0.1086 | 0.0209 | 0.0837 | 0.0030 | |
| (0.1452) | (0.1459) | (0.1501) | (0.1490) | ||
| GOV | 3.4832 * * * | 3.4224 * * * | 3.3240 * * * | 3.6438 * * * | |
| (0.7918) | (0.8126) | (0.7989) | (0.8546) | ||
| INV | 0.4877 * * * | 0.5149 * * * | 0.4997 * * * | 0.5245 * * * | |
| (0.1577) | (0.1617) | (0.1595) | (0.1662) | ||
| URB | 2.3404 | 2.7579 | 2.3232 | 3.3027 * | |
| (1.7415) | (1.7728) | (1.7220) | (1.8916) | ||
| LAB | 5.6902 * * * | 5.4400 * * * | 4.7686 * * * | 5.9587 * * * | |
| (1.7606) | (1.7809) | (1.7667) | (1.8605) | ||
| TRAD | 1.9850 * * * | 1.9343 * * * | 1.8719 * * * | 2.0318 * * * | |
| (0.3196) | (0.3208) | (0.3121) | (0.3406) | ||
| FRU | 18.8158 | 20.4876 | 11.1092 | 45.8038 | |
| (37.2926) | (36.9260) | (36.9141) | (37.7292) | ||
| W*INNO | 5.9224 * * * | -- | -- | -- | |
| (1.3904) | -- | -- | -- | ||
| W*FINA | 0.9467 * * * | -- | -- | -- | |
| (0.3562) | -- | -- | -- | ||
| rho | 0.2100 * * * | 36.9260 * * * | 0.4550 * * * | -- | |
| (0.0754) | (0.0595) | (0.0714) | -- | ||
| Lambda. | -- | -- | 0.2183 * | 0.3549 * * * | |
| -- | -- | (0.1313) | (0.0889) | ||
| Log-likelihood | 31.9518 | 22.5785 | 23.8530 | 12.1935 | |
| Area effect | Control | Controls | Controls | Controls | |
| Time effect | Control | Controls | Controls | Controls | |
| Hausman check | chi2(8) | 19.25 * * | 17.42 * * | -- | 25.76 * * * |
| P value | 0.0136 | 0.0260 | -- | 0.0012 | |
| Model selection | Fixed effects model | Fixed effect model | Fixed effect model | Fixed effect model | |
| LR test | SDM vs. SAR | LR chi2(2) = 18.75*** | |||
| SDM vs. SAC | LR chi2(1) = 16.20*** | ||||
| SDM to SEM | LR chi2(2) = 39.52*** | ||||
Note: Standard deviation in parentheses; ***, **, and * are significant at the significance level of 1%, 5%, and 10%, respectively.
Table 7.
Decomposition of spatial effects based on spatial Durbin model.
| Variables | Direct effects | Indirect effects | Total effect |
|---|---|---|---|
| INNO | 4.0825 * * * | 8.2264 * * * | 12.3089 * * * |
| (0.7316) | (1.3325) | (1.6111) | |
| FINA | 0.1543 | 1.2013 * * * | 1.3556 * * * |
| (0.1456) | (0.4504) | (0.5215) | |
| GOV | 3.4446 * * * | 0.8560 * * | 4.3006 * * * |
| (0.7612) | (0.3917) | (0.9495) | |
| INV | 0.4927 * * * | 0.1238 * | 0.6165 * * * |
| (0.1538) | (0.0665) | (0.1969) | |
| URB | 2.3912 | 0.6086 | 2.9998 |
| (1.7384) | (0.5535) | (2.2019) | |
| LAB | 5.8545 * * * | 1.4890 * | 7.3435 * * * |
| (1.7726) | (0.8093) | (2.3303) | |
| TRAD | 1.9959 * * * | 0.5073 * * | 2.5032 * * * |
| (0.3240) | (0.2388) | (0.4650) | |
| FRU | 19.9701 | 4.6665 | 24.6366 |
| (36.3143) | (9.8359) | (45.3201) |
Note: Standard deviation in brackets; ***, **, and * are significant at the significance level of 1%, 5%, and 10%, respectively.
Disclaimer/Publisher’s Note: The statements, opinions and data contained in all publications are solely those of the individual author(s) and contributor(s) and not of MDPI and/or the editor(s). MDPI and/or the editor(s) disclaim responsibility for any injury to people or property resulting from any ideas, methods, instructions or products referred to in the content. |
© 2023 by the authors. Licensee MDPI, Basel, Switzerland. This article is an open access article distributed under the terms and conditions of the Creative Commons Attribution (CC BY) license (http://creativecommons.org/licenses/by/4.0/).
Copyright: This open access article is published under a Creative Commons CC BY 4.0 license, which permit the free download, distribution, and reuse, provided that the author and preprint are cited in any reuse.


