Submitted:
06 June 2025
Posted:
09 June 2025
You are already at the latest version
Abstract
The important goals of SDGs include eliminating hunger, achieving food security, improving nutrition and promoting sustainable agriculture. Focusing on the arable land issue can help address not only the relationship between humans and land but also the relationship between humans and nature in the Anthropocene. As a country with a large population in the world, the per capita cultivated land in China is lower than the global level, the quality of cultivated land is uneven, and the reserve resources are inadequate. The changes in arable land in Henan Province have attracted much attention as a major grain-producing area in China. Since changes in arable land are affected by multiple factors, it is difficult to find scientific answers for comprehensive problems based on the analysis of the net benefit of a single factor. Based on the analysis of the characteristics of the spatial evolution of arable land, the improvement of the analysis system of driving factors will help to understand the change of arable land scientifically. By comprehensively analysis the multifactorial characteristics of arable land change drivers, such as industrialization, urbanization and policies, and analyzing the remote sensing data and GIS data via the Geodetector analysis method, it is of great significance to conduct research on the spatial and temporal characteristics of arable land and its driving factors in Henan Province, China. A case study was conducted in Henan Province from 2000 to 2020 based on remote sensing images and GIS Geodetector technology to analyse the spatial evolution of cultivated land and explore the influencing factors driving the declining trend of cultivated land area. The results revealed that: 1) the arable land gradually decreased from 108,263.39km² in 2000 to 106,389.63km² in 2010 and 103,469.81km² in 2020, with a significant increase shown in the construction land; 2) the main factors affecting changes in arable land include total population, GDP, urbanisation rate, etc. In China's main grain-producing region, Henan Province, industrialisation and urbanisation processes are the main driving factors for the reduction of arable land. Presently, enhancing the efficiency of industrialisation and strengthening the intensive management of land in the process of urbanisation is an important way to resolve the contradictions in human-land relations and to strengthen the management of land resources.
Keywords:
Henan Province
; arable land
; spatial pattern evolution
; GIS technology
; Geodetector
1. Introduction
Arable land protection is meaningful for sustainable development. As the fundamental part of grain production, arable land provides a basic source of food for humankind [1], which helps address the hunger problem facing sustainable development globally. To meet the goal of sustainable development, a stable food supply is a prerequisite. By ensuring the quantity and quality of arable land can the demand for food from a growing population be met. Arable land is the foundation of economic development [2], especially as the crucial natural resource base of agriculture, which supports the development of related industrial chains, provides employment opportunities and sources of income for farmers, and promotes the prosperity of the rural economy, which in turn promotes the sustainable development of society as a whole. Besides, arable land also has an ecological regulating function [3]; it can purify air and water quality through the adsorption and filtration of soil, and at the same time, as an important part of the ecosystem, it provides a habitat for many plants and animals and maintains biodiversity.
In developing countries, the rapid economic and social development and the acceleration of urbanization have led to significant changes in the pattern of land use, especially the reduction of arable land area, which has become an outstanding problem that needs to be solved urgently in order to guard the red line of arable land protection. Arable land is very important for China to guarantee the solution of the problem of hunger for sustainable development [4], it is not only the natural resource condition for grain production but also the foundation for guaranteeing the food supply of China’s one billion people [5]. Self-sufficiency in grain production is currently the top priority of China’s food security policy, and protecting the “red line of arable land” is the basis for guaranteeing food security [6,7]. In 2020, the General Office of the State Council of China issued “The Opinions on Preventing the ‘Degradation’ of Arable Land and Stabilizing Food Production” [8], and in 2023, the Central Government’s Document No. 1 pointed out that it is necessary to strengthen the protection of arable land and the usage control of arable land. As an important agricultural province in China, changes in the area and utilization of arable land in Henan Province are of great significance to national food security and the ecological environment.
2. Literature Review
Arable land is an important resource for human survival and development. Its spatial and temporal changes not only affect food security and the ecological environment but are also closely related to socio-economic development [9], which is an important influence on global sustainable development and an essential basis for addressing the goal of sustainable development and hunger. Accurately understanding the spatial and temporal characteristics and patterns of arable land changes is of great theoretical and practical significance for rationally formulating land use policies, optimizing the layout of agricultural production, guaranteeing food security and promoting sustainable development.
Remote sensing image interpretation has been used to obtain information on the spatial distribution and change of arable land, and GIS technology has been used to carry out spatial analysis, data processing and visualization expression [10], obtain the basic data and carry out spatial metrological analyses, for example, to monitor the spatial distribution and dynamic change of the arable land in the Yellow-Huai-Haihai Plain. The center of gravity analysis, spatial statistical analysis and other methods have been applied to quantitatively study the statistical characteristics of spatial and temporal changes in arable land. By analyzing the spatial and temporal characteristics of China’s arable land utilization change from 1980 to 2020, it is found that China’s arable land generally presents the spatial distribution characteristics of decreasing in the south and increasing in the north, decreasing in the east and increasing in the west and that the center of arable land transferring in and out of the country is generally moving towards the south-west. By structuring relevant models [11], such as the arable land pressure index model, the effects of arable land changes on grain production and other aspects are simulated and studied.
In recent years, the global arable land area has grown slowly and has entered a relatively stable state [12]. The spatial distribution of global grain production is uneven, with high-yield grain regions moving northwestward and grain production in the east-west direction being more concentrated than in the north-south direction. The spatial consistency of the global distribution of arable land and grain production is not high, and it shows a negative dislocation feature. Most countries are in the stage of inefficient use of arable land. Recently, the arable land area in China shows a trend of “decrease in the south and increase in the north”, it also shows an overall decreasing trend.
Natural factors have a significant impact on the long-cycle changes of arable land [13]. Climate change, topography, geomorphology, soil conditions, water resource conditions [14] and elevation [15] have a fundamental impact on the evolution of arable land functions, and climate change affects the cultivation structure and productivity of arable land, and natural disasters also have a direct impact on the functions of arable land. The process of urbanization and industrialization is the economic and social factor that affects the recent changes in cultivated land [16]. The transfer of a large number of rural labourers has led to the abandonment and rough management of rural arable land. The development of the market economy has oriented agricultural production towards market demand, the planting structure has changed, and technological progress has promoted the diversified development of arable land functions. Amani [17] stated that the arable land change in Tanzania is caused by the combined effects of GDP, the number of exported goods, annual population growth and the amount of cultivated land per capita, and the arable land area is affected by demographic and socio-economic factors. In China, urban construction and agricultural industrial structure adjustment have led to a large reduction in arable land [18]. The reduction of arable land area is mainly driven by natural factors such as altitude and slope, and socio-economic factors like GDP, population, and social fixed asset investment [19]. The socio-economic factors are the main drivers of the reduction of arable land. The research on the arable land changes in the Yellow River Basin [20] shows that the average annual arable land reduction in the Yellow River Basin was 69.53 hm2 from 2000 to 2020. The reduction of arable land is mainly caused by the policy of returning arable land back to its original state of forests and grassland [21], with 2004 and 2020 being the peak years for returning. As a spatial statistical method, a geographic detector can effectively reveal the impact of multiple factors on spatial distribution patterns and their interactions [22]. In addition, the policies related to land property rights, agricultural subsidies, etc. have a profound impact on the use and functions of arable land.
Based on the data on land use and economic and social development of Henan Province from 2000 to 2020, the characteristics and driving factors of spatiotemporal changes can be identified by adopting remote sensing and the geographic detector method; the temporal and spatial changes in cultivated land in developing countries can be explored, and the driving factors of the changes can be understood, which provide a scientific basis for the rational allocation and management of land resources.
3. Materials and Methods
3.1. Study Area
Henan Province is located in east-central China, with geographic coordinates roughly between 31°23′and 36°22′north latitude and 110°21′and 116°39′east longitude. With Anhui and Shandong in the east, Hubei in the south, Shaanxi in the west, and Hebei in the north, Henan Province covers a total area of about 167,000 km2. The landscape in Henan is diverse, mainly consisting of plains, hills, mountains and basins, with the middle and lower plains of the Yellow River being the main farming areas. With the Yellow River, Huaihe River and Shahe River in Henan province, the water resources are abundant. The climate is a temperate monsoon climate with four distinct seasons, and the average annual precipitation is about 600–1200 mm [23].
As an important agricultural province in China, Henan Province has a vast area of arable land with excellent conditions for agricultural production. The arable land area was about 108,263.39 km2 in 2000 and about 103,469.8 km2 in 2020. With the development of the economy and society, the construction land has increased year by year, and the arable land area has decreased, but overall, the scale of agricultural production has remained large. The area of forest land and grassland has also increased, indicating that the ecological restoration and land protection policies have begun to show results. With a large population, Henan Province is one of the most populous provinces in China. There were over 93 million people in 2000, and nearly 100 million people in 2020 [24]. In terms of economic development, Henan Province has gradually changed from an agricultural-based economic structure to one that places equal emphasis on industry and services [25]. The accelerated process of industrialization and urbanization has increased the demand for land resources, especially arable land, resulting in certain conflicts and contradictions in land use.
3.2. Data Collection
The data used in this paper are the land usage data and the socio-economic development data of Henan Province in 2000, 2010, and 2020. The land usage data are based on the Environment Database from the Chinese Academy of Sciences (CAS) [26], by taking the Landsat remote sensing image data of the United States as the main information source, the national 1:10 scale multi-period land use/cover remote sensing monitoring database (CNLUCC) is established through manual visual interpretation. China’s multi-period land use/cover remote sensing monitoring database includes 10 periods, namely the late 1970s (1980), the late 1980s (1990), 1995, 2000, 2005, 2010, 2013, 2015, 2018, and 2020. The remote sensing interpretation of the data in 1990, 1995, 2000, 2005, 2010, and 2013 mainly used Landsat-TM/ETM remote sensing image data, while the land use/cover data update in 2015, 2018, and 2020 mainly used Landsat 8 remote sensing image data [27]. The elevation data are from NASA [28] and Henan’s elevation is 30m.
3.3. Research Methodology
3.3.1. Land-use Type Transfer Matrix
The land use type transfer matrix can better express the evolution direction and degree of different land use types in a certain period in the study area by calculating the transfer direction and quantity between different land use types, that is, describing the source and direction of changes between different land types, thus revealing the process of spatiotemporal evolution of land use [29,30,31], see Equation (1):
where is the total area of the study area; is the number of types of land use; are the land use types at the beginning and end of the study period, respectively [32].
3.3.2. Geodetector
The GeoDetector model is a statistical method for detecting spatial variation and revealing the drivers behind it [33]. It is widely used in fields such as ecological environment, geographic remote sensing, and urban planning to identify influencing factors and analyze driving mechanisms [34]. The spatial evolution of cropland and its driving factors in Henan Province were analyzed using a Geodetector, aiming to find the driving role of each factor in the change of cropland area. In order to ensure the effective operation of the GeoDetector model, numerical variables were converted to discrete variables using the K-mean clustering method of SPSS [35]. See Equation (2):
where is the different type of , ; is the number of units of the overall layer; is variance of the overall layer; is the explanatory power of spatial separation of for , and it ranges from 0 to -1. When the value is 0, it indicates that factor has no explanatory power on the spatial differentiation pattern of , which means that factor has no relationship with attribute ; while a value of 1 means that factor completely explains the spatial differentiation of attribute . The larger the value, the stronger the explanation of factor for the spatial differentiation of attribute .
3.3.2. Degree of Land-use Dynamics
Land use dynamics is an indicator of the change of land use types within a certain period. The greater the dynamics, the faster the change rate of land types within this period. The smaller the dynamics, the faster the change rate of land types within this period [36,37]. See Equation 3:
where is the degree of land-use dynamics; is the initial land use type in the study area; is the area of the land use type at the end of the study area; is a designated period for the study.
4. Results
4.1. Analysis on Spatial and Distribution Characteristics of Arable Land in Henan Province
As shown in Figure 1, the arable land area in Henan Province shows a decreasing trend from 2000 to 2020. The construction land area was 17,307.78 km2 in 2000, 19,234.39 km2 in 2010, and 21,882.15 km2 in 2020, with an increase of 11.13% (1926.61 km2) from 2000 to 2010 and 13.77% (2647.76 km2) from 2010 to 2020. Accelerated urbanization is one of the main reasons for the reduction of arable land area, with the increasing level of urbanization in Henan Province, more and more farmland is being converted to urban construction land. Especially in large cities in the central north of Henan Province, such as Zhengzhou and Luoyang, urban expansion and infrastructure construction have taken up a large amount of arable land. The land in these areas is used to build residential buildings, commercial centers, transportation networks, etc., resulting in a reduction in arable land area. Rapid industrialization is also an essential factor contributing to the reduction in the area of arable land. As an important industrial base in China, Henan Province has seen an increase in the construction of industrial parks and factories in recent years, which not only directly occupies arable land but also indirectly affects the quality and quantity of arable land through environmental pollution and land degradation. Especially in some areas where resource exploitation and heavy industry are developed, such as Jiaozuo City in Henan Province in the north of Henan Province, which is one of the important coal production bases in China with rich coal resources, as well as an important coking industry base and heavy industry city in China. This has led to particularly serious problems of degradation and loss of arable land.
The area of ecological land in Henan Province increased from 2000 to 2020. In 2000, the forest area in Henan Province was about 26,961.15 km2, the grassland area was 9463.28 km2, and the water area was about 3580.56 km2. By 2010, the area of forest land was about 27,132.14 km2, the area of grassland was 8870.9 km2, and the area of water was about 4020 km2. During the ten years, the forest area increased by 170.99 km2, the grassland area decreased by 592.48 km2, and the water area increased by 439.45 km2. Policy factors also play an important role in the change of arable land area. In order to promote economic development, China and its local governments have formulated and implemented many land use policies and plans to promote land transfer and achieve intensive land management. These policies have promoted the rational allocation of land resources to a certain extent but have also led to a reduction in arable land in some areas. In addition, the implementation of ecological and environmental protection policies, such as the policy of returning farmland to forest and grassland, which was first proposed in 1999, has also transformed some marginal farmland into ecological land. Henan Province has carried out large-scale ecological engineering construction in some areas where farmland has been returned to forests, including natural protection projects, water conservation forest construction, and windbreak and sand fixation forest construction. These projects aim to improve the ecological environment of the region, enhance soil and water conservation capacity, and promote sustainable development of the local economy through afforestation and grassland construction. Agricultural structural adjustment is also an important factor affecting the change in cultivated land area. With the advancement of agricultural modernization, the agricultural structure of Henan Province has changed significantly. Some traditional grain crop planting areas have shifted to the production of cash crops and high-value-added agricultural products, resulting in part of the arable land being used for other agricultural purposes.
In summary, the arable land area of Henan Province shows a general trend of decrease from 2000 to 2020.
4.2. Analysis on the Evolution of Arable land Spatial Pattern in Henan Province
Based on China’s land classification standards [38], and according to the land use data in 2000, 2010 and 2022, the land transfer matrix of Henan Province from 2000 to 2020 is obtained (Table 1). As shown in Table 2, most land types in Henan Province have been interconverted from 2000 to 2020, with a total area of transferred land of 5071.45 km2. The arable land area decreased from 65.35% in 2000 to 62.46%, the grassland area decreased from 5.71% in 2000 to 5.39%, the area of arable land and grassland accounting for about 11.68% of the total transferred area; forest land, water area and construction land showed an upward trend, increasing from 16.27% to 16.33%, 2.16% to 2.6%, and 10.45% to 13.21% respectively; the change of unused land was relatively stable.

Table 1.
Land-use classification in Henan Province based on China’s land classification standards [38].
Table 1.
Land-use classification in Henan Province based on China’s land classification standards [38].
| First Category | Second Category |
|---|---|
| Arable land | Paddy field, dry land |
| Woodland | Woodland, shrub land, and other woodland |
| Grassland | High coverage grassland, medium coverage grassland, low coverage grassland |
| Water | Rivers, lakes, reservoirs, ponds, tidal flats, wetlands |
| Construction land | Urban land, rural settlement land, other construction land |
| Unused land | Barren, other unused land |
Table 2.
Land transfer matrix of Henan Province from 2000 to 2010.
| 2000 | 2010 | ||||||
|---|---|---|---|---|---|---|---|
| Arable land | Woodland | Grassland | Water | Construction land | Unused land | Total(km2) | |
| Arable land | 100,927.67 | 971.84 | 294.27 | 747.10 | 5321.79 | 0.72 | 108,263.39 |
| Woodland | 678.77 | 25,947.47 | 85.29 | 63.74 | 183.81 | 2.08 | 26,961.15 |
| Grassland | 594.54 | 137.48 | 8457.17 | 65.79 | 204.52 | 3.78 | 9463.28 |
| Water | 407.29 | 28.03 | 15.06 | 3065.37 | 63.45 | 1.35 | 3580.56 |
| Construction land | 3742.29 | 29.36 | 17.17 | 61.15 | 13,457.80 | 0.00 | 17,307.78 |
| Unused land | 37.73 | 17.19 | 1.51 | 16.79 | 2.88 | 11.04 | 87.14 |
| Total(km2) | 106,388.29 | 27,131.38 | 8870.46 | 4019.94 | 19,234.25 | 18.98 | 165,663.30 |
Table 3.
Land transfer matrix of Henan Province from 2010 to 2020.
| 2000 | 2020 | ||||||
|---|---|---|---|---|---|---|---|
| Arable land | Woodland | Grassland | Water | Construction land | Unused land | Total(km2) | |
| Arable land | 101,366.67 | 672.21 | 247.17 | 435.84 | 3666.29 | 1.13 | 106,389.32 |
| Woodland | 557.39 | 26,114.99 | 343.21 | 56.23 | 51.99 | 8.24 | 27,132.05 |
| Grassland | 243.04 | 221.40 | 8314.99 | 41.31 | 49.35 | 0.66 | 8870.75 |
| Water | 195.82 | 18.97 | 13.80 | 3750.64 | 40.38 | 0.32 | 4019.95 |
| Construction land | 1102.89 | 19.91 | 13.50 | 22.90 | 18,074.11 | 1.07 | 19,234.37 |
| Unused land | 4.01 | 2.27 | 0.21 | 0.75 | 0.03 | 11.71 | 18.98 |
| Total(km2) | 103,469.81 | 27,049.76 | 8932.88 | 4307.67 | 21,882.15 | 23.13 | 165,665.41 |
A Sankey map is present to better present land changes [39] (Figure 2), it can be seen that the arable land area in Henan Province decreased significantly from 2000 to 2010, with the land mainly converted to construction land, forest land, water, grassland and unused land. The area of construction land increased the most, accounting for about 37.9% of the total converted land, which mainly originated from arable land, therefore, construction land excessively encroached on arable land. The area increase of forest land and water mainly converted from arable land, accounting for 3.4% and 8.67% of the total converted area respectively. In terms of the land-use changes from 2010 to 2020, the arable land area decreased further, mainly converting to construction land, grassland, water area, and forest land, with the greatest conversion to construction land.
4.3. Analysis of Driving Factors of Spatial Pattern Evolution of Arable Land Based on Geodetector
The factors affecting changes in land use structure include natural factors, such as soil, hydrology, topography, climate, etc. and socio-economic factors, like population, economy, urbanization and government planning [40,41,42,43]. However, it is difficult to reflect the adjustment of land use changes in Henan Province due to changes in natural factors in a short period of time. This paper mainly analyzes the driving effect of socio-economic factors such as population, economy and urbanization on changes in arable land in Henan Province from 2000 to 2020. Two indicators of total population and population density under the natural environmental dimension and six indicators of GDP, number of industrial enterprises, proportion of secondary industry in regional GDP, proportion of tertiary industry in regional GDP, total fixed asset investment, and urbanization rate under socioeconomic dimension are selected as driving factors (see Table 4) to detect the driving factors of arable land changes in Henan Province and the interactive relationship between the factors. The effect of each indicator on the change of arable land in Henan Province is shown in Table 5. Figure 3 shows the degree of interaction between driver factors.
As shown in Figure 3, the top five indicators with a high degree of influence are population density (X2), urbanization rate (X8), GDP (X3), number of industrial enterprises (X6), and the proportion of tertiary industry in regional GDP (X5), which are showing in order. This indicates that the arable land changes in Henan Province are mainly affected by population density, urbanization rate, GDP etc. The reason for this is the increasing demand for construction land due to the rise of the secondary and tertiary industries and the accelerated population urbanization caused by industrialization, urbanization, population growth, economic development and improving infrastructure. Over the past 20 years, economic development has increased people’s income as well as accelerated infrastructure construction, and the construction of residential buildings, hospitals, shopping malls and shops has occupied a large amount of agricultural land. With the continuous development of the economy, the continuous growth of population and the gradual improvement of urbanization level, the relationship between people and land will inevitably face many contradictions. Therefore, as people’s demands for clothing, food, housing and transportation continue to increase, the expansion of construction land and the reduction of arable land are reasonable. Therefore, as people’s demands for clothing, food, housing and transportation continue to increase, the expansion of construction land and the reduction of arable land are reasonable.
Through interactive detection, the impact of the combined effects of various indicators on land use change can be compared and the difference between the effects of a single indicator can be recognized [32]. Therefore, by applying the Geodetector model, this paper interactively analyses the eight driving indicators/factors that affect the change of arable land in Henan Province and explores the effects of the combined effect of various indicators/factors. The results show that the q value of the interaction between the two indicators/factors is greater than the q value of any single indicator/factor, and less than the sum of the q values of the single indicator/factors. Population density-GDP, population density-urbanization rate, GDP-urbanization rate, and GDP-number of industrial enterprises show a double-factor/indicator enhancement relationship. In summary, the results of the interactive detection show that the combined effects of population density, GDP, urbanization rate, and other factors have promoted the changes in cultivated land area in Henan Province.
5. Discussion
According to the analysis based on the Geodetector, urbanization and industrialization have played an important role in promoting the reduction of arable land in Henan Province. Specifically, a large amount of arable land has been converted into construction land, reflecting the problem of urban expansion and infrastructure construction occupying arable land when the economy is developing rapidly. This shows that urbanization and local fiscal investment are the main factors affecting the change of arable land, which is consistent with the actual situation—with the increase of urban population and the expansion of the urban economy, the demand for construction land has increased significantly, resulting in a reduction in arable land area.
Ecological protection and agricultural structural adjustment have promoted the increase of the area of woodland and water. The policies of “returning arable land to woodland” and “returning arable land to wetlands” implemented by Henan Province between 2000 and 2020 have effectively promoted the growth of the area of woodland and water. Ecological restoration projects (such as returning farmland to woodland and wetlands) directly occupy part of the arable land, especially sloping arable land, low-yield fields and farmland in ecologically fragile areas, which shows the positive impact of policy orientation on land use change. By strengthening ecological protection and rationally using water resources, intensive use of land resources can be achieved.
Population density and economic development level have a dual effect on land use change. On the one hand, the high degree of land use in areas with high population density may lead to a reduction in cultivated land area; on the other hand, the demand for construction land in areas with high economic development levels is large, which further promotes the conversion of cultivated land to construction land, reflecting the complexity of population and economic factors in land use change. Therefore, balancing the contradiction between population growth and arable land protection is an urgent problem that needs to be solved in the future. This paper believes that 1) a reverse linkage mechanism of “population density-cultivated land protection” will help if the population density exceeds a certain threshold, it is prohibited from converting new construction land; 2) the “GDP- land” assessment mechanism will help by requiring the units’ GDP land consumption to show an average annual downward trend.
To make sure the arable land does not decrease further, the expansion of construction land can be strictly controlled, the most stringent arable land protection system can be implemented, and a reverse linkage mechanism of “population density-farmland protection” can be set. Optimize the coordinated degree between the growth rate of the number of industrial enterprises, fixed asset investment and GDP to promote the concentration of industrial land; utilizing the interaction of the proportion of the tertiary industry and the number of industrial enterprises to comprehensively prosper economic and social development; scientifically plan the layout of land use to improve land use efficiency, and to promote the intensive use of construction land; adjusting agricultural structural for the development of ecological agriculture to promote the modernization and intensification of agricultural production and reduce dependence on arable land. To achieve the coordinated development of the economy, society and the ecological environment, the protection of the ecological environment and the development of the economy should be promoted at the same time. The land use changes in Henan Province from 2000 to 2020 reflect the complex relationship between economic and social development and ecological and environmental protection. In the future, with scientific planning, policy guidance and technical support, the land use structure can be further optimized, and sustainable development can be further promoted.
6. Conclusions
From 2000 to 2020, arable land has been the main land use type in Henan Province, accounting for 65.35%. The area of arable land and construction land has changed the most, with a decrease of 4693.58 km2 in arable land and an increase of 4574.37 km2 in construction land over the past 20 years. It can be seen from Figure 2 that construction land has occupied most of the arable land, followed by woodland and grassland. Since 2000, although a lot of attention has paid to land use, farmland protection and farmland returning, for example, the implementation of the “Basic Farmland Protection Regulations” and the “Land Reclamation Regulations”, which aimed at ensuring food security, controlling farmland loss, and promoting land reclamation and ecological restoration; the active response to the national policy of returning farmland to woodland and grasslands by implementing large-scale afforestation and grassland restoration projects, the great pressure still brought to arable land protection due to the rapid economic and social development of Henan Province between 2000 and 2020, with rapid growth in GDP and urban population, and strong demand for construction land.
Population density, GDP, and urbanization rate are the main driving factors for the change of arable land area in Henan Province. The interaction between factors better explains the change of arable land area in Henan Province, the interaction between population, economy and urbanization is an important representation of economic and social development and is also the main factor driving the change of cultivated land. Population density (X2) pushes up land demand, urbanization (X8) accelerates land development, and GDP (X3) relies on the expansion of construction land, forming a vicious cycle of “using land to support people, using land to promote cities, and using land to seek growth”, for instance, the Zhengzhou and Luoyang business districts. The coordinate chain between investment, industry and land shows that the fixed asset investment (X7) is concentrated in industrial parks (X6), and GDP growth (X3) depends on the expansion of industrial land, resulting in “rigid occupation” of arable land. The invisible pressure of “industrial structure transformation” and the increase in the proportion of the tertiary industry (X5) seem to reduce the demand for industrial land, but the service industry carriers (logistics parks, data centers) still need to occupy arable land, and the number of industrial enterprises (X6) has not decreased simultaneously, forming a situation of “double-track squeeze”.
By analyzing the spatial evolution and driving factors of arable land in Henan Province from 2000 to 2020, it can not only provide guidance for scientific and rational land resource management but also provide useful guidance for land use planning and policy formulation in other areas of China. Besides, the analysis of the changing trends and driving factors of arable land in Henan Province during the study period is helpful in understanding the relationship between economic development, population growth and land resource protection, and provides theoretical support and practical guidance for achieving sustainable development goals. Therefore, we must pay attention to the coordination of natural environmental conditions and socio-economic conditions, rationally formulate a planning and management plan suitable for Henan Province, in order to reduce damage to arable land, stick to the “red line” of arable land area, fully play the strategic position of Henan Province and achieve the sustainable development goals.
Author Contributions
Conceptualization, J.T. and J.L.; methodology, J.T.; software, J.L.; validation, L.H. and J.L.; formal analysis, M.Y.; investigation, C.W. and Y.Z.; resources, J.L. and H.Z.; data curation, J.L. and H.Z.; writing—original draft preparation, J.L.; writing—review and editing, L.H.; visualization, J.L.; supervision, J.T.; project administration, J.T.; funding acquisition, L.H. All authors have read and agreed to the published version of the manuscript.
Funding
This research was funded by National Social Science Fund Project “Innovation and Path Research on the Value realization Mechanism of Ecological Products through Multi subject Collaboration” grant number “22BJY107’’, and Philosophy and Social Sciences fund of Henan Province “Research on Innovation and Implementation Path of Collaborative Mechanism of Elements for Urban Rural Integration Developmen” grant number “2024BJJ033’’.
Data Availability Statement
The original contributions presented in the study are included in the article, further inquiries can be directed to the corresponding author.
Conflicts of Interest
The authors declare no conflicts of interest.
Abbreviations
The following abbreviations are used in this manuscript:
| CAS | Chinese Academy of Sciences |
| CNLUCC | China Land Use and Cover Change |
| GDP | Gross Domestic Product |
| GIS | Geographic Information System |
| Landsat-TM/ETM | Landsat-Thematic Mapper/Enhanced Thematic Mapper Plus |
| NASA | National Aeronautics and Space Administration |
| SDGs | Sustainable Development Goals |
References
- Buringh, P. Availability of Agricultural Land for Crop. Food and natural resources. 1989, 69. [Google Scholar]
- Yin, G.; Liu, L.; Jiang, X. The sustainable arable land use pattern under the tradeoff of agricultural production, economic development, and ecological protection—an analysis of Dongting Lake basin, China. Environmental Science and Pollution Res. 2017, 11, 45. [Google Scholar] [CrossRef] [PubMed]
- Zhang, H.Q.; Xu, E.Q.; Zhu, H.Y. Ecological-living-productive land classification system in China. Journal of Resources and Ecology. 2017, 8, 1–8. [Google Scholar]
- Li, D.L.; Li, C.D.; Cai, L.H. Food security issues in the Middle East and Africa under the Russian-Ukrainian conflict: characteristics, impacts and governance paths. Journal of China Agricultural University 2022, 27, 15–27. [Google Scholar]
- Li, J.F.; Fang, A.M.; Wu, K.N. Analysis on spatial heterogeneity characteristics and driving factors of “non-granitization” of cultivated land in Henan Province. China’s agricultural resources and regional planning 2024, 1–14. [Google Scholar]
- Zhang, L.G.; Chen, S. Spatiotemporal evolution of per capita grain possession in China and its driving factors. Economic Geography 2015, 35, 171–177. [Google Scholar]
- Jiang, M.; Li, X.B.; Xin, L.J. Impact of changes in the rice multiple cropping index in southern China on national grain production capacity and its policy implications. Journal of geography 2019, 79, 32–43. [Google Scholar]
- Central People’s Government of the People’s Republic of China. Opinions of the General Office of the State Council on preventing the use of cultivated land for non-grain purposes and stabilizing grain production,; China Standards Press, Beijing, China, 2020.
- Wang, J.; He, T.; Lin, Y. Changes in ecological, agricultural, and urban land space in 1984–2012 in China: Land policies and regional social-economical drivers. Habitat International. 2018, 71, 1–3. [Google Scholar] [CrossRef]
- Lloyd, C. Spatial data analysis: an introduction for GIS users. Oxford university press; Oxford, UK, 2010.
- Su, Y.; Li, T.; Cheng, S.; Wang, X. Spatial distribution exploration and driving factor identification for soil salinization based on Geodetector models in coastal area. Ecological Engineering. 2020, 156, 105961. [Google Scholar] [CrossRef]
- Prăvălie, R.; Patriche, C.; Borrelli, P.; Panagos, P.; Roșca, B.; Dumitraşcu, M.; Nita, I.A.; Săvulescu, I.; Birsan, M.V.; Bandoc, G. Arable lands under the pressure of multiple land degradation processes. A global perspective. Environmental Research. 2021, 194, 110697. [Google Scholar] [CrossRef]
- Charles, E.; Kellogg, A.C. Orvedal,Potentially Arable Soils Of The World And Critical Measures For Their Use. Brady,Advances in Agronomy,Academic Press 1969, 21, 109–170.
- Tao, J.G. Development and utilization of sloping farmland resources and the problem of soil and water loss in my country-Analysis of a series of surveys on soil and water resources. Science and Technology Management Research 2014, 34, 162–165. [Google Scholar]
- Giuliano, B.; Riccardo, M.; Ahmed, M.A.; Mohamed, I. Soil water repellency along elevation gradients: The role of climate, land use and soil chemistry. Geoderma 2024, 443, 116847. [Google Scholar]
- Ma, J.; Quan, B.; Zhou, Z. Analysis of land use change based on the policy of returning farmland to forest and grassland: A case study of Guyuan City. Agricultural disaster research 2023, 13, 262–265. [Google Scholar]
- Amani, M.U.; Harun, T. Driving factors and assessment of changes in the use of arable land in Tanzania. Land Use Policy, 2021, 104, 105359. [Google Scholar]
- Wang, Y.; Yu, Q.; Ren, Q. Spatial differences and driving force mechanisms of cultivated land changes in urban areas in the past decade. Rural Economy and Technology 2023, 34, 33–38. [Google Scholar]
- Li, D.; Zhou, J.; Zhan, D.Q. Analysis on spatiotemporal changes and driving factors of cultivated land in Heilongjiang Province. Geographical Sciences 2021, 41, 1266–1275. [Google Scholar]
- Li, C.S.; Yan, J.M. Study on the relationship between cultivated land change, agricultural production and ecological environment in the Yellow River Basin under the background of ecological land withdrawal. China’s agricultural resources and regional planning 2022, 43, 1–8. [Google Scholar]
- Li, S.D.; Liu, M.C. Development history, current status and future prospects of returning farmland to forest and grassland in China. Journal of Resources and Ecology 2022, 13, 120–128. [Google Scholar]
- Wang, J.F.; Xu, C.D. Geographic detectors: principles and prospects. Journal of Geography 2017, 72, 116–134. [Google Scholar]
- Henan Platform for Common Geospatial Information Service. Available online: https://henan.tianditu.gov.cn/cityCard (accessed on 18-05-2021).
- Henan Province Bureau of Statistics. Available online: https://tjj.henan.gov.cn/2021/05-14/2145057.html (accessed on 14-05-2021).
- Zhang Juan, Wu Xinke Research on the Integrated Development of Agricultural Cultural Heritage Industry in Henan Province [J]. Agricultural Economy 2025, (05), 126–127.
- Xu Xinliang, Liu Jiyuan, Zhang Shuwen, et al. Multi-period land use and land cover remote sensing monitoring data set in China[DS]. Data Registration and Publishing System of Resources and Environmental Sciences Data Center, Chinese Academy of Sciences (http://www. resdc.cn/DOI/DOI.aspx?DOIid=54), 2018. [CrossRef]
- Li, Y.J.; Chen, Y.N.; Zhang, Q.F. Analysis of the variation characteristics of the water level of Bosten Lake and its influencing factors from 1960 to 2018. Arid Zone Research 2021, 38, 48–58. [Google Scholar]
- NASA/METI/AIST/Japan Spacesystems, and U.S./Japan ASTER Science Team. (2020). NASADEM Global Digital Elevation Model (NASADEM-HGT)[Data set]. NASA EOSDIS Land Processes DAAC. Accessed 2024-05-19 from https://doi.org/10.5067/MEaSUREs/NASADEM/NASADEM_HGT.001. [CrossRef]
- Sun, X.L.; Zhao, R.; Zheng, Y., et al. Analysis on spatial distribution characteristics of grassland resource types in Huize County. Journal of Guizhou University 2022, 39, 118–114.
- Qiao, W.F.; Sheng, Y.H.; Fan, B, et al. Mining land use evolution information in highly urbanized regions based on transfer matrix: A case study of Suzhou, Jiangsu Provinc. Geographical Research 2013, 32, 1497–1507.
- Wang, Q.C.; Xi, Y.T.; Liu, X.R.; et al. Study on the spatiotemporal response of ecological service value to land use change: A case study of Xuzhou City. Remote Sensing of Natural Resources 2021, 33, 219–228. [Google Scholar]
- Gao, X.; Liu, Z.W.; Li, C.X.; et al. Study on the transformation of land use function and ecological and environmental effects in Xiongan New Area based on “Three Life Space”. Journal of Ecology 2020, 40, 7113–7122. [Google Scholar]
- Wang, Y.F.; Bai, Q.; Sun, H. Spatial and temporal evolution and drivers of ecological vulnerability in the Fen River Basin from 2000 to 2020. Journal of Zhejiang University (Science Edition) 2023, 50, 607–618. [Google Scholar]
- Fang, Y.H.; Zhao, L.Y.; Do, B.Y.; et al. Abatement effects of green infrastructure on PM2.5 in the built-up areas of urban agglomerations in the middle reaches of the Yangtze River. Journal of Ecology 2024, 44, 117–128. [Google Scholar]
- Liu, H.; Zhu, T.H.; Xin, L. Coupling and driving factors of agricultural modernization and urban-rural integration. Agricultural Modernization Research 2021, 42, 982–995. [Google Scholar]
- Wang, G.; Zhang, F.R. Analysis of spatiotemporal evolution and influencing factors of ecosystem service value in Liaohe Delta in the past 30 years. Environmental Science 2024, 45, 228–238. [Google Scholar]
- Zhu, Y.; Liu, J.F.; Zhang, B.H.; et al. Dynamic changes of land use in the Songhua River Basin: A case study from 2005 to 2020. Agriculture and Technology 2024, 44, 73–76. [Google Scholar]
- Central People’s Government of the People’s Republic of China. Land use status classification: GB/T 21010—2017.; China Standards Press, Beijing, China, 2017.
- Zhu, K.; Liu, N.; Xia, L.; et al. Analysis of land use structure changes and driving forces in Luliang City from 2000 to 2018. Journal of Shanxi Agricultural University (Natural Science Edition), 2024; 1–11. [Google Scholar]
- Yu, X.L.; Guo, H.H.; Li, C.; et al. Analysis of spatiotemporal evolution of land use structure and its driving factors in Chongqing based on information entropy. Journal of Jiangsu Agricultural Sciences, 2019, 47, 261–265. [Google Scholar]
- Bičık, I.; Jeleček, L.; Štěpánek, V. Land-use changes and their social driving forces in Czechia in the 19th and 20th centuries. Land Use Policy, 2001, 18, 65–73. [Google Scholar] [CrossRef]
- Liu, G.X.; Wang, X.J.; Xiang, A.C.; et al. Spatial heterogeneity and driving factors of land use change in the middle and upper reaches of Ganjiang River. Chinese Journal of Applied Ecology, 2021, 32, 2545–2554. [Google Scholar] [PubMed]
- Chen, X.Y.; Zhu, M.Z.; Gong, J.Z. Analysis of land use change and driving factors in Dongguan City. Journal of Guangzhou University (Natural Science Edition), 2023, 22, 32–39. [Google Scholar]
- Henan Provincial Bureau of Statistics, NBS Survey Office in Henan. (2022). Henan Statistical Yearbook 2021 [Data set]. China Statistics Press. Accessed 2024-05-19 from http://tjj.henan.gov.cn/tjfw/tjnj/.
Figure 1.
Land use types in Henan Province from 2000 to 2020.
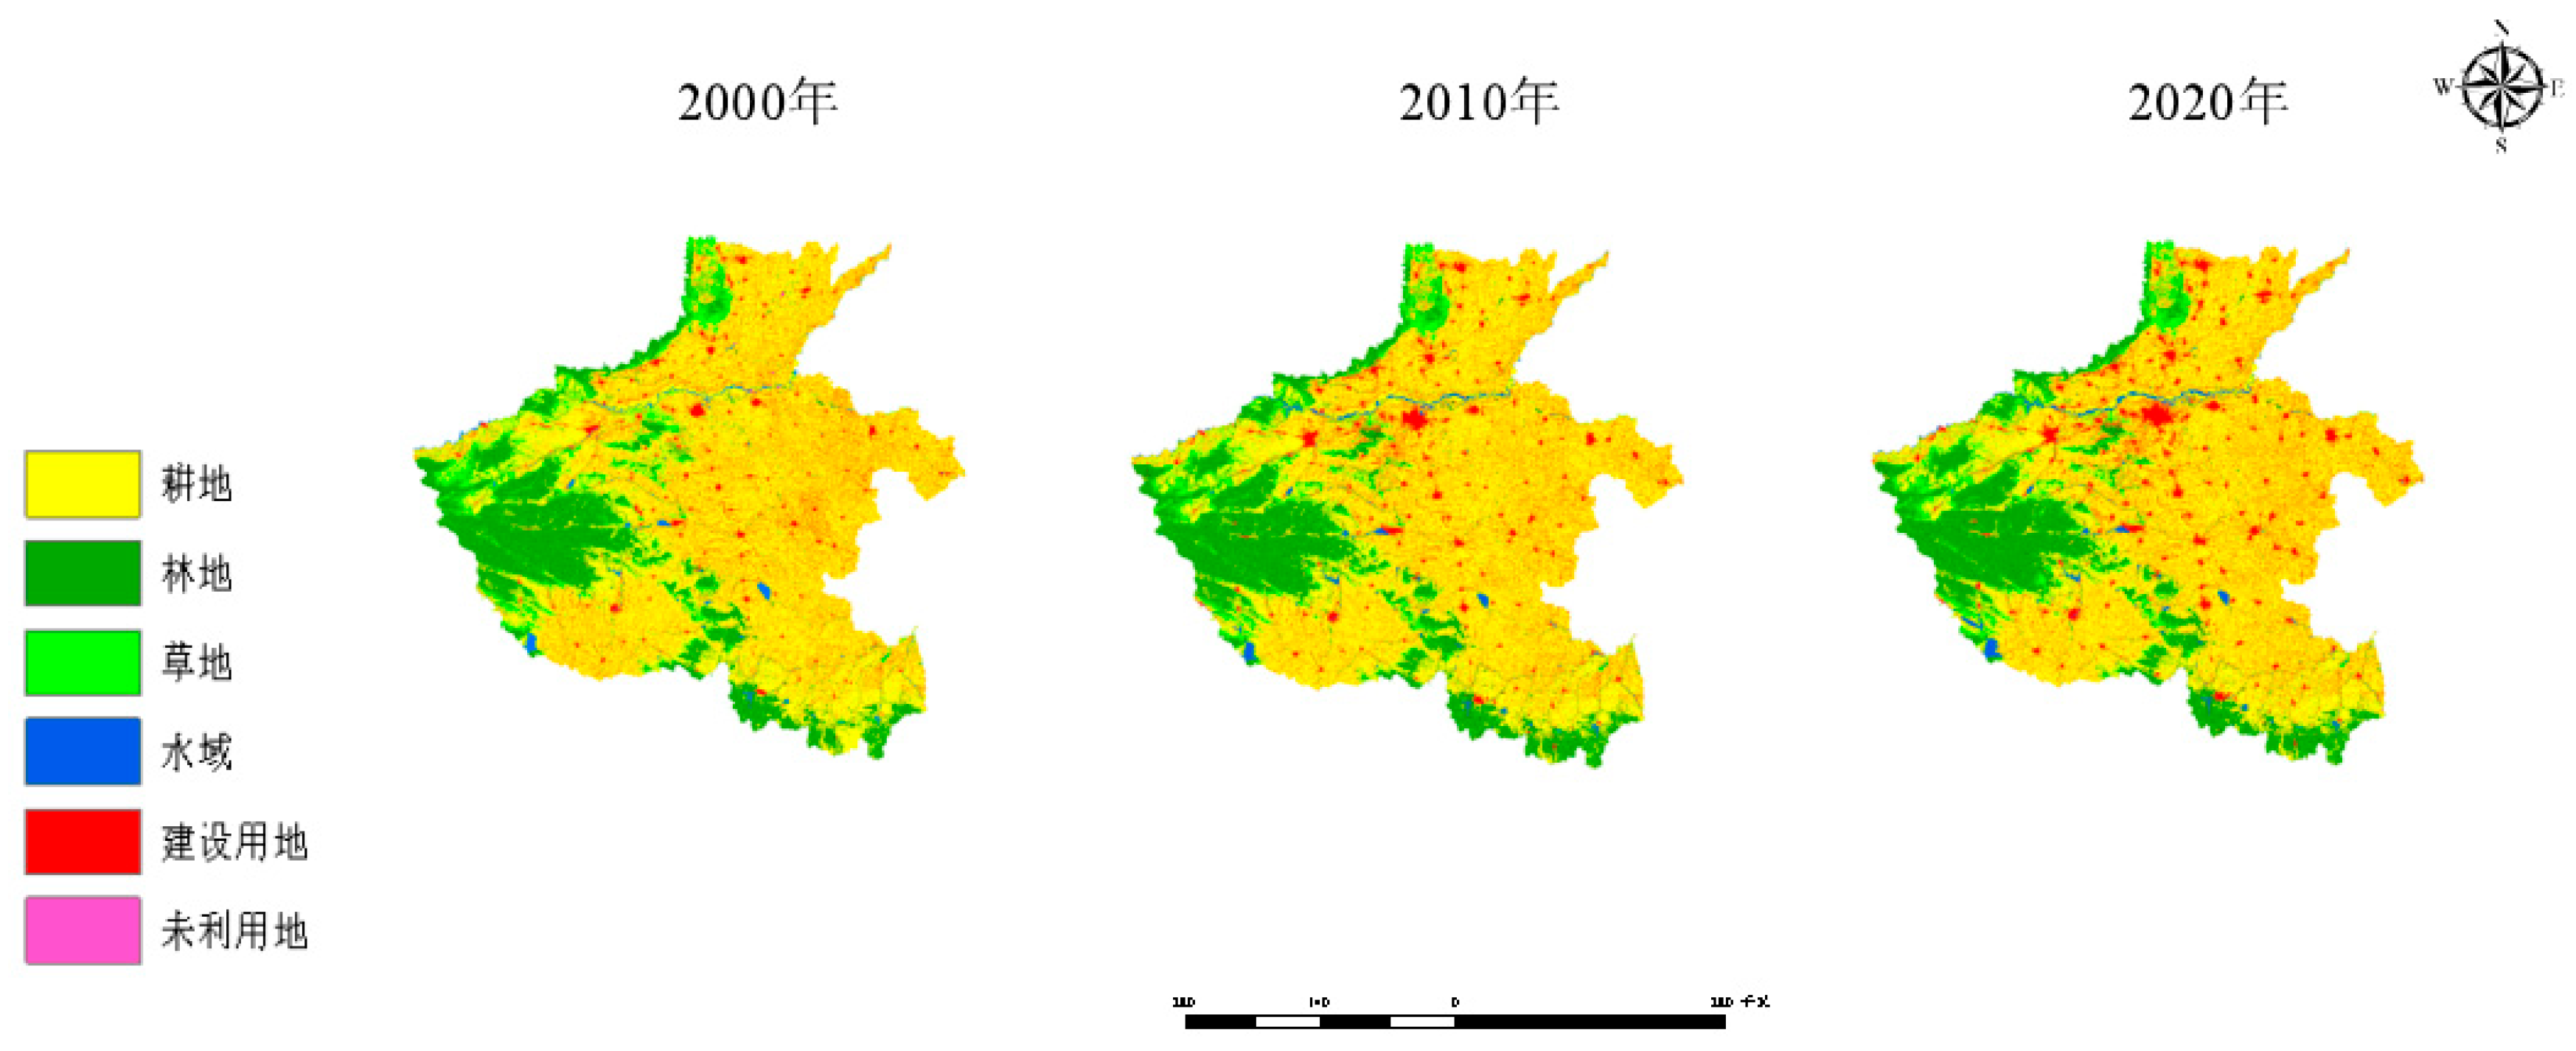
Figure 2.
Sankey map of land change in Henan Province from 2000 to 2020.
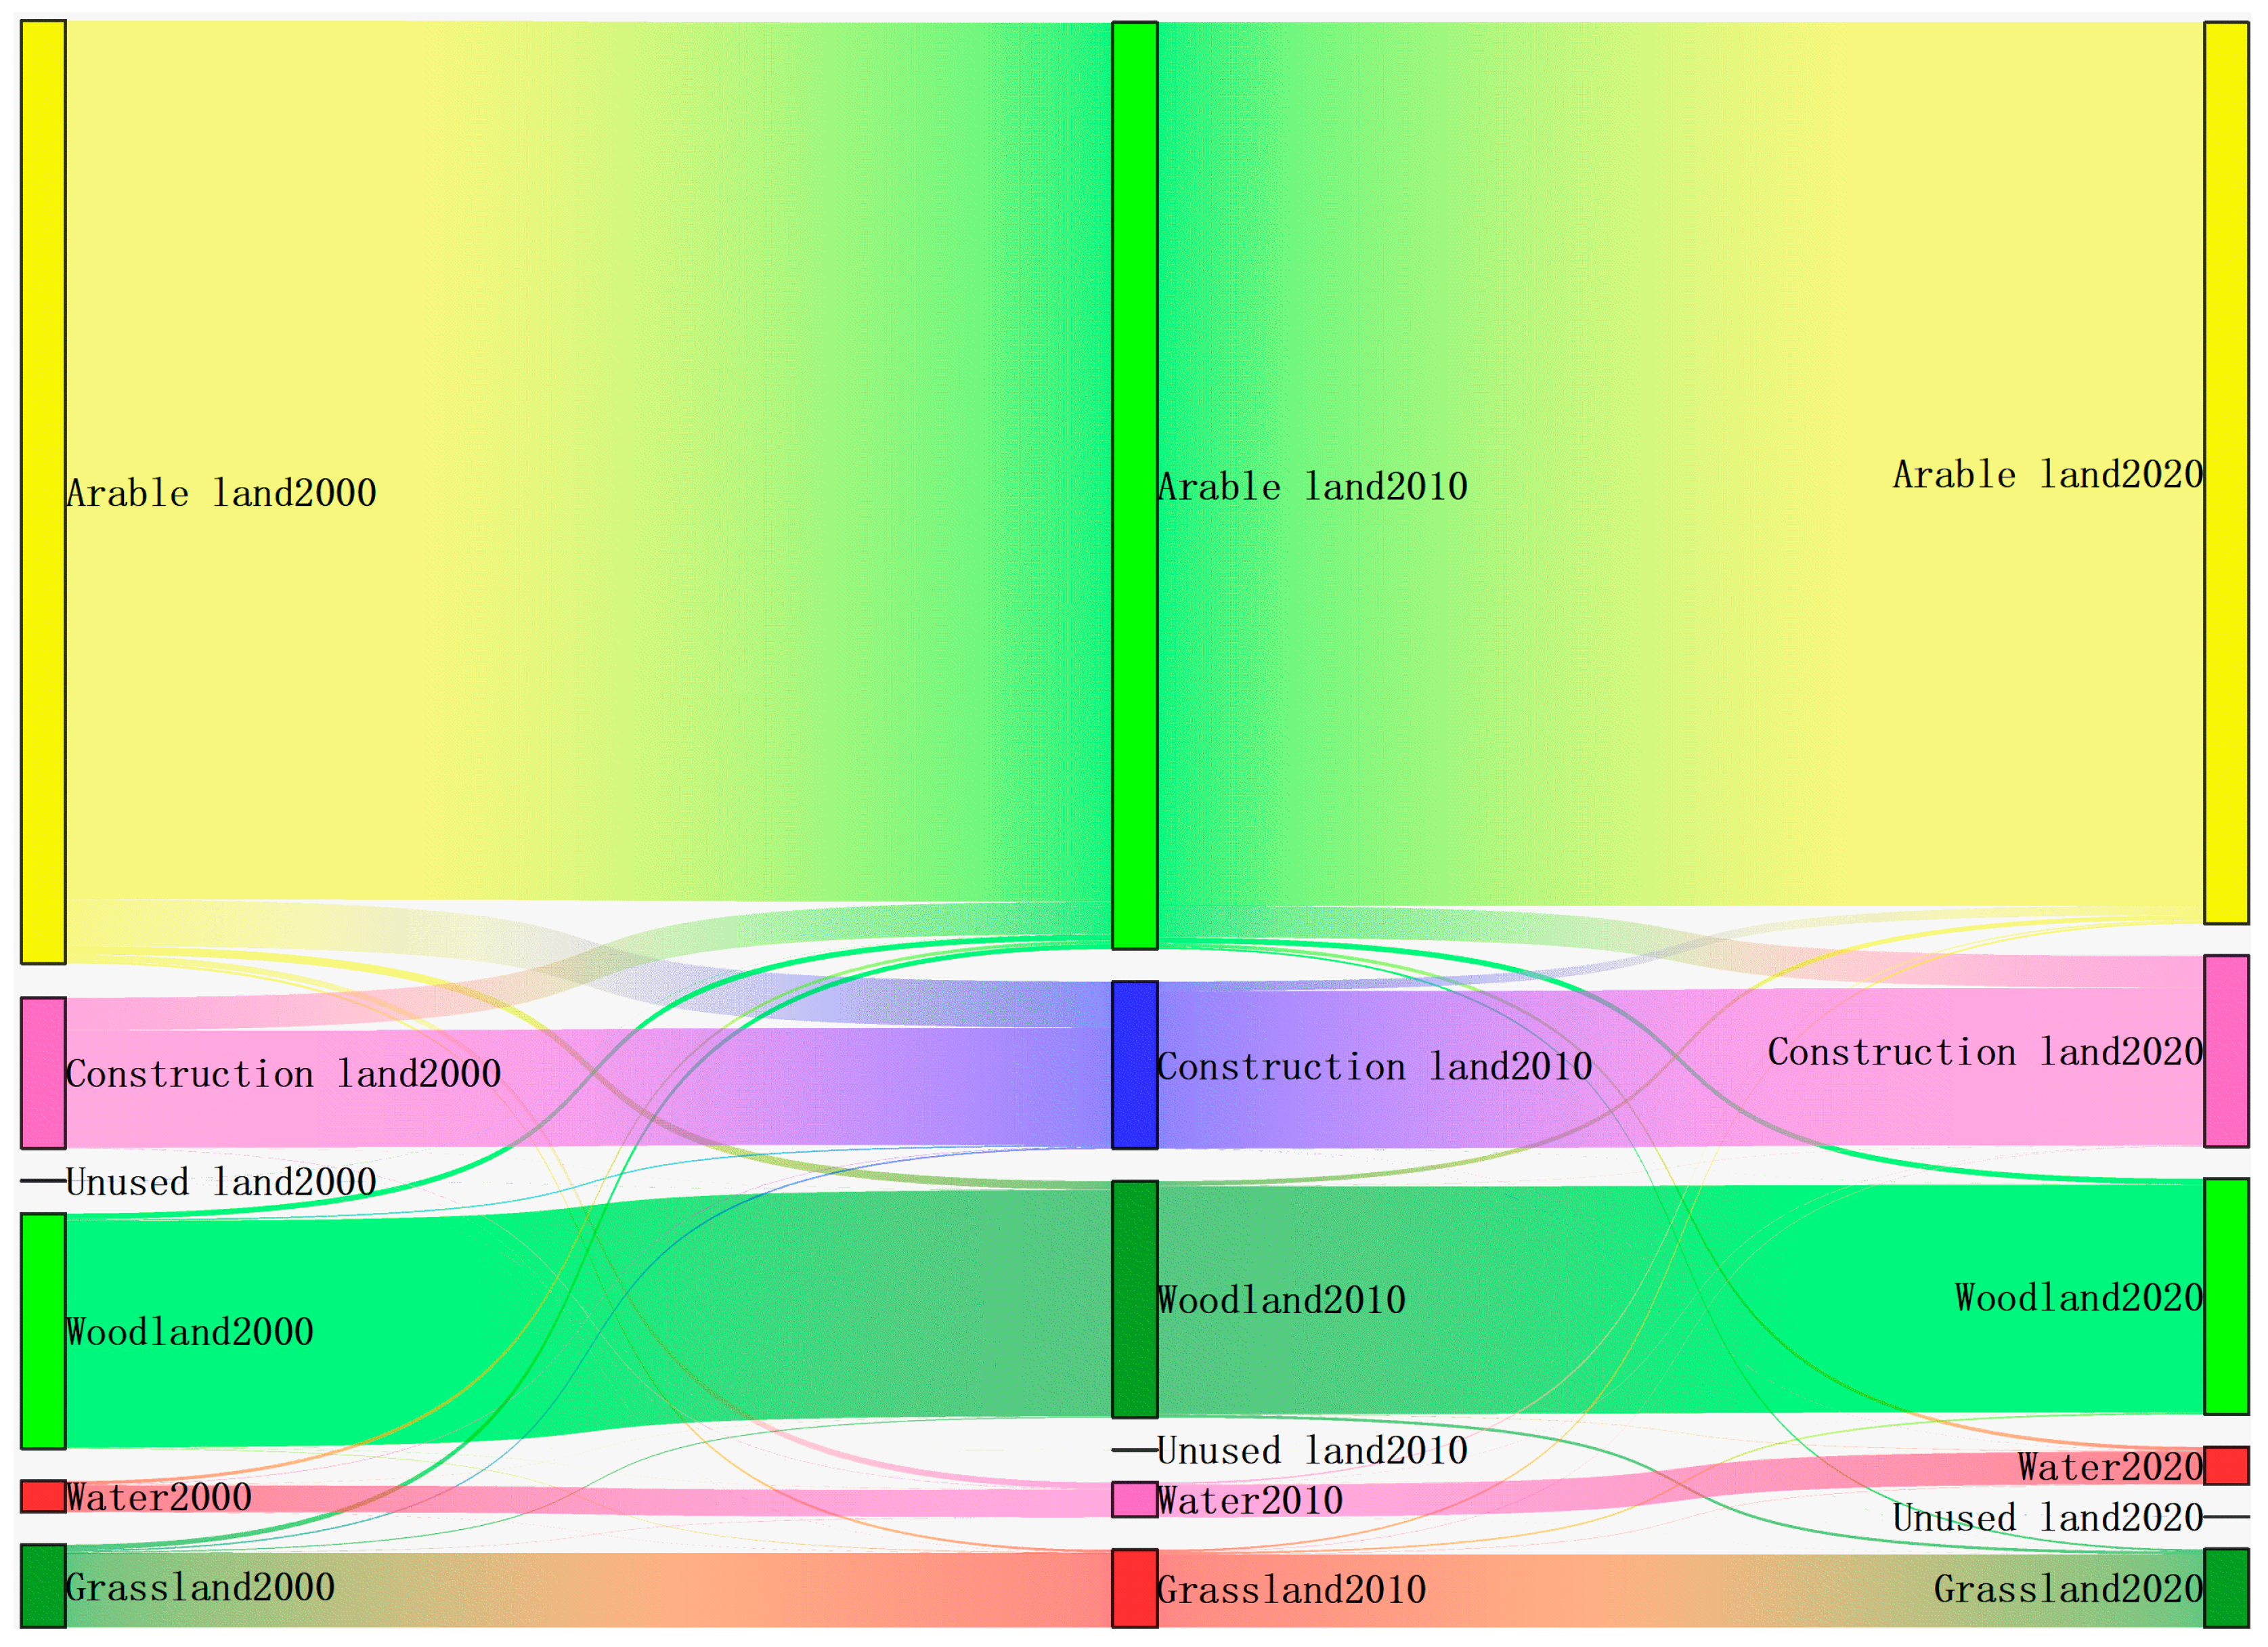
Figure 3.
Driver factor interaction detection results.
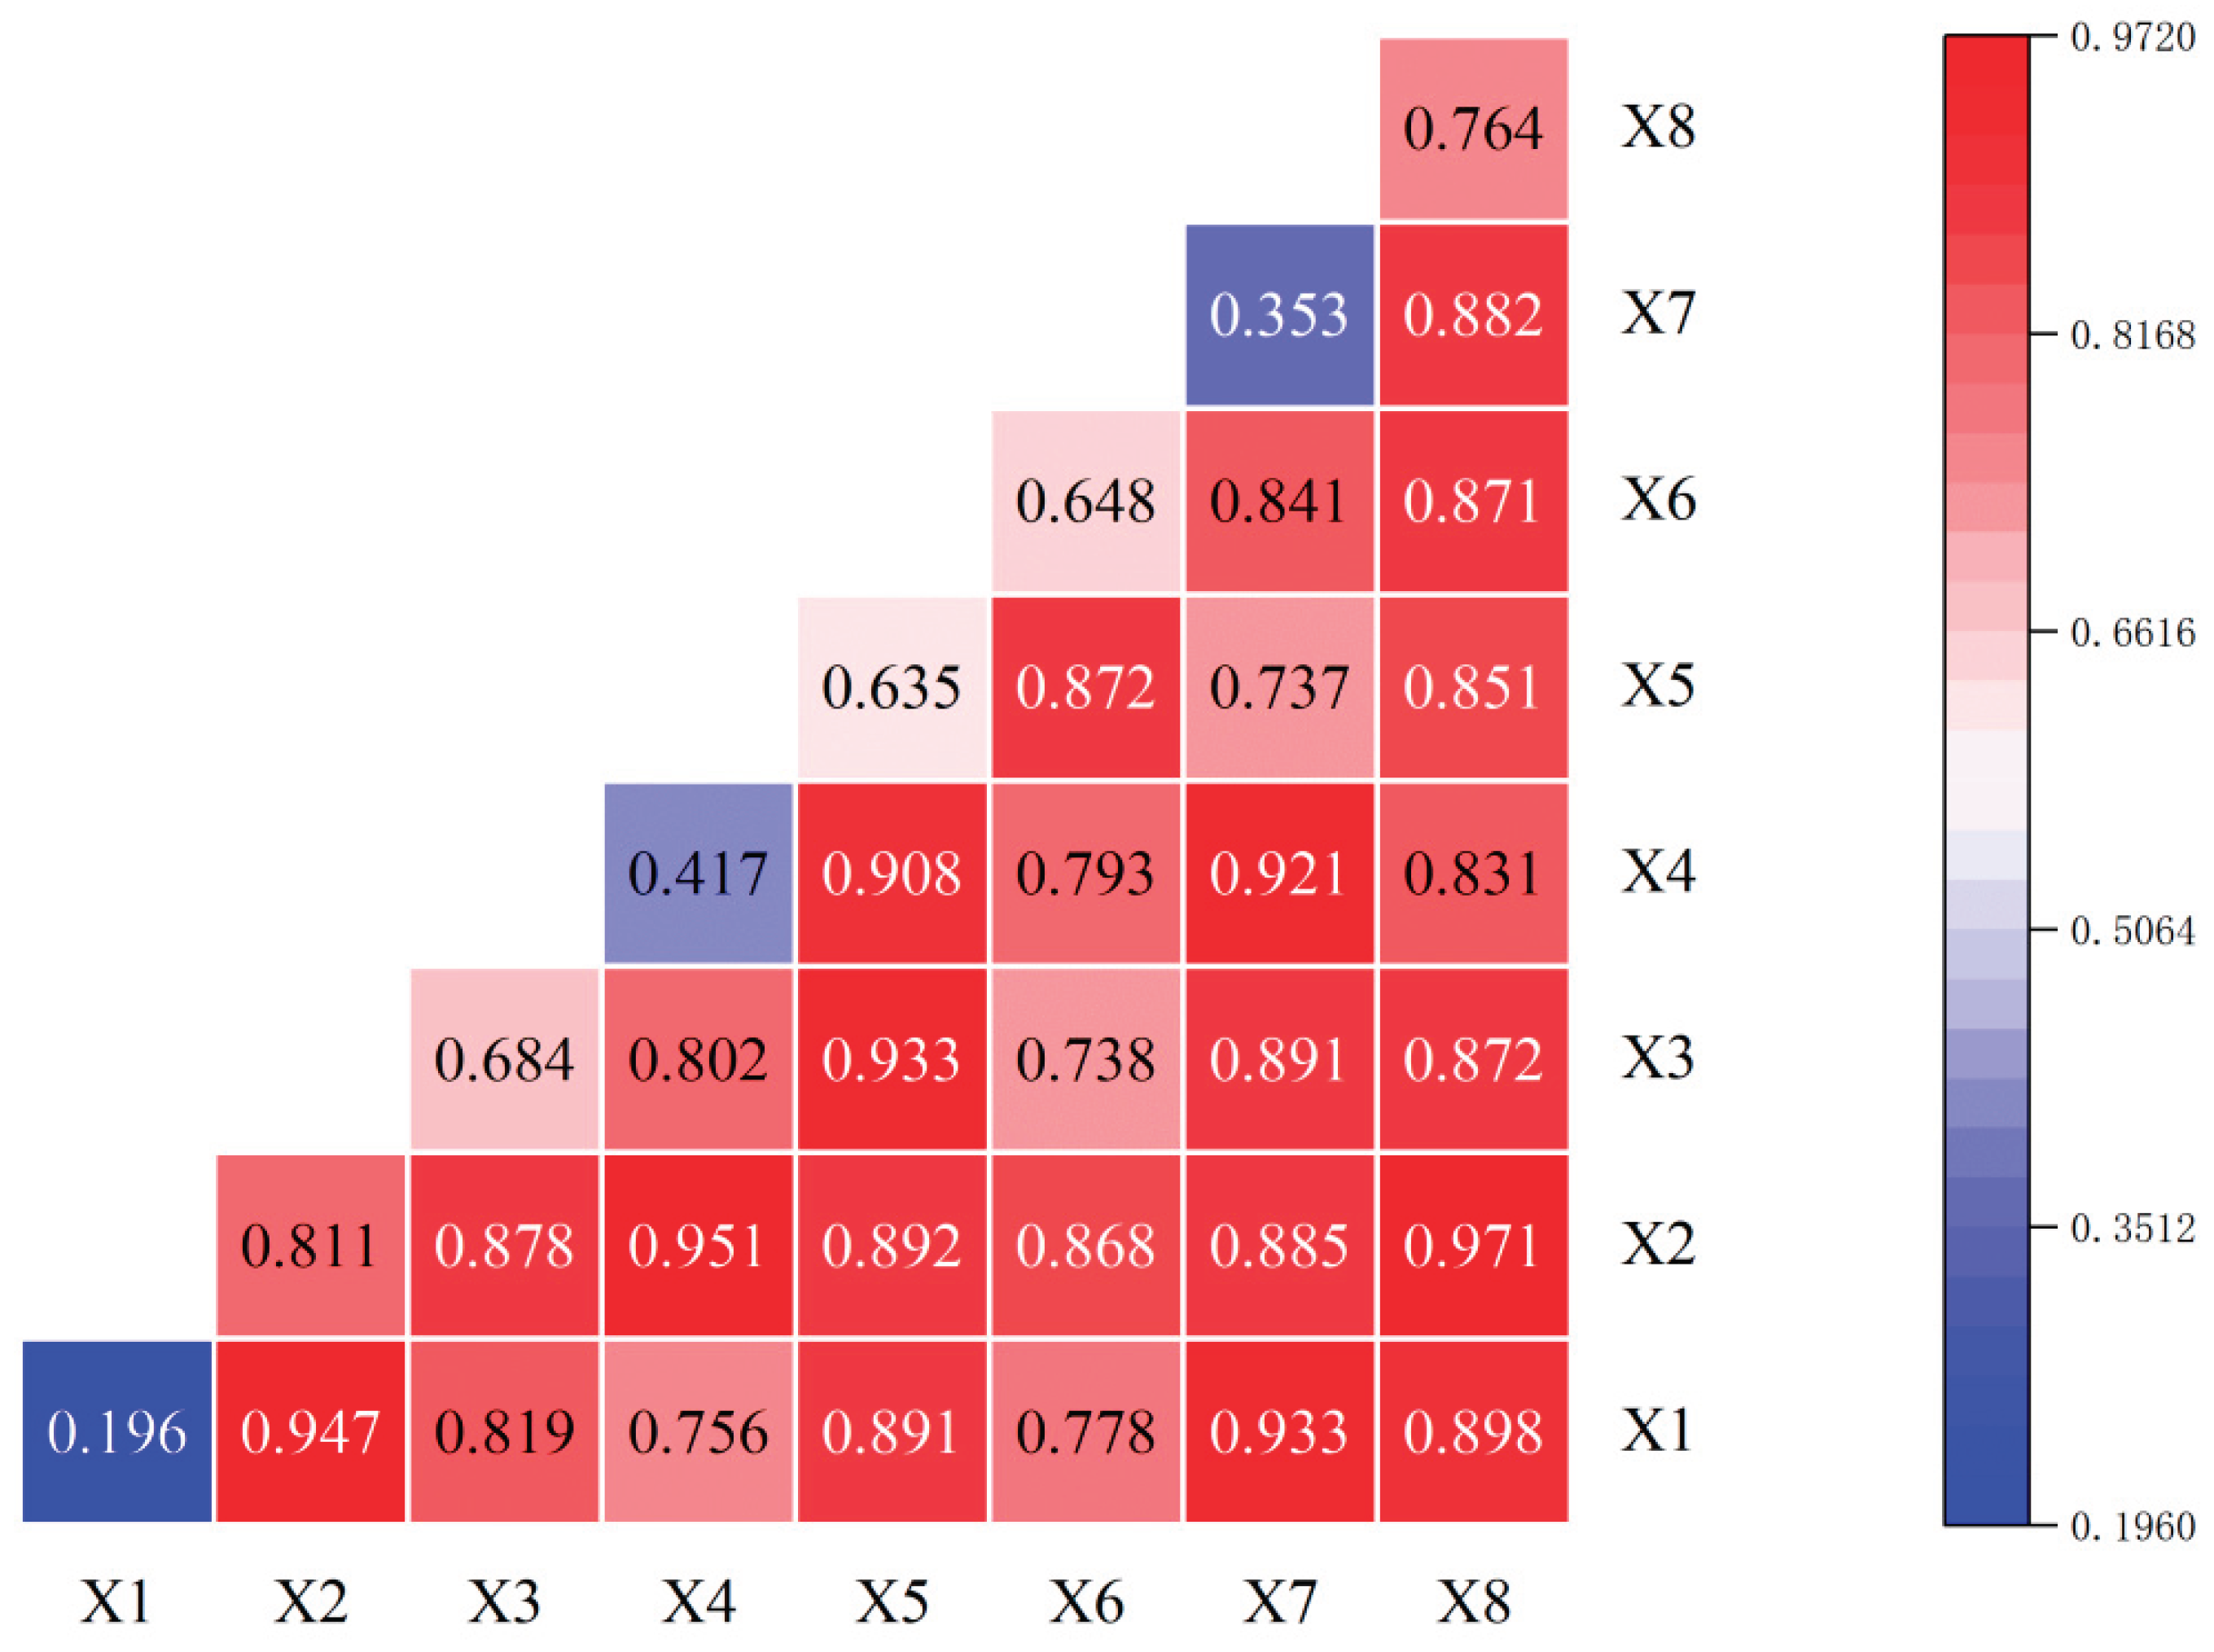
Table 4.
The selected indicators.
| Dimension | Indicators | Data Source |
|---|---|---|
| Natural environmental | Total population (X1) | Henan Province Statistical Yearbook [44] |
| Population density (X2) | Henan Province Statistical Yearbook [44] | |
| Socioeconomic | GDP (X3) | Henan Province Statistical Yearbook [44] |
| Proportion of secondary industry in regional GDP (X4) | Henan Province Statistical Yearbook [44] | |
| Proportion of tertiary industry in regional GDP (X5) | Henan Province Statistical Yearbook [44] | |
| Number of industrial enterprises (X6) | Henan Province Statistical Yearbook [44] | |
| Fixed asset investment (X7) | Henan Province Statistical Yearbook [44] | |
| Urbanization rate (X8) | Henan Province Statistical Yearbook [44] |
Table 5.
Detection results of driving factors of cultivated land area in Henan Province.
| Indicators | q |
|---|---|
| X1 | 0.196 |
| X2 | 0.810 |
| X3 | 0.684 |
| X4 | 0.417 |
| X5 | 0.635 |
| X6 | 0.648 |
| X7 | 0.353 |
| X8 | 0.764 |
Disclaimer/Publisher’s Note: The statements, opinions and data contained in all publications are solely those of the individual author(s) and contributor(s) and not of MDPI and/or the editor(s). MDPI and/or the editor(s) disclaim responsibility for any injury to people or property resulting from any ideas, methods, instructions or products referred to in the content. |
© 2025 by the authors. Licensee MDPI, Basel, Switzerland. This article is an open access article distributed under the terms and conditions of the Creative Commons Attribution (CC BY) license (http://creativecommons.org/licenses/by/4.0/).
Copyright: This open access article is published under a Creative Commons CC BY 4.0 license, which permit the free download, distribution, and reuse, provided that the author and preprint are cited in any reuse.


