
Submitted:
08 June 2025
Posted:
09 June 2025
You are already at the latest version
Abstract
Acoustic quality is one of the aspects that contribute to the heritage of cultural and religious spaces. It is increasingly common to find scientific literature detailing the sound characteristics of places of worship, especially those with cultural and historical interests. This article presents a comprehensive acoustic characterization of three colonial heritage churches in Quito. It examines the relationship between objective and subjective parameters that influence the valuation of a space or sound environment. To analyze this relationship, the study employs Structural Equation Modeling (SEM) to evaluate three latent variables using perceptual acoustic indicators. Results from SEM showed statistically confirmed pathways between sociodemographic variables and latent perceptual constructs, which supports the notion that acoustic quality is not entirely captured by more classical measures of intelligibility or clarity.
Keywords:
church acoustics
; sound perception
; structural equation modeling
; Quito
; acoustic parameters
1. Introduction
Over the centuries, the church has served as a vital institution in civilization. It is a place strongly associated with religious beliefs, where believers go to seek spiritual release and tranquility. In addition to serving as a means to enhance people's spiritual well-being, these spaces also provide opportunities for verbal address, the subject of which should be clearly communicated to the audience. Furthermore, churches often hold a variety of art and music events. These include recitals of liturgical music, chamber concerts, symphonic performances, and popular or seasonal music celebrations. As cultural heritage, churches located in historic districts are invaluable. They integrate elements from architecture and urban design. In contrast, the acoustic quality parameters of churches are often not considered during this architectural process.
Restoration efforts have traditionally focused on the rehabilitation of elements such as altarpieces, altars, floors, and even coffered ceilings, as well as their decorative or pictorial elements. Although speech intelligibility may be enhanced by the use of sound reinforcement systems, the intrinsic acoustic response of these spaces—shaped by their geometry, materials, and volume—is often overlooked, despite its greater significance for the acoustic assessment of worship venues. Church acoustics represent a form of heritage that should be preserved with the same emphasis given to architecture and artistic elements.
The study of soundscapes in religious heritage buildings has gained significant attention over the past decade, driven by the interdisciplinary convergence of acoustics, architecture, and cultural heritage preservation [1,2]. Religious spaces, such as churches, mosques, and temples, serve as places of worship and repositories of intangible cultural heritage, where sound significantly influences spiritual and communal experiences [3,4].
Acoustic characteristics of places of worship can be evaluated using a variety of methods, ranging from the numerical quantification of sound energy-related parameters to binaural recording techniques and ambisonic impulse response measurements for different combinations of sound sources and receivers. The complex architecture of churches often forces evaluators to use diverse and numerous source-receiver positions, resulting in non-comparable results. Therefore, a comprehensive understanding of the spatial variation in acoustic parameters and the selection of the most suitable technological methods are essential for accurate acoustic assessment [5]. A literature review [6] summarized decades of research on the acoustics of Western Christian churches, mainly focusing on heritage-listed sites. This review highlighted the work of research groups in several European countries, providing details of experimental procedures, results, and interpretations of how sound propagates, as well as subjective auditory experiences and computer-assisted simulation techniques. While most acoustic studies have been presented for European churches, notable research has also occurred in the Americas.
In this light, church music represents a form of domain heritage that should be equally preserved with the architectural and performance aspects, suggesting that the acoustic characteristics of worship spaces are not only contextually significant for the intelligibility of speech and the appreciation of music during religious services, but also acquire unique semiotic value specific to each geographic and cultural setting. Measurements of monaural and binaural impulse responses in distinct areas and for various liturgical functions within each cathedral confirmed that spatial distribution of reflected sound energy, reverberation time, and acoustic strength contribute meaningfully to the semiological dimension of the experience—even if these physical descriptors are not explicitly recognized by performers themselves [7]. Another study examined the acoustic properties of Toledo Cathedral in Spain, showing it to be a highly reverberant space with poor speech intelligibility. However, an analysis of its liturgical uses suggests that the cathedral is not a single acoustic space, as evidenced by the differences between the chapels and the choir [8].
One study measured the acoustic energy relationships in Gothic-Mudéjar churches in southern Spain, comparing the results of these measurements against theoretical models [9]. The authors proposed an analytical model based on measured musical clarity (C80) values. An alternative approach was presented in a study of eight Roman Catholic churches in Poland, where a comprehensive acoustic quality indicator was created by comparing multiple variables. This global indicator offers a user-friendly tool for both scientific research and practical decision-making [10].
As technology has progressed over the years, the methods for evaluating acoustics have also advanced. Initial characterizations were concerned with reverberation time (RT), early decay time (EDT), and speech intelligibility using the Speech Transmission Index (STI). Later additions included further energy-related parameters such as strength (G), lateral energy fractions (LF and LG), and speech and music clarity (C50 and C80). More recently, the interaural cross-correlation coefficient (IACC) has been used to check that sound arrives at the listener’s two ears simultaneously, calling for binaural or ambisonic recording equipment as specified in the standards [11] and [12].
In addition to Christian churches, soundscapes for Buddhist temples have been evaluated, and their analysis has reported some sounds that disturb music listening as well as preferred sound sources for meditating. A study found that sound sharpness correlated most strongly with visitor's sound preferences [13]. Recently, Ma et al. [14] proposed a subjective scale for evaluating sound quality in buildings. On this scale, the three principal latent factors in the human perceptual dimensions of sound are overall sound evaluation (E: evaluation), energy content (P: potency), and temporal-spectral content (A: activity). This EPA approach (Evaluation, Potency, Activity) considers the interaction between the on-site listener and the measurement, thereby providing a valid and reliable method for quantitative analysis [14].
Despite the growing body of literature, a critical gap remains in the application of advanced statistical methods, such as structural equation modeling (SEM) [15] to analyze the relationships between acoustic and perceptual variables in religious heritage sites. This approach offers a robust framework for modeling latent constructs and their relationships with perceptual acoustic parameters.
Building upon this background, this study aims to acoustically characterize three colonial churches in Quito, which are significant components of the city's historical heritage. By combining objective measurements with subjective evaluation scales, this study proposes a comprehensive evaluation of acoustic quality parameters for both speech and music in the evaluated churches. The goal is to use modern technology to analyze the characteristics of the overall sound field. This research aims to inform future studies on preserving the acoustics of churches as part of our cultural heritage. By comparing the sound field behavior with the experiences of on-site listeners, the study identifies key acoustic factors that influence how individuals perceive these historic spaces. Combining objective measurements with subjective assessments of the sound environment provides practical advice for adapting historic buildings for contemporary use.
2. Evaluated Churches
In this study, three significant heritage churches of Quito were examined: 1) La Compañía de Jesús, 2) the Metropolitan Cathedral, and 3) El Sagrario.
The Church of La Compañía de Jesús is one of the most representative of Quito's baroque architecture in Latin America. Built from 1605 to 1765, the church is an extraordinary blend of styles, including Baroque, Moorish, and Neoclassical elements [16]. Located in Quito's city center, this religious building is best known for its ornate interior, featuring gilded wood carvings, intricate altarpieces, and golden-leaf decorations. The Jesuits constructed the church as a multifaceted center for religion, education, and culture. It reflects the educational and spiritual values of the Jesuits, as well as the widespread artistic and theological interests of the Counter-Reformation era. The aesthetic of the Quito School of Art, a Spanish- and indigenous-influenced regional style, can still be observed in the form of many church frescoes, sculptures, and ornamental details [17]. Conservation and restoration efforts carried out over the last few decades have enabled the preservation of its historical and artistic heritage, making it a reference for researchers and experts in heritage protection [18].
The Metropolitan Cathedral is another important religious site in Quito and can be found in the city's main square in the colonial quarter. Constructed from 1562 to 1806, the cathedral reflects the evolution of architectural styles from the colonial period to the early Republican era. It features a blend of Gothic rib vaults, Baroque ornamentation, Mudejar ceilings, and Neoclassical facades. This diversity of styles demonstrates how the European model of architecture was gradually adapted to local building practices. Since the Spanish conquest, the cathedral has remained an integral part of the city's religious, cultural, and political life [19]. This richness of artistry also extends to the interior, where there is masterful woodwork and stone carvings, as well as a number of Quito School artworks. The cathedral also contains the tombs of several significant historical figures. Although there have been several earthquakes in the area, the building itself has undergone several careful renovations and reinforced its construction, preserving its spiritual and architectural essence intact.
Another well-known colonial religious structure is the El Sagrario Church, also located in Quito's Old Town. Envisioned initially as a subsidiary chapel of the Metropolitan Cathedral, El Sagrario developed its own architectural identity and artistic importance as a separate parish church. The church was constructed in the 16th-18th centuries (Renaissance for construction and Baroque for decoration). It features a very coherent composition style with a concordant yet dynamic architecture. On the surface are classical-style columns and intricate iconographic details cut from polished volcanic rock. Within, the visitor finds an overwhelming visual feast of gilded altarpieces, mural paintings, and a soaring dome that filters the light. El Sagrario is a key element of Ecuador's national heritage, providing examples of the art and cultural interaction that characterized Andean colonial architecture [20]. Table 1 shows the general attributes of the studied churches, Figure 1 presents a schematic diagram of the churches, and Figure 2 shows general views of the evaluated sites.
3. Methodology
The methodology includes three key components: acoustic evaluation through in-situ measurements, subjective assessment via opinion surveys, and the development of a Structural Equation Model (SEM) based on the EPA approach to analyze the relationships between perceptual and acoustic variables.
3.1. Acoustic Assessment
The acoustic evaluation followed a rigorous methodology to analyze the sound characteristics of the selected religious sites. To ensure controlled conditions, acoustic measurements were conducted during technical visits when the space was unoccupied by the public. An omnidirectional sound source (CESVA BP012) was used, driven by its dedicated amplifier and connected to an M-Audio MTrack II interface, as shown in Figure 3. Calibration was performed in situ before each measurement using software (EASERA v1.2) to ensure consistent excitation levels. The source was positioned at the altar, as it is the central location for religious ceremonies.
Receiver positions ranged between 15 and 22 per site, distributed along the central nave, considering the geometry of the space. Their placement followed the recommendations of [12], ensuring a homogeneous random distribution while avoiding symmetrical positions. Each point was measured using both a microphone (Beyerdynamic MM1) and a binaural dummy head (Neumann KU100). The microphone was primarily used to evaluate temporal acoustic parameters, including Reverberation Time (RT), Early Decay Time (EDT), Speech Clarity (C50), Musical Clarity (C80), Definition, the sound pressure level within the first 80 ms after the initial arrival of the signal (L80), and Speech Transmission Index (STI). At the same time, the binaural dummy head captured spatial attributes, including the Interaural Cross-Correlation Coefficient (IACC) in full early and late mode.
Acoustic excitation was performed using an exponential sine sweep generated by software (EASERA v1.2), with a sampling rate of 44.1 kHz. The impulse responses were captured over the whole audible frequency range, ensuring broadband acquisition was suitable for room acoustic analysis. Each receiver position was measured five times to ensure data reliability and accuracy. The software automatically processed the impulse responses and calculated the acoustic parameters. Statistical post-processing involved averaging five measurements per point and aggregating data across three predefined zones—near, mid, and far (relative to the altar)—to derive representative values for each area and the entire venue.
Acoustic measurements were conducted under the normal conditions of each space without modifications. To minimize external noise interference and environmental fluctuations, several measures were implemented, including in situ calibration, closure of the venue to the public during measurement sessions, and scheduling data collection during periods of minimal or no external activity. These procedures provided a comprehensive and reliable assessment of the acoustic environment within the analyzed religious spaces.
3.2. Subjective Assessment
To explore the perceptual and affective responses to the acoustic environment of the heritage churches under study, a subjective assessment was conducted through on-site surveys. Participants completed questionnaires immediately after visiting the churches, which contained a range of contextual scenarios. Specifically, participants were surveyed following religious services, guided or independent tourist visits, and non-formal religious or touristic visits (e.g., private prayer or casual entry). This approach ensured the inclusion of a broad spectrum of acoustic perceptions shaped by different functional and experiential conditions within the sacred spaces.
3.2.1. Participants’ Sample Size
Applying the guideline of six subjects per parameter resulted in a minimum sample size of 115 participants per site. To enhance the consistency of the perceptual data and meet the statistical requirements of the analysis methods used, we distributed a greater number of surveys—at least 400 for each religious site [21]. This decision follows methodological recommendations indicating that larger sample sizes enhance the stability of factor analysis results and support the practical application of the semantic differential technique.
On the other hand, the EPA approach specified in this study consisted of three latent variables, each measured through two observed indicators, yielding a total of six observed variables [14]. Following best practices in SEM, a minimum sample size was estimated based on two commonly accepted criteria: at least ten respondents per observed variable and at least five respondents per estimated parameter.
Thus, a total of 1,214 visitors participated in the survey, distributed across the sites as follows: the Cathedral (n = 409), La Compañía (n = 403), and El Sagrario (n = 402). The participants included individuals visiting for both religious and touristic purposes, representing a balanced distribution of male and female respondents. Age groups ranged from 15 years to over 65 years, allowing for a diverse understanding of sound perception across different life stages. The data was collected through face-to-face surveys conducted using digital forms between March and November 2024, ensuring a comprehensive capture of visitor experiences under varying temporal and environmental conditions. Considering that the model includes six factor loadings, six error variances, and three latent covariances, a total of 23 parameters were estimated (see Table 2 parts II and III). Accordingly, the minimum recommended sample size was calculated to be 60 based on the parameter-based criterion and 60 based on the variable-based criterion. The final sample size far exceeded the minimum requirements, thereby ensuring robust model estimation and high statistical power.
3.2.2. Questionnaire Design
The survey was structured into three main sections to capture participants' profiles and their experiences with sound perception, as presented in Table 2. The first section gathered personal and socio-demographic information, including age, gender, purpose of visit (touristic or religious), and frequency of visits to religious sites. The second section focused on general perception related to the acoustic environment, using a 5-point Likert scale where 1 represented "Strongly Disagree" and 5 "Strongly Agree." The third section explored perceptions associated with the latent variables defined in the EPA approach. This part contained 18 semantic differential indicators, all rated on a 5-point scale. For example, for the indicator "Pleasantness," participants rated their experience from 1 ("Not pleasant at all") to 5 ("Very pleasant"). This structured approach enabled a detailed assessment of how visitors perceived the sound environment within religious spaces, providing insights into both subjective evaluations and broader perceptual patterns.
Table 3 presents the complete set of input variables used to construct and estimate the structural equation model designed to explore the relationships between architectural/acoustic indicators, perceptual sound descriptors, and sociodemographic factors. It contains three main thematic blocks: (1) demographic and socioeconomic aspects, (2) architectural/acoustic perception ratings (General Opinions), and (3) perceptual responses subdivided according to the circumplex structure of soundscape dimensions—Evaluation, Potency, and Activity. Each variable was categorized by its thematic module and included the corresponding label and coding scale.
3.3. Structural Equation Modeling
To investigate the correlations between objective acoustic behavior and subjective sound quality perception in churches, the current study employs SEM with three latent variables: EPA [14], where Evaluation (E) characterizes the global affective judgment of the acoustic scene (e.g., Pleasant-Unpleasant, Relaxed-Tense), Potency (P) indicates the perceived intensity and dominancy of the sound in the environment (e.g., Weak-Strong, Quiet-Loud), and Activity (A) represents the spectral content (e.g., Flat-Sharp, Low-High).
Firstly, an exploratory factor analysis (EFA) was performed to extract the primary latent constructs from a set of measured indicators without a preconceived structure. Next, to assess the discriminant validity and factorial validity of the constructs, Confirmatory Factor Analyses (CFA) were carried out and confirmed using composite reliability (CR) and average variance extracted (AVE). Discriminant validity was established as the maximum shared variance (MSV) for each factor was lower than the AVE. Finally, an advanced SEM model was formulated to validate the hypothesis path by estimating the regressor coefficient loadings on the structural model. Structural equation models were processed and analyzed using the Lavaan library [22] in R-Studio (v2025.05). SEM allows the use of mediation analysis and then estimates the loadings of the total effects involving both latent and explanatory variables.
The literature indicates that several studies have applied latent variable analysis within SEM frameworks to assess auditory perception in urban soundscapes [23,24,25,26], as well as in building environments [14]. However, this methodology remains unexplored, mainly in the specific context of heritage churches. Recent contributions have sought to integrate objective acoustic measurements with subjective assessments of auditory perception [27,28] or with user-reported perceptions of churches as tourist destinations [29]. Based on the EPA approach proposed for assessing sound quality in buildings, the present study tests a conceptual SEM based on the three hypotheses illustrated in Figure 4, specifically adapted to the context of heritage churches:
- HA: Perceived Activity inside churches is positively correlated with Potency of sounds.
- HB: Perceived Potency of sounds influences sound evaluation.
- HC1: Sociodemographic characteristics of participants influence Activity, Potency, and Evaluation of sounds in churches.
- HC2: The geographical residential location of participants influences the Activity, Potency, and Evaluation of sounds inside the churches.
4. Results
Table 4 summarizes the acoustic analysis of the three heritage churches, where different reverberation and clarity behaviors were identified. RT varied between 2.1 s (La Compañía) and 2.6 s (El Sagrario), though La Compañía also showed the lowest EDT (2.4 s), which might denote just a little better sound decay control. Clarity indices were negative in all sites, with La Compañía church exhibiting the highest Music Clarity (C80 = –2.0), indicating a better musical acoustic environment. Definition values were consistent at 0.3, and L80 levels were highest in La Compañía (100.0 dB), suggesting a stronger early energy contribution. STI and RASTI values were generally moderate (STI ≈ 0.4), as were the %AlCons values (17.8–20.2%), suggesting moderate levels of speech intelligibility. IACC values were relatively stable for the early and late reflections; full-range IACC was highest in La Compañía (0.4), indicating a somewhat stronger spatial impression.
Figure 5 shows RT values across 1/1 octave bands, capturing the frequency-dependent decay characteristics of the sound field. Complementarily, Figure 6 shows the IACCs, also in 1/1 octave bands, which provides insights into the spatial immersion of the acoustic environment from a binaural perspective.
The Metropolitan Cathedral exhibited the highest RT across most frequency bands, peaking at 3.2 seconds at 500 Hz, which suggests a particularly reverberant space, ideal for the performance of liturgical music but detrimental to the intelligibility of spoken language. El Sagrario presents an intermediate acoustic profile, with reverberation times comparable to the Cathedral at mid-to-high frequencies but slightly reduced at low frequencies. On the other hand, La Compañía presents the lowest reverberation times in general, and especially at low frequencies (1.9 s at 250 Hz), indicating a more damped acoustic environment, which may favor the clarity of spoken words. These differences arise from the varied architectural and material properties of the three buildings.
As for IACC, large values indicate an enhanced auditory spaciousness. La Compañía generally shows the highest IACC across most frequencies, as well as the mid-high range, which can be as high as 0.4-0.5. These results indicate better performance in generating an enveloping sound field, which increases the perception of spatialness. By contrast, the IACC values are higher in the Metropolitan Cathedral and El Sagrario, specifically, below 1 kHz, the IACC values are higher in the Cathedral, while above 4 kHz, El Sagrario exhibits the highest values, denoting a directional sound field and less perceptual space. These data support the acoustic singularity of La Compañía in terms of spatial sensation.
A principal component analysis with varimax rotation was conducted to identify orthogonal factors and their primary indicators. The Kaiser–Meyer–Olkin Index (KMO = 0.94), along with the Measure of Sampling Adequacy (MSA) for each indicator, was used to assess sample adequacy [30]. All indicators surpassed the acceptable threshold of 0.7 based on MSA values, confirming their suitability for inclusion in the analysis.
The SEM development underwent a multi-stage validation process, which included EFA, CFA, and SEM path modeling techniques. The EPA approach determined that Activity (η₁), Potency (η₂), and Evaluation (η₃) represent the fundamental latent variables characterizing the acoustic quality perception within heritage churches
Several models were tested for the EFA, and Table 5 presents the results of the EFA that showed the highest association. Three clear factors emerged from the EFA with eigenvalues above 1, explaining 74% of the total variance. The variance distribution was 35% for Factor 1 (Activity) and 19% for Factor 2 (Potency), while Factor 3 (Evaluation) explained 20%. The principal factors extracted from the EFA align with those identified in previous studies [31]. The Activity showed high loadings from Noise, Tense, and Unpleasantness indicators, which exceeded 0.89, while Potency revealed strong loadings from Loudness, Reverberation, and Strength indicators. The Evaluation dimension relied on indicators like Speech and Music Clarity and Brightness together with Understandability.
CFA confirmed the structure because every standardized factor loading proved statistically significant and surpassed the advised threshold of 0.70 except for one marginal instance. Table 6 demonstrates that the average variance extracted for each construct exceeded 0.50, thereby confirming convergent validity. The measurement of internal consistency proved strong as CR and Cronbach’s alpha values exceeded the accepted 0.70 standard [32].
To validate the hypothesis, the structural relationships among the latent and observed variables were analyzed, as presented in Figure 7 and Table 7. The values of the goodness-of-fit metrics for the conceptual model are shown in Table 8. Regression results (see Table 7) indicated that all structural paths were statistically significant (p < 0.001). For example, Activity was a significant predictor of Potency, and Potency significantly influenced Evaluation, suggesting a mediated mechanism whereby negative emotional responses (e.g., Noise, Tense) intensify the perceived acoustic environment, subsequently shaping global evaluative judgments of sound quality. Table 8 indicates an acceptable model fit. Although the Tucker–Lewis Index (TLI) and the Root Mean Square Error of Approximation (RMSEA)values are slightly outside the ideal ranges, they still fall within acceptable limits for complex models. The Standardized Root Mean Square Residual (SRMR) falls within the recommended values. Overall, the model exhibited a satisfactory fit to the data.
SEM results confirm the hypothesized relationships among the latent constructs derived from the EPA model (see Table 9). Specifically, perceived Activity significantly and positively influences Potency (β = 0.881, p < 0.001), while Potency exhibits a strong adverse effect on Evaluation (β = -0.872, p < 0.001), suggesting a mediating mechanism through which spectral characteristics of sound modulate the perceived intensity and, ultimately, the affective appraisal of the acoustic environment in heritage churches. Sociodemographic factors, such as age and frequency of visits to the assessed churches, were also significant. Adults and seniors reported higher perceptions of Activity and Potency but tended to evaluate the soundscape more negatively (e.g., adult → Evaluation: β = -0.378, p < 0.001). Additionally, geographic location was a significant factor. Participants residing in both the northern and southern areas, compared to those living in the central zone where the churches are located, consistently perceived higher levels of Activity and Potency, and tended to evaluate the acoustic environment more negatively. These findings highlight the significance of physical acoustic parameters and listener context in shaping subjective sound quality evaluations in religious spaces.
4. Discussion
The research findings demonstrate the efficacy of using the EPA approach to study acoustic perception within heritage churches. The latent construct Activity captures negative emotional responses (such as Noise and Tense), Potency measures the perceived intensity of sound (such as Loudness and Reverberation), while Evaluation assesses the comprehensive quality of hearing (like Clarity and Brightness). The structure illustrates how acoustic perception is formed through physical sound measurements and emotional and cognitive reactions to auditory surroundings, which underlie the sound experience in sacred spaces.
The acoustic measurements revealed that three churches exhibited moderately long RTs ranging from 2.1 s to 2.6 s, with La Compañía demonstrating slightly superior acoustic behavior across several parameters, including C80 and IACC. These values align with those reported in [7], who observed excessively high RTs in Andalusian cathedrals—exceeding 8 seconds in some cases—yet highlighted the significance of architectural features and spatial source positioning (e.g., retro-choir) in mitigating these effects. In this study, the placement of the sound source at the altar, together with the natural material absorption characteristics, likely contributed to its comparatively better speech intelligibility and spatial impression. However, the dimensions of the analyzed churches in this study were significantly lower.
Despite low STI values (≈0.4), the perceptual clarity reported by participants—particularly in La Compañía—suggests a decoupling between physical and subjective intelligibility, reinforcing the observations made by Abadía [31], who found low D50 values (<50%) across several Jesuit churches, yet moderate to high subjective ratings for clarity. This discrepancy highlights the influence of non-acoustic factors, including visual cues, source distance, and cognitive adaptation, on shaping sound perception in sacred contexts.
From the SEM analysis, three latent constructs were clearly identified—Activity, Potency, and Evaluation—explaining a cumulative 74% of the total variance. The high factor loadings and satisfactory goodness-of-fit indices support the structural validity of the model. Notably, the strongest loading indicators for Activity included Noise, Tense, and Unpleasantness, reproducing the semantic scales validated in [14], which emphasized the importance of affective dimensions in shaping environmental sound judgments. Similarly, Potency was closely associated with Loudness and Reverberation, while Evaluation included indicators related to Speech Clarity and Understandability.
The structural relationships among latent variables revealed that Activity significantly predicts Potency, and Potency, in turn, significantly influences Evaluation, validating the hypothesized mediation pathway. This suggests that emotionally charged reactions (e.g., stress, discomfort) intensify the perceived sound environment, which subsequently affects the overall evaluative judgment. Such mediation aligns with the conceptual structure proposed in [14] and is further supported by the high AVE and CR values observed in the CFA.
The path from Potency to Evaluation suggests that the mere intensity or dominance of sound may not be inherently negative; instead, it becomes evaluatively salient when modulated by emotional or contextual cues. This finding aligns with Abadía's study [33], which suggests that spatial volume and materiality play a defining role in listener impressions, independent of reverberation time alone. Moreover, the relatively high IACC values in La Compañía reinforce the importance of spatial characteristics in enhancing the immersive quality of the acoustic experience, a dimension highlighted by Farina [34] in the context of binaural measurements.
The study reinforces the concept that acoustic quality in heritage churches cannot be fully understood through objective metrics alone. The perceptual experience is shaped by a complex interplay of physical, emotional, and contextual factors that SEM can effectively capture. These insights have practical implications for acoustic heritage conservation, soundscape-based assessments, and the integration of perceptual models into building acoustic standards.
While this study provides valuable insights into the perceptual and acoustic dynamics of heritage churches, several limitations must be acknowledged. First, the acoustic measurements were taken in unoccupied conditions, which may not accurately reflect how sound absorption and diffusion behave with live audiences present. Even though statistical averaging and zone-based aggregation were applied to approximate typical usage scenarios, dynamic occupancy remains a variable that could impact the generalizability of the results. Additionally, the perceptual data were gathered immediately after individual visits rather than during services, potentially underrepresenting the full-range of soundscape experiences. Additionally, although the SEM demonstrated strong explanatory power, it was limited to three latent constructs (EPA). It may not account for other dimensions, such as cultural context, visual-auditory interaction, or temporal variation in sound perception.
Future research should expand the model by including additional variables such as spatial congruence, expectation bias, and ritual familiarity. These enhancements could improve the understanding of how sacredness, history, and religious significance influence soundscape evaluation. Longitudinal studies tracking acoustic perception over time—or during different liturgical events—could also offer deeper insights into the dynamic relationship between sound environments and human experience. Further integration of binaural recordings, immersive auralizations, and virtual reality simulations could help assess design interventions or material additions in a non-invasive way, particularly in sensitive heritage contexts.
5. Conclusions
The acoustic characterization of three heritage churches in Quito revealed not only the objective physical conditions of these spaces, as identified by reverberation times, clarity indices, and speech intelligibility values, but also provided valuable insights into how these conditions are perceived by users/visitors through systematic subjective evaluation. The EPA approach to auditory perceptions revealed that, although the spaces were generally perceived as imposing and culturally resonant (Potency), the listeners found them somewhat confusing or lacking in clarity (Evaluation) and experienced a dense or saturated acoustic environment (Activity). These subjective perceptions complement the quantitative acoustic metrics and confirm the limitations posed by speech intelligibility, as well as the perceived magnificence and envelopment of sound, which are hallmarks of sacred spaces.
To investigate the relationship between acoustic and soundscape perceptual descriptors, an SEM approach was employed as a robust analytical tool to examine the intricate nature of ecclesiastical acoustics. Key results from SEM demonstrated statistically confirmed pathways between sociodemographic variables and latent perceptual constructs, supporting the notion that acoustic quality is not entirely captured by more classical measures of intelligibility or clarity. A further positive predictor for Evaluation was Potency, which suggests that loudness and spatial spread can be beneficial within the conditions of a liturgical space. In contrast, the Activity factor -which describes auditory dynamism and temporal density- was negatively correlated with it. This study demonstrates that the combined use of quantitative measures and auditory perceptions is crucial when examining acoustic heritage. In addition to being a robust approach, SEM provides a conceptual framework to bridge the gap between measurable acoustic events and human sensory perception. The methodology developed in this study can be applied to future research in the architectural acoustics of culturally significant contexts. It advocates for refined interdisciplinary frameworks that recognize the diverse acoustical identities embedded in historical sacred spaces.
Author Contributions
Conceptualization, L.B-M. and F.E.; methodology, L.B-M., F-E. and L.G.; software, F.E.; validation, L.G., V.P. and J.P.A.; formal analysis, L.G., L.B-M., F.E;; data curation, F.E., L.G.; writing—original draft preparation, L.B-M., F.E.,L.G., and V.P; writing—review and editing, L.B-M., V.P. L.G. and J.P.A.; supervision, J.P.A. All authors have read and agreed to the published version of the manuscript.
Funding
This research received no external funding. The APC was funded by Universidad de Las Américas.
Informed Consent Statement
Informed consent was obtained from all subjects involved in the study.
Conflicts of Interest
The authors declare no conflicts of interest.
Abbreviations
The following abbreviations are used in this manuscript:
| AVE | Average Variance Extracted |
| C50 | Speech Clarity |
| C80 | Music Clarity |
| CFA | Confirmatory Factor Analyses |
| CR | Composite Reliability |
| EFA | Exploratory Factor Analysis |
| EPA | Evaluation Potency Activity |
| G | Strength |
| IACC | Inter aural cross-correlation coefficient |
| RMSEA | Root Mean Square Error of Approximation |
| RT | Reverberation Time |
| SEM | Structural Equation Modeling |
| SRMR | Standardized Root Mean Square Residual |
| STI | Speech Transmission Index |
| TLI | Tucker–Lewis Index |
References
- Zhang, D.; Shan, Y.; Chen, X.; Wang, Z. Soundscape in religious historical buildings: a review. Herit Sci 2024, vol. 12, no. 1, 1–30. [CrossRef]
- Mu, J.; Wang, T.; Zhang, Z. Research on the Acoustic Environment of Heritage Buildings: A Systematic Review. Buildings 2022, vol. 12, 1963. [CrossRef]
- Girón, S.; Galindo, M.; Gómez-Gómez, T. Assessment of the subjective perception of reverberation in Spanish cathedrals. Build Environ 2020, vol. 171, 106656. [CrossRef]
- Kim, Y. H.; Hwang, I. H.; Hong, J. Y.; Lee, S. C. Effects of vegetation on soundscape of an urban religious precinct: Case study of Myeong-dong cathedral in Seoul. Build Environ 2019, vol. 155, 389–398. [CrossRef]
- Martellotta, F.; Cirillo, E.; Carbonari, A.; Ricciardi, P. Guidelines for acoustical measurements in churches. Applied Acoustics 2009, vol. 70, no. 2, 378–388. [CrossRef]
- Girón, S.; Álvarez-Morales, L.; Zamarreño, T. Church acoustics: A state-of-the-art review after several decades of research. J Sound Vib, 2017, vol. 411, 378–408. [CrossRef]
- Álvarez-Morales, L.; Girón, S.; Galindo, M.; Zamarreño, T. Acoustic environment of Andalusian cathedrals. Build Environ 2016, vol. 103, 182–192. [CrossRef]
- Pedrero, A.; Ruiz, R.; Díaz-Chyla, A.; Díaz, C. Acoustical study of Toledo Cathedral according to its liturgical uses. Applied Acoustics 2014, vol. 85, 23–33.
- Zamarreño, T.; Girón, S.; Galindo, M. Acoustic energy relations in Mudejar-Gothic churches. J Acoust Soc Am 2007, vol. 121, no. 1, 234–250. [CrossRef]
- Kosała, K.; Engel, Z. W. Assessing the acoustic properties of Roman Catholic churches: A new approach. Applied Acoustics 2013, vol. 74, no. 10, 1144–1152. [CrossRef]
- International Organization for Standardization. ISO 18233:2006 - Acoustics — Application of new measurement methods in building and room acoustics, ISO: Geneva, Switzerland, 2006.
- International Organization for Standardization. ISO 3382-1:2009 - Acoustics — Measurement of room acoustic parameters — Part 1: Performance spaces, ISO: Geneva, Switzerland, 2009.
- Zhang, D.; Zhang, M.; Liu, D.; Kang, J. Sounds and sound preferences in Han Buddhist temples. Build Environ 2018, vol. 142, 58–69. [CrossRef]
- Ma, K. W.; Mak, C. M.; Wong, H. M. Development of a subjective scale for sound quality assessments in building acoustics. Journal of Building Engineering 2020, vol. 29, 101177. [CrossRef]
- Magasi, C. Evaluating Machine Learning Approaches in Structural Equation Modelling to Improve Predictive Accuracy in Marketing Research. Indonesian Journal of Business and Entrepreneurship (IJBE) 2025, vol. 11, no. 1, 93–93. [CrossRef]
- Webster, S. V. Vantage Points: Andeans and Europeans in the Construction of Colonial Quito. Colon latin Am Rev 2011, vol. 20, no. 3, 303–330. [CrossRef]
- López-Ulloa, F. S.; López-Ulloa, A. A. The vaulted systems of the colonial city of Quito, Ecuador. History of Construction Cultures - Proceedings of the 7th International Congress on Construction History 2021, vol. 2, 247–254. [CrossRef]
- Lara, M.L.; Sanz-Arauz, M. D.; López-Andrés, S.; Del Pino, I. Characterization and Analysis of the Mortars in the Church of the Company of Jesus—Quito (Ecuador). Minerals 2021, vol. 11, no. 7, 781. [CrossRef]
- Webster, S. V. Masters of the trade: Native artisans, guilds, and the construction of colonial Quito. Journal of the Society of Architectural Historians 2009, vol. 68, no. 1, 10–29. [CrossRef]
- Webster, S. V. The Architect and the Construction of the Church of El Sagrario in Quito. Colon latin Am Rev 2002, vol. 11, no. 1, 71–87. [CrossRef]
- Kline, R. Principles and Practice of Structural Equation Modeling, 5th ed. The Guildford Press: New York, USA, 2023.
- Rosseel, Y. lavaan: An R Package for Structural Equation Modeling. J Stat Softw 2012, vol. 48, 1–36. [CrossRef]
- Ye, J.; Chen, L.; Zheng, Y. Effect of an Artificial Sound-Based Index on the Perception of Historical Block Environments. Buildings 2023, vol. 13, no. 9, 2372. [CrossRef]
- Guo, X.; Liu, J.; Albert, C.; Hong, X. C. Audio-visual interaction and visitor characteristics affect perceived soundscape restorativeness: Case study in five parks in China. Urban For Urban Green 2022, vol. 77, 127738. [CrossRef]
- Garzón, L.; Bravo-Moncayo, L.; Arellana, J.; Ortúzar, J. de D. On the relationships between auditory and visual factors in a residential environment context: A SEM approach. Front Psychol 2023, vol. 14, 1080149. [CrossRef]
- Li, H.; Lau, S.-K. A review of audio-visual interaction on soundscape assessment in urban built environments. Applied Acoustics 2020, vol. 166, 107372. [CrossRef]
- Domenighini, P.; Belloni, E.; Buratti, C. Experimental subjective and objective analysis of speech intelligibility and acoustic comfort conditions in an unchanged XVII century Italian church. Applied Acoustics, 2023, vol. 205, 109267. [CrossRef]
- Laplace, J.; Guastavino, C. Exploring sonic experiences in church spaces: a psycholinguistic analysis. Senses and Society 2022, vol. 17, no. 3, 343–358. [CrossRef]
- Estika, N. D.; Kusuma, H. E.; Tampubolon, A. C.; Widyawan, F. B. User’s Perceptions of Sacredness (Case Study: Catholic Churches in Indonesia). Dimensi: Journal of Architecture and Built Environment 2021, vol. 48, no. 1, 37–46. [CrossRef]
- Cerny, B. A.; Kaiser, H. F. A Study Of A Measure Of Sampling Adequacy For Factor-Analytic Correlation Matrices. Multivariate Behav Res 1977, vol. 12, no. 1, 43–47. [CrossRef]
- Hong, J. Y.; Jeon, J. Y. Influence of urban contexts on soundscape perceptions: A structural equation modeling approach. Landsc Urban Plan 2015, vol. 141, 78–87. [CrossRef]
- Hair Jr., J. F.; Hult, G. T. M.; Ringle, C. M.; Sarstedt, M.; Danks, N. P.; Ray, S. Partial Least Squares Structural Equation Modeling (PLS-SEM) Using R, 1st ed.; Springer Nature: Cham, Switzerland, 2021, p. 197. [CrossRef]
- Abadía, L. Prediction of Acoustic Parameters in Jesuit Churches in Cordoba and San Ignacion Mini. PENSUM, 2017, vol. 3, no. 3, 119–140.
- Farina, A. Acoustic quality of theatres: correlations between experimental measures and subjective evaluations. Applied Acoustics 2001, vol. 62, no. 8, 889–916. [CrossRef]
Figure 1.
Ground plan of the three churches studied, including source and receiver positions used.
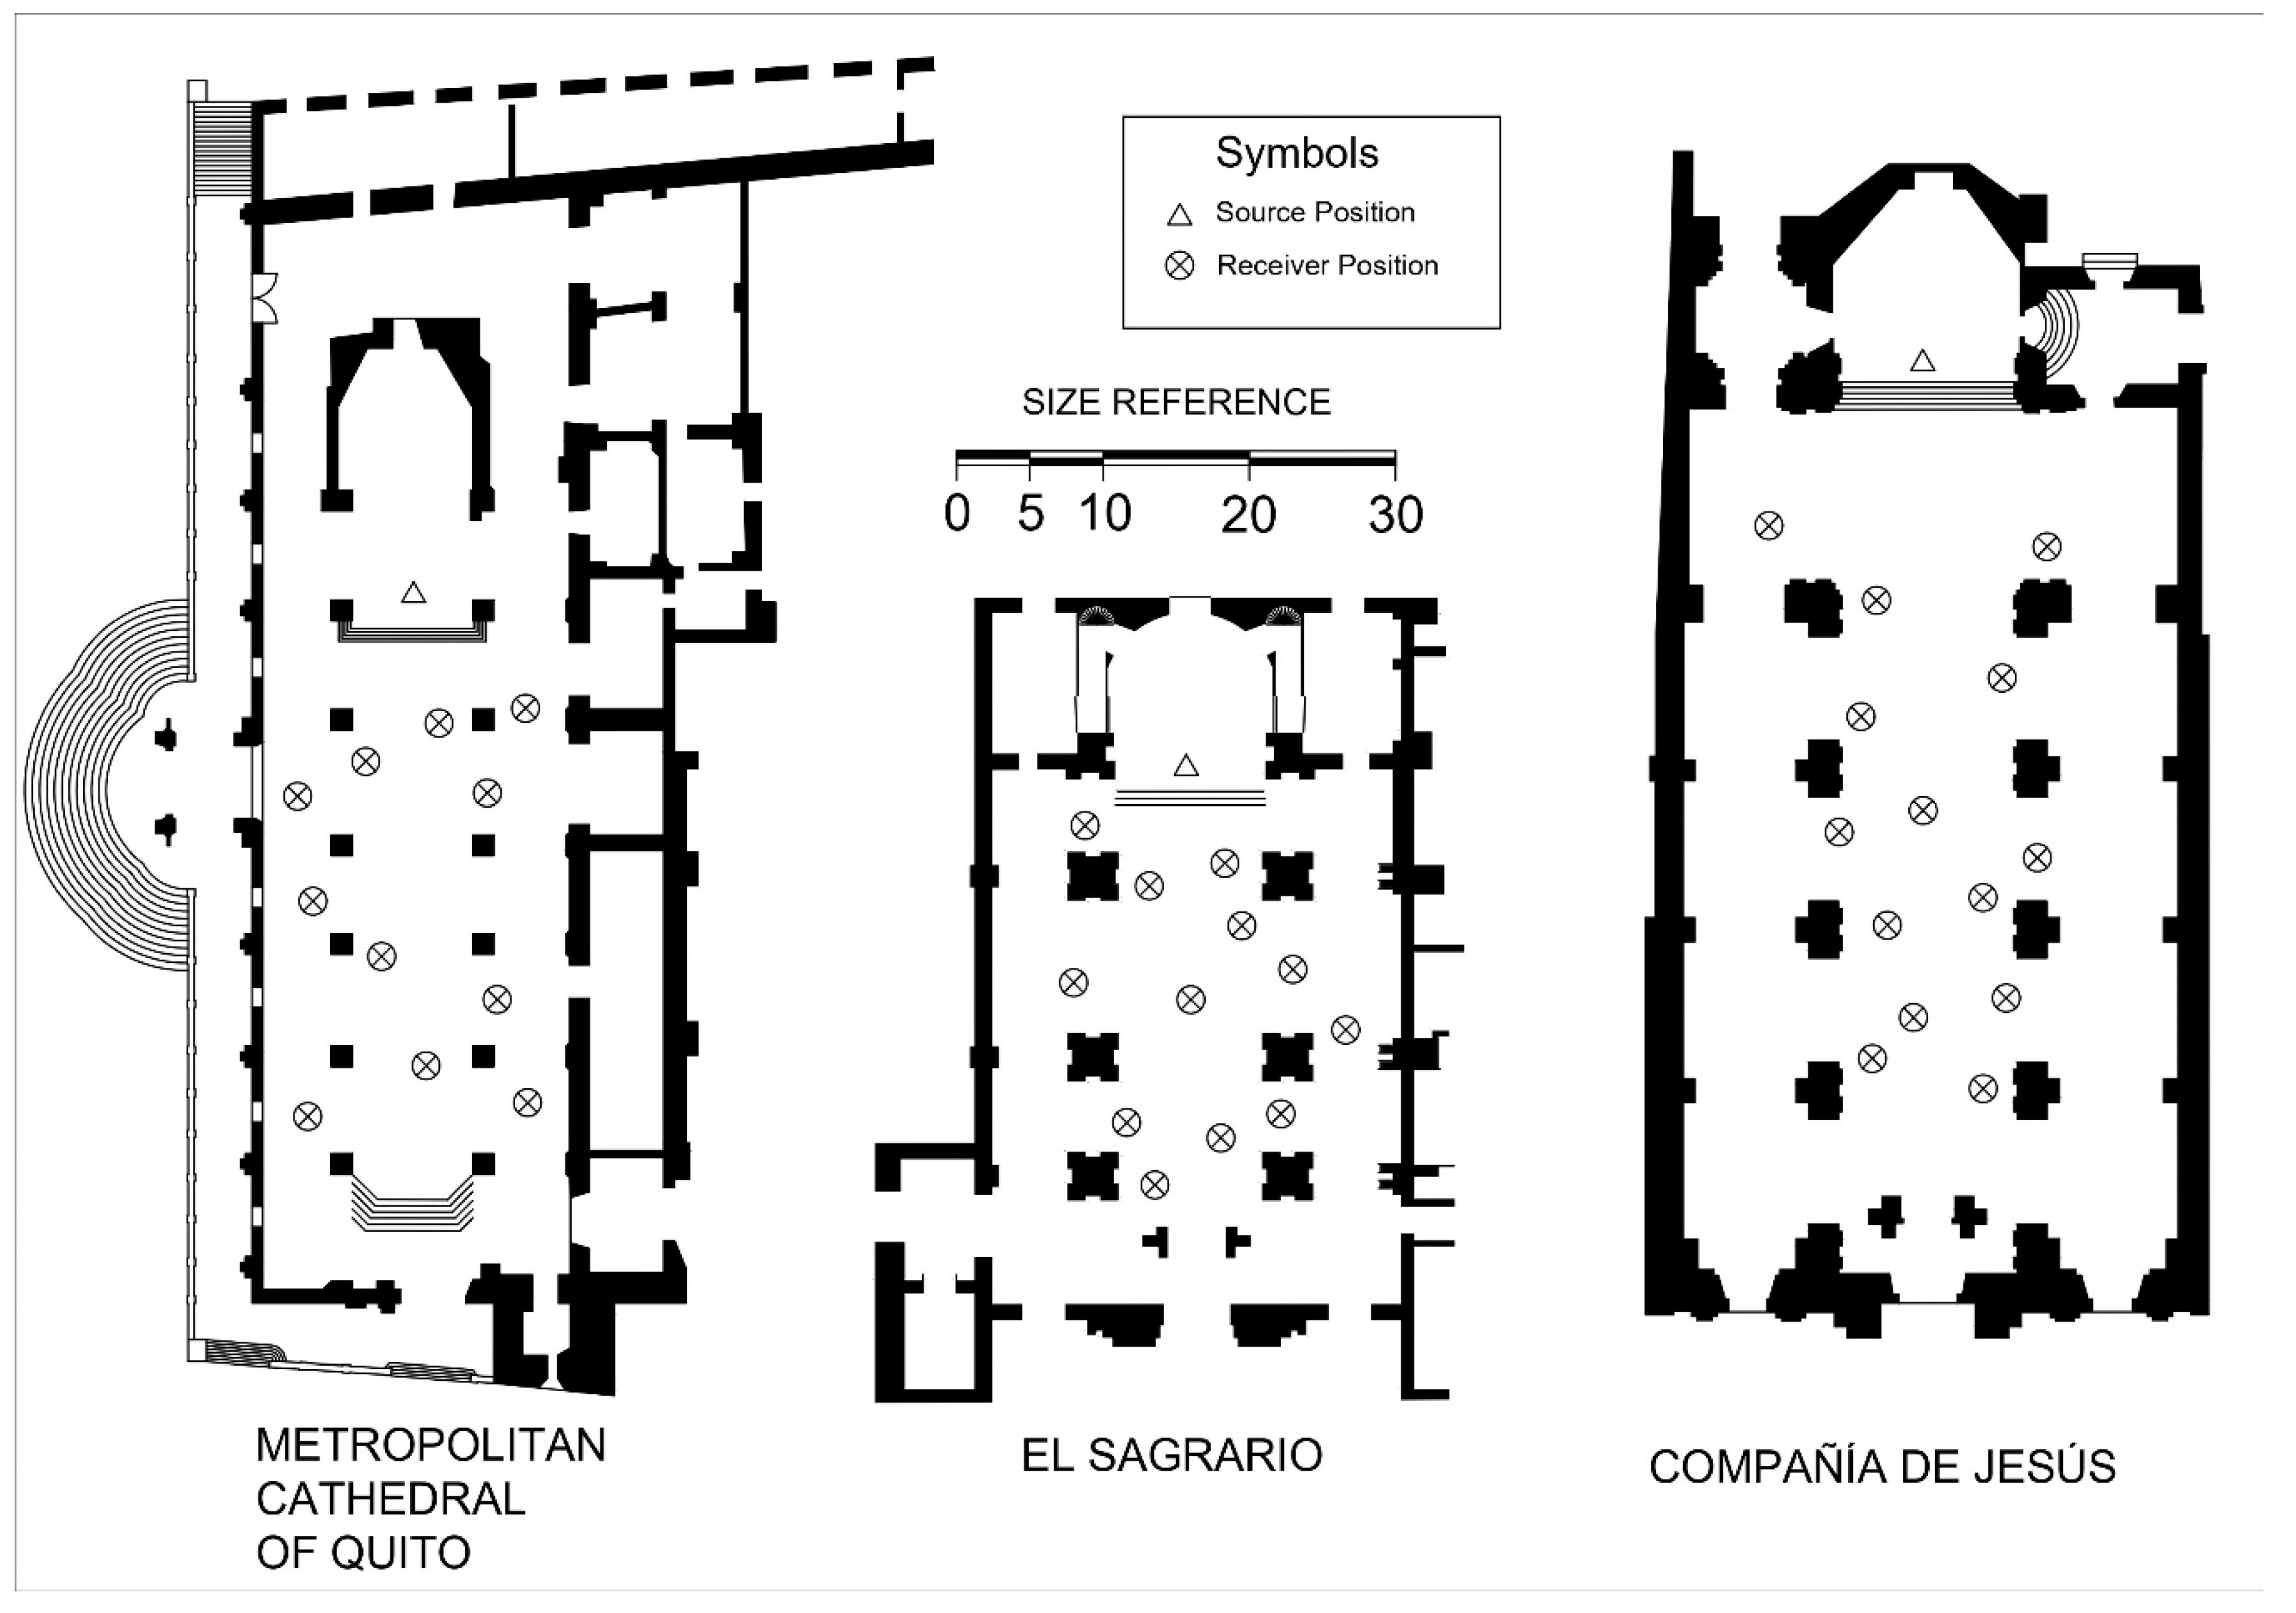
Figure 2.
Photographs of the exterior and interior of the churches.
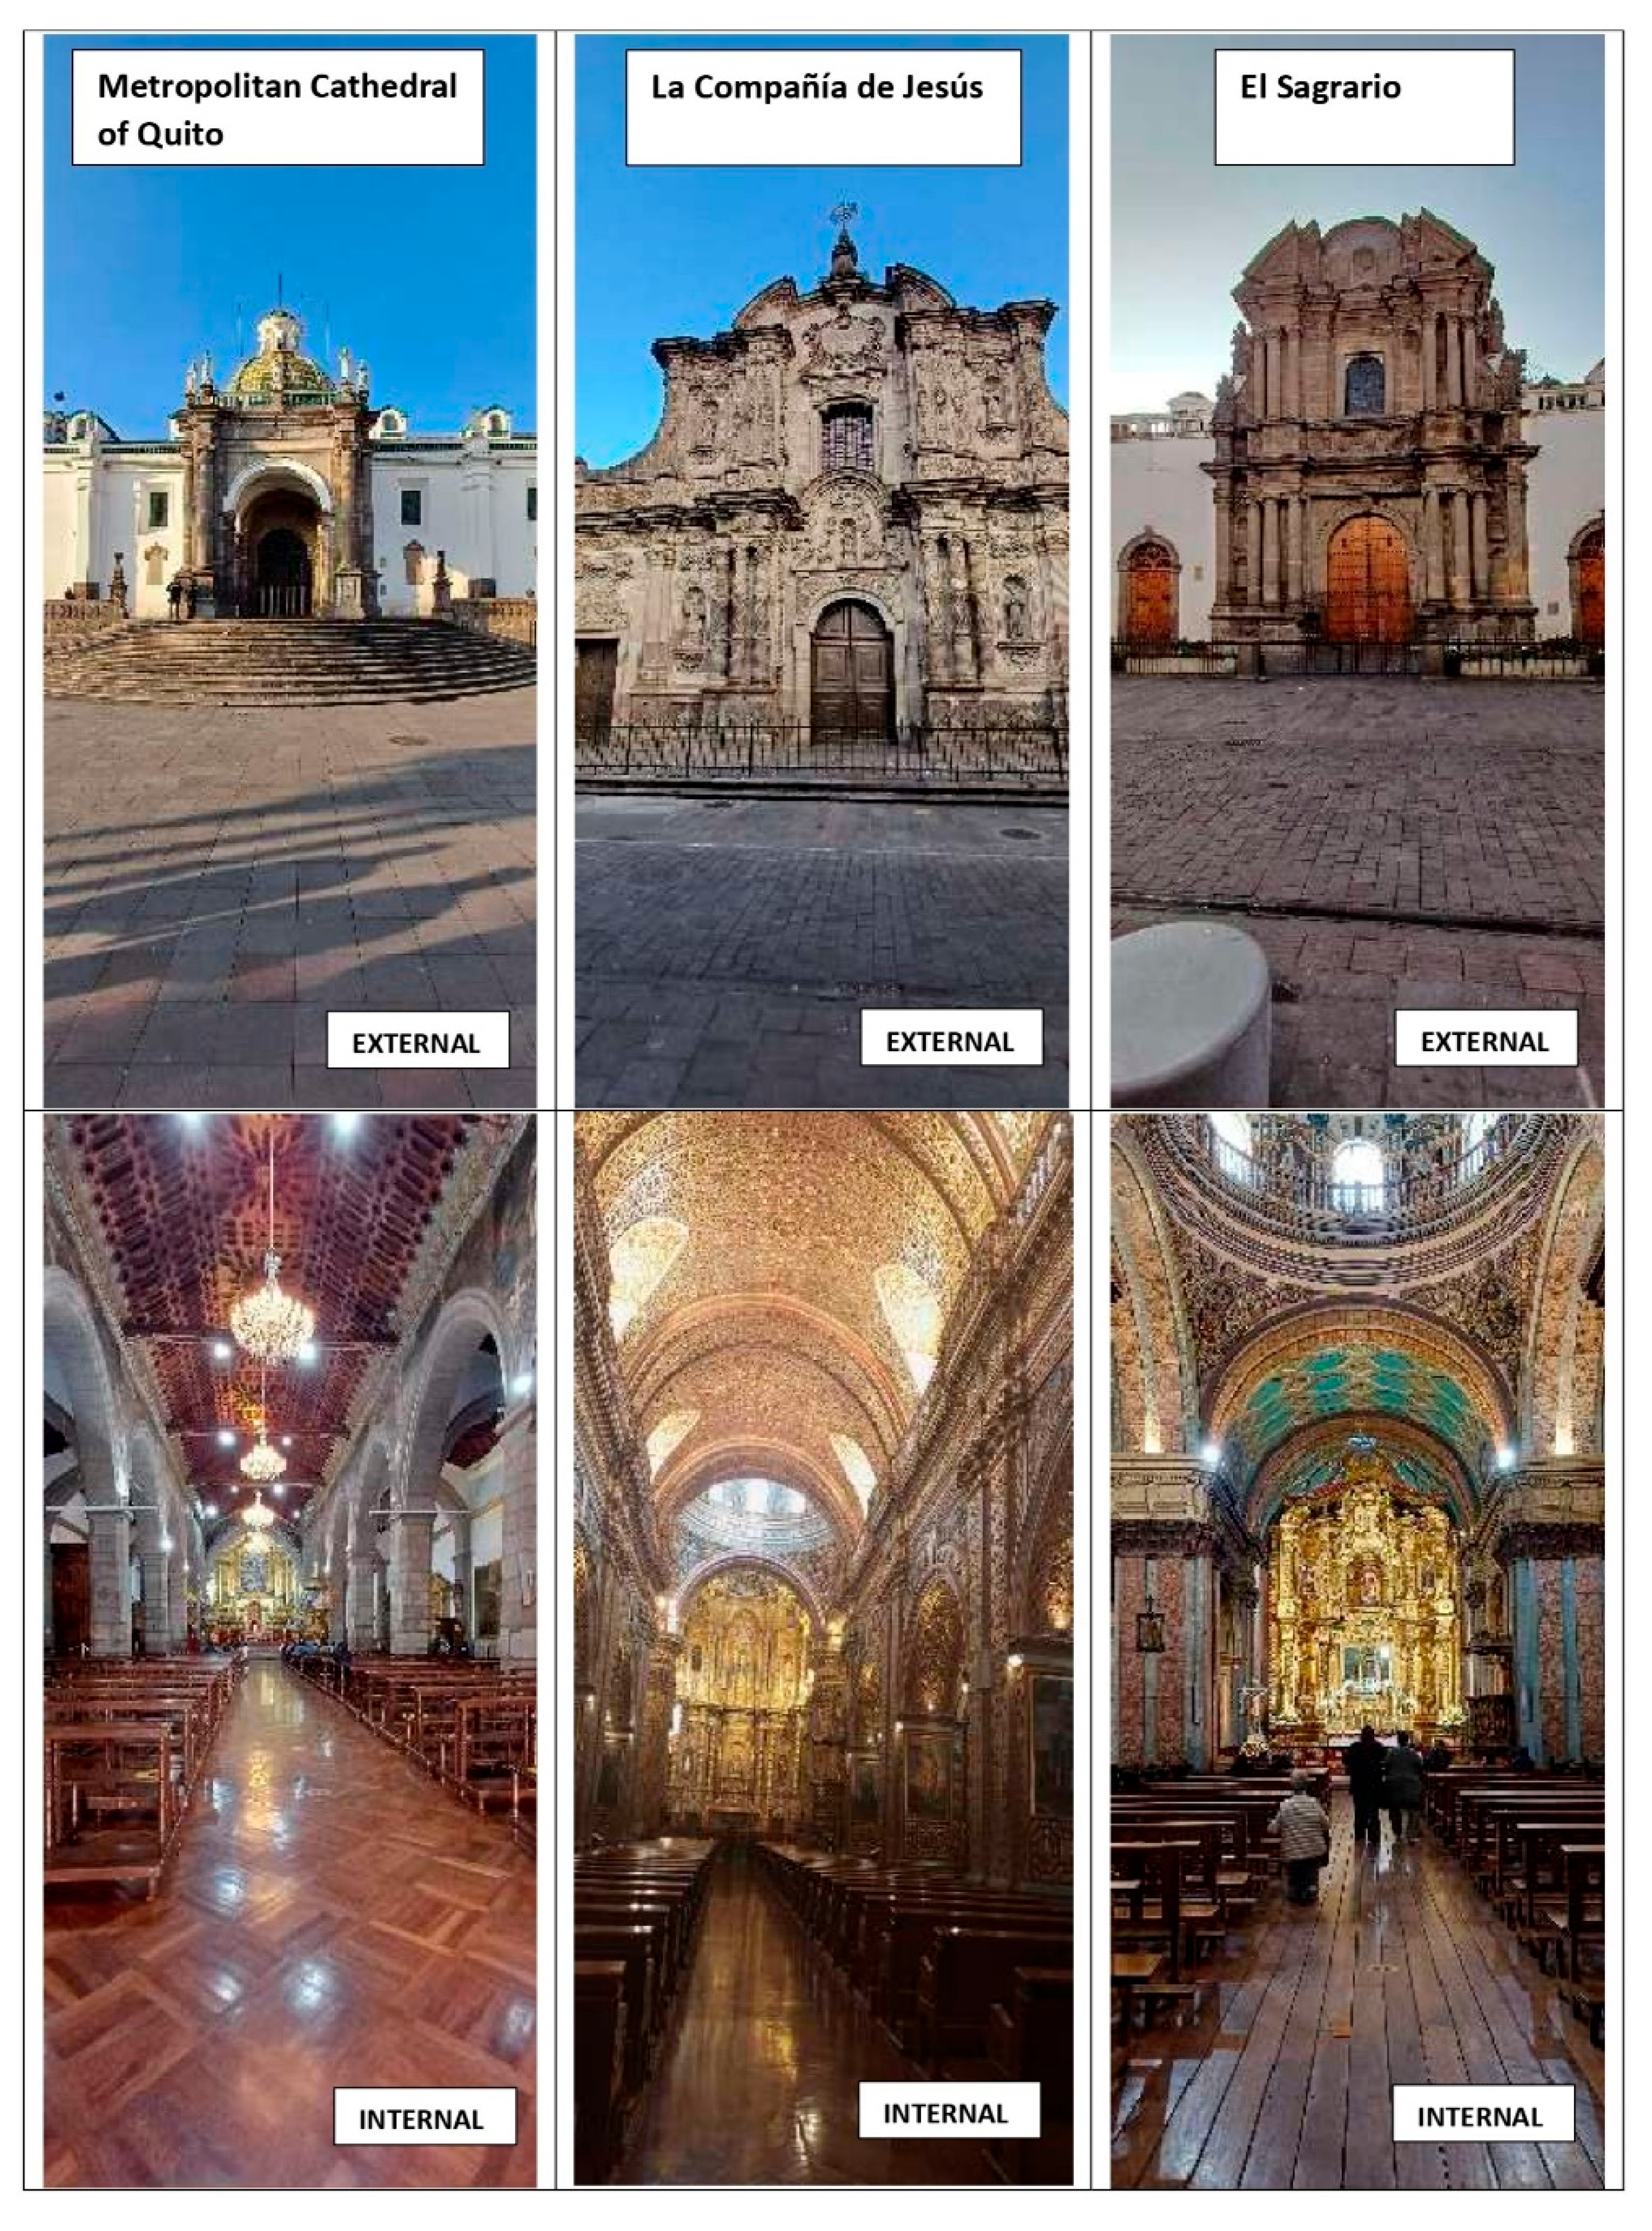
Figure 3.
Diagram of measurement’s setup. Elements: 1. Computer running software (EASERA v1.2); 2. M-Audio Mtrack II Audio Interface; 3. Measurement microphone (Beyerdynamic MM1); 4. Binaural dummy head (Neumann KU100); 5. omnidirectional sound source (CESVA BP012).
Figure 3.
Diagram of measurement’s setup. Elements: 1. Computer running software (EASERA v1.2); 2. M-Audio Mtrack II Audio Interface; 3. Measurement microphone (Beyerdynamic MM1); 4. Binaural dummy head (Neumann KU100); 5. omnidirectional sound source (CESVA BP012).
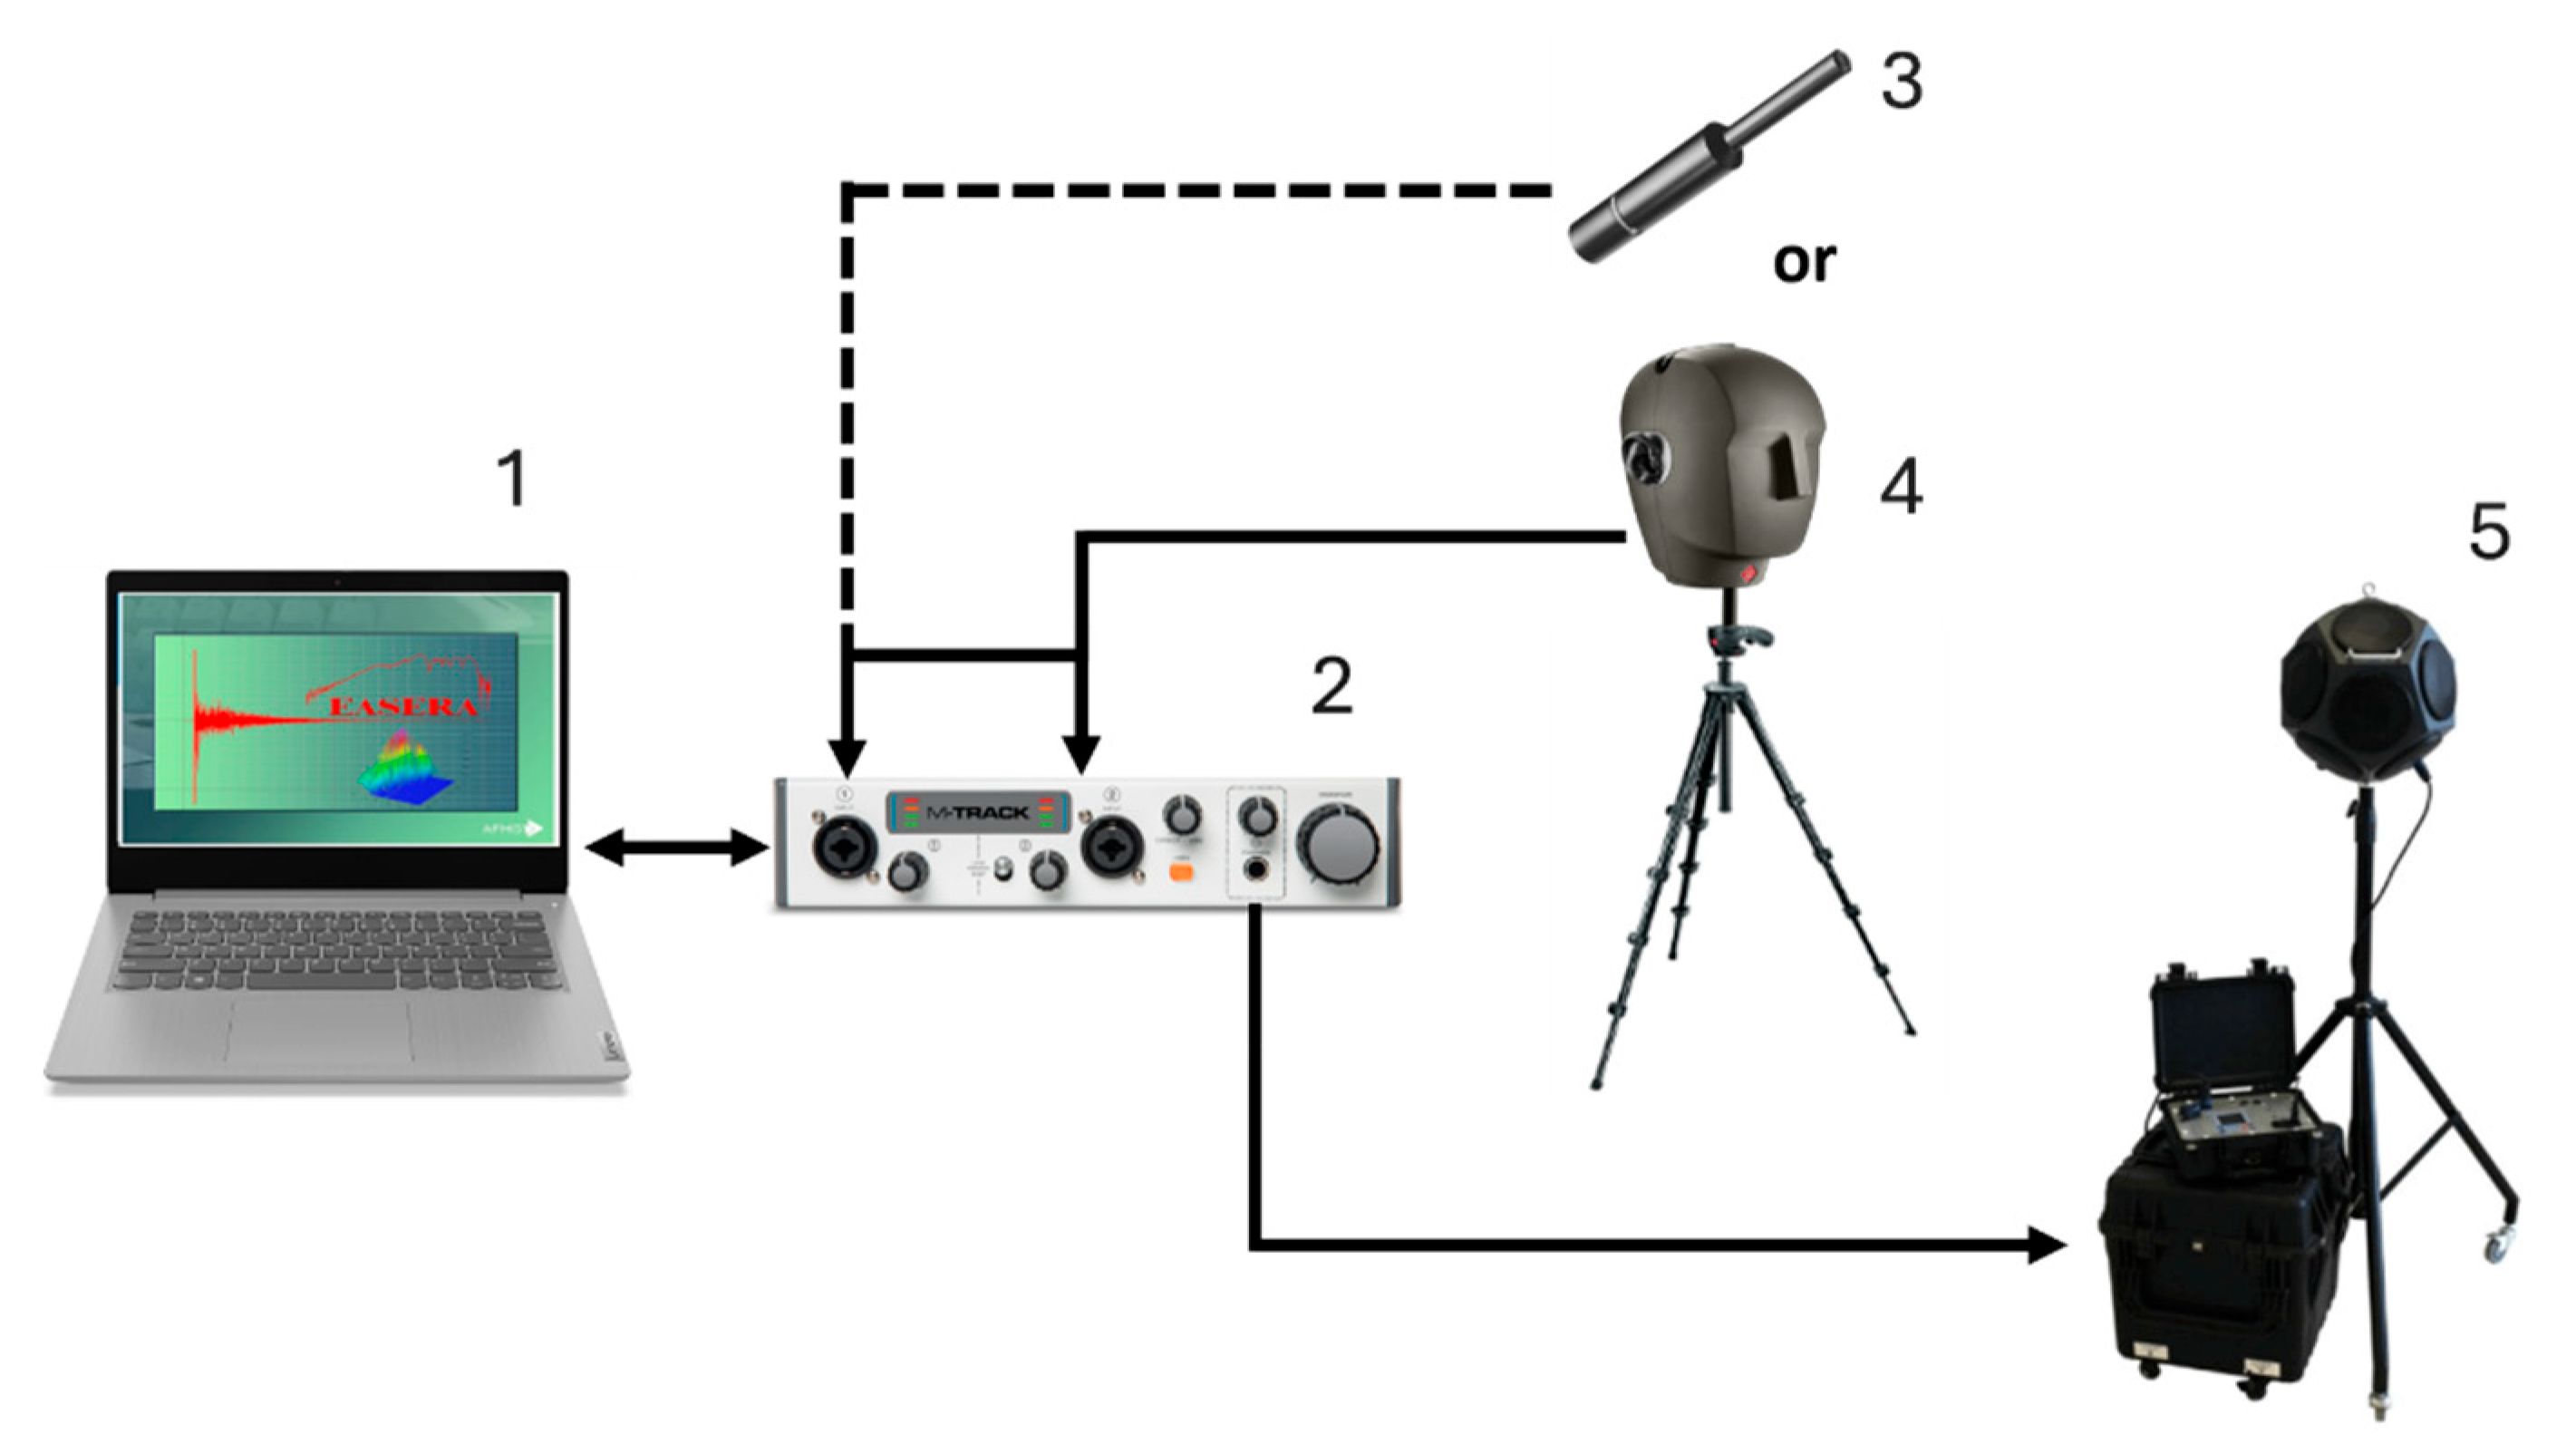
Figure 4.
Proposed theoretical model.

Figure 5.
Reverberation time (RT) measured in one-octave frequency bands at each church.

Figure 6.
Interaural Cross-Correlation Coefficient (IACC) measured in one-octave frequency bands at each church.
Figure 6.
Interaural Cross-Correlation Coefficient (IACC) measured in one-octave frequency bands at each church.
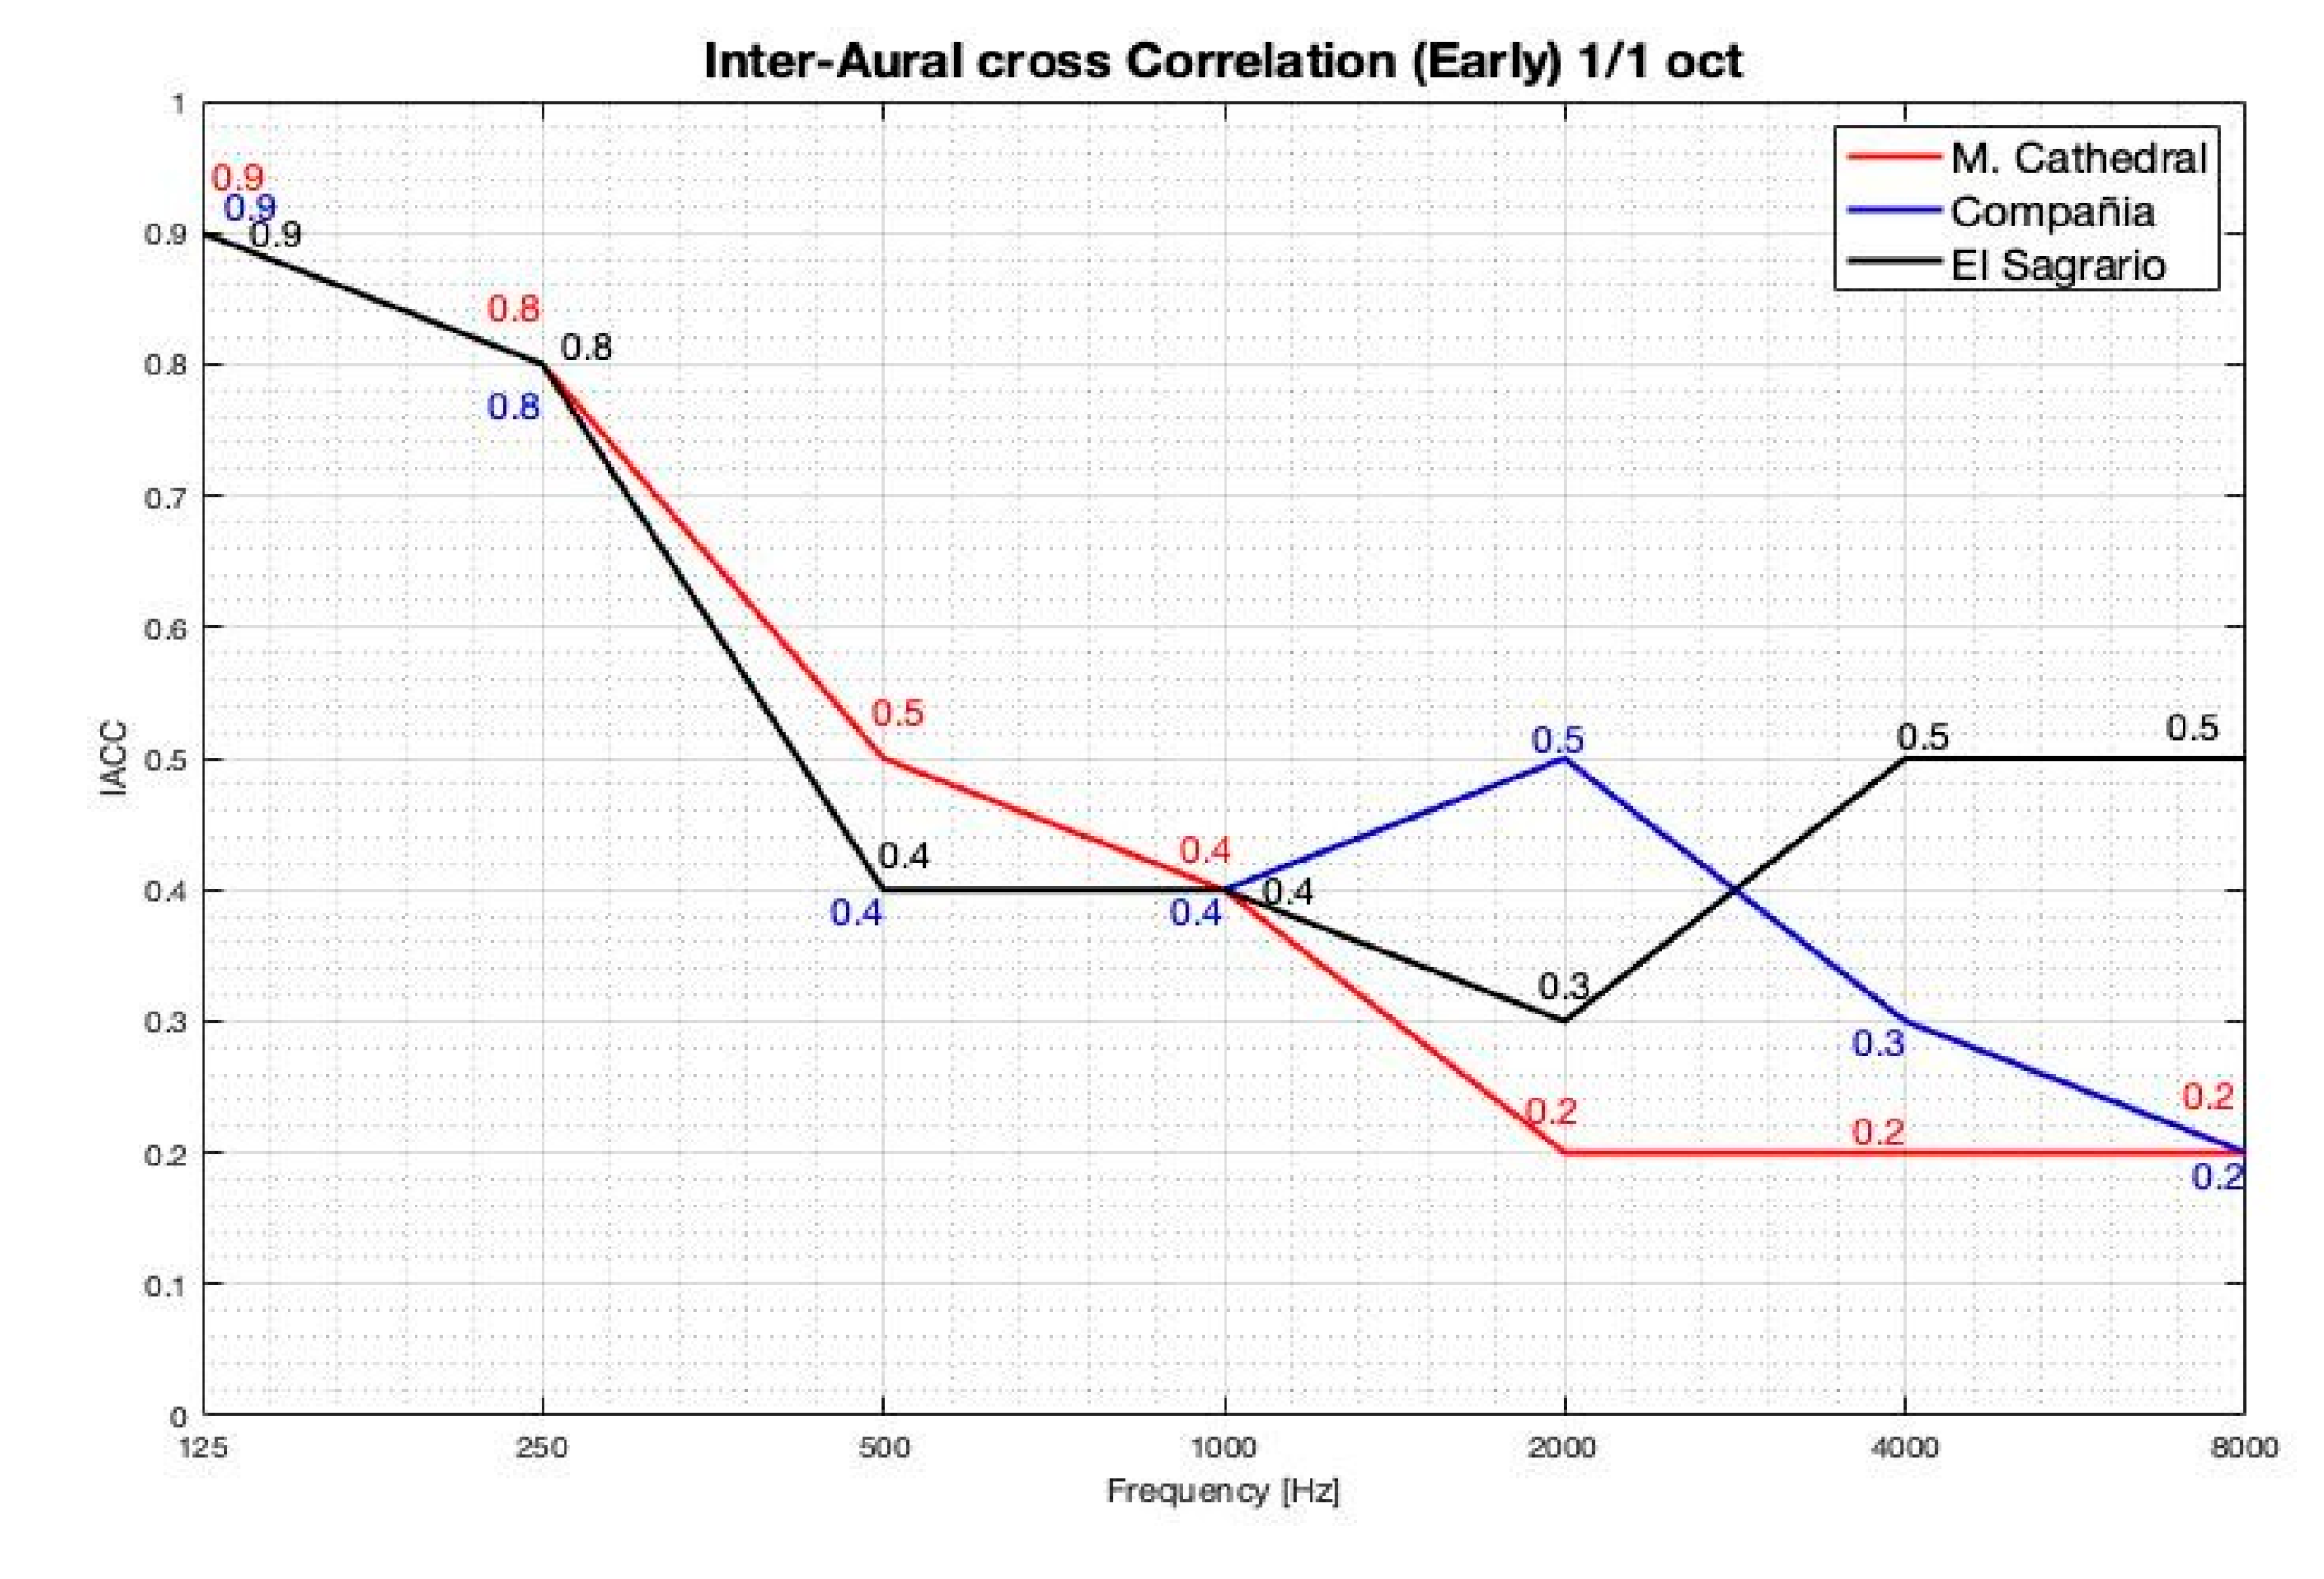
Figure 7.
Structural model results.
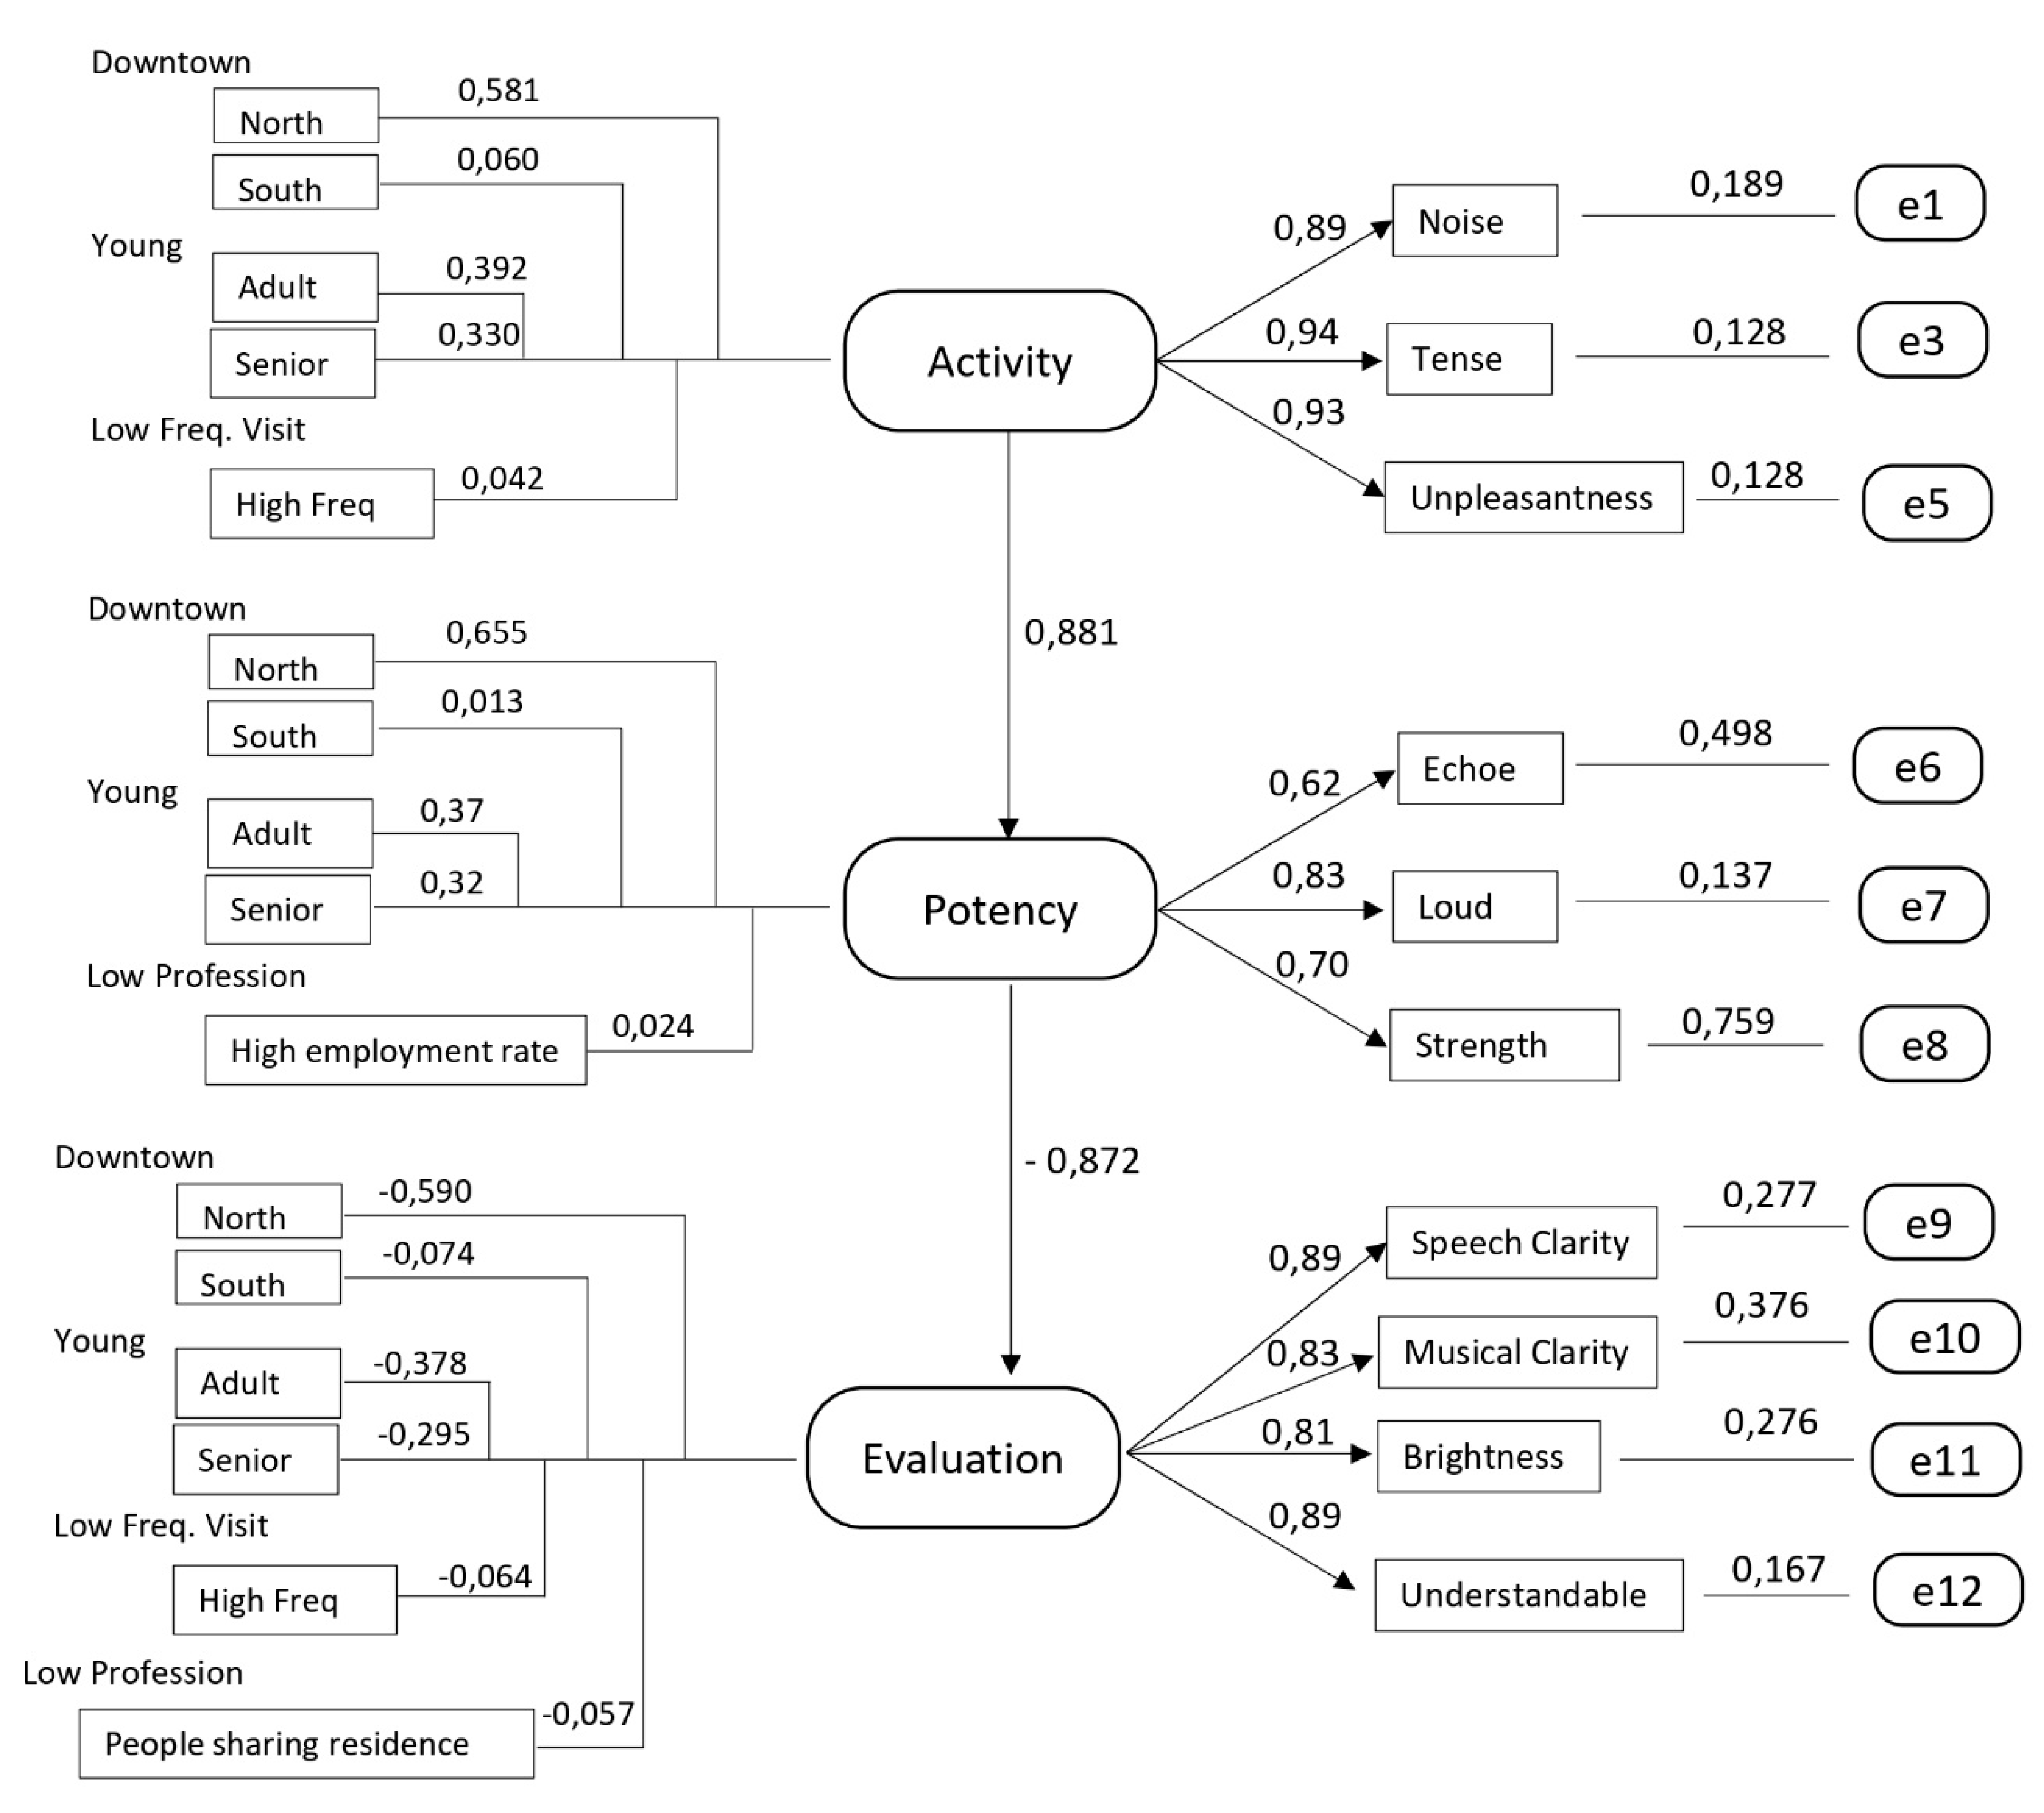

Table 1.
Main attributes of the studied churches in Quito, Ecuador.
| Church | Architectural Style | Volume (m3) | Dimension L x W (m) | Height (m) | Description |
| La Compañía | Baroque, Rococo. 16th century |
30,240 | 63 x 30 | 16 | Plank hardwood flooring, Gold leaf coffered ceiling, Gold leaf altarpieces wall, Stone and plaster columns. |
| Metropolitan Cathedral | Baroque, Rococo. 16th century |
31,500 | 70 x 25 | 18 | Plank hardwood flooring, Wooden coffered ceiling, Plaster walls with oil paintings, Stone columns. |
| El Sagrario | Baroque, Rococo. 18th century |
16,512 | 43 x 24 | 16 | Suspended plank flooring, Plaster ceiling, Gold leaf altarpieces wall, Stone and plaster columns. |
Table 2.
Elements of the applied questionnaire.
| Part | Question (Latent variable) | Scale type |
| I: Personal background/sociodemographic | Gender, Age, Educational level, Occupation, Family size, Residence Zone, Frequency of visit, Purpose of visit |
Categorical |
| II: Acoustic perceptions | Speech clarity, Musical clarity, Quality, Intelligibility, Reverberation/Echo | Five-point Likert scale |
| III: Soundscape perceptions |
E: Opacity, Brightness, Treble, Bass, Understandable, Confusing P: Silence, Noise, Lightness, Intensity, Strength, Weakness A: Tranquility, Noise, Relaxation, Strain, Pleasure, Displeasure |
Five-point Likert scale |
Table 3.
Input variables used in the model.
| Module | Variable | Range - Codes |
| Sociodemographic | Gender | Female (0) - Male (1) |
| Age | 15–25 (1), 26–35 (2), 36–45 (3), 46–55 (4), | |
| 65 (5), >65 (6) | ||
| Educational level | Categorical | |
| Occupation | Categorical | |
| Family size | Categorical | |
| Residence zone | Categorical | |
| Frequency of visit | Categorical | |
| Purpose of visit | Categorical | |
| Acoustic perceptions | Speech clarity | Lowest (1) - highest (5) |
| Music clarity | Lowest (1) - highest (5) | |
| General quality | Lowest (1) - highest (5) | |
| Intelligibility | Lowest (1) - highest (5) | |
| Reverberation/Echo | Lowest (1) - highest (5) | |
| Soundscape perceptions | Opacity | Lowest (1) - highest (5) |
| (Evaluation) | Brightness | Lowest (1) - highest (5) |
| Bass | Lowest (1) - highest (5) | |
| Treble | Lowest (1) - highest (5) | |
| Confused | Lowest (1) - highest (5) | |
| Understandable | Lowest (1) - highest (5) | |
| (Potency) | Quiet | Lowest (1) - highest (5) |
| Loudness | Lowest (1) - highest (5) | |
| Light | Lowest (1) - highest (5) | |
| Intense | Lowest (1) - highest (5) | |
| Weakness | Lowest (1) - highest (5) | |
| Strength | Lowest (1) - highest (5) | |
| (Activity) | Noise | Lowest (1) - highest (5) |
| Tranquility | Lowest (1) - highest (5) | |
| Tense | Lowest (1) - highest (5) | |
| Relaxed | Lowest (1) - highest (5) | |
| Unpleasant | Lowest (1) - highest (5) | |
| Pleasant | Lowest (1) - highest (5) |
Table 4.
Average results of the acoustic parameters (standard deviation).
| Parameters |
Metropolitan Cathedral |
La Compañía | El Sagrario |
| RT[s] | 2.4 (0.06) | 2.1 (0.08) | 2.6 (0.03) |
| EDT [s] | 2.5 (0.07) | 2.4 (0.23) | 2.6 (0.06) |
| C50 | -4.7 (0.52) | -4.3 (0.11) | -4.5 (0.38) |
| C80 | -2.8 (0.36) | -2.0 (0.11) | -3.6 (0.90) |
| D | 0.3 (0.02) | 0.3 (0.05) | 0.3 (0.02) |
| L80 [dB] | 97.7 (0.63) | 100.0 (0.73) | 99.3 (0.27) |
| AlCons [%] | 20.2 (0.66) | 17.8 (0.30) | 17.8 (0.24) |
| STI | 0.4 (0.02) | 0.4 (0.04) | 0.4 (0.01) |
| STI (Male) | 0.4 (0.02) | 0.4 (0.04) | 0.4 (0.01) |
| STI (Female) | 0.4 (0.02) | 0.4 (0.04) | 0.4 (0.01) |
| RASTI | 0.3 (0.01) | 0.4 (0.04) | 0.3 (0.03) |
| IACC (Full) | 0.3 (0.05) | 0.4 (0.07) | 0.4 (0.03) |
| IACC (Early) | 0.5 (0.07) | 0.5 (0.07) | 0.5 (0.05) |
| IACC (Late) | 0.3 (0.07) | 0.3 (0.04) | 0.3 (0.02) |
Table 5.
Results of the Exploratory Factor Analysis (EFA).
| Indicators | MSA | Factor loading | Variance explained (%) |
| Factor 1: Activity | 35 | ||
| I3. Noise | 0.82 | 0.89 | |
| I4. Tense | 0.74 | 0.94 | |
| I7. Unpleasantness | 0.75 | 0.93 | |
| Factor 2: Potency | 19 | ||
| I8. Reverberation/Echo | 0.89 | 0.62 | |
| I10. Loudness | 0.71 | 0.83 | |
| I14. Strength | 0.87 | 0.7 | |
| Factor 3: Evaluation | 20 | ||
| I15. Speech clarity | 0.78 | 0.89 | |
| I16. Music clarity | 0.78 | 0.83 | |
| I19. Brightness | 0.78 | 0.81 | |
| I23. Understandability | 0.78 | 0.89 |
Table 6.
Results of the Confirmatory Factor Analyses (CFA)
| Latent variable | Std. factor loading | AVE | CR | Cronbach’s alpha | MSV | ASV |
| Activity η1 | 0.851 | 0.851 | 0.94 | 0.891 | 0.868 | |
| I3. Noise | 0.900 | |||||
| I5. Tense | 0.934 | |||||
| I7. Unpleasantness | 0.934 | |||||
| Potency η2 | 0.536 | 0.536 | 0.744 | 0.845 | 0.840 | |
| I8. Reverberation/Echo | 0.706 | |||||
| I10. Loudness | 0.935 | |||||
| I14. Strength | 0.485 | |||||
| Evaluation η3 | 0.726 | 0.726 | 0.908 | 0.891 | 0.853 | |
| I15. Speech clarity | 0.883 | |||||
| I16. Music clarity | 0.791 | |||||
| I19. Brightness | 0.850 | |||||
| I22. Understandability | 0.912 |
Table 7.
SEM Measurement and Regression.
| Measurement | Estimate | Standard Error | p-value | Standardized estimate |
| Activity η1 | ||||
| I3. Noise | 1.023 | 0.03 | < 0.001 | 0.9 |
| I5. Tense | 0.954 | 0.02 | < 0.001 | 0.934 |
| I7. Unpleasantness | 0.868 | 0.02 | < 0.001 | 0.934 |
| Potency η2 | ||||
| I8. Reverberation/Echo | 0.645 | 0.03 | < 0.001 | 0.709 |
| I10. Loudness | 1.041 | 0.03 | < 0.001 | 0.929 |
| I14. Strength | 0.346 | 0.02 | < 0.001 | 0.491 |
| Evaluation η3 | ||||
| I15. Speech clarity | 0.686 | 0.02 | < 0.001 | 0.851 |
| I16.Music clarity | 0.656 | 0.02 | < 0.001 | 0.79 |
| I19. Brightness | 0.923 | 0.03 | < 0.001 | 0.851 |
| I22. Understandability | 0.9 | 0.02 | < 0.001 | 0.913 |
Table 8.
Goodness-of-fit of the tested model and recommended values (N=1,214).
| Model fit metric | χ2 SB /df | CFI | TLI | RMSEA | SRMR |
| Modified model | 8.84 | 0.905 | 0.873 | 0.082 | 0.047 |
| Recommended | < 5.0 | >0.90 | >0.90 | < 0.08 | < 0.05 |
Table 9.
Hypothesis testing results.
| Hypothesis | S.D. | T-value | p-Value | Decision | |
| HA A → P | 0.881 | 0.015 | 56.958 | <0.001*** | Accepted |
| HB P → E | -0.872 | 0.02 | -52.89 | <0.001*** | Accepted |
| HC1 Age (adult) → A | 0.392 | 0.137 | 7.257 | <0.001*** | Accepted |
| HC1 Age (senior) → A | 0.33 | 0.14 | 6.20 | <0.001*** | Accepted |
| HC1 High freq. visits → A | 0.042 | 0.09 | 2.54 | <0.05** | Accepted |
| HC1 Age (adult) → P | 0.374 | 0.16 | 6.82 | <0.001*** | Accepted |
| HC1 Age (senior) → P | 0.32 | 0.15 | 5.89 | <0.001*** | Accepted |
| HC1 High employment rate → P | 0.024 | 0.11 | 1.43 | 1.43 | Rejected |
| HC1 Age (adult) → E | -0.378 | 0.14 | -6.93 | <0.001*** | Accepted |
| HC1 Age (senior) → E | -0.295 | 0.14 | -5.50 | <0.001*** | Accepted |
| HC1 High freq. visits → E | -0.064 | 0.09 | -3.70 | <0.001*** | Accepted |
| HC1 People sharing residence → E | -0.057 | 0.04 | -4.30 | <0.001*** | Accepted |
| HC2 Location (North) → A | 0.581 | 0.083 | 18.05 | <0.001*** | Accepted |
| HC2 Location (South) → A | 0.06 | 0.116 | 2.31 | <0.05** | Accepted |
| HC2 Location (North) → P | 0.655 | 0.10 | 19.57 | <0.001*** | Accepted |
| HC2 Location (South) → P | 0.013 | 0.12 | 0.54 | 0.54 | Rejected |
| HC2 Location (North) → E | -0.59 | 0.09 | -17.98 | <0.001*** | Accepted |
| HC2 Location (South) → E | -0.074 | 0.12 | -2.83 | <0.001*** | Accepted |
Disclaimer/Publisher’s Note: The statements, opinions and data contained in all publications are solely those of the individual author(s) and contributor(s) and not of MDPI and/or the editor(s). MDPI and/or the editor(s) disclaim responsibility for any injury to people or property resulting from any ideas, methods, instructions or products referred to in the content. |
© 2025 by the authors. Licensee MDPI, Basel, Switzerland. This article is an open access article distributed under the terms and conditions of the Creative Commons Attribution (CC BY) license (http://creativecommons.org/licenses/by/4.0/).
Copyright: This open access article is published under a Creative Commons CC BY 4.0 license, which permit the free download, distribution, and reuse, provided that the author and preprint are cited in any reuse.


