
Submitted:
05 June 2025
Posted:
09 June 2025
You are already at the latest version
Abstract
This study examined the efficacy and mechanisms underlying biological activities of IBCar in several in vitro and in vivo breast cancer models and in cells derived from normal tissues. The IBCar’s effectiveness was demonstrated across a diverse range of BCa cell lines, including those with mutant and wild-type TP53 as well as cell lines with short and long doubling times. Comparative analysis of IBCar’s effects on normal versus cancer cells revealed distinct responses, including differences in endoplasmic reticulum stress, mitochondrial membrane potential, and cell death pathways. IBCar is cytotoxic to breast cancer cells at nM concentrations and induces apoptosis. In normal cells, the key protective mechanisms in response to IBCar appear to involve reversible microtubule depolymerization and pro-survival adaptations within the caspase-8 and ripoptosome pathways. IBCar-induced irreversible microtubule depolymerization, leading to mitochondrial dysfunction and endoplasmic reticulum stress, was observed in cancer cells but not in normal cells, highlighting its selective cytotoxicity. The therapeutic efficacy of IBCar was further validated in mouse models of triple-negative and Luminal B breast cancers. In both models, IBCar exhibited strong antitumor activity without inducing observable toxicity. Overall, these findings support the potential of IBCar as an effective and non-toxic alternative for breast cancer treatment.
Keywords:
breast cancer
; therapy
; nontoxic
; oral
; microtubule-targeted agents
; benzimidazole carbamates
1. Introduction
Breast cancer (BCa) is the second leading cause of death from cancer in women [1] and accounts for 25% of all cancers in women. Globally, an estimated 2.3 million new cases of breast cancer are diagnosed each year [2,3]. Estimated 316,950 new cases of invasive breast cancer and 59,080 of ductal carcinoma in situ will be diagnosed in the United States in 2025. Approximately 42,250 women will die from BCa. The likelihood of a woman being diagnosed with breast cancer during her lifetime has increased from 1 in 11 in 1975 to 1 in 8 today [4,5].
Development of metastasis is the most serious aspect of BCa sequelae, and this stage is the most difficult to treat. In the majority of cases, metastatic breast cancer (mBCa) develops after a series of failed therapies and so, predictably, metastatic cancer cells acquire resistance to these therapies. Alarmingly, between 2004 and 2021, the incidence of distant-stage (metastatic) disease at diagnosis rose significantly among newly diagnosed breast cancer patients across all age groups, with the most pronounced increase observed in women aged 20–39 years [6].
Metastatic breast cancer (mBCa) is the leading cause of breast cancer-related mortality, accounting for nearly 90% of all deaths from the disease. The median survival of patients with mBCa is approximately three years, with little improvement observed over the past two decades [1,7,8]. Despite recent advances, mBCa remains incurable. Systemic chemotherapy continues to be the cornerstone of most treatment regimens; however, many drugs eventually lose efficacy due to the primary or acquired resistance. This resistance contributes to refractory disease, therapeutic failure, and ultimately, patient death. Overall response rates for second- and third-line therapies in previously treated mBCa patients range from approximately 10% to 35% [9,10,11,12].
There is an urgent need for safe and effective therapies for patients with mBCa, particularly those whose health and immune function have been compromised by multiple prior treatments. To improve survival outcomes and effectively eliminate breast cancer cells, new therapies must be safer and capable of overcoming drug resistance. Given the clinical success of vinca alkaloids, taxanes, and newer microtubule targeting agents such as eribulin [13,14,15] or ixabepilone [16,17,18], it is evident that microtubules (MTs) remain an excellent target for drug development. Dynamic MTs are assembled from α- and β-tubulin heterodimers, two highly conserved proteins that are present in all eukaryotic organisms. MTs play a fundamental role in diverse cellular functions including cell division, growth and motility [19,20,21,22]. The category of MT-targeted drugs comprises diverse agents that interfere with MTs dynamics, by either stabilizing or destabilizing tubulin polymers, arrest cell cycle progression and lead to cell death [23,24,25]. Several of these agents were approved for cancer treatment >50 years ago and are still the second most used class of chemotherapeutics [23,26,27]. However, their utility is often limited by the primary or acquired resistance and side effects, which can be severe and irreversible. Approximately 30% - 40% of BCa patients treated with conventional anticancer therapies develop chemotherapy-induced peripheral neurotoxicity (CIPN), a common and debilitating side effect that significantly reduces quality of life. CIPN remains one of the most challenging adverse effects of chemotherapy and a major limiting factor in the treatment of BCa. [28]. It is a persistent morbidity that affects approximately 20%–30% of BCa patients long into survivorship, often presenting as a chronic and highly pharmacoresistant condition [29,30,31,32]. CIPN can arise after a single treatment or result from the cumulative effects of multiple agents. Its onset may necessitate dose reductions or even early discontinuation of chemotherapy- both of which can significantly compromise treatment efficacy and patient survival. In the United States, there are approximately 4 million BCa survivors, with nearly 1 million experiencing chronic, debilitating consequences from their treatment.
The development of therapies that are free from the toxicities associated with conventional treatments represents a critical unmet need in the care of BCa patients. This report focuses on a novel, non-toxic, microtubule-targeting compound, N-[5-(3'-iodobenzoyl)-1H-benzimidazol-2-yl]carbamate (IBCar), which shows potential to significantly improve mBCa therapy. The primary objective of the study was to evaluate the anti-BCa efficacy and safety of IBCar. Our findings strongly support the hypothesis that IBCar is a highly potent, orally bioavailable agent with demonstrated effectiveness across multiple in vitro and in vivo models of BCa. Furthermore, our research revealed a marked resistance of normal cells to IBCar and identified some key differences in the toxicity profiles between IBCar and vinca alkaloids in non-cancerous cells.
2. Materials and Methods
2.1. Cell Lines
Human breast cancer (BCa) cell lines BT-549, HCC70, MDA-MB-175-VII, MDA-MB-231, MDA-MB-361, and MDA-MB-468 were purchased from American Type Culture Collection (ATCC, Manassas, VA) and maintained in HyClone™ Dulbecco’s Modified Eagle’s Medium (DMEM) containing 4,500 mg/L glucose, 4.0 mM L-glutamine, and 110 mg/L sodium pyruvate, and supplemented with 10% fetal bovine serum (FBS). MCF-10A, a human epithelial cell line isolated from the fibrocystic breast, was also purchased from ATCC. Normal breast cells 76N, a human cell line derived from the mammary epithelial cells immortalized by human telomerase [33] was kindly contributed by Dr. Vimla Band (University of Nebraska Medical Center). MCF-10A and 76N were maintained in Mammary Epithelial Growth Medium (MEBM) supplemented with Bullet Kit from Lonza Bioscience (Morrisville, NC). Trypsin-EDTA (0.25%), Trypsin Neutralizing Solution, and sterile cell culture grade DMSO were obtained from VWR (Radnor, PA). Non-enzymatic cell dissociation solution in phosphate buffered saline (PBS) without calcium and magnesium was purchased from Sigma-Aldrich (St. Louis, MO). Cell proliferation was measured using the colorimetric MTS Assay Kit (Abcam, Boston, MA). Cell line characteristics are summarized in Table 1.
2.2. Chemicals, Reagents, and Antibodies
N-[5-(3'-iodobenzoyl)-1H-benzimidazol-2-yl]carbamate (IBCar), was synthesized, purified, and characterized as described previously [34,35,36]. Necrostatin-1 and vincristine were purchased from Selleck Chemicals (Houston, TX). Antibodies and their sources are listed in Supplementary Materials (Table S1). Positive control cell lysate standards were purchased from Santa Cruz Biotechnology (Dallas, TX). Gel electrophoresis, Western blotting supplies, and their sources are listed in Supplementary Materials (Table S2). NucBlue™ Live ReadyProbes™ reagent (Hoechst 33342); LIVE/DEAD™ Cell imaging kit (488/570); Tubulin Tracker™ Deep Red; and CellEvent™ Caspase-3/7 Green ReadyProbes™ reagents were purchased from Thermo Fisher Scientific (Waltham, MA). ION Vital-MitoVolt assay kit was from ION Biosciences (San Marcos, TX). MitoBrilliant™ Live 646 were from BioTechne-Tacris (Minneapolis, MN). Apoptotic, Necrotic and Healthy Cells quantitation kit was purchased from Biotium, Inc. (Fremont, CA). Cells were imaged in Fluorobrite DMEM (Life Technologies Corporation, Carlsbad, CA) or Invitrogen™ Live Cell Imaging solution (Thermo Fisher Scientific). Human HSP Array C1 was from RayBiotech (Norcross, GA). Cell lysis buffer (10×) and protease/phosphatase inhibitors (100×) were from Cell Signaling Technology (Danvers, MA). Pierce micro-BCA protein assay for total protein determination and Halt protease and phosphatase single-use inhibitor cocktails were purchased from Life Technologies Corporation (Carlsbad, CA).
2.3. Computational Methods
The crystal structure of human tubulin was downloaded from the Protein Data Bank (PDB ID: 6BRY, resolution: 2.70 Å) [37]. Water molecules, ions, stathmin-4, and tubulin tyrosine ligase were removed from the downloaded structure. Crystallographic disorders and unfilled valence atoms were repaired using AutoDock Tools 1.5.7 [38]. Polar hydrogens and Kolmann charges were added. The entire protein was designated rigid in the PDBQT file. IBCar in the PDB format was prepared using online software [38,39]. The AD4 atom types were assigned, polar hydrogens added, bond order was fixed, bonds renumbered, Gasteiger charges added, and file saved in the PDBQT format. A three-dimensional user-specified grid: 60 x-points × 60 y-points × 60 z-points grid with a spacing of 0.5 Å was centered at the αβ tubulin dimer. Affinity maps were calculated using AutoGrid 4.2.6. The Lamarckian genetic algorithm with a maximum of 2,500,000 energy evaluations was implemented in AutoDock4 [39]. Following the analysis command in the docking parameter file, AutoDock performed cluster analyses of the different docked conformations detecting the minimum energy in each run and selecting the 10 best-scoring solutions. Rmsd (root mean square deviation) cluster analysis was performed using only ligand atoms and outputting structurally similar clusters ranked in order of increasing energy. Seven distinct conformational clusters were found out of 10 runs using the rmsd-tolerance of 2.0 Å. Similar docking protocols were followed for colchicine and mebendazole to compare their binding energies and inhibition constants to IBCar (Table 2). Docking of three regioisomers of IBCar into the colchicine binding site of the αβ tubulin dimer is shown in Figure S1.
2.4. Cell Proliferation, GI50 Determination, and Cytotoxicity Assays
2.4.1. Cell Doubling Times
TDs were determined using a routine trypan blue exclusion method to count cells at 24 h, 48 h, 72 h and 96 h after plating (Nexcelom Cellometer Auto 1000 Brightfield Cell Counter). Doubling times TDs were calculated as: TD (hours) = (hours in culture - 24 h) × ln(2)/ln(number of cells harvested at time t/number of cells harvested at 24 h).
2.4.2. Cellular Metabolic Activity, MTS Assay and GI50 Determination.
Cells suspensions at 20,000-50,000 cells/mL (depending on the cell line) were seeded into 96-well plates (technical replicates n=6 per concentration) and allowed to attach for 24 h. A freshly prepared stock solution of IBCar in DMSO was used to prepare IBCar dilutions in full growth medium. Control cells received medium containing DMSO. Cell metabolic activity was analyzed after 24 h, 48 h and 72 h treatment. Spent medium was removed, monolayer washed with PBS, and fresh medium containing the MTS reagent was added. Cells were incubated for 30 min to 120 min under the standard culture conditions. Plates were shaken briefly and absorbance measured at 490 nm using the Opsys MR microplate reader (Dynex Technologies, Chantilly, VA).
2.4.3. Counting Cell Nuclei.
Cells grown in medium containing either IBCar or DMSO were washed once with PBS and twice with HBSS containing calcium and magnesium to remove non-adherent and dead cells. Hoechst 33342, a cell-permeant nuclear counterstain that emits blue fluorescence when bound to DNA (NucBlue™ Live ReadyProbes™ Reagent) was used for imaging. Two drops of NucBlue per 1 mL medium were added and cells were incubated for 30 min. At least three fields per concentration were imaged (λex = 350 nm; λem = 460 nm) and nuclei counted. This method alongside life/dead cell assay described below was used to validate the MTS assay results for the adherent cells that do not form colonies.
2.4.4. Life/Dead Cell Assays.
Cells treated with IBCar or DMSO (controls) were washed twice with FluoroBrite™ DMEM. SYTOX™ Green nucleic acid stain, impermeant to live cells, was used as the indicator of dead cells within a cell population. The SYTOX Green staining solution (167 nM) in FluoroBrite™ DMEM and added to cells. Cells were incubated for 30 min protected from light, the staining solution decanted, cells washed twice with FluoroBrite™ DMEM, and imaged (λex = 504 nm; λem = 523 nm) using the FLoid™ Cell Imaging Station (Thermo Fisher Scientific). For the life/dead cell assay and to validate the results of other survival assays, the LIVE/DEAD™ Cell Imaging Kit 488/570 was used in two ways: cells were either imaged with the FLoid™ Cell Imaging Station or the imaging protocol customized for the 96-well microplate fluorescence reader was used (PerkinElmer LS-55 Fluorescent spectrometer with the 96-well plate-reader accessory); λex = 488, 570 nm; λem = 515, 602 nm).
2.4.5. Clonogenic Assay.
Cells harvested with trypsin-EDTA (0.25%) were plated into T25 flasks (200-800 cells/flask; n=2 replicates per treatment) and allowed to recover for 48 h. Spent medium was removed and cells were exposed to several concentrations of IBCar for 24 h and 48 h. Drug-containing medium was removed, monolayers washed once with full medium, and fresh growth medium was added. Cells were grown for 14 days to 21 days with fresh medium changes every 7 days. Colonies were stained with crystal violet and either manually counted by two independent observers or analyzed using ImageJ as described previously [40].
In each of the above methods, data analyses involved the calculation of surviving fractions (SF) as the fraction of viable cells or colonies relative to the DMSO-treated control. SFs were then plotted as a function of concentration to determine half maximal growth inhibitory concentrations of IBCar (GI50). The nonlinear regression functions of GraphPad Prism 9 were used to determine GI50 and standard deviations (std dev).
2.5. Protein Extraction and Western Blotting
Cells grown to 70%-80% confluence were incubated with IBCar (0.5 µM, 1 µM) for 24 h and 48 h. Spent medium was collected, cell monolayers washed twice with PBS. Cell lysates were prepared using commercial lysis buffers supplemented with protease and phosphatase inhibitors. Protein concentration in cell lysates was measured using Micro BCA™ protein assay kit (ThermoFisher Scientific). For gel electrophoresis, cell lysate aliquots were added to the 2× sample buffer. Protein samples were denatured at 95°C for 5 min, cooled, and loaded onto gels at 50-100 μg total protein per well. Gels were run at the constant voltage (150 V) for ∼1 h. Proteins were transferred onto a Hybond-P 0.45 μm PVDF membrane (Amersham Biosciences, Piscataway NJ) using a constant current of 30 mA for 18 h at 4°C or 80 mA for 2 h at rt. PageRuler Plus prestained protein ladder, 10 to 250 kDa (Life Technologies Corp) or Precision Plus Protein™ Kaleidoscope™ prestained protein standards (Bio-Rad Laboratories, Hercules, CA) were used as the molecular weight markers and to monitor the efficiency of protein transfer. Membranes were incubated for 1 h at rt or 18 h at 4°C in the blocking buffer containing either 5% w/v nonfat dry milk or 5% bovine serum albumin (fraction V). Blocked membranes were incubated in the blocking buffer containing primary antibodies overnight at 4°C, washed and incubated with HRP-conjugated anti-species secondary antibodies at rt for 2-3 h. The protein load was measured with anti-GAPDH antibodies. Antigens were detected using Novex ECL Chemiluminescent substrate reagent kit according to the manufacturer’s instructions (Life Technologies Corp.).
2.6. Effects of IBCar on the Integrity of Microtubules
Cells grown in T25 flasks to 70%-80% confluence were incubated with IBCar (100 nM, 500 nM, 1000 nM) for 1 h, 24 h, and 48 h. Medium was removed and monolayers washed with PBS. Stock solution of Tubulin Tracker™ Deep Red (1,000× in anhydrous DMSO) was diluted to 1× solution in the Invitrogen™ Live Cell Imaging buffer (ThermoFisher Scientific) and added to monolayers. Cells were incubated for 30 min at 37°C (5% CO2). One drop nucleus staining reagent (NucBlue™ Live) was added and cell were incubated for additional 20 min at rt. Probenecid was diluted in Live Cell Imaging solution and used to wash out (3×) extracellular dyes from cells. Microtubules were imaged using FLoid™ Cell Imaging Station λex = 652 nm; λem = 669 nm (Thermo Fisher Scientific).
2.7. Cell Cycle Analyses
Changes in the cell cycle phases were evaluated in BCa cells and cells derived from normal breast tissue after treatment with various concentrations of IBCar for 24 h and 48 h. Untreated control cells were grown in medium containing DMSO. Cells were harvested using non-enzymatic dissociation buffer; washed twice with PBS and centrifuged at 1,500 rpm for 10 min at 4oC. Cell pellets were resuspended in ice-cold 70% ethanol and gently vortexed to obtain monodispersed cell suspensions. Cell suspensions were stored at -20°C until all samples were ready for the flow cytometry analyses. Ethanol-fixed cells were centrifuged, ethanol decanted, and cells washed one time with PBS. The resultant cell pellets were resuspended, ~1×10⁶ - 5×10⁶ cells/mL, in the Telford reagent (16.81 mg EDTA disodium salt; 13.4 g RNAse A (93 U/mg); 25 mg propidium iodide; 500 μL Triton X-100 in 500 mL PBS). Cell suspensions were kept in the dark at room temperature for 2 h. Stained cell suspensions were transferred to the flow cytometer and cell-associated fluorescence was measured.
2.7. Caspases Monitoring, Apoptosis, and Riptosome Analyses
2.7.1. Caspases and Apoptosis.
Two methods were used to evaluate caspase-3 (cas-3) and caspase-7 (cas-7) in BCa cells: Western blot (described above) and cell imaging. For imaging, cells were grown in T25 flasks to 60% - 70% confluence and incubated with IBCar (100 nM, 500 nM, 1000 nM) for 1 h, 3 h, 24 h, and 48 h. CellEvent™ Caspase-3/7 Green Detection Reagent (ThermoFisher Scientific) was used to monitor caspase-3/7 activation using live cell fluorescence imaging. The stock solution of the detection reagent was diluted to 5 μM in PBS containing 5% FBS. Spent medium was removed from cells and the diluted Cell Event™ reagent was added. Cells were incubated at 37°C for at least 40 min, NucBlue™ was added, and incubation continued for an additional 20 min. Cells were imaged using the FLoid™ Cell Imaging Station with filters set for FITC (λex = 502 nm; λem = 530 nm).
2.7.2. Riptosome
The protein components of the riptosome were analyzed using Western blots. The necroptosis was corroborated using necrostatin-1, the RIP-targeted inhibitor of necroptosis. Cells were plated in wells of 96-well plates at predetermined optimal densities for each cell line and allowed to attach for 24 h. One set of wells was treated with necrostatin-1 at concentrations of 1, 10, 50, and 100 μM. The second set of wells on the same plate was treated with 100 nM IBCar combined with the indicated above concentrations of necrostatin-1. Cells were incubated with the reagents for 48 h. Medium was aspirated from wells, monolayer washed 1×PBS, and the LIVE/DEAD™ Cell Imaging Kit 488/570 was used to determine cell survival as described above. A separate set of plates was also analyzed using the MTS assay to corroborate findings.
2.8. Evaluation of Endoplasmic Reticulum Stress and Mitochondrial Membrane Potential
2.8.1. Endoplasmic Reticulum Stress.
Analyses of several ER stress proteins were conducted using the human HSP Array C1 (RayBiotech Life, Inc., Peachtree Corners, GA) and Western blotting. Lysates were prepared and Western blots ran as outlined above. The HSP array analysis was conducted according to the vendors protocol with the protein load adjusted to 500 μg per membrane.
2.8.2. Mitochondrial Membrane Potential.
The Ion Vital-MitoVolt assay (Ion Biosciences, San Marcos, TX) was used to determine the mitochondrial membrane potential using the protocol provided by the vendor. BCa cells were plated into T25 flasks, allowed to recover and grow for 48 h, fresh medium added, and cells were either not treated (DMSO) or treated with 0.1 µM and 1 µM IBCar for 2 h, 24 h, and 48 h. The JC-10 dissolved in the dye loading buffer was added directly to cells at 1:2 (v/v) ratio. Cells were incubated for 60 min protected from light. The masking buffer was added directly to cells, and the cells imaged using the FLoid™ Cell Imaging Station (λex = 490 nm, 540 nm; λem = 525 nm, 590 nm). MitoBrilliant™ Live 646 (Tocris, Bio-Techne, Minneapolis, MN) was used to corroborate MitoVolt data. The dye solution diluted in growth medium was added to live cells. Cells were incubated for 60 min at 37°C; washed 1× PBS; fresh medium was added, and mitochondria imaged (λex = 648 nm; λem = 662 nm).
2.9. Mouse Tumor Models and Treatments
Animal experiments were conducted in compliance with the University of Nebraska Medical Center institutional guidelines using protocols approved by the Institutional Animal Care and Use Committee. Mice were housed in a pathogen-free facilities at controlled temperature and humidity with a 12-h light–dark cycle. Food and water were provided ad libitum. Mice were examined daily. Their body weights were measured three times a week. Throughout the course of the study, tumor dimensions were measured twice per week using Scienceware® Digi-Max™ slide caliper (Sigma-Aldrich), and the tumor volume was calculated: volume = [π × (width)2 × (length)]/6.
2.9.1. MMTV-PyMT Transgenic Breast Cancer Mouse Model.
To evaluate the effects of the IBCar on mammary gland tumor formation and lung metastases, FVB/N transgenic mice expressing the PyMT oncogene under the control of the MMTV LTR promoter/enhancer were used [41]. Female, 4-weeks old FVB/N-Tg(MMTV-PyVT)634Mul/J mice were purchased from the Jackson Laboratories (strain 002374). Female mice develop palpable mammary tumors with a mean latency of 53 days of age [42]. At 6 weeks of age, mice were randomly assigned into two groups. NT group (n=6): control mice (25 µL of PBS containing 5% ethanol); IBCar group (n=6): oral therapy mice (PO dose of IBCar 10 mg/kg bw in 25 µL of PBS containing 5% ethanol). Mice were palpated daily to check the development of mammary tumors. IBCar and vehicle doses were administered every other day for 31 days with weekend breaks. Mice in the NT group were euthanized consecutively as their total volume of mammary gland tumors reached ~2 cm3. IBCar-treated mice were euthanized at the age of 88 days. Mammary tumor tissue, lungs, and kidneys were collected and weighed. Blood was analyzed using the VetScan HM5 hematology system (Zoetis, Parsippany, NJ). Aliquots of blood were processed for serum. Blood chemistry analyses were performed using the VetScan® VS2 chemistry analyzer (Zoetis). Frozen tumors and lungs were minced and transferred into a volume of ice-cold lysis buffer equivalent to two tumor weights (20 mM Tris, pH 7.5, 150 mM NaCl, 1 mM EDTA, 1 mM EGTA, 1% Triton X-100, 2.5 mM Na4O7P2, 1 mM β-glycerol-phosphate, 1 mM Na3VO4, 1µg/mL leupeptin, supplemented with 1 mM PMSF). Minced tumor fragments were placed in a tube on ice and processed first with the tissue tearor (MIDSCI, St. Louis, MO) then sonicated using a Vibra Cell Model VC 375 ultrasonic processor (Sonics&Materials, Inc., Danbury, CT, USA) for 14 s with a 14-s break between sonications for a total of 4 min at a 40% duty cycle. Homogenates were centrifuged at 14,000×g for 10 min at 4°C. Supernatants were collected, aliquoted and stored at −80°C. Prior to Western blot analyses of estrogen (ER) and progesterone (ER) receptors the total protein concentration was determined using the micro-BCA assay (ThermoFisher Scientific, Waltham, MA).
2.9.2. Human Xenograft Mouse Models.
Xenografts were established in immunodeficient outbred nude J:NU female mice homozygous for Foxn1nu/Foxn1nu (The Jackson Laboratories). BCa cells in 0.2 mL VitroGel® Hydrogel Matrix, 5×10⁶ per mouse, were implanted on the left flank. Mice received the implant of BCa cells at the age of 38 days. Three days after the cell implant, mice were randomly divided into two groups: NT control group (n=10): mice treated PO with 25 µL of PBS containing 5% ethanol; IBCar therapy group (n=10): mice treated with PO doses of IBCar 10 mg/kg bw in 25 µL of PBS containing 5% ethanol. Nine days after BCa cell implants tumors reached an average volume of ~120 mm3 and treatments commenced. PBS and IBCar were given approximately every 2 days for 26 days with weekend breaks. Mice were observed for an additional 20 days. The experiment was terminated when one xenograft in the NT group developed a small ulcer (as per the UNMC IACUC policy). Xenografts, lungs, liver, spleen and kidneys were collected, weighed, and macroscopically evaluated. Analyses of blood hematology and serum chemistry were performed as described above.
2.10. Statistical Analyses
Statistical analyses were performed with GraphPad Prism 10 software (GraphPad Software, Boston, MA). Data are reported as mean ± standard error or ± standard deviation, and statistical significance is indicated (P values). The multiwell assays data were analyzed using nested one-way AVOVA with Tukey’s multiple comparisons test. For the GI50 cytotoxicity determination, responses to IBCar were normalized to the DMSO-treated controls (surviving fractions; SF), plotted on a semi-log scale, and analyzed using the non-linear regression functions in GraphPad Prism. GI50s were derived for each cell line from n = 4 - 6 technical and two biological (passage number) replicates. GI50s values determined in the nonlinear regression were compared using the ordinary ANOVA with the Dunnett’s multiple comparisons test (Table S3). Clonogenic assay data were normalized to DMSO-treated controls to calculate SF and analyzed using one-way ANOVA with the Tukey's pairwise comparisons. Unpaired t-test with Welch's correction was used to assess differences in SFs between cell lines. Tumor growth curves were analyzed using the GraphPad exponential (Malthusian) growth function assuming a constant doubling time. Weights of extirpated xenografts, mammary tumors, and tumor growth curves were analyzed using unpaired t-test with Welch's correction.
3. Results
3.1. Molecular Docking Studies
The interaction between IBCar and the α- and β-chains of tubulin was investigated using AutoDock. Figure 1 shows a graphical depiction of these interactions. The binding free energy was estimated at −11.44 kcal/mol (Table 2), with an inhibition constant (Ki) of 4.08 nM at 298.15 K. The final intermolecular energy was estimated at −12.64 kcal/mol, with the electrostatic energy of 0.00 kcal/mol; final total internal energy of -0.76 kcal/mol; torsional free energy of +1.19 kcal/mol; and unbound system's energy of -0.76 kcal/mol. The top-ranked docking pose revealed three hydrogen bonds between IBCar and tubulin: two with residues Asn101 and Ser178 in the α-chain, and one with Asn258 in the β-chain. The predicted Ki of 4.08 nM for IBCar is substantially lower than that of colchicine and mebendazole, both known microtubule-binding agents (Table 2).
3.2. Selective Cytotoxic Effects of IBCar in Normal Versus Breast Cancer Cells
Characteristics of cell lines used in this project are listed in Table 1. Cell doubling times (TDs) were determined before the cytotoxicity tests. The effects of IBCar on BCa and normal cells were assessed and validated using three independent methods: the MTS assay to measure cytotoxicity at early times after the exposure to the IBCar; the clonogenic assay (reproductive integrity assay), which is the gold standard for the survival analysis of cells able to produce colonies; and SYTOX™ Green dead cell staining combined with total nuclei count using Hoechst 33,342 staining to validate the MTS assay results in cells that do not form colonies. In all assays, cells were treated with various concentrations of IBCar alongside controls grown in medium containing DMSO. The efficacy of IBCar (NSC811291) was also confirmed in the NCI-60 Human Tumor Cell Lines Screen performed by the NCI DTP [43] (Table 3). Cell metabolic activities were measured after 24 h, 48 h and 72 h treatment with IBCar (Table 4). A similar experimental design was used to determine GI50 values for normal breast epithelial cells 76N, astrocytes, and pericytes. In the clonogenic assay, cells were treated with IBCar for 24 h or 48 h followed by up to 21 days culture in IBCar-free medium. Figure 2 illustrates responses of BCa and normal breast cells to IBCar. The results of MTS assays are corroborated by data acquired in the reproductive integrity assays (Figure 2D-G).
Comparisons were made between normal cells residing in the environment from which tumor cells were derived. Responses of 76N normal breast cells to IBCar were compared to two primary TNBC BCa cell lines with mTP53 (Figure 1A). The survival of astrocytes was compared to MB361 cells derived from the brain metastatic site (Figure 1B). We used pericytes to compare responses of mBCa cells derived from plural effusions (Figure 1C). Pericytes served as a model for a normal microenvironment that, when damaged by chemotherapy, can acquire pro-metastatic characteristics [44]. Several reports also indicate that the loss of pericytes contributes to increased metastases in mice [45] suggesting that such a loss can generate local microenvironments promoting metastasis [46,47].
By employing several independent methods, we demonstrated that BCa cells are effectively eradicated at concentrations <25 nM, whereas normal cells exhibit significant resistance to IBCar.
3.3. Cell Cycle Effect of IBCar
Cell cycle analyses using the Telford method with propidium iodine staining showed that IBCar treatment induced cell cycle arrest at the G2/M phase (Figure 3A-C). Of the seven cell lines tested, TNBC BT549 and HCC70 cells underwent the most pronounced shift to the G2/M phase. Both cell lines were derived from primary tumors harboring TP53 hotspot mutations associated with gain-of-function phenotypes [48,49].
The G2/M arrest was confirmed using the Western blot of p(Tyr15)-cdc2 with anti-pcdc2 rabbit antibodies in conjunction with the analyses of H3 histone phosphorylation at S10. The critical regulatory step for cdc2 during progression into mitosis is its dephosphorylation at Tyr15 [50]. It is evident (Figure 3D) that the entry of all tested cells into mitosis is regulated by the cdc2 kinase activation regardless of the TP53 status. We can tentatively propose that the normal cells resistance to IBCar is not related to the TP53 status.
3.4. Cell Death Mechanisms
The objective was to determine whether the cell death mechanisms induced by IBCar treatment differ between BCa cells and normal breast cells, and to explore any underlying dissimilarities. Live cell imaging and Western blot analyses were used to assess cellular death events.
3.4.1. Caspase-3 and Caspase-7 Activation.
Apoptotic responses of BCa and normal breast cells to IBCar were evaluated using the caspase-3/7 (Cas-3/7) activation assay (Figure 4 and Figure 5) and the Western blot analyses of cleaved Cas-3 (Figure 6) and PARP (Figure 4S). Apoptotic cells were imaged with the CellEvent™ Cas-3/7 Green. The method is suitable for longitudinal assessment of activated Cas-3/7 without disturbing cells in monolayers over the course of 72 h. CellEvent™ Cas-3/7 Green reagent is intrinsically non-fluorescent. After activation of caspase 3/7 in apoptotic cells, the DEVD peptide is cleaved, binds to DNA and produces a bright green fluorescence (Figure 5). All BCa cells except MB175 show evidence of Cas-3/7 activation when treated with IBCar. MB175 cells produce very few apoptotic cells and only after prolonged treatment with IBCar (>48 h). However, MB175 cells exhibit a significant nuclear fragmentation in >25% of nuclei as early as 24 h after IBCar exposure. This may be indicative of the mitotic catastrophe as the death mechanism (Figure S10).
In several BCa cell lines, the earliest apoptotic cells emerge as soon as 1 h after exposure to IBCar (Figure 4), whereas in 76N normal breast cells, the apoptotic population is not detectable even after prolonged time with IBCar. Baseline Cas-3/7 activation is minimal in all tested cell lines (Figure S11). The size of the apoptotic fraction varies by cell line (Figure 4), but it is time-dependent across all cell lines. The concentration dependence is less apparent. For example, MB468 and HCC70 cells have practically identical apoptotic fractions at 0.1 µM and 0.5 µM (Figure S12).
Cas-3/7 imaging data were substantiated using Western blot analyses of lysates from control cells (DMSO) and cells treated with IBCar for 24 h and 48 h (Figure 6). BT549 cells show high levels of Cas-3 fragments p17 and p19 after 24 h and 48 h with IBCar. This coincides with the large apoptotic fraction observed in the Cas-3/7 imaging studies. High levels of cleaved Cas-3 in MB468 after 48 h with IBCar also parallel the observation from the Cas-3/7 imaging studies. The p17 and p19 fragments of cleaved Cas-3 were not detectable in 76N and MB175 lysates treated with IBCar corroborating the lack of Cas-3/7 activation in these cells.
3.4.2. Caspase-8.
Procaspase-8 (Cas-8) activity correlates with Cas-8 prodomain cleavage at Asp374 between the catalytic subdomains, which generates fragments p43 and p41. These fragments typically emerge first after activation [51,52,53]. Fragments p43 and p41 are intermediate products in the Cas-8 maturation process and are responsible for most of the Cas-8 activity in cells [53]. The cleavage of Cas-8 also produces p18 and p10 fragments.
Untreated normal breast cells 76N as well as BCa cells MB361 and MB468 express full-length Cas-8. In BT549, HCC70, and MB175 BCa cells Cas-8 is practically undetectable (Figure 7 and Figure S6). The exposure to IBCar upregulates full-length Cas-8 expression in HCC70 cells. While we did not detect 18 kDa and 10 kDa fragments, most likely because p18 has a lifetime of only 7 min [54] (only MB468 lysates had a weak 18-kDa band after 48 h treatment with IBCar), we detected both 41 kDa and 43 kDa fragments of Cas-8 (Figure 7A and Figure 8). However, only in MB361 and MB468 cells, which also show high levels of cleaved Cas-3 and activated Cas-3/7. During apoptosis, Cas-8 substrates, such as downstream effector caspases Cas-3 and Cas-7, are cleaved and activated by Cas-8 p43 and p41 intermediates [55]. The notable lack of Cas-8 p41 and p43 fragments in 76N cells, despite the prominent presence of the full-length protein, confirms that apoptosis is not an active cell death mechanism in this cell line. Moreover, these data suggest that dissimilarities in Cas-8 expression and maturation may underlie the differences in cellular responses to IBCar, i.e., the relative resistance of normal breast cells to IBCar and its lethality in BCa cells.
3.5. Riptosome
The receptor-interacting protein (RIP) family of serine-threonine kinases (RIP, RIP2, RIP3, and RIP4) are important regulators of cellular stress that can activate pro-survival as well as pro-apoptotic pathways [56]. RIP1 activities control apoptosis, necroptosis, and inflammatory pathways and are defined by a strict balance between RIP1 activation, fragmentation and degradation, processes that are crucial for maintaining cellular homeostasis [57,58,59,60]. We have explored the potential role of RIP1 in conferring significant resistance of normal cells to IBCar.
High levels of Cas-8 can promote apoptosis by allowing Cas-8 self-cleavage into its active forms. This leads to the activation of the downstream apoptotic pathways. Although normal breast cells 76N express full-length Cas-8, cleaved Cas-8 is not generated in response to IBCar treatment (Figure 7 and Figure 8). Heterodimerization of Cas-8 blocks apoptotic cell death leading to the increased levels of active RIP1, which can phosphorylate RIP3 resulting in the MLKL-dependent necroptosis. Tested to date BCa cells and normal breast cells, with the exception of MB468, appear to be RIP3-deficient (Figure 7C). Some cancers suppress necroptosis by epigenetic silencing of RIP3 [61]. Phosphorylation of MLKL by RIP3 is essential for MLKL translocation, accumulation in the plasma membrane, and consequent activation of necroptosis [62]. All tested cells, except BT549, express varying levels of MLKL (Figure 7B). However, we were not able to detect S345 phosphorylated MLKL in any of the tested cell lines.
Untreated cells 76N and MB361 have detectable levels of RIP1 (Figure 9). In BT549 cells, RIP1 expression is triggered by IBCar treatment. 76N and MB361 cells, untreated controls as well as IBCar treated cells, also express RIP1 phosphorylated at Ser166 (Figure 9A), an autophosphorylation site in the RIP1 kinase domain. RIP1 is constitutively cleaved in 76N cells at the N-terminus generating p25 and p37 fragments detectable with antibodies recognizing epitope centered around Leu190 in the kinase domain (Figure 9). Even though RIP1 cleavage is primarily mediated by Cas-8, the process can be executed by Cas-3 or Cas-6 in cell lacking Cas-8 [63]. The absence of activated Cas-3 can attenuate RIP1 proteolysis [64]. Proteolysis of RIP1 is also blocked by mutation of Asp180 [59]. The RIP1 fragmentation at the N-terminus suppresses the apoptotic and necrotic RIP1 activities and promotes cell survival [59]. Correspondingly, multiple studies have shown that inhibition of RIP1 cleavage at the kinase domain leads to cell death [59,65,66,67]. The C-terminal cleavage of the RIP1 death domain prevents NF-κB activation and promotes apoptosis [68,69]. When activated Cas-8 is inhibited or absent, as we observed in 76N cells (Figure 8), RIP1 can promote either cell survival or necroptosis, demonstrating its dual role depending on the cellular context [57]. Thus, the cleavage site seems to have a decisive role in determining the cellular fate. The mechanism, which appears to be functional in 76N normal breast cells treated with IBCar, involves pro-survival activities. Recent reports indicate that inhibition of RIP1 prevents necroptosis in brain [70] and that RIP1 and Cas-8 also have cell-death-independent functions in supporting faithful chromosome alignment in mitosis [60]. Vinblastine - which like IBCar depolymerizes microtubules – can amplify the expression of necrosome components RIP1, RIP3, and MLKL [71]. IBCar, despite its similar effects on microtubules, does not have any significant impact on the expression of these three proteins in examined BCa cells. However, IBCar treatment increases the N-terminal fragmentation of RIP1 in 76N and MB361 cells (Figure 9).
Necrostatin-1 is widely used in various disease models to examine contributions of RIP1 to cell survival, death, and inflammation [66]. This agent can ameliorate peripheral nerve injury-induced pain by inhibiting the RIP1/RIP3 pathway. For these reasons, we have examined its effect on cell survival in response to IBCar treatment (Figure 10). It is apparent that necrostatin-1 had no effect on the survival of IBCar-treated MB468 cells consistent with the lack of RIP1 expression in these cells (Figure 10A). Data for MB468 cells is representative of results obtained for other BCa RIP1-deficient cell lines. In contrast, necrostatin-1 rescued RIP1-expressing MB361 from the cytotoxic effects of IBCar (Figure 10B). The inhibitory activity of necrostatin-1 was less pronounced in IBCar-treated 76N cells suggesting that RIP1 cleavage at the kinase domain may be an important factor contributing to these cells’ resistance to IBCar (Figure 10C). Further investigation into the mechanism of RIP1 signaling in 76N and other normal cells will be essential to fully understand RIP1's role in the response to IBCar treatment.
3.6. Microtubule Integrity
During their normal cellular functions, microtubules undergo polymerization and depolymerization of α and β tubulin heterodimers. IBCar’s binding site resides between α and β tubulin chains (Figure 1). Treatment with IBCar produced rapid and extensive microtubule depolymerization in all tested BCa cell lines. Depolymerization of microtubules in 76N normal breast cells was minimal. Figure 11 shows the status of the microtubule structures in BCa and normal breast cells after 24 h with 0.5 µM IBCar.
The evaluation of microtubule integrity after IBCar treatment provided further evidence of the differing responses of normal breast cells and BCa cells to IBCar. Data demonstrated reversibility of IBCar effects in normal 76N cells, which contrasts with the irreversible microtubule depolymerization by VCR in these cells (Figure 12). Treatment with VCR at the same concentration as IBCar, but for a shorter duration (24 h) followed by 72 h without the drug, did not result in any noticeable reconstruction of normal microtubule structures. Neither BCa nor normal cells regained microtubule integrity after VCR treatment. Microtubule depolymerization by IBCar in BCa cells was also permanent (Figure 12) whereas in normal breast 76N cells the changes appeared to be transient. Partially depolymerized microtubules of normal 76N breast cells appear to have the capacity to recover their structures when IBCar is removed from medium and cells continue to grow in IBCar-free medium. Images in Figure 11 exemplify data for all tested BCa cell lines after 24 h treatment with IBCar followed by 72 h recovery in fresh medium. Of HCC70 cells that survived IBCar treatment, none regained their structures even when allowed to grow and recover in IBCar-free medium for 96 h. This represents a significant difference between cellular responses to IBCar and VCR that will be further explored in future studies.
3.7. Endoplasmic Reticulum Stress and Mitochondrial Membrane Potential
Since the status of p53 does not appear to be the primary determinant of the cell death mechanism in response to IBCar, we conducted further analyses to identify other IBCar-induced stressors. Specifically, we examined endoplasmic reticulum (ER) and mitochondrial stress responses.
3.7.1. Endoplasmic Reticulum Stress Pathways Evaluation.
The endoplasmic reticulum (ER) controls protein folding as well as the maintenance of its own homeostasis. When these functions are not achieved, the ER stress signals are triggered to activate either adaptive or apoptotic responses. ER contains a pool of molecular chaperones including BiP (GRP78) and calnexin, two transmembrane proteins synthesized on polysomes and translocated into ER [72,73,74].
We have analyzed BiP and calnexin expression in untreated and IBCar-treated cells using Western blots. Lysates were prepared from the combined fractions of non-adherent floating cell (these are formed when IBCar depolymerizes microtubules, but cells are not yet dead) and non-enzymatically harvested adherent cells. Figure 13 summarizes our findings. It appears that all BCa tested cells, except MB468 and MB175, significantly increased BiP synthesis in response to IBCar treatment. When protein folding is disturbed, BiP synthesis increases to prevent protein aggregation and facilitate protein folding [75,76,77,78]. Published reports indicate that BiP expression is stimulated by taxol and vinblastine, two agents that, like IBCar, disrupt microtubule integrity [78]. Our results suggest the ER stress pathways represent an important mechanism of BCa cells response to IBCar. Untreated BT549 and MB175 cells appear to have high intrinsic levels of BiP. In contrast, normal breast 76N cells showed a very weak BiP signal, which was detectable only when the protein load was increased by nearly 10-fold over other lysates.
In addition to its role in the unfolded protein response, calnexin regulates mitochondrial energy production and stress responsiveness by controlling Ca2+ import into ER and facilitating Ca2+ transfer to mitochondria [79]. We propose that the decline in calnexin levels in IBCar-treated 76N cells (Figure S9) modulates mitochondrial membrane potential (ΔΨ), thereby promoting cell survival. This notion is supported by our analysis of the mitochondrial membrane ΔΨ, which suggests that reduced calnexin expression contributes to the protective effect. The impact of IBCar-induced microtubule destabilization on ΔΨ modulation is discussed in the following section.
To further investigate the role of IBCar as a cellular stressor, we analyzed the expression of protein kinase-like endoplasmic reticulum kinase (PERK, also known as EIF2αK3) and the transmembrane serine/threonine kinase inositol-requiring enzyme 1 alpha (IRE1α). These two proteins independently monitor the equilibrium between protein load and folding capacity and regulate key signal transduction pathways of the unfolded protein response [80,81,82]. Eukaryotic initiation factor 2α subunit (eIF2α) is a downstream effector of PERK [81,83,84]. We have analyzed the expression of these three proteins in untreated cells and cells exposed to IBCar for 24 h and 48 h (Figure 14). Data provide additional evidence in support of IBCar as the cellular ER stressor. ER stress increases the activity of PERK (Figure 14A,B). We observe substantial increases in the total PERK expression in 76N and MB361 cells after 24 h with IBCar followed by a significant decline by 48 h. PERK activities in MB468 cells after IBCar treatment intensify in a time-dependent manner. Specifically, the expression of 55 kDa PERK protein kinase fragment increases ~10-fold and ~20-fold at 24 h and 48 with IBCar, respectively. Normal 76N cells double the expression of 55 kDa fragment after 24 h IBCar. However, at 48 h the expression of 55 kDa protein kinase fragment returns to basal levels observed in untreated 76N cells. MB361 cells do not produce 55 kDa PERK fragments. eIF2α is detectable exclusively in 76N normal breast cells (Figure 14C). Levels of IRE1α remain unchanged in MB361 and MB468 cells treated with IBCar. In contrast, IRE1α and p-Ser724-IRE1α are significantly upregulated in 76N cells treated with IBCar for 48 h suggesting that in this cell line two independent unfolded protein responses may be functional. The duration of PERK and IRE1α signaling can vary following disruptions in the protein folding processes. Sustained periods of PERK activities are detrimental to cell survival. The corresponding duration of IRE1α signaling is not [85,86]. Therefore, the transient PERK activity in 76N cells is suggestive of cytoprotective functions whereas the extended PERK activity in MB468 appears to contribute to BCa cell death [85]. Extensive additional studies will be required to fully correlate the longitudinal interplay between these two proteins in IBCar-treated cells.
Because mitochondrial proteins are also involved in the unfolded protein response, we analyzed the expression of six heat shock proteins. The data revealed differences between normal 76N cells and BCa MB648 cells (Figure 15 and Figure S7). In normal breast cells, IBCar treatment decreases the expression of HSP32 and ubiquitin-ribosomal protein eS31 fusion protein (RPS27a) and upregulates HSP60. In MB468 cells, neither HSP32 nor HSP60 are impacted by IBCar treatment. However, RPS27a expression increases by approximately 80% compared to untreated MB468 cells (Figure S6). Knocking down of RPS27a has been reported to inhibit p53 ubiquitination and degradation [87] suggesting that its downregulation in 76N cells may be a component of a multifaceted cytoprotective mechanisms active in normal breast cells responding to IBCar treatment.
3.7.2. Mitochondrial Membrane Potential.
Microtubule interactions with mitochondria regulate their intracellular movement, while unpolymerized tubulin modulates ΔΨ in both normal and cancer cells [88,89,90]. Depolymerized tubulin as well as discussed above calnexin can contribute to the mitochondrial depolarization. The notion of decreased expression of calnexin in IBCar-treated 76N cells as a contributor to their survival is corroborated by the analysis of changes in ΔΨ (Figure 16A). Mitochondrial ΔΨ was measured using JC-10 dye. In its monomeric form, JC-10 emits green fluorescence; when it accumulates in healthy mitochondria, it forms fluorescent orange aggregates. Mitochondrial depolarization results in the loss of JC-10 accumulation in mitochondria and a shift from orange to green fluorescence indicating compromised mitochondria. Normal 76N cells and BCa cells were either treated with 0.1 µM and 1 µM IBCar for 2 h, 24 h, and 48 h or left untreated, DMSO control (Figure 16 and Figure S2). BCa cells treated with IBCar rapidly lose mitochondrial ΔΨ (Figure 16B). This finding is consistent with extensive microtubule depolymerization and high apoptotic fraction, nearly 100% after 48 h with IBCar, observed in these cells. Increased levels of free tubulin produced by IBCar-induced microtubule depolymerization trigger significant depolarization of mitochondria in BCa cells. By comparison, in normal breast cells IBCar has only a minimal effect on the microtubule integrity (Figure 11) and correspondingly, in these cells we do not observe any significant changes in mitochondrial ΔΨ (Figure 16A). The results were confirmed with MitoBrilliant™ Live 646, another mitochondrial ΔΨ-dependent dye (Figure S3).
3.8. Efficacy of IBCar in Mice Models of BCa
3.8.1. Transgenic Breast Cancer Model
IBCar’s therapeutic potential was evaluated in FVB/N-Tg(MMTV-PyVT)634Mul/J female mice (PyTV), an established transgenic model of BCa. Based on the gene expression profiling, PyTV tumors cluster with the luminal B subtype of human breast cancers [91] and recapitulate human BCa progression [92,93].
IBCar treatment started when mice reached the age of 40 days. Mice were monitored daily, body weight determined, and mammary glands palpated every other day. When the first palpable tumor was detected, all nodules were measured every other day. The formation of pulmonary lesions was determined at necropsy. All findings are summarized in Figure 17. Prolonged treatment with oral IBCar was not associated with any adverse events. Oral IBCar was effective in controlling tumor development (Figure 17B, C). IBCar-treated mice did not develop any mammary gland tumors and lung metastases during treatment. The first signs of mammary tumor development were evident on day 81, i.e., 12 days after the secession of IBCar treatment. In this cohort, we did not detect any tumors in the abdominal mammary gland (Figure 17F). Control mice developed multiple tumors starting at the age of 46 days, which, as the disease progressed, involved all mammary glands. Control mice also developed multiple lung metastases. Lungs extirpated from untreated mice had macroscopically observable tumor nodules and were on average >30% heavier than lungs from IBCar-treated mice (Figure 17E).
IBCar-treated tumors retained high levels of estrogen receptor-α (ER-α) (Figure 17G, H). The presence of ER-α in BCa usually denotes a better prognosis. PyTV tumors, similar to the luminal B subtype of breast cancer, lose ER-α expression as the disease progresses, thereby mimicking the behavior of human breast cancers associated with poor prognosis [92,93]. Loss of ER-α expression frequently results in a more aggressive phenotype and resistance to endocrine therapy [94]. IBCar treatment did not appear to have any major effects on the expression of progesterone receptor. Hematology and serum chemistry of IBCar-treated mice at termination were normal indicating that prolonged treatment with IBCar is not toxic to the host (Table 5).
3.8.2. Subcutaneous Breast Cancer Model MDA-MB-468.
IBCar therapy in TNBC model was conducted in female J:Nu mice. The experimental timeline is shown in Figure 18A. Treatment commenced 10 days after the MB468 cells implants when the average tumor volume (TV) was 118±40 mm3. Mice were randomized into untreated (NT; n=9; TV=114±15 mm3) and IBCar-treated (n=10; TV=118±12 mm3) groups. IBCar-treated mice maintained healthy body weights throughout treatment (Figure 18B). Median tumor doubling time determined using the Kaplan-Meier estimator was 42 d in NT mice (Figure 18C). In the IBCar-treated cohort, Tv of two tumors doubled approximately three weeks after termination of treatment. Analyses of the MB468 tumor growth curves (Figure 18D) indicated significant delay of tumor growth in IBCar-treated mice with TD >700 days compared to TD of 33±1.7 days in untreated controls (P <0.0001). Xenograft regression in IBCar-treated mice became evident after the seventh IBCar dose and continued throughout the treatment. Tumor regrowth after the secession of treatment was not significant; TD=118±12 mm3 at the initiation of treatment compared to TD=135.6±29.3 mm3 on day 53 after the BCa implant (P=0.8). Additional statistical analyses are presented in Table S4. Similarly to PyTV mice, hematology and serum chemistry profiles of IBCar-treated mice at necropsy were normal indicating that prolonged IBCar therapy is not toxic in this mouse strain (Tables S5 and S6).
4. Discussion
Breast cancer chemotherapy has long been associated with a range of negative side effects, including chemotherapy-induced peripheral neuropathy (CIPN) and a persistent decline in memory and cognitive function [29,30,31,32,95]. CIPN is one of the most challenging side effects of chemotherapy and a major limiting factor in BCa treatment [28]. Nearly 40% of BCa patients treated with conventional chemotherapeutics develop CIPN, which not only reduces quality of life but often leads to dose reductions or early cessation of chemotherapy. Both of these outcomes can have adverse impact on treatment effectiveness and the patient’s survival. Additionally, nearly 80% of BCa patients experience cognitive impairment shortly after starting chemotherapy, which can result from a single treatment or accumulate over the course of multiple drug regimens. Currently, there are ~4 million BCa survivors in the United States, including women who have completed their course of therapies and women who are still undergoing treatment [96]. Many of these survivors continue to cope with side effects of their therapies.
The development of therapies free from the toxicities associated with conventional treatments is a major unmet need in the care of BCa patients. Data presented in this study strongly support our hypothesis that IBCar is a nontoxic, highly potent, and orally bioavailable agent with efficacy across multiple BCa models, both in vitro and in vivo. Notably, one of the most promising features of IBCar is its selective toxicity. It appears to effectively eliminate BCa cells while sparing normal cells, which exhibit marked resistance to IBCar.
The heterogeneity of BCa, including variability of tumor doubling times and cell cycle parameters, poses a significant challenge to effective treatments. The S-phase fraction of BCa tumors can range from 5% to 30% [97,98,99]. Studies measuring BCa tumor growth through serial mammograms have reported TDs ranging from 44 days to more than 1,800 days [100], substantially longer than TDs of BCa cells grown in tissue culture or mouse models. Cell lines selected in this study span a broad range of TDs, from approximately 30 hours to over 100 hours. After short treatment times in vitro, substantial differences in IBCar cytotoxicity among cell lines were observed. However, when the IBCar exposure was extended to 48 h and beyond, these differences became insignificant and did not correlate with TDs. It is evident that when therapeutic concentrations are maintained, IBCar demonstrate equivalent efficacy in BCa cells with both short and long TDs, a finding with important clinical implications. IBCar was also effective in mice with tumor TDs ranging from approximately 10 days to 33 days. Furthermore, IBCar's large therapeutic index, exceeding 50, 100, and 120 relative to pericytes, astrocytes, and normal breast cells, respectively, suggests that achieving effective steady-state concentrations in patients is feasible.
Mutated TP53 is present in ~30% of all breast cancer cases [101] and is one of the most frequently mutated gene in BCa [102]. The relationship between TP53 mutation status and response to chemotherapeutic agents in BCa is not straightforward and depends on the type, dose, and schedule of chemotherapy. Of the eight cells lines tested in this study, four harbor hot-point mutations in TP53. Cell cycle analyses confirmed that IBCar treatment arrests cells in the G2/M phase. Notably, BT549 and HCC70 cells underwent the most pronounced shift to the G2/M phase. Both cell lines harbor TP53 hotspot mutations [48,49]. However, the entry of all tested normal breast as well as BCa cells into mitosis was found to be regulated by the cdc2 kinase activation irrespective of TP53 status. Therefore, we propose that the sensitivity of BCa cells to IBCar as well as the relative resistance of normal breast cells to IBCar are not linked to the TP53 status. This is consistent with published reports showing that TP53-knockout MCF-10A cells exhibit no significant differences compared to TP53-parental MCF-10A cells in response to the clinically used anti-microtubule agent paclitaxel [103].
To further investigate the cause of normal cell resistance to IBCar, we examined the differences in death mechanisms between BCa and normal breast cells treated with IBCar. All BCa cells except MB175 showed evidence of the apoptotic response to IBCar. MB175 likely dies via mitotic catastrophe as indicated by nuclei fragmentation and micronucleation. MCF-10A cells, which originated from a benign fibrocystic breast disease and spontaneously immortalized, underwent the apoptotic death when exposed to IBCar for 48 h or longer. In contrast, 76N normal breast cells, even after prolonged exposure to IBCar, show no apoptotic population, as confirmed by Cas-3/7 assays and Western blot. The dissimilarities are likely the result of different death pathways. While it is well-established that a defective or abrogated G2 checkpoint is crucial for DNA damage-induced mitotic catastrophe, and that the eventual mode of cell death depends on the on the p53 status, the pathways driving this form of cell death in the absence of DNA damage are still largely unknown.
Untreated normal breast cells express full-length Cas-8, whereas Cas-8 is undetectable in BCa cells BT549, HCC70, and MB175. Cas-8 is a 55 kDa zymogen composed of p18 and p10 subunits connected by a pro-domain at its N-terminus. During activation, Cas-8 can cleave itself or nearby Cas-8 molecules at Asp374, leading to the generation of the 43 kDa and 41 kDa fragments. These fragments correspond to the intermediate products in the activation cascade. The difference in the molecular weight of the two fragments is often due to slight variations in the cleavage sites or partial activation intermediates [52,104]. Both of these fragments retain enzymatic activity and contribute to downstream signaling in apoptosis [51,52,53]. During apoptosis, Cas-8 substrates, including the downstream effector caspases Cas-3 and Cas-7, are cleaved and activated by the p43 and p41 Cas-8 intermediates [55]. Fragments p41 and p43 are detectable only in MB361 and MB468 cells, which also exhibit significantly elevated levels of cleaved Cas-3 and activated Cas-3/7. The notable absence of p41 and p43 fragments in 76N cells, despite the prominent presence of full-length Cas-8, confirms that apoptosis as a death mechanism is not active in these cells. These data also suggest dissimilarities in Cas-8 expression and maturation as the potential reasons for disparate responses of normal breast cells and BCa cells to IBCar.
Looking deeper into the function of Cas-8 in cellular responses to IBCar, we also analyzed differences in the riptosome of normal and BCa cells. The heterodimerization of Cas-8 can either promote cell survival through RIP1 cleavage or block apoptotic cell death and promote RIP3-mediated necroptosis [105]. Interactions of RIP1 with Cas-8 are critical to the cell survival and death. Cas-8 plays a significant role in inhibiting necroptosis by cleaving and inactivating RIP1 and RIP3, two upstream kinases in the necroptosis pathway. By cleaving RIP1 and RIP3, Cas-8 prevents the phosphorylation and activation of MLKL allowing cells to undergo apoptosis rather than necroptosis. Genotoxic stresses can induce riptosome formation and trigger necroptosis by activation of RIP3-MLKL-dependent necrosis signaling pathways. When Cas-8 is active, it can cleave RIP1 preventing signaling through the necroptotic pathway and promoting apoptosis such as observed in BCa cells MB361 and MB468. Conversely, when the Cas-8 activity is inhibited or absent, e.g., in normal breast cells, RIP1 can promote cell survival and/or necroptosis demonstrating its dual role depending on the cellular context. The mechanism, which appears to be functional in normal breast cells treated with IBCar, involves pro-survival activities of riptosome confirmed in our studies with the RIP1 inhibitor necrostatin-1.
Assessment of microtubule integrity provided further insight into the contrasting responses of normal breast and BCa cells. IBCar causes permanent microtubule depolymerization in BCa cells, whereas in normal breast cells, this effect appears to be transient. The reversibility of IBCar’s effect on microtubules in normal cells contrasts with that of VCR, which induces permanent microtubule damage in both BCa and normal cells. Both VCR and IBCar depolymerize microtubules; however, in normal 76N cells treated with IBCar, microtubule integrity is restored within hours after the drug-containing medium is replaced with fresh medium. A few days after IBCar treatment, recovery seems complete, and cells resume normal division rates. Conversely, normal cells treated with VCR sustain permanent damage and die. Although anti-microtubule agents can induce apoptosis at all phases of the cell cycle, including in noncycling cells [106,107,108], cells in interphase recover microtubule integrity more readily than those in G2/M, where microtubule disruption has more severe effects. It is important to note that cell death independent of mitosis can also occur; for example, this is the primary cause of neurotoxicity in patients treated with anti-microtubule agents. Evidence from in vitro and xenograft models [109,110] supports mitosis as the critical phase for the action of microtubule-disrupting agents, though cancer cells exhibit a wide range of responses to antimitotic drugs [111,112]. In the case of IBCar, the recovery of microtubule integrity in normal cells does not seem to be linked to changes in the mitotic fraction, indicating that further detailed studies are needed to fully understand the mechanisms underlying this recovery.
We have identified additional contributors to the differences between BCa and normal cells responses to IBCar that involve ER stress response mechanisms and changes in the mitochondrial membrane potential. Mitochondrial depolarization induced by colchicine, which has a similar effect on microtubules as IBCar, is caused by free tubulin released from depolymerized microtubules [90]. This may occur through the insertion of the negatively charged extended C-terminal tail of tubulin into the voltage-dependent anion channel [113], affecting mitochondrial Ca2⁺ exchange, a critical process for balancing cell death, energy demands, and membrane potential. BCa cells treated with IBCar rapidly lose mitochondrial ΔΨ consistent with extensive microtubule depolymerization and high apoptotic fraction in these cells. The increased levels of free tubulin produced by IBCar-induced microtubule depolymerization trigger significant depolarization of mitochondria in BCa cells. By comparison, IBCar treatment has only a minimal effect on microtubule integrity in normal breast cells with the corresponding marginal changes of ΔΨ.
Disruptions in protein folding induce an unfolded protein response aimed at alleviating the cellular injury. BiP plays a key role in the ER stress responses [114]. Overexpression of BiP inhibits apoptosis in BCa cells, reduces chemosensitivity, and appears to contribute to chemoresistance [74]. BiP’s pro-survival functions in the unfolded protein response include targeting misfolded proteins for degradation, binding of Ca+2 in ER, and regulating the activation of transmembrane ER stress sensors. When tumors become refractory to therapy, ER stress triggered by chemotherapeutic agents is followed by the adaptive pathways of the unfolded protein response designed to alleviate the ER stress and confer chemoresistance [72,73]. Calnexin and BiP interact as sequential chaperones [115,116,117]. This collaboration ensures proper folding and prevents misfolded proteins from leaving the ER. Normal breast 76N cells, both untreated and IBCar-treated, express minimal levels of BiP. In contrast, untreated BCa cells, such as BT549 and MB175, exhibit high intrinsic levels of BiP. Several of tested BCa cell lines show a significant increase in BiP synthesis in response to IBCar treatment. These findings indicate that ER stress pathways play a significant role in the response of BCa cells to IBCar. Calnexin regulates mitochondrial energy production and stress responsiveness by controlling the activity of Ca2⁺ import into the ER and its transfer to mitochondria. While BCa cells maintain stable levels of calnexin after IBCar treatment, calnexin levels decline in IBCar-treated 76N cells, which appear to modulate ΔΨ and prevent cell death. The idea that reduced calnexin expression in IBCar-treated 76N cells contributes to cell survival is fully supported by the analysis of mitochondrial membrane ΔΨ in this cell line.
ER stress sensors that mediate the unfolded protein response include PERK, eIF2α, and IRE1α. PERK and IRE1α independently monitor the balance between protein load and folding capacity, regulating key unfolded protein response signal transduction pathways. eIF2α, a downstream effector of PERK, links ER stress signals to the inhibition of translation [81]. Based on our results, IBCar appears to be the cellular ER stressor. Substantial increases in the total PERK expression are detected in 76N and MB361 cells post-IBCar treatment followed by a significant decline at later times. eIF2α is detectable exclusively in 76N normal breast cells suggesting that in normal breast cells the activation of PERK and eIF2α have cytoprotective functions absent in the BCa cells. A recent study identified eIF2α as the pro-survival factor during paclitaxel treatment in vitro and in vivo [83]. Others suggested that apoptosis induced by taxanes is a process downstream of the activation of PERK-eIF2α signaling pathways [84]. IRE1α and p-Ser724-IRE1α are significantly upregulated in 76N cells treated with IBCar , suggesting that two independent unfolded protein response pathways may be active in this cell line. The duration of PERK and IRE1α signaling can vary following disruptions in the protein folding processes. Sustained periods of PERK activities are detrimental to cell survival. The corresponding duration of IRE1α signaling is not [85,86]. Therefore, the transient PERK activity in 76N cells is suggestive of cytoprotective functions whereas the extended PERK activity in MB468 appears to contribute to BCa cell death [86]. This temporal regulation of ER stress signaling may be a contributing factor to IBCar's selectivity. Extensive additional studies will be required to correlate the longitudinal interplay between these two pathways.
IBCar is effective in controlling breast cancer development and growth in two distinct mouse models. The MMTV-PyMT transgenic BCa mouse model represents the luminal B subtype of ER-positive BCa. Luminal B tumors exhibit moderate ER expression, elevated levels of proliferation and cell cycle genes, including high Ki67 expression [118]), making them more aggressive than luminal A. Patients with luminal B cancers have higher incidence of local recurrences and bone metastasis compared to those with non-luminal disease [119]. They also experience a higher rate of visceral recurrence and significantly shorter times from diagnosis to relapse [120]. In this group, the 5-year survival rate with current treatments is only 29%, and the median survival is 36 months [121]. Adjuvant systemic chemotherapies for these patients typically include anti-microtubule taxane-based regimens [122,123]. IBCar appears to have significant potential as an alternative treatment option in the luminal B subtype of BCa. MMTV-PyMT mice treated with IBCar did not develop any tumors during the treatment period. After treatment withdrawal, tumor recurrence was delayed by more than two weeks. Oral IBCar in J:Nu mice bearing subcutaneous TNBC MB468 xenografts produced similar outcomes demonstrating significant potential of IBCar as a treatment option for TNBC.
5. Conclusions
Most anticancer drugs, including microtubule-targeting chemotherapeutics, discriminate poorly between normal and cancer cells. However, in the instance of IBCar, the contrasting responses are striking. IBCar is selectively more cytotoxic in BCa cells. Responses of BCa cells are concentration and time of exposure dependent. To date, we found no evidence that TP53 status influences IBCar’s cytotoxicity; the compound is effective in both wtTP53 and mTP53 BCa cells. In normal cells, protective mechanisms appear to include the reversible nature of IBCar-induced microtubule depolymerization, prosurvival adaptations in the riptosome, and effective management of the ER stress. Our ongoing research focuses on further characterizing the mechanisms underlying these divergent responses. When administered orally, IBCar reduces tumor development and growth in two aggressive BCa mouse models with sustained effects even after treatment cessation. IBCar seems to be well tolerated as indicated by the stable body weights and normal hematology and serum chemistry profiles, characteristics that support its potential as a promising and less toxic alternative to conventional anti-microtubule breast cancer therapies.
Supplementary Materials
The following supporting information can be downloaded at the website of this paper posted on Preprints.org, Figure S1. Molecular docking of IBCar regioisomers. Figure S2: IBCar-concentration-dependent evaluation of mitochondrial potential in 76N normal breast cells using MitoVolt. Figure S3: Time-dependent evaluation of mitochondrial potential in 76N normal breast cells treated with 1 µM IBCar as compared to the DMSO controls using Mito Brilliant. Figure S3: Western immunoblot of p53 expression in BCa cells untreated (NT) and IBCar-treated (500 nM IBCar, 24 h). Figure S4: Western immunoblot of cleaved PARP in BCa cells untreated (NT) and IBCar-treated (500 nM IBCar, 24 h). Figure S5: Western immunoblot of β-actin to determine the protein load in lysates from BCa cells untreated (NT) and IBCar-treated (500 nM IBCar, 24 h) lysates. Figure S6. Confirmatory Western immunoblot of Cas-8 in lysates from BCa cells untreated (NT) and IBCar-treated (500 nM IBCar, 48 h) using rabbit anti-human, mouse, rat-Cas-8 antibodies PA5-87373. Figure S7: Analyses of human HSP arrays results (shown in Figure 15) of lysates from BCa cells untreated (NT) and IB-Car-treated (500 nM IBCar, 24 h). Figure S8: Longitudinal changes in tumor volume in control mice and IBCar-treated mice. Figure S9: Analysis of the expression of the endoplasmic reticulum sequential chaperone calnexin. Figure S10: Nuclear fragmentation in normal and BCa cells treated with IBCar. Blue arrowheads indicate fragmented nuclei and micronucleation. Table S1: Antibodies used in this study. Table S2: Reagents and supplies for gel electrophoresis and Western blotting. Table S3: Statistical analyses for GI50s. Table S4: Statistical analyses of MDA-MB-468 xenograft growth curves. Table S5. Hematology of female mice bearing human breast cancer xenografts. Table S6. Serum chemistry of female mice bearing human breast cancer xenografts.
Author Contributions
Conceptualization, J.B.K; methodology, J.B.K. and Y.Y.; validation, J.B.K.; formal analysis, J.B.K.; investigation, J.B.K. and Y.Y.; resources, J.B.K.; data curation, J.B.K.; writing—original draft preparation, J.B.K.; writing—review and editing, J.B.K. and Y.Y.; visualization, J.B.K.; supervision, J.B.K; project administration, J.B.K.; funding acquisition, J.B.K. All authors have read and agreed to the published version of the manuscript.
Funding
This research was funded by the DoD Breast Cancer Research Program, grant number BC201514.
Institutional Review Board Statement
The animal study protocol was approved by the UNMC Institutional Animal Care and Use Committee and Animal Care and Use Review Office (ACURO) US Army Medical Research and Development Command (IACUC protocol number 21-028-08-FC; date of approval March 20, 2024).
Informed Consent Statement
Not applicable.
Data Availability Statement
Supplementary Materials attached to this article at www.mdpi.com/xxx/s1 provide access to data not included in the article. Other data presented in this study are available on request from the corresponding author due to some restrictions related to intellectual property.
Acknowledgments
The authors thank Dr. Z. P. Kortylewicz for his invaluable help with IBCar synthesis and quality assurance protocols as well as his contribution to the molecular modeling studies. The authors also thank Ms. N. Chaika for her technical assistance. The authors also acknowledge V. B. Smith, Flow Cytometry Research Facility for her help with the cell cycle analysis.
Conflicts of Interest
The authors declare no conflict of interest.
References
- Cancer facts & figures 2025. American Cancer Society, 2025. https://www.cancer.org/research/cancer-facts-statistics/all-cancer-facts-figures/2025-cancer-facts-figures.html (accessed 04/01/2025).
- Sung, H.; Ferlay, J.; Siegel, R. L.; Laversanne, M.; Soerjomataram, I.; Jemal, A.; Bray, F. Global cancer statistics 2020: Globocan estimates of incidence and mortality worldwide for 36 cancers in 185 countries. CA Cancer J Clin 2021, 71, 209–249. [Google Scholar] [CrossRef] [PubMed]
- Arnold, M.; Morgan, E.; Rumgay, H.; Mafra, A.; Singh, D.; Laversanne, M.; Vignat, J.; Gralow, J. R.; Cardoso, F.; Siesling, S.; et al. Current and future burden of breast cancer: Global statistics for 2020 and 2040. Breast 2022, 66, 15–23. [Google Scholar] [CrossRef] [PubMed]
- Siegel, R. L.; Giaquinto, A. N.; Jemal, A. Cancer statistics, 2024. CA Cancer J Clin 2024, 74, 12–49. [Google Scholar] [CrossRef] [PubMed]
- Giaquinto, A. N.; Sung, H.; Miller, K. D.; Kramer, J. L.; Newman, L. A.; Minihan, A.; Jemal, A.; Siegel, R. L. Breast cancer statistics, 2022. CA Cancer J Clin 2022, 72, 524–541. [Google Scholar]
- Hendrick, R. E.; Monticciolo, D. L. Surveillance, epidemiology, and end results data show increasing rates of distant-stage breast cancer at presentation in U.S. Women. Radiology 2024, 313, e241397. [Google Scholar] [CrossRef]
- The Breast Cancer Landscape, 2023. https://cdmrp.health.mil/bcrp/pdfs/BreastCancerLandscape2023.pdf (accessed 06/04/2025).
- Gobbini, E.; Ezzalfani, M.; Dieras, V.; Bachelot, T.; Brain, E.; Debled, M.; Jacot, W.; Mouret-Reynier, M. A.; Goncalves, A.; Dalenc, F.; et al. Time trends of overall survival among metastatic breast cancer patients in the real-life esme cohort. Eur J Cancer 2018, 96, 17–24. [Google Scholar] [CrossRef]
- Cortes, J.; O'Shaughnessy, J.; Loesch, D.; Blum, J. L.; Vahdat, L. T.; Petrakova, K.; Chollet, P.; Manikas, A.; Dieras, V.; Delozier, T.; et al. Eribulin monotherapy versus treatment of physician's choice in patients with metastatic breast cancer (embrace): A phase 3 open-label randomised study. Lancet 2011, 377, 914–923. [Google Scholar] [CrossRef]
- Lin, N. U.; Murthy, R. K.; Abramson, V.; Anders, C.; Bachelot, T.; Bedard, P. L.; Borges, V.; Cameron, D.; Carey, L. A.; Chien, A. J.; et al. Tucatinib vs. placebo, both in combination with trastuzumab and capecitabine, for previously treated erbb2 (her2)-positive metastatic breast cancer in patients with brain metastases: Updated exploratory analysis of the her2climb randomized clinical trial. JAMA Oncol 2023, 9, 197–205. [Google Scholar]
- Lin, N. U.; Borges, V.; Anders, C.; Murthy, R. K.; Paplomata, E.; Hamilton, E.; Hurvitz, S.; Loi, S.; Okines, A.; Abramson, V.; et al. Intracranial efficacy and survival with tucatinib plus trastuzumab and capecitabine for previously treated her2-positive breast cancer with brain metastases in the her2climb trial. J Clin Oncol 2020, 38, 2610–2619. [Google Scholar]
- Buisseret, L.; Loirat, D.; Aftimos, P.; Maurer, C.; Punie, K.; Debien, V.; Kristanto, P.; Eiger, D.; Goncalves, A.; Ghiringhelli, F.; et al. Paclitaxel plus carboplatin and durvalumab with or without oleclumab for women with previously untreated locally advanced or metastatic triple-negative breast cancer: The randomized synergy phase i/ii trial. Nat Commun 2023, 14, 7018. [Google Scholar] [CrossRef]
- Mougalian, S. S.; Kish, J. K.; Zhang, J.; Liassou, D.; Feinberg, B. A. Effectiveness of eribulin in metastatic breast cancer: 10 years of real-world clinical experience in the united states. Adv Ther 2021, 38, 2213–2225. [Google Scholar] [CrossRef] [PubMed]
- Gumusay, O.; Huppert, L. A.; Magbanua, M. J. M.; Wabl, C. A.; Assefa, M.; Chien, A. J.; Melisko, M. E.; Majure, M. C.; Moasser, M.; Park, J.; et al. A phase ib/ii study of eribulin in combination with cyclophosphamide in patients with advanced breast cancer. Breast Cancer Res Treat 2024, 203, 197–204. [Google Scholar] [CrossRef] [PubMed]
- La Verde, N.; Damia, G.; Garrone, O.; Santini, D.; Fabi, A.; Ciccarese, M.; Generali, D. G.; Nunzi, M.; Poletto, E.; Ferraris, E.; et al. Tolerability of eribulin and correlation between polymorphisms and neuropathy in an unselected population of female patients with metastatic breast cancer: Results of the multicenter, single arm, phase iv painter study. Breast Cancer Res 2022, 24, 71. [Google Scholar] [CrossRef] [PubMed]
- Rugo, H. S.; Barry, W. T.; Moreno-Aspitia, A.; Lyss, A. P.; Cirrincione, C.; Leung, E.; Mayer, E. L.; Naughton, M.; Toppmeyer, D.; Carey, L. A.; et al. Randomized phase iii trial of paclitaxel once per week compared with nanoparticle albumin-bound nab-paclitaxel once per week or ixabepilone with bevacizumab as first-line chemotherapy for locally recurrent or metastatic breast cancer: Calgb 40502/ncctg n063h (alliance). J Clin Oncol 2015, 33, 2361–2369. [Google Scholar]
- Rugo, H. S.; Roche, H.; Thomas, E.; Chung, H. C.; Lerzo, G. L.; Vasyutin, I.; Patel, A.; Vahdat, L. Efficacy and safety of ixabepilone and capecitabine in patients with advanced triple-negative breast cancer: A pooled analysis from two large phase iii, randomized clinical trials. Clin Breast Cancer 2018, 18, 489–497. [Google Scholar] [CrossRef]
- Yardley, D. A.; Arrowsmith, E. R.; Daniel, B. R.; Eakle, J.; Brufsky, A.; Drosick, D. R.; Kudrik, F.; Bosserman, L. D.; Keaton, M. R.; Goble, S. A.; et al. Titan: Phase iii study of doxorubicin/cyclophosphamide followed by ixabepilone or paclitaxel in early-stage triple-negative breast cancer. Breast Cancer Res Treat 2017, 164, 649–658. [Google Scholar] [CrossRef]
- Ohi, R.; Zanic, M. Ahead of the curve: New insights into microtubule dynamics. F1000Res 2016, 5. [Google Scholar] [CrossRef]
- Cirillo, L.; Gotta, M.; Meraldi, P. The elephant in the room: The role of microtubules in cancer. Adv Exp Med Biol 2017, 1002, 93–124. [Google Scholar]
- Goodson, H. V.; Jonasson, E. M. Microtubules and microtubule-associated proteins. Cold Spring Harb Perspect Biol 2018, 10. [Google Scholar] [CrossRef]
- Vicente, J. J.; Wordeman, L. The quantification and regulation of microtubule dynamics in the mitotic spindle. Curr Opin Cell Biol 2019, 60, 36–43. [Google Scholar] [CrossRef]
- Jordan, M. A.; Wilson, L. Microtubules as a target for anticancer drugs. Nat Rev Cancer 2004, 4, 253–265. [Google Scholar] [CrossRef] [PubMed]
- Mukhtar, E.; Adhami, V. M.; Mukhtar, H. Targeting microtubules by natural agents for cancer therapy. Mol Cancer Ther 2014, 13, 275–284. [Google Scholar] [CrossRef] [PubMed]
- Masci, D.; Naro, C.; Puxeddu, M.; Urbani, A.; Sette, C.; La Regina, G.; Silvestri, R. Recent advances in drug discovery for triple-negative breast cancer treatment. Molecules 2023, 28. [Google Scholar] [CrossRef]
- Stanton, R. A.; Gernert, K. M.; Nettles, J. H.; Aneja, R. Drugs that target dynamic microtubules: A new molecular perspective. Med Res Rev 2011, 31, 443–481. [Google Scholar] [CrossRef]
- Christensen, S. B. Drugs that changed society: Microtubule-targeting agents belonging to taxanoids, macrolides and non-ribosomal peptides. Molecules 2022, 27. [Google Scholar] [CrossRef]
- Cavaletti, G.; Alberti, P.; Argyriou, A. A.; Lustberg, M.; Staff, N. P.; Tamburin, S.; Toxic Neuropathy Consortium of the Peripheral Nerve, S. Chemotherapy-induced peripheral neurotoxicity: A multifaceted, still unsolved issue. J Peripher Nerv Syst 2019, 24 Suppl 2, S6–S12. [Google Scholar] [CrossRef]
- Park, S. B.; Goldstein, D.; Krishnan, A. V.; Lin, C. S.; Friedlander, M. L.; Cassidy, J.; Koltzenburg, M.; Kiernan, M. C. Chemotherapy-induced peripheral neurotoxicity: A critical analysis. CA Cancer J Clin 2013, 63, 419–437. [Google Scholar] [CrossRef]
- Bao, T.; Basal, C.; Seluzicki, C.; Li, S. Q.; Seidman, A. D.; Mao, J. J. Long-term chemotherapy-induced peripheral neuropathy among breast cancer survivors: Prevalence, risk factors, and fall risk. Breast Cancer Res Treat 2016, 159, 327–333. [Google Scholar] [CrossRef]
- Flatters, S. J. L.; Dougherty, P. M.; Colvin, L. A. Clinical and preclinical perspectives on chemotherapy-induced peripheral neuropathy (cipn): A narrative review. Br J Anaesth 2017, 119, 737–749. [Google Scholar] [CrossRef]
- Ma, J.; Kavelaars, A.; Dougherty, P. M.; Heijnen, C. J. Beyond symptomatic relief for chemotherapy-induced peripheral neuropathy: Targeting the source. Cancer 2018, 124, 2289–2298. [Google Scholar] [CrossRef]
- Zhao, X.; Malhotra, G. K.; Lele, S. M.; Lele, M. S.; West, W. W.; Eudy, J. D.; Band, H.; Band, V. Telomerase-immortalized human mammary stem/progenitor cells with ability to self-renew and differentiate. Proc Natl Acad Sci U S A 2010, 107, 14146–14151. [Google Scholar] [CrossRef] [PubMed]
- Kortylewicz, Z. P.; Baranowska-Kortylewicz, J. Radiosynthesis of microtubule-targeted theranostic methyl n-[5-(3'-radiohalobenzoyl)-1h-benzimidazol-2-yl]carbamates. J Labelled Comp Radiopharm 2018, 61, 749–756. [Google Scholar] [CrossRef] [PubMed]
- Kortylewicz, Z. P.; Coulter, D. W.; Baranowska-Kortylewicz, J. In vitro and in vivo evaluation of radiolabeled methyl n-[5-(3'-halobenzoyl)-1h-benzimidazol-2-yl]carbamate for cancer radiotherapy. Drug Dev Res 2020, 81, 62–69. [Google Scholar] [CrossRef] [PubMed]
- Kortylewicz, Z. P.; Coulter, D. W.; Baranowska-Kortylewicz, J. Biological evaluation of a potential anticancer agent methyl n-[5-(3'-iodobenzoyl)-1h-benzimidazol-2-yl]carbamate. Cancer Biother Radiopharm 2020, 35, 16–25. [Google Scholar]
- PDB Protein Data Bank, 2018. https://www.rcsb.org/structure/6BRY (accessed 05/07/2025).
- Morris, G. M.; Huey, R.; Lindstrom, W.; Sanner, M. F.; Belew, R. K.; Goodsell, D. S.; Olson, A. J. Autodock4 and autodocktools4: Automated docking with selective receptor flexibility. J Comput Chem 2009, 30, 2785–2791. [Google Scholar] [CrossRef]
- The Scripps Research Institute, 2018. https://autodock.scripps.edu/resources/ (accessed 05/07/2025).
- Kortylewicz, Z. P.; Coulter, D. W.; Han, G.; Baranowska-Kortylewicz, J. Radiolabeled (r)-(-)-5-iodo-3'-o-[2-(epsilon-guanidinohexanoyl)-2-phenylacetyl]-2'-deoxyuridine: A new theranostic for neuroblastoma. J Labelled Comp Radiopharm 2020. [Google Scholar] [CrossRef]
- Guy, C. T.; Cardiff, R. D.; Muller, W. J. Induction of mammary tumors by expression of polyomavirus middle t oncogene: A transgenic mouse model for metastatic disease. Mol Cell Biol 1992, 12, 954–961. [Google Scholar]
- The Jackson Laboratory, 2024. https://www.jax.org/strain/002374 (accessed 05/10/2025).
- The NCI Developmental Therapeutics Program, https://dtp.cancer.gov/services/nci60data/colordoseresponse/pdf/811291 (accessed 07/07/2024).
- Perkins, D. W.; Steiner, I.; Haider, S.; Robertson, D.; Buus, R.; O'Leary, L.; Isacke, C. M. Therapy-induced normal tissue damage promotes breast cancer metastasis. iScience 2024, 27, 108503. [Google Scholar] [CrossRef]
- Cooke, V. G.; LeBleu, V. S.; Keskin, D.; Khan, Z.; O'Connell, J. T.; Teng, Y.; Duncan, M. B.; Xie, L.; Maeda, G.; Vong, S.; et al. Pericyte depletion results in hypoxia-associated epithelial-to-mesenchymal transition and metastasis mediated by met signaling pathway. Cancer Cell 2012, 21, 66–81. [Google Scholar] [CrossRef]
- Ippolitov, D.; Arreza, L.; Munir, M. N.; Hombach-Klonisch, S. Brain microvascular pericytes-more than bystanders in breast cancer brain metastasis. Cells 2022, 11. [Google Scholar] [CrossRef]
- Pieterse, Z.; Sinha, D.; Kaur, P. Pericytes in metastasis. Adv Exp Med Biol 2019, 1147, 125–135. [Google Scholar] [PubMed]
- Nigro, J. M.; Baker, S. J.; Preisinger, A. C.; Jessup, J. M.; Hostetter, R.; Cleary, K.; Bigner, S. H.; Davidson, N.; Baylin, S.; Devilee, P.; et al. Mutations in the p53 gene occur in diverse human tumour types. Nature 1989, 342, 705–708. [Google Scholar] [CrossRef] [PubMed]
- Wang, H.; Liao, P.; Zeng, S. X.; Lu, H. It takes a team: A gain-of-function story of p53-r249s. J Mol Cell Biol 2019, 11, 277–283. [Google Scholar] [CrossRef] [PubMed]
- Norbury, C.; Blow, J.; Nurse, P. Regulatory phosphorylation of the p34cdc2 protein kinase in vertebrates. EMBO J 1991, 10, 3321–3329. [Google Scholar] [CrossRef]
- Medema, J. P.; Scaffidi, C.; Kischkel, F. C.; Shevchenko, A.; Mann, M.; Krammer, P. H.; Peter, M. E. Flice is activated by association with the cd95 death-inducing signaling complex (disc). EMBO J 1997, 16, 2794–2804. [Google Scholar] [CrossRef]
- Chang, D. W.; Xing, Z.; Capacio, V. L.; Peter, M. E.; Yang, X. Interdimer processing mechanism of procaspase-8 activation. EMBO J 2003, 22, 4132–4142. [Google Scholar] [CrossRef]
- Hoffmann, J. C.; Pappa, A.; Krammer, P. H.; Lavrik, I. N. A new c-terminal cleavage product of procaspase-8, p30, defines an alternative pathway of procaspase-8 activation. Mol Cell Biol 2009, 29, 4431–4440. [Google Scholar] [CrossRef]
- Kallenberger, S. M.; Beaudouin, J.; Claus, J.; Fischer, C.; Sorger, P. K.; Legewie, S.; Eils, R. Intra- and interdimeric caspase-8 self-cleavage controls strength and timing of cd95-induced apoptosis. Sci Signal 2014, 7, ra23. [Google Scholar] [CrossRef]
- Hughes, M. A.; Harper, N.; Butterworth, M.; Cain, K.; Cohen, G. M.; MacFarlane, M. Reconstitution of the death-inducing signaling complex reveals a substrate switch that determines cd95-mediated death or survival. Mol Cell 2009, 35, 265–279. [Google Scholar] [CrossRef]
- Meylan, E.; Tschopp, J. The rip kinases: Crucial integrators of cellular stress. Trends Biochem Sci 2005, 30, 151–159. [Google Scholar] [CrossRef]
- Festjens, N.; Vanden Berghe, T.; Cornelis, S.; Vandenabeele, P. Rip1, a kinase on the crossroads of a cell's decision to live or die. Cell Death Differ 2007, 14, 400–410. [Google Scholar] [CrossRef] [PubMed]
- Schilling, R.; Geserick, P.; Leverkus, M. Characterization of the ripoptosome and its components: Implications for anti-inflammatory and cancer therapy. Methods Enzymol 2014, 545, 83–102. [Google Scholar] [PubMed]
- Zhang, L.; Blackwell, K.; Workman, L. M.; Chen, S.; Pope, M. R.; Janz, S.; Habelhah, H. Rip1 cleavage in the kinase domain regulates trail-induced nf-kappab activation and lymphoma survival. Mol Cell Biol 2015, 35, 3324–3338. [Google Scholar] [CrossRef] [PubMed]
- Liccardi, G.; Ramos Garcia, L.; Tenev, T.; Annibaldi, A.; Legrand, A. J.; Robertson, D.; Feltham, R.; Anderton, H.; Darding, M.; Peltzer, N.; et al. Ripk1 and caspase-8 ensure chromosome stability independently of their role in cell death and inflammation. Mol Cell 2019, 73, 413–428. [Google Scholar] [CrossRef] [PubMed]
- Koo, G. B.; Morgan, M. J.; Lee, D. G.; Kim, W. J.; Yoon, J. H.; Koo, J. S.; Kim, S. I.; Kim, S. J.; Son, M. K.; Hong, S. S.; et al. Methylation-dependent loss of rip3 expression in cancer represses programmed necrosis in response to chemotherapeutics. Cell Res 2015, 25, 707–725. [Google Scholar] [CrossRef] [PubMed]
- Rodriguez, D. A.; Weinlich, R.; Brown, S.; Guy, C.; Fitzgerald, P.; Dillon, C. P.; Oberst, A.; Quarato, G.; Low, J.; Cripps, J. G.; et al. Characterization of ripk3-mediated phosphorylation of the activation loop of mlkl during necroptosis. Cell Death Differ 2016, 23, 76–88. [Google Scholar] [CrossRef] [PubMed]
- van Raam, B. J.; Ehrnhoefer, D. E.; Hayden, M. R.; Salvesen, G. S. Intrinsic cleavage of receptor-interacting protein kinase-1 by caspase-6. Cell Death Differ 2013, 20, 86–96. [Google Scholar] [CrossRef]
- Slee, E. A.; Adrain, C.; Martin, S. J. Executioner caspase-3, -6, and -7 perform distinct, non-redundant roles during the demolition phase of apoptosis. J Biol Chem 2001, 276, 7320–7326. [Google Scholar] [CrossRef]
- Martinon, F.; Holler, N.; Richard, C.; Tschopp, J. Activation of a pro-apoptotic amplification loop through inhibition of nf-kappab-dependent survival signals by caspase-mediated inactivation of rip. FEBS Lett 2000, 468, (2–3). [Google Scholar] [CrossRef]
- Degterev, A.; Hitomi, J.; Germscheid, M.; Ch'en, I. L.; Korkina, O.; Teng, X.; Abbott, D.; Cuny, G. D.; Yuan, C.; Wagner, G.; et al. Identification of rip1 kinase as a specific cellular target of necrostatins. Nat Chem Biol 2008, 4, 313–321. [Google Scholar] [CrossRef]
- Duan, X.; Liu, X.; Liu, N.; Huang, Y.; Jin, Z.; Zhang, S.; Ming, Z.; Chen, H. Inhibition of keratinocyte necroptosis mediated by ripk1/ripk3/mlkl provides a protective effect against psoriatic inflammation. Cell Death Dis 2020, 11, 134. [Google Scholar] [CrossRef]
- Lin, Y.; Devin, A.; Rodriguez, Y.; Liu, Z. G. Cleavage of the death domain kinase rip by caspase-8 prompts tnf-induced apoptosis. Genes Dev 1999, 13, 2514–2526. [Google Scholar] [CrossRef]
- Kim, J. W.; Choi, E. J.; Joe, C. O. Activation of death-inducing signaling complex (disc) by pro-apoptotic c-terminal fragment of rip. Oncogene 2000, 19, 4491–4499. [Google Scholar] [CrossRef]
- Deng, X. X.; Li, S. S.; Sun, F. Y. Necrostatin-1 prevents necroptosis in brains after ischemic stroke via inhibition of ripk1-mediated ripk3/mlkl signaling. Aging Dis 2019, 10, 807–817. [Google Scholar] [CrossRef]
- Zhou, H.; Liu, L.; Ma, X.; Wang, J.; Yang, J.; Zhou, X.; Yang, Y.; Liu, H. Rip1/rip3/mlkl-mediated necroptosis contributes to vinblastine-induced myocardial damage. Mol Cell Biochem 2021, 476, 1233–1243. [Google Scholar] [CrossRef]
- Pyrko, P.; Schonthal, A. H.; Hofman, F. M.; Chen, T. C.; Lee, A. S. The unfolded protein response regulator grp78/bip as a novel target for increasing chemosensitivity in malignant gliomas. Cancer Res 2007, 67, 9809–9816. [Google Scholar] [CrossRef]
- Roller, C.; Maddalo, D. The molecular chaperone grp78/bip in the development of chemoresistance: Mechanism and possible treatment. Front Pharmacol 2013, 4, 10. [Google Scholar] [CrossRef]
- Xie, J.; Tao, Z. H.; Zhao, J.; Li, T.; Wu, Z. H.; Zhang, J. F.; Zhang, J.; Hu, X. C. Glucose regulated protein 78 (grp78) inhibits apoptosis and attentinutes chemosensitivity of gemcitabine in breast cancer cell via akt/mitochondrial apoptotic pathway. Biochem Biophys Res Commun 2016, 474, 612–619. [Google Scholar] [CrossRef]
- Kohno, K.; Normington, K.; Sambrook, J.; Gething, M. J.; Mori, K. The promoter region of the yeast kar2 (bip) gene contains a regulatory domain that responds to the presence of unfolded proteins in the endoplasmic reticulum. Mol Cell Biol 1993, 13, 877–890. [Google Scholar]
- Gething, M. J. Role and regulation of the er chaperone bip. Semin Cell Dev Biol 1999, 10, 465–472. [Google Scholar] [CrossRef]
- Lee, A. S. Grp78 induction in cancer: Therapeutic and prognostic implications. Cancer Res 2007, 67, 3496–3499. [Google Scholar] [CrossRef] [PubMed]
- Wang, J.; Yin, Y.; Hua, H.; Li, M.; Luo, T.; Xu, L.; Wang, R.; Liu, D.; Zhang, Y.; Jiang, Y. Blockade of grp78 sensitizes breast cancer cells to microtubules-interfering agents that induce the unfolded protein response. J Cell Mol Med 2009, 13, 3888–3897. [Google Scholar] [CrossRef] [PubMed]
- Gutierrez, T.; Qi, H.; Yap, M. C.; Tahbaz, N.; Milburn, L. A.; Lucchinetti, E.; Lou, P. H.; Zaugg, M.; LaPointe, P. G.; Mercier, P.; et al. The er chaperone calnexin controls mitochondrial positioning and respiration. Sci Signal 2020, 13. [Google Scholar] [CrossRef]
- Brewer, J. W.; Diehl, J. A. Perk mediates cell-cycle exit during the mammalian unfolded protein response. Proc Natl Acad Sci U S A 2000, 97, 12625–12630. [Google Scholar] [CrossRef] [PubMed]
- Donnelly, N.; Gorman, A. M.; Gupta, S.; Samali, A. The eif2alpha kinases: Their structures and functions. Cell Mol Life Sci 2013, 70, 3493–3511. [Google Scholar] [CrossRef]
- Liu, Z.; Lv, Y.; Zhao, N.; Guan, G.; Wang, J. Protein kinase r-like er kinase and its role in endoplasmic reticulum stress-decided cell fate. Cell Death Dis 2015, 6, e1822. [Google Scholar] [CrossRef]
- Chen, L.; He, J.; Zhou, J.; Xiao, Z.; Ding, N.; Duan, Y.; Li, W.; Sun, L. Q. Eif2a promotes cell survival during paclitaxel treatment in vitro and in vivo. J Cell Mol Med 2019, 23, 6060–6071. [Google Scholar] [CrossRef]
- Cai, W.; Rong, D.; Ding, J.; Zhang, X.; Wang, Y.; Fang, Y.; Xiao, J.; Yang, S.; Wang, H. Activation of the perk/eif2alpha axis is a pivotal prerequisite of taxanes to cancer cell apoptosis and renders synergism to overcome paclitaxel resistance in breast cancer cells. Cancer Cell Int 2024, 24, 249. [Google Scholar] [CrossRef]
- Li, H.; Korennykh, A. V.; Behrman, S. L.; Walter, P. Mammalian endoplasmic reticulum stress sensor ire1 signals by dynamic clustering. Proc Natl Acad Sci U S A 2010, 107, 16113–16118. [Google Scholar] [CrossRef]
- Han, D.; Lerner, A. G.; Vande Walle, L.; Upton, J. P.; Xu, W.; Hagen, A.; Backes, B. J.; Oakes, S. A.; Papa, F. R. Ire1alpha kinase activation modes control alternate endoribonuclease outputs to determine divergent cell fates. Cell 2009, 138, 562–575. [Google Scholar] [CrossRef]
- Li, H.; Zhang, H.; Huang, G.; Bing, Z.; Xu, D.; Liu, J.; Luo, H.; An, X. Loss of rps27a expression regulates the cell cycle, apoptosis, and proliferation via the rpl11-mdm2-p53 pathway in lung adenocarcinoma cells. J Exp Clin Cancer Res 2022, 41, 33. [Google Scholar] [CrossRef] [PubMed]
- Bernier-Valentin, F.; Rousset, B. Interaction of tubulin with rat liver mitochondria. J Biol Chem 1982, 257, 7092–7099. [Google Scholar] [CrossRef] [PubMed]
- Carre, M.; Andre, N.; Carles, G.; Borghi, H.; Brichese, L.; Briand, C.; Braguer, D. Tubulin is an inherent component of mitochondrial membranes that interacts with the voltage-dependent anion channel. J Biol Chem 2002, 277, 33664–33669. [Google Scholar] [CrossRef] [PubMed]
- Maldonado, E. N.; Patnaik, J.; Mullins, M. R.; Lemasters, J. J. Free tubulin modulates mitochondrial membrane potential in cancer cells. Cancer Res 2010, 70, 10192–10201. [Google Scholar] [CrossRef]
- Pfefferle, A. D.; Herschkowitz, J. I.; Usary, J.; Harrell, J. C.; Spike, B. T.; Adams, J. R.; Torres-Arzayus, M. I.; Brown, M.; Egan, S. E.; Wahl, G. M.; et al. Transcriptomic classification of genetically engineered mouse models of breast cancer identifies human subtype counterparts. Genome Biol 2013, 14, R125. [Google Scholar] [CrossRef]
- Lin, E. Y.; Jones, J. G.; Li, P.; Zhu, L.; Whitney, K. D.; Muller, W. J.; Pollard, J. W. Progression to malignancy in the polyoma middle t oncoprotein mouse breast cancer model provides a reliable model for human diseases. Am J Pathol 2003, 163, 2113–2126. [Google Scholar] [CrossRef]
- Attalla, S.; Taifour, T.; Bui, T.; Muller, W. Insights from transgenic mouse models of pymt-induced breast cancer: Recapitulating human breast cancer progression in vivo. Oncogene 2021, 40, 475–491. [Google Scholar] [CrossRef]
- Sopik, V.; Sun, P.; Narod, S. A. The prognostic effect of estrogen receptor status differs for younger versus older breast cancer patients. Breast Cancer Res Treat 2017, 165, 391–402. [Google Scholar] [CrossRef]
- Seretny, M.; Currie, G. L.; Sena, E. S.; Ramnarine, S.; Grant, R.; MacLeod, M. R.; Colvin, L. A.; Fallon, M. Incidence, prevalence, and predictors of chemotherapy-induced peripheral neuropathy: A systematic review and meta-analysis. Pain 2014, 155, 2461–2470. [Google Scholar] [CrossRef]
- https://www.Cancer.Org/cancer/types/breast-cancer/about/how-common-is-breast-cancer.html. 2024.
- McDivitt, R. W.; Stone, K. R.; Craig, R. B.; Palmer, J. O.; Meyer, J. S.; Bauer, W. C. A proposed classification of breast cancer based on kinetic information: Derived from a comparison of risk factors in 168 primary operable breast cancers. Cancer 1986, 57, 269–276. [Google Scholar] [CrossRef]
- Dressler, L. G.; Seamer, L. C.; Owens, M. A.; Clark, G. M.; McGuire, W. L. DNA flow cytometry and prognostic factors in 1331 frozen breast cancer specimens. Cancer 1988, 61, 420–427. [Google Scholar] [CrossRef] [PubMed]
- Aaltomaa, S.; Lipponen, P.; Papinaho, S.; Syrjanen, K. Proliferating-cell nuclear antigen (pc10) immunolabelling and other proliferation indices as prognostic factors in breast cancer. J Cancer Res Clin Oncol 1993, 119, 288–294. [Google Scholar] [CrossRef] [PubMed]
- von Fournier, D.; Weber, E.; Hoeffken, W.; Bauer, M.; Kubli, F.; Barth, V. Growth rate of 147 mammary carcinomas. Cancer 1980, 45, 2198–2207. [Google Scholar] [CrossRef] [PubMed]
- Ungerleider, N. A.; Rao, S. G.; Shahbandi, A.; Yee, D.; Niu, T.; Frey, W. D.; Jackson, J. G. Breast cancer survival predicted by tp53 mutation status differs markedly depending on treatment. Breast Cancer Res 2018, 20, 115. [Google Scholar] [CrossRef]
- Cancer Genome Atlas, N. Comprehensive molecular portraits of human breast tumours. Nature 2012, 490, 61–70. [Google Scholar] [CrossRef]
- Weiss, M. B.; Vitolo, M. I.; Mohseni, M.; Rosen, D. M.; Denmeade, S. R.; Park, B. H.; Weber, D. J.; Bachman, K. E. Deletion of p53 in human mammary epithelial cells causes chromosomal instability and altered therapeutic response. Oncogene 2010, 29, 4715–4724. [Google Scholar] [CrossRef]
- Orning, P.; Lien, E. Multiple roles of caspase-8 in cell death, inflammation, and innate immunity. J Leukoc Biol 2021, 109, 121–141. [Google Scholar] [CrossRef]
- Contadini, C.; Ferri, A.; Cirotti, C.; Stupack, D.; Barila, D. Caspase-8 and tyrosine kinases: A dangerous liaison in cancer. Cancers (Basel) 2023, 15. [Google Scholar] [CrossRef]
- Schrek, R. Sensitivity of leukaemic lymphocytes to microtubular reagents. Br J Exp Pathol 1975, 56, 280–285. [Google Scholar]
- DeAngelis, L. M.; Gnecco, C.; Taylor, L.; Warrell, R. P., Jr. Evolution of neuropathy and myopathy during intensive vincristine/corticosteroid chemotherapy for non-hodgkin's lymphoma. Cancer 1991, 67, 2241–2246. [Google Scholar] [CrossRef]
- Salerni, B. L.; Bates, D. J.; Albershardt, T. C.; Lowrey, C. H.; Eastman, A. Vinblastine induces acute, cell cycle phase-independent apoptosis in some leukemias and lymphomas and can induce acute apoptosis in others when mcl-1 is suppressed. Mol Cancer Ther 2010, 9, 791–802. [Google Scholar] [CrossRef] [PubMed]
- Horton, J. K.; Houghton, P. J.; Houghton, J. A. Relationships between tumor responsiveness, vincristine pharmacokinetics and arrest of mitosis in human tumor xenografts. Biochem Pharmacol 1988, 37, 3995–4000. [Google Scholar] [CrossRef] [PubMed]
- Milas, L.; Hunter, N. R.; Kurdoglu, B.; Mason, K. A.; Meyn, R. E.; Stephens, L. C.; Peters, L. J. Kinetics of mitotic arrest and apoptosis in murine mammary and ovarian tumors treated with taxol. Cancer Chemother Pharmacol 1995, 35, 297–303. [Google Scholar] [CrossRef] [PubMed]
- Gascoigne, K. E.; Taylor, S. S. Cancer cells display profound intra- and interline variation following prolonged exposure to antimitotic drugs. Cancer Cell 2008, 14, 111–122. [Google Scholar] [CrossRef]
- Mitchison, T. J. The proliferation rate paradox in antimitotic chemotherapy. Mol Biol Cell 2012, 23, 1–6. [Google Scholar] [CrossRef]
- Rostovtseva, T. K.; Sheldon, K. L.; Hassanzadeh, E.; Monge, C.; Saks, V.; Bezrukov, S. M.; Sackett, D. L. Tubulin binding blocks mitochondrial voltage-dependent anion channel and regulates respiration. Proc Natl Acad Sci U S A 2008, 105, 18746–18751. [Google Scholar] [CrossRef]
- Lee, A. S. Glucose-regulated proteins in cancer: Molecular mechanisms and therapeutic potential. Nat Rev Cancer 2014, 14, 263–276. [Google Scholar] [CrossRef]
- Hammond, C.; Helenius, A. Folding of vsv g protein: Sequential interaction with bip and calnexin. Science 1994, 266, 456–458. [Google Scholar] [CrossRef]
- Kim, P. S.; Arvan, P. Calnexin and bip act as sequential molecular chaperones during thyroglobulin folding in the endoplasmic reticulum. J Cell Biol 1995, 128, (1–2). [Google Scholar] [CrossRef]
- Molinari, M.; Galli, C.; Piccaluga, V.; Pieren, M.; Paganetti, P. Sequential assistance of molecular chaperones and transient formation of covalent complexes during protein degradation from the er. J Cell Biol 2002, 158, 247–257. [Google Scholar] [CrossRef]
- Inic, Z.; Zegarac, M.; Inic, M.; Markovic, I.; Kozomara, Z.; Djurisic, I.; Inic, I.; Pupic, G.; Jancic, S. Difference between luminal a and luminal b subtypes according to ki-67, tumor size, and progesterone receptor negativity providing prognostic information. Clin Med Insights Oncol 2014, 8, 107–111. [Google Scholar] [CrossRef] [PubMed]
- Li, Z. H.; Hu, P. H.; Tu, J. H.; Yu, N. S. Luminal b breast cancer: Patterns of recurrence and clinical outcome. Oncotarget 2016, 7, 65024–65033. [Google Scholar] [CrossRef] [PubMed]
- Park, S.; Koo, J. S.; Kim, M. S.; Park, H. S.; Lee, J. S.; Lee, J. S.; Kim, S. I.; Park, B. W. Characteristics and outcomes according to molecular subtypes of breast cancer as classified by a panel of four biomarkers using immunohistochemistry. Breast 2012, 21, 50–57. [Google Scholar] [CrossRef] [PubMed]
- Lindman, H.; Wiklund, F.; Andersen, K. K. Long-term treatment patterns and survival in metastatic breast cancer by intrinsic subtypes - an observational cohort study in Sweden. BMC Cancer 2022, 22, 1006. [Google Scholar] [CrossRef]
- Park, C.; Park, K.; Kim, J.; Sin, Y.; Park, I.; Cho, H.; Yang, K.; Bae, B. N.; Kim, K. W.; Ahn, S.; et al. Prognostic values of negative estrogen or progesterone receptor expression in patients with luminal b her2-negative breast cancer. World J Surg Oncol 2016, 14, 244. [Google Scholar] [CrossRef]
- NCCN, 2025. https://www.nccn.org/professionals/physician_gls/pdf/breast.pdf (accessed 05/01/2025).
Figure 1.
A. Chemical structure of IBCar. B. Molecular docking analyses of IBCar interactions with α- and β-chains of tubulin. C. Close-up of IBCar in its binding site. D. Molecular surface of the IBCar binding pocket in the β-chain. Hydrogen bonds with Asn101 (α-chain), Ser178 (α-chain), and Asn258 (β-chain) are shown as yellow dots.
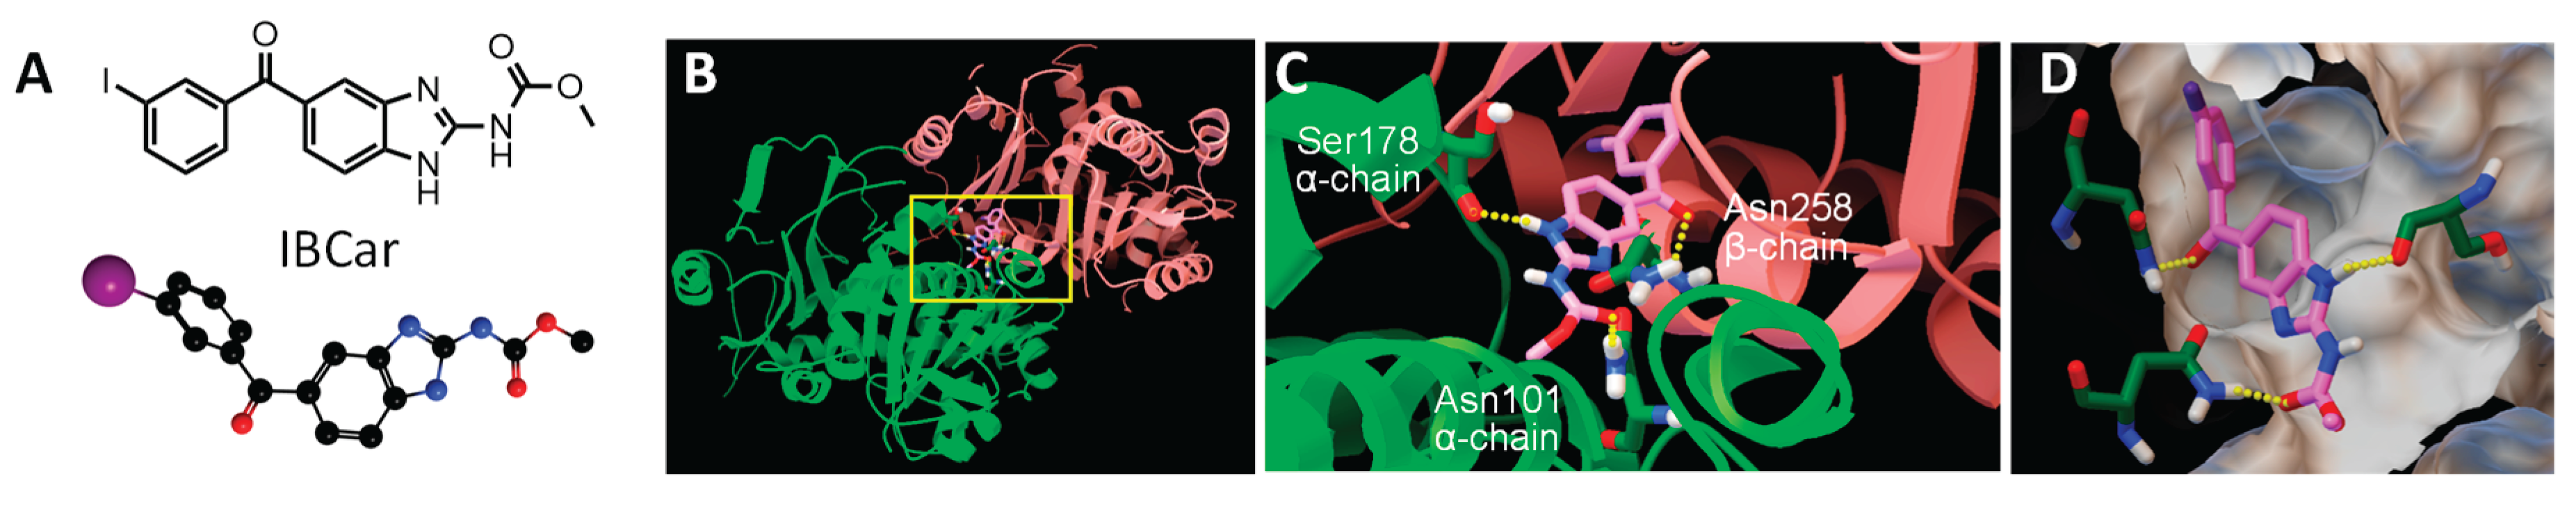
Figure 2.
Cytotoxicity of IBCar in normal cells and BCa cells. A-C. Cell survival after 48 h treatment with IBCar determined using the MTS assay. A. Comparison of IBCar cytotoxicity in BT549 and HCC70 cells derived from the primary tumor with normal breast 76N cells. B. Comparison of IBCar cytotoxicity in MB361 cells derived from brain metastases with human astrocytes. C. Comparison of IBCar cytotoxicity in MB175 and MB468 cells derived from pleural effusions with human pericytes. D-G. Survival of BCa cells treated with IBCar determined using the clonogenic assay. D. Surviving fraction of MB231 cells after 24 h with IBCar. E. Colonies of MB231 cells: controls (DMSO) or treated with IBCar for 24 h. F. Surviving fraction of MB468 cells after 48 h with IBCar. G. Colonies of MB468 cells: controls (DMSO) or treated with IBCar for 48 h.
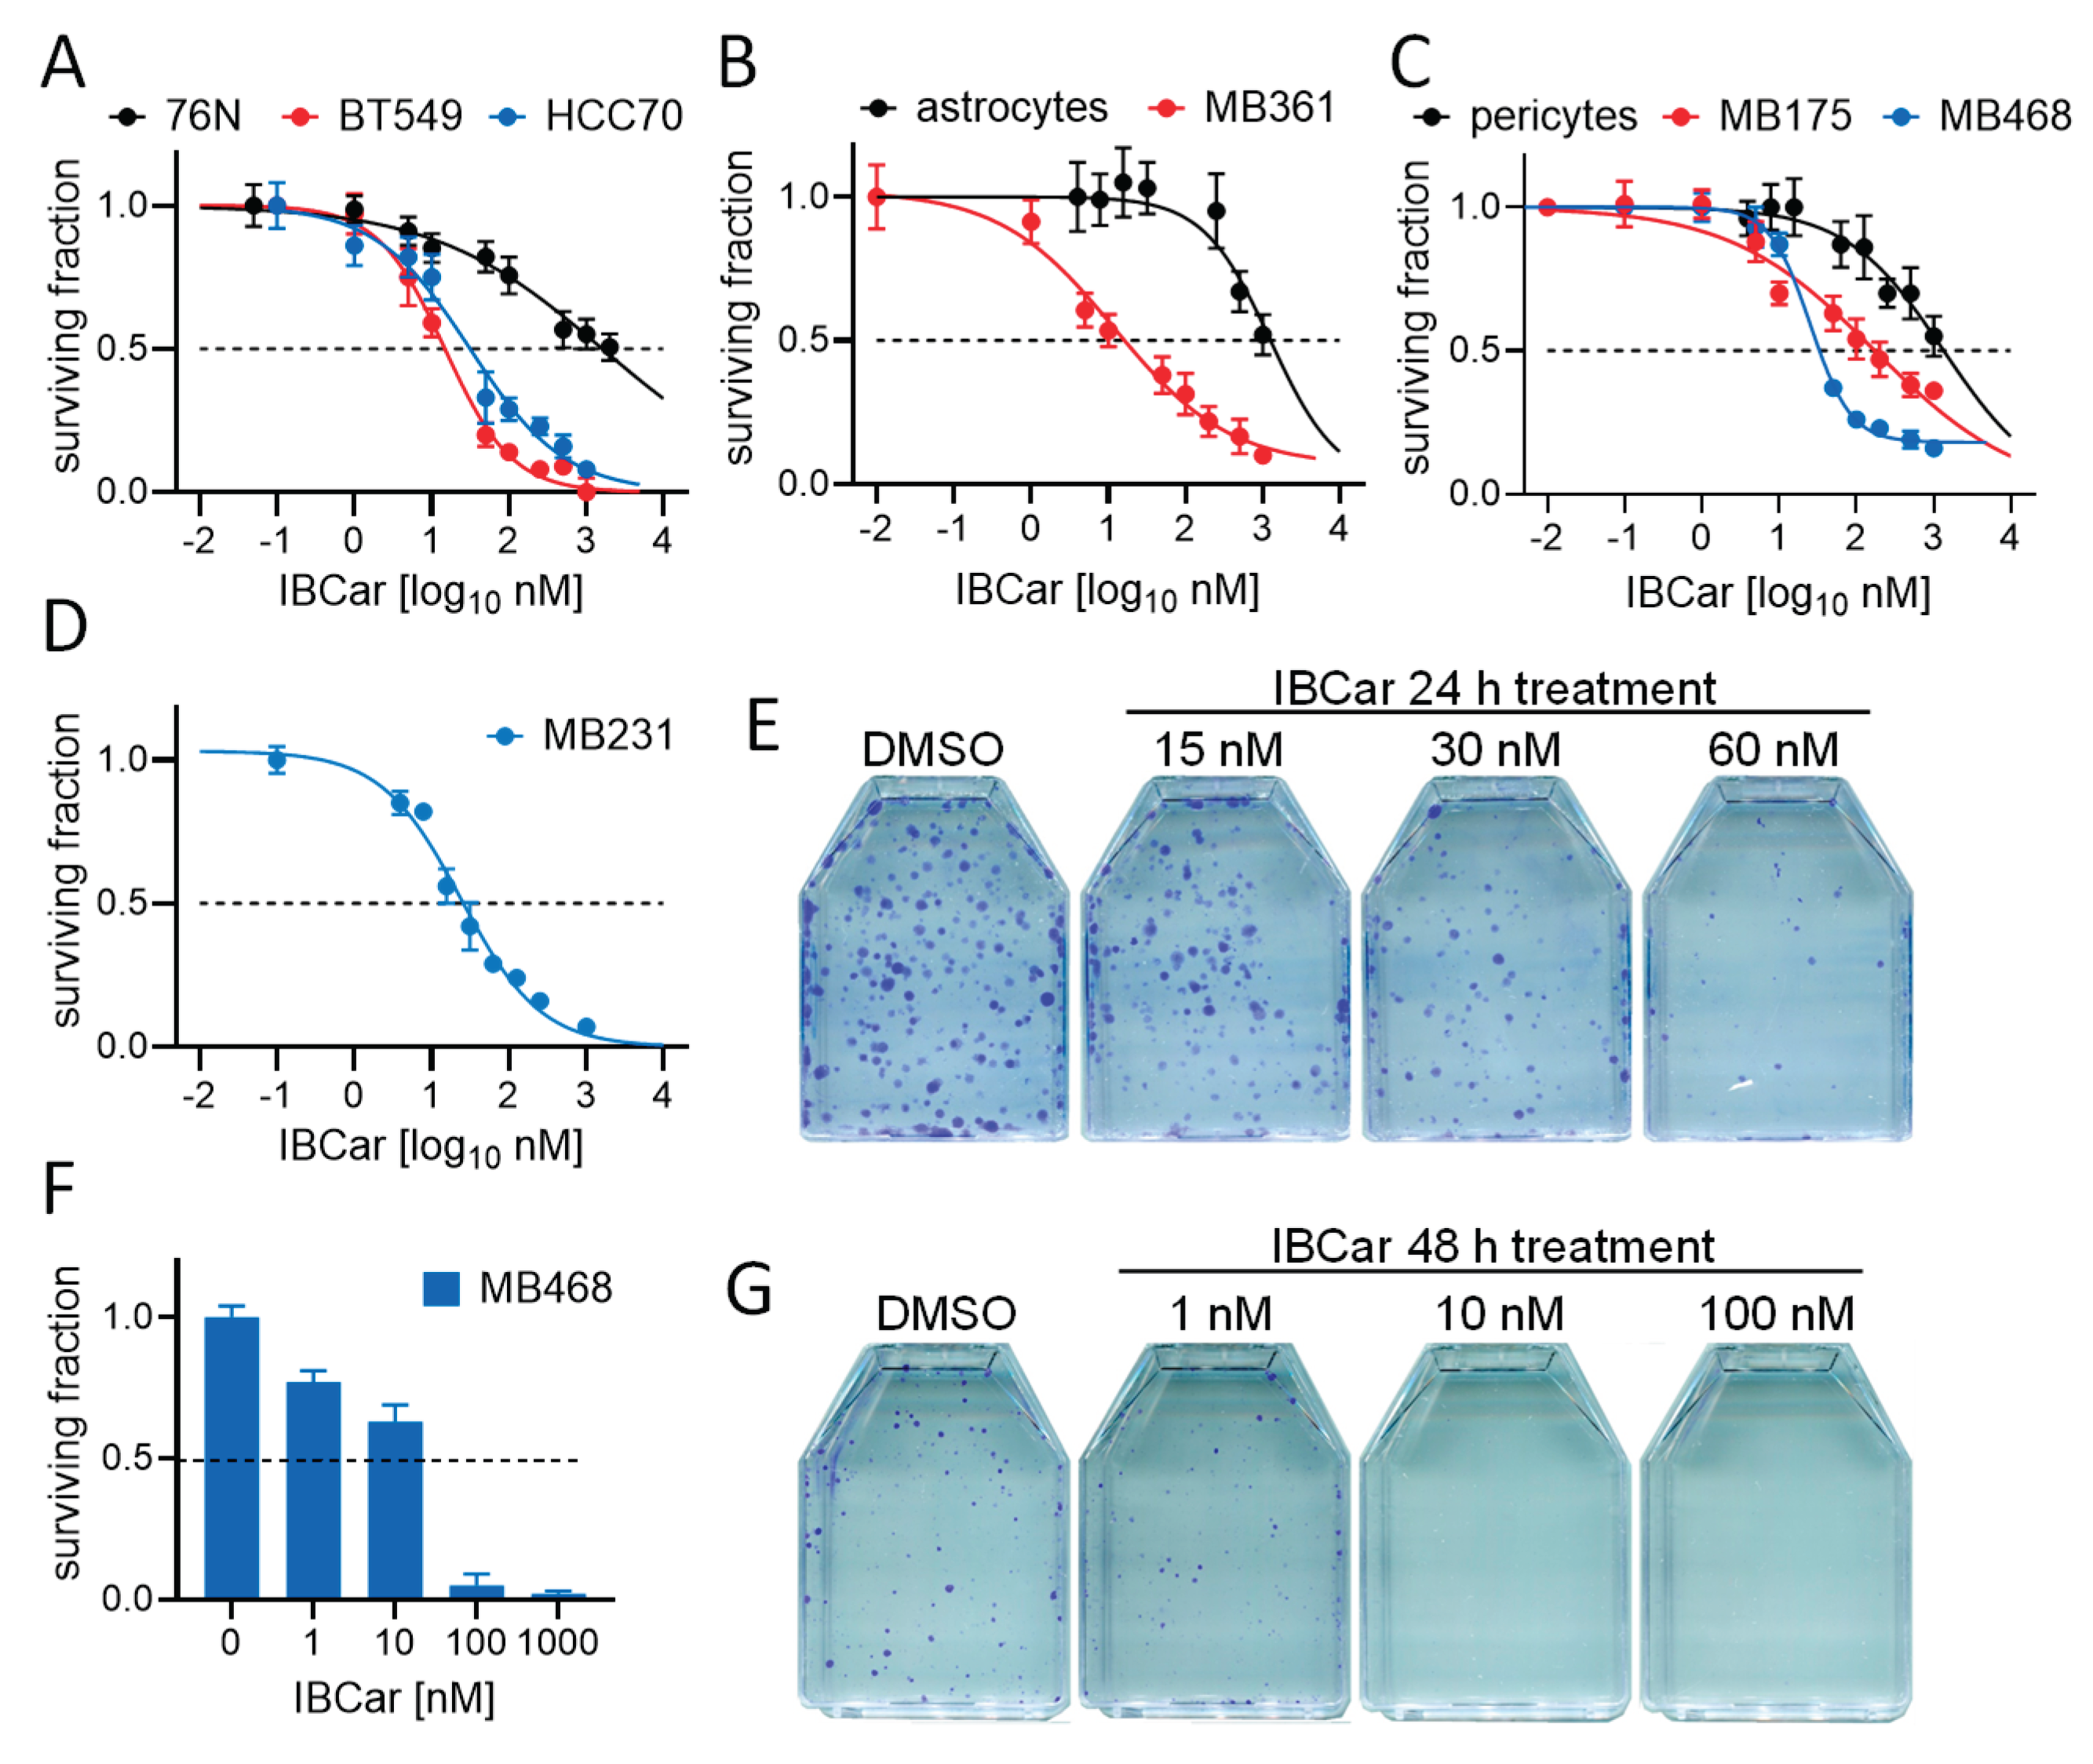
Figure 3.
Cell cycle analyses of normal breast and breast cancer cells in response to IBCar treatment. A. Untreated control cells (DMSO). B. Cells treated with 500 nM IBCar for 48 h. C. Summary of the cell cycle phase changes. Black bars = DMSO control; red bars = IBCar -treated cells. D. Western blot analyses of cdc2 dephosphorylation at Thr15 resulting in the cdc2 activation during progression into mitosis; NT denotes untreated cells; 24, 48 denote cells treated with IBCar for 24 h or 48 h, respectively; mw marks lanes with molecular weight markers. E. Relative intensity of p(Tyr15)-cdc2 bands. Dotted line denotes 100% p-cdc2 levels in NT cells.
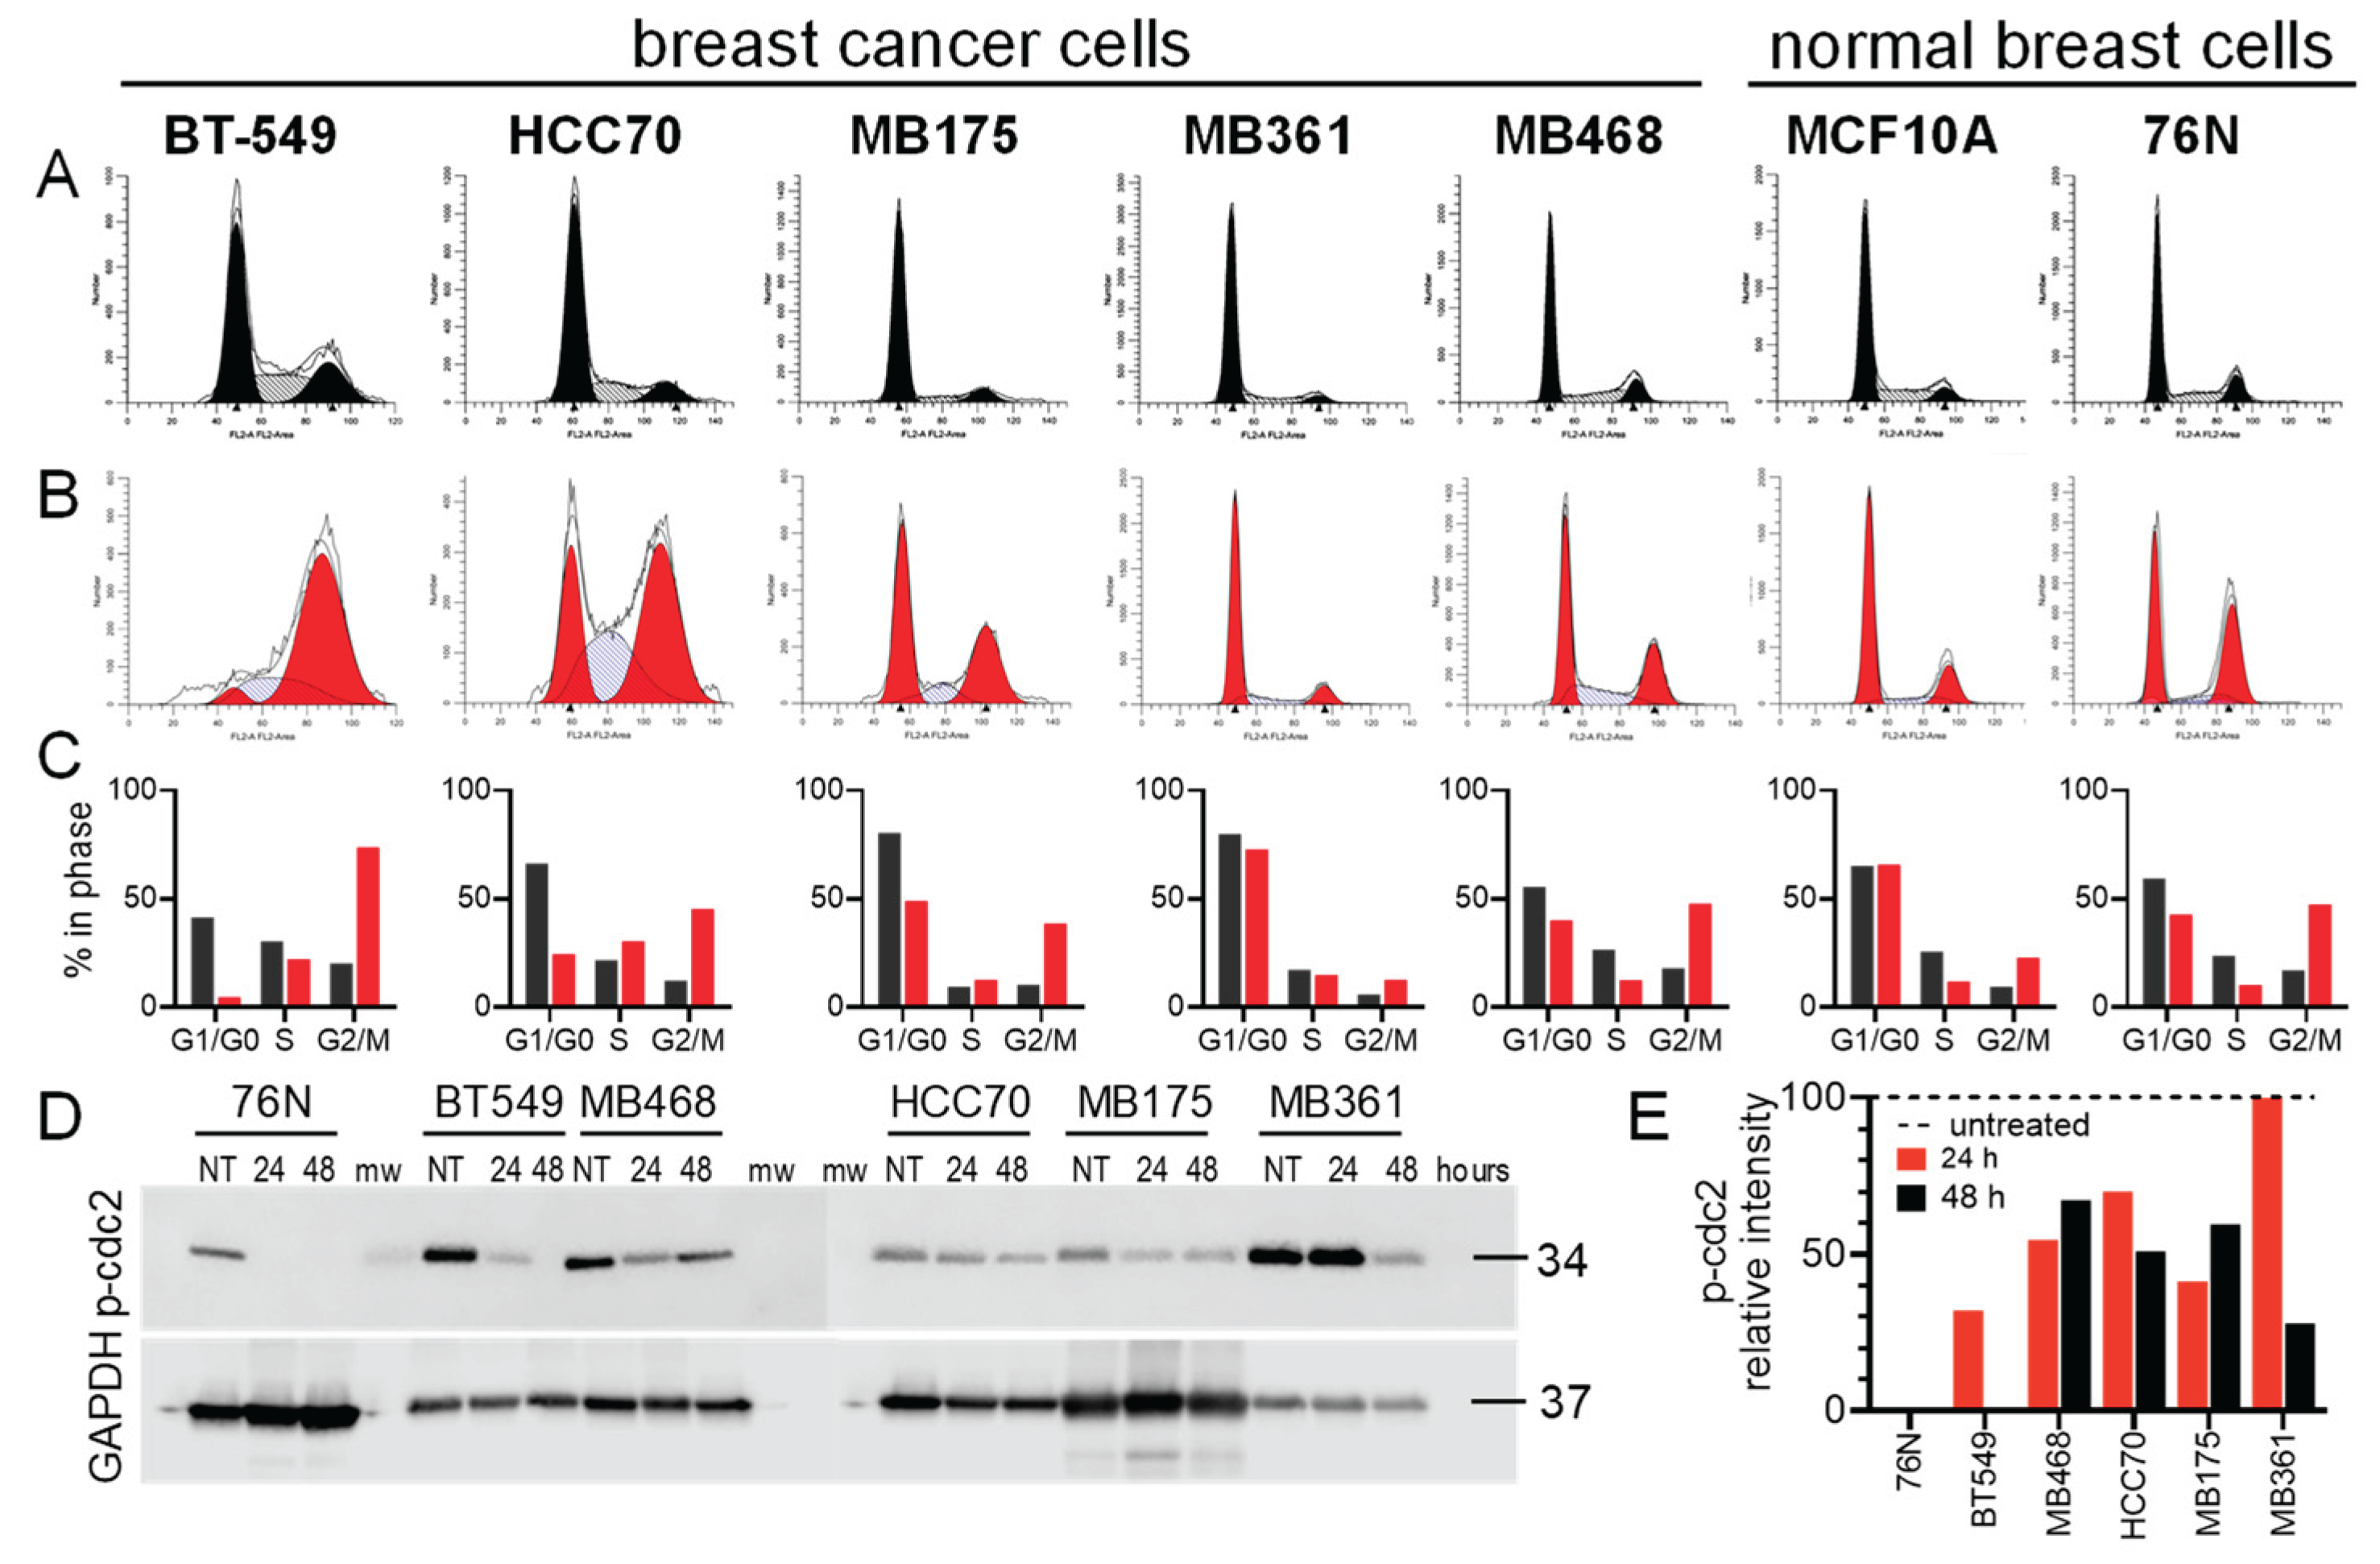
Figure 4.
Expansion of the apoptotic cell population during the IBCar treatment of normal breast cells (orange bars), mTP53 BCa cells (blue bars), and wtTP53 BCa cells (green bars). Percentages are the ratio of cells expressing activated Cas-3/7 to all cells in the population.
Figure 4.
Expansion of the apoptotic cell population during the IBCar treatment of normal breast cells (orange bars), mTP53 BCa cells (blue bars), and wtTP53 BCa cells (green bars). Percentages are the ratio of cells expressing activated Cas-3/7 to all cells in the population.
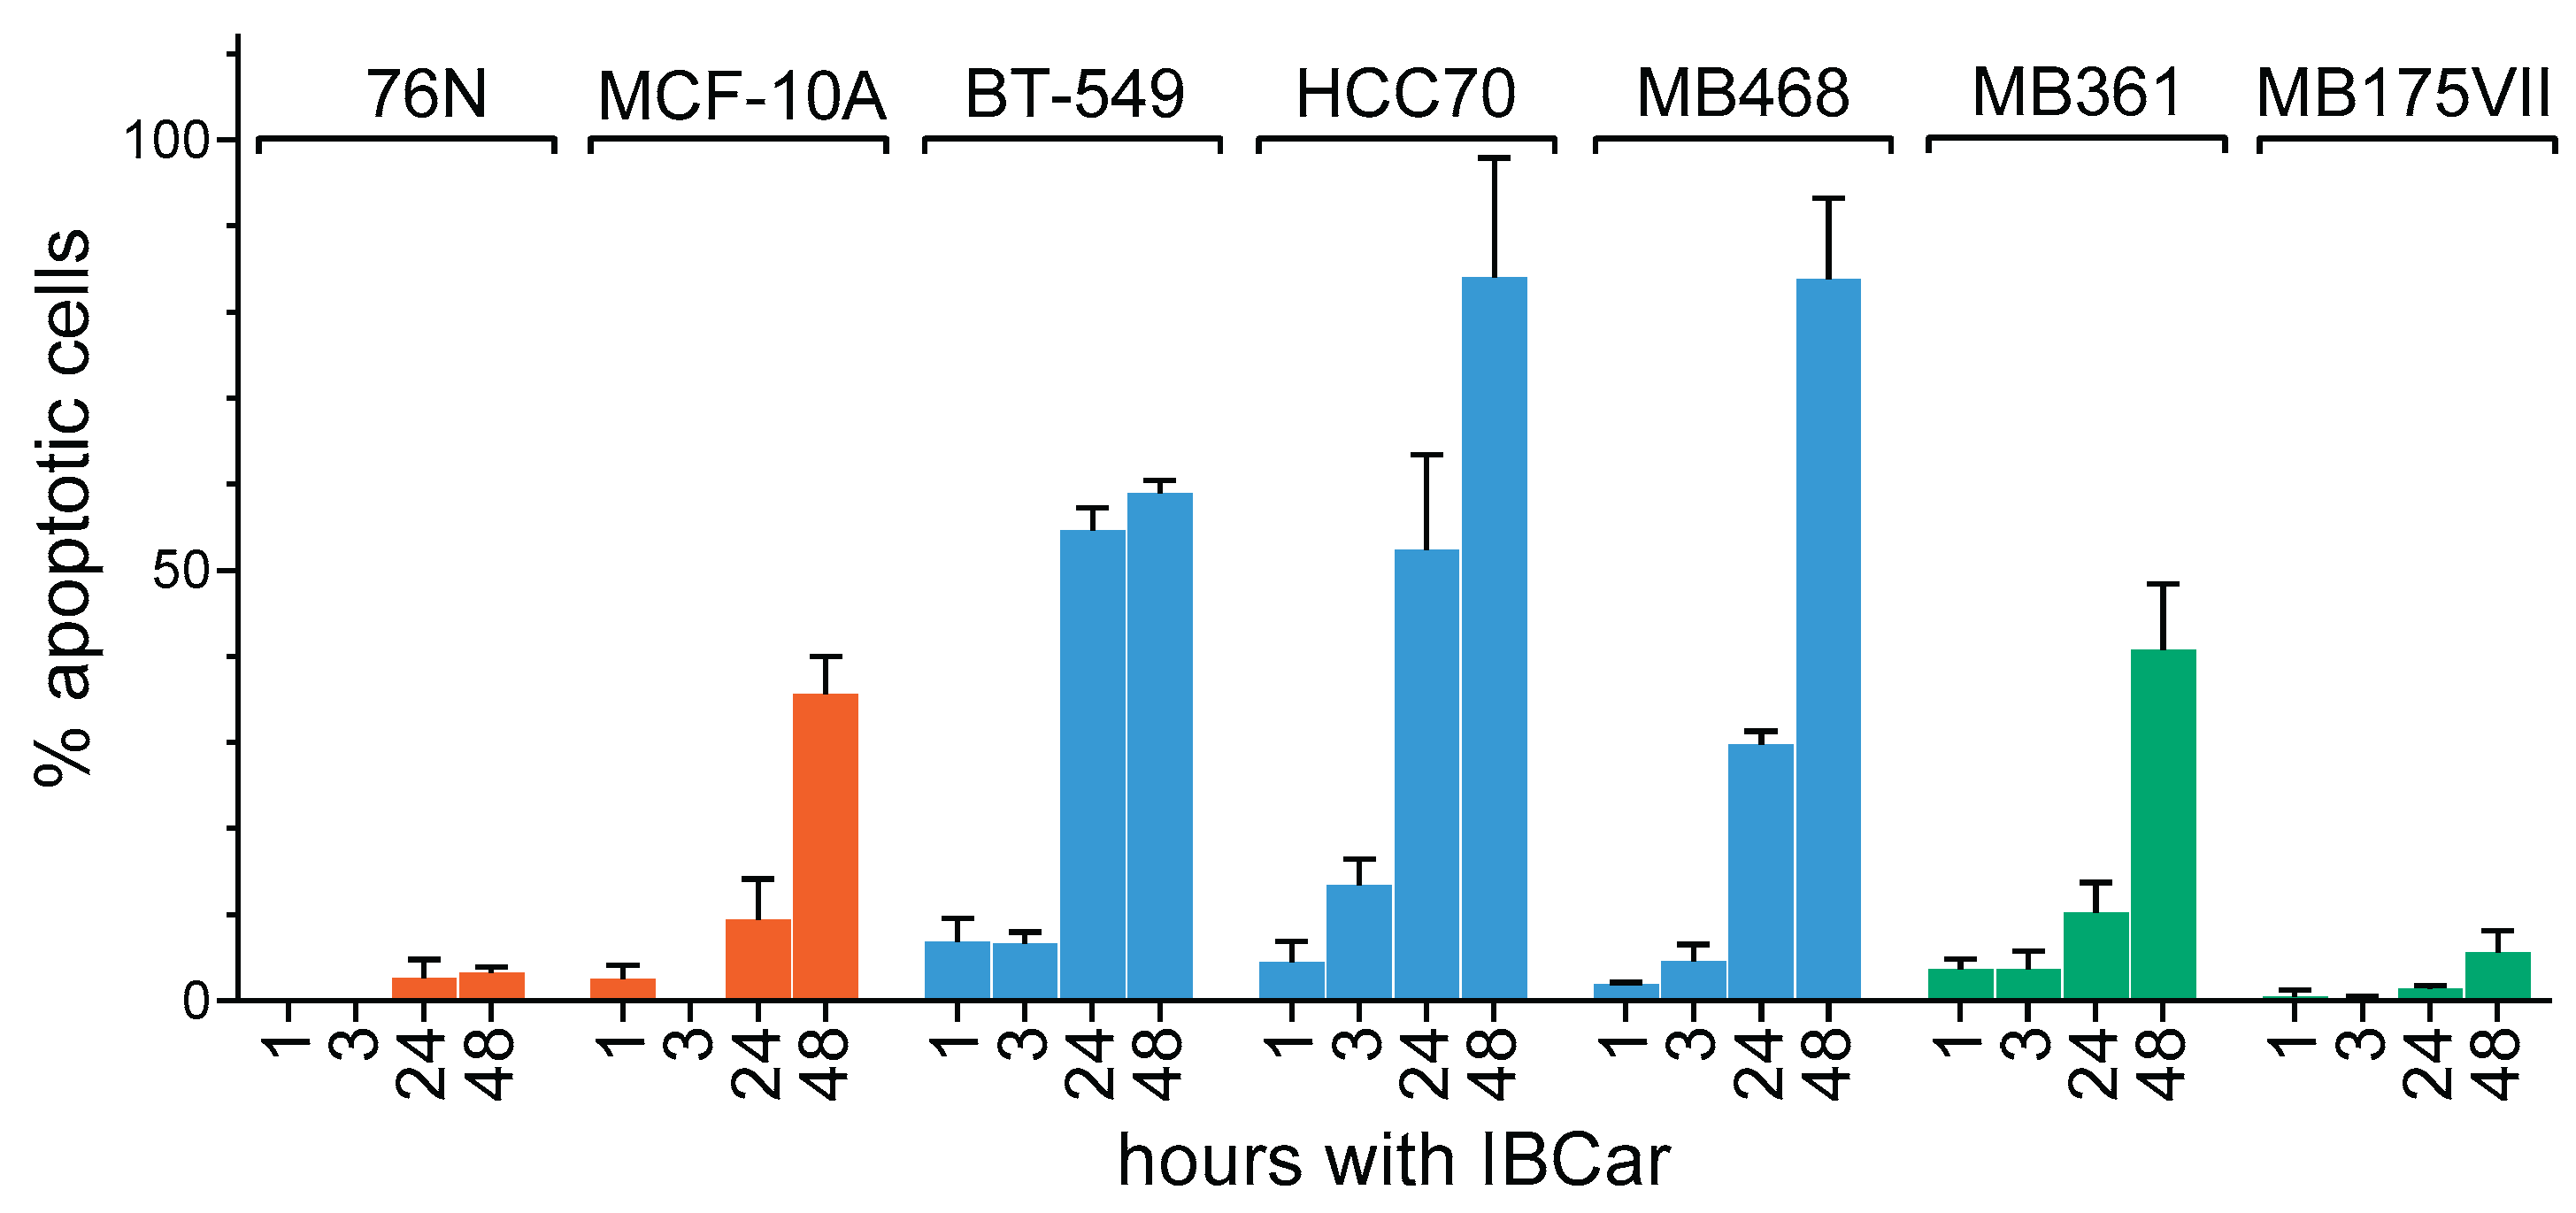
Figure 5.
Evaluation of caspase-3/7 activation in normal breast and BCa cells treated with IBCar for 48 h. Apoptotic cells are green. All cell except MB468 (0.5 µM IBCar) were treated with 1 µM IBCar. Black bar = 100 µm.
Figure 5.
Evaluation of caspase-3/7 activation in normal breast and BCa cells treated with IBCar for 48 h. Apoptotic cells are green. All cell except MB468 (0.5 µM IBCar) were treated with 1 µM IBCar. Black bar = 100 µm.
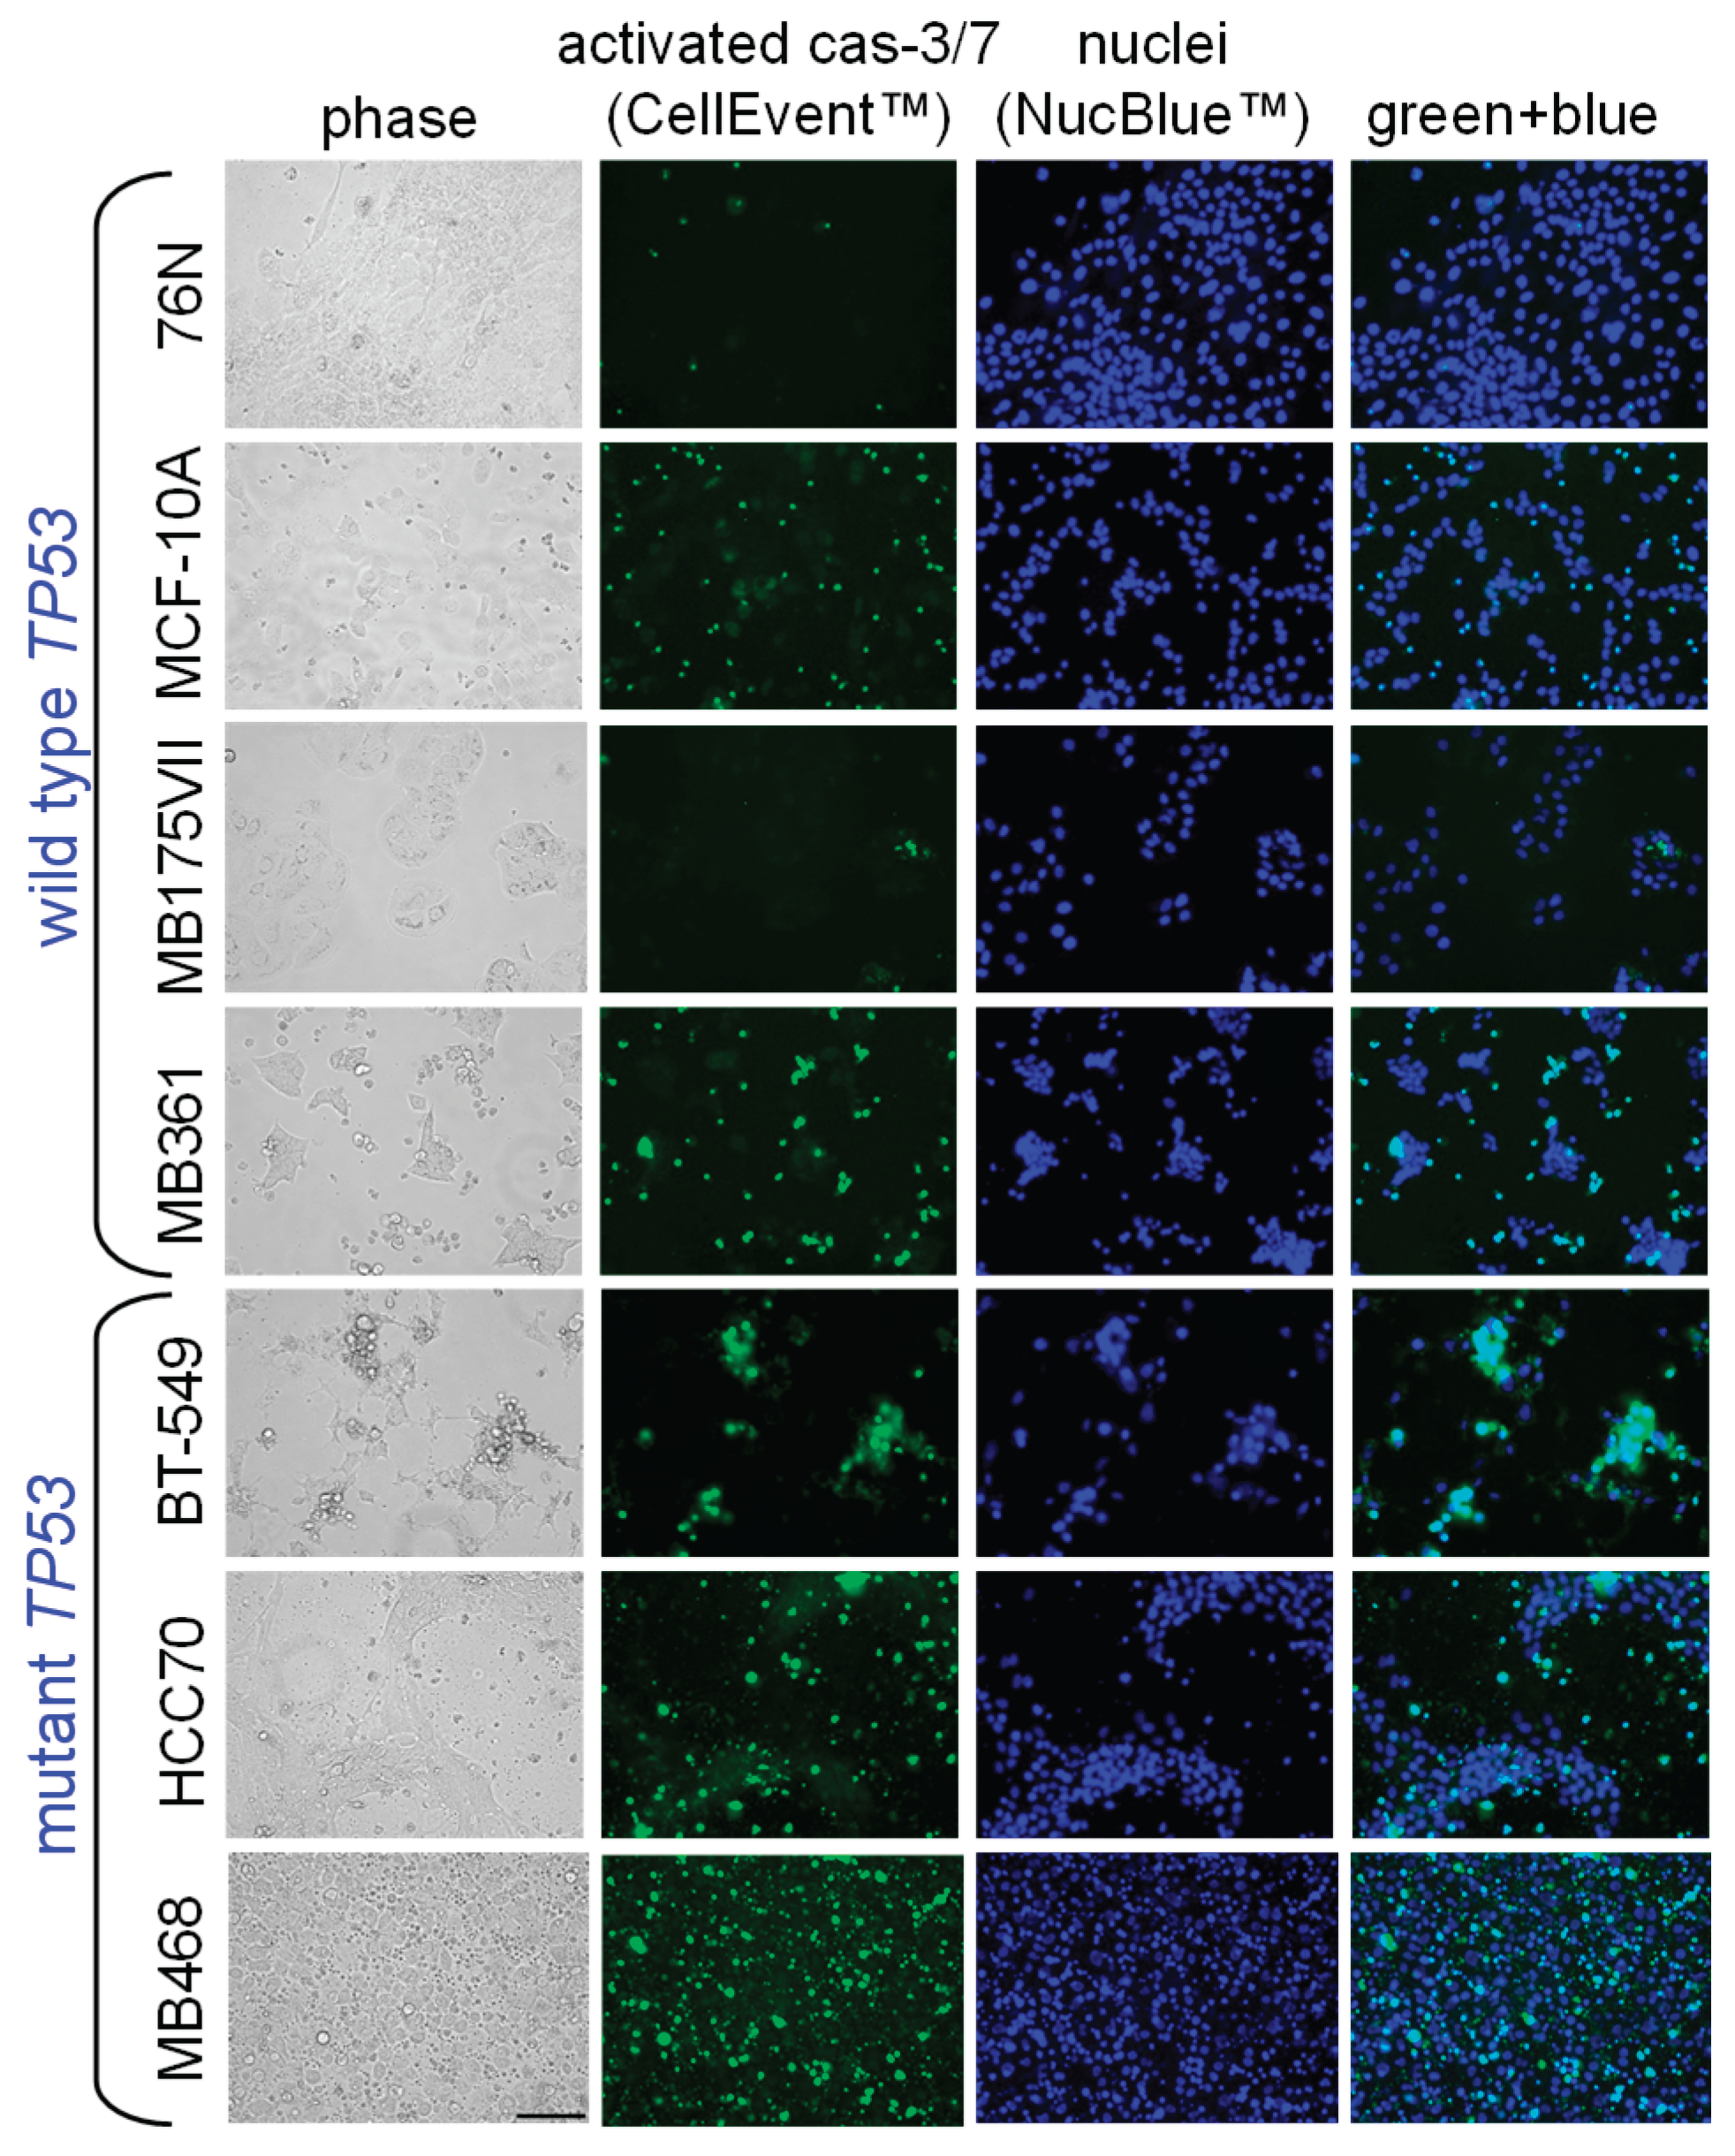
Figure 6.
Expression of caspase-3 and cleaved caspase-3 in normal breast cells and BCa cells; NT = untreated cells; 24, 48 = cells treated with 0.5 µM IBCar for 24 h or 48 h, respectively.
Figure 6.
Expression of caspase-3 and cleaved caspase-3 in normal breast cells and BCa cells; NT = untreated cells; 24, 48 = cells treated with 0.5 µM IBCar for 24 h or 48 h, respectively.
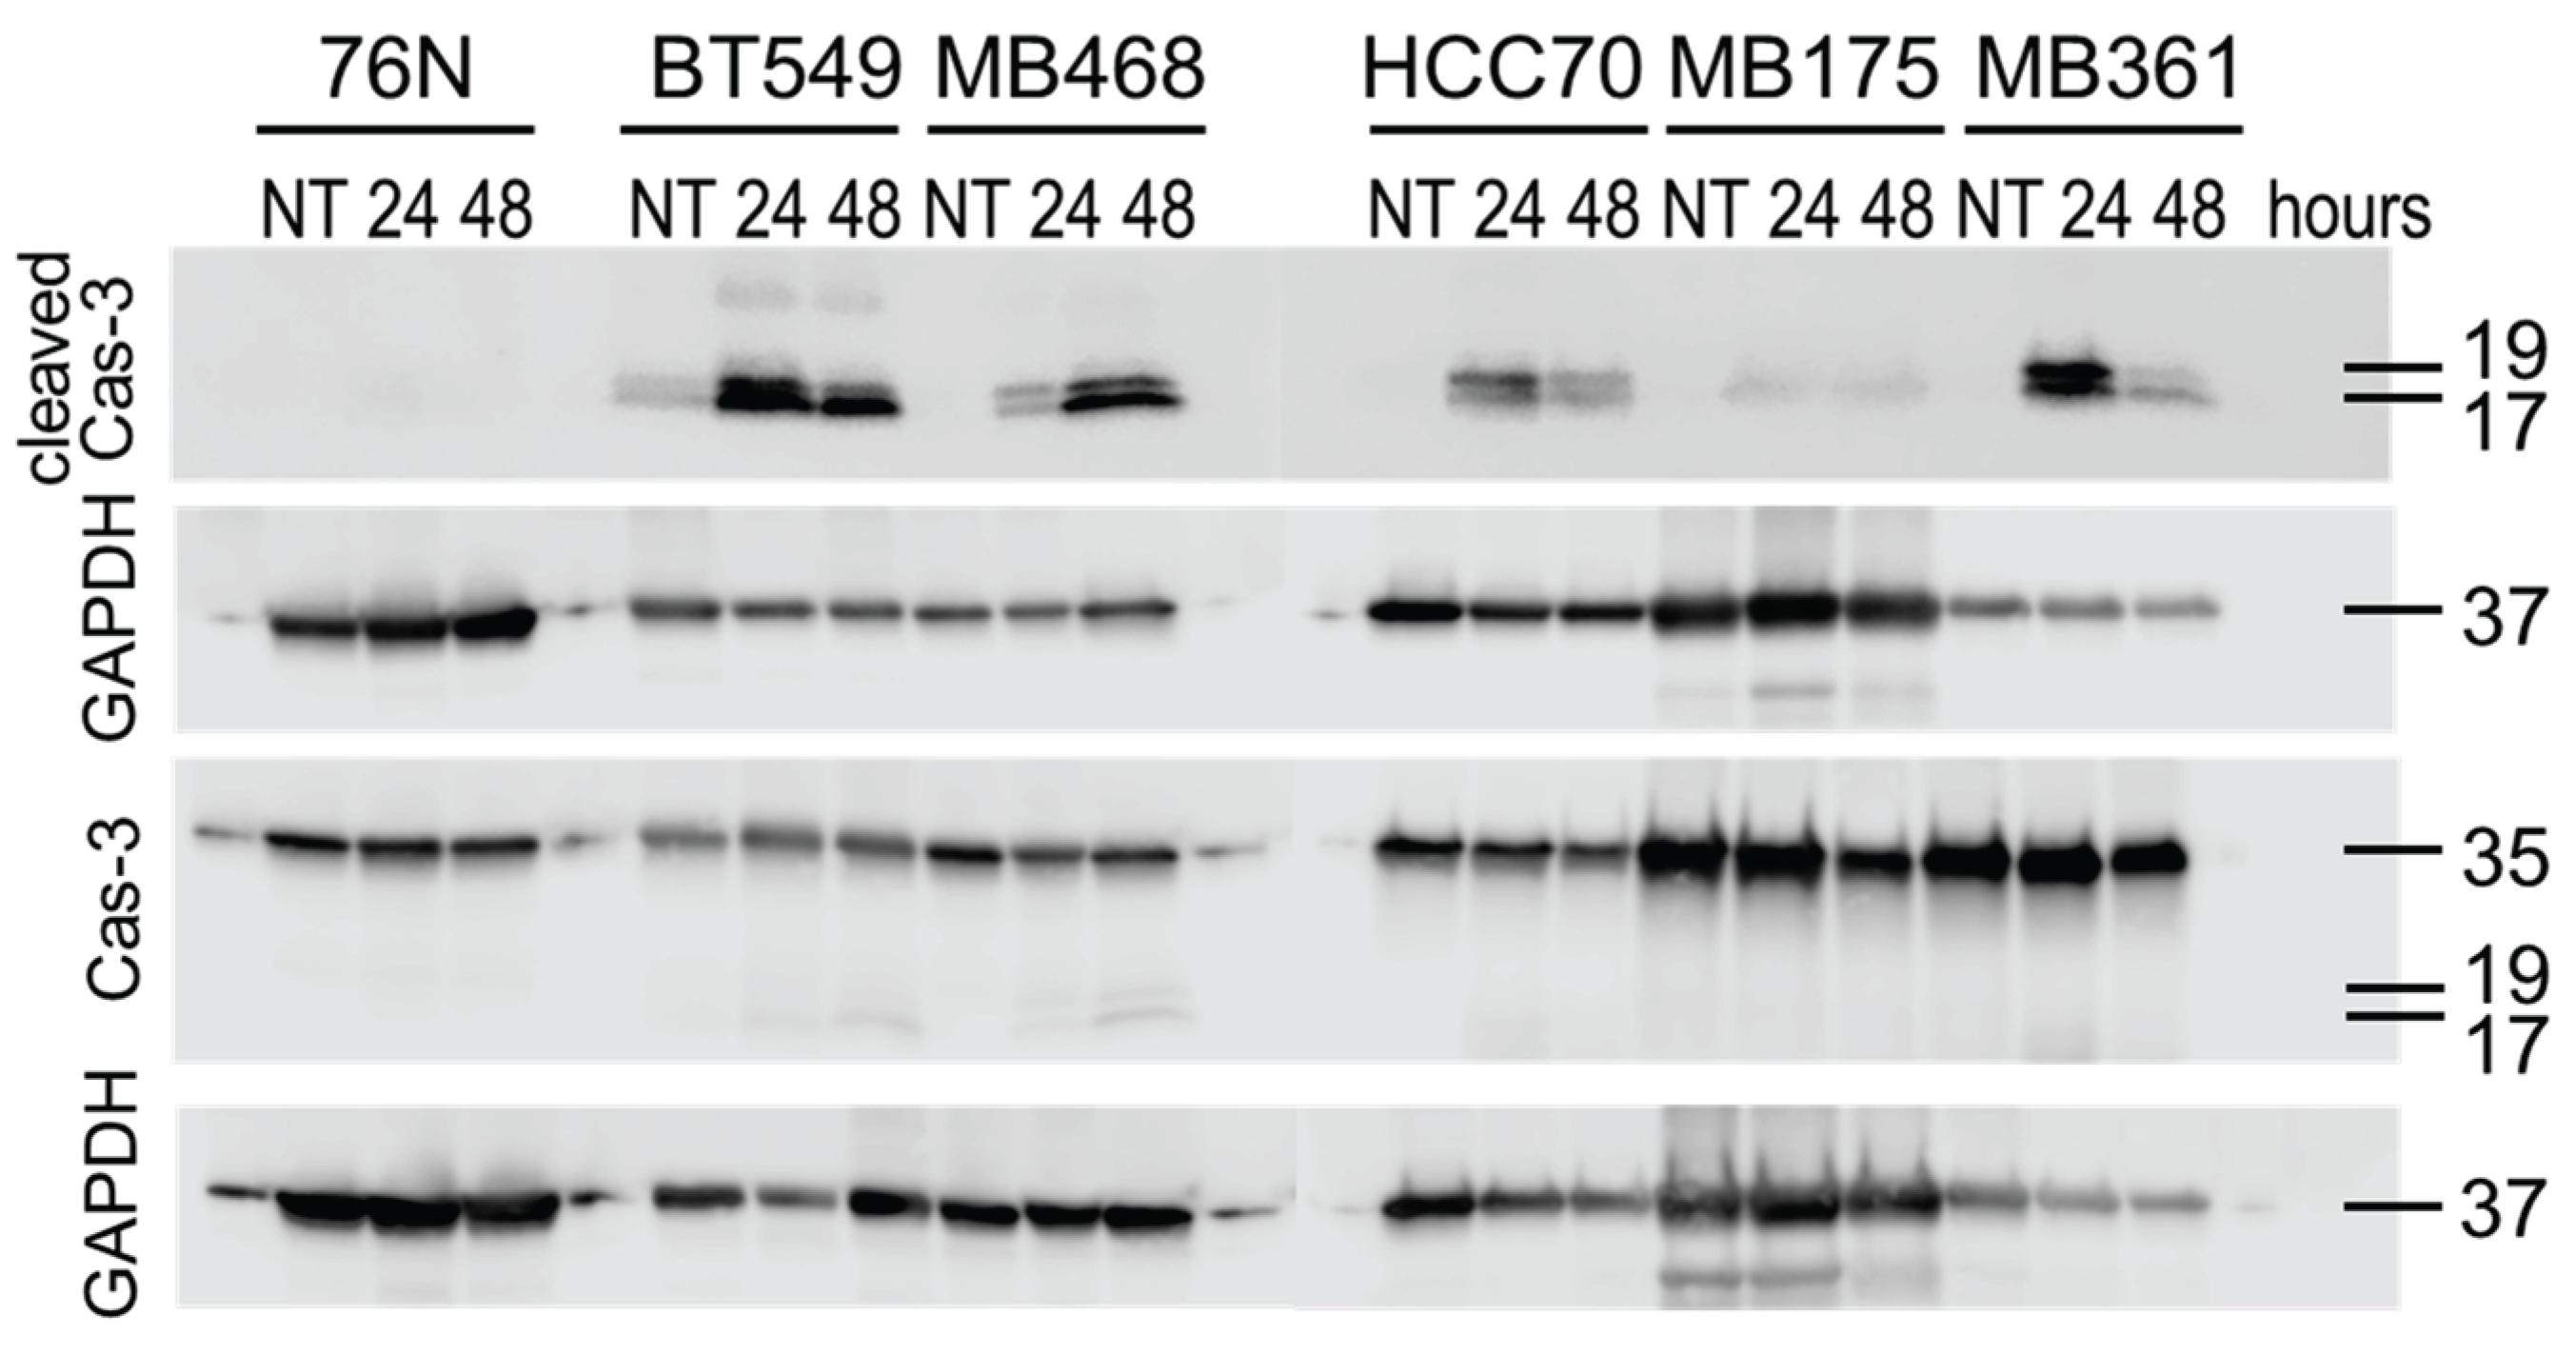
Figure 7.
Expression of Cas-8 (A), MLKL (B), RIP3 (C), and pRIP3 (D) in normal breast cells and BCa cells treated with IBCar; NT = untreated cells; 24, 48 = cells treated with IBCar for 24 h or 48 h, respectively.
Figure 7.
Expression of Cas-8 (A), MLKL (B), RIP3 (C), and pRIP3 (D) in normal breast cells and BCa cells treated with IBCar; NT = untreated cells; 24, 48 = cells treated with IBCar for 24 h or 48 h, respectively.
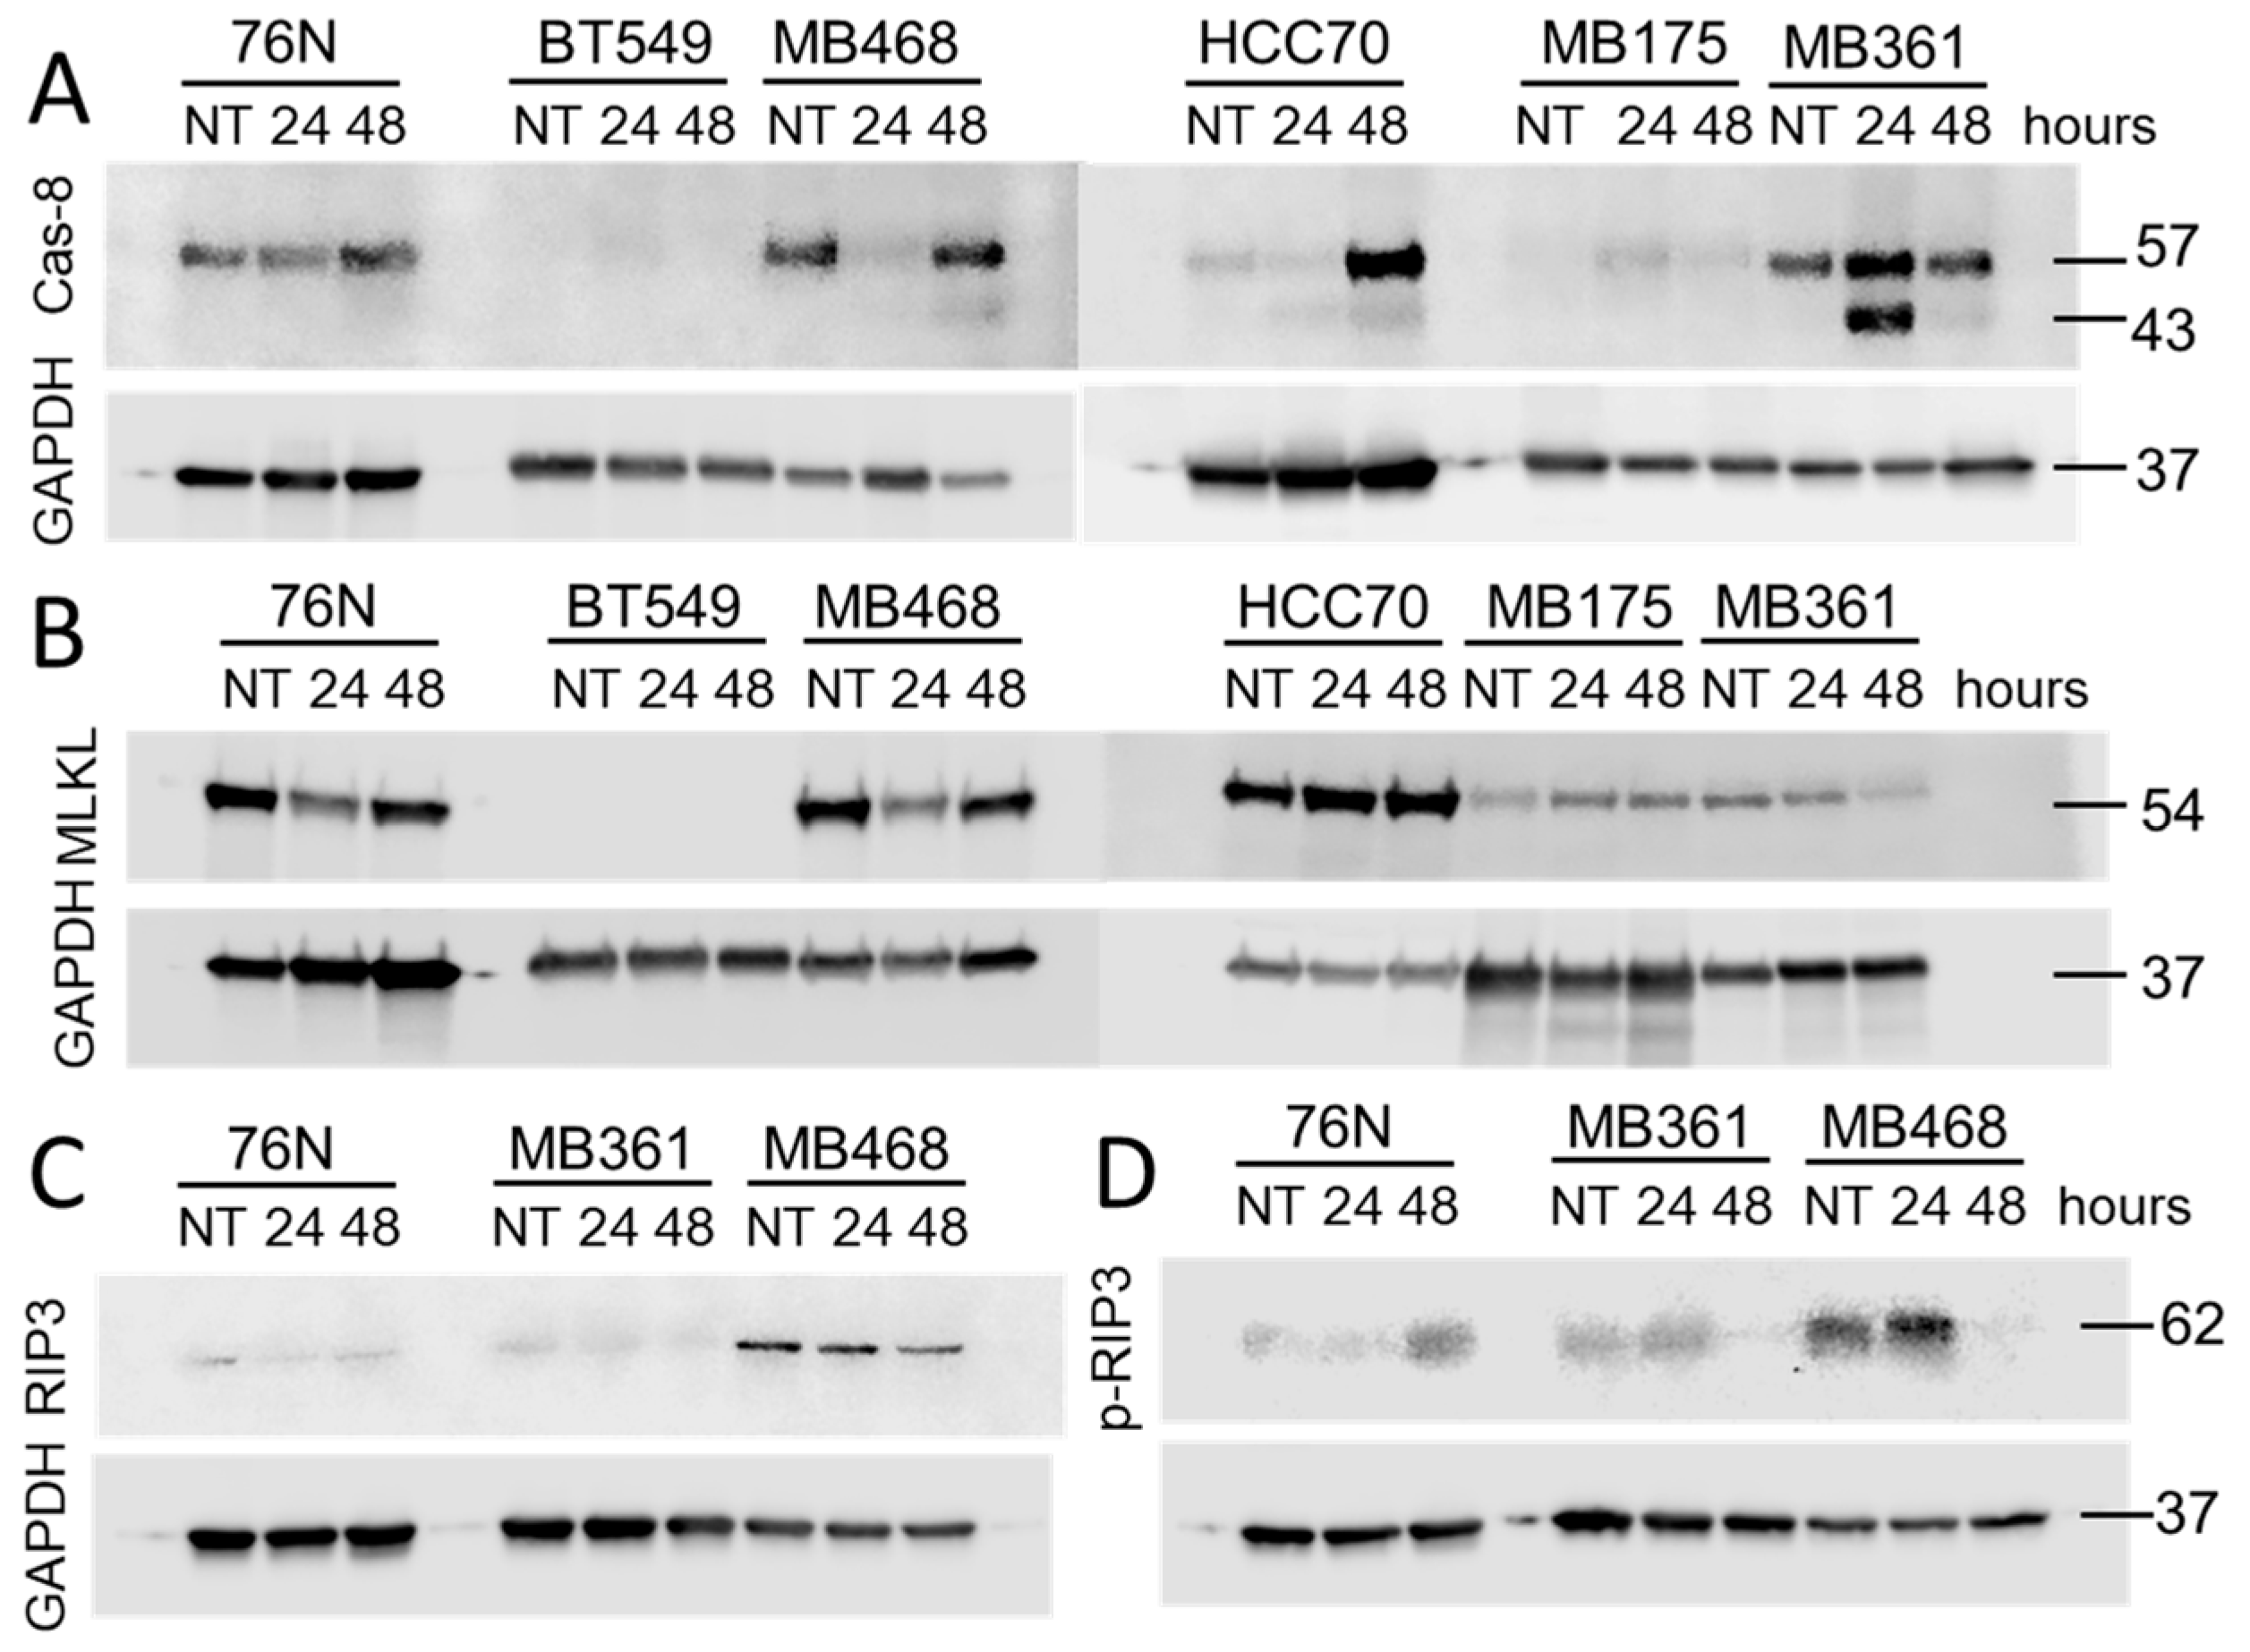
Figure 8.
Expression of cleaved Cas-8 in normal and BCa cells. Untreated cells (NT) were grown in DMSO-containing medium. Cells were lysed after 24 h and 48 h with 0.5 µM IBCar.
Figure 8.
Expression of cleaved Cas-8 in normal and BCa cells. Untreated cells (NT) were grown in DMSO-containing medium. Cells were lysed after 24 h and 48 h with 0.5 µM IBCar.
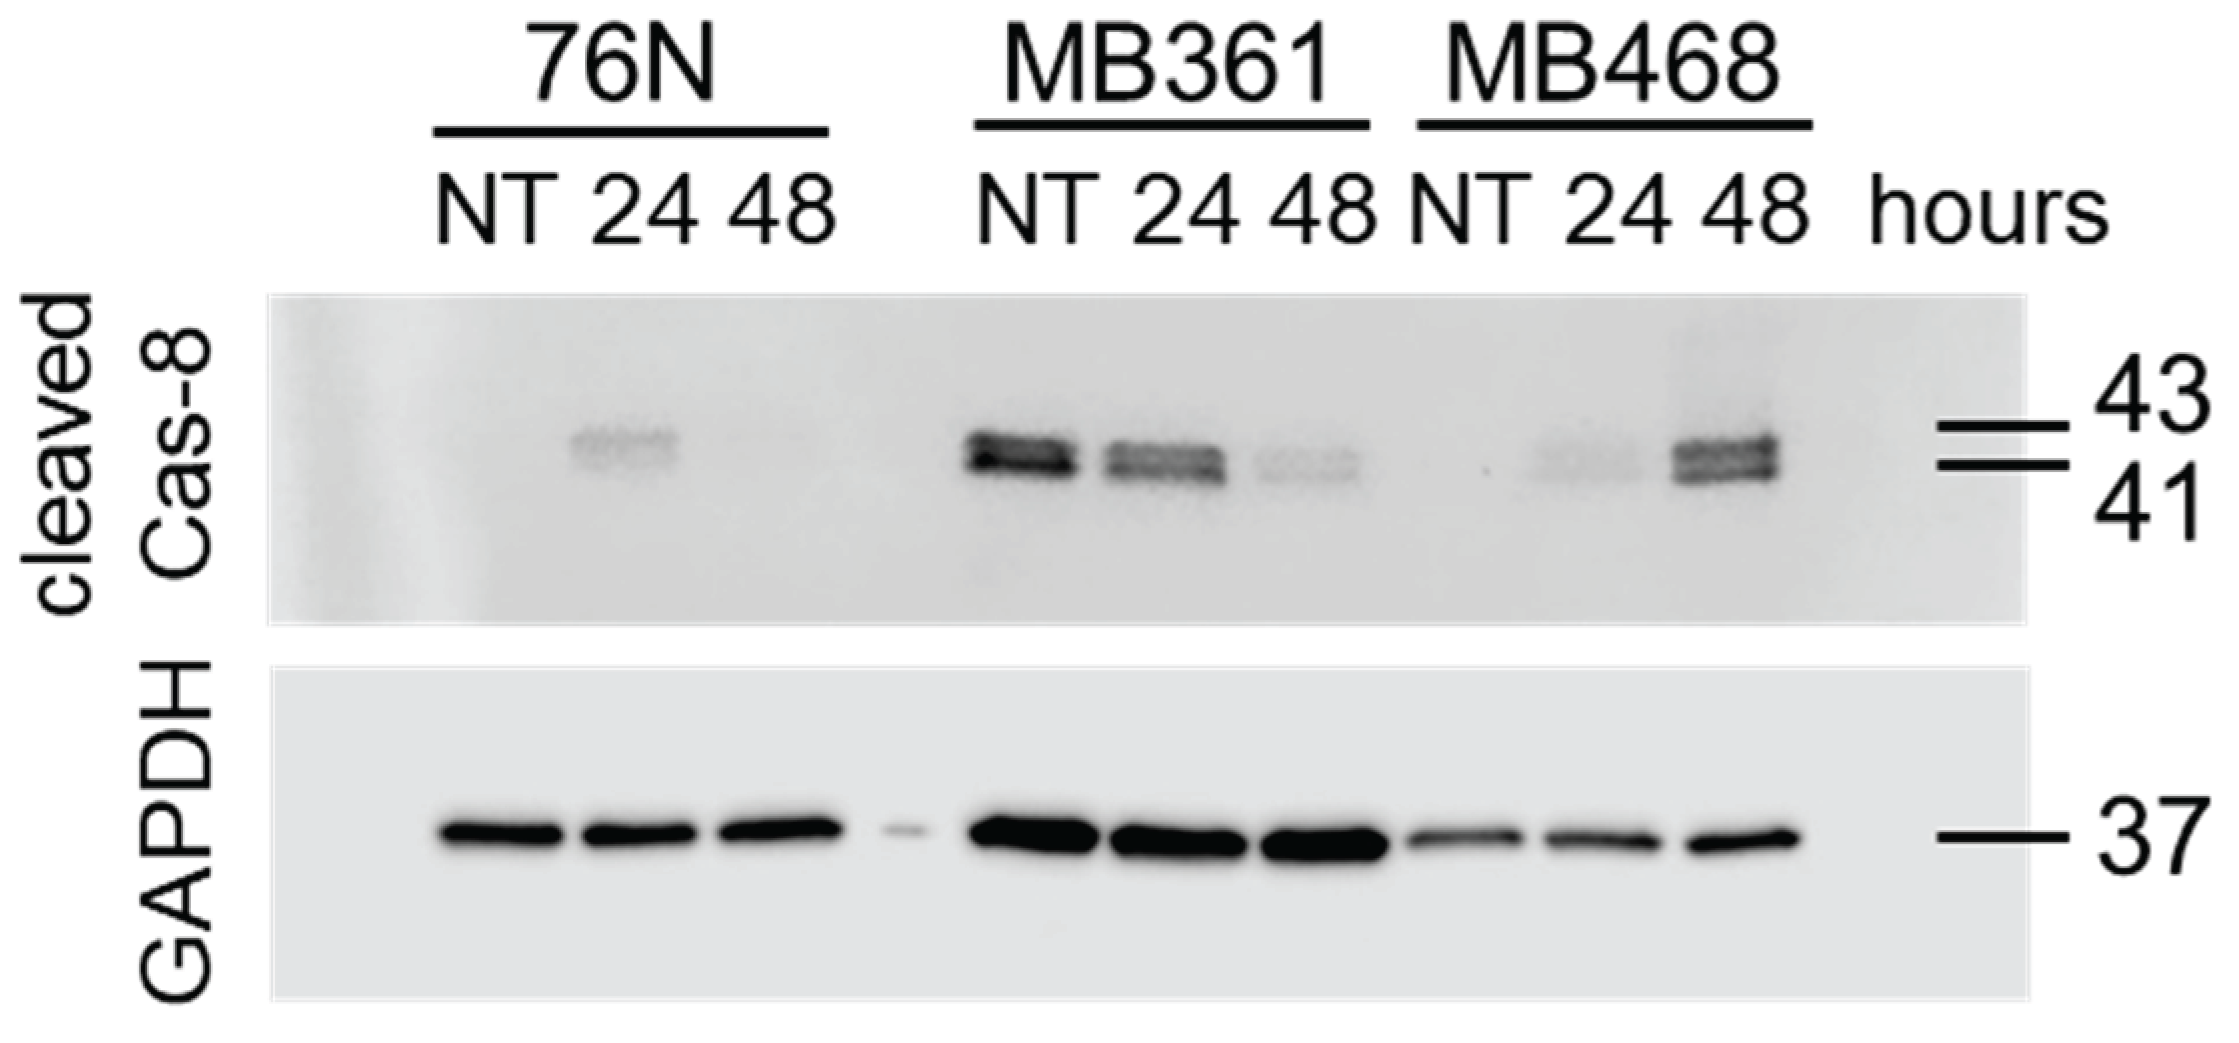
Figure 10.
Effects of necrostatin-1 on survival of MB468 cells (A), MB361 (B) and 76N (C) cells. Control cells (n = 6; blue bars) were cultured with various concentration of necrostatin-1 in DMSO-containing medium. Experimental groups (n = 6; orange bars) were treated with the identical concentrations of necrostatin-1 and 100 nM IBCar.
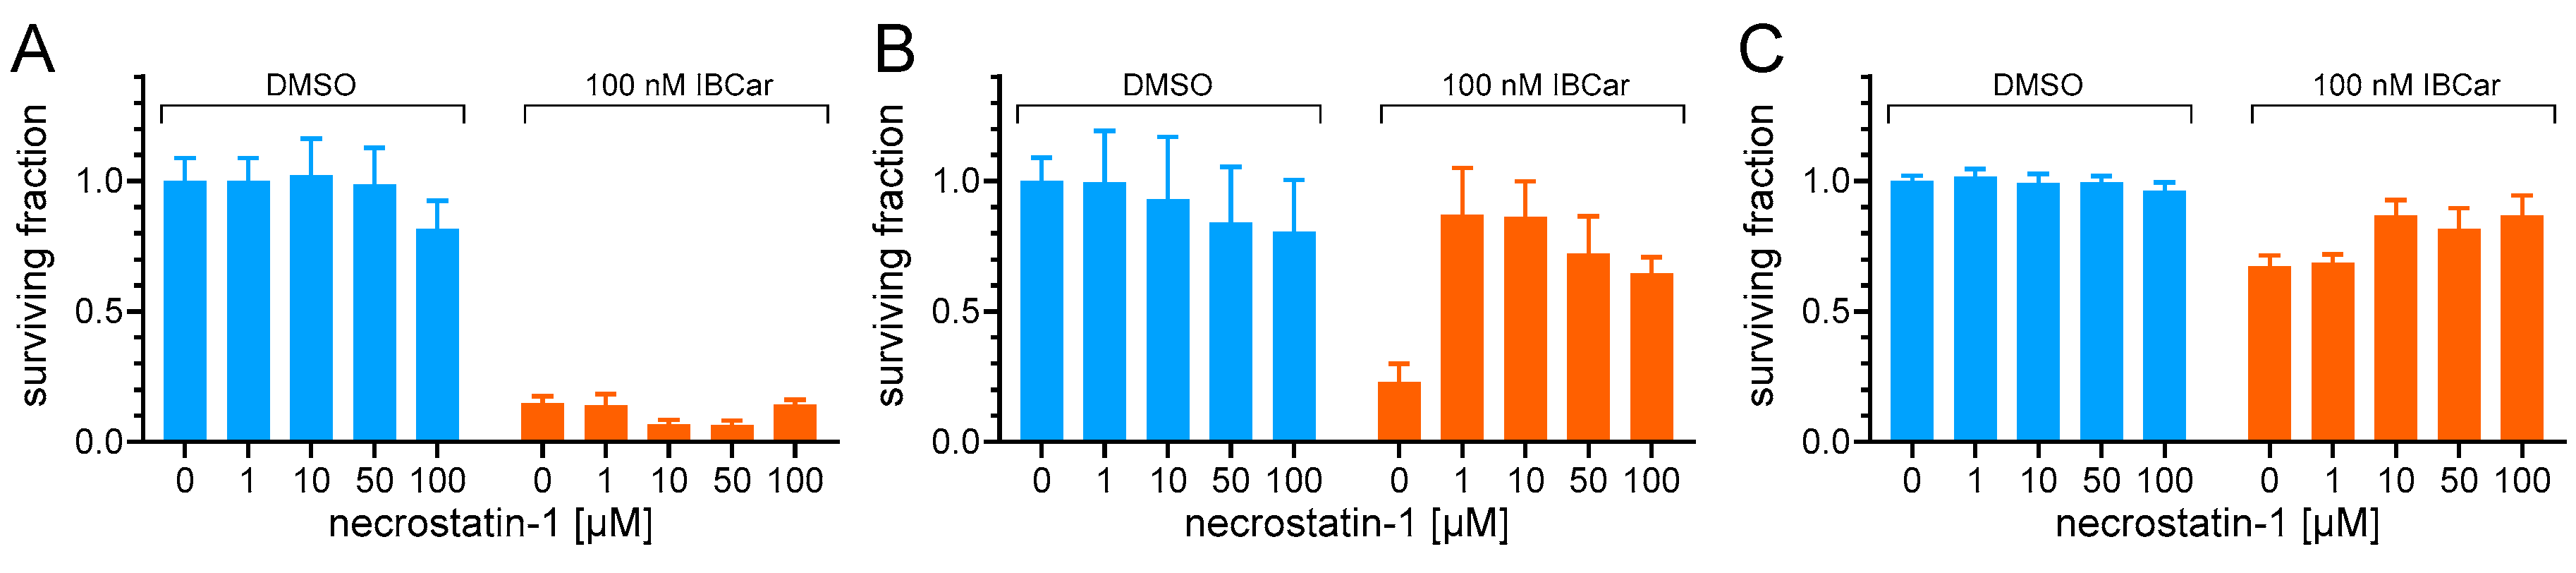
Figure 11.
Evaluation of the microtubule integrity in 76N normal breast cells and several BCa cell lines. Microtubules (red) are stained with Tubulin Tracker™ Deep Red. Nuclei (blue) are stained with NucBlue™ Live. Cells were either untreated (DMSO) or treated with 0.5 µM IBCar for 24 h. Phase contrast micrographs are included to show morphology.
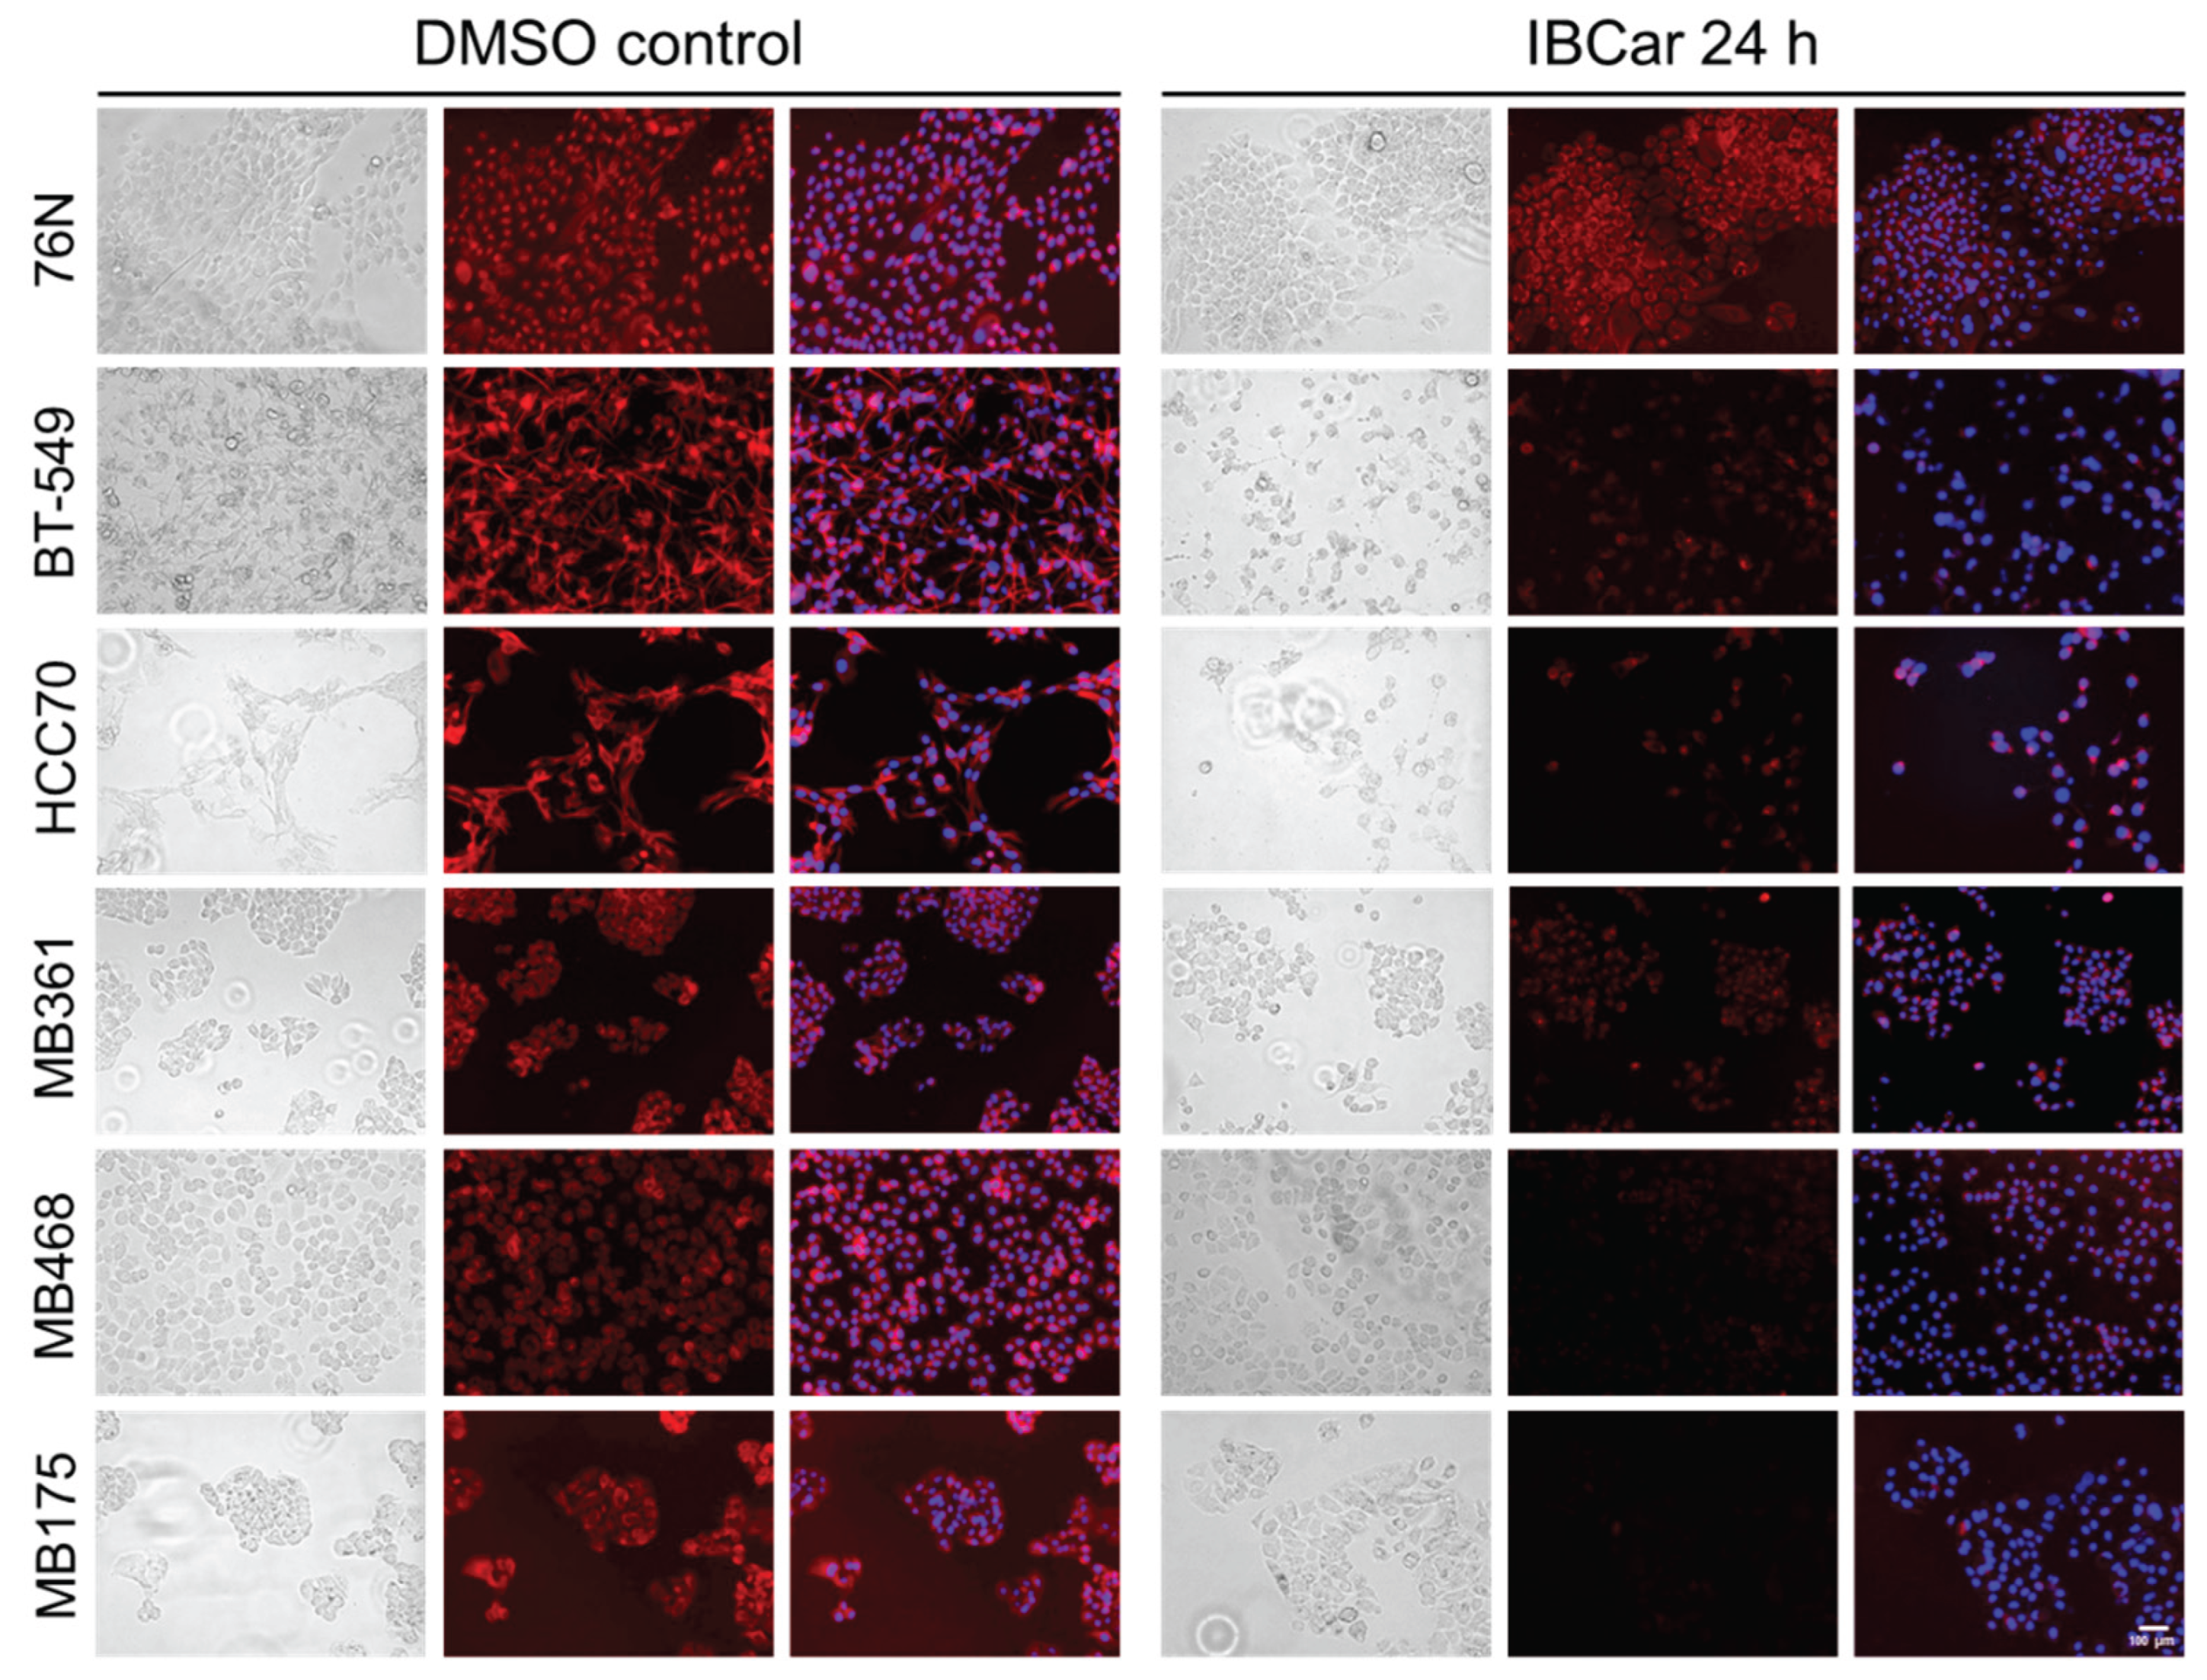
Figure 12.
Evaluation of the microtubule integrity in breast cancer HCC70 cells and normal breast 76N cells after treatment with 500 nM IBCar for 48 h or 500 nM VCR for 24 h. Recovery: drug-containing medium was removed, cells washed with growth medium without drugs and cells allowed to grow for additional 72 h in fresh medium. Untreated control cells were grown in medium containing DMSO. Microtubules = red (Tubulin Tracker™). Nuclei = blue (NucBlue™).
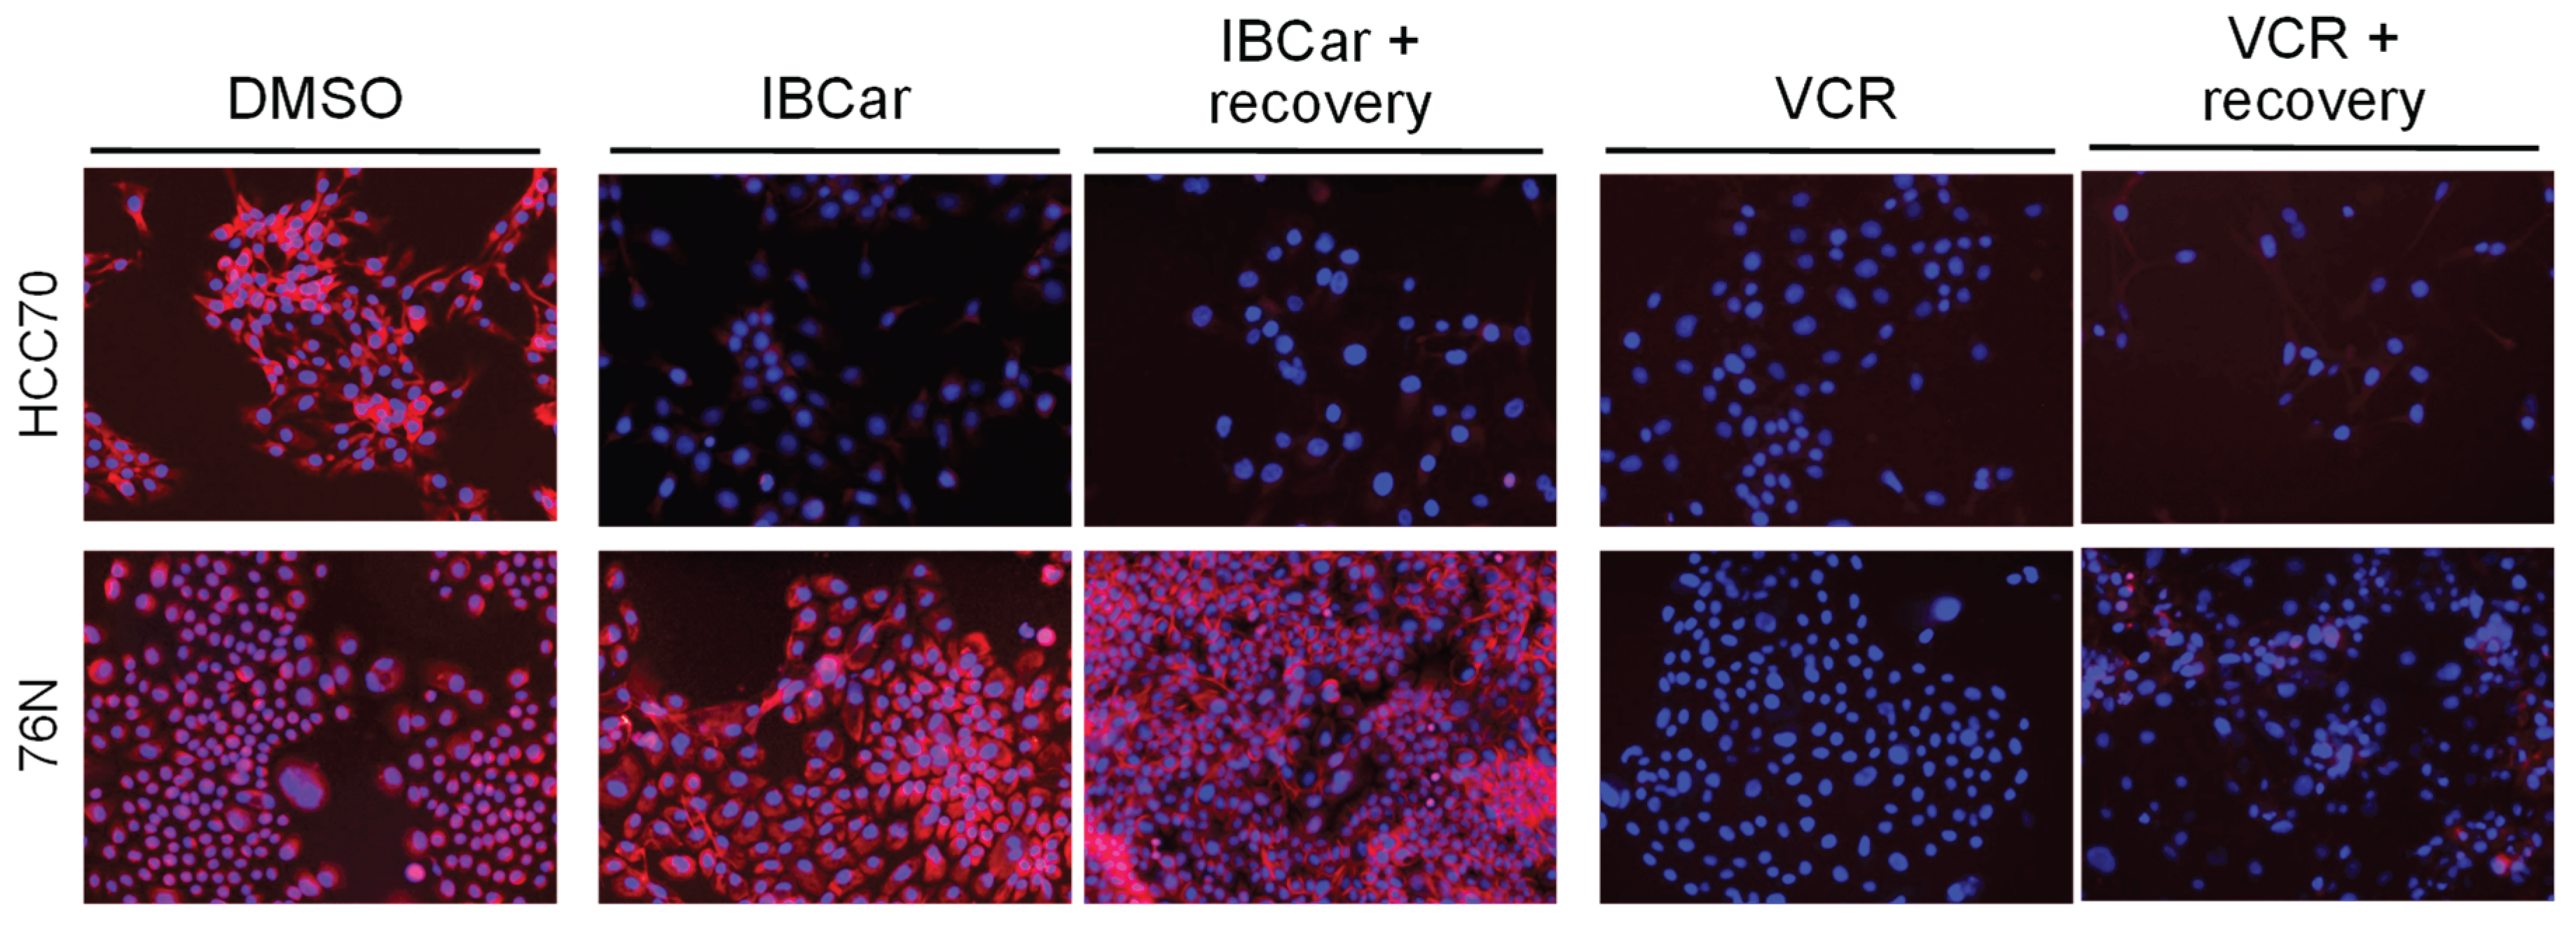
Figure 13.
Expression of the endoplasmic reticulum sequential chaperones calnexin and BiP in untreated cells (NT) and cells treated with IBCar for 24 h and 48 h.
Figure 13.
Expression of the endoplasmic reticulum sequential chaperones calnexin and BiP in untreated cells (NT) and cells treated with IBCar for 24 h and 48 h.
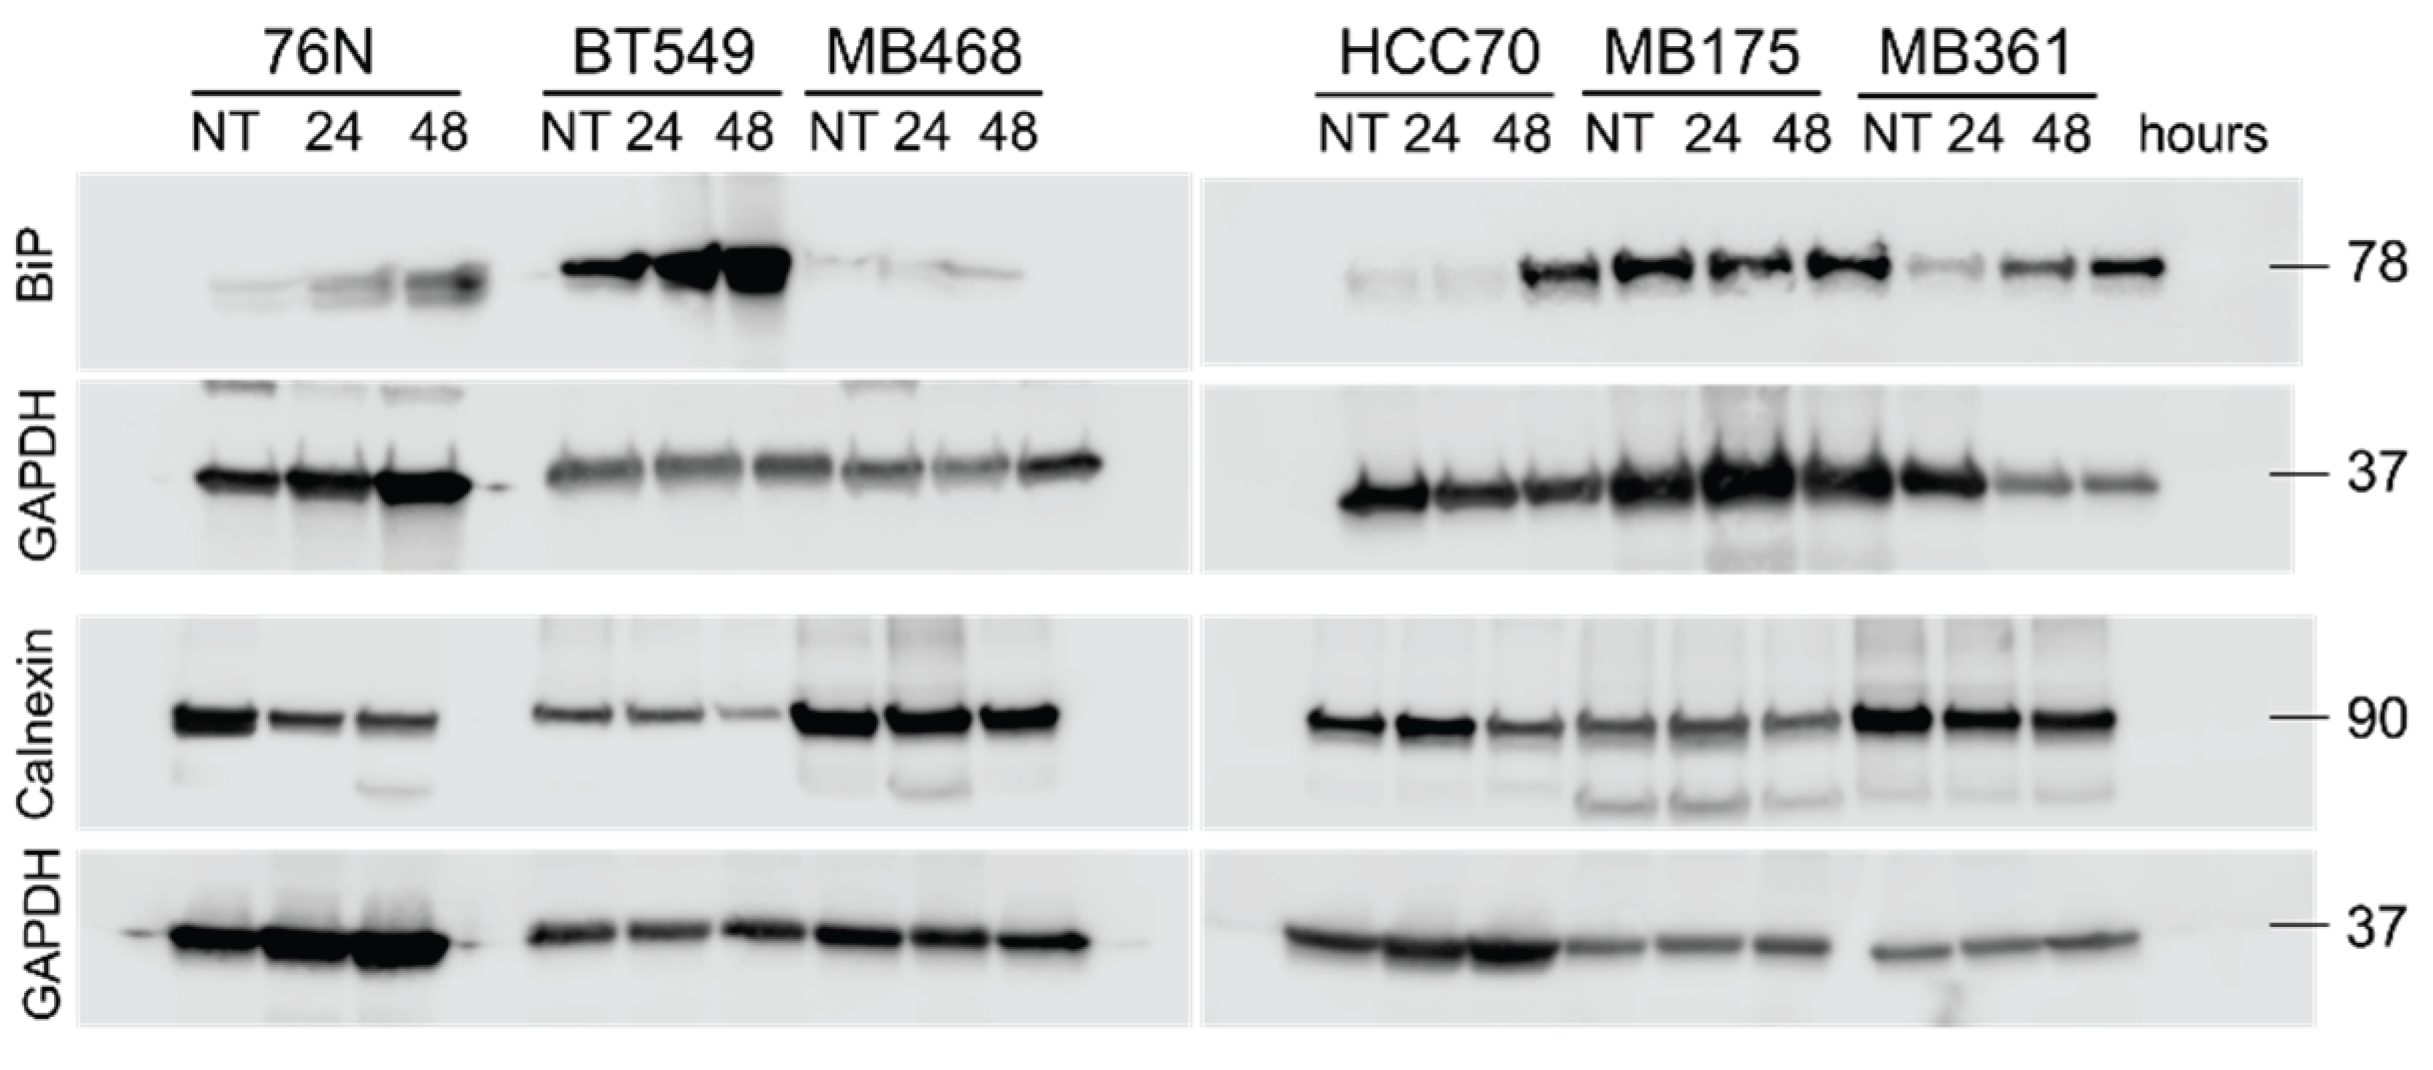
Figure 14.
Expression of endoplasmic retic-ulum unfolded protein response sensors in untreated cells (NT) and cells treated with IBCar for 24 h and 48 h. A. Western blot of PERK. B. Analysis of changes in PERK ex-pression. Red arrows indicate active PERK fragment. C. Western blot of eIF2α, IRE1α, and phospho-Ser724-IRE1α. Positive control lysates are indicated by .
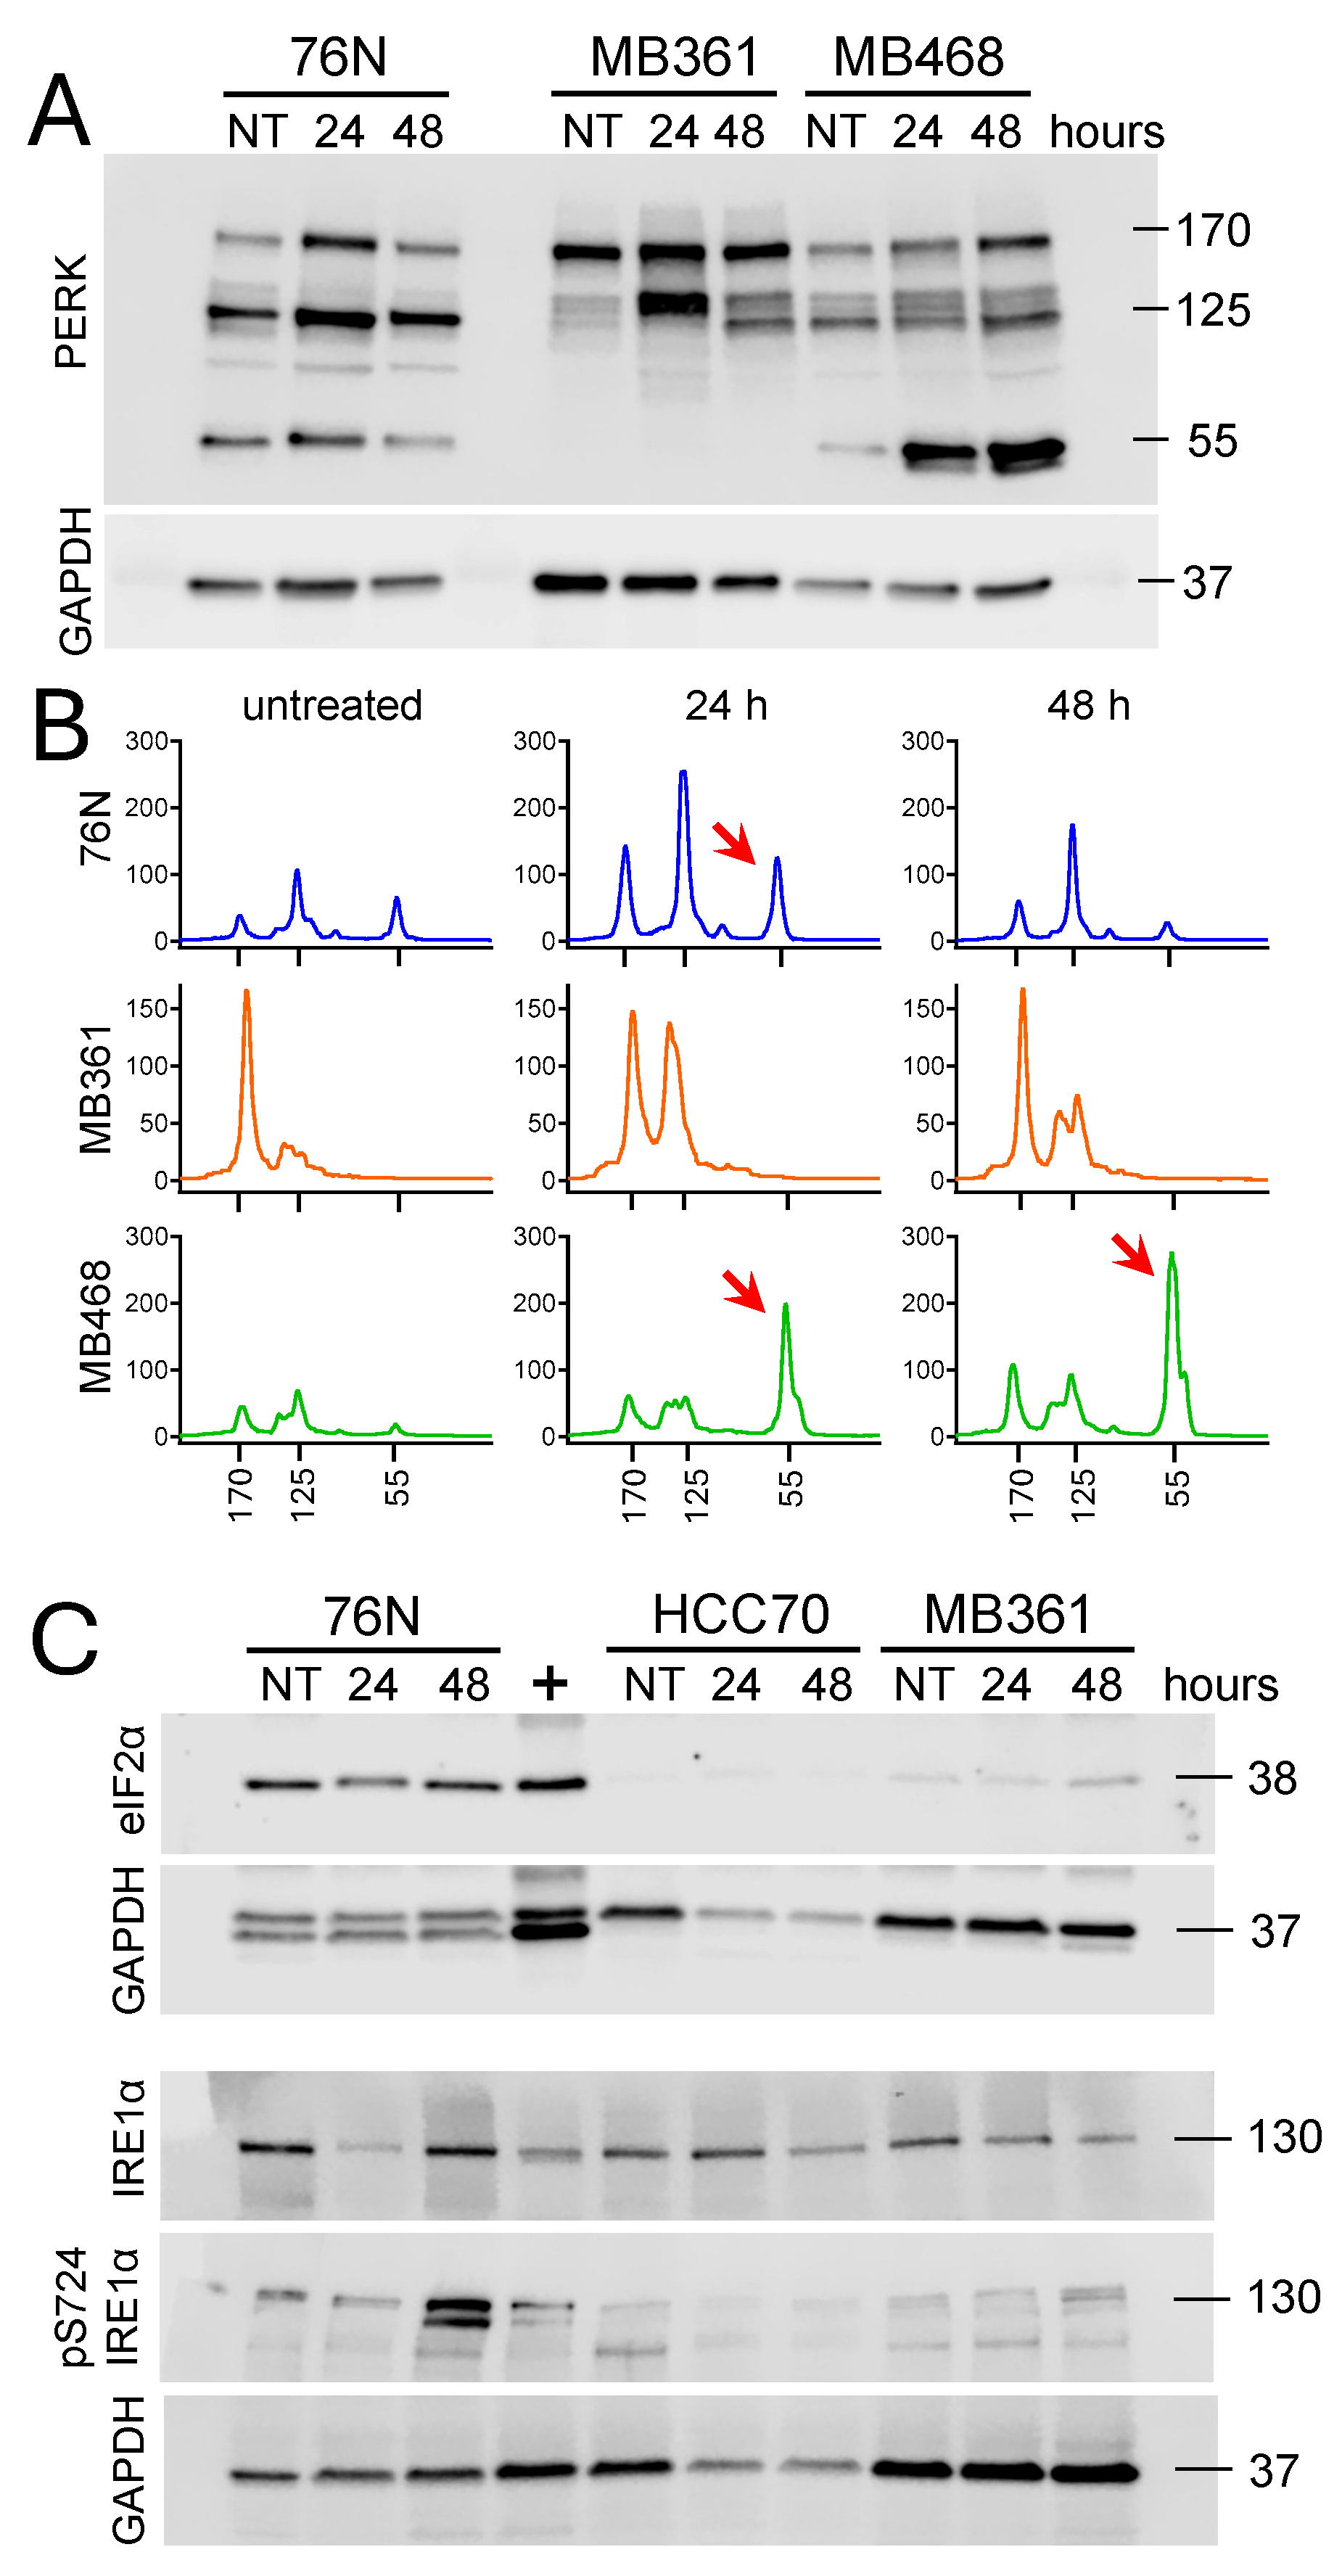
Figure 15.
Human heat shock proteins expression in lysates from normal breast cells and BCa cells either untreated (NT) and IBCar-treated (500 nM IBCar, 24 h). A. Untreated 76N cells. B. IBCar treated 76 cells. C. Untreated MB468 cells. D. IBCar-treated MB468 cells. UBIQ = RPS27a.
Figure 15.
Human heat shock proteins expression in lysates from normal breast cells and BCa cells either untreated (NT) and IBCar-treated (500 nM IBCar, 24 h). A. Untreated 76N cells. B. IBCar treated 76 cells. C. Untreated MB468 cells. D. IBCar-treated MB468 cells. UBIQ = RPS27a.
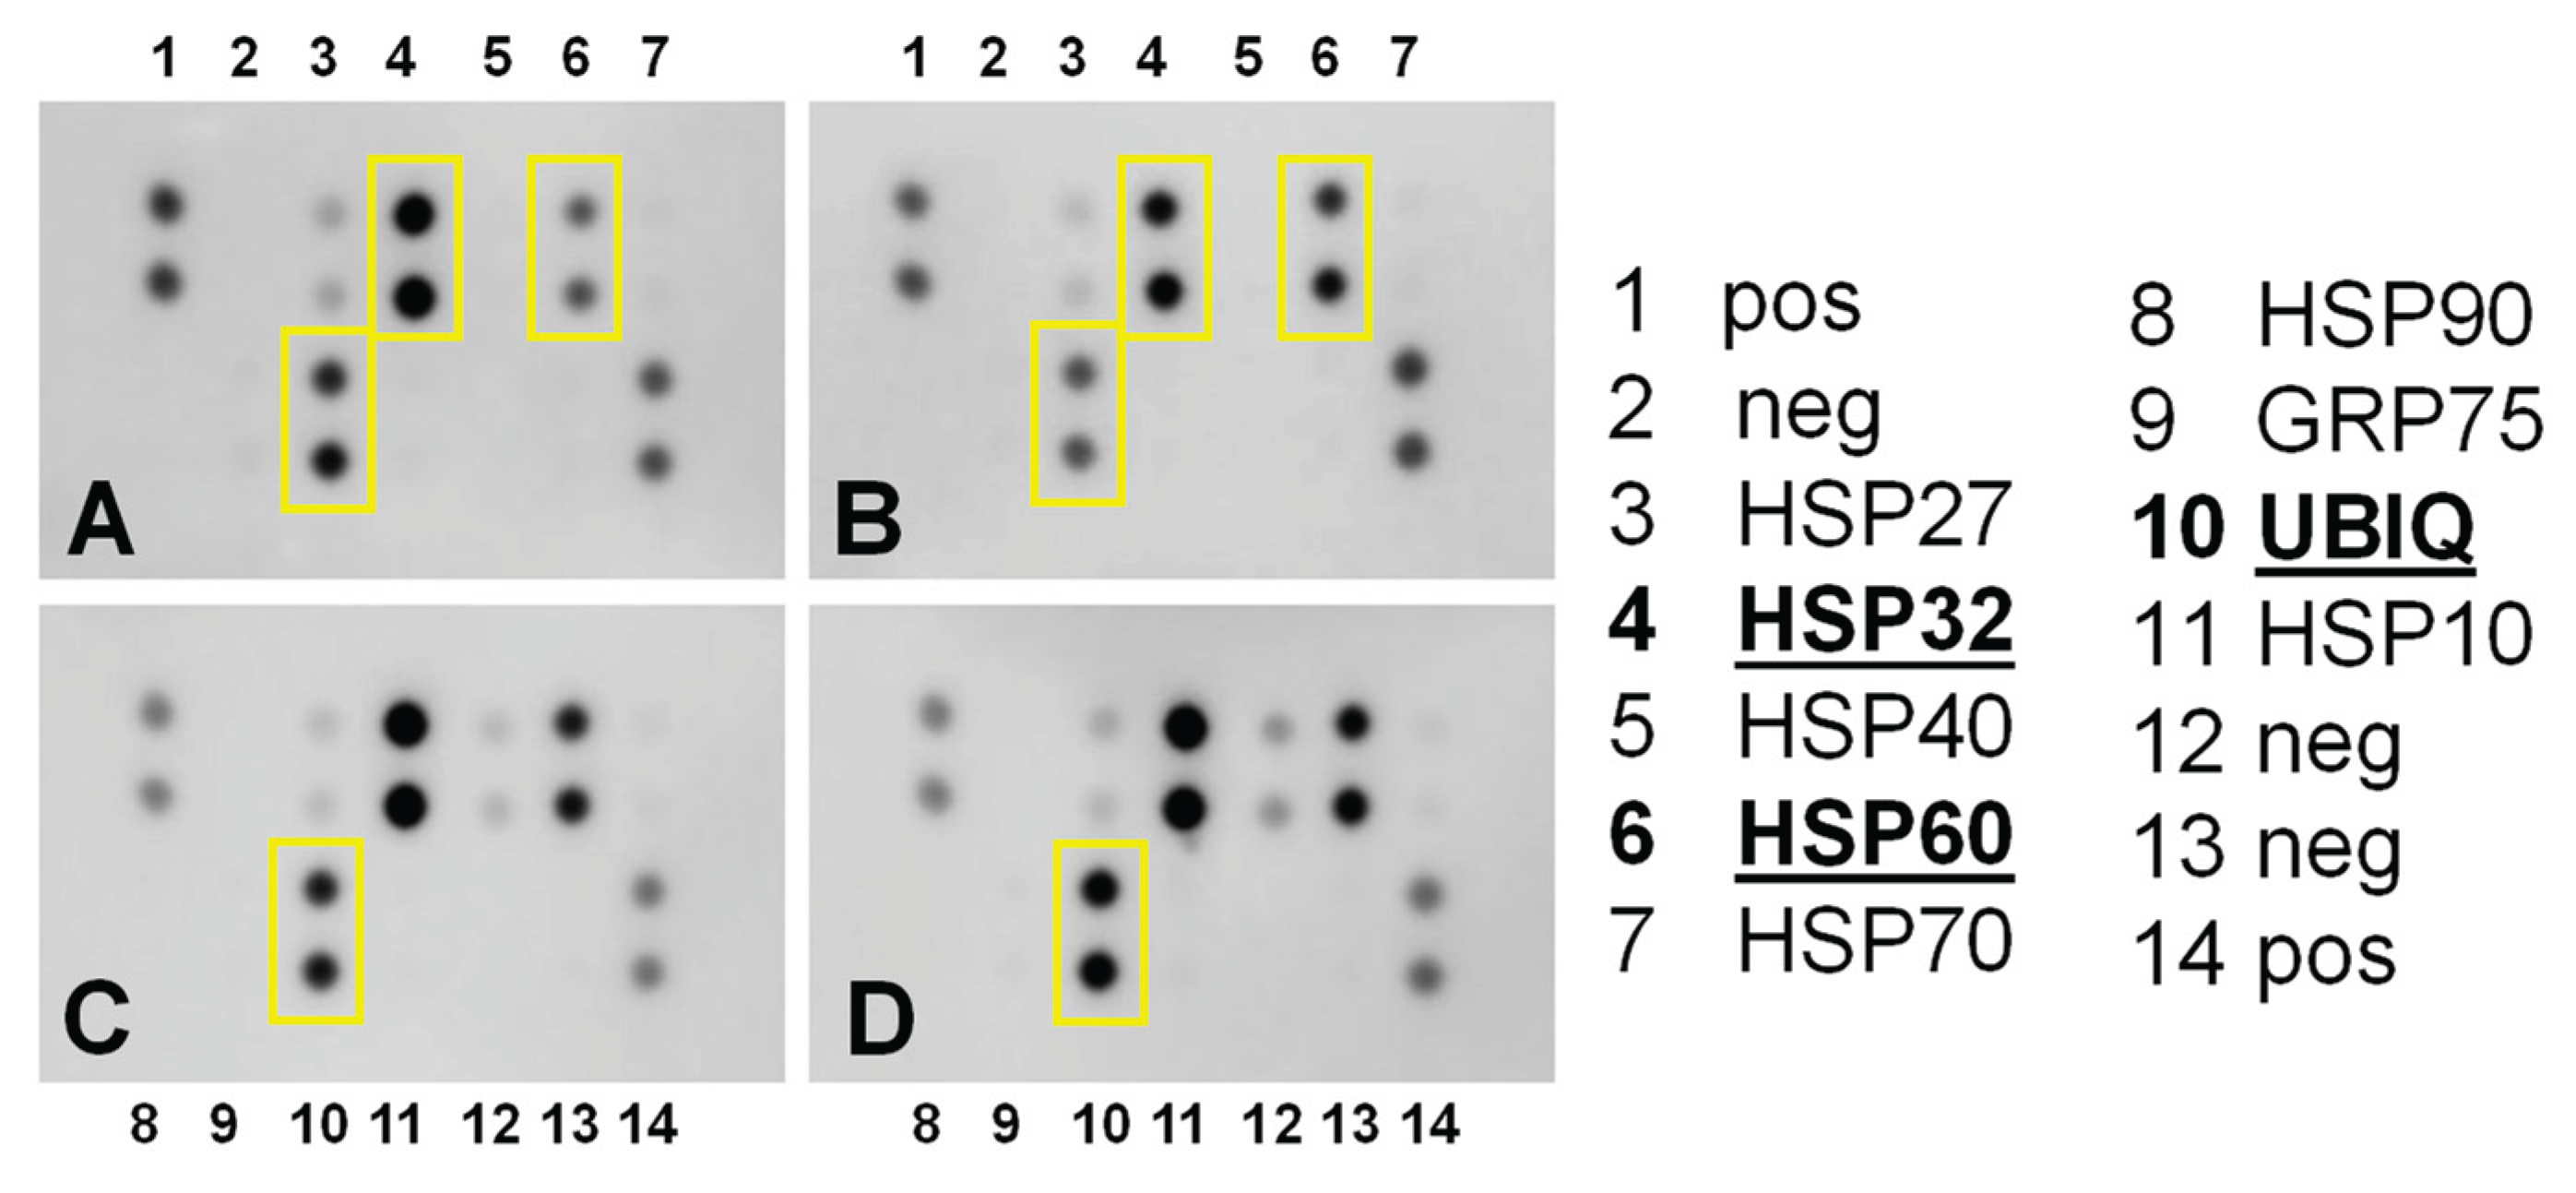
Figure 16.
Diverse effects of the IBCar treatment on the mitochondrial membrane potential of normal breast cells 76N (A) and breast cancer cells HCC70 (B).
Figure 16.
Diverse effects of the IBCar treatment on the mitochondrial membrane potential of normal breast cells 76N (A) and breast cancer cells HCC70 (B).
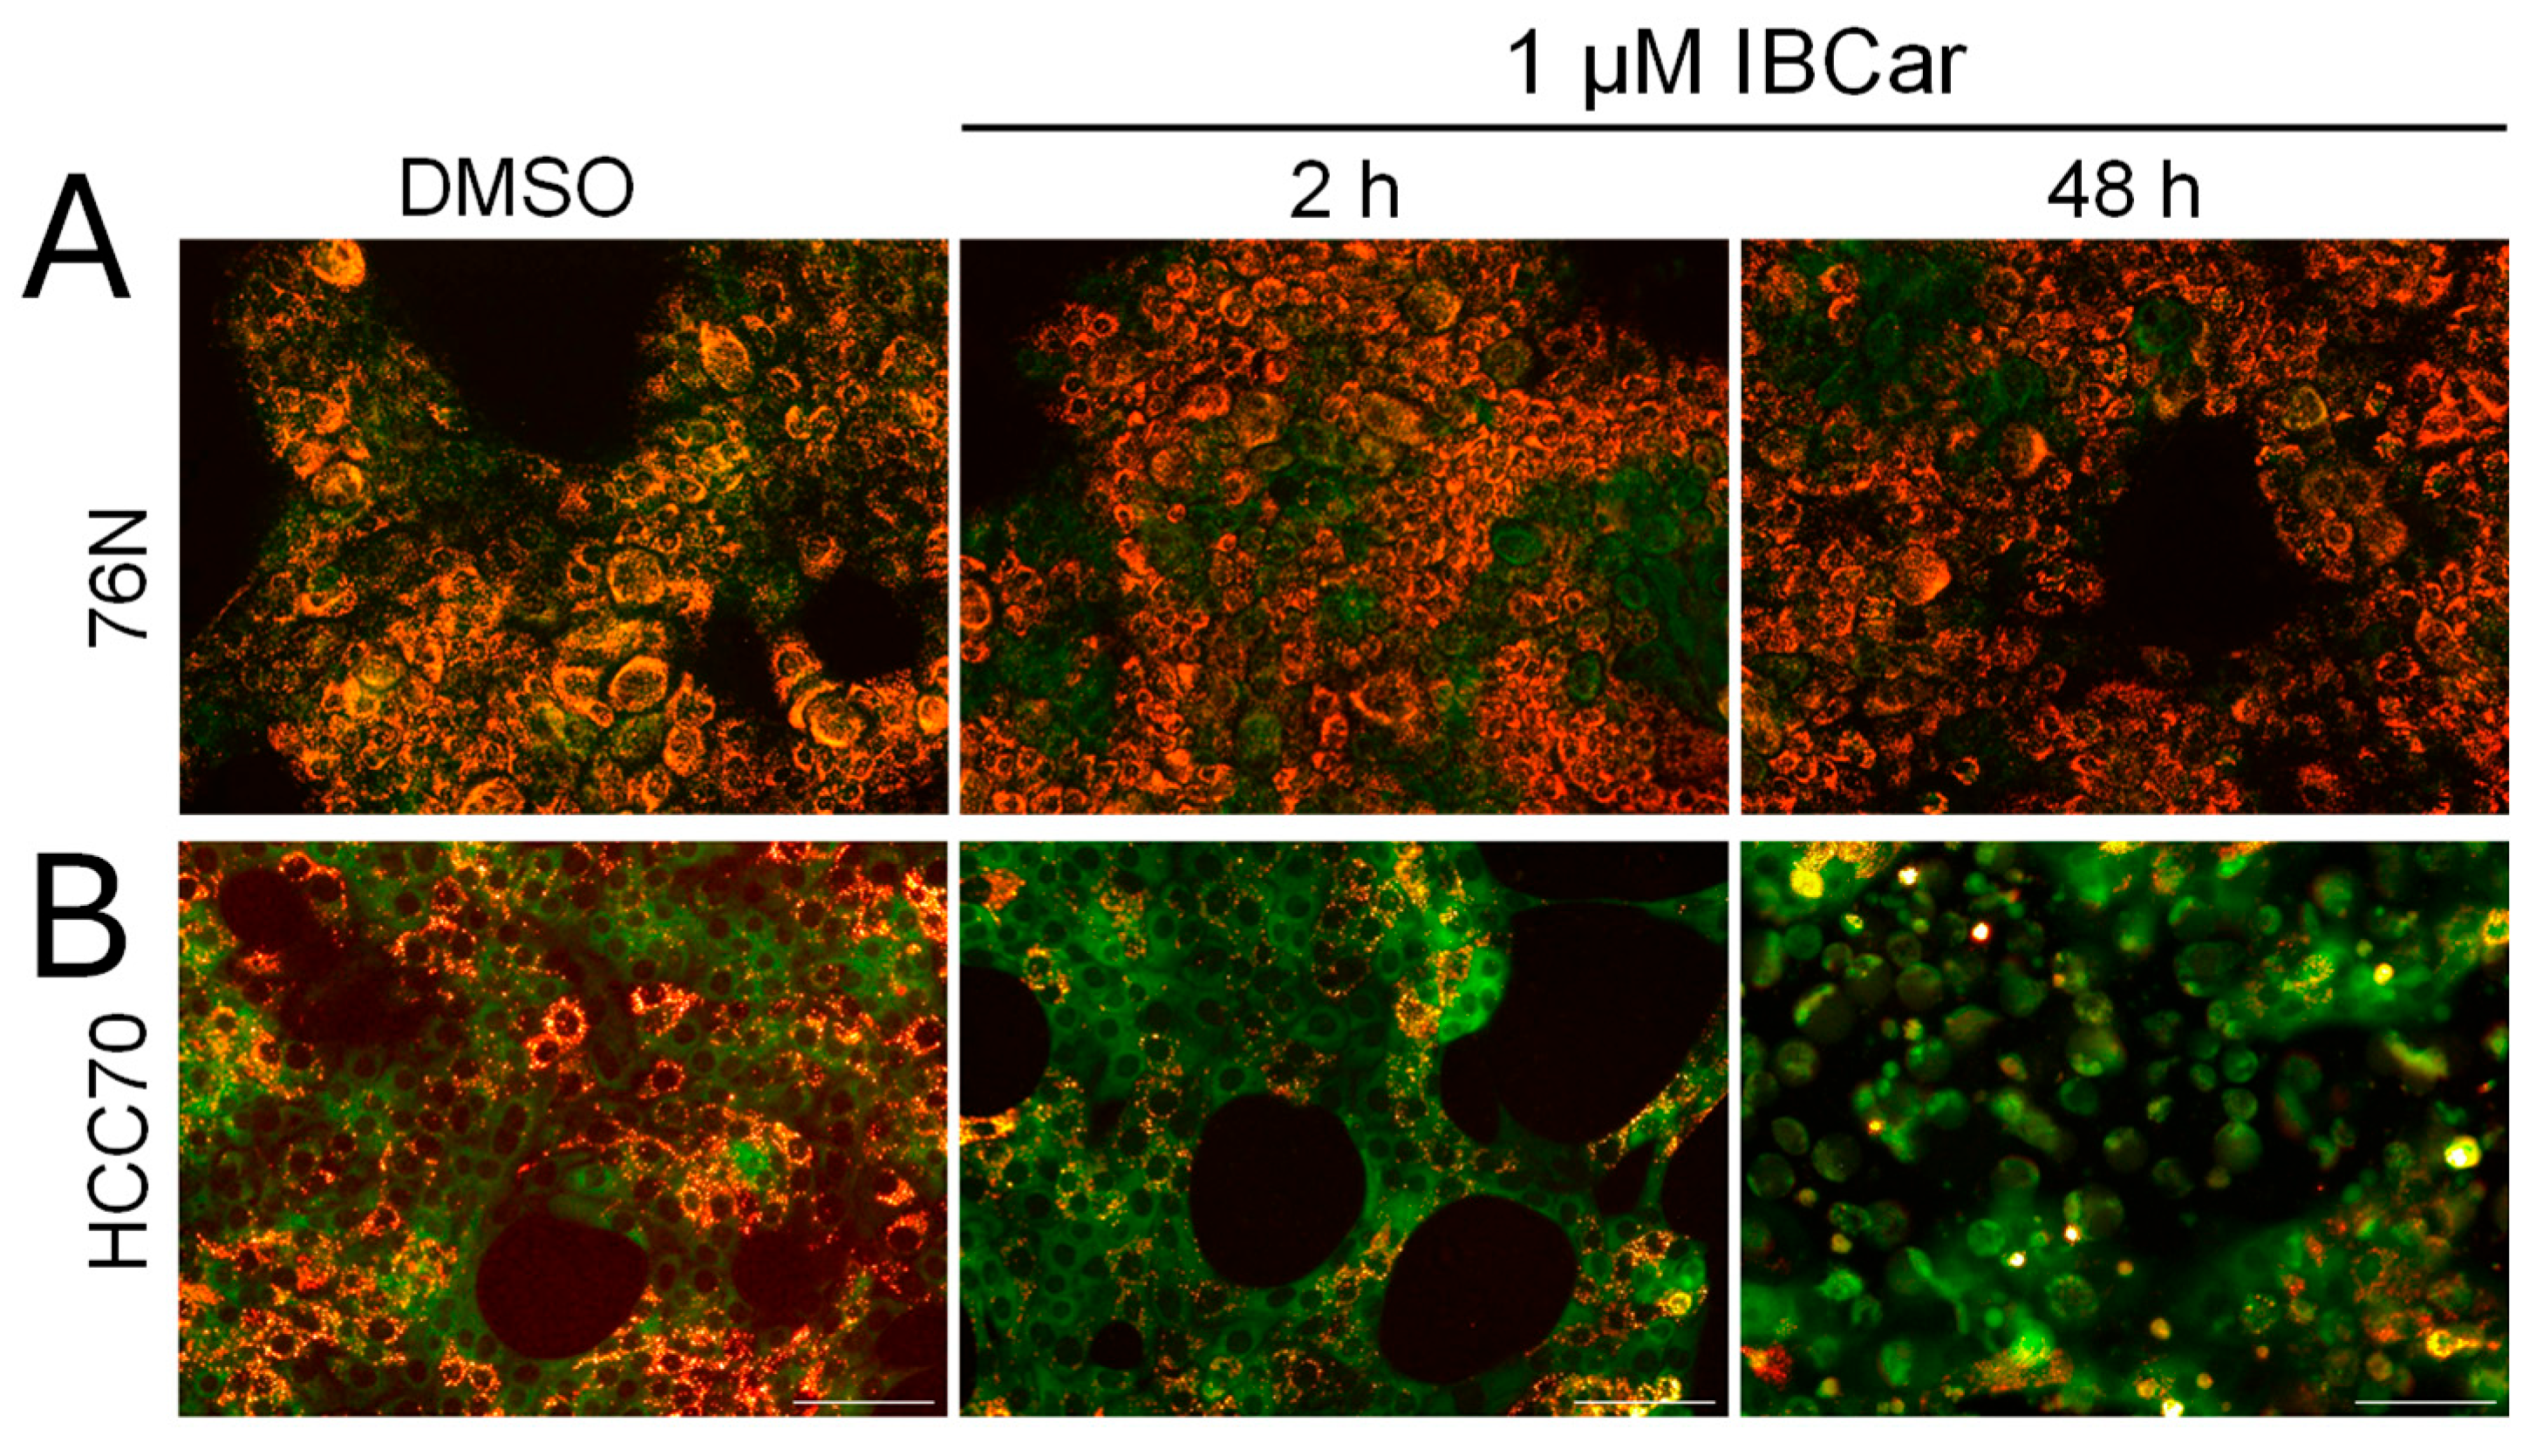
Figure 17.
Oral IBCar therapy in MMTV-PyVT female mice. A. Outline of treatment and necropsy schedules. B. Kaplan-Meier survival curves of IBCar-treated and control mice (NT). C. Longitudinal evaluation of tumor volumes. Average weights of tumors (D) and lungs (E) extirpated from IBCar-treated mice (day 88, i.e., 18 days after the last IBCar dose) and control mice receiving vehicle only (data from mice necropsied on days 59 to 81). F. Comparison of mammary glands involvement in untreated control mice and IBCar-treated mice. Mice treated with IBCar did not develop any mammary gland tumors and lung metastases during treatment. All mammary glands in control mice were involved. G. Expression of ER-α and PR in lysates prepared from tumors extirpated on day 81 (NT mice) and on day 88 (IBCar-treated mice). H. ER-α expression relative of the protein load as measured by GAPDH bands.
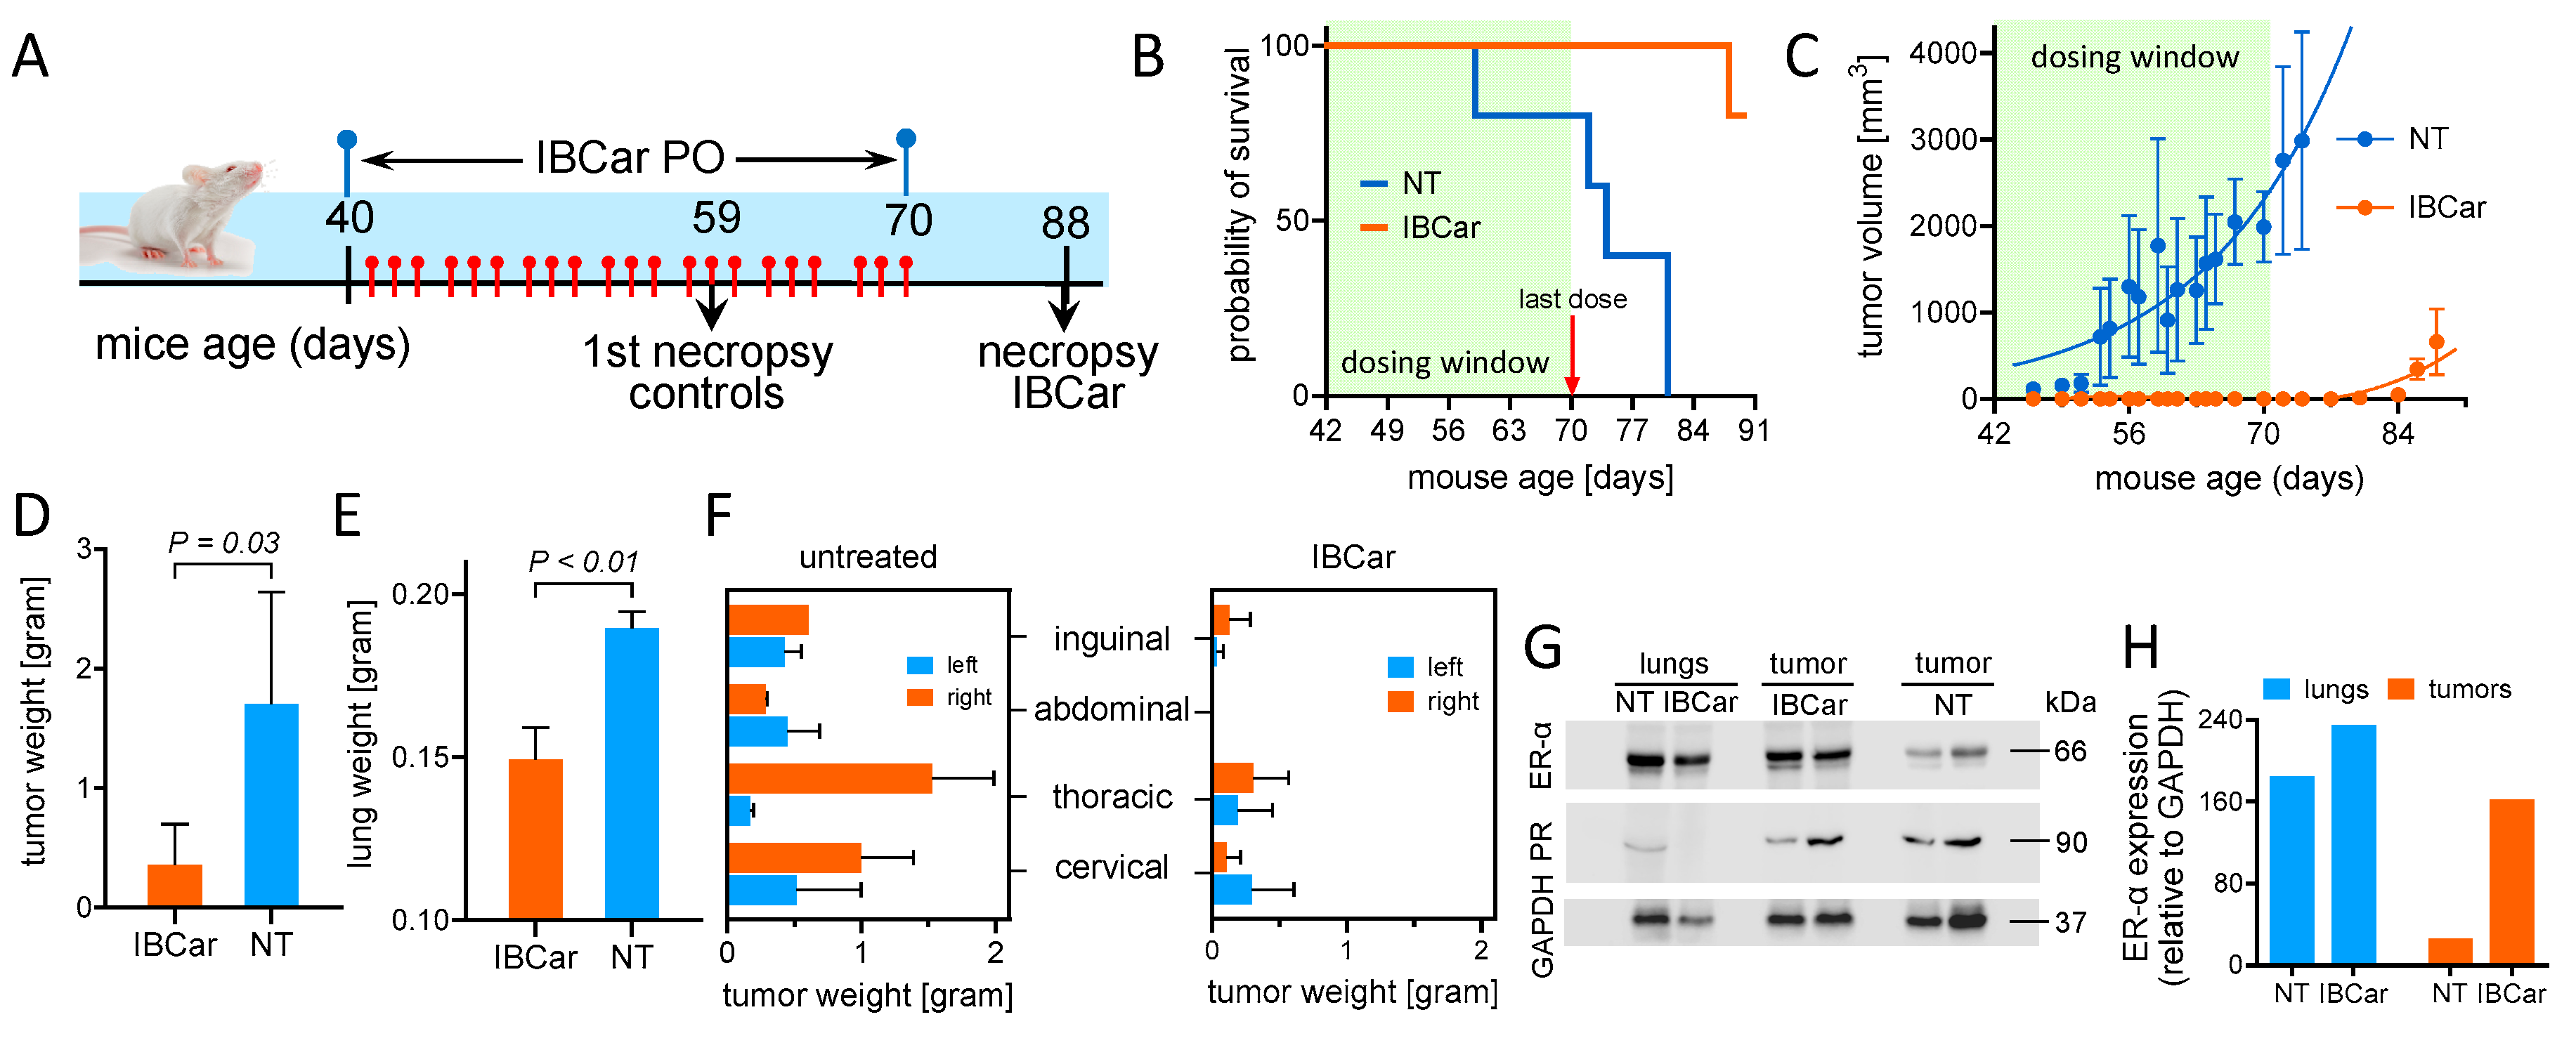
Figure 18.
Oral IBCar therapy in immunodeficient J:Nu female mice bearing subcutaneous human MB468 triple-negative breast cancer xenografts. A. Outline of treatment and necropsy schedules. B. Changes in body weights relative to weights one week before xenograft implant. Tumor volumes are subtracted from body weights. NT = control mice. Orally administered IBCar had no adverse impact on the body weight. C. The Kaplan-Meier survival curves of IBCar-treated and control mice. Only two xenografts in mice treated with IBCar doubled their volume during treatment. D. Longitudinal evaluation of tumor volumes. E. and F. Comparison of tumors extirpated from IBCar-treated mice and vehicle-treated control mice. IBCar-treated tumor weights are >3× smaller compared to tumors from the untreated control mice.
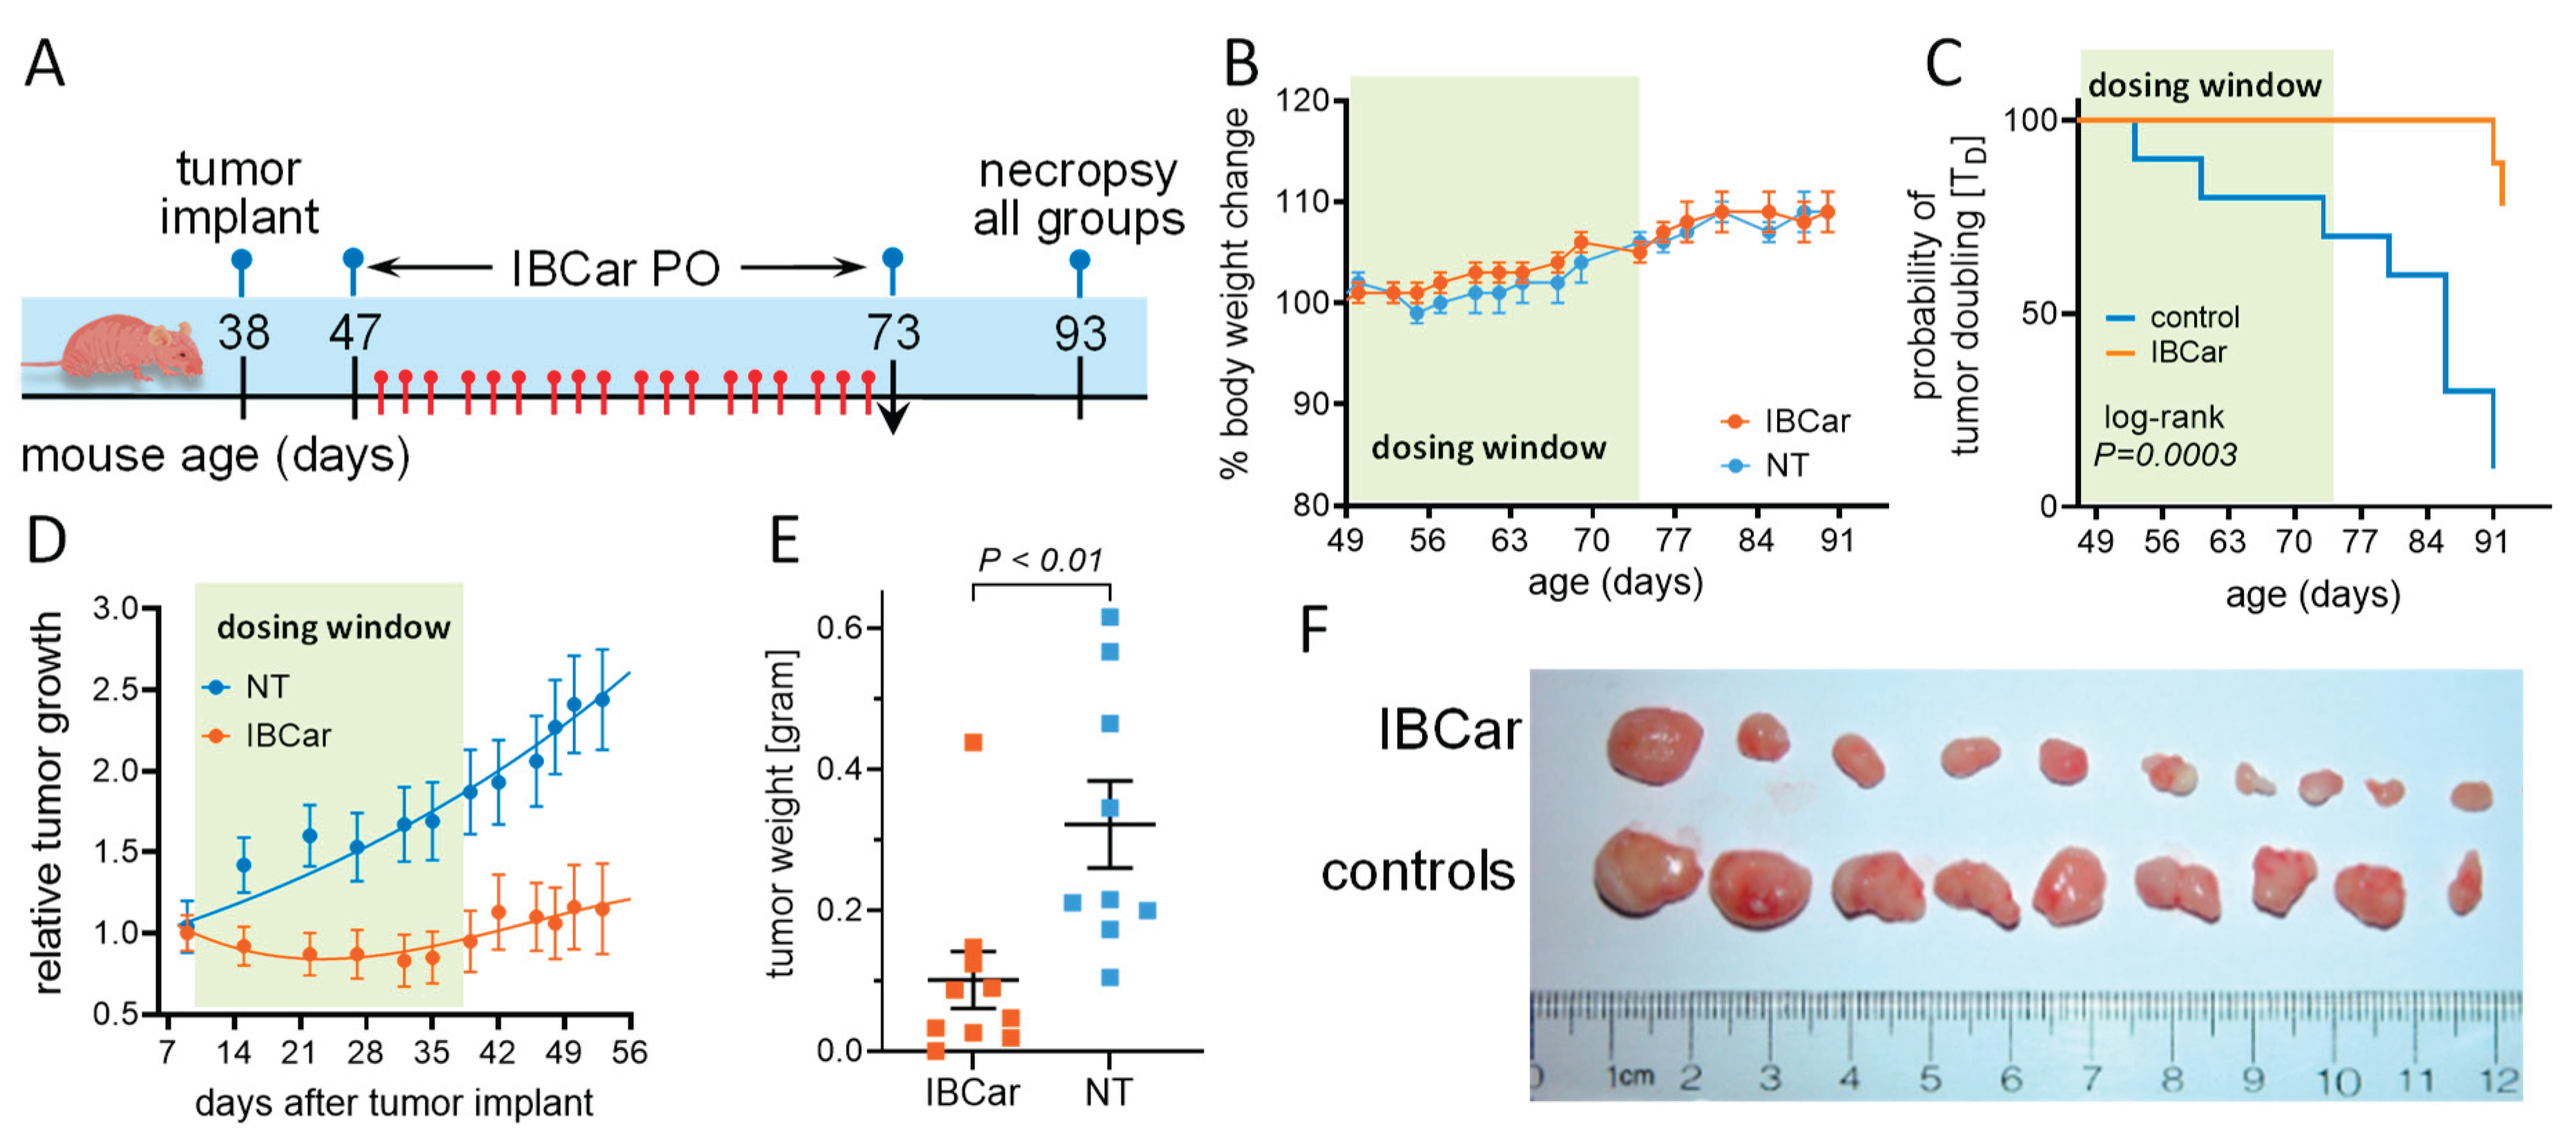

Table 1.
Characteristics of human cell lines used in this study.
| cell line (abbreviation) |
disease | source | race | TP53 status | TD [hours] |
|---|---|---|---|---|---|
|
BT-549 (BT549) |
TNBC* | primary | White | R249S | 57.9±9.6 |
|
HCC70 (HCC70) |
TNBC | primary | Black | R248Q | 60.0±8.9 |
|
MDA-MB-175-VII (MB175) |
carcinoma | pleural effusion |
Black | WT | 100.8±8.9 |
|
MDA-MB-231 (MB231) |
TNBC | pleural effusion |
White | R280K | 32.6±6.3 |
|
MDA-MB-361 (MB361) |
carcinoma | brain | White | WT | 94.1±3.1 |
|
MDA-MB-468 (MB468) |
TNBC | pleural effusion |
Black | R273H | 42.5±3.9 |
|
MCF-10A (MCF10A) |
fibrocystic breast | fibrocystic breast | White | WT | 21.0±5.6 |
|
76N (76N) |
epithelial cells | mammoplasty | not defined |
WT | 23.0±2.3 |
* TNBC = triple negative breast cancer.
Table 2.
Binding energies (EB) and inhibition constants (Ki) estimated in the docking studies.
| compound | EB [kcal/mol] | Ki [nM] |
|---|---|---|
| colchicine | -9.86 | 59.0 |
| mebendazole | -7.90 | 1,630.0 |
| IBCar | -11.44 | 4.08 |
Table 3.
GI50 concentrations of mebendazole, vincristine, and IBCar determined by the NCI DTP in several breast cancer cell lines.
Table 3.
GI50 concentrations of mebendazole, vincristine, and IBCar determined by the NCI DTP in several breast cancer cell lines.
| cell line | Mebendazole [nM] |
Vincristine [nM] |
IBCar [nM] |
|---|---|---|---|
| BT-549 | 3,273.4 | 657.7 | 74.1 |
| HS 578T | 199.5 | 233.9 | 38.9 |
| MCF7 | 204.2 | 119.7 | 35.5 |
| MDA-MB-231 | 1,253.1 | 209.9 | 100.0 |
| MDA-MB-468 | 121.3 | nd | 28.2 |
Table 4.
Cytotoxicity of IBCar in breast cancer cell lines and normal epithelial breast cells.
| GI50 [nM] | GI50 [nM] | ||||
|---|---|---|---|---|---|
| 96-well MTS assay | clonogenic | ||||
| cell line | 24 h | 48 h | 72 h | 48 h treatment | |
| BT-549 | 57.5±6.0 | 14.8±1.2 | 12.9±1.3 | 22.9±1.4 | |
| HCC70 | 177.5±16.2 | 33.7±6.9 | 17.8±2.2 | 12.3±2.8 | |
| MDA-MB-175-VII | nd | 172.4±36.5 | 24.2±3.5 | 24.0±6.6 | |
| MDA-MB-231 | nd | 41.4±7.8 | nd | 19.5±3.4 | |
| MDA-MB-361 | nd | 21.9±3.1 | nd | 3.0±2.1 | |
| MDA-MB-468 | nd | 25.3±1.5 | nd | 7.3±1.9 | |
| MCF-10A | 1,149±357 | 149.9±49.7 | nd | nd | |
| 76N | 2,561±315 | 1,786±389 | 1,622±580 | nd | |
Table 5.
FVB/N-Tg(MMTV-PyVT)634Mul/J female mice serum chemistry in IBCar-treated and controls mice.
Table 5.
FVB/N-Tg(MMTV-PyVT)634Mul/J female mice serum chemistry in IBCar-treated and controls mice.
| IBCar | control | standard values |
||
|---|---|---|---|---|
| parameter | units | average (std dev) |
average (std dev) |
range |
| Albumin (ALB) | g/dL | 4.4 (0.3) | 4.7 (0.4) | 2.5 – 4.9 |
| Alkaline phosphatase (ALP) | U/L | 90.0 (11.1) | 68.0 (19.9) | 16 - 291 |
| Alanine aminotransferase (ALT) | U/L | 84.3 (43.0) | 57.0 (17.6) | 7 - 277 |
| Amylase (AMY) | U/L | 847.8 (92.3) | 876.7 (73.4) | na |
| Bilirubin, total (total bil) | mg/dL | 0.4 (0.1) | 0.3 (0.1) | 0.1 - 1.1 |
| Bood urea nitrogen (BUN) | mg/dL | 17.8 (1.3) | 18.0 (2.6) | 2 - 71 |
| Calcium (Ca) | mg/dL | 11.3 (0.9) | 11.9 (0.2) | 6.8 - 11.9 |
| Phosphorus (PHOS) | mg/dL | 11.8 (0.6) | 11.0 (1.3) | 5.3 - 11.3 |
| Creatinine (CRE) | mg/dL | 0.4 (0.1) | 0.3 (0.1) | 0.1 - 2.1 |
| Glucose (GLU) | mg/dL | 310.3 (47.2) | 258.7 (12.1) | 46 - 279 |
| Sodium (Na+) | mmol/L | 157.3 (11.1) | 160.0 (4.4) | 145 - 176 |
| Potassium (K+) | mmol/L | 8.5 (0.0) | 8.5 (0.0) | 6.5 - 9.7 |
| Total protein (TP) | g/dL | 5.4 (0.5) | 5.9 (0.5) | 3.3 - 7.6 |
| Globulin (GLOB) | g/dL | 1.1 (0.2) | 1.2 (0.2) | na |
Disclaimer/Publisher’s Note: The statements, opinions and data contained in all publications are solely those of the individual author(s) and contributor(s) and not of MDPI and/or the editor(s). MDPI and/or the editor(s) disclaim responsibility for any injury to people or property resulting from any ideas, methods, instructions or products referred to in the content. |
© 2025 by the authors. Licensee MDPI, Basel, Switzerland. This article is an open access article distributed under the terms and conditions of the Creative Commons Attribution (CC BY) license (http://creativecommons.org/licenses/by/4.0/).
Copyright: This open access article is published under a Creative Commons CC BY 4.0 license, which permit the free download, distribution, and reuse, provided that the author and preprint are cited in any reuse.


