
Submitted:
06 June 2025
Posted:
09 June 2025
You are already at the latest version
Abstract
The System of Rice Intensification (SRI) is known to boost rice yields while reducing water use, but its impact on greenhouse gas (GHG) emissions under different water management practices remains unclear. This research aims to determine the effective water management practices in SRI for mitigating greenhouse gas emissions by maintaining yield. This study, conducted from 2016 to 2018, evaluated three irrigation regimes—Flooded (FL: 2–5 cm water depth), WET (0–1 cm), and DRY (-5 cm) in Bogor, Indonesia. Methane (CH₄) and nitrous oxide (N₂O) emissions were measured weekly using a closed chamber system. Results showed an inverse relationship between CH₄ and N₂O: CH₄ was lowest under the DRY regime, while N₂O was lowest in the FL regime. The DRY regime had the lowest global warming potential (GWP), 28% and 33% lower than WET and FL, mainly due to a significant CH₄ reduction (42% and 57%, respectively). Despite reduced water levels, rice yields remained stable in the DRY regime, averaging 6.0–6.18 tons/ha across three seasons. These findings suggest that the DRY irrigation regime in SRI can effectively balance high rice productivity with reduced GHG emissions, offering a sustainable water management strategy.
Keywords:
greenhouse gas emission
; global water potential
; paddy cultivation
; water management
1. Introduction
Rice paddy is a key staple crop that sustains the needs of more than half the global population. However, their production heavily depends on water availability, making rice cultivation one of the most water-intensive sectors in agriculture. Traditional water management systems often lead to inefficient water use and heighten greenhouse gas emissions [1], particularly methane, which is produced through anaerobic processes in flooded fields. Given global warming concerns, water management strategies that maintain productivity while reducing emissions have become a critical priority in advancing sustainable agriculture. Water management in rice cultivation affects not only crop production but also greenhouse gas emissions, particularly methane (CH4) and nitrous oxide (N2O) [2]. Commonly in Indonesia, continuous flooding (CF) is widely practiced, primarily to create an anaerobic environment that suppresses weed growth. The lack of oxygen in submerged conditions inhibits the germination and establishment of most weed species, giving rice, which is adapted to thrive in flooded environments, a competitive advantage. CF condition limits the light and nutrient availability of weeds, significantly reducing their population and spread. The practice remains widespread due to its simplicity and historical association with high yields under optimal conditions [3].
Although CF enhances productivity, there are some concerns related to excessive water use and high CH4 emissions. CF create of anaerobic soil conditions, which promote the activity of methanogenic archaea—microorganisms that produce methane as a by-product of organic matter decomposition in oxygen-deprived environments. CH4 is a potent greenhouse gas, with a global warming potential much higher than carbon dioxide. Studies have shown that this traditional water management practice in rice cultivation is a primary contributor to agricultural CH4 emissions globally [4,5]. In addition, CF in rice fields is known to reduce water use efficiency due to significant water losses through processes such as deep percolation, surface runoff, and evaporation. This traditional irrigation method consumes substantial amounts of water. Despite its ability to ensure stable rice yields and suppress weed growth, CF contributes to inefficient water utilization, which is increasingly unsustainable in regions facing water scarcity and growing competition for water resources [6].
Therefore, water-saving technologies such as intermittent irrigation, water-saving irrigation, and alternate wetting and drying (AWD) have been introduced as more environmentally friendly water management practice that is able to reduce greenhouse gas emissions. In addition, alternative rice cultivation systems such as the System of Rice Intensification (SRI) have demonstrated a significant reduction in greenhouse gas emissions [7,8,9]. SRI has emerged as a promising method for addressing these challenges. By emphasizing controlled irrigation, improved spacing, and organic fertilization, SRI reduces water use and enhances soil aeration, thereby mitigating CH4 emissions and maintaining or even increasing yields [10].
SRI has been introduced in Indonesia since 1999, and numerous studies on SRI have been conducted in the country, focusing on water management [11,12,13]. But most Indonesian farmers still prefer CF systems due to concerns that water-saving technologies may reduce yields and problems with weed growing. Further, there is currently a lack of information on optimal water management practices that can simultaneously maintain productivity and reduce emissions, particularly CH4 and N2O. Therefore, this study aims to determine optimal water management strategies with SRI that sustain yields while lowering greenhouse gas emissions including its analysis of water productivity and water use efficiency. These strategies will be developed by testing various irrigation scenarios at different growth stages of the crop.
2. Materials and Methods
2.1. Experimental setup
The study was conducted at Kinjiro Farm (6°35’35.36”S and 106°46’17.95” E) in Bogor, Indonesia, over three growing seasons from 2016 to 2018. The first growing season took place from April 14 to August 4, 2016, the second from April 8 to July 29, 2017, and the third from January 20 to May 12, 2018, with each rice cultivation cycle lasting 112 days. Elements of the System of Rice Intensification (SRI) were applied during cultivation, including single transplanting with young seedlings (14 days after sowing) at a spacing of 30 x 30 cm using the Pertiwi rice variety.
For fertilization, the soil was treated with urea, SP-36, and KCl fertilizers. Urea was applied at a rate of 100 kg/ha at 0–10 days after transplanting (DAT), 100 kg/ha at 20–30 DAT, and 75 kg/ha at 35–45 DAT. SP-36 was applied at 100 kg/ha at 0–10 DAT, while KCl was applied at 75 kg/ha at 0–10 DAT and 75 kg/ha at 35–45 DAT. Details of the soil’s physical properties are presented in Table 1.
The irrigation patterns in this study were divided into three distinct water regimes: flooded (FL), WET, and DRY. The flooded (FL) regime was implemented as a conventional irrigation system, the WET regime represented a moderate water condition, and the DRY regime simulated a water-saving scenario under SRI rice cultivation. In the FL regime, the water level was maintained continuously at 2–5 cm above the soil surface. During the final growth stages, the water level was gradually reduced to the soil surface. In the WET regime, the water level was set at 1 cm above the soil surface during the first 20 days after transplantation (DAT). Afterward, it was maintained at 0 cm (soil surface level) until harvest. In the DRY regime, the water level was maintained at 1 cm above the soil surface for the first 20 days. It was then adjusted to 0 cm at 21–30 DAT and subsequently lowered to 5 cm below the soil surface until harvest (Figure 1).
2.2. Greenhouse gas emission measurements and analysis
Measurements of greenhouse gas emissions, specifically methane (CH4) and nitrous oxide (N2O), were conducted weekly using a closed chamber system. The chamber measured 30 cm × 30 cm × 120 cm, accompanied by a chamber base of 30 cm × 30 cm × 20 cm, 200 ml tedlar bags, and 10 ml brown vials equipped with rubber stoppers. Prior to gas sampling, a fan inside the chamber was activated, and the chamber was securely placed on the chamber base. Transparent tubing connected to a three-way valve on the chamber facilitated sampling by attaching tedlar bags and syringes. Gas samples were collected at four times intervals—0, 10, 20, and 30 minutes. The sampled gas in the tedlar bags was transferred into 10 ml vials using syringes through the rubber stoppers for each time point. Subsequently, the gas samples were analyzed at the Greenhouse Gas Laboratory.
Gas analysis was conducted using a calibrated Gas Chromatography (GC) system. The analysis results provided gas concentration values in parts per million (ppm). The rate of change in gas concentration over time was used to determine the gas flux. Methane flux was calculated using Equation (1) [14]:
where E is CH₄/N2O gas flux (mg/m²/min), δC/δt is change in CH₄/N2O concentration over time (ppm/min), V is chamber volume (m³), A is chamber surface area (m²), mV is molar volume of gas (22.41 liters at standard temperature and pressure), mW is molecular weight of CH₄/N2O gas and T is sampling temperature (°C). A positive CH4/N2O gas flux value indicates that the rice field emits methane gas, while a negative value indicates CH4/N2O absorption or uptake.
The total flux over a growing season was calculated by integrating the flux values using the numerical Simpson’s Rule model, as expressed in Equation (2):
where a is measurement time point ‘a’, b is measurement time point ‘b’, f(a) is the greenhouse gas emission value at a time ‘a’ (mg/m²/d) and f(b) is the greenhouse gas emission value at time ‘b’ (mg/m²/d).
2.3. Water and weathers parameters measurements
The determination of water parameters is based on a water balance using the lysimeter principle, taking into account water inflow and outflow. Water inflow includes rainfall (P) and irrigation (I), while water outflow consists of actual evapotranspiration (ETa) and drainage/runoff (RO). The relationship is expressed by the following Equation (3):
where WL represents the water level (mm), and i denotes time (days).
The observed weather parameters include air temperature, humidity, and solar radiation. We analyzed weather data to obtain max, min, and average of air temperatures. For humidity and solar radiation, we calculate the mean daily value. Daily reference evapotranspiration based on Penman-Monteith FAO was calculated using the available weather data over three cropping seasons.
2.4. Yield, water productivity, and water use efficiency
The grain yield of rice for each water regime is converted to tons per hectare (ton/ha) at harvest. Water productivity is calculated using the following Equations (4) and (5):
where WPI+P represents water productivity with respect to water inflow (kg/m³), WPET represents water productivity with respect to actual evapotranspiration (kg/m³), and Y is the total yield (ton/ha). Additionally, to evaluate water use efficiency, the water efficiency index is determined using the following Equation (6):
where WUE is the water use efficiency index (kg/m³). Due to severe bird attack, the yield data for the 2017 season were not reliable. Estimations were made based on remaining unspoiled grain and supported by linear interpolation between 2016 and 2018 yields for each irrigation regime. A simple linear regression model using season and treatment as predictors was also applied to validate the estimates. These values were used in the analysis to ensure data consistency.
3. Results
3.1. Weather conditions among crop seasons
Table 2 provides weather data over three years of crop season, which includes parameters like air temperature, relative humidity, solar radiation, evapotranspiration, and precipitation. The weather conditions during the three growing seasons were relatively stable across all parameters, despite some fluctuations. Maximum air temperature remained constant at 35.9°C in 2016 and 2017 and slightly increased to 36.2°C in 2018. For average air temperature, a gradual decrease from 26.9°C in 2016 to 26.2°C in 2018 may reflect changes in growing conditions. For paddy, the ideal temperature range is 25-35°C; the values in the table are within this range, favoring growth. Meanwhile, the slight variations (20.4°C to 20.6°C) of minimum air temperature indicate stable nighttime temperatures, which are critical for crop respiration and avoiding cold stress.
Relative humidity (RH) ranged from 82.7% in 2017 to 84.6% in 2016. High humidity is generally favorable for paddy as it prevents excessive water loss through transpiration. However, excessive humidity can promote diseases such as pathogenic fungal infections (e.g., blast and sheath blight). The average solar radiation slightly declined from 13.0 MJ/m²/d in 2016 to 12.1 MJ/m²/d in 2018. Adequate sunlight is necessary for photosynthesis and crop yield. Reference evapotranspiration was in line with the solar radiation. A notable decrease in reference evapotranspiration values (from 3.25 mm in 2016 to 2.43 mm in 2018) suggests a reduction in water demand by the atmosphere. Meanwhile, precipitation varied significantly, with a peak in 2017 (1414 mm) and a decline in 2018 (1025 mm).
3.2. Seasonal CH4 and N2O emissions
Figure 2 shows the fluctuation of CH4 emission during three crop seasons under three different regimes. CH4 emissions vary significantly across the years, showing both positive and negative values. Significant emission peaks were observed in the FL regime, particularly in 2017 (e.g., 1184.2 mg/m² at DAT 28) and 2016 (e.g., 961.9 mg/m² at DAT 105). The positive correlation between flooding and CH4 emissions supports the idea that standing water facilitates methane production as occurred in the FL regime. Under the WET regime, the conditions show intermediate levels of methane emissions compared to flooded conditions. However, in some cases (e.g., DAT 28, 2017: 1044.4 mg/m²), emissions were nearly as high as under flooded conditions. In some instances (e.g., DAT 0 and DAT 35 in 2017), the WET regime shows CH4 uptake (negative values), indicating methanotrophy might dominate temporarily. The data suggested that shifting from flooded to wet conditions could significantly reduce CH4 emissions without entirely eliminating CH4 release [15]. The DRY regime with the lowest water level shows that CH4 emissions were typically the lowest or even negative (indicating uptake). Here, strong uptake was observed in 2016 (e.g., -155.2 mg/m² at DAT 0) and positive emissions were occasional and relatively low, and the peak were lowest than two other regimes (e.g., 250.4 mg/m² at DAT 21, 2018). Aerobic soil conditions under dry conditions favor methanotrophic bacteria that consume CH4 [16].
A different trend was observed in N2O emissions, where the FL regime produced the lowest N2O emissions compared to the other two irrigation systems (WET and DRY), particularly in 2018, as shown in Figure 3. N2O emissions were relatively low under flooded conditions in the FL regime, consistent with reduced availability of oxygen in the soil. For instance, low emissions were observed in most years and dates (e.g., -0.7 mg/m² at DAT 91 in 2018 or 0.5 mg/m² at DAT 0 in 2016). Negative values (e.g., -18.0 mg/m² at DAT 112 in 2016) may indicate net consumption of N2O, likely due to denitrification to N2 [17]. Peaks were rare but occurred under specific conditions (e.g., 13.1 mg/m² at DAT 84 in 2016).
The WET regime shows moderate N2O emissions, with occasional peaks, e.g., peaks of 14.5 mg/m² (DAT 35 in 2017) and 26.0 mg/m² (DAT 35 in 2018) that suggested transient periods of aerobic soil zones facilitating nitrification. On the other hand, negative values, as observed in 2016 and 2018 (e.g., -7.2 mg/m² at DAT 70 in 2016), indicate conditions favoring N2O consumption, likely due to near-anaerobic soil environments. Under the DRY regime, N2O emissions were highest, where aerobic environments enhance nitrification. According to Figure 2 high positive emissions were observed, such as 58.7 mg/m² (DAT 42 in 2018) and 25.2 mg/m² (DAT 49 in 2018). Lower negative values or near-neutral values (e.g., -0.3 mg/m² at DAT 63 in 2018) occur less frequently in dry conditions compared to FL and WET, suggesting limited denitrification.
Table 3 presents the total emissions of both CH4 and N2O across each irrigation regime among three seasons. The results highlight a consistent pattern between CH4 and N2O emissions. The FL irrigation treatment produced the highest CH4 emissions but the lowest N2O emissions. Conversely, the DRY irrigation treatment had the lowest CH4 emissions but the highest cumulative N2O emissions. FL regime as continuous flooding creates anaerobic conditions favorable for methanogenesis by microbes in which CH4 emissions peaked in 2017 (267.0 kg/ha/season). The WET showed intermediate CH4 emissions compared to FL and DRY. Wet irrigation, with intermittent drying, limits anaerobic conditions, reducing methanogenesis. Under the WET regime, CH4 emissions were more stable across seasons, ranging from 124.0 to 153.3 kg/ha/season. The lowest water level in the DRY regime produced the lowest CH4 emissions, particularly in 2018 (33.6 kg/ha/season) since dry conditions reduce anaerobic processes, significantly limiting CH4 production. The average reduction in CH4 emissions under the DRY regime is 42% and 57% compared to the WET and FL regimes, respectively.
On the other hand, N2O emissions had negative values on the FL regime particularly in 2016 and 2018, possibly due to denitrification processes converting N2O into N2 gas under saturated conditions, while emissions were negligible in 2017 since the value close to zero (0.45 kg/ha/season). Meanwhile, the WET regime consistently has higher N2O emissions than FL, due to alternating wet-dry cycles that enhance nitrification-denitrification processes. Here, N2O peaked in 2018 (3.25 kg/ha/season). Under the DRY regime, N2O emissions were at the highest level, with a significant increase in 2018 (6.36 kg/ha/season). Aerobic soil conditions promote nitrification, while subsequent irrigation events enable N2O release.
To assess the total emissions from a field, GWP is used to reflect the combined impact of CH4 and N2O emissions. Based on Table 2, the FL regime had the highest GWP in 2017 (7,332 kg CO₂-eq/ha/season), primarily driven by high CH4 emissions. In 2018, the GWP (3,172 kg CO₂-eq/ha/season) of this regime was reduced, likely due to a significant drop in CH₄ emissions and negative N2O emissions. The WET regime had consistently high GWP values, peaking in 2016 (4,283 kg CO₂-eq/ha/season). While CH4 emissions were lower than FL, N2O emissions under wet-dry conditions significantly contributed to GWP. DRY regime achieved the lowest GWP across all years, with the lowest value in 2018 (2,644 kg CO₂-eq/ha/season). This is due to the substantial reduction in CH4 emissions, even though N2O emissions were higher. The reduction in GWP under the DRY regime was recorded at 28% and 33% compared to the WET and FL regimes, respectively.
Therefore, the DRY regime is the most sustainable option for reducing GWP in paddy fields, but it requires careful management to control N2O emissions. Flooded irrigation, while minimizing N₂O emissions, contributes significantly to global warming due to CH4 emissions. Wet irrigation strikes a balance but still results in relatively high GWP due to intermediate levels of both CH4 and N2O. Future strategies should focus on integrating water management practices with emission mitigation techniques to enhance sustainability.
3.3. Water productivity and water use efficiency among regimes
Grain yield and water productivity varied significantly across the three irrigation regimes—Flooded (FL), Wet (WET), and Dry (DRY)—from 2016 to 2018 as shown in Table 4. The yield increased from the first season (2016) to the third season (2018). Between 2016 and 2018, yield under FL increased by 38.8% (from 4.69 to 6.51 t/ha), and WET rose by 32.0% (from 5.19 to 6.85 t/ha). In contrast, DRY showed only a 3.0% increase, indicating that its yield potential had likely plateaued early. Comparison among irrigation regimes, DRY irrigation produced the highest yield, about 28% greater than FL and 16% higher than WET in 2016. By 2018, WET produced the highest yield (6.85 t/ha), exceeding FL by 5.2%, while DRY fell slightly behind WET by 9.8%. This suggests that although DRY had the early advantage, the WET regime offered more stable yield improvement over time. These findings are in line with Bouman et al. [18], who noted that intermittent irrigation (WET and DRY) can sustain high yields with reduced water input.
Table 4 also shows irrigation and water productivities among the regimes. The first season required the highest amount of irrigation water compared to the second and third seasons. This was primarily due to significant water loss through runoff, particularly rainwater that could not be effectively utilized. Improvements were made in the second and third seasons, resulting in reduced irrigation water requirements. Consequently, water productivity and efficiency in the third season were better than in the first season. When comparing the three irrigation regimes, the DRY regime required the least amount of irrigation water compared to the other two systems. The DRY system achieved water savings of 21–39% compared to the FL regime and 6–20% compared to the WET regime. The less water used in the DRY regime led to significant improvements in water productivity and water use efficiency, particularly during the first season. Water productivity increased by 16–31%, while water use efficiency improved by 31–53%. In the third season, water productivity across all three regimes was comparable, as the yields were relatively similar. However, the DRY regime demonstrated the highest water use efficiency among the three regimes, with an improvement of 11–29%.
4. Discussion
The System of Rice Intensification (SRI), recognized as a water-saving rice cultivation method, demonstrated its effectiveness in the current experiment. Although there were variations in yields between the first, second and third planting seasons, the DRY regime consistently achieved consistent production outcomes with more efficient use of irrigation water (Table 4). The key to maintaining productivity in the DRY regime lies in its aerobic conditions, which ensure higher oxygen availability. This approach aligns with previous research indicating that rice plants can thrive in non-flooded and unsaturated soil conditions [19].
In SRI rice cultivation, strengthening the root system is a critical aspect, achieved in part by lowering water levels [20]. Reduced water levels encourage roots to grow vertically deeper into the soil to access water and nutrients as reported by previous studies [21,22,23]. The development of longer roots contributes to stronger rice plant growth under the SRI method with the DRY regime compared to the FL regime, thus, SRI performs better with intermittent irrigation than with continuous flooding [24]. Empirical evidence also showed that SRI combined with alternate wetting and drying irrigation (AWD) enhances crop standing until harvest [25]. Additionally, these results align with findings by Thakur et al., [26], who reported that the SRI method with water-saving irrigation not only improves root growth but also enhances nutrient uptake, thereby sustaining yields even under limited water availability.
The DRY regime enhanced water productivity, consistent with previous research that highlights the benefits of controlled water application in reducing non-productive water losses, such as minimizing evaporation and percolation losses [27] and balancing water use and maintaining adequate soil moisture [28]. Moreover, the DRY regime consistently achieved the highest water use efficiency, with improvements of 31–53% in the first season and 11–29% in the third season. These results align with findings from Geerts and Raes [29], who emphasized that deficit irrigation strategies like DRY can substantially increase water use efficiency without significantly compromising yield. The DRY regime’s advantage in water use efficiency, even in later seasons, underscores its potential for long-term sustainability. Reduced water application not only conserves water resources but also improves the energy efficiency of irrigation practices, which is critical in regions facing water scarcity.
The DRY regime consistently reduced GWP over three planting seasons. The DRY regime’s ability to achieve the lowest global warming potential (GWP)—45% and 46% lower than the WET and FL regimes, respectively—highlights its effectiveness in balancing these trade-offs. This finding aligns with the growing emphasis on water-saving irrigation techniques, such as alternate wetting and drying (AWD), as viable strategies for mitigating GHG emissions in rice cultivation [30]. The greatest contribution to the reduction in GWP was a significant decrease in CH4 emissions, which aligns with prior research on aerobic soil conditions limiting methanogenesis [31]. However, this regime elevated N2O emissions, a known trade-off when transitioning from anaerobic to aerobic soil conditions [32]. Conversely, the FL regime minimizes N2O emissions but at the cost of higher CH4 emissions due to prolonged flooding, which promotes the anaerobic decomposition of organic matter.
The DRY regime’s ability to maintain yields while achieving the lowest GWP positions it as a sustainable water management practice for SRI. However, its success depends on careful implementation and monitoring to address the potential for increased N2O emissions. Integrating complementary practices, such as precision nutrient management or the use of nitrification inhibitors, could further enhance its environmental and agronomic benefits [33].
5. Conclusions
The study demonstrated that DRY regime is the optimal water management strategy for the System of Rice Intensification (SRI) in Indonesia, effectively balancing greenhouse gas (GHG) emission mitigation and rice productivity. The DRY regime achieved the lowest methane (CH4) emissions and global warming potential (GWP), with GWP reductions of 45% and 46% compared to the WET and FL regimes, respectively. While nitrous oxide (N₂O) emissions were higher in the DRY regime compared to the FL regime, the overall GWP was minimized. Additionally, the DRY regime supported maintained rice yields, with productivity comparable to or exceeding other regimes during the three-year study. This makes the DRY regime an effective approach for sustainable rice cultivation under SRI.
Author Contributions
Conceptualization, C.A (Chusnul Arif); B.I.S and M.M.; methodology, C.A.; S.K.S; and B.I.S; data curation, C.A; S.K.S; B.D.A; original draft preparation, C.A; writing—review and editing, B.I.S, F.D; M.T; R.S.; visualization, C.A; M.T; supervision, B.I.S; M.M.; project administration, R.S.; funding acquisition, C.A; M.M. authors have read and agreed to the published version of the manuscript
Funding
This research project was partially supported by the Ministry of Education, Culture, Research, and Technology and the Indonesia Endowment Fund for Education (LPDP) through the 2024 PRPB Funding Program under the e-Asia project titled “Developing Integrated Agriculture Waste – Carbon Capture Model for Mitigation of Greenhouse Gas Emissions in Rice Production in Asia” (Contract No. 50843/IT3.D10/PT.01.03/P/B/2024).
Data Availability Statement
The original contributions presented in this study are included in the article. Further inquiries can be directed to the corresponding author.
Acknowledgments
We sincerely appreciate the Ministry of Education, Culture, Research, and Technology of the Republic of Indonesia for its invaluable support in enhancing the research and fostering collaboration with world-class universities.
Conflicts of Interest
The authors declare no conflicts of interest.
References
- Gangopadhyay, S.; Chowdhuri, I.; Das, N.; Pal, S.C.; Mandal, S. The Effects of No-Tillage and Conventional Tillage on Greenhouse Gas Emissions from Paddy Fields with Various Rice Varieties. Soil and Tillage Research 2023, 232, 105772. [Google Scholar] [CrossRef]
- Oo, A.Z.; Sudo, S.; Fumoto, T.; Inubushi, K.; Ono, K.; Yamamoto, A.; Bellingrath-Kimura, S.D.; Win, K.T.; Umamageswari, C.; Bama, K.S.; et al. Field Validation of the DNDC-Rice Model for Methane and Nitrous Oxide Emissions from Double-Cropping Paddy Rice under Different Irrigation Practices in Tamil Nadu, India. Agriculture 2020, 10, 355. [Google Scholar] [CrossRef]
- Bwire, D.; Saito, H.; Sidle, R.C.; Nishiwaki, J. Water Management and Hydrological Characteristics of Paddy-Rice Fields under Alternate Wetting and Drying Irrigation Practice as Climate Smart Practice: A Review. Agronomy 2024, 14, 1421. [Google Scholar] [CrossRef]
- Qian, H.; Zhu, X.; Huang, S.; Linquist, B.; Kuzyakov, Y.; Wassmann, R.; Minamikawa, K.; Martinez-Eixarch, M.; Yan, X.; Zhou, F.; et al. Greenhouse Gas Emissions and Mitigation in Rice Agriculture. Nat Rev Earth Environ 2023, 4, 716–732. [Google Scholar] [CrossRef]
- Dahlgreen, J.; Parr, A. Exploring the Impact of Alternate Wetting and Drying and the System of Rice Intensification on Greenhouse Gas Emissions: A Review of Rice Cultivation Practices. Agronomy 2024, 14, 378. [Google Scholar] [CrossRef]
- Mallareddy, M.; Thirumalaikumar, R.; Balasubramanian, P.; Naseeruddin, R.; Nithya, N.; Mariadoss, A.; Eazhilkrishna, N.; Choudhary, A.K.; Deiveegan, M.; Subramanian, E.; et al. Maximizing Water Use Efficiency in Rice Farming: A Comprehensive Review of Innovative Irrigation Management Technologies. Water 2023, 15, 1802. [Google Scholar] [CrossRef]
- Uphoff, N.; Dazzo, F.B. Making Rice Production More Environmentally-Friendly. Environments 2016, 3, 12. [Google Scholar] [CrossRef]
- Jain, N.; Dubey, R.; Dubey, D.S.; Singh, J.; Khanna, M.; Pathak, H.; Bhatia, A. Mitigation of Greenhouse Gas Emission with System of Rice Intensification in the Indo-Gangetic Plains. Paddy Water Environ 2014, 12, 355–363. [Google Scholar] [CrossRef]
- Choi, J.; Kim, G.; Park, W.; Shin, M.; Choi, Y.; Lee, S.; Kim, S.; Yun, D. Effect of SRI Water Management on Water Quality and Greenhouse Gas Emissions in Korea. Irrigation and Drainage 2014. [Google Scholar] [CrossRef]
- Uphoff, N.; Kassam, A.; Harwood, R. SRI as a Methodology for Raising Crop and Water Productivity: Productive Adaptations in Rice Agronomy and Irrigation Water Management. Paddy Water Environ. 2011, 9 Sp. Iss. SI MAR, 3–11. [Google Scholar] [CrossRef]
- Arif, C.; Toriyama, K.; Nugroho, B.D.A.; Mizoguchi, M. Crop Coefficient and Water Productivity in Conventional and System of Rice Intensification (SRI) Irrigation Regimes of Terrace Rice Fields in Indonesia. Jurnal Teknologi 2015, 76. [Google Scholar] [CrossRef]
- Nugroho, B.D.A.; Toriyama, K.; Kobayashi, K.; Arif, C.; Yokoyama, S.; Mizoguchi, M. Effect of Intermittent Irrigation Following the System of Rice Intensification (SRI) on Rice Yield in a Famer’s Paddy Fields in Indonesia. Paddy Water Environ 2018, 1–9. [Google Scholar] [CrossRef]
- Sato, S.; Yamaji, E.; Kuroda, T. Strategies and Engineering Adaptions to Disseminate SRI Methods in Large-Scale Irrigation Systems in Eastern Indonesia. Paddy Water Environ 2011, 9, 79–88. [Google Scholar] [CrossRef]
- IAEA Manual on Measurement of Methane and Nitrous Oxide Emissions from Agricultural; International Atomic Energy Agency: Vienna, Austria, 1993.
- Sha, C.; Wang, Q.; Wu, J.; Hu, W.; Shen, C.; Zhang, B.; Wang, M. Regulation of Methane Emissions in a Constructed Wetland by Water Table Changes. Sustainability 2023, 15, 1536. [Google Scholar] [CrossRef]
- Lim, J.; Wehmeyer, H.; Heffner, T.; Aeppli, M.; Gu, W.; Kim, P.J.; Horn, M.A.; Ho, A. Resilience of Aerobic Methanotrophs in Soils; Spotlight on the Methane Sink under Agriculture. FEMS Microbiol Ecol 2024, 100, fiae008. [Google Scholar] [CrossRef]
- Ishii, S.; Ohno, H.; Tsuboi, M.; Otsuka, S.; Senoo, K. Identification and Isolation of Active N2O Reducers in Rice Paddy Soil. ISME J 2011, 5, 1936–1945. [Google Scholar] [CrossRef] [PubMed]
- Bouman, B.A.M. Water Management in Irrigated Rice: Coping with Water Scarcity; Int. Rice Res. Inst., 2007; ISBN 978-971-22-0219-3.
- Bouman, B.A.M.; Peng, S.; Castañeda, A.R.; Visperas, R.M. Yield and Water Use of Irrigated Tropical Aerobic Rice Systems. Agricultural Water Management 2005, 74, 87–105. [Google Scholar] [CrossRef]
- Doni, F.; Safitri, R.; Suhaimi, N.S.M.; Miranti, M.; Rossiana, N.; Mispan, M.S.; Anhar, A.; Uphoff, N. Evaluating the Underlying Physiological and Molecular Mechanisms in the System of Rice Intensification Performance with Trichoderma-Rice Plant Symbiosis as a Model System. Front. Plant Sci. 2023, 14. [Google Scholar] [CrossRef]
- Setiawan, B.I.; Imansyah, A.; Arif, C.; Watanabe, T.; Mizoguchi, M.; Kato, H. SRI Paddy Growth and GHG Emissions at Various Groundwater Levels. Irrigation and Drainage 2014, 63, 612–620. [Google Scholar] [CrossRef]
- Aziez, A.; Hanudin, E.; Harieni, S. Impact of Water Management on Root Morphology, Growth and Yield Component of Lowland Rice Varieties under the Organic System of Rice Intensification. Journal of Degraded and Mining Lands Management 2018, 5, 1035–1045. [Google Scholar] [CrossRef]
- Arif, C.; Saptomo, S.K.; Setiawan, B.I.; Taufik, M.; Suwarno, W.B.; Mizoguchi, M. A Model of Evapotranspirative Irrigation to Manage the Various Water Levels in the System of Rice Intensification (SRI) and Its Effect on Crop and Water Productivities. Water 2022, 14, 170. [Google Scholar] [CrossRef]
- Thakur, A.K.; Mandal, K.G.; Mohanty, R.K.; Ambast, S.K. Rice Root Growth, Photosynthesis, Yield and Water Productivity Improvements through Modifying Cultivation Practices and Water Management. Agricultural Water Management 2018, 206, 67–77. [Google Scholar] [CrossRef]
- Chapagain, T.; Yamaji, E. The Effects of Irrigation Method, Age of Seedling and Spacing on Crop Performance, Productivity and Water-Wise Rice Production in Japan. Paddy Water Environ 2010, 8, 81–90. [Google Scholar] [CrossRef]
- Thakur, A.K.; Rath, S.; Patil, D.U.; Kumar, A. Effects on Rice Plant Morphology and Physiology of Water and Associated Management Practices of the System of Rice Intensification and Their Implications for Crop Performance. Paddy and Water Environment 2011, 9, 13–24, Sp. Iss. SI MAR. [Google Scholar] [CrossRef]
- Zwart, S.J.; Bastiaanssen, W.G.M. Review of Measured Crop Water Productivity Values for Irrigated Wheat, Rice, Cotton and Maize. Agricultural Water Management 2004, 69, 115–133. [Google Scholar] [CrossRef]
- Bouman, B.A.M.; Humphreys, E.; Tuong, T.P.; Barker, R. Rice and Water. In Advances in Agronomy; Sparks, D.L., Ed.; Academic Press, 2007; Vol. 92, pp. 187–237.
- Geerts, S.; Raes, D. Deficit Irrigation as an On-Farm Strategy to Maximize Crop Water Productivity in Dry Areas. Agricultural Water Management 2009, 96, 1275–1284. [Google Scholar] [CrossRef]
- Sander, B.O.; Samson, M.; Buresh, R.J. Methane and Nitrous Oxide Emissions from Flooded Rice Fields as Affected by Water and Straw Management between Rice Crops. Geoderma 2014, 235–236, 355–362. [Google Scholar] [CrossRef]
- Linquist, B.; van Groenigen, K.J.; Adviento-Borbe, M.A.; Pittelkow, C.; van Kessel, C. An Agronomic Assessment of Greenhouse Gas Emissions from Major Cereal Crops. Global Change Biology 2012, 18, 194–209. [Google Scholar] [CrossRef]
- Bouwman, A.F.; Boumans, L.J.M.; Batjes, N.H. Emissions of N2O and NO from Fertilized Fields: Summary of Available Measurement Data. Global Biogeochemical Cycles 2002, 16, 6-1–6-13. [Google Scholar] [CrossRef]
- Pathak, H.; Tewari, A.N.; Sankhyan, S.; Dubey, D.S.; Mina, U.; Singh, V.K. Direct-Seeded Rice: Potential, Performance and Problems - a Review. Current Advances in Agricultural Sciences 2014, 6, 77–88. [Google Scholar]
Figure 1.
Water management of three irrigation regimes.
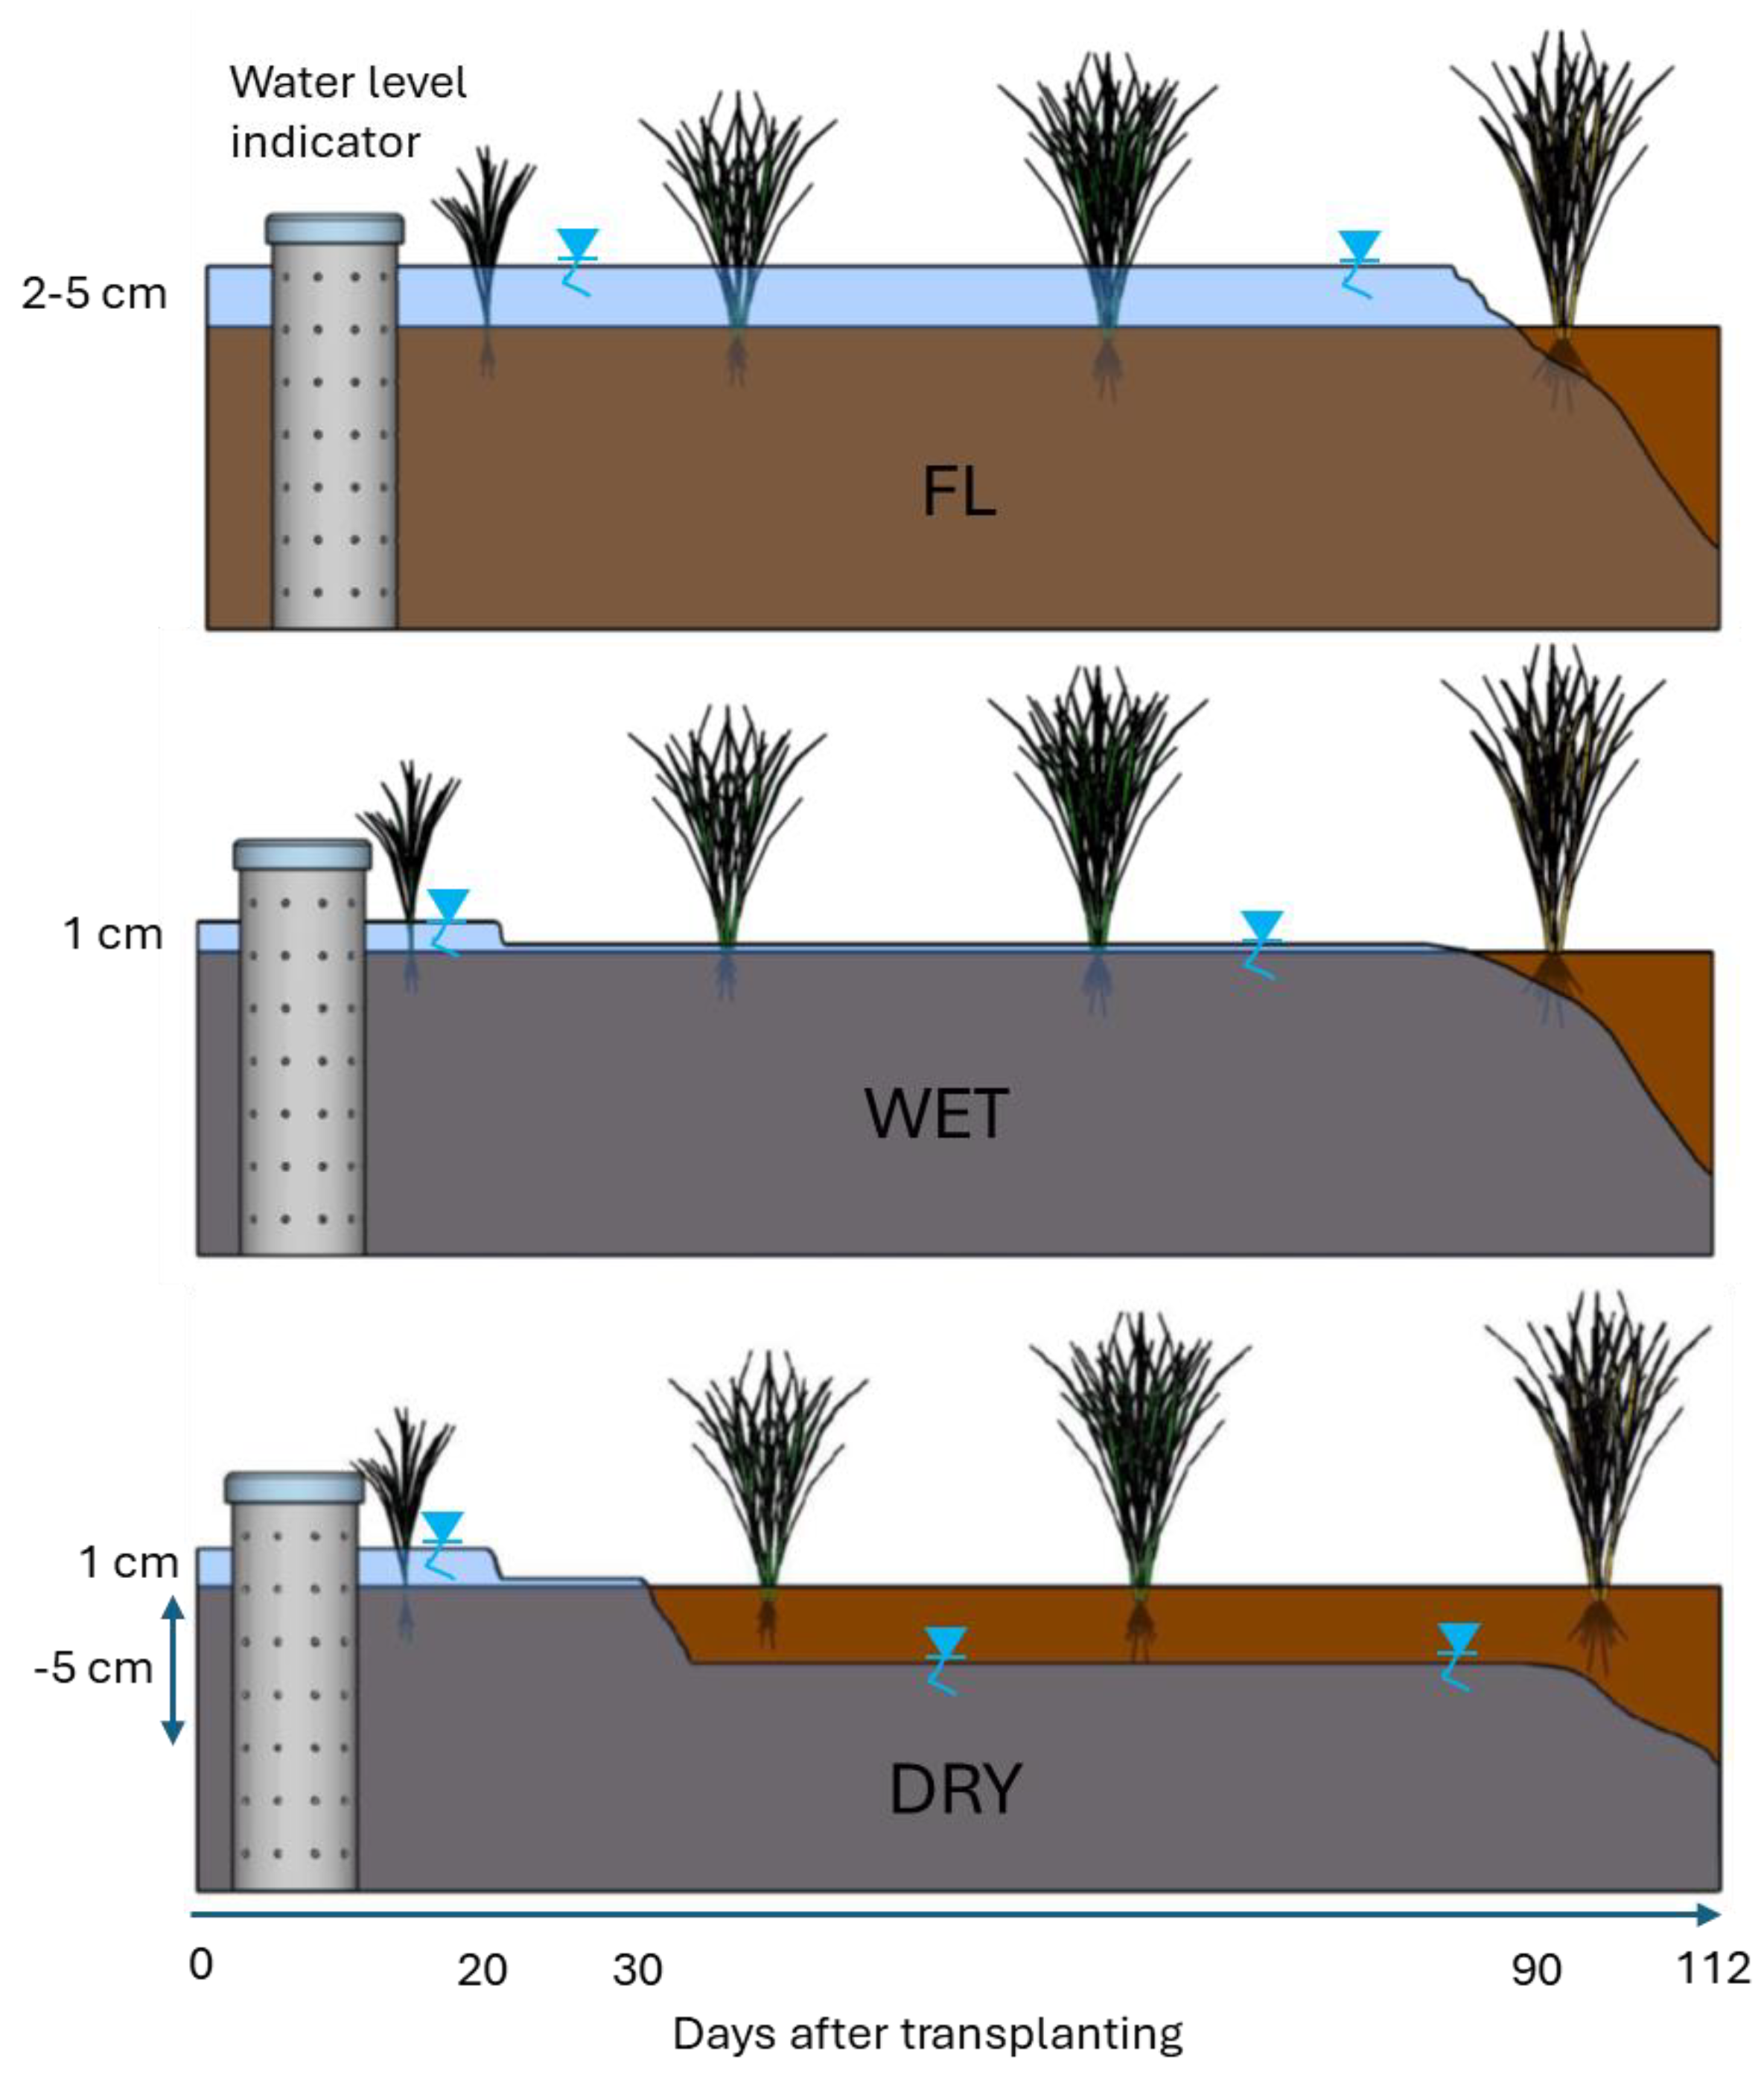
Figure 2.
Seasonal CH4 emissions among crop seasons in three irrigation regimes.
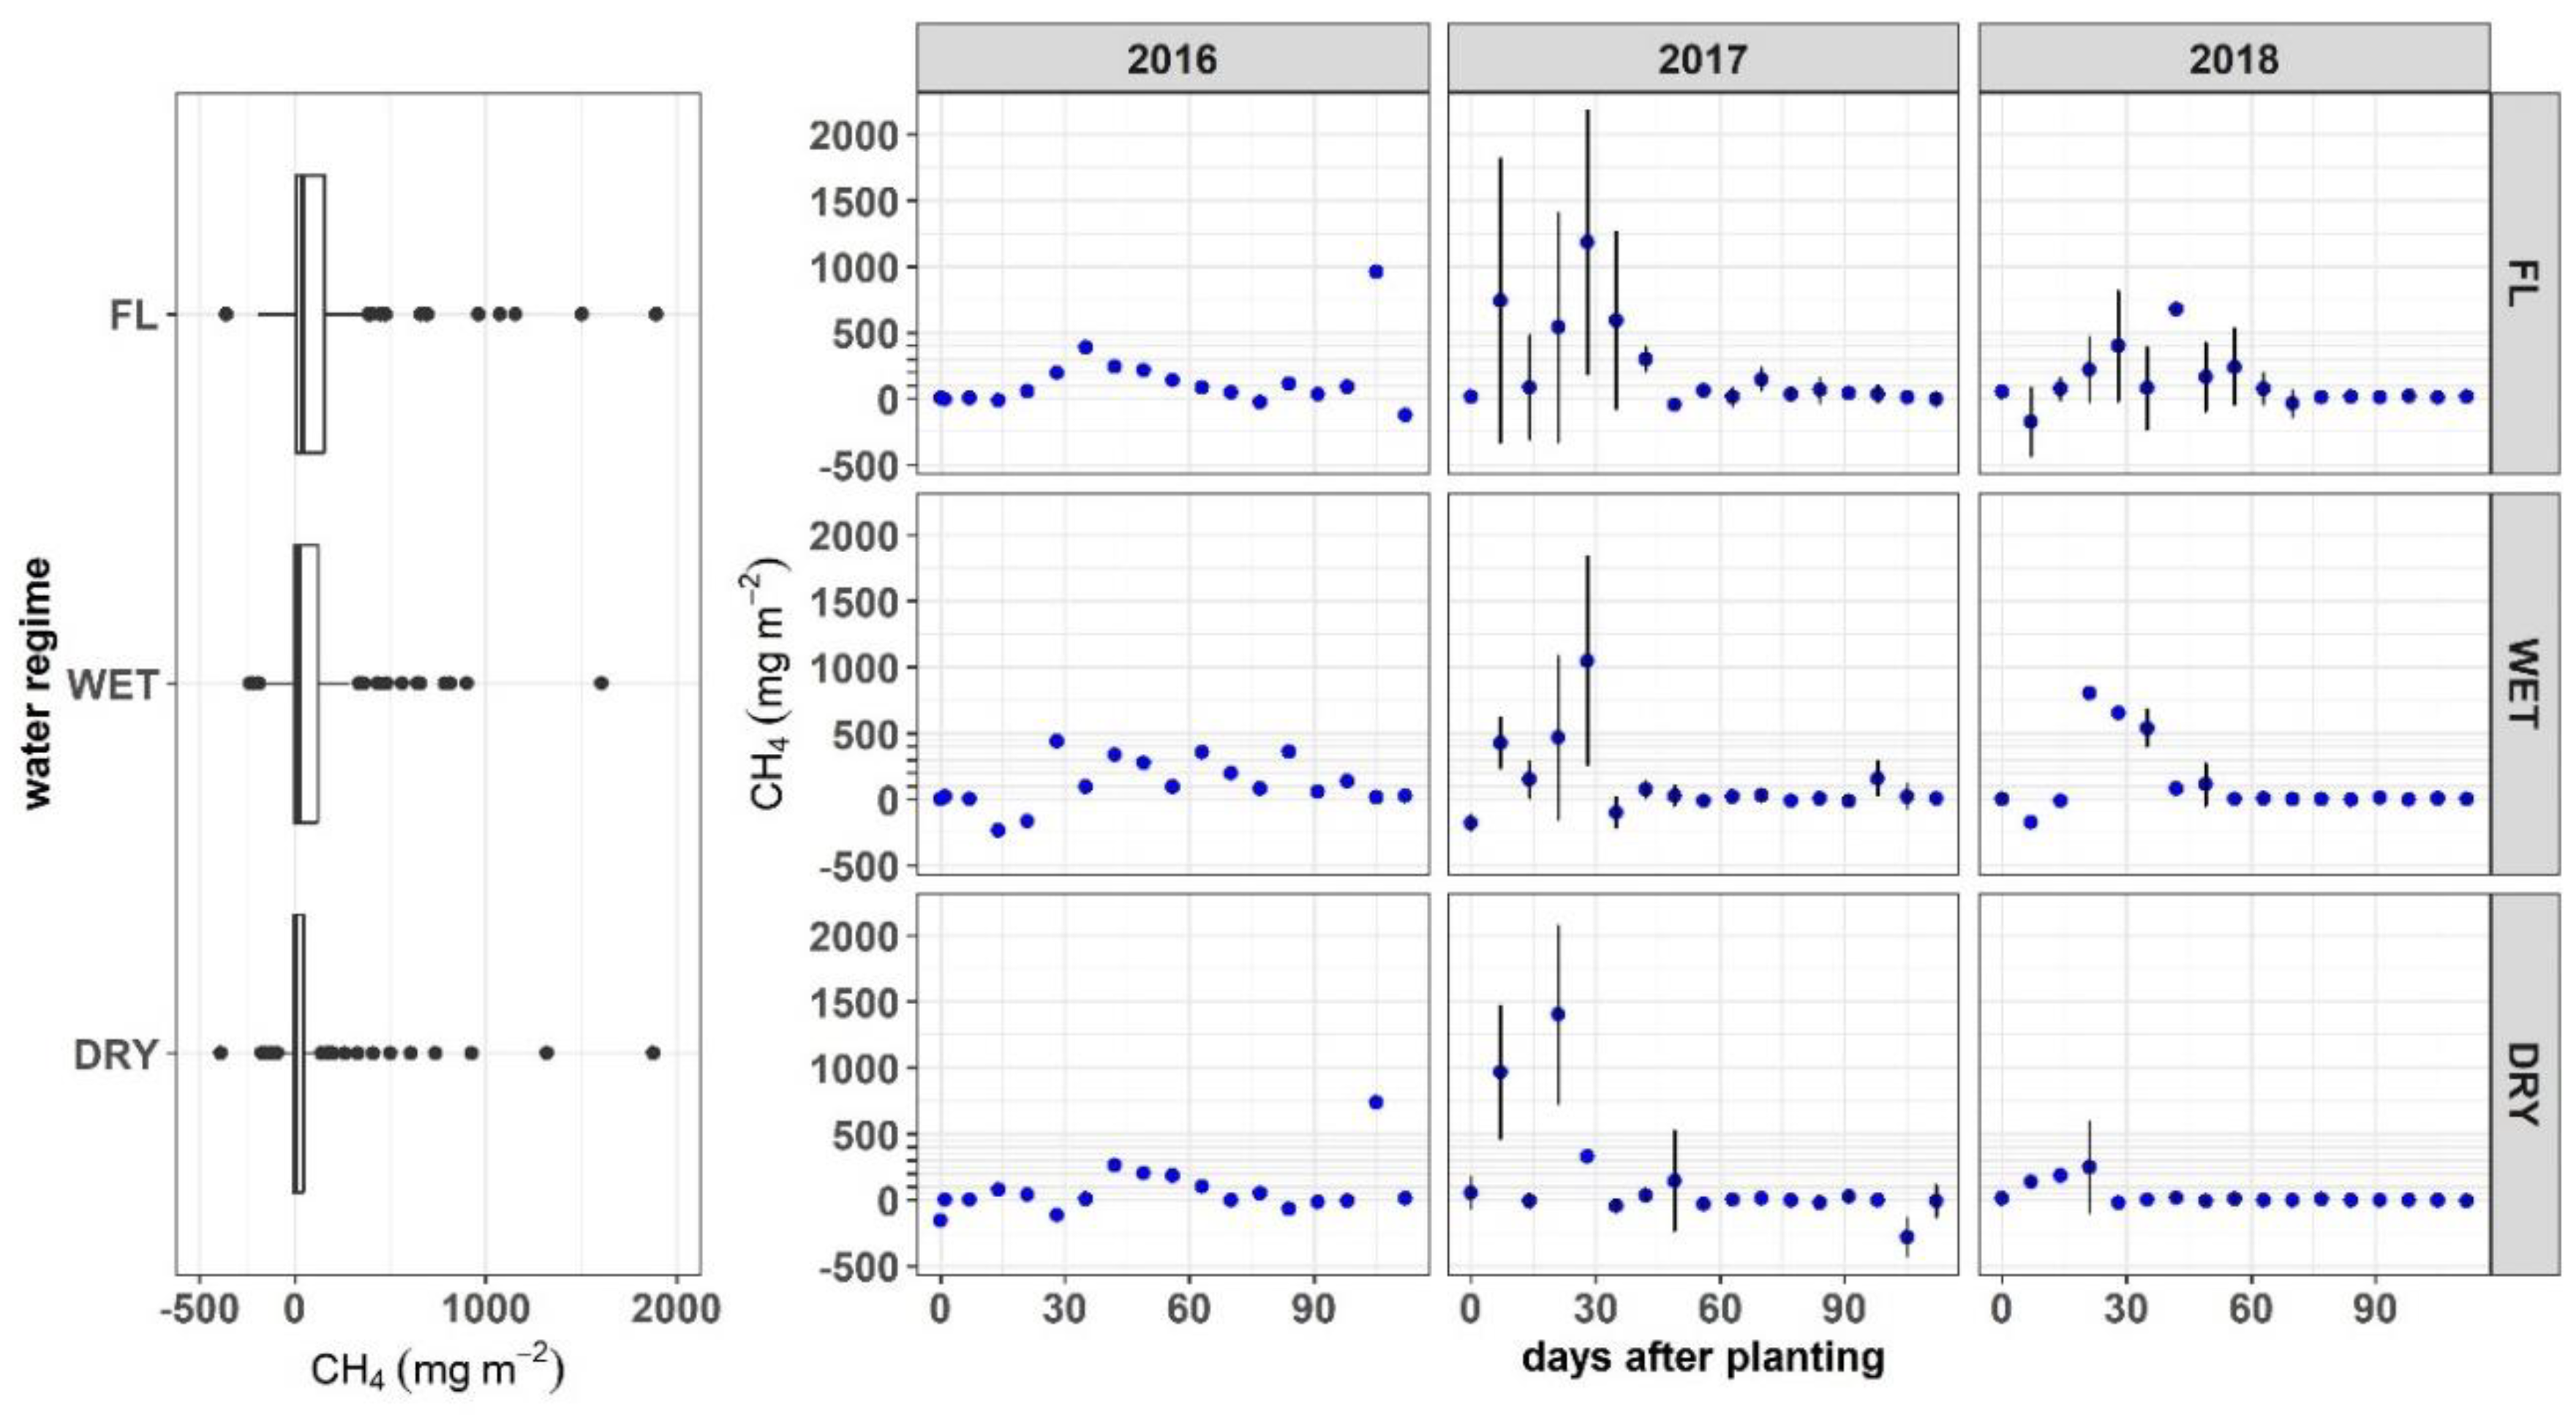
Figure 3.
Seasonal N2O emissions among crop seasons in three irrigation regimes.
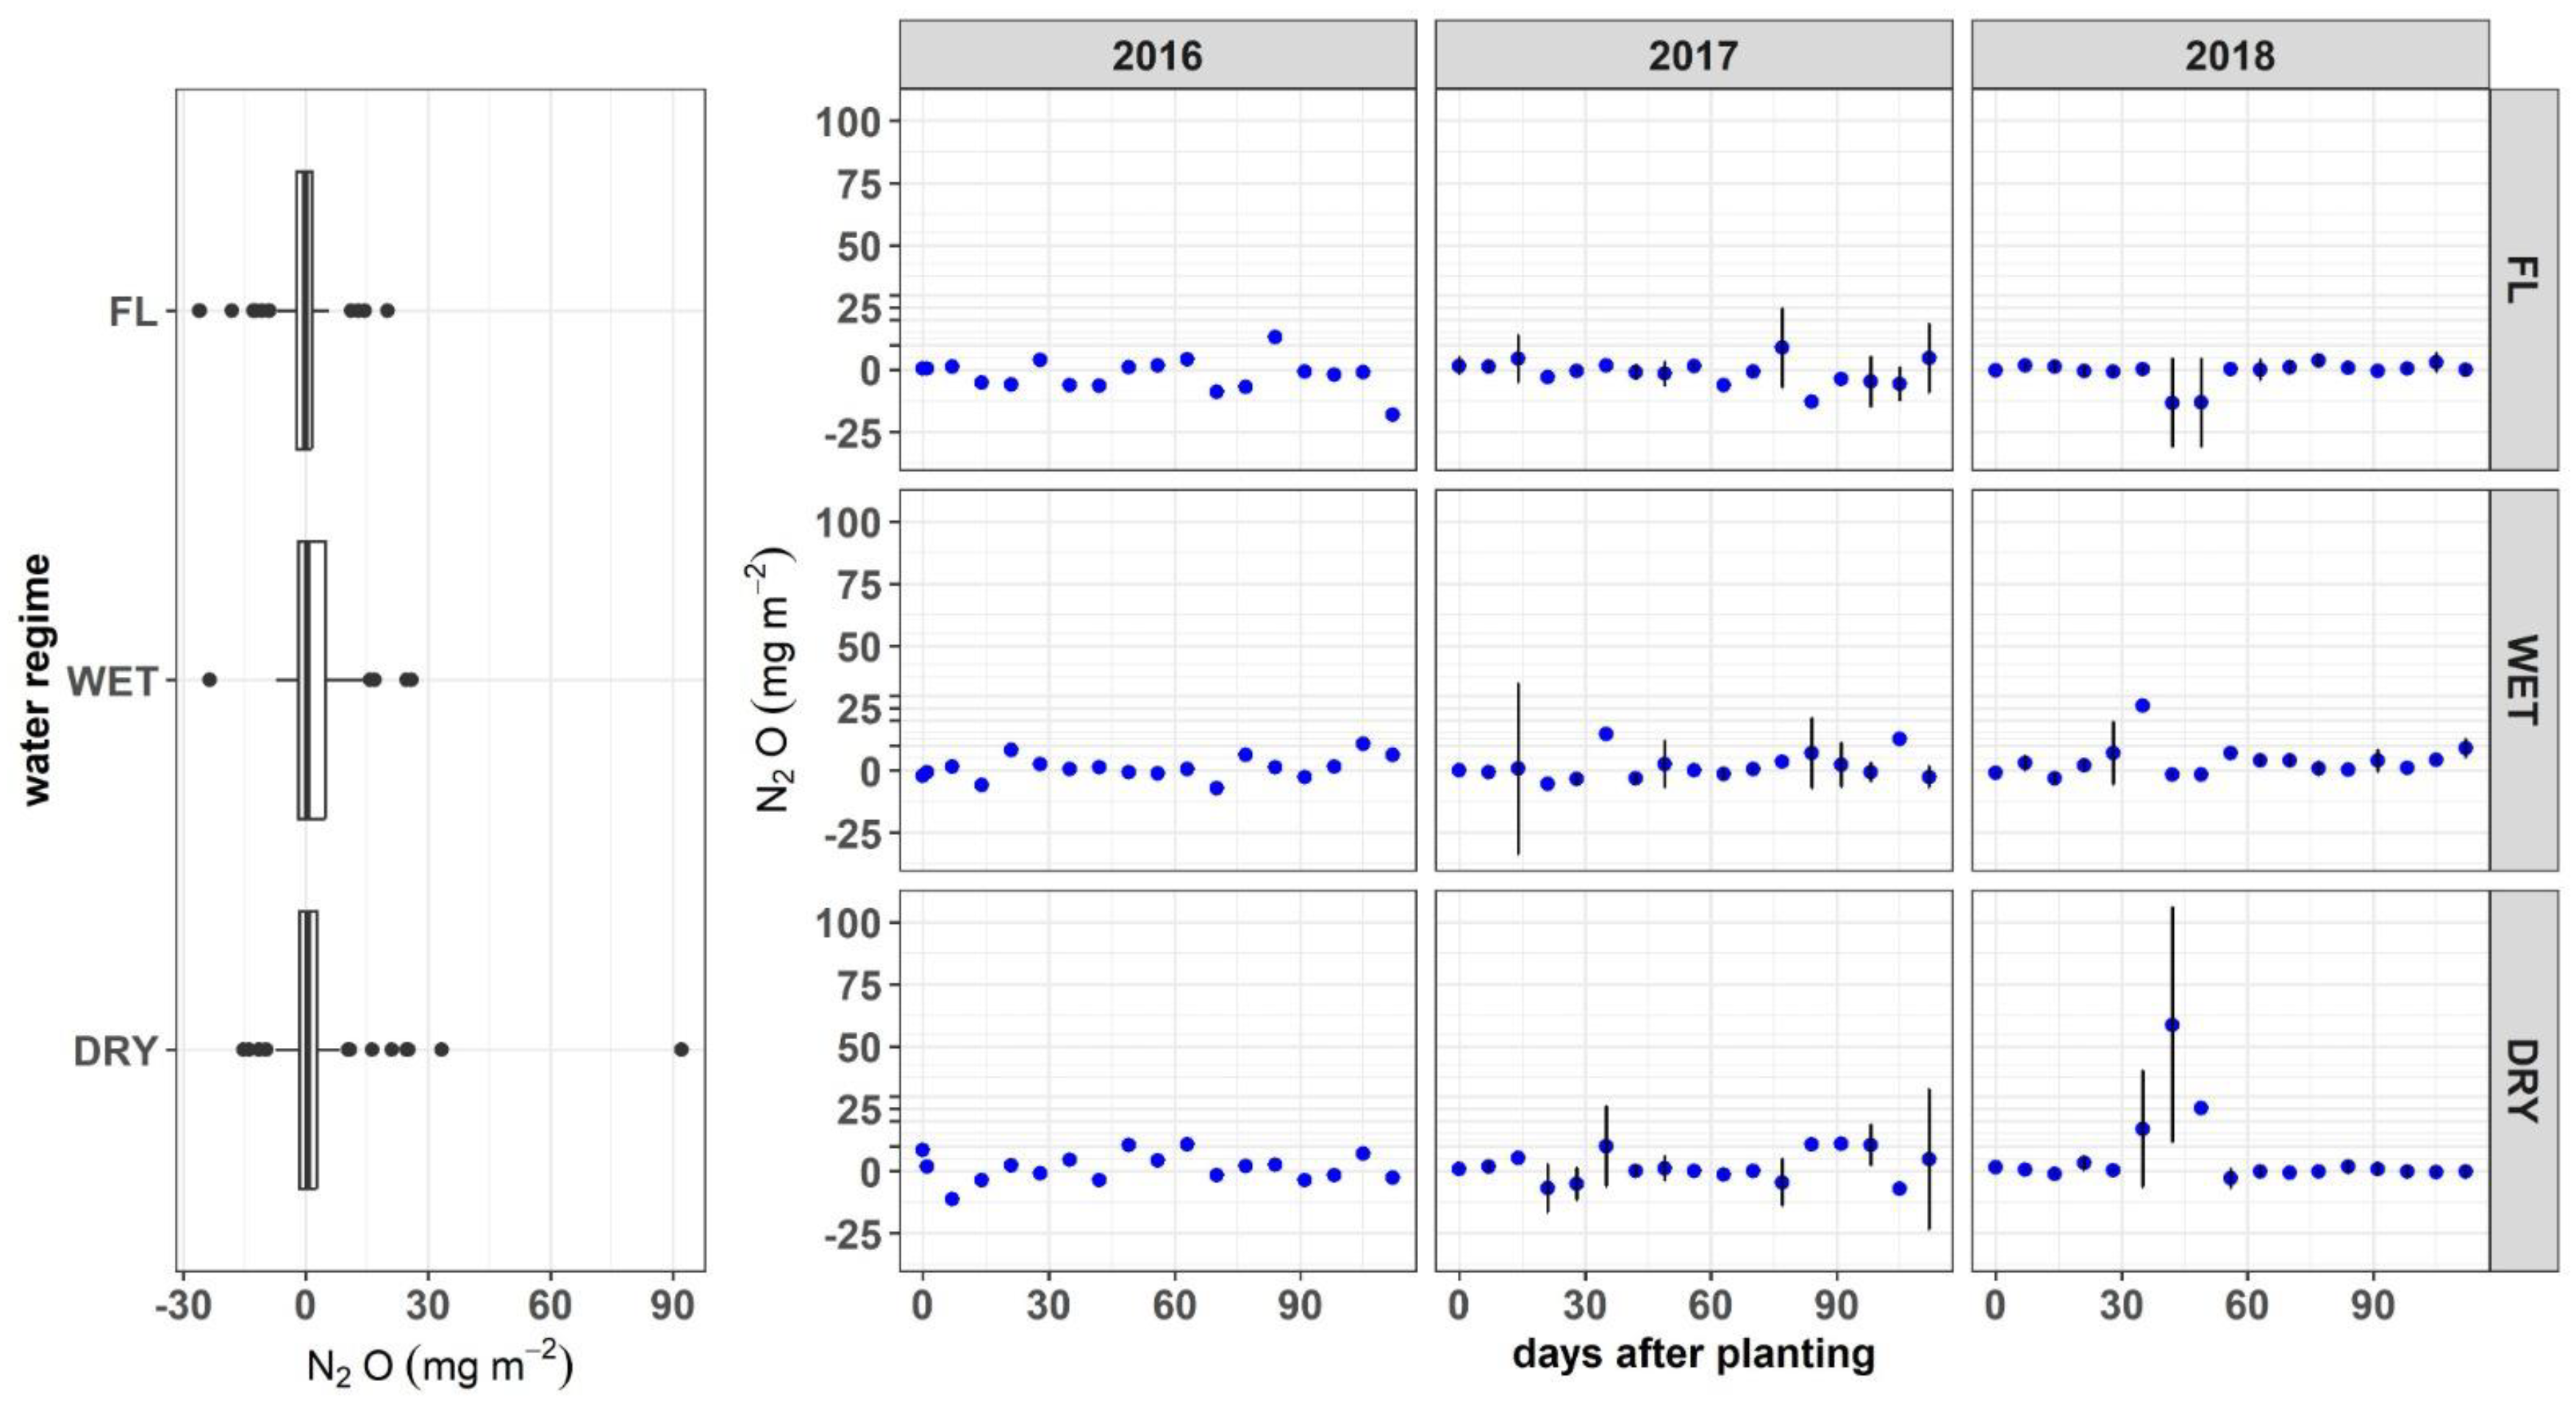

Table 1.
Soil physics properties in the location.
| Properties | Value |
|---|---|
| Particle density (g/cm3) | 1.96 |
| Total porosity (% volume) | 65.3 |
| Water content (% volume) | |
| pF 1 | 63.3 |
| pF 2 | 46.9 |
| pF 2.54 (Field capacity) | 40.3 |
| pF 4.2 (Permanent wilting point) | 19.6 |
| Permeability (cm/jam) | 8.17 |
| Soil texture (%) | |
| Sand | 23 |
| Silt | 34 |
| Clay | 43 |
Table 2.
Weather conditions among crop seasons.
| No | Parameters | Season | Unit | ||
|---|---|---|---|---|---|
| 2016 | 2017 | 2018 | |||
| 1 | Max air temperature | 35.9 | 35.9 | 36.2 | oC |
| 2 | Average air temperature | 26.9 | 26.7 | 26.2 | oC |
| 3 | Min air temperature | 20.4 | 20.1 | 20.6 | oC |
| 4 | Relative humidity | 84.6 | 82.7 | 84.5 | % |
| 5 | Average Solar radiation | 13.0 | 12.9 | 12.1 | MJ/m2/d |
| 6 | Average reference evapotranspiration | 3.25 | 2.60 | 2.43 | mm |
| 7 | Total Precipitation | 1211 | 1414 | 1025 | mm |
Table 3.
Total emission and global warming potential among regimes.
| Season | Regime | Parameters | Unit | ||
|---|---|---|---|---|---|
| CH4 | N2O | GWP* | |||
| 2016 | FL | 173.6 | -1.81 | 4,193 | kg/ha/season |
| WET | 145.1 | 1.34 | 4,283 | kg/ha/season | |
| DRY | 100.7 | 1.33 | 3,082 | kg/ha/season | |
| 2017 | FL | 267.0 | 0.45 | 7,332 | kg/ha/season |
| WET | 153.3 | -0.62 | 3,972 | kg/ha/season | |
| DRY | 118.0 | 0.33 | 3,275 | kg/ha/season | |
| 2018 | FL | 130.2 | -1.26 | 3,172 | kg/ha/season |
| WET | 124.0 | 3.25 | 4,236 | kg/ha/season | |
| DRY | 33.6 | 6.36 | 2,644 | kg/ha/season | |
*GWP: the global warming potentials at the 100-year time horizon of 27 and 273 for CH4 and N2O, respectively (IPCC AR6).
Table 4.
Yield, water productivity, and water use efficiency among regimes.
| Season | Irrigation Regime | Yield (ton/ha) | Irrigation (mm) | ETa (mm) | WPI+P (kg/m3) | WPET (kg/m3) | WUE (kg/m3) |
|---|---|---|---|---|---|---|---|
| 2016 | FL | 4.69 | 498 | 461 | 0.27 | 1.02 | 0.94 |
| WET | 5.19 | 378 | 421 | 0.33 | 1.23 | 1.37 | |
| DRY | 6.00 | 302 | 408 | 0.40 | 1.47 | 1.99 | |
| 2017 | FL | 5.60 | 183 | 378 | 0.35 | 1.48 | 3.06 |
| WET | 6.02 | 153 | 349 | 0.38 | 1.72 | 3.93 | |
| DRY | 6.09 | 145 | 338 | 0.39 | 1.80 | 4.20 | |
| 2018 | FL | 6.51 | 136 | 310 | 0.56 | 2.10 | 4.78 |
| WET | 6.85 | 114 | 295 | 0.60 | 2.32 | 5.99 | |
| DRY | 6.18 | 91 | 280 | 0.55 | 2.21 | 6.76 |
Disclaimer/Publisher’s Note: The statements, opinions and data contained in all publications are solely those of the individual author(s) and contributor(s) and not of MDPI and/or the editor(s). MDPI and/or the editor(s) disclaim responsibility for any injury to people or property resulting from any ideas, methods, instructions or products referred to in the content. |
© 2025 by the authors. Licensee MDPI, Basel, Switzerland. This article is an open access article distributed under the terms and conditions of the Creative Commons Attribution (CC BY) license (http://creativecommons.org/licenses/by/4.0/).
Copyright: This open access article is published under a Creative Commons CC BY 4.0 license, which permit the free download, distribution, and reuse, provided that the author and preprint are cited in any reuse.


