
Submitted:
04 June 2025
Posted:
05 June 2025
You are already at the latest version
Abstract
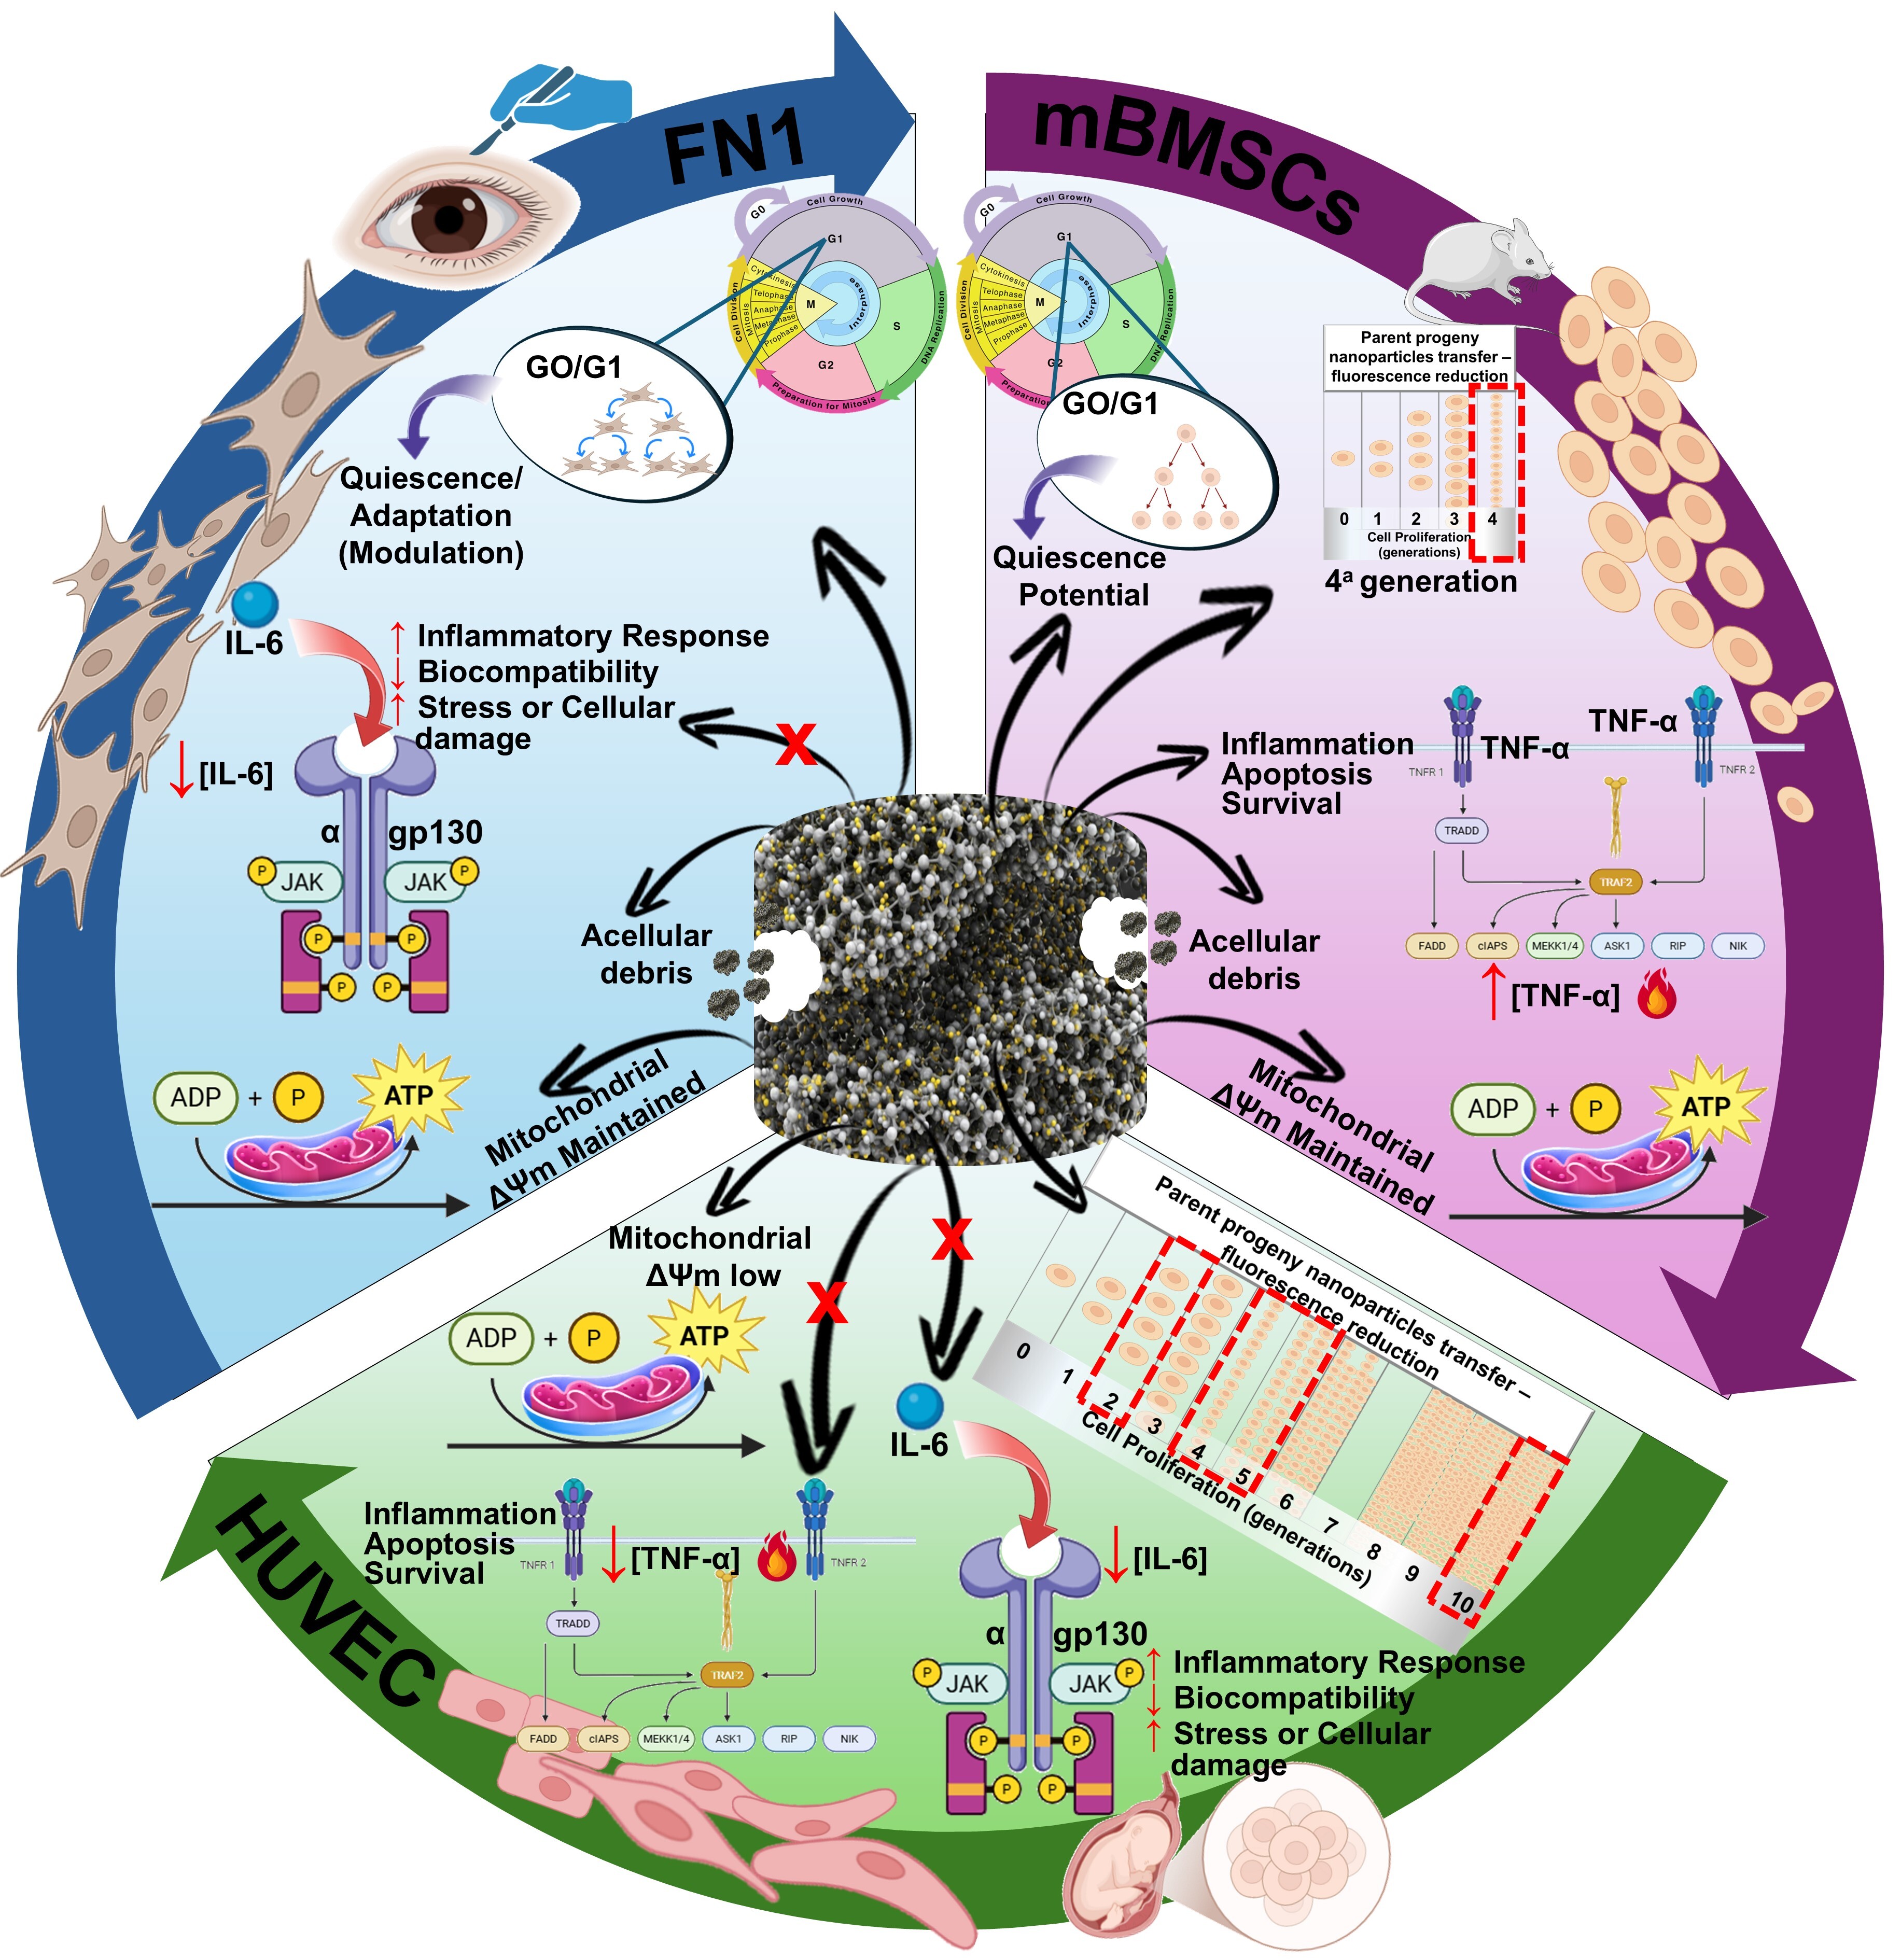
Background/Objectives: While the nanocomposite of poly(L-lactic acid) with graphene oxide (PLLA-GO) shows promise for tissue engineering, its specific bioactive interactions with diverse cell lineages during early tissue regeneration remain unclear.. This study comprehensively investigated PLLA-GO's multifaceted in vitro biocompatibility using human fibroblasts (FN1), murine mesenchymal stem cells (mBMSCs), and human umbilical vein endothelial cells (HUVECs). Methods: We assessed morphological characteristics via optical and scanning electron microscopy, proliferation using CFSE, cell cycle progression with flow cytometry, mitochondrial potential via TMRE, and inflammatory cytokine profiles through Cytometric Bead Array (CBA). Results: PLLA-GO demonstrated primary biocompatibility across all cell lines, characterized by efficient adhesion and proliferation. However, significant cell-type-dependent modulations were observed. FN1 cells exhibited proliferative adaptation but induced accelerated scaffold degradation, evidenced by a substantial increase in cellular debris (5.93% control vs. 34.38% PLLA-GO; p=0.03). mBMSCs showed a transient initial proliferative response and a significant 21.66% increase in TNF-α production (179.67 pg/mL vs. 147.68 pg/mL in control; p=0.03). Notably, HUVECs displayed pronounced mitochondrial sensitivity, with a 32.19% reduction in mitochondrial electrical potential (97.07% control vs. 65.82% PLLA-GO; p≤0.05), alongside reductions in pro-inflammatory cytokines TNF-α (8.73%) and IL-6 (12.47%). Conclusions: The PLLA-GO processing method is crucial for its properties and subsequent cellular interactions. Therefore, rigorous and specific preclinical evaluations, considering both cellular contexts and fabrication, are indispensable to ensure the safety and therapeutic potential of PLLA-GO in tissue engineering and regenerative medicine.
Keywords:
tissue engineering
; nanocomposite
; graphene oxide
; biocompatible materials
; poly(lactic acid)
; fibroblasts cells/metabolism
; mesenchymal stem cells/metabolism
; human umbilical vein endothelial cells/metabolism
; biological specimen banks
Highlights
• PLLA-GO is biocompatible, but its interaction is cell-type-dependent.
• HUVECs exhibited a significant 32.19% reduction in mitochondrial potential.
• mBMSCs showed a 21.66% increase in TNF-α production.
• PLLA-GO modulated inflammatory cytokines (TNF-α, IL-6) distinctly by lineage.
1. Introduction
Tissue Engineering (TE), a continually evolving multidisciplinary field, is dedicated to developing biological substitutes with the aim of restoring, repairing, or enhancing the function of damaged or lost tissues and organs [1,2]. In this context, the success of effective regenerative therapies hinges critically on the synergistic interaction among cells, growth factors, and biomimetic scaffolds [3].
The design of scaffold materials that integrate physical and biological characteristics, and that facilitate the emission of essential biological signals, is fundamental to mimic a specific regenerative niche, promoting cellular development, morphogenesis, and consequently, the re-establishment of the tissue's morphofunctional integrity [3,4].
For these biological substitutes to be effective, they must exhibit carefully optimized physical and biological properties. This includes biodegradability, with a degradation rate synchronous with new tissue growth, and the ability to mimic the appropriate mechanical properties for the in vivo environment, resisting physiological forces [5,6].
Among biocompatible polymers, poly-L-lactic acid (PLLA) emerges as a promising strategy due to its proven biocompatibility, adaptable biodegradability, and capacity to reproduce structural and biomechanical characteristics comparable to the host tissue's extracellular matrix (ECM) [7]. However, despite its high crystallinity, chemical stability, and resistance to enzymatic degradation—which results in a prolonged reabsorption time—PLLA presents challenges. The hydrolytic degradation of PLLA generates acidic byproducts, such as lactic acid, which can acidify the in situ microenvironment, compromising the viability and differentiation of cells seeded on the scaffolds [8]. Additionally, the inherently hydrophobic nature of PLLA limits cell-material interactions and biological recognition at the material's surface. This can lead to non-specific protein adsorption and undesirable reactions, thereby negatively impacting the biological response in vivo [9]. The typical degradation time for PLLA ranges between 30 and 40 weeks, depending on the in vitro or in vivo environment [10].
To overcome the intrinsic limitations of PLLA and expand its spectrum of applications, its combination with other materials has been widely explored. In this context, graphene oxide (GO) stands out as a highly relevant carbonaceous material in contemporary research [11]. Its structure, rich in oxygen-containing functional groups (epoxy, hydroxyl, and carboxyl), confers upon GO remarkable hydrophilicity and a reversibly adjustable interlayer distance with increasing relative humidity, thereby facilitating its dispersion and functionalization [12].
The combination of PLLA and GO results in hybrid nanocomposites that offer synergies to enhance the individual performance of each material [20]. These nanocomposites leverage the biodegradability and processability of PLLA for fabricating complex three-dimensional scaffolds, while simultaneously incorporating the enhancements conferred by GO in the composite's mechanical properties, bioactivity, and, notably, its electrical conductivity [13]. This strategic combination confers a myriad of functional applications in tissue engineering and regenerative medicine, providing a favorable microenvironment for the morphofunctional restoration of various tissues, such as bone, cartilage, skin, and blood vessels [14].
Additionally to scaffold development, a critical challenge in tissue engineering is the judicious selection of relevant cell types that adequately mimic the intrinsic characteristics of in vivo tissue, including their specific functional Properties [15]. While tissue engineering research prioritizes the development of promising in vitro approaches for eventual translation to in vivo regeneration, understanding the natural response to tissue injury reveals a paradigm of spontaneous regeneration when the stromal tissue remains intact.
However, in cases of extensive injuries in non-regenerative tissues, where stromal tissue loss is significant, there is an urgent need to induce repair mechanisms, highlighting the importance of resident cells [16]. In this study, the investigation focuses on three cell lineages, whose relevance in the reconstruction of various organic tissues stems from their complementary and intrinsic biological roles within the stromal microenvironment and the repair process.
Human fibroblasts (FN1), cells of mesenchymal origin widely distributed in connective tissues, are crucial for tissue repair and remodeling. Their primary function lies in the synthesis and organization of the extracellular matrix (ECM), which provides the structural framework and the bioactive microenvironment indispensable for angiogenesis and the subsequent deposition of new tissue [17]. In the stromal context, these fibroblasts act as essential components that shape the niche, responding to injury stimuli and contributing to the formation of granulation tissue, a precursor to repair, thus positioning them as key cells in stromal support and communication [18,19].
Mesenchymal stem cells (BMSCs), recognized as multipotent adult stem cells, exhibit the remarkable capacity for differentiation into various connective tissue cell subtypes. Such cells play a primary role in replenishing progenitor and tissue-specific cell populations, in addition to contributing significantly to the processes of angiogenesis, modulation of the inflammatory response, and consequently, tissue regeneration [20,21]. Within the stromal environment, MSCs act as multifunctional regulators, not only differentiating into tissue components but also exerting paracrine effects through the secretion of factors that modulate the activities of fibroblasts and endothelial cells. This promotes a pro-regenerative and anti-inflammatory environment critical for the restructuring of damaged stroma [22,23].
Human Umbilical Vein Endothelial Cells (HUVEC) are instrumental due to their proven ability to establish a functional vasculature, which is essential for promoting vascularization in tissue engineering contexts. This property is mediated by the secretion of angiogenic growth factors and intricate synergistic interaction with scaffold componentes [24]. Essentially, HUVECs are fundamental components of the stromal vascular network, facilitating the transport of nutrients, oxygen, and trophic factors vital for the survival and proliferation of other stromal and parenchymal cells, in addition to modulating the initial inflammatory response. Consequently, the strategy of in vitro pre-vascularization, by seeding HUVECs into three-dimensional scaffolds, constitutes a promising approach to optimize graft vascular integration and accelerate the formation of functional tissue [25,26].
Despite advancements in the quest for ideal scaffolds that mimic the intrinsic conditions of the extracellular matrix and optimize tissue synthesis, a gap in in-depth knowledge persists regarding the systematic interaction of novel biomaterials, such as the PLLA-GO nanocomposite, with different key cell populations during the early stages of tissue repair. Recognizing this gap, our research group proposes a rigorous methodology to evaluate the response of specific resident cell types to the new scaffold.
Thus, the main objective of this study was to investigate the cellular viability and proliferation, as well as the potential cytotoxicity, of the PLLA-GO nanocomposite using three distinct cell lines: human fibroblasts (FN1), human umbilical vein endothelial cells (HUVEC), and mesenchymal stem cells (mBMSCs). Analyses were conducted with each cell type separately, avoiding co-cultures at this initial stage to ensure the reliability of the results for the proposed analyses and the unequivocal elucidation of specific material-cell interactions.
2. Materials and Methods
2.1. Cell Culture and Experimental Setup
The murine mesenchymal stem cells (mBMSCs) from C57BL/6J mice (Butantan Institute Animal Experimentation Ethics Committee - CEEA, Protocol n° 928/12), normal human fibroblasts (FN1) (CEEA Protocol n° 921/06), and primary human umbilical vein endothelial cells (HUVEC) (ATCC CRL-1730, BSL 1®) utilized in this study belong to the cell bank of the Molecular Biology Laboratory at the Butantan Institute, under the responsibility of Prof. Dr. Durvanei Augusto Maria.
Cell lines were cultured in RPMI-1640 medium (Cultilab, Campinas, São Paulo), adjusted to pH 7.2 and supplemented with 10% heat-inactivated fetal bovine serum (FBS), 2 mM L-glutamine, and 1% antibiotic solution containing 10,000 IU/mL penicillin and 10 mg/mL streptomycin. Cultures were maintained in 75 cm² culture flasks under controlled humidified atmosphere conditions with 5% CO₂ at 37 °C until they reached over 90% confluence.
Prior to conducting the experiments, cell concentration and viability were determined by counting with a Neubauer chamber, using the trypan blue exclusion dye (1%). This method allows for distinguishing between viable cells, characterized by plasma membrane integrity and consequent dye exclusion, and non-viable cells. Cell batches with viability equal to or greater than 95% were selected for subsequent assays.
For interaction with the nanocomposite, cells were suspended at a concentration of 1 x 10⁴ cells/mL. The exposure of cells to the PLLA/GO nanocomposite was monitored for a period of up to 72 hours, as outlined in the experimental protocol.
2.2. Preparation of PLLA-GO Nanocomposite
Graphene oxide (GO) was obtained via the chemical exfoliation of graphite (Nacional de Grafite Ltda®, São Paulo, Brazil), following the modified Hummers method [27]. The PLLA-GO nanocomposite (Mackgrape Laboratory, Mackenzie University, São Paulo, Brazil) was produced by incorporating a 0.2% (weight) fraction of GO into the poly(L-lactic acid) (PLLA; Evonik RESOMER® L 210S) matrix. This was achieved using a Thermo Fisher Scientific Process 11 parallel twin-screw extruder (L/D 40, Waltham, MA, USA) under a controlled temperature profile with the following heating zones: Die (220°C), Zone 8 (220°C), Zone 7 (215°C), Zone 6 (210°C), Zone 5 (210°C), Zone 4 (210°C), Zone 3 (210°C), and Zone 2 (200°C). This process yielded filaments with a 1.75 mm diameter. As demonstrated by characterization analyses, the PLLA-GO nanocomposite used as a scaffold exhibited a crystallinity degree of 42.5% [28].
The polymeric nanocomposite filaments were utilized as raw material for the production, via 3D printing (Supplemental Material 1A), of discoidal scaffolds measuring 4 mm in diameter and 2 mm in height. These dimensions are compatible with the wells of 96-well plates (U-bottom microplate, lot 1712201-1, Greiner Bio-One® Ltda, Frickenhausen, Germany) (Figure 1B). The nanocomposite was sterilized with ethylene oxide during the manufacturing process. Additionally, prior to the experiments, the scaffolds were re-sterilized by autoclaving (121°C, 15 psi, 20 minutes). To ensure the absence of contamination, a negative control was performed by seeding PLLA-GO scaffolds without cells under the same experimental culture conditions (Supplemental Material 1C). These scaffolds were designed to promote adhesion and structural support for the mBMSCs, FN1, and HUVEC cell cultures.
2.3. Cellular Characterization Techniques
To investigate the effects of the PLLA-GO nanocomposite on different cell types, in vitro experiments were conducted using three distinct cell lines (see Section 2.1): normal human fibroblasts (FN1), murine mesenchymal stem cells (mBMSCs), and human umbilical vein endothelial cells (HUVEC). Within each plate, cells from each lineage were allocated into two experimental groups: a control group (48 wells), consisting of cells cultured under standard conditions without exposure to the nanocomposite, and an experimental group (48 wells), where cells were exposed to discoidal PLLA-GO nanocomposite scaffolds (4 mm in diameter and 2 mm in height).
2.3.1. Evaluation of Cell Adhesion and Morphology via Inverted Optical Microscopy
Cell adhesion and morphology on PLLA-GO substrates were assessed by inverted microscopy, using an LSM 780-NLO confocal microscope coupled to an Axio Observer Z.1 inverted system (Carl Zeiss AG, Jena, Germany), equipped with a 40× objective (scale bar: 100 µm). Cell cultures were maintained under standard incubation conditions (37°C, 5% CO₂ in a humidified atmosphere) during image acquisition. Images were captured at predefined time intervals (24, 48, and 72 hours) using an Axiocam 506 color digital camera (Carl Zeiss AG, Germany) and ZEN 2 (Blue edition) image acquisition software (Carl Zeiss AG, Jena, Germany).
2.3.2. Morphological Characterization by Scanning Electron Microscopy (SEM)
The surface morphology of cells in the presence of PLLA-GO scaffolds was investigated by scanning electron microscopy (SEM) after 72 hours. Fragments containing the PLLA-GO nanocomposite and cells were prepared by primary fixation in 3% (v/v) glutaraldehyde in 0.1 M sodium phosphate buffer (PBS), followed by post-fixation in 1% osmium tetroxide (OsO₄). Sequential dehydration was performed using a gradual series of ethanol (80%, 90%, and 100%, with two 5-minute immersions each), culminating in critical point drying with liquid carbon dioxide (CO₂), employing the LEICA EM CPD300 equipment (Leica Microsystems GmbH, Wetzlar, Germany) to preserve cellular ultrastructure.
The dried samples were then mounted on aluminum stubs using conductive carbon tape and subjected to the deposition of a thin gold layer by sputtering, using an EMITECH® K550 metalizer (Quorum Technologies Ltd., Ashford, UK), operated at 35 mA for 120 seconds. The thickness of the conductive layer was optimized to maximize secondary electron emission and signal-to-noise ratio without compromising spatial resolution (Supplemental Material 2A-C).
Images were acquired using a Leo 435VP scanning electron microscope (Leo, Cambridge, UK) operated in secondary electron mode, with acceleration voltages and beam currents optimized for each experimental condition (Supplemental Material 2D). Processing was performed at the Advanced Center for Image and Molecular Diagnostics (CADIM) (Faculty of Veterinary Medicine and Animal Science-USP). The magnifications used for documentation were specified in the corresponding figures (Results section).
2.3.3. Flow Cytometric Analysis of Cell Cycle Distribution
The distribution of cell cycle phases was determined by flow cytometry through the quantification of cellular DNA content. Cells adhered to the scaffolds were trypsinized and centrifuged at 1500 rpm for 5 minutes. The resulting cell pellet was then resuspended in a solution containing 70% (v/v) alcohol and RNase alcohol, and stored at -20°C for 24 hours for fixation. Prior to analysis, fixed samples were centrifuged at 1500 rpm for 5 minutes, and the pellet resuspended in 200 µL of FACS buffer (Fluorescence Activated Cell Sorting; typically PBS with 1-2% BSA and EDTA). The cells were then permeabilized by adding 20 µL of Triton X-100 (Sigma-Aldrich, St. Louis, Missouri, USA), and the cellular DNA was stained with 50 µg/mL of propidium iodide (PI) (Sigma-Aldrich, St. Louis, Missouri, USA). Incubation occurred for 30 minutes at room temperature and protected from light. After this period, the samples were transferred to flow cytometry tubes and analyzed on a FACSCalibur flow cytometer (BD Biosciences, San Jose, CA, USA) in the FL2-H fluorescence channel, set to acquire 10,000 events per sample.
The results were analyzed using ModFit LT software version 3.2 (Verity Software House, Topsham, ME, USA). The histograms show the percentage of cells distributed across the different phases of the cell cycle: Sub-G1, G0/G1, S, and G2/M, expressed as mean ± standard deviation (SD).
2.3.4. Cell Proliferation Analysis by Generation Tracking with CFSE
The proliferation rate of FN1, mBMSCs, and HUVEC cells was evaluated using the fluorescent dye carboxyfluorescein succinimidyl ester (CFSE-DA Thermo Fisher, KITC34571, Waltham, MA, USA). In 24-well plates, 1 x 10⁴ cells/mL were seeded in complete culture medium 2 µL of diluted CFSE-DA was added directly to each well, which contained 500 µL of culture medium for both the control group (without PLLA-GO) and the PLLA-GO exposed group (cells + nanocomposite), resulting in a final CFSE concentration of 19.92 µM.
The PLLA-GO exposed and control groups were incubated for 24 hours under controlled conditions (37°C, 5% CO₂), allowing CFSE incorporation. The labeling reaction was naturally terminated by washing and subsequent incubation. After the incorporation period, the supernatant was removed, and 250 µL of trypsin were added to each well to dissociate adherent cells. After 5 minutes at 37°C, trypsin was inactivated with double the volume of complete culture medium. The labeled cells were then transferred to centrifuge tubes and centrifuged at 1500 rpm for 5 minutes, discarding the supernatant.
Next, the cells were resuspended in 200 µL of 4% paraformaldehyde for fixation and stored in the refrigerator until the day of reading. On the day of analysis, cells were centrifuged again at 1500 rpm for 5 minutes, and the supernatant was discarded. Cells were then resuspended in 200 µL of fluorescence-activated cell sorting (FACS) buffer.
The readings were performed on a FACScanto flow cytometer (BD) with the acquisition of 10,000 events per sample. CFSE fluorescence intensity histograms were analyzed using ModFit LT 5.0 software (Verity Software House, Topsham, ME, USA). This software was employed to model cell populations in different division generations based on the distribution of CFSE fluorescence intensity. Through sophisticated curve-fitting algorithms applied to fluorescence peaks corresponding to each generation, it was possible to quantify the percentage of cells in each generation and estimate parameters such as the cell proliferation index.
2.3.5. Analysis of Mitochondrial Electrical Potential by Flow Cytometry
The mitochondrial membrane potential (ΔΨm) was assessed using the lipophilic cationic dye Mito-Red (TMRE – tetramethylrhodamine ethyl ester; Sigma-Aldrich, St. Louis, MO, USA), a fluorochrome specific for labeling active mitochondria. After the respective treatment periods, samples of FN1, mBMSCs, and HUVEC cells were processed for the analysis of mitochondrial electrical potential.
The cells were centrifuged at 1500 rpm for 5 minutes, and the supernatant was removed. The cell pellet was then resuspended in 100 µL of RPMI-1640 culture medium containing 200 nM of Mito-red dye (Sigma-Aldrich, St. Louis, MO, USA). Samples were incubated in a 37°C incubator with 5% CO₂ for 1 hour to allow dye incorporation. Following incubation, the cells were centrifuged again at 1500 rpm for 5 minutes, the supernatant discarded, and the pellet resuspended in 100 µL of FACS Flow buffer (PBS with 1-2% BSA and EDTA). The reading and analysis of Mito-red staining in the cells were performed on a FACSCanto® II flow cytometer (Becton, Dickinson and Company, BD Biosciences, Franklin Lakes, NJ, USA) using the 488 nm laser for excitation and detecting emission at FL1-H fluorescence intensity (10,000 events). The histograms were acquired and analyzed using CellQuest® software, version 2.0 (Becton, Dickinson and Company, BD Biosciences, San Jose, CA, USA). The analysis of mitochondrial membrane potential (ΔΨm) was performed by evaluating the fluorescence intensity of the dye used, where a higher intensity correlates with a greater mitochondrial membrane potential.
2.3.6. Analysis of Inflammatory Cytokines by Flow Cytometry (CBA)
Cytokine quantification was performed using the BD Cytometric Bead Array (CBA) system (BD Biosciences, San Jose, CA, USA), with specific kits applied according to the cellular model analyzed. For the human cell lines FN1 (Fibroblasts) and HUVEC (Endothelial cells), and the murine cell line mBMSCs (Murine mesenchymal stem cells), the following cytokines were measured: IL-12p70 (Interleukin-12p70), TNF-α (Tumor Necrosis Factor alpha), IL-10 (Interleukin-10), IL-6 (Interleukin-6), IL-1β (Interleukin-1 beta), IL-8 (Interleukin-8), IFN-γ (Interferon Gamma), and MCP-1 (Monocyte Chemoattractant Protein-1).
FN1, HUVEC, and mBMSCs cells were plated in 6-well plates at a density of 2×10⁵ cells/well, and after 24 hours of incubation, the cell culture supernatants were collected after 72 hours of exposure to the PLLA-GO nanocomposite and stored at -80°C until analysis. The CBA assay was performed according to the manufacturer's instructions, with minor modifications. Specific capture microbeads for each cytokine were mixed by adding 10 µL of each microbead suspension to a tube to create the mixed microbead solution. Then, 50 µL of the mixed microbead solution, 50 µL of the cell culture supernatant (or cytokine standard), and 50 µL of the PE Detection Reagent (phycoerythrin-conjugated anti-cytokine antibodies, specific for the cell species) were added to the respective assay tubes. The tubes were incubated at room temperature for 2 hours, protected from light, followed by the addition of 1 mL of Wash Buffer and centrifugation at 1500 rpm for 5 minutes. The supernatant was carefully aspirated and discarded, and the microbead pellet was resuspended in 300 µL of FACSFlow solution. Samples were acquired on a FACSCanto II flow cytometer (Becton, Dickinson and Company, BD Biosciences, USA), and data were analyzed using BD FCAP Array software, which includes the specific tools of BD CBA Analysis for the data generated by the Cytometric Bead Array assays.

Table 1.
Especificações dos kits de citocinas utilizados para a quantificação de mediadores inflamatórios por linhagem celular.
Table 1.
Especificações dos kits de citocinas utilizados para a quantificação de mediadores inflamatórios por linhagem celular.
| Cell Types | Kit | Catalog Number | Measured Cytokines | Manufacturer |
| FN1, HUVEC | Human Th1/Th2 Cytokine Kit | 551809 | IL-12p70, TNF-α, IL-10, IL-6, IL-8, IL-1β, IFN-γ, MCP-1 | BD® Biosciences, Heidelberg, Alemanha |
| mBMSCs | Mouse Th1/Th2 Cytokine Kit | 551287 | IL-12p70, TNF-α, IL-10, IL-6, IL-8, IL-1β, IFN-γ, MCP-1 | BD® Biosciences, Heidelberg, Alemanha |
Legend - IL-12p70 refers to Interleukin-12p70; TNF-α stands for Tumor Necrosis Factor alpha; IL-10 is Interleukin-10; IL-6 denotes Interleukin-6; IL-1β represents Interleukin-1 beta; IL-8 is Interleukin-8; IFN-γ signifies Interferon Gamma; and MCP-1 corresponds to Monocyte Chemoattractant Protein-1.
2.4. Statistical Analysis
Statistical analysis of data from the cell lines (FN1, mBMSCs, and HUVEC) exposed to the PLLA-GO nanocomposite was performed using GraphPad Prism 8, with a significance level of α = 0.05. Shapiro-Wilk test was used to verify data normality. Cell distribution across cell cycle phases was compared between control and treated groups using an unpaired Student's t-test. The effect of the treatment on cell number per generation, proliferative index, and mitochondrial membrane potential was assessed by a paired t-test. Inflammatory cytokines were quantified and analyzed using a paired Student's t-test.
3. Results
3.1. Assessment of Cell Adhesion and Morphology by Inverted Optical Microscopy
Sequential morphological evaluation by inverted optical microscopy (at 24, 48, and 72 hours) of FN1, mBMSCs, and HUVEC cell lines cultivated in contact with the PLLA-GO nanocomposite demonstrated efficient cell adhesion and progressive proliferation across all cell lines, with no morphological evidence of cytotoxicity (Figure 1A-I). Temporal analysis revealed distinct and specific interaction patterns for each cell type with the biomaterial's surface.
In the study of FN1 cells, we observed the adhesion of elongated and spindle-shaped fibroblasts, with a progressive increase in cell density in the region adjacent to the PLLA-GO (Figure 1C). We noted the extension of cellular projections towards the nanocomposite's surface, as well as subtle morphological changes, such as variations in the shape and size of fibroblasts in the surrounding material, suggesting a possible fragmentation of the material.
In contrast, mBMSCs initially exhibited the adhesion of more rounded cells, which subsequently evolved into elongated shapes with an orientation directed toward the PLLA-GO. A gradual increase in cell density was also observed in the contact area, eventually leading to adhesion to the biomaterial's surface (Figure 1D-F).
HUVEC cells, characterized by their pavement-like morphology and formation of a more confluent pattern around the PLLA-GO, showed progressive interaction with the nanocomposite's edge. Individual cells extended projections, and there was an observed increase in cell density in the contact region over time (Figure 1G-I).
Sequential morphological analysis showed progressive proliferation in all evaluated cell lines, with no morphological signs indicating cytotoxicity, such as excessive rounding, fragmentation, or significant cell detachment. Additionally, the absence of morphological artifacts suggestive of contamination or aggregation in all experimental groups supports the integrity of the culture conditions and the potential primary biocompatibility of the PLLA-GO nanocomposite.
3.2. Cellular Morphological Characterization by Scanning Electron Microscopy (SEM)
SEM morphological characterization revealed that the PLLA-GO nanocomposite exerts a distinct influence on cellular organization, varying with the cell line analyzed (Figure 2A-F).
For FN1 cells (Figure 2A, B), an elongated morphology was observed, featuring fine cytoplasmic extensions and an irregular surface, reflecting their intense activity in extracellular matrix synthesis.
Scanning Electron Microscopy (SEM) morphological characterization revealed that the PLLA-GO nanocomposite distinctly influences cellular organization, with effects varying depending on the cell line analyzed (Figure 2A-F).
For FN1 cells (Figure 2A, B), an elongated morphology was observed, characterized by fine cytoplasmic extensions and an irregular surface. This morphology reflects their intensive activity in synthesizing the extracellular matrix.
In the case of murine mesenchymal stem cells (mBMSCs) (Figure 2C, D), a notable tendency towards cell clustering was observed, accompanied by robust intercellular connections. This pattern suggests the activation of mechanisms associated with tissue regeneration. As for human umbilical vein endothelial cells (HUVEC) (Figure 2E, F), the typical pavement-like cellular architecture was maintained, and the interactions between cells appeared enhanced.
In all cell lines, the biocompatibility of PLLA-GO was suggested by the absence of adverse morphological changes, such as apoptosis or cellular dedifferentiation (in FN1 and HUVEC). The observed interactions, such as the spreading of FN1, the clustering of mBMSCs, and the membranous connections of HUVECs, infer that the material not only supports cell viability but also actively modulates the microenvironment, favoring biological processes specific to each cell type.
3.3. Flow Cytometric Analysis of Cell Cycle Distribution
Table 2 presents a detailed comparative analysis of cell cycle phases (G0/G1, S, G2/M) and the debris fraction in both the control and PLLA-GO-treated groups for three cell types: FN1, mBMSCs, and HUVEC. The standard deviations (SD) and p-values are provided, indicating the statistical significance of the observed differences.
In the control group, FN1 cells showed a high proliferative activity and DNA synthesis, with 81.50% in the S phase, and smaller proportions in G0/G1 (15.27%) and G2/M (3.23%) phases. However, exposure to the PLLA-GO nanocomposite significantly altered the cell cycle: 71.74% of cells were retained in the G0/G1 phase, accompanied by a reduction to 21.58% in the S phase. The G2/M phase remained largely unchanged (5.93%) compared to the control group (p=0.28). A substantial increase in debris (34.38%) was also observed, suggesting instability of the PLLA-GO nanocomposite in the liquid medium, possibly due to hydrolytic degradation of the polymeric matrix and the subsequent release or agglomeration of graphene oxide (Table 2, Figure 3A,B).
The mBMSCs demonstrated a redistribution across the cell cycle phases: an increased concentration of cells in the G0/G1 phase (control: 39.98% vs. PLLA-GO: 61.89%, p=0.039), a reduction of cells in the S phase (control: 54.82% vs. PLLA-GO: 29.16%, p=0.027), while maintaining the same profile in the G2/M phase (control: 5.20% vs. PLLA-GO: 8.96%, p=0.12). This increase in the proportion of cells in G0/G1 and reduction in S phase suggests a potential modulation in cell cycle progression, with a decrease in DNA synthesis activity. Regarding debris, a significant increase was observed in cells exposed to PLLA-GO (p=0.005) (Table 2, Figure 3C,D).
In contrast to the FN1 and mBMSCs cells, exposure to PLLA-GO did not significantly alter the cell cycle distribution in HUVEC cells. Both the control and treated groups primarily showed cells in the G0/G1 phase (control: 61.93% vs. PLLA-GO: 54.26%) and S phase (control: 37.99% vs. PLLA-GO: 45.74%), with minimal presence in G2/M phase (control: 0.08% vs. PLLA-GO: 0.0%). There were no significant differences between the groups in any cell cycle phase (p≥0.05), nor in the proportion of debris (control: 3.80% vs. PLLA-GO: 2.80%). The accumulation of cells in the G0/G1 phase, concomitant with a reduction in the S phase, suggests a modulation in cell cycle progression with an inhibition of DNA synthesis (Table 2, Figure 3E,F).
3.4. Cell Proliferation Analysis by Generation Tracking with CFSE
CFSE proliferation analysis revealed a distinct division pattern among the cell lines (Table 3). For both FN1 and mBMSCs cells, a clear progression through generations 2, 3, and 4 was observed over the analysis period. In contrast, HUVEC cells exhibited divisions up to the 6th generation, followed by an apparent absence of the 7th generation, with subsequent detection of cell populations in generations 8, 9, and 10 by the end of the experiment.
CFSE proliferation analysis revealed that FN1 cells exposed to PLLA-GO maintained a replicative dynamic equivalent to that of the control group, with no statistically significant difference (p≥0.05). In both the control and PLLA-GO exposed groups, the majority of cells were in the second generation (control: 48.01 vs. PLLA-GO: 48.30 pg/mL), followed by the third generation (control: 31.28 vs. PLLA-GO: 31.88 pg/mL) and fourth generation (control: 20.72 vs. PLLA-GO: 19.83 pg/mL). This indicates a similar proliferative progression pattern between the groups. These results suggest that PLLA-GO treatment did not impact the ability of FN1 cells to divide and progress through the analyzed cell generations (Table 3; Figure 4A,B).
The analysis of mBMSC generational distribution after PLLA-GO exposure revealed a significant effect on initial proliferative progression (control: 43.95 vs. PLLA-GO: 46.26 pg/mL; p=0.003). However, this initial difference did not extend to subsequent generations, as the distribution of cells in generations 3 (control: 36.34 vs. PLLA-GO: 34.03 pg/mL) and 4 (control: 20.21 vs. PLLA-GO: 19.71 pg/mL) was similar between control and treated groups. The absence of significant differences in later generations indicates that while PLLA-GO may influence the kinetics of the first cell division, it does not affect the overall long-term proliferative capacity of mBMSCs. This pattern suggests a transient effect of PLLA-GO on the cell cycle, possibly related to early regulatory changes that are not sustained across multiple cell divisions (Table 3; Figure 4C,D).
For HUVEC cells, proliferation analysis was possible from the second up to the tenth generation, with the exception of the seventh generation. Data for the seventh generation were not quantifiable due to its very low population representation (Table 3).
The data revealed that PLLA-GO significantly alters the generational distribution of HUVEC cells. Progression to the second generation was accelerated, as demonstrated by the significant reduction of cells in this generation (control: 9.24 vs. PLLA-GO: 7.8 pg/mL, p=0.0005). However, PLLA-GO also caused a significant accumulation of cells in generations 4 (control: 8.61 vs. PLLA-GO: 16.53 pg/mL; p=0.005) and 10 (control: 20.72 vs. PLLA-GO: 19.83 pg/mL, p=0.03). Despite the lack of data for the seventh generation, this complex pattern suggests that PLLA-GO influences HUVEC cell proliferative kinetics in a multiphasic manner, with an initial acceleration followed by an accumulation in more advanced generations (Table 3; Figures 4E,F).
3.5. Analysis of Mitochondrial Electrical Potential by Flow Cytometry
To evaluate the impact of PLLA-GO treatment on the mitochondrial electrical potential (ΔΨm) of FN1, mBMSCs, and HUVEC cells, the proportion of cells with active and inactive mitochondrial potential was quantified by flow cytometry. Table 4 summarizes the results of the mitochondrial electrical potential analysis across all cell lines under different conditions.
Analysis of ΔΨm in FN1 cells revealed that in both the control and PLLA-GO exposed groups, the majority of cells exhibited active mitochondrial potential. The results indicate no drastic alteration in FN1 cells' mitochondrial electrical potential after PLLA-GO exposure. The predominance of cells in both groups maintained an active mitochondrial potential (control: 90.76% vs. PLLA-GO: 88.58%), suggesting that PLLA-GO treatment did not induce significant mitochondrial dysfunction in these cells. The proportion of cells with inactive potential also remained low with no major changes between groups (control: 9.32% vs. PLLA-GO: 11.56%) (Table 4, Figure 5A,B).
Analysis of the mitochondrial electrical potential (ΔΨm) revealed that mBMSCs exposed to PLLA-GO maintained a $\Delta\Psi$m equivalent to that of the control (91.6% vs. 93.03%, respectively). Similarly, there was no significant difference in the proportion of cells with reduced ΔΨm (control: 7.03% vs. PLLA-GO: 8.42%). Consistent with the observations for FN1 cells, the slight widening of the left tail in the histogram of the PLLA-GO-exposed group suggests a non-significant variation in the proportion of cells with transient mitochondrial depolarization, which is compatible with physiological fluctuations (Table 4, Figure 5C,D). These findings corroborate the possible conclusion that the nanocomposite does not compromise the energetic integrity or viability of FN1 and mBMSCs cells.
In contrast to the previous cell lines, exposure of HUVEC cells to PLLA-GO induced a significant reduction in mitochondrial electrical potenti (ΔΨm), as demonstrated by a paired t-test. The percentage of cells with active potential decreased from 97.07% in the control group to 65.82% in the exposed group (p≤0.05), representing a 32.19% drop.
Concomitantly, the proportion of HUVEC cells with inactive mitochondria substantially increased, from 3.04% in the control to 34.24% in the PLLA-GO group (p≤0.05). This remarkable difference represents an approximate 1026.32% increase in the percentage of cells with compromised mitochondrial potential. These results suggest that PLLA-GO treatment can lead to significant mitochondrial dysfunction in these cells, which has direct implications for their function and viability (Table 4, Figure 5E,F).
3.6. Analysis of Inflammatory Cytokines by Flow Cytometry (CBA)
Analysis of inflammatory cytokines via flow cytometry (CBA) revealed distinct response profiles to PLLA-GO treatment across the different cell lines investigated (FN1, mBMSCs, and HUVEC) when compared to their respective controls (Table 5).
In FN1 cells, a significant reduction was observed in IL-6 levels (control: 130.10 pg/mL vs. PLLA-GO: 114.67 pg/mL; p=0.019), representing an 11.86% decrease. For TNF-α, although an increasing trend was noted, the difference did not reach statistical significance (control: 89.11 pg/mL vs. PLLA-GO: 97.63 pg/mL; p=0.052), showing an 8.73% increase. The cytokines IL-12p70, IL-10, IL-8, 1L-1β, IFN-γ and MCP showed no significant changes between the PLLA-GO-treated group and the control (Table 5; Figure 6).
In contrast, mBMSCs exposed to PLLA-GO showed a significant increase in TNF-α production (control: 147.68 pg/mL vs. PLLA-GO: 179.67 pg/mL; p=0.03), which corresponds to a 21.66% increase. The other cytokines analyzed in this cell line—including IL-12p70, IL-6, IL-10, IL-8, 1L-1β, IFN-γ and MCP-1, did not show statistically significant differences compared to the control group (Table 5; Figure 6).
In HUVEC endothelial cells, exposure to PLLA-GO resulted in a significant reduction in both TNF-α levels (control: 97.63 pg/mL vs. PLLA-GO: 89.11 pg/mL; p=0.05) and IL-6 levels (control: 131.00 pg/mL vs. PLLA-GO: 114.67 pg/mL; p=0.02). These represented percentage decreases of 8.73% and 12.47%, respectively. The cytokines IL-12p70, IL-10, IL-8, 1L-1β, IFN-γ and MCP-1, showed no significant changes in their levels after PLLA-GO exposure compared to the control (Table 5; Figure 6).
4. Discussion
Despite significant advancements in designing nanocomposites for tissue engineering, a persistent knowledge gap remains in fully understanding the systematic response of different key cell populations—such as human fibroblasts (FN1), human umbilical vein endothelial cells (HUVEC), and mesenchymal stem cells (mBMSCs)—to novel biomaterials like the PLLA-GO nanocomposite during tissue repair stages. Comprehending this response is crucial for the rational design of biomaterials with specific and optimized applications in the context of tissue repair.
The current study aimed to fill this gap by meticulously investigating the viability, proliferation, cytotoxicity, morphological organization, and inflammatory response profile of these cell lines following exposure to PLLA-GO. The data presented here provide a multifaceted profile of the PLLA-GO-cell interaction, revealing distinct and complex behaviors that are crucial for evaluating the biocompatibility and potential application of this biomaterial in tissue engineering strategies.
In line with the objective of evaluating material-cell interaction, morphological analyses by both inverted optical microscopy and scanning electron microscopy (SEM) generally revealed primary biocompatibility of the PLLA-GO nanocomposite with all three cell lines studied. This was characterized by efficient adhesion and progressive proliferation, with typical preservation of the exposed cell lines' morphology [28,29,30].
The incorporation of graphene oxide (GO) into polymers like poly(L-lactide) (PLLA) is well-documented, solidifying its importance in advanced biomaterial development. Experimental evidence shows that adding 0.4% by weight of GO increases the material's mechanical strength by up to 44%, while 1.2% concentrations ensure electrical conductivity exceeding 1 mS/cm [31]. Additionally, its biocompatibility has been extensively validated, with studies indicating cell viability exceeding 70% [32], further strengthening its potential for applications in tissue engineering [33,34]. However, despite the expected synergistic characteristics, the specific 3D printing fabrication process and the nanocomposite's construction are critical factors that can determine changes in properties crucial for cell interaction. Variations in surface topography, pore interconnectivity, hydrophilicity, and even residual toxicity can be induced by processing conditions. These alterations directly impact cell adhesion and proliferation, influencing anchoring, migration, and nutrient access [35,36]. Consequently, these peculiarities inherent to the nanocomposite's fabrication step can infer changes in the observed results in our study, manifesting distinctly across different cell lines, even within a context of primary biocompatibility. It's worth noting that the long-term stability and potential toxicity of graphene-based materials remain ongoing research topics.
FN1 cells demonstrated adhesion and spreading characteristic of fibroblasts on biocompatible substrates [37], establishing intercellular networks and preserving their typical cellular ecomorphology in the presence of the PLLA-GO nanocomposite, similar to the control group. This in vitro behavior aligns with the high phenotypic plasticity inherent to fibroblasts, extensively documented in the literature as a mechanism of functional adaptation to microenvironmental variations and exogenous stimuli [38]. However, a slight cell dispersion was observed in some fibroblast cultures after 72 hours. This raises the possibility of a subtle stress response induced by the material, though without morphological evidence of acute cytotoxicity [39].
Similarly, mBMSCs cultured in contact with the PLLA-GO nanocomposite demonstrated the maintenance of morphological integrity of the exposed cells, with no significant deviations from the control. Local variations in cell density suggest a potential influence of the biomaterial's surface nanoarchitecture. The pattern of cellular self-organization and the increase in intercellular junctions are consistent with the activation of morphogenetic mechanisms inherent to tissue regeneration, where cell communication and proximity regulate the formation of specialized niches and the initiation of differentiation programs [40]. The preservation of cellular morphology and the promotion of homotypic interactions further bolster the evidence of the cytocompatibility of the PLLA-GO nanocomposite for mBMSCs, aligning with previous studies that investigated the biointeraction of PLLA-GO composites [28,41].
For HUVECs, the maintenance of the pavement-like architecture and the enhancement of intercellular interactions were evident in both optical and SEM microscopy. This suggests that PLLA-GO may favor endothelial organization and exert potential effects on cell adhesion and communication [42], which is a fundamental aspect for the formation of functional vascular structures [43].
The absence of adverse morphological changes, such as apoptotic bodies, and the maintenance of typical cellular identity across all cell lines corroborate PLLA-GO's ability to sustain cell viability and actively modulate the microenvironment, thereby favoring biological processes specific to each cell type [44]. The subtle morphological alteration observed in FN1 cells, with possible fragmentation of the surrounding material, raises the hypothesis that, although biocompatible, the material may undergo degradation. If this degradation is excessive or inappropriate, it could influence the long-term cellular response [45].
Complementing these data, scanning electron microscopy (SEM) analysis revealed the nanocomposite's surface topography and cell distribution across all three cell lines. This highlighted the formation of membranous connections and cellular clusters on both the surface and within the pores of the PLLA-GO. Given that research indicates PLLA is a porous scaffold [28], we hypothesize that the composite's structure is influenced by PLLA's inherent properties. These pores play a fundamental role in allowing cells to expand, establish connections, and occupy spaces within the scaffold [46]
Additionally, these results align with previous studies highlighting how the oxygen-containing functional groups present on the surface of GO interact non-specifically with molecules on the cell membrane via weak chemical bonds, such such as electrostatic and hydrogen bonds, or ionic interactions [47]. This interaction is facilitated and intensified by the incorporation of GO into PLLA, which expands the composite's specific surface area and, consequently, creates more binding sites [47,48]. These interactions activate various intracellular signaling pathways, including the MAP Kinases (MAPK), Phosphatidylinositol-3 Kinase/Protein Kinase B (PI3K/AKT), Janus Kinase/Signal Transducer and Activator of Transcription (JAK/STAT), and Nuclear Factor kappa B (NF-Κb) pathways, promoting cell adhesion, proliferation, and differentiation [48].
Analyses of the cell cycle by flow cytometry and proliferation by CFSE generation tracking revealed important nuances and differential responses among the cell lines exposed to the PLLA-GO nanocomposite.
For both FN1 and mBMSCs, the control group showed a significant predominance in the S phase, indicating high inherent proliferative activity in these cell lines. However, exposure to PLLA-GO induced a substantial retention in the G0/G1 phase and a significant reduction in the S phase relative to the control (approximately 73.52% in FN1 and 53.19% in mBMSCs). This profile suggests a modulation in normal cell cycle progression, which could be attributed to the activation of cell stress checkpoints or an initial adaptation to the new microenvironment provided by the nanocomposite. Such modulation leads to a delay in progression or the induction of an adaptive quiescent state, temporarily compromising cell replication [49,50].
However, a more in-depth analysis of long-term proliferation revealed differentiated cellular adaptation dynamics for these cell lines.
For FN1 cells, although cell cycle analysis at a given time point indicated an accumulation in G0/G1, generation tracking did not reveal a significant alteration in overall proliferation over time. This suggests a scenario of dynamic cellular adaptation to the PLLA-GO microenvironment. Initial contact with the biomaterial may trigger a transient stress that disrupts cell cycle progression; however, the subsequent restoration of proliferative capacity points to the activation of intrinsic adaptive mechanisms, allowing the maintenance of proliferative homeostasis despite the material's presence [51,52].
Regarding mesenchymal stem cells (mBMSCs), the analysis of proliferative progression through CFSE generational tracking also revealed a temporally restricted modulation of cell division kinetics. A significant effect was noted in the progression to the second generation, indicating an initial alteration in the proliferation rate in response to contact with the PLLA-GO nanocomposite. This early change in the first division might reflect a phase of cellular adaptation to the new interfacial microenvironment or a transient response to biophysical and/or biochemical signals emanating from the PLLA-GO surface [53]. However, the absence of propagation of this proliferative difference to subsequent generations suggests that, after the initial response, mBMSCs stabilized their division rate, matching the proliferative profile of the control group. This phenomenon can be attributed to cellular homeostatic mechanisms that re-establish basal proliferative kinetics, or to the attenuation of the initial stimulus caused by cell-material interaction over time. The transient nature of this initial proliferative effect implies that, while PLLA-GO may influence the dynamics of the first cell divisions of mBMSCs, it does not compromise the sustained proliferative capacity of this lineage in the long term, a crucial aspect for its potential in tissue engineering applications [54].
HUVEC cells exhibited a distinct and more complex pattern. Cell cycle analysis demonstrated that PLLA-GO exposure did not induce significant alterations in HUVEC cell cycle phases compared to the control group (p≥0.05). However, CFSE analysis revealed a multiphasic proliferative profile for HUVECs, characterized by an acceleration in progression to the second generation, an apparent absence of the 7th generation, and a subsequent significant accumulation of cells in more advanced generations (4th and 10th generations). This complex pattern infers that PLLA-GO may influence HUVEC proliferative kinetics in a non-linear manner, possibly accelerating initial divisions but inducing a delay, senescence, or specific cell loss in the 7th generation, which contributes to the later accumulation [55,56]
The significant and expressive presence of acellular debris in the FN1 cell line, characterized by an irregular, fibrous, or lamellar morphology, signals a process of biophysical degradation of the PLLA-GO scaffold. This phenomenon is intrinsically influenced by the hydrolysis of PLLA in contact with the aqueous culture medium, a process that may be potentially facilitated by the presence of graphene oxide by altering the material's hydrophilicity and surface área [57,58].
The notable intensification of PLLA-GO degradation in the presence of fibroblasts (FN1), in contrast to other cell lines, suggests the contribution of specific cellular mechanisms in modulating the biomaterial's stability. Several pathways could explain this acceleration. One possible explanation lies in the local acidification of the interfacial microenvironment [59].
Literature establishes that fibroblasts exhibit high glycolytic activity [60,61]resulting in the production and secretion of lactic acid. The consequent decrease in local pH can create a catalytic niche that favors the acceleration of hydrolysis of PLLA's ester bonds, as demonstrated by Silva and colleagues [62].
Another possible contribution to accelerated degradation lies in the secretion of enzymes by fibroblasts. While the primary function of enzymes like esterases and lipases is linked to lipid metabolism and cell signaling, the possibility of secondary hydrolytic activity targeting PLLA's ester bonds cannot be dismissed [63,64]. The local concentration of these enzymes in the cellular microenvironment, especially in intimate contact with the scaffold, could catalyze the polymer's breakdown.
Similarly, the well-recognized contractile capacity of fibroblasts [65], which is essential for tissue remodeling and response to mechanical stimuli, can exert significant forces on the PLLA-GO structure. This mechanical tension imposed by FN1 cells can induce microfractures and points of fragility in the scaffold, making it more susceptible to hydrolytic degradation and subsequent fragmentation. The nanometric architecture of PLLA-GO, possibly altered by the incorporation of graphene oxide, can modulate cell adhesion and contractility, thereby influencing the magnitude of these forces [66].
The absence of such pronounced fragmentation in HUVEC cultures corroborates the specific nature of the interaction between fibroblasts and mesenchymal stem cells with PLLA-GO, suggesting intrinsic differences in the physiology and metabolism of these cell lines. Endothelial cells, with their primary function in angiogenesis and their own distinct mechanisms of adhesion and contractility, interact differently with the material. This interaction tends to promote a less acidic microenvironment and impose less mechanical stress on the material, which, in turn, does not favor the accelerated degradation observed in the presence of fibroblastos [46].
The integrated evaluation of mitochondrial electrical potential (ΔΨm by flow cytometry and the inflammatory cytokine profile offers a robust mechanistic perspective on the cellular interactions with the PLLA-GO nanocomposite.
The preservation of an active ΔΨm in the majority of FN1 and mBMSC cells exposed to the material suggests the maintenance of energetic homeostasis and mitochondrial integrity in these cell lines. This finding aligns with the viability observations and, in terms of overall proliferative capacity over time, previously discussed for these cells. This result may indicate a lower intrinsic sensitivity of fibroblasts and mesenchymal stem cells to the direct or indirect effects of PLLA-GO regarding mitochondrial function [67].
This lower sensitivity can be attributed to several intrinsic cellular protective mechanisms. Literature suggests a higher antioxidant capacity in fibroblasts and mBMSCs, evidenced by their metabolic plasticity and the expression of enzymes like superoxide dismutase (SOD) and catalase [68]. This could neutralize oxidative stress potentially induced by PLLA-GO, thereby protecting mitochondrial function. Additionally, the efficient regulation of mitochondrial biogenesis and dynamics, including mitophagy to remove damaged organelles, can also contribute to the resilience of these cells [69,70]. Furthermore, the activation of protective signaling pathways, such as AMPK/SIRT1, in response to stress, may play a crucial role in maintaining mitochondrial homeostasis [71]. Finally, differences in mitochondrial membrane composition may influence susceptibility to material-induced damage [72]. The lower mitochondrial sensitivity observed in these lineages contrasts sharply with the response of HUVECs.
In striking contrast to the other cell lines, exposure of HUVECs to PLLA-GO resulted in a significant 32.19% reduction in active mitochondrial potential compared to the control group. This decline was accompanied by a substantial, approximately 10-fold increase over the control, in the proportion of cells exhibiting inactive mitochondrial potential. This disparity suggests a peculiar sensitivity of HUVECs to the nanocomposite.
This atypical response raises the hypothesis that the endothelial lineage may have a limited capacity to mitigate stress induced by GO's functional groups, or that the nature of the cell-material interaction is intrinsically more disruptive to the maintenance of these cells' mitochondrial homeostasis. Since mitochondrial integrity plays a significant role in cellular function and persistence [72,73], the observation in HUVECs raises important questions about the potential long-term consequences of this alteration for vascular functionality and stability.
The investigation into the inflammatory cytokine profile, quantified by Cytometric Bead Array (CBA), revealed highly unique response patterns for each cell line studied. Their distinct physiological functions are essential in elucidating the complex biomaterial-cell interactions. It's important to note that the scope of cytokines quantified varied between cell lines, as the selection of CBA analysis panels was guided by optimization and specificity for the expected cytokine secretion profile of each cell type.
The basal elevation of Interleukin-6 (IL-6) levels observed in control group fibroblasts (130.10 pg/mL, Table 5) suggests an intrinsic response to the culture microenvironment. This may potentially influence cell cycle regulation through its pro-inflammatory action and as a growth factor, stimulating the G0/G1-S transition via activation of the Janus Kinase/Signal Transducer and Activator of Transcription 3 (JAK/STAT3) and Phosphatidylinositol-3 Kinase/Protein Kinase B (PI3K/AKT) pathways [74]. In contrast, the significant reduction in IL-6 levels detected in cells exposed to PLLA-GO, concomitant with the previously observed lower proliferation, suggests that the nanocomposite may negatively modulate the production or secretion of IL-6 by these cells. This down-regulation of IL-6 could, in turn, contribute to the inhibition of downstream signaling pathways, adversely impacting progression to the S phase and, consequently, delaying or even limiting cell growth.
Regarding the inflammatory response of mBMSCs, quantitative cytokine analysis by CBA showed a statistically significant modulation (p=0.0314) in Tumor Necrosis Factor alpha (TNF-α) levels, specifically in the group exposed to the PLLA-GO nanocomposit [75]. This significant elevation of TNF-α, a pleiotropic pro-inflammatory cytokine with a recognized central role in regulating intricate inflammatory, immunological, and tissue repair processes, indicates a prominent action of this material in orchestrating the inflammatory response in this cell line [76].
It is postulated that this modulation is induced by the complex biomaterial-cell interaction established between the nanocomposite and mBMSCs. Although specific in vitro investigations involving mBMSCs and PLLA-GO are scarce, existing literature demonstrates the intrinsic ability of graphene oxide (GO) to modulate the immune response in cell lines relevant to tissue engineering. For instance, studies by Luque-Campos and researchers [75] elucidated GO's potential to influence macrophage polarization, which can, through paracrine mechanisms, affect mBMSCs' response. Additionally, studies evaluating scaffolds composed of GO and other polymers, such as the research by Islam et al. [77] sing chitosan, corroborate GO's ability to modulate the cell-material interface and, consequently, the cellular response. In line with these findings, the investigation conducted by Lategan et al. [76] on human BMSCs in vitro also demonstrates GO's aptitude for modulating the immune response of these cells. This strengthens the hypothesis that the GO present in our composite significantly contributes to the elevated TNF-α levels observed in our mBMSC cultures.
Regarding the inflammatory response of the HUVEC lineage, exposure to PLLA-GO resulted in a reduction in TNF-α levels (from 97.63 pg/mL in the control to 89.11 pg/mL in the PLLA-GO group) and IL-6 levels (from 131 pg/mL in the control to 114.67 pg/mL in the PLLA-GO group). This can be attributed to the modulation of inflammatory signaling induced by the interaction of graphene oxide (GO) with the endothelial cell. The interaction of GO with the cell membrane or its internalization may inhibit the activation of key transcription factors like NF-κB, resulting in a decrease in the gene expression of these pro-inflammatory cytokines. Alternatively, this reduction might represent a later phase of the cellular response to the nanomaterial, where mechanisms of inflammatory resolution or cellular adaptation lead to the downregulation of cytokine production.
Thus, the results underscore the need for rigorous and specific preclinical evaluations, both concerning cellular and tissue characteristics and the biomaterial's fabrication method, to ensure safety, functionality, and reproducibility. Optimizing PLLA-GO processing, coupled with a deep understanding of its cellular interactions, is essential to expanding its potential in tissue engineering and regenerative medicine strategies.
5. Conclusions
Based on our findings, the poly-L-lactic acid with graphene oxide (PLLA-GO) nanocomposite showed satisfactory primary biocompatibility with various cell lines crucial for regenerative processes. These include human fibroblasts (FN1), murine mesenchymal stem cells (mBMSCs), and human umbilical vein endothelial cells (HUVECs). However, we observed distinct and cell-type-dependent functional responses, reflected in changes in proliferation, cell cycle progression, mitochondrial potential, and inflammatory cytokine release.
Specifically, we observed accelerated material degradation associated with fibroblast activity, transient inflammatory activation in stem cells, and pronounced mitochondrial dysfunction in endothelial cells. These results demonstrate that the biocompatibility of PLLA-GO cannot be generalized across different cellular contexts, necessitating rigorous and comparative preclinical evaluation. The nanocomposite's efficacy in clinical applications will depend on its compatibility with the specific cellular microenvironment of the target tissue, as well as the optimization of its processing and formulation to ensure functional performance and safety in tissue engineering and regenerative medicine strategies.
Supplementary Materials
The following supporting information can be downloaded at the website of this paper posted on Preprints.org, Figure S1: PLLA-GO Nanocomposite Fabrication and Quality Control Steps; Figure S2: Steps for Metallization of PLLA-GO Nanocomposite Samples. Figure S1: PLLA-GO Nanocomposite Fabrication and Quality Control Steps. This section details the manufacturing steps and quality control for the PLLA-GO nanocomposite: Polymeric PLLA-GO nanocomposite filaments were used as raw material for 3D printing discoidal scaffolds (A). The manipulation and positioning process of the scaffolds in the culture plate after nanocomposite fabrication (B). A microscopic image of PLLA-GO scaffolds cultured without cells, performed under the same experimental conditions, confirming the absence of contamination (C). Figure S2: Steps for Metallization of PLLA-GO Nanocomposite Samples. This section details the metallization process for the PLLA-GO nanocomposite samples: (A) Positioning of the PLLA-GO nanocomposite samples on the sample holder inside the vacuum chamber of the Sputter Coater. (B) Sputtering process in progress, showing the luminous plasma (ionized argon) generated to bombard the metallic target and eject metal atoms. (C) Metallized samples removed from the Sputter Coater. A thin conductive layer of gold metal was deposited on the surface of the samples. (D) SEM images of PLLA coated with GO.
Author Contributions
Conceptualization, R.E.G.R. and D.A.M.; methodology, J.C.F., L.M.D.S. and P.G.F.T.; software, M.M.S. and M.G.A.; validation, M.G.A. and D.A.M.; formal analysis, K.T.P., M.G.A. and R.E.G.R.; investigation, K.T.P., R.E.G.R., D.A.M. and E.S.B.M.P.; resources, D.A.M. and R.E.G.R.; data curation, K.T.P., R.E.G.R., and E.S.B.M.P.; writing—original draft preparation, K.T.P.; writing—review and editing, K.T.P. and R.E.G.R.; visualization, K.T.P. and M.G.A.; supervision, K.T.P., R.E.G.R., and D.A.M.; project administration, K.T.P., R.E.G.R., D.A.M. and E.S.B.M.P.; funding acquisition, D.A.M.
Funding
This research was supported by the Laboratory of Development and Innovation – CDI, Durvanei Agusto Maria, academic researcher from Instituto Butantan.
Institutional Review Board Statement
Not applicable.
Informed Consent Statement
Not applicable.
Data Availability Statement
The authors confirm that the data supporting the findings of this study are available within the article and its Supplementary Materials. Data are also available on request from the authors.
Conflicts of Interest
The authors declare no conflicts of interest.
References
- Ferraz, M.P. An Overview on the Big Players in Bone Tissue Engineering: Biomaterials, Scaffolds and Cells. Int J Mol Sci 2024, 25, 3836. [Google Scholar] [CrossRef] [PubMed]
- Farjaminejad, S.; Farjaminejad, R.; Hasani, M.; Garcia-Godoy, F.; Abdouss, M.; Marya, A.; Harsoputranto, A.; Jamilian, A. Advances and Challenges in Polymer-Based Scaffolds for Bone Tissue Engineering: A Path Towards Personalized Regenerative Medicine. Polymers 2024, 16, 3303. [Google Scholar] [CrossRef] [PubMed]
- Muzzio, N.; Moya, S.; Romero, G. Multifunctional Scaffolds and Synergistic Strategies in Tissue Engineering and Regenerative Medicine. Pharmaceutics 2021, 13, 792. [Google Scholar] [CrossRef]
- Khan, A.R.; Gholap, A.D.; Grewal, N.S.; Jun, Z.; Khalid, M.; Zhang, H.-J. Advances in Smart Hybrid Scaffolds: A Strategic Approach for Regenerative Clinical Applications. Engineered Regeneration 2025, 6, 85–110. [Google Scholar] [CrossRef]
- Mohammadi Nasr, S.; Rabiee, N.; Hajebi, S.; Ahmadi, S.; Fatahi, Y.; Hosseini, M.; Bagherzadeh, M.; Ghadiri, A.M.; Rabiee, M.; Jajarmi, V.; et al. Biodegradable Nanopolymers in Cardiac Tissue Engineering: From Concept Towards Nanomedicine. Int J Nanomedicine 2020, Volume 15, 4205–4224. [Google Scholar] [CrossRef]
- Gunatillake, P. Biodegradable Synthetic Polymers for Tissue Engineering. Eur Cell Mater 2003, 5, 1–16. [Google Scholar] [CrossRef] [PubMed]
- Khouri, N.G.; Bahú, J.O.; Blanco-Llamero, C.; Severino, P.; Concha, V.O.C.; Souto, E.B. Polylactic Acid (PLA): Properties, Synthesis, and Biomedical Applications – A Review of the Literature. J Mol Struct 2024, 1309, 138243. [Google Scholar] [CrossRef]
- Limsukon, W.; Rubino, M.; Rabnawaz, M.; Lim, L.-T.; Auras, R. Hydrolytic Degradation of Poly(Lactic Acid): Unraveling Correlations between Temperature and the Three Phase Structures. Polym Degrad Stab 2023, 217, 110537. [Google Scholar] [CrossRef]
- Quirk, R.A.; Davies, M.C.; Tendler, S.J.B.; Chan, W.C.; Shakesheff, K.M. Controlling Biological Interactions with Poly(Lactic Acid) by Surface Entrapment Modification. Langmuir 2001, 17, 2817–2820. [Google Scholar] [CrossRef]
- da Silva, D.; Kaduri, M.; Poley, M.; Adir, O.; Krinsky, N.; Shainsky-Roitman, J.; Schroeder, A. Biocompatibility, Biodegradation and Excretion of Polylactic Acid (PLA) in Medical Implants and Theranostic Systems. Chemical Engineering Journal 2018, 340, 9–14. [Google Scholar] [CrossRef]
- Maestrelli, L.M.D.; Oyama, H.T.T.; Muñoz, P.A.R.; Cestari, I.A.; Fechine, G.J.M. Role of Graphene Oxide on the Mechanical Behaviour of Polycarbonate-Urethane/Graphene Oxide Composites. Materials Research 2021, 24. [Google Scholar] [CrossRef]
- Viprya, P.; Kumar, D.; Kowshik, S. Study of Different Properties of Graphene Oxide (GO) and Reduced Graphene Oxide (RGO). In Proceedings of the RAiSE-2023; MDPI: Basel Switzerland, December 20, 2023; p. 84. [Google Scholar]
- Arriagada, P.; Palza, H.; Palma, P.; Flores, M.; Caviedes, P. Poly(Lactic Acid) Composites Based on Graphene Oxide Particles with Antibacterial Behavior Enhanced by Electrical Stimulus and Biocompatibility. J Biomed Mater Res A 2018, 106, 1051–1060. [Google Scholar] [CrossRef] [PubMed]
- Zhou, B.; Zheng, C.; Zhang, R.; Xue, S.; Zheng, B.; Shen, H.; Sheng, Y.; Zhang, H. Graphene Oxide-Enhanced and Dynamically Crosslinked Bio-Elastomer for Poly(Lactic Acid) Modification. Molecules 2024, 29, 2539. [Google Scholar] [CrossRef] [PubMed]
- Dey, K.; Roca, E.; Ramorino, G.; Sartore, L. Progress in the Mechanical Modulation of Cell Functions in Tissue Engineering. Biomater Sci 2020, 8, 7033–7081. [Google Scholar] [CrossRef]
- Da Silva, K.; Kumar, P.; Choonara, Y.E. The Paradigm of Stem Cell Secretome in Tissue Repair and Regeneration: Present and Future Perspectives. Wound Repair and Regeneration 2025, 33. [Google Scholar] [CrossRef]
- Park, J.Y.C.; King, A.; Björk, V.; English, B.W.; Fedintsev, A.; Ewald, C.Y. Strategic Outline of Interventions Targeting Extracellular Matrix for Promoting Healthy Longevity. American Journal of Physiology-Cell Physiology 2023, 325, C90–C128. [Google Scholar] [CrossRef]
- Tanaka, K.; Ogino, R.; Yamakawa, S.; Suda, S.; Hayashida, K. Role and Function of Mesenchymal Stem Cells on Fibroblast in Cutaneous Wound Healing. Biomedicines 2022, 10, 1391. [Google Scholar] [CrossRef]
- Schuster, R.; Rockel, J.S.; Kapoor, M.; Hinz, B. The Inflammatory Speech of Fibroblasts. Immunol Rev 2021, 302, 126–146. [Google Scholar] [CrossRef]
- Nancarrow-Lei, R.; Mafi, P.; Mafi, R.; Khan, W. A Systemic Review of Adult Mesenchymal Stem Cell Sources and Their Multilineage Differentiation Potential Relevant to Musculoskeletal Tissue Repair and Regeneration. Curr Stem Cell Res Ther 2017, 12. [Google Scholar] [CrossRef]
- Maqsood, M.; Kang, M.; Wu, X.; Chen, J.; Teng, L.; Qiu, L. Adult Mesenchymal Stem Cells and Their Exosomes: Sources, Characteristics, and Application in Regenerative Medicine. Life Sci 2020, 256, 118002. [Google Scholar] [CrossRef]
- Han, Y.; Yang, J.; Fang, J.; Zhou, Y.; Candi, E.; Wang, J.; Hua, D.; Shao, C.; Shi, Y. The Secretion Profile of Mesenchymal Stem Cells and Potential Applications in Treating Human Diseases. Signal Transduct Target Ther 2022, 7, 92. [Google Scholar] [CrossRef] [PubMed]
- Xue, Z.; Liao, Y.; Li, Y. Effects of Microenvironment and Biological Behavior on the Paracrine Function of Stem Cells. Genes Dis 2024, 11, 135–147. [Google Scholar] [CrossRef] [PubMed]
- Rouwkema, J.; Khademhosseini, A. Vascularization and Angiogenesis in Tissue Engineering: Beyond Creating Static Networks. Trends Biotechnol 2016, 34, 733–745. [Google Scholar] [CrossRef] [PubMed]
- Ren, B.; Jiang, Z.; Murfee, W.L.; Katz, A.J.; Siemann, D.; Huang, Y. Realizations of Vascularized Tissues: From in Vitro Platforms to in Vivo Grafts. Biophys Rev 2023, 4. [Google Scholar] [CrossRef]
- Chen, J.; Zhang, D.; Wu, L.-P.; Zhao, M. Current Strategies for Engineered Vascular Grafts and Vascularized Tissue Engineering. Polymers 2023, 15, 2015. [Google Scholar] [CrossRef]
- Hummers, W.S.; Offeman, R.E. Preparation of Graphitic Oxide. J Am Chem Soc 1958, 80, 1339–1339. [Google Scholar] [CrossRef]
- Santos Silva, T.; Melo Soares, M.; Oliveira Carreira, A.C.; de Sá Schiavo Matias, G.; Coming Tegon, C.; Massi, M.; de Aguiar Oliveira, A.; da Silva Júnior, L.N.; Costa de Carvalho, H.J.; Doná Rodrigues Almeida, G.H.; et al. Biological Characterization of Polymeric Matrix and Graphene Oxide Biocomposites Filaments for Biomedical Implant Applications: A Preliminary Report. Polymers 2021, 13, 3382. [Google Scholar] [CrossRef]
- Yao, X.; Yan, Z.; Wang, X.; Jiang, H.; Qian, Y.; Fan, C. The Influence of Reduced Graphene Oxide on Stem Cells: A Perspective in Peripheral Nerve Regeneration. Regen Biomater 2021, 8. [Google Scholar] [CrossRef]
- Luo, Y.; Shen, H.; Fang, Y.; Cao, Y.; Huang, J.; Zhang, M.; Dai, J.; Shi, X.; Zhang, Z. Enhanced Proliferation and Osteogenic Differentiation of Mesenchymal Stem Cells on Graphene Oxide-Incorporated Electrospun Poly(Lactic- Co -Glycolic Acid) Nanofibrous Mats. ACS Appl Mater Interfaces 2015, 7, 6331–6339. [Google Scholar] [CrossRef]
- Kim, M.; Jeong, J.H.; Lee, J.-Y.; Capasso, A.; Bonaccorso, F.; Kang, S.-H.; Lee, Y.-K.; Lee, G.-H. Electrically Conducting and Mechanically Strong Graphene–Polylactic Acid Composites for 3D Printing. ACS Appl Mater Interfaces 2019, 11, 11841–11848. [Google Scholar] [CrossRef]
- González-Rodríguez, L.; Pérez-Davila, S.; Lama, R.; López-Álvarez, M.; Serra, J.; Novoa, B.; Figueras, A.; González, P. 3D Printing of PLA:CaP:GO Scaffolds for Bone Tissue Applications. RSC Adv 2023, 13, 15947–15959. [Google Scholar] [CrossRef] [PubMed]
- Oktay, B.; Ahlatcıoğlu Özerol, E.; Sahin, A.; Gunduz, O.; Ustundag, C.B. Production and Characterization of PLA/HA/GO Nanocomposite Scaffold. ChemistrySelect 2022, 7. [Google Scholar] [CrossRef]
- Choi, H.W.; Cox, A.; Mofarah, H.M.; Jabbour, G. Mechanical and Electrical Properties of 3D-Printed Highly Conductive Reduced Graphene Oxide/Polylactic Acid Composite. Adv Eng Mater 2024, 26. [Google Scholar] [CrossRef]
- Pandey, A.; Singh, J.; Singh, M.; Singh, G.; Parmar, A.S.; Chaudhary, S. Graphene Oxide/ Polylactic Acid Composites with Enhanced Electrical and Mechanical Properties for 3D-Printing Materials. J Mol Struct 2025, 1329, 141420. [Google Scholar] [CrossRef]
- Guo, W.; Yang, Y.; Liu, C.; Bu, W.; Guo, F.; Li, J.; Wang, E.; Peng, Z.; Mai, H.; You, H.; et al. 3D Printed TPMS Structural PLA/GO Scaffold: Process Parameter Optimization, Porous Structure, Mechanical and Biological Properties. J Mech Behav Biomed Mater 2023, 142, 105848. [Google Scholar] [CrossRef]
- Altankov, G.; Grinnell, F.; Groth, T. Studies on the Biocompatibility of Materials: Fibroblast Reorganization of Substratum-Bound Fibronectin on Surfaces Varying in Wettability. J Biomed Mater Res 1996, 30, 385–391. [Google Scholar] [CrossRef]
- Pinto, A.M.; Moreira, S.; Gonçalves, I.C.; Gama, F.M.; Mendes, A.M.; Magalhães, F.D. Biocompatibility of Poly(Lactic Acid) with Incorporated Graphene-Based Materials. Colloids Surf B Biointerfaces 2013, 104, 229–238. [Google Scholar] [CrossRef]
- Krausgruber, T.; Fortelny, N.; Fife-Gernedl, V.; Senekowitsch, M.; Schuster, L.C.; Lercher, A.; Nemc, A.; Schmidl, C.; Rendeiro, A.F.; Bergthaler, A.; et al. Structural Cells Are Key Regulators of Organ-Specific Immune Responses. Nature 2020, 583, 296–302. [Google Scholar] [CrossRef]
- Laraba, S.R.; Ullah, N.; Bouamer, A.; Ullah, A.; Aziz, T.; Luo, W.; Djerir, W.; Zahra, Q. ul A.; Rezzoug, A.; Wei, J.; et al. Enhancing Structural and Thermal Properties of Poly(Lactic Acid) Using Graphene Oxide Filler and Anionic Surfactant Treatment. Molecules 2023, 28, 6442. [Google Scholar] [CrossRef]
- Qiu, Z.; Lin, X.; Zou, L.; Fu, W.; Lv, H. Effect of Graphene Oxide/ Poly-L-Lactic Acid Composite Scaffold on the Biological Properties of Human Dental Pulp Stem Cells. BMC Oral Health 2024, 24, 413. [Google Scholar] [CrossRef]
- You, D.; Li, K.; Guo, W.; Zhao, G.; Fu, C. Poly (Lactic-Co-Glycolic Acid)/Graphene Oxide Composites Combined with Electrical Stimulation in Wound Healing: Preparation and Characterization. Int J Nanomedicine 2019, 14, 7039–7052. [Google Scholar] [CrossRef] [PubMed]
- Hennigs, J.K.; Matuszcak, C.; Trepel, M.; Körbelin, J. Vascular Endothelial Cells: Heterogeneity and Targeting Approaches. Cells 2021, 10, 2712. [Google Scholar] [CrossRef] [PubMed]
- Su, J.; Song, Y.; Zhu, Z.; Huang, X.; Fan, J.; Qiao, J.; Mao, F. Cell–Cell Communication: New Insights and Clinical Implications. Signal Transduct Target Ther 2024, 9, 196. [Google Scholar] [CrossRef]
- Sulaksono, H.; Annisa, A.; Ruslami, R.; Mufeeduzzaman, M.; Panatarani, C.; Hermawan, W.; Ekawardhani, S.; Joni, I.M. Recent Advances in Graphene Oxide-Based on Organoid Culture as Disease Model and Cell Behavior – A Systematic Literature Review. Int J Nanomedicine 2024, 19, 6201–6228. [Google Scholar] [CrossRef] [PubMed]
- Zhang, X.; Zhang, S.; Wang, T. How the Mechanical Microenvironment of Stem Cell Growth Affects Their Differentiation: A Review. Stem Cell Res Ther 2022, 13, 415. [Google Scholar] [CrossRef]
- AbouAitah, K.; Sabbagh, F.; Kim, B.S. Graphene Oxide Nanostructures as Nanoplatforms for Delivering Natural Therapeutic Agents: Applications in Cancer Treatment, Bacterial Infections, and Bone Regeneration Medicine. Nanomaterials 2023, 13, 2666. [Google Scholar] [CrossRef]
- Hu, X.; li, J.; Fu, M.; Zhao, X.; Wang, W. The JAK/STAT Signaling Pathway: From Bench to Clinic. Signal Transduct Target Ther 2021, 6, 402. [Google Scholar] [CrossRef]
- Wang, X.; Wang, H.; Jiang, K.; Zhang, Y.; Zhan, C.; Ying, M.; Zhang, M.; Lu, L.; Wang, R.; Wang, S.; et al. Liposomes with Cyclic RGD Peptide Motif Triggers Acute Immune Response in Mice. Journal of Controlled Release 2019, 293, 201–214. [Google Scholar] [CrossRef]
- Hao, Q.; Zong, X.; Sun, Q.; Lin, Y.-C.; Song, Y.J.; Hashemikhabir, S.; Hsu, R.Y.; Kamran, M.; Chaudhary, R.; Tripathi, V.; et al. The S-Phase-Induced LncRNA SUNO1 Promotes Cell Proliferation by Controlling YAP1/Hippo Signaling Pathway. Elife 2020, 9. [Google Scholar] [CrossRef]
- ten Brink, T.; Damanik, F.; Rotmans, J.I.; Moroni, L. Unraveling and Harnessing the Immune Response at the Cell–Biomaterial Interface for Tissue Engineering Purposes. Adv Healthc Mater 2024, 13. [Google Scholar] [CrossRef]
- Ma, Q.; Wang, X.; Feng, B.; Liang, C.; Wan, X.; El-Newehy, M.; Abdulhameed, M.M.; Mo, X.; Wu, J. Fiber Configuration Determines Foreign Body Response of Electrospun Scaffolds: In Vitro and in Vivo Assessments. Biomedical Materials 2024, 19, 025007. [Google Scholar] [CrossRef] [PubMed]
- Ghosh, K.; Pan, Z.; Guan, E.; Ge, S.; Liu, Y.; Nakamura, T.; Ren, X.-D.; Rafailovich, M.; Clark, R.A.F. Cell Adaptation to a Physiologically Relevant ECM Mimic with Different Viscoelastic Properties. Biomaterials 2007, 28, 671–679. [Google Scholar] [CrossRef]
- Dudaryeva, O.Y.; Bernhard, S.; Tibbitt, M.W.; Labouesse, C. Implications of Cellular Mechanical Memory in Bioengineering. ACS Biomater Sci Eng 2023, 9, 5985–5998. [Google Scholar] [CrossRef]
- Chavkin, N.W.; Genet, G.; Poulet, M.; Jeffery, E.D.; Marziano, C.; Genet, N.; Vasavada, H.; Nelson, E.A.; Acharya, B.R.; Kour, A.; et al. Endothelial Cell Cycle State Determines Propensity for Arterial-Venous Fate. Nat Commun 2022, 13, 5891. [Google Scholar] [CrossRef]
- Shin, Y.J.; Lee, J.H. Exploring the Molecular and Developmental Dynamics of Endothelial Cell Differentiation. Int J Stem Cells 2024, 17, 15–29. [Google Scholar] [CrossRef]
- Bikiaris, N.D.; Koumentakou, I.; Samiotaki, C.; Meimaroglou, D.; Varytimidou, D.; Karatza, A.; Kalantzis, Z.; Roussou, M.; Bikiaris, R.D.; Papageorgiou, G.Z. Recent Advances in the Investigation of Poly(Lactic Acid) (PLA) Nanocomposites: Incorporation of Various Nanofillers and Their Properties and Applications. Polymers 2023, 15, 1196. [Google Scholar] [CrossRef]
- Castro-Aguirre, E.; Iñiguez-Franco, F.; Samsudin, H.; Fang, X.; Auras, R. Poly(Lactic Acid)—Mass Production, Processing, Industrial Applications, and End of Life. Adv Drug Deliv Rev 2016, 107, 333–366. [Google Scholar] [CrossRef]
- Park, S.A.; Lee, S.J.; Seok, J.M.; Lee, J.H.; Kim, W.D.; Kwon, I.K. Fabrication of 3D Printed PCL/PEG Polyblend Scaffold Using Rapid Prototyping System for Bone Tissue Engineering Application. J Bionic Eng 2018, 15, 435–442. [Google Scholar] [CrossRef]
- Lemons, J.M.S.; Feng, X.-J.; Bennett, B.D.; Legesse-Miller, A.; Johnson, E.L.; Raitman, I.; Pollina, E.A.; Rabitz, H.A.; Rabinowitz, J.D.; Coller, H.A. Quiescent Fibroblasts Exhibit High Metabolic Activity. PLoS Biol 2010, 8, e1000514. [Google Scholar] [CrossRef]
- Vander Heiden, M.G.; Cantley, L.C.; Thompson, C.B. Understanding the Warburg Effect: The Metabolic Requirements of Cell Proliferation. Science (1979) 2009, 324, 1029–1033. [Google Scholar] [CrossRef]
- Silva, R.R.A.; Marques, C.S.; Arruda, T.R.; Teixeira, S.C.; de Oliveira, T.V. Biodegradation of Polymers: Stages, Measurement, Standards and Prospects. Macromol 2023, 3, 371–399. [Google Scholar] [CrossRef]
- Kürten, C.; Carlberg, B.; Syrén, P.-O. Mechanism-Guided Discovery of an Esterase Scaffold with Promiscuous Amidase Activity. Catalysts 2016, 6, 90. [Google Scholar] [CrossRef]
- Tokiwa, Y.; Suzuki, T. Hydrolysis of Polyesters by Lipases. Nature 1977, 270, 76–78. [Google Scholar] [CrossRef]
- Shvetsova, E.V.; Rogovaya, O.S.; Tkachenko, S.B.; Kiselev, I.V.; Vasil’ev, A.V.; Terskikh, V.V. Contractile Capacity of Fibroblasts from Different Sources in the Model of Living Skin Equivalent. Biology Bulletin 2008, 35, 146–150. [Google Scholar] [CrossRef]
- Naganuma, T. The Relationship between Cell Adhesion Force Activation on Nano/Micro-Topographical Surfaces and Temporal Dependence of Cell Morphology. Nanoscale 2017, 9, 13171–13186. [Google Scholar] [CrossRef] [PubMed]
- Cun, X.; Hosta-Rigau, L. Topography: A Biophysical Approach to Direct the Fate of Mesenchymal Stem Cells in Tissue Engineering Applications. Nanomaterials 2020, 10, 2070. [Google Scholar] [CrossRef]
- Sahlender, B.; Windolf, J.; Suschek, C.V. Superoxide Dismutase and Catalase Significantly Improve the Osteogenic Differentiation Potential of Osteogenetically Compromised Human Adipose Tissue-Derived Stromal Cells in Vitro. Stem Cell Res 2022, 60, 102708. [Google Scholar] [CrossRef] [PubMed]
- Yao, Y.; Zhang, T.; Tang, M. Toxicity Mechanism of Engineered Nanomaterials: Focus on Mitochondria. Environmental Pollution 2024, 343, 123231. [Google Scholar] [CrossRef]
- Salisbury, R.L.; Agans, R.; Huddleston, M.E.; Snyder, A.; Mendlein, A.; Hussain, S. Toxicological Mechanisms of Engineered Nanomaterials: Role of Material Properties in Inducing Different Biological Responses. In Handbook of Developmental Neurotoxicology; Elsevier, 2018; pp. 237–249.
- Herzig, S.; Shaw, R.J. AMPK: Guardian of Metabolism and Mitochondrial Homeostasis. Nat Rev Mol Cell Biol 2018, 19, 121–135. [Google Scholar] [CrossRef]
- Chen, W.; Zhao, H.; Li, Y. Mitochondrial Dynamics in Health and Disease: Mechanisms and Potential Targets. Signal Transduct Target Ther 2023, 8, 333. [Google Scholar] [CrossRef]
- Sharma, P.; Sampath, H. Mitochondrial DNA Integrity: Role in Health and Disease. Cells 2019, 8, 100. [Google Scholar] [CrossRef] [PubMed]
- Abaurrea, A.; Araujo, A.M.; Caffarel, M.M. The Role of the IL-6 Cytokine Family in Epithelial–Mesenchymal Plasticity in Cancer Progression. Int J Mol Sci 2021, 22, 8334. [Google Scholar] [CrossRef] [PubMed]
- Luque-Campos, N.; Bustamante-Barrientos, F.A.; Pradenas, C.; García, C.; Araya, M.J.; Bohaud, C.; Contreras-López, R.; Elizondo-Vega, R.; Djouad, F.; Luz-Crawford, P.; et al. The Macrophage Response Is Driven by Mesenchymal Stem Cell-Mediated Metabolic Reprogramming. Front Immunol 2021, 12. [Google Scholar] [CrossRef] [PubMed]
- Lategan, K.; Alghadi, H.; Bayati, M.; De Cortalezzi, M.; Pool, E. Effects of Graphene Oxide Nanoparticles on the Immune System Biomarkers Produced by RAW 264.7 and Human Whole Blood Cell Cultures. Nanomaterials 2018, 8, 125. [Google Scholar] [CrossRef]
- Islam, Md.M.; Shahruzzaman, Md.; Biswas, S.; Nurus Sakib, Md.; Rashid, T.U. Chitosan Based Bioactive Materials in Tissue Engineering Applications-A Review. Bioact Mater 2020, 5, 164–183. [Google Scholar] [CrossRef]
Figure 1.
Morphological analysis by inverted optical microscopy of cell line interaction with the PLLA-GO nanocomposite. (A, D, G) 24 hours; (B, E, H) 48 hours; (C, F, I) 72 hours. Photomicrographs of FN1 (A-C), mBMSCs (D-F), and HUVEC (G-I) cell lines cultured in the presence of PLLA-GO. Legend: Asterisk (*): Indicates the PLLA-GO nanocomposite. White arrows: Point to cells at the interface or migrating towards the nanocomposite. Red arrows: Indicate areas of contact or cellular concentration at the nanocomposite interface. Objective: 10x (magnification: × 100).
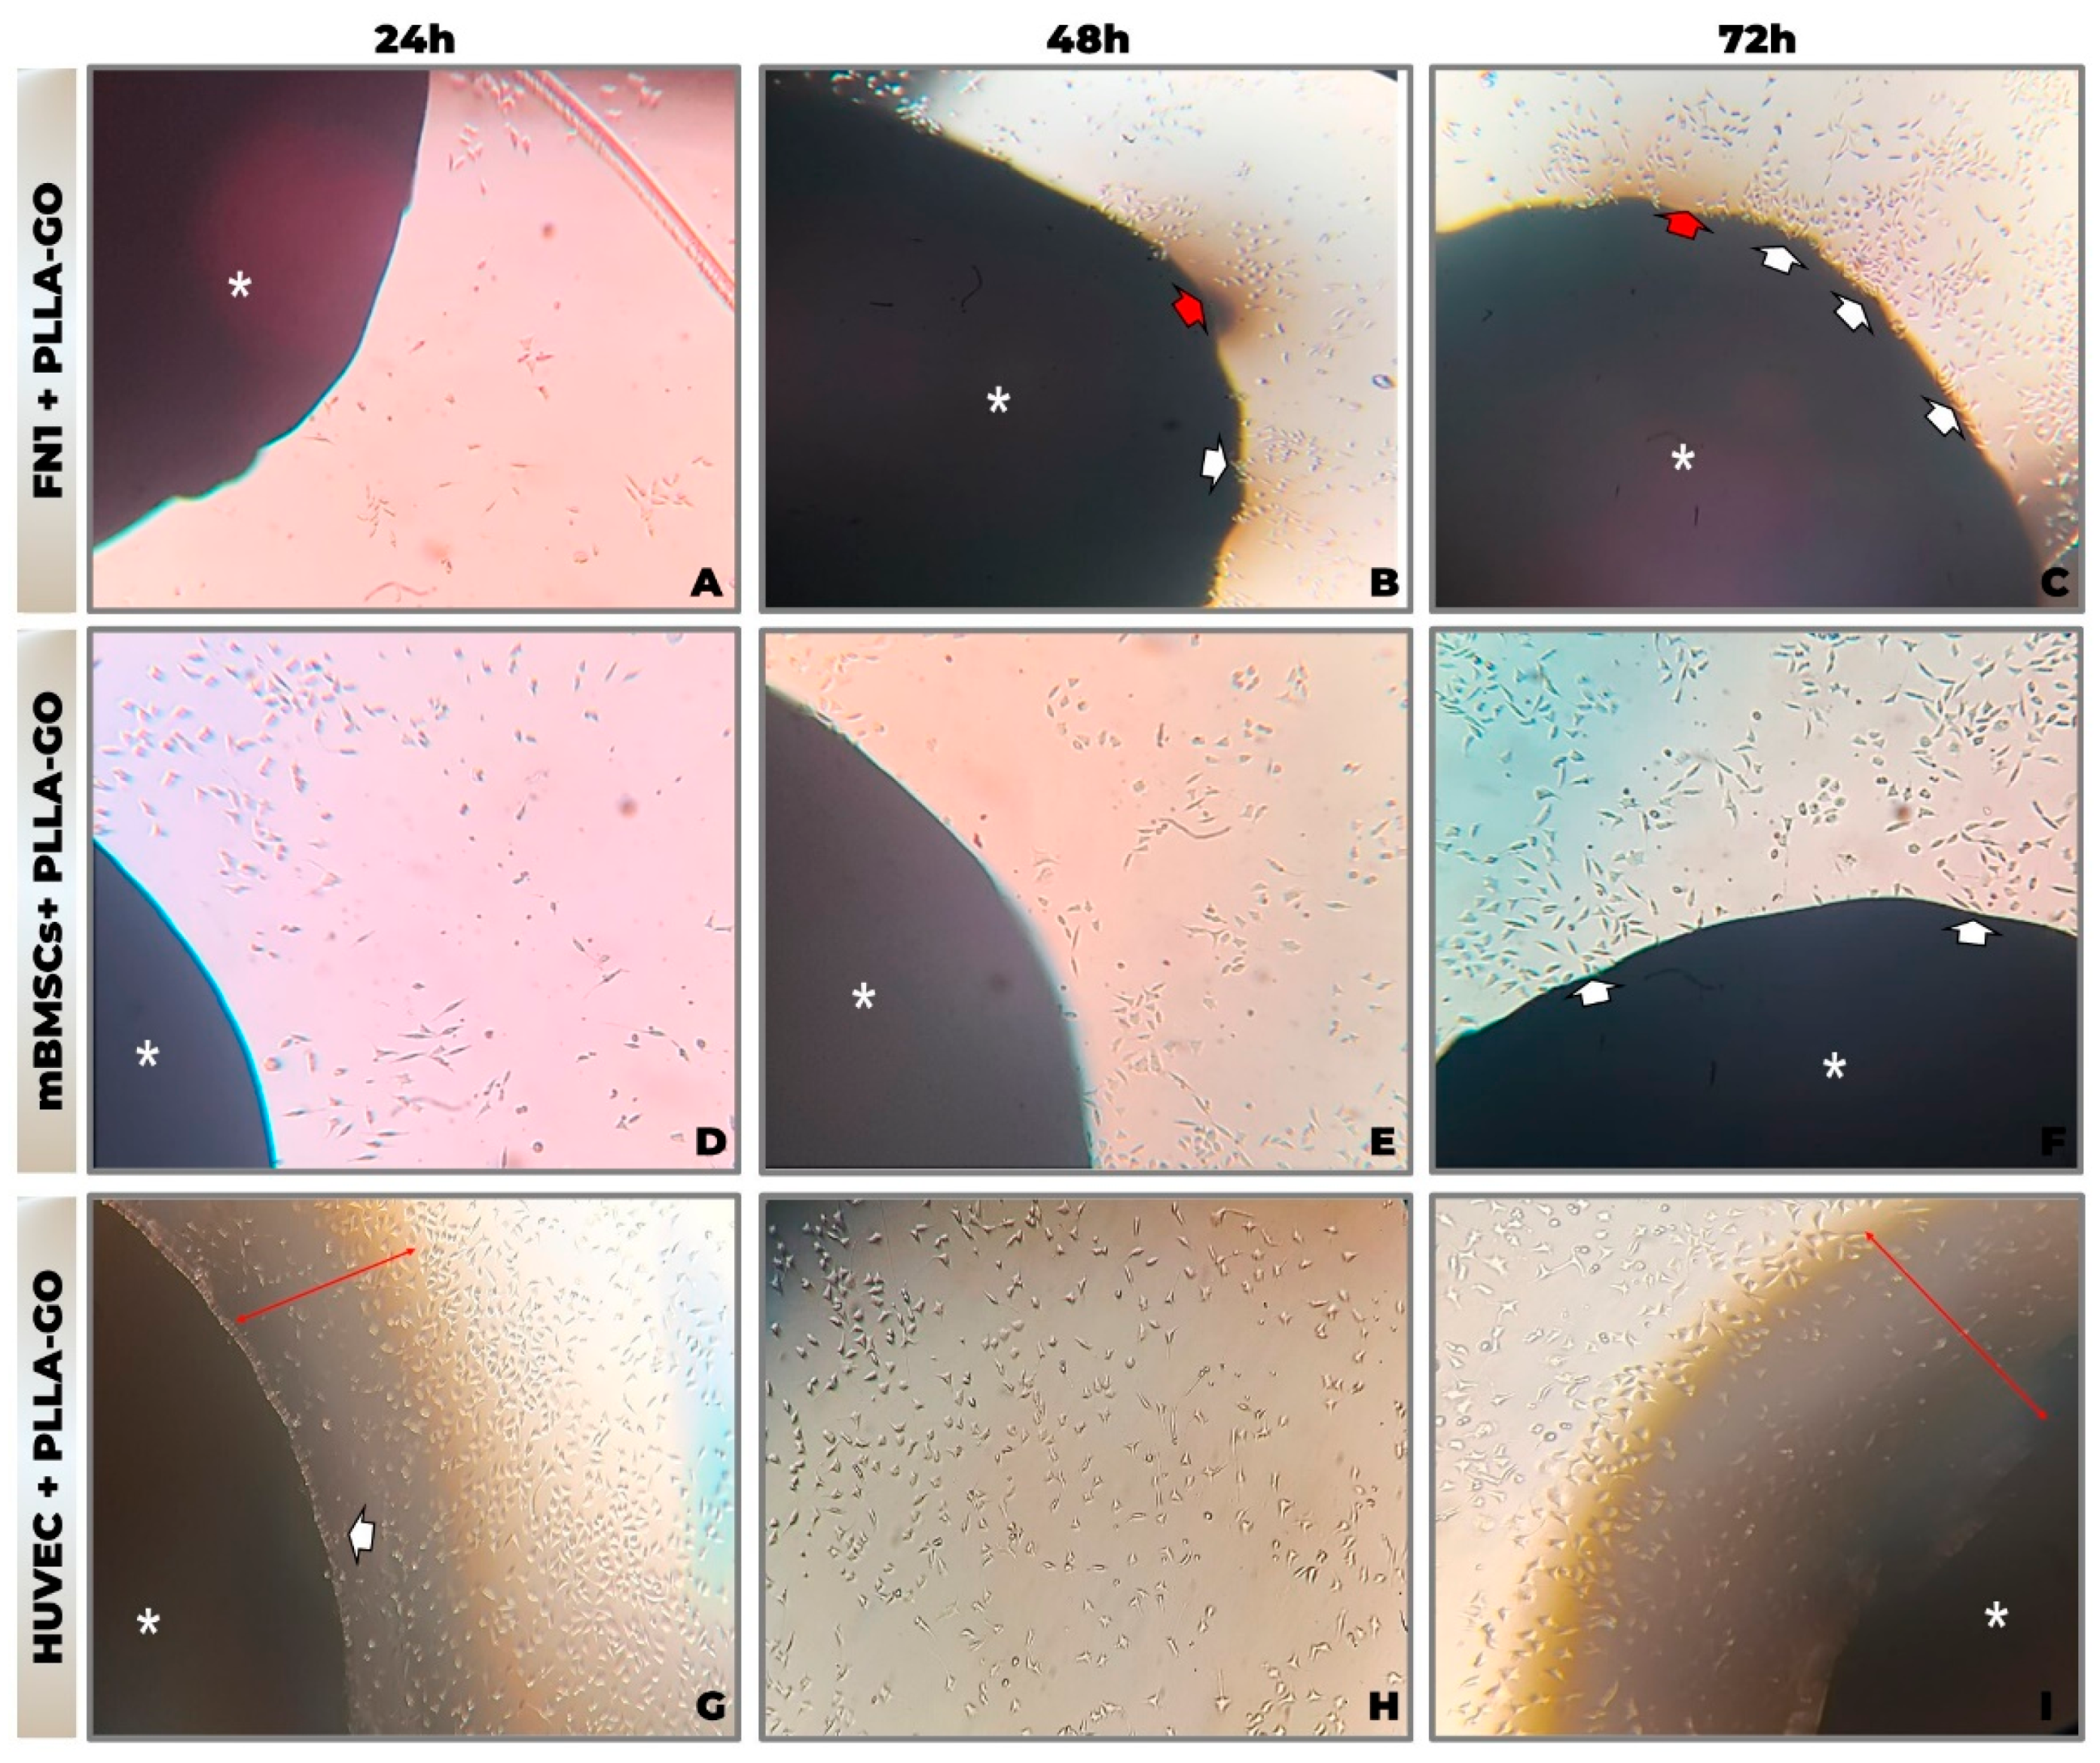
Figure 2.
Cell Morphology of Cell Lines Exposed to PLLA-GO Nanocomposite After 72h of Culture, Analyzed by Scanning Electron Microscopy (SEM). FN1 cells (A, B) exhibit a spindle-shaped morphology with filopodial extensions. The mBMSCs (C, D) exhibit an irregular polygonal shape with lamellipodial extensions. HUVEC cells (E, F) demonstrate a pavement-like morphology and confluent organization. Progressive cell spreading is observed in all cultures. SEM image acquisition parameters: Secondary electron detector (SE1); acceleration voltage of 15.00 kV; scale bar = 3 µm. Magnifications were 3.49 K X for images A-E, 3.13 K X for B-F, 3.26 K X for C, and 3.13 K X for D.
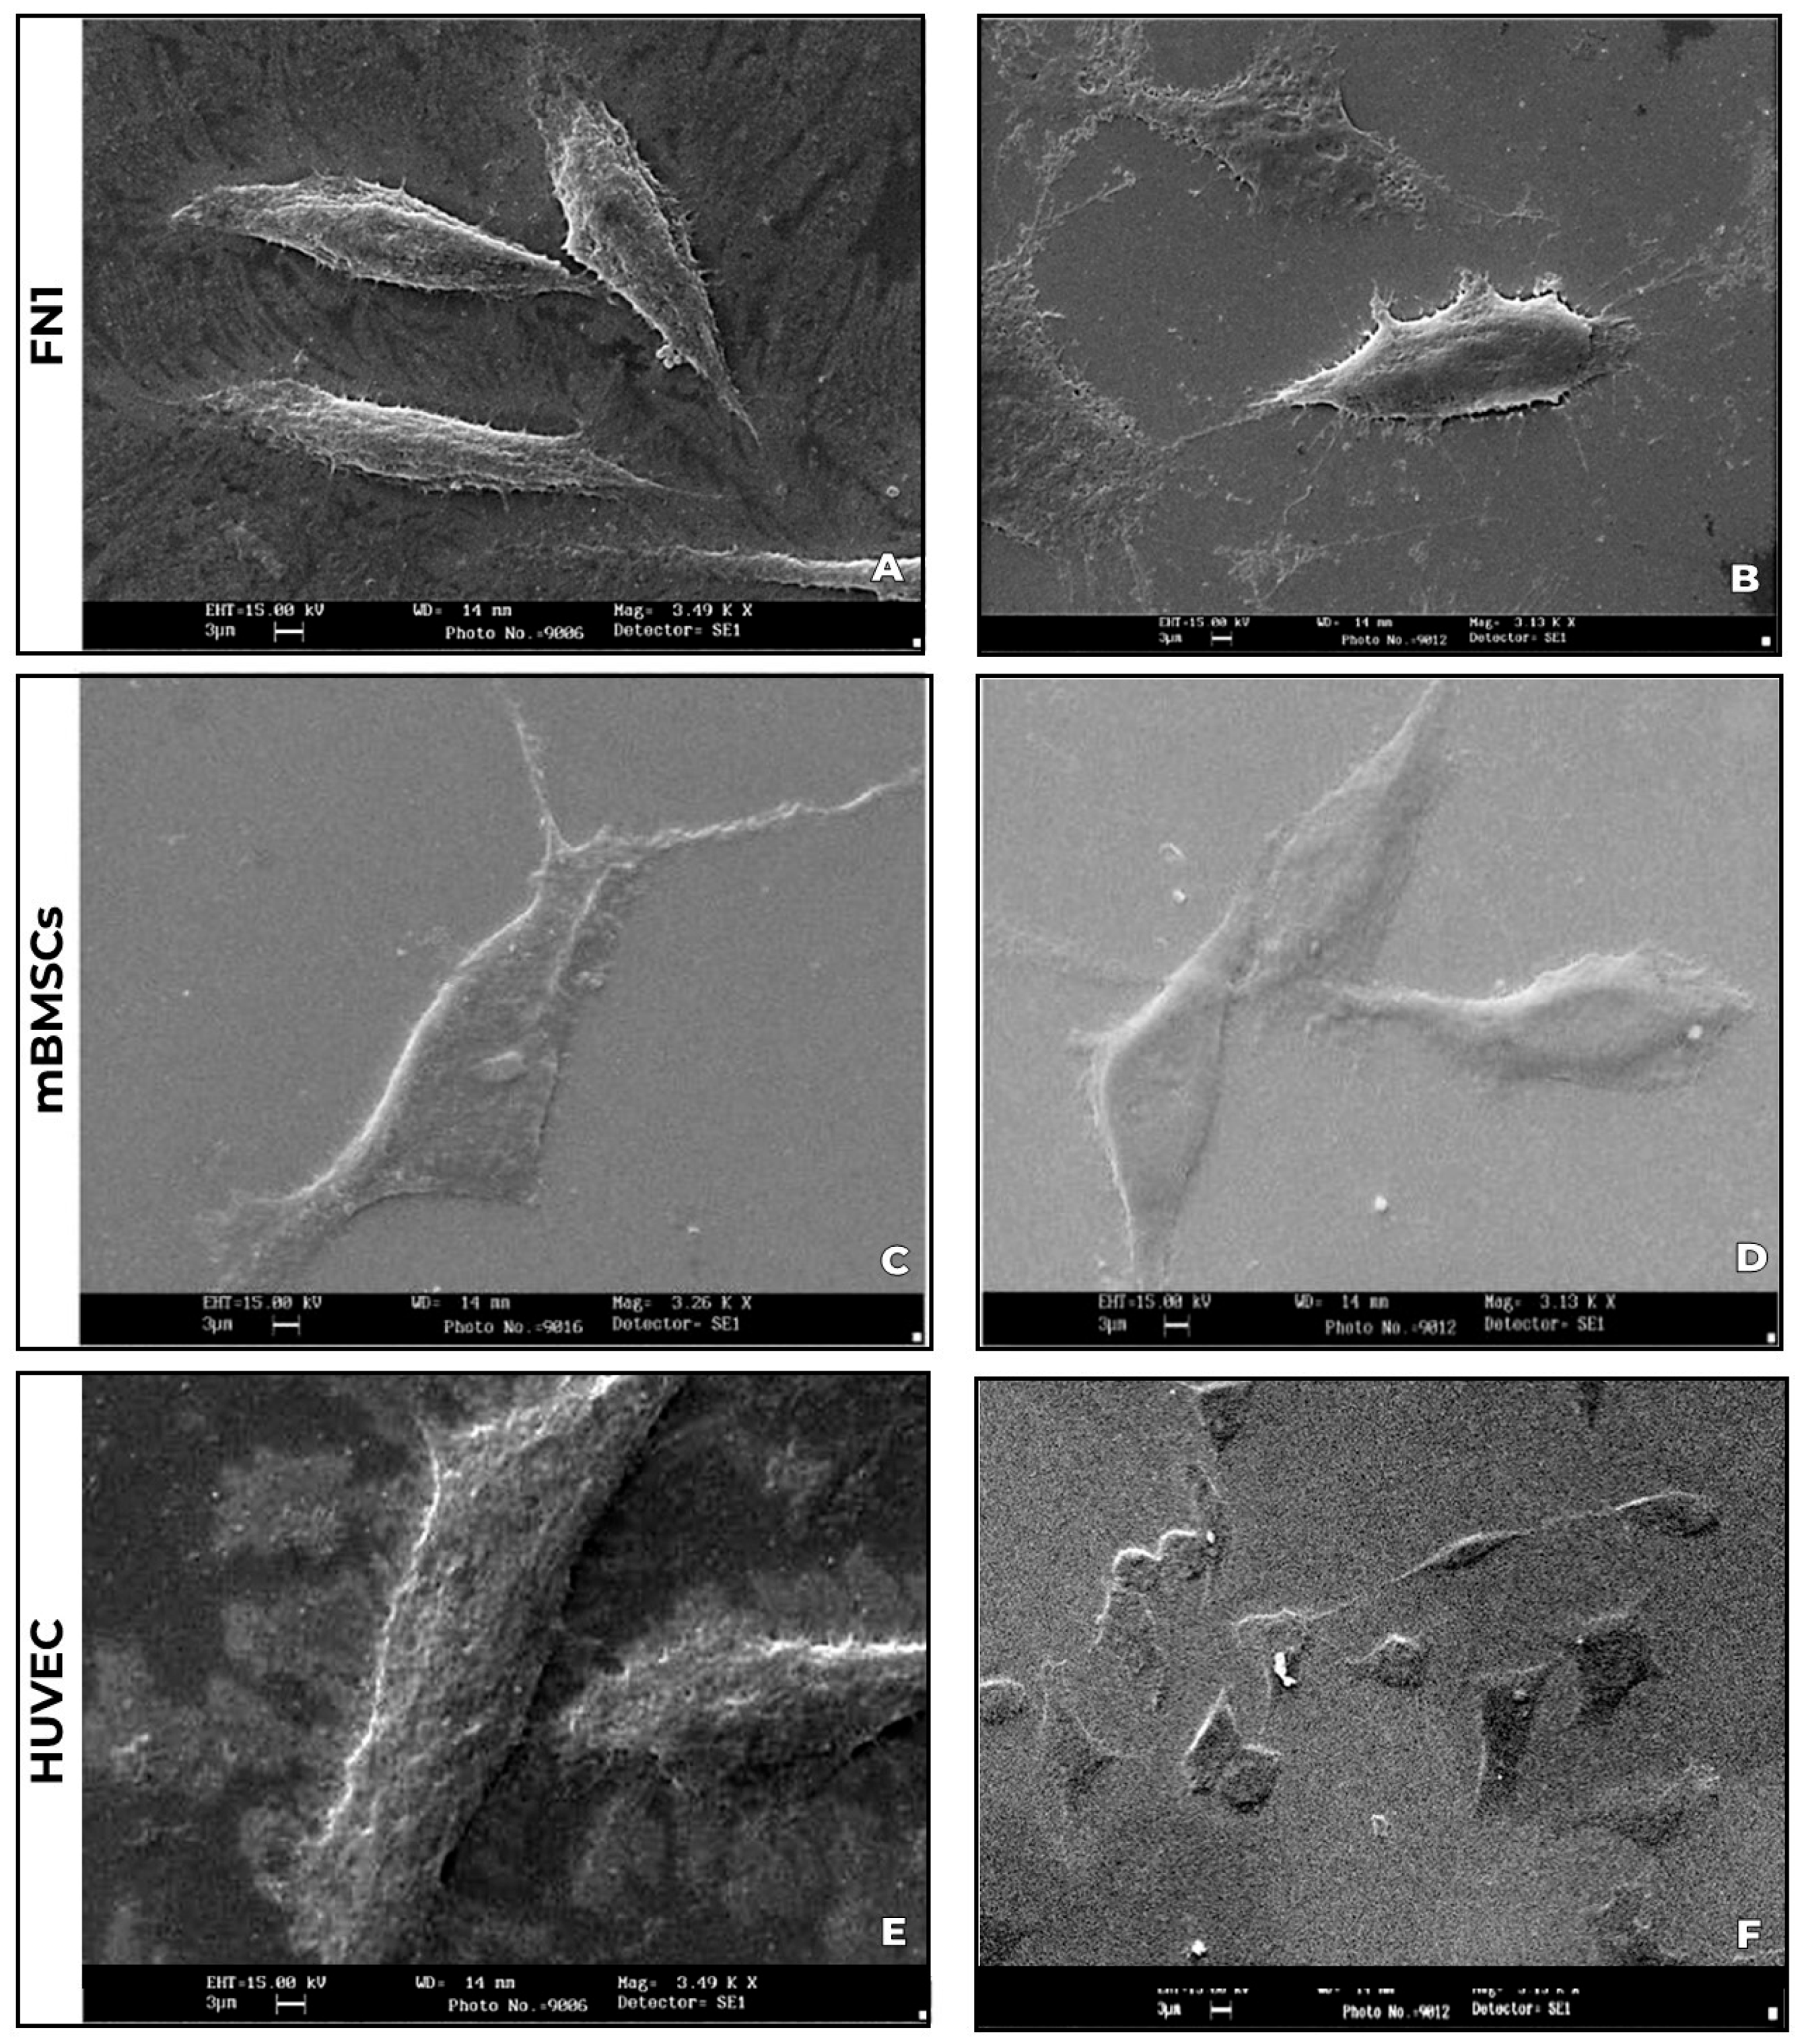
Figure 3.
Cell Cycle Analysis of FN1, mBMSCs, and HUVECs in Response to PLLA-GO Nanocomposite. Comparative bar graphs illustrate the percentage of FN1 (A), mBMSCs (C), and HUVECs (E) cells in the G0/G1, S, and G2/M phases for both control and PLLA-GO groups. For FN1 and mBMSCs cells, the presence of the nanocomposite induced a significant increase in the proportion of cells in the G0/G1 phase and a decrease in the S phase (p≤0.05). In contrast, HUVEC cells showed no significant alterations in cell cycle phases (p≥0.05). Error bars represent the standard deviation. Asterisks (**) indicate statistically significant differences (p≤0.05). Representative histograms of DNA content for FN1 (B), mBMSCs (D), and HUVECs (F) from both control and PLLA-GO groups are also presented. The peaks in these histograms correspond to the different cell cycle phases. In the control groups of FN1 and mBMSCs, the main peak is located in the S phase region. Conversely, in the PLLA-GO group, the main peak shifts to the G0/G1 phase region. For HUVECs, the main peak remains in the G0/G1 region in both groups.
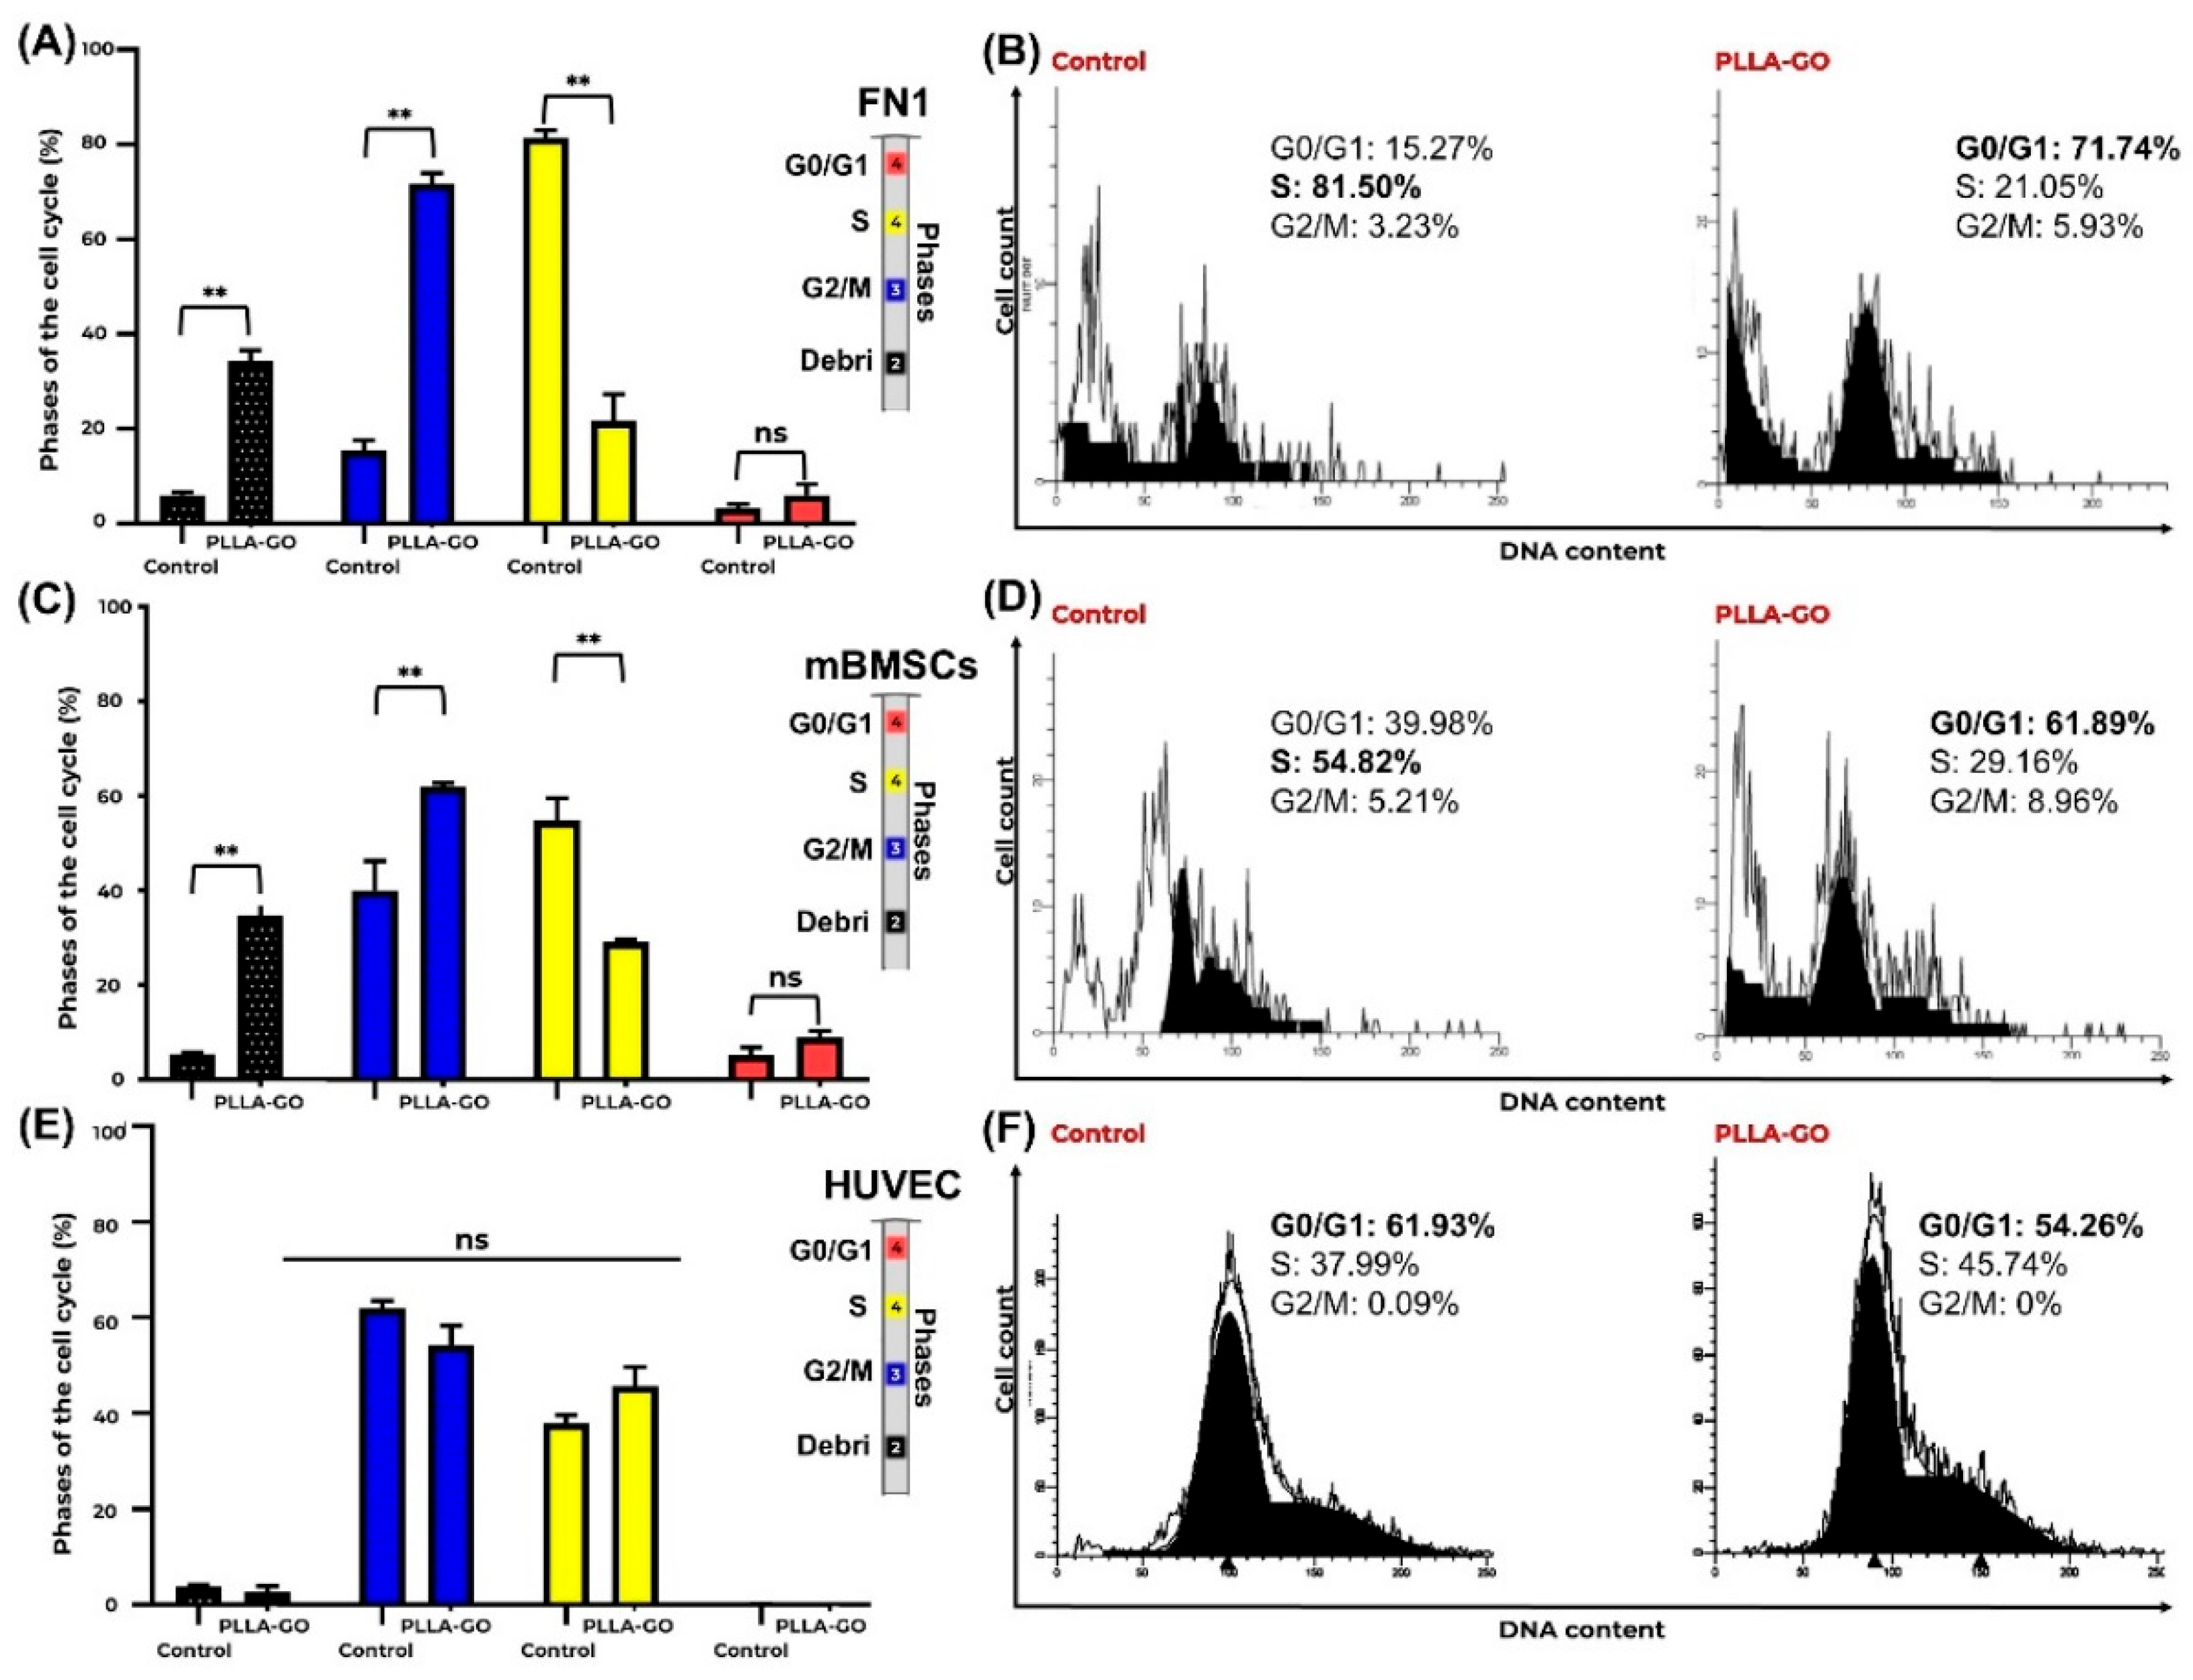
Figure 4.
Proliferation Analysis of FN1, mBMSCs, and HUVECs by CFSE. Generation Tracking Comparative bar graphs show the percentage of FN1 (A), mBMSCs (C), and HUVECs (E) cells across different generations (FN1: 2nd-4th; mBMSCs: 2nd-4th; HUVECs: 2nd-10th) in both control and PLLA-GO groups. For FN1, there was no significant difference between the groups in any of the analyzed generations (p≥0.05) (A). In mBMSCs, a significant increase in the percentage of cells in the 2nd generation was observed in the PLLA-GO group (p≤0.05), with no significant differences in other generations (B). For HUVECs, the PLLA-GO group showed significant differences in the percentage of cells across various generations, including a decrease in initial generations and an accumulation in more advanced generations, with the absence of the 7th generation (p≤0.05) (E). The cellular proliferation index for FN1 (B), mBMSCs (D), and HUVECs (E) in control and PLLA-GO groups was also assessed. There was no significant difference in the proliferation index for FN1 and mBMSCs between the groups (p≥0.05) (B, D). However, HUVECs exposed to PLLA-GO presented a significant decrease in the cellular proliferation index (p≤0.05) (F). Error bars represent the standard deviation. "ns" indicates no statistically significant difference (p≥0.05), and asterisks (**) indicate statistically significant differences (p≤0.05).
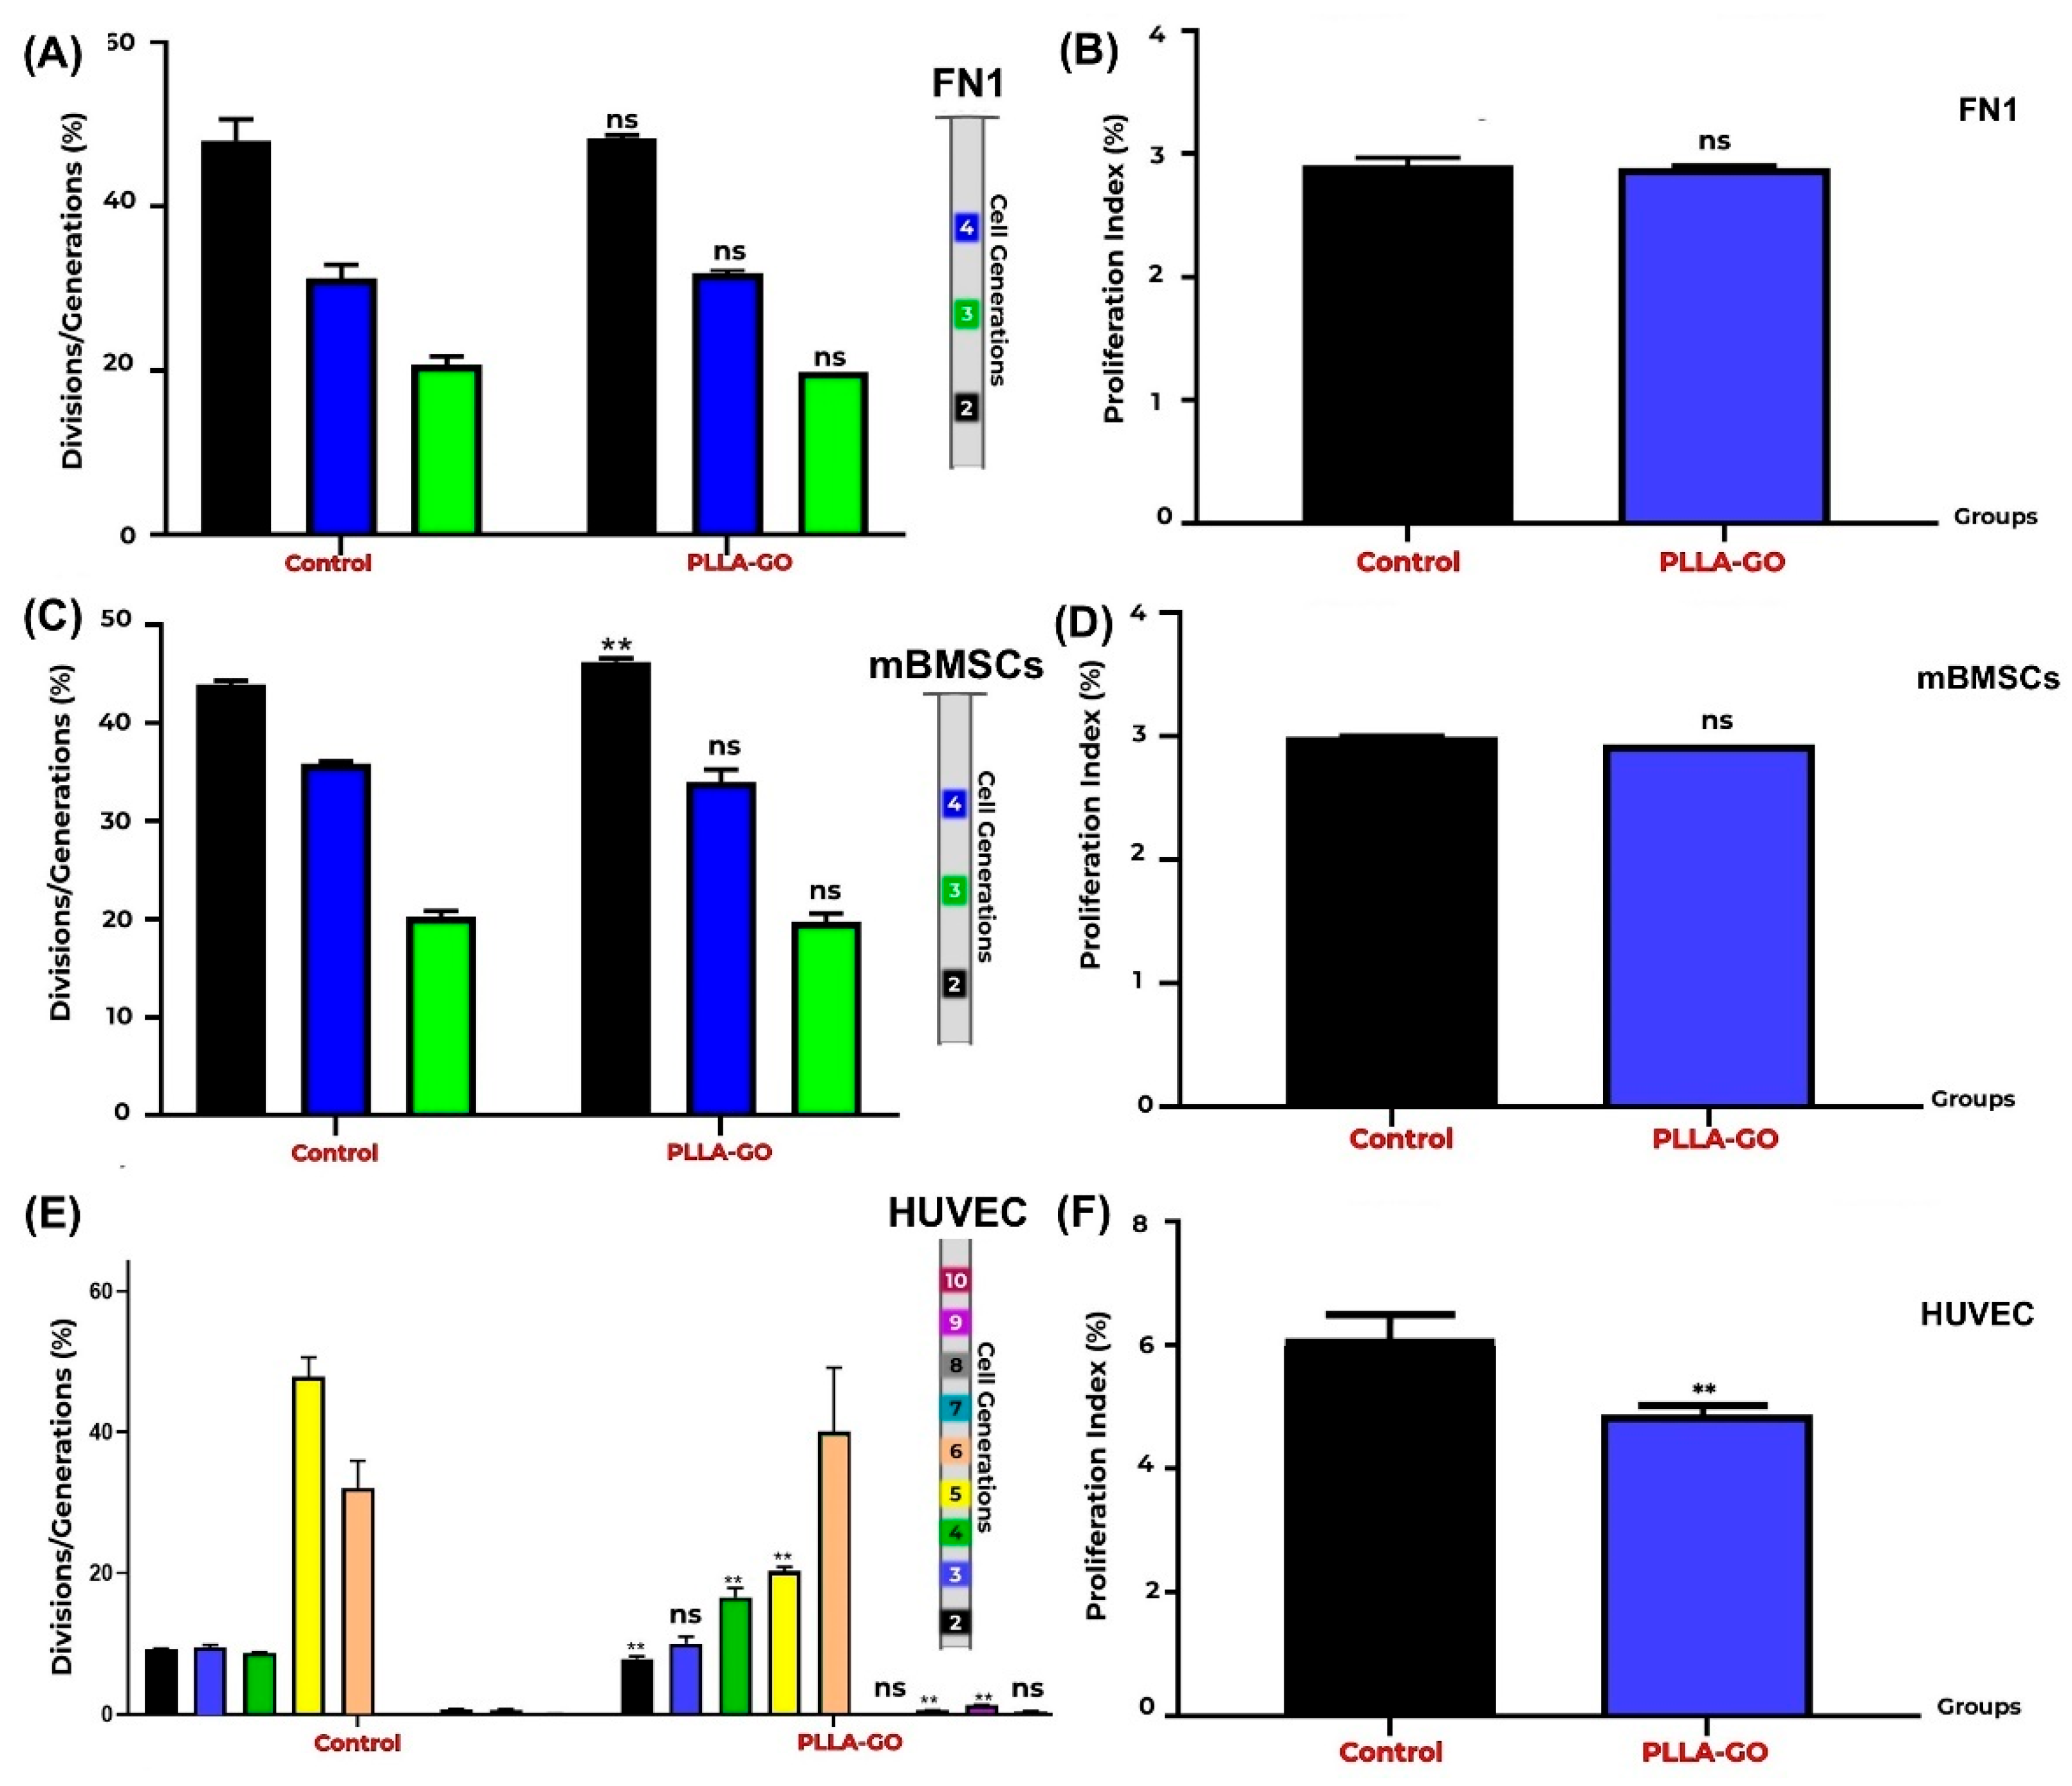
Figure 5.
Analysis of Mitochondrial Electrochemical Potential (ΔΨm) in FN1, mBMSCs, and HUVECs in Response to PLLA-GO Nanocomposite. Comparative bar graphs illustrate the percentage of cells with active and inactive mitochondrial potential in control and PLLA-GO groups for FN1 (A), mBMSCs (C), and HUVECs (E). FN1 and mBMSCs cells predominantly maintained an active ΔΨm in both control and PLLA-GO groups, with no statistically significant differences (p≥0.05). In contrast, HUVECs exposed to PLLA-GO showed a significant reduction in the percentage of cells with active mitochondrial potential and a substantial increase in cells with inactive potential (p≤0.05). Representative histograms of FITC dye fluorescence intensity (FI) indicate the distribution of cells with active and inactive mitochondrial potential in control and PLLA-GO groups for FN1 (B), mBMSCs (D), and HUVECs (F). Region M1 represents cells with active mitochondrial potential (high fluorescence, indicative of polarized mitochondria), while region M2 corresponds to cells with inactive mitochondrial potential (low fluorescence, reduced ΔΨm). The histograms demonstrate the maintenance of active potential for FN1 and mBMSCs, and a clear transition to the inactive state in HUVECs with PLLA-GO.
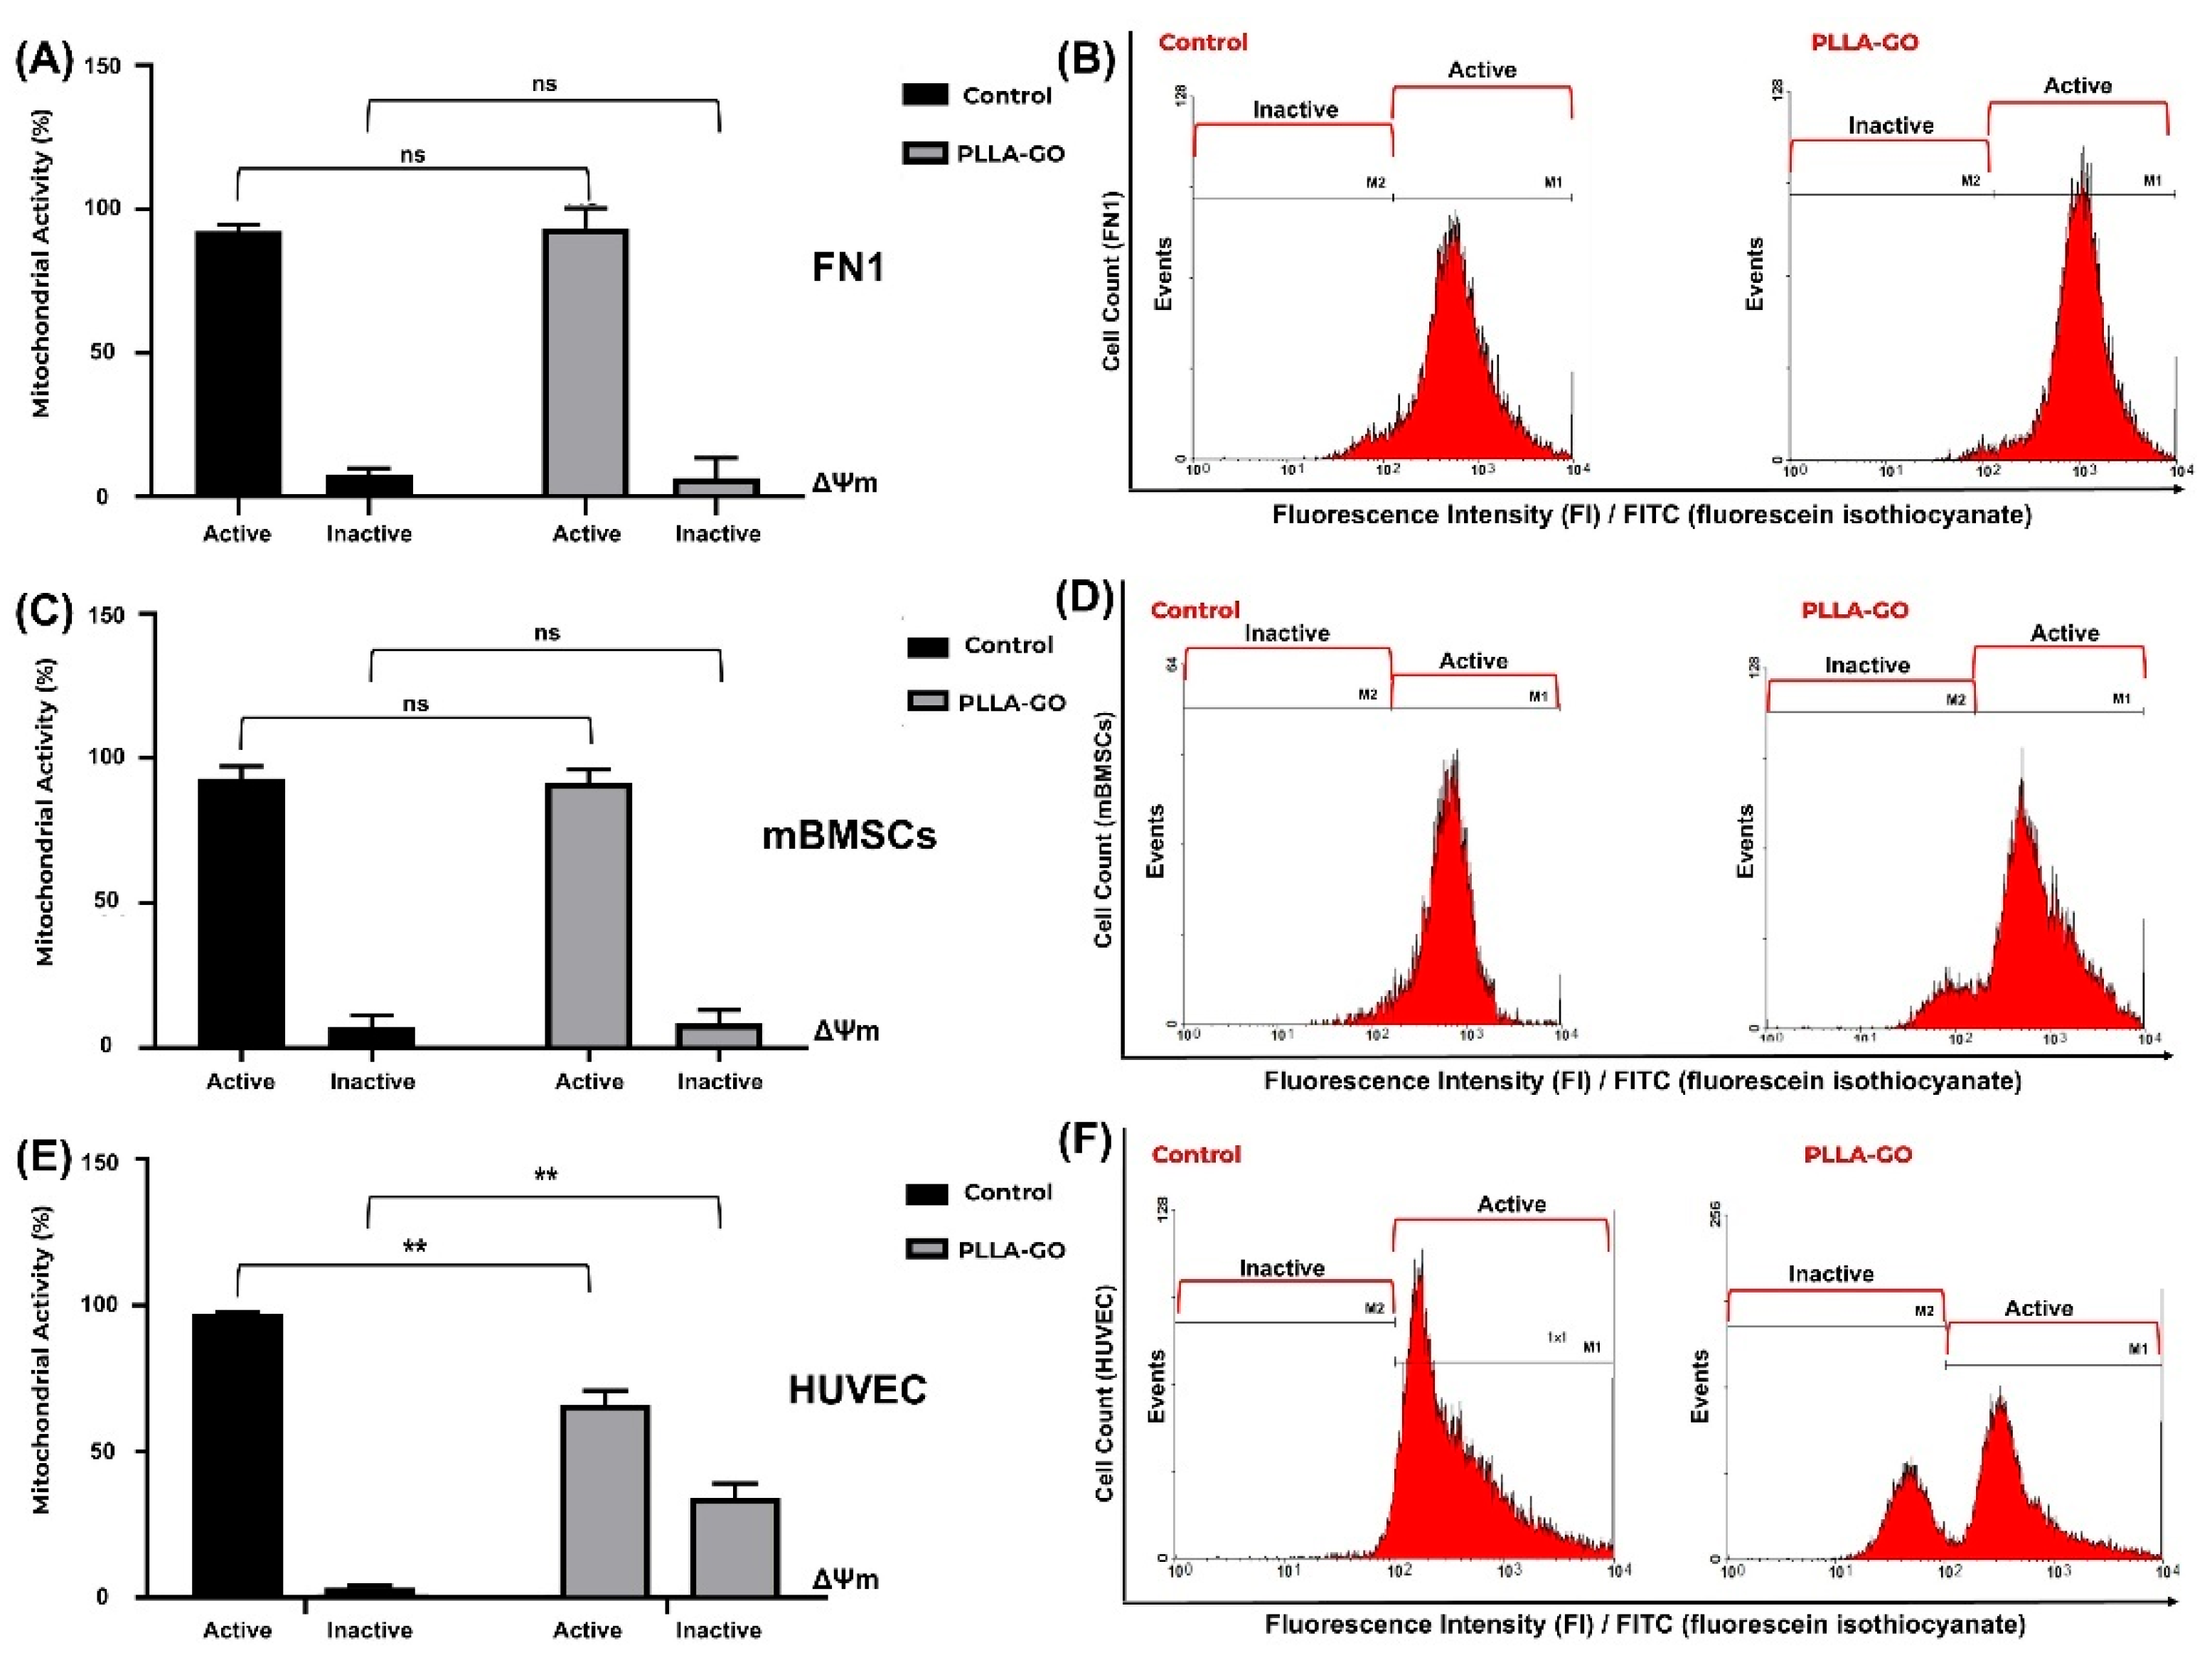
Figure 6.
Analysis of inflammatory cytokine levels in fn1, mbmscs, and huvec cells after plla-go exposurethe bars represent the mean concentration (± standard deviation) of different cytokines (IL-12p70, IL-10, IL-8, 1L-1β, IFN-γ and MCP-1) in picograms per milliliter (pg/ml) for the control group (black bars) and the plla-go-exposed group (gray bars) in each cell line. Statistical significance was determined by appropriate tests, and significant differences are indicated by asterisks: ** (p≤0.05). "ns" indicates a non-significant difference (p≥0.05).
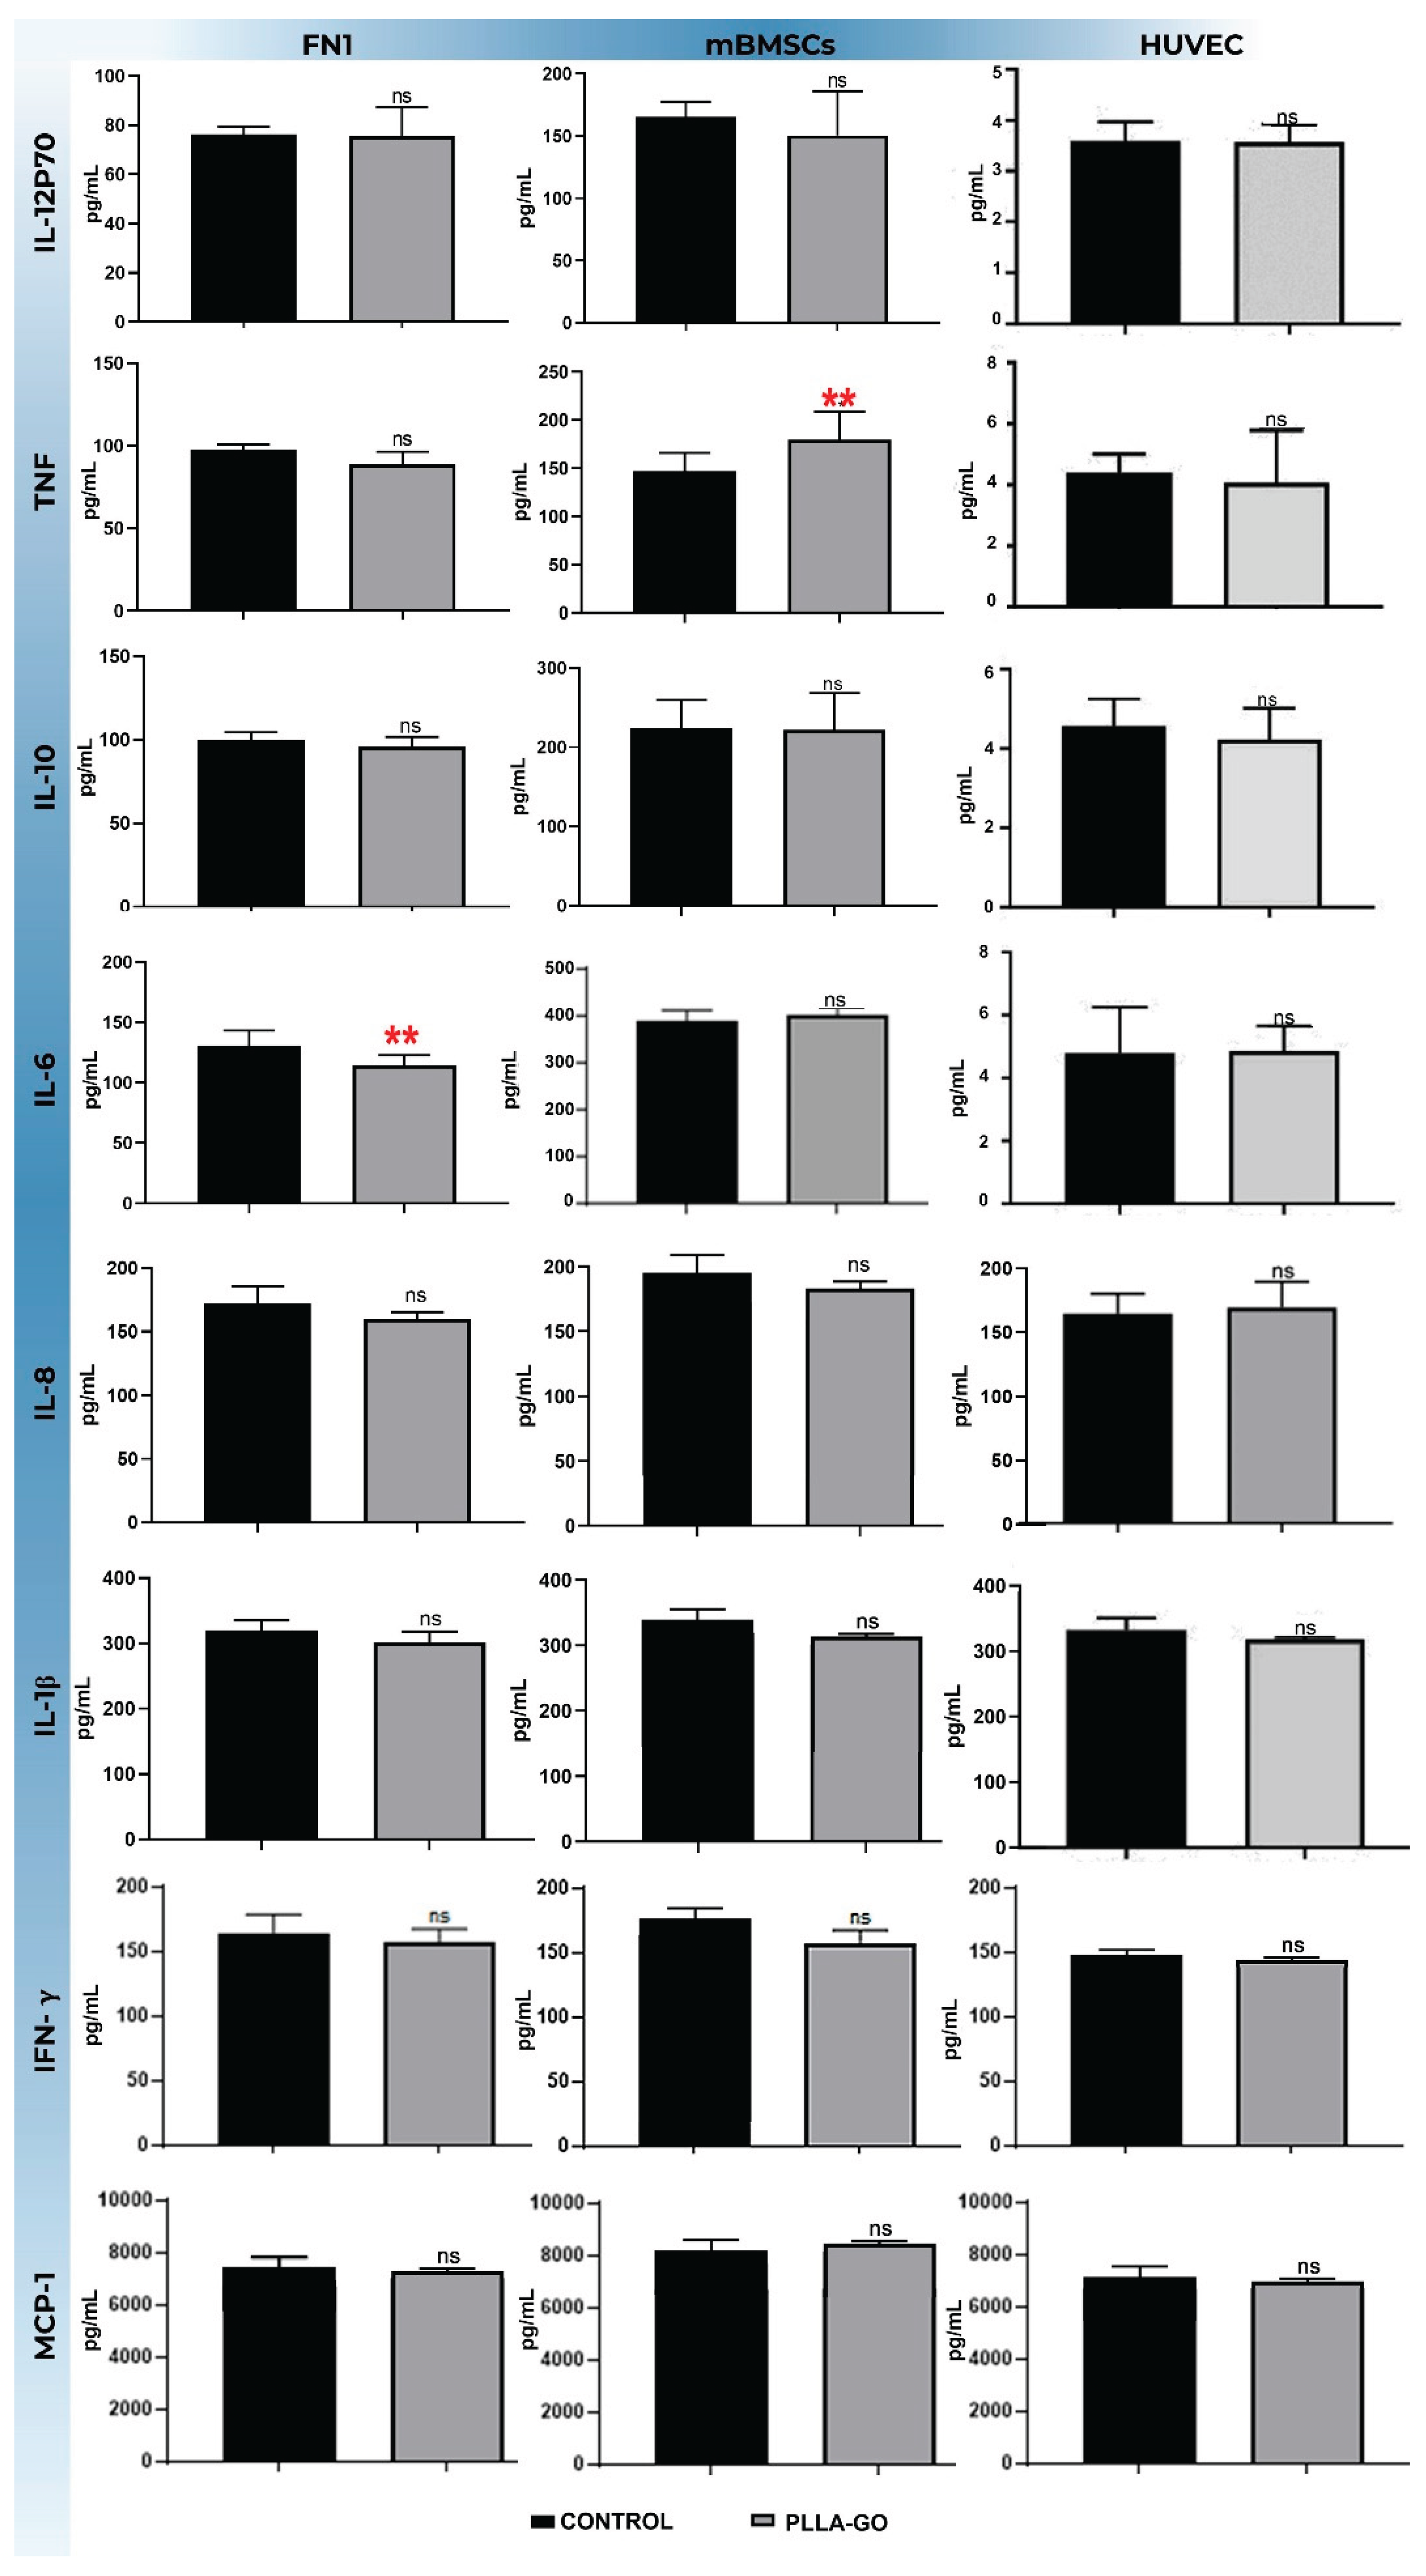
Table 2.
Cell Cycle Distribution in Different Cell Lines After PLLA-GO Exposure.
| Cell cycle (phase) | FN1 vs. control (%) |
mBMSCs vs. control (%) |
HUVEC vs. control (%) |
| Debris | ↑ (34.38 vs. 5.93; p=0.03) | ↑ (34.73 vs. 5.40; p=0.005) | ↔ (2.8 vs. 3.8; p=0,34) |
| G0/G1 | ↑ (71.74 vs. 15.27; p=0.02) | ↑ (61.89 vs. 39.98; p=0.039) | ↔ (54.26 vs. 61.93; p=0.13) |
| S | ↓ (21.58 vs. 81.50; p=0.005) | ↓ (29.16 vs. 54.82; p=0.017) | ↔ (45.74vs. 37.99; p=0.13) |
| G2/M | ↔ (5.93 vs. 3.23; p=0.28) | ↔ (8.96 vs. 5.21; p=0.12) | ↔ (0 vs. 0.09; p=0.08) |
Legenda: ↑: Aumento significativo (p≤0,05). ↓: Redução significativa (p≤0,05). ↔: Sem alteração significativa (p≥0,05). Valores expressos como média percentual.
Table 3.
Concentration of mediators across generations in different cell lines after PLLA-GO exposure.
Table 3.
Concentration of mediators across generations in different cell lines after PLLA-GO exposure.
| Generations | FN1 vs. control (pg/mL) | mBMSCs vs. control (pg/mL) | HUVEC vs. control (pg/mL) |
| 2 | ↔ (48.30 vs. 48.01; p=0.89) | ↑(46.26 vs. 43.95; p=0.003); Δ+4.99% | ↓(7.8 vs. 9.24; p=0.0005); Δ-18.46% |
| 3 | ↔ (31.88 vs. 31.28; p=0.61) | ↔ (34.03 vs. 36.34; p=0.34) |
↔ (9.89 vs. 9.41; p=0.16) |
| 4 | ↔ (19.83 vs. 20.72; p=0.42) | ↔ (19.71 vs. 20.21; p=0.72) | ↑(16.53 vs. 8.61; p=0.005); Δ+ 47.91% |
| 5 | N.A | N.A | ↓(20.28 vs. 47.87; p=0.003); Δ-136.05% |
| 6 | N.A | N.A | ↔ (35.13 vs. 32.05; p=0.95) |
| 7 | N.A | N.A | N.D. |
| 8 | N.A | N.A | ↔ (0.61 vs. 0.75; p=0.65) |
| 9 | N.A | N.A | ↔ (1.33 vs. 0.62; p=0.23) |
| 10 | N.A | N.A | ↓(19.83 vs. 20.72; p<0.0001);Δ- 4.49% |
Legend: ↑: Significant increase (p≤0,05). ↓: Significant reduction (p≤0,05). ↔: No significant change (p≥0,05). Δ+: Percentage increase relative to control. Δ-: Percentage reduction relative to control. Values are expressed as mean. N.D.: Not detectable. N.A.: Not applicable.
Table 4.
Changes in mitochondrial electrical potential induced by plla-go in different cell lines.
| ΔΨ | FN1 vs. control (%) | mBMSCs vs. control (%) | HUVEC vs. control (%) |
| Active cells | ↔ (88.58 vs. 90.76) | ↔ (91.6 vs. 93.03) | ↓ (65.82 vs. 97.07); Δ-32.19% |
| Inactive cells | ↔ (11.56 vs. 9.32) | ↔ (8.42 vs. 7.03) | ↑ (34.24 vs. 3.04); Δ+1026.32% |
Legend: ↑: Significant increase (p≤0,05). ↓: Significant reduction (p≤0,05). ↔: No significant change (p≥0,05). Δ+: Percentage increase relative to control. Δ-: Percentage reduction relative to control. Values are expressed as the mean.
Table 5.
Modulation of inflammatory cytokine concentration induced by plla-go in different cell lines.
Table 5.
Modulation of inflammatory cytokine concentration induced by plla-go in different cell lines.
| Citokines | FN1 vs. control (pg/mL) | mBMSCs vs. control (pg/mL) | HUVEC vs. control (pg/mL) |
| IL-12p70 | ↔ (73.14 vs. 76.33; p=0.68) | ↔ (150.52 vs. 165.43; p=0.39) | ↔ (73.13 vs. 76.33; p=0.68) |
| TNF-α | ↔ (89.11 vs. 97.63; p=0.052 ) | ↑(179.67vs. 147.68; p=0.03); Δ+21.66% | ↓ (89.11 vs. 97.63; p=0.05); Δ- 8.73% |
| IL-10 | ↔ (96.21 vs. 99.75; p=0.39) | ↔ (221.52 vs. 224.36; p=0.71) | ↔ (96.21 vs. 99.76; p=0.39) |
| IL-6 | ↓(114.67 vs. 130.10; p=0.019); Δ-1.86% | ↔ (402.57 vs. 388.37; p=0.62) | ↓(114.67vs. 131.00;p=0.02); Δ-12.47% |
| IL-8 | ↔ (150.00 vs. 155.20; p=0.42) | ↔ (185.20 vs. 190.50; p=0.55) | ↔ (165.00 vs. 170.10; p=0.38) |
| 1L-1β | ↔ (301.40 vs. 319.25; p=0.34) | ↔ (330.10 vs. 335.70; p=0.60) | ↔ (310.00 vs. 315.30; p=0.47) |
| IFN- γ | ↔ (155.00 vs. 158.50; p=0.68) | ↔ (157.62 vs. 164.72; p=0.1) | ↔ (148.70 vs. 150.10; p=0.82) |
| MCP-1 | ↔ (7.500 vs. 7.700; p=0.52) | ↔ (8.675. vs. 8.076; p=0.23) | ↔ (7.050 vs. 7.200; p=0.70) |
Legenda: ↑: Significant increase (p≤0,05). ↓: Significant reduction (p≤0,05). ↔: No significant change (p ≥ 0,05). Δ+: Percentage increase relative to control. Δ-: Percentage reduction relative to control. Values are expressed as mean. N.A.: Not analyzed.
Disclaimer/Publisher’s Note: The statements, opinions and data contained in all publications are solely those of the individual author(s) and contributor(s) and not of MDPI and/or the editor(s). MDPI and/or the editor(s) disclaim responsibility for any injury to people or property resulting from any ideas, methods, instructions or products referred to in the content. |
© 2025 by the authors. Licensee MDPI, Basel, Switzerland. This article is an open access article distributed under the terms and conditions of the Creative Commons Attribution (CC BY) license (https://creativecommons.org/licenses/by/4.0/).
Copyright: This open access article is published under a Creative Commons CC BY 4.0 license, which permit the free download, distribution, and reuse, provided that the author and preprint are cited in any reuse.


