
Submitted:
03 June 2025
Posted:
05 June 2025
You are already at the latest version
Abstract
The paper focuses on the experimental investigation of the impact of filtration and tribological parameters on the reliability, service life, and functional characteristics of gear mechanisms used in robotics. The primary objective was to analyze the importance of lubricant cleanliness in robotic transmission modules and to assess the effectiveness of filtration as a preventive and protective measure. As part of the research, a dedicated test rig was designed and developed. Based on the measurements and analyses performed, a significant correlation was confirmed between lubricant contamination levels and degradation phenomena in transmission modules. The study also highlights a sharp increase in contamination during the initial hours of operation, emphasizing the need for early intervention and continuous monitoring. The findings have strong practical potential and are highly relevant for manufacturers of robotic systems, maintenance service providers, and operators of automated production lines. The results contribute to increased system reliability and extended service life, reduced maintenance and repair costs, and improved environmental aspects of robotic system maintenance.
Keywords:
diagnostics
; tribology
; filtration
; maintenance
; robotics
; transmission systems
1. Introduction
The concept of reliability encompasses the strategy, methodology, and planning that guide the actions necessary to optimise the performance of production systems. The primary objective is to guarantee that robotic equipment performs its intended function without failure, within the stipulated timeframe and with the requisite precision. A comprehensive reliability approach integrates all these initiatives into a unified, systematic framework.
The reliability and service life of gear mechanisms or transmission systems used in advanced applications depend not only on their design, precision manufacturing, and appropriate dimensioning according to operational and load conditions, but also on the application of tribological and tribodiagnostic knowledge.
The importance of lubrication and oil care is reflected in various ways in practical applications. It is certainly easier to check the oil level in the reservoir and top it up if necessary, or to visually monitor for potential lubricant leaks while walking through the production hall, than to later investigate the causes of increased vibrations due to high contamination of the lubrication system—or, even worse, to deal with serious damage to the production equipment.
This issue is addressed from multiple perspectives. The article [1] presents a systematic review of vibration-based condition monitoring in rotating machinery, with a focus on the methodologies used in the key phases of automatic fault diagnosis, including signal measurement, pre-processing, processing, feature selection, and fault diagnosis. It explores the application of vibration monitoring across various mechanical systems and components, highlighting the main techniques used in each diagnostic phase. The review analyzes the effectiveness of different signal processing, feature selection, and diagnostic methods, with an emphasis on their impact based on the specific aspects studied. The findings provide insights into current research trends and innovations in vibration-based diagnostics, offering valuable directions for future developments in the field.
The impact of oil type on vibration characteristics—particularly the influence of oil viscosity and pressure on vibration levels in pumps and rotating machinery—plays a crucial role in system performance and reliability. Key oil properties, such as viscosity, significantly affect both average vibration values and the dynamics of peak-to-peak acceleration. Additionally, the physicochemical composition of various oils, including engine, hydraulic, and gear oils, contributes to cavitation behavior and vibration response. These factors are especially important in the context of optimizing and the design of more equipment. The article [2] is devoted to a systematic study and detailed analysis of these aspects.
The study [3] is devoted to the development of a test rig for monitoring the impact of various operating conditions—such as shaft load, shaft speed, lubrication level, and abrasive contamination—on bevel gear mechanisms over different operating hours. The results demonstrate that combining sound and vibration monitoring provides a reliable approach for diagnosing fault conditions in bevel gears.
Gear misalignment is a critical factor contributing to gearbox failure, leading to increased wear and oil degradation. Real-time monitoring using a combination of sensors enables the detection of misalignment effects through changes in lubricant condition and wear particle generation. The development and implementation of an online diagnostic system integrating these aspects is the focus of the study [4].
A newly developed compound diagnostic system, integrating a compound sensor and signal processor, enables simultaneous monitoring of vibration acceleration and acoustic emission for rolling contact fatigue in grease-lubricated ball bearings is in [5]. Diagnostic features such as RMS, mean, variance, skewness, and kurtosis are extracted to evaluate bearing condition, with RMS of vibration acceleration proving most effective. This study demonstrates the system’s effectiveness in detecting early fatigue failure in rolling bearings under lubrication conditions.
Insufficient lubrication of gearboxes in industrial motors shortens their lifespan and can lead to catastrophic failures and losses. The paper [6] proposed diagnosing the lack of lubrication in gear oil systems using motor current signature analysis (MCSA). This study proposed, investigated, and experimentally validated two new technologies for diagnosing inadequate lubrication in gearmotor systems based on MCSA.
Gearboxes are critical components in various industrial applications, where gear wear over time can lead to significant failures and unexpected downtime. Vibration analysis is commonly used to monitor and diagnose gear wear, but its application is limited due to the complexity of vibration characteristics caused by gear wear propagation. The review paper [7] summarizes the progress in vibration-based gear wear monitoring, exploring the relationship between gear surface features and vibration characteristics, and offering recommendations for future research in this field to improve predictive maintenance and remaining useful life predictions.
The use of artificial intelligence in fault diagnosis is the subject of a [8]. In this work, an attempt was made to systematically review the progress of machine learning theories in fault diagnosis from zero to future perspectives.
The [9] focuses on vibration monitoring in rotating machinery, enabling effective diagnostics through specific patterns in vibration signals. A systematic analysis of various methodologies for signal measurement, preprocessing, feature selection, and fault diagnosis highlights the latest research trends and innovations in this field, offering recommendations for future studies.
The [10] investigates the structure design and technology of a centralized lubrication system with a distributed structure, addressing the shortcomings of traditional systems such as poor generality and low measurement precision. It proposes reliable digital detection methods for oil pressure, flow, and temperature, significantly improving lubrication performance when applied in industrial settings.
Paper [11] deals with problems with intelligent lubrication systems for construction machinery and creates a performance evaluation system for intelligent lubrication systems for construction machinery by analyzing and selecting appropriate evaluation indices.
In the paper [12], a computer program was developed for the analysis of engine lubrication systems, providing mathematical models of oil flow through a hydraulic tappet, as well as models of oil flow and plain bearings.
Proper maintenance of industrial robots is closely linked to their lifespan. How can you ensure that your industrial robots “live” as long as possible? First and foremost, we focus on the most common faults or symptoms observed in robotic systems, such as leakage in gear mechanisms, increased vibrations, positioning errors, irregular movement, oscillations, noise, and robot malfunctions.
In technical practice, we often encounter the need to address various operational issues, with our attention typically focusing on system errors, software malfunctions, or deficiencies in control processes. However, we rarely give enough attention to fundamental elements such as the condition of the lubricant, specifically its cleanliness, quality, or suitability for the specific application. The aforementioned faults and negative symptoms are often a result of malfunctioning, improper, or insufficient lubrication. The degradation of the lubricant due to an increased presence of mechanical contaminants leads to failures in the lubrication system and the emergency shutdown of the robot. These parameters can significantly impact the reliability and lifespan of technical equipment.
The paper focuses on experimental research investigating the impact of filtration and tribological parameters on the reliability, lifespan, and functional performance of transmission systems used in robotics. Based on these findings, progressive approaches to the maintenance of manufacturing equipment, including robots and other handling devices, are developed, enabling the rational application of analysis results for flawless operation and reliability of the equipment.
2. Materials and Methods
The issue was investigated on a newly developed test rig, whose main purpose was to monitor the condition of gear reducers online and assess the impact of filtration on the functional characteristics of robots.
2.1. Optimization of Robot Operation and Maintenance Using Tribodiagnostic Methods
Tribotechnical diagnostics is a method of technical diagnostics focused on analyzing lubrication systems as a non-destructive technique [13,14]. This method utilizes information about the condition of the equipment, specifically the robot, and changes in frictional nodes based on lubricant analysis. The goal of tribotechnical diagnostics is to determine the current state of the lubrication system and identify the presence of foreign substances in the lubricant. Proper interpretation of analytical results enables early detection of potential faults and localization of the damage origin.
When moving solid surfaces come into contact, friction occurs, which can lead to undesirable consequences such as energy losses and mechanical wear of materials [15,16]. This process generates heat, contributing to further wear due to the increased temperature. The change in material structure subsequently results in reduced resistance to loading and loss of surface layers at the contact areas.
The main purpose of lubrication is to separate moving surfaces using a lubricant layer with optimal shear properties [17]. The addition of additives to the lubricant helps optimize friction and improve lubrication performance. In practice, it is essential to correctly determine the type of lubricant, its quantity, and specific application, considering both economic efficiency and operating conditions.
To address this issue, an algorithm has been designed (Figure 1) for monitoring the condition of gear reducers and the impact of filtration on the functional characteristics of robots.
2.2. Transmission System
Industrial robots play a key role in automated manufacturing processes, performing a wide range of tasks – from material handling to assembly operations and precise machining [18]. A fundamental component of their design are robotic arms, which execute the required movements in space using powerful actuators combined with gear mechanisms. These gear systems, most commonly harmonic or planetary, ensure the conversion of speed and torque, enabling precise, smooth, and repeatable movements of end-effectors. Additionally, they contribute to increased mechanical efficiency and controlled motion dynamics, which are crucial for achieving high accuracy and reliability in robotic systems under demanding operating conditions. Proper selection and maintenance of these gear systems are therefore critical factors for the long-term functionality and performance of industrial robots.
Therefore, attention has been focused primarily on the most commonly used types of gear mechanisms, specifically the high-precision gearbox, which is based on a new reduction mechanism.
Figure 2 shows the gear mechanism used in addressing the given issue, which represents a gear reducer for power transmission, integrating highly precise trochoidal gears and a radial-axial bearing into a single compact unit.
This type of gear mechanism was chosen for the following reasons:
- Backlash-free motion: Due to minimal backlash, the movements are precise and repeatable, which is essential for accurate operations in robotics.
- High rigidity and durability: The combination of a robust bearing and reducer allows the transmission of high torques while maintaining stability and resistance to shocks, which is critical for applications such as exoskeletons or robotic arms.
- Compact and lightweight solution: The compact size and low weight are advantageous for mobile robotic systems, where every gram counts.
- Versatile use in various fields such as robotics, automation, engineering, navigation systems, industrial applications, and more.
2.3. Construction Proposal of the Measurement Test Rig
For the implementation of the load test rig, a prototype design was developed from a structural perspective, which assumes the placement of four independent functional units on a common base structure (Figure 3). The arrangement of the individual units was designed to ensure their independent operation while guaranteeing maximum operator safety during the monitoring of the correct cycle of activities in the gear reducer operations.
The goal was to design the structure of a testing device that enables the measurement of multiple static and dynamic characteristics through a single combined measurement station. The design was conceived to minimize the risk of result distortion caused by the versatility of the used measurement system. This was reflected in the selection of appropriate types of measurement sensors, as well as data collection and evaluation units, with an emphasis on their scalability for future expansion or changes in the measured parameters.
The proposed design also allows for the testing of various sizes and types of gear reducers used in robotic drives. Sufficient system rigidity was considered to eliminate undesirable influences on measurement accuracy. The design solution provides flexibility for testing gear reducers from different manufacturers, differing in both external geometry and internal configuration.
2.4. Verification of the Proposed Multi-Purpose Testing System
The constructed measurement rig (Figure 4) had to be optimized while simultaneously verifying the functionality of the software for the testing equipment.
During the experimental pilot testing, various types of functional tests were conducted, including measurements of key characteristics of gear modules in robotic drives, such as angular transmission error, hysteresis, lost motion, starting torque, and others. The process also included integration tests, system testing, and acceptance testing.
As part of the task, the connectivity verification between hardware components and the central server was also performed to ensure reliable and uninterrupted data transmission during testing. The processing of measured data occurs after each testing sequence, enabling the comparison of current results with previous measurements. The entire testing process was conducted under conditions simulating a real production environment to ensure the highest relevance of the obtained data.
In addition to the main structural frame, which supports four individually mounted units — each consisting of a support bracket, servo motors, a gear module, sensors, and a counterweight — the break-in test stand is also equipped with control elements. These control components form part of the operator interface and are used to configure the necessary parameters required for the correct initiation of the test procedure. Furthermore, the system enables fault reset functionality in the event of errors occurring during operation and includes an emergency stop mechanism to ensure immediate shutdown of the entire test stand in hazardous or abnormal conditions.
2.5. Cleanliness of Working Fluids (Lubricant) Contaminated with Solid Particles
The primary objective is to analyze the quality of the lubricant used in the gear mechanism, with a particular focus on its contamination and overall cleanliness [19]. Maintaining optimal cleanliness of the lubricant is a key factor in extending the service life of components, improving operational efficiency, prolonging oil life, and reducing costs associated with routine maintenance. A clean lubricant — or working fluid with the required moisture content — ensures long-term stable performance of the equipment.
The presence of fine particles in the fluid leads to abrasive wear, whereas larger particles may cause fatigue damage. Contamination of the lubricant with solid particles accelerates its degradation, thereby reducing the overall efficiency and reliability of the system.
To monitor the quantity and size of solid particles in hydraulic fluids, several standards have been established. One such standard is NAS 1638 (National Aerospace Standard), which in recent years has been largely replaced by ISO 4406. A comparison of cleanliness class designations according to these standards is provided in Table 1.
The ISO 4406 standard defines cleanliness codes consisting of three numerical values that categorize the size and distribution of solid particles in the following manner:
- The first number represents the quantity of particles larger than 4 μm per millilitre of fluid;
- The second number represents the quantity of particles larger than 6 μm per millilitre of fluid;
- The third number represents the quantity of particles larger than 14 μm per millilitre of fluid.
The recommended cleanliness classes according to ISO 4406 for individual systems are presented in Table 2.
2.6. The Principle of Sampling Working Lubricants for Contamination Analysis Purposes
In order to obtain relevant information about the condition and quality of the lubricant, it is essential to ensure proper sampling. The validity and accuracy of the tribotechnical analysis results are directly dependent on the quality of the sample collected. A sample can only be obtained by following basic sampling principles, and the sample intended for tribotechnical diagnostics must meet the following requirements:
- The lubricant sample must be taken from a representative part of the robotic system, specifically from each gear mechanism (joint), with the sample being taken from the individual positions on the test rig in this case.
- The lubricant sampling is performed at low speeds of the gear reducer and under operational temperature conditions to ensure sufficient homogeneity of the sample.
- During sampling, it is crucial to prevent contamination of the lubricant by any foreign substances or impurities.
- The sample must always be taken from the same location and in the same manner to ensure repeatability and comparability of the analysis results.
- Care must be taken to maintain the cleanliness of the surrounding area of the sampling point in order to eliminate the risk of secondary contamination of the sample.
Contaminants in the form of mechanical particles or resinous components tend to settle and form sediments. In case of improper sampling procedures, a non-homogeneous sample may be obtained, which does not represent the actual condition of the lubricant in the gear mechanism. For the purposes of our analysis, a portable analytical kit designed for lubricant sampling was used.
3. Results
The results of measurements conducted simultaneously on four gear reducers were analyzed. For the purposes of further analysis and clarity, these reducers will be designated by the symbols G1, G2, G3, and G4.
The measurement and analysis schedule for lubricant contamination was as follows:
- Initial analysis of new (unfiltered) lubricant prior to testing;
- Analysis of lubricant contamination after 1 hour of testing without filtration;
- Analysis of lubricant contamination after 10 hours of testing without filtration;
- Analysis of lubricant contamination after 11 hours of testing and 1 hour of filtration;
- Analysis of lubricant contamination after 4 weeks of testing and 4 hours of filtration;
- Analysis of lubricant contamination after 8 weeks of testing and 8 hours of filtration;
- Analysis of lubricant contamination after 32 weeks of testing and 32 hours of filtration.
3.1. Lubricant Condition Analysis Prior to Test Rig Activation
For the lubrication of all gear modules G1 through G4, the lubricant Castrol Optigear Synthetic 150 ALR was selected. To enable accurate interpretation of contamination analysis during the operation of individual gear modules, the condition of the new lubricant was assessed prior to its first use. The results of this analysis are presented in Figure 5.
3.1. Lubricant Condition Analysis After the First Hour of Gear Module Run-In
In the second phase of the experiment, an analysis was performed on samples taken from individual gear modules (G1 to G4) after one hour of operation during the initial run-in on the test rigs. The elemental contamination analysis of the lubricant in the individual gear modules G1, G2, G3 and G4 is presented in Table 3.
The results of the lubricant condition analysis in gear module G1 after the first hour of run-in are presented in the following Figure 6.
In a similar manner, the results of the analysis were processed for the other gear modules. A comparison of the results according to ISO 4406 for all four gear modules is presented in Table 4.
The evaluation results indicate that the level of contamination of the lubricant is approximately uniform across all gear modules.
3.3. Lubricant Condition Analysis in Gear Module G1
This section presents the processing of the results for determining the lubricant condition, or in other words, the results of the analysis for determining the cleanliness class according to ISO 4406 for the first gear module, labeled G1, based on all seven measurements according to the periodicity described in the introduction to Chapter 3. The results are presented in Table 5. The graphical representation of this analysis is presented in Figure 7.
Table 6 presents the elemental analysis of the lubricant in gearbox module G1, conducted over individual periods of lubricant condition assessment.
The graphical evaluation of elemental lubricant contamination for selected elements is shown in Figure 8.
Based on the lubricant analysis from Gearbox Module G1, a period of 32 weeks since the start of testing and filtration resulted in lubricant cleanliness that is two ISO classes better than that of the fresh oil. According to these results, the initially set filtration interval for this gearbox module proved to be sufficient, and for future tests, the filtration frequency can be adjusted to one hour per month.
3.4. Lubricant Condition Analysis in Gear Module G3
Table 7 and subsequently Figure 9 present the results of the analysis examining the progression of lubricant contamination in Gearbox Module G3 during load bench testing with additional lubricant filtration.
The elemental analysis of the lubricant in Gearbox Module G3 for individual lubricant condition monitoring periods is presented in Table 8 and Figure 10.
Based on the lubricant analysis of the G3 gearbox module, after 32 weeks of testing and filtration, the lubricant cleanliness level was found to be worse than the cleanliness observed after just one hour of load testing. This may be related to a more than 2000% increase in lubricant contamination observed during the initial phase (10 hours) of load testing. Such a significant rise can be attributed to several potential causes.
Particles present in the contaminated lubricant can cause microscopic damage to gear teeth surfaces and bearings, leading to accelerated wear and the potential generation of additional debris. This is further supported by the increased torque observed at the beginning of the test cycle. Microscopic particles increase friction between the bearing and other moving components. This elevated friction results in higher torque required to overcome resistance.
After the implementation of filtration and the removal of contaminant particles from the lubricant, a reduction in torque values was observed. In contrast, the unfiltered gearbox module showed a continued increase in torque values (Figure 11).
Significant wear due to sliding and slippage was also observed, along with the presence of abrasive particles. This indicates improper rolling of the rolling-element bearings, where localized sliding occurs instead of correct rolling motion. Such behavior may also be associated with the increased torque observed in the gearbox module. The presence of these particles was reduced by only approximately 50%.
Significant contamination of the lubricant in the robot’s gear modules can significantly affect the accuracy of the angular transmission, also known as “transmission error” (TE). Angular transmission error (ATE) is the deviation between the actual and ideal angular displacement of the gears. This is reflected in a significant increase in angular transmission error. However, if we compare this with the angular transmission error of a filtered gear module, where it is only a negligible value (Figure 12).
4. Discussion
The implementation of modern approaches to the maintenance and monitoring of technical equipment, including robots and handling mechanisms, contributes to the efficient use of analytical outputs to ensure trouble-free operation and high reliability of equipment.
One of the key aspects of ensuring the operational reliability of robotic systems is the effective filtration of lubricant within the gear modules. This filtration plays a crucial role in eliminating contaminants such as dust particles, metal debris, and other impurities that may be present in the lubricant. Their removal significantly contributes to the protection of gear mechanisms and other moving components from excessive wear or mechanical damage. Maintaining lubricant cleanliness leads to improved lubrication performance, reduces the coefficient of friction, and optimizes surface contact, thereby extending the service life of components such as bearings, gears, and the gear units themselves.
Recent studies, such as that by [23], have demonstrated the effectiveness of advanced electrostatic filtration technologies in improving lubricant quality. In their work, the researchers investigated the use of electrostatic forces to remove solid contaminants from lubricants. Their findings highlighted that electrostatic filtration not only removes fine particles more efficiently but also reduces wear and friction in mechanical systems. This supports the critical role of filtration in maintaining the integrity of gear mechanisms and optimizing the overall performance of robotic systems.
Effective lubricant filtration significantly reduces the likelihood of operational failures and functional malfunctions, thereby minimizing the risk of unplanned downtime and associated repair or component replacement costs. Due to the reduced friction and higher lubricant purity, energy transfer becomes more efficient, leading to improved gear mechanism performance, smoother operation, quicker robot responses, and decreased energy consumption of the entire system.
The reliability of robotic systems is particularly critical in industrial applications that demand high availability and productivity. Implementing filtration technologies directly into maintenance processes contributes to the stability and long-term operability of equipment, especially in environments where robot failure can halt the production process or cause other severe operational impacts. In addition to mechanical filtration, the application of suitable additives to lubricants has also proven effective in enhancing system reliability and reducing component wear. As highlighted by [24], environmentally acceptable lubricant additives can significantly improve tribological performance while simultaneously reducing the ecological footprint of industrial operations. This dual benefit not only strengthens the economic balance of production through extended service intervals and reduced maintenance costs but also supports sustainable engineering practices.
Online monitoring of the tribological parameters of robot gear modules provides a powerful tool for advanced diagnostics and predictive maintenance. It enables real-time detection of abnormalities and early identification of potential faults, allowing operators to take corrective actions before failures occur. Based on the analysis of monitored data, operating parameters can be optimized, robot system efficiency enhanced, and maintenance scheduled proactively. This approach significantly contributes to extended equipment life, reduced failure rates, and minimized costs associated with unplanned service interventions. As demonstrated by [25], the application of condition-based monitoring in high-precision robotic gearboxes effectively supports early fault detection and long-term operational reliability in demanding industrial environments, further validating the importance of integrating online diagnostics into modern maintenance strategies.
Online monitoring can also be part of broader safety strategies, where deviations from normal operation are analyzed to identify potential safety risks. These systems can be implemented either as integrated components of robot control units or as standalone software solutions with remote access and control capabilities.
5. Conclusions
This work focuses on the experimental evaluation of the impact of lubricant filtration and tribological parameters on the reliability, longevity, and functional characteristics of gear mechanisms used in robotics. The results were evaluated using the ISO 4406 standard, which is used to determine the contamination class of lubricating fluids. Based on knowledge from the field of gear reducer and robotic system design, a mobile filtration system was proposed and implemented to test the impact of filtration on the operational characteristics of gearboxes, including the introduction of online monitoring of tribological parameters.
As part of the research, a test station was developed, consisting of load benches simulating cyclic loading of gear units. Thanks to precisely defined measurement parameters, it was possible to analyze and quantify the effect of filtration on the kinematic and performance characteristics of gear mechanisms, creating space for maintenance optimization and the design of effective technical solutions in industrial robotics.
The benefits can be summarized in the following points:
- The research highlights a sharp rise in contamination during initial operation hours, stressing the need for timely intervention to avoid reduced gear module reliability.
- The study confirms that efficient filtration reduces failures, extends gearbox life, and lowers maintenance costs.
- A specialized test station was developed for assessing lubrication strategies, and online monitoring of tribological parameters was introduced to support predictive maintenance.
- The approach promotes environmental responsibility by minimizing waste and offers strong practical value in industries demanding high robotic system reliability.
- The study emphasizes the importance of addressing tribological components from the design phase through operation, supporting system reliability in robotics.
6. Patents
The research presented in this manuscript contributed to the development of patent “Oil-lubricated kinematic module connecting system, mainly the transmission or bearing modules of industrial robot; method of kinematic module lubrication”, Ilečko Ľubomír, 2018 - 2024, PATENT: US11685062B2, CN111712358A; CN111712358B; EP3720668A1; EP3720668B1; EP3720668C0; JP2021505422A; U2020122180A; RU2020122180A3; SK2692017U1; SK8191Y1; US2020298428A1; WO2019111232A1; WO2019111232A4.
Author Contributions
For Conceptualization, S.M. and L.I.; methodology, S.M. and L.I.; software, L.I.; validation, S.M. and L.I.; formal analysis, L.I.; investigation, L.I.; resources, S.M.; writing—original draft preparation, S.M. and T.K.; writing—review and editing, S.M. and T.K.; supervision, L.I. and M.D. All authors have read and agreed to the published version of the manuscript.
Funding
This work was funded by the Ministry of Education, Research, Development and Youth of the Slovak Republic within project KEGA 037TUKE-4/2024, VEGA 1/0573/25 and VEGA 1/0834/25. This research was also supported by the EU NextGenerationEU through the Recovery and Resilience Plan for Slovakia under the project No. 09I03-03-V03-00075.
Institutional Review Board Statement
Not applicable.
Informed Consent Statement
Not applicable.
Data Availability Statement
Data are presented within the article; further inquiries can be directed to the corresponding author.
Acknowledgments
This work was carried out with the support of company eROBOT, j.s.a., which developed the testing equipment, provided the original idea behind the project, and carried out all the testing procedures.
Conflicts of Interest
The authors declare no conflicts of interest.
References
- Tiboni, M.; Remino, C.; Bussola, R.; Amici, C. A Review on Vibration-Based Condition Monitoring of Rotating Machinery. Appl. Sci. 2022, 12, 972. [Google Scholar] [CrossRef]
- Wieczorek, B.; Warguła, Ł.; Zharkevich, O.; Gierz, Ł.A.; Wojciechowski, Ł.; Perz, K. The Study of the Impact of Oil Type and Throttling Pressure on the Vibrations of a Gear Pump. Adv. Sci. Technol. Res. J. 2025, 19, 142–155. [Google Scholar] [CrossRef]
- Keleşoğlu, C.; Küçük, H.; Demetgül, M. Fault Diagnosis of Bevel Gears Using Neural Pattern Recognition and MLP Neural Network Algorithms. Int. J. Precis. Eng. Manuf. 2020, 21, 843–856. [Google Scholar] [CrossRef]
- Kumar, P.; Hirani, H.; Agrawal, A.K. Online Condition Monitoring of Misaligned Meshing Gears Using Wear Debris and Oil Quality Sensors. Ind. Lubr. Tribol. 2018, 70, 645–655. [Google Scholar] [CrossRef]
- Yoshioka, T.; Shimizu, S. Monitoring of Ball Bearing Operation under Grease Lubrication Using a New Compound Diagnostic System Detecting Vibration and Acoustic Emission. Tribol. Trans. 2009, 52, 725–730. [Google Scholar] [CrossRef]
- Farhat, M.H.; Gelman, L.; Conaghan, G.; Kluis, W.; Ball, A. Novel Diagnosis Technologies for a Lack of Oil Lubrication in Gearmotor Systems, Based on Motor Current Signature Analysis. Sensors 2022, 22, 9507. [Google Scholar] [CrossRef] [PubMed]
- Feng, K.; Ji, J.C.; Ni, Q.; Beer, M. A Review of Vibration-Based Gear Wear Monitoring and Prediction Techniques. Mech. Syst. Signal Process. 2023, 182, 109605. [Google Scholar] [CrossRef]
- Vashishtha, G.; Chauhan, S.; Sehri, M.; Zimroz, R.; Dumond, P.; Kumar, R.; Gupta, M.K. A Roadmap to Fault Diagnosis of Industrial Machines via Machine Learning: A Brief Review. Measurement 2025, 242, 116216. [Google Scholar] [CrossRef]
- Tiboni, M.; Remino, C.; Bussola, R.; Amici, C. A Review on Vibration-Based Condition Monitoring of Rotating Machinery. Appl. Sci. 2022, 12, 972. [Google Scholar] [CrossRef]
- Su, B.; Wang, L. Study on Control System of Grease Lubrication. In Proceedings of the 2010 8th World Congress on Intelligent Control and Automation; IEEE: Jinan, China, July 2010; pp. 4240–4243. [Google Scholar]
- Peng, H.; Chen, Y.; Shangguan, L.; Cheng, R.; Li, Y.; Yang, C. Multi-Objective-Based Intelligent Lubrication System Performance Evaluation Technology for Construction Machinery. Appl. Sci. 2023, 13, 11768. [Google Scholar] [CrossRef]
- Chun, S.M. Network Analysis of an Engine Lubrication System. Tribol. Int. 2003, 36, 609–617. [Google Scholar] [CrossRef]
- Yan, S.; Ma, B.; Zheng, C. A Unified System Residual Life Prediction Method Based on Selected Tribodiagnostic Data. IEEE Access 2019, 7, 44087–44096. [Google Scholar] [CrossRef]
- Герасиди, В.В.; Лисаченкo, А.В. On the issue of the formation of tribodiagnostic models of ship WATERS in operation. Morskie Intellektualnye Tehnol. 2022, 93–98. [Google Scholar] [CrossRef]
- Murčinková, Z.; Živčák, J.; Sabol, D. Torsional Vibrations in the Resonance of High-Speed Rotor Bearings Reduced by Dynamic Properties of Carbon Fiber Polymer Composites. Materials 2023, 16, 3324. [Google Scholar] [CrossRef] [PubMed]
- Demčák, J.; Židek, K.; Krenický, T. Digital Twin for Monitoring the Experimental Assembly Process Using RFID Technology. Processes 2024, 12, 1512. [Google Scholar] [CrossRef]
- Zhang, R.; Yu, Z.; Fan, Z.; Wang, S.; Xiang, Y.; Liu, Y.; Wang, Z. Sensor for a Solid–Liquid Tribological System. Sensors 2025, 25, 437. [Google Scholar] [CrossRef] [PubMed]
- Prada, E.; Varga, M.; Virgala, I.; Mikova, Ľ.; Kelemen, M. Model – based methodology for designing automated workplaces. MM Sci. J. 2023, 2023. [Google Scholar] [CrossRef]
- Huang, Y. A Facile Approach to Fabricate a Stabilized Slippery Lubricant-Infused Porous Surface with Dynamic Omniphobicity for Self-Cleaning. RSC Adv. 2024, 14, 23621–23628. [Google Scholar] [CrossRef] [PubMed]
- Aerospace Industries Association. NAS 1638: Cleanliness Requirements of Parts Used in Hydraulic Systems (Revision 4), 2011. National Aerospace Standard.
- International Organization for Standardization ISO 4406:2021. Hydraulic fluid power — Fluids — Method for coding the level of contamination by solid particles Edition 4, published January 2021.
- U.S. Navy. (2006). NAVAIR 01-1A-17: Technical Manual Organizational, Intermediate and Depot Maintenance Aviation Hydraulics Manual (Change 2, August 1), 2014. Naval Air Systems Command.
- Khan, S.; Dyrstad-Cincotta, N.; Nasah, J.; Bhat, A.; Rickson, J.; Mann, M. Electrostatic Lubricant Filter Design Study. 2022 IEEE Conference on Electrical Insulation and Dielectric Phenomena (CEIDP). Denver, CO, USA, 2022; pp. 95–98. [Google Scholar] [CrossRef]
- Gan, C.; Liang, T.; Li, X. Current and Candidate Additives for Environmentally Acceptable Lubricants—A Review. Tribol. Int. 2020, 146, 106768. [Google Scholar] [CrossRef]
- Al Hajj, A. Condition-Based Monitoring on High-Precision Gearbox for Robotic Applications. Shock and Vibration 2022, Article ID 6653723. [Google Scholar] [CrossRef]
Figure 1.
The proposed algorithm for solving the problem.
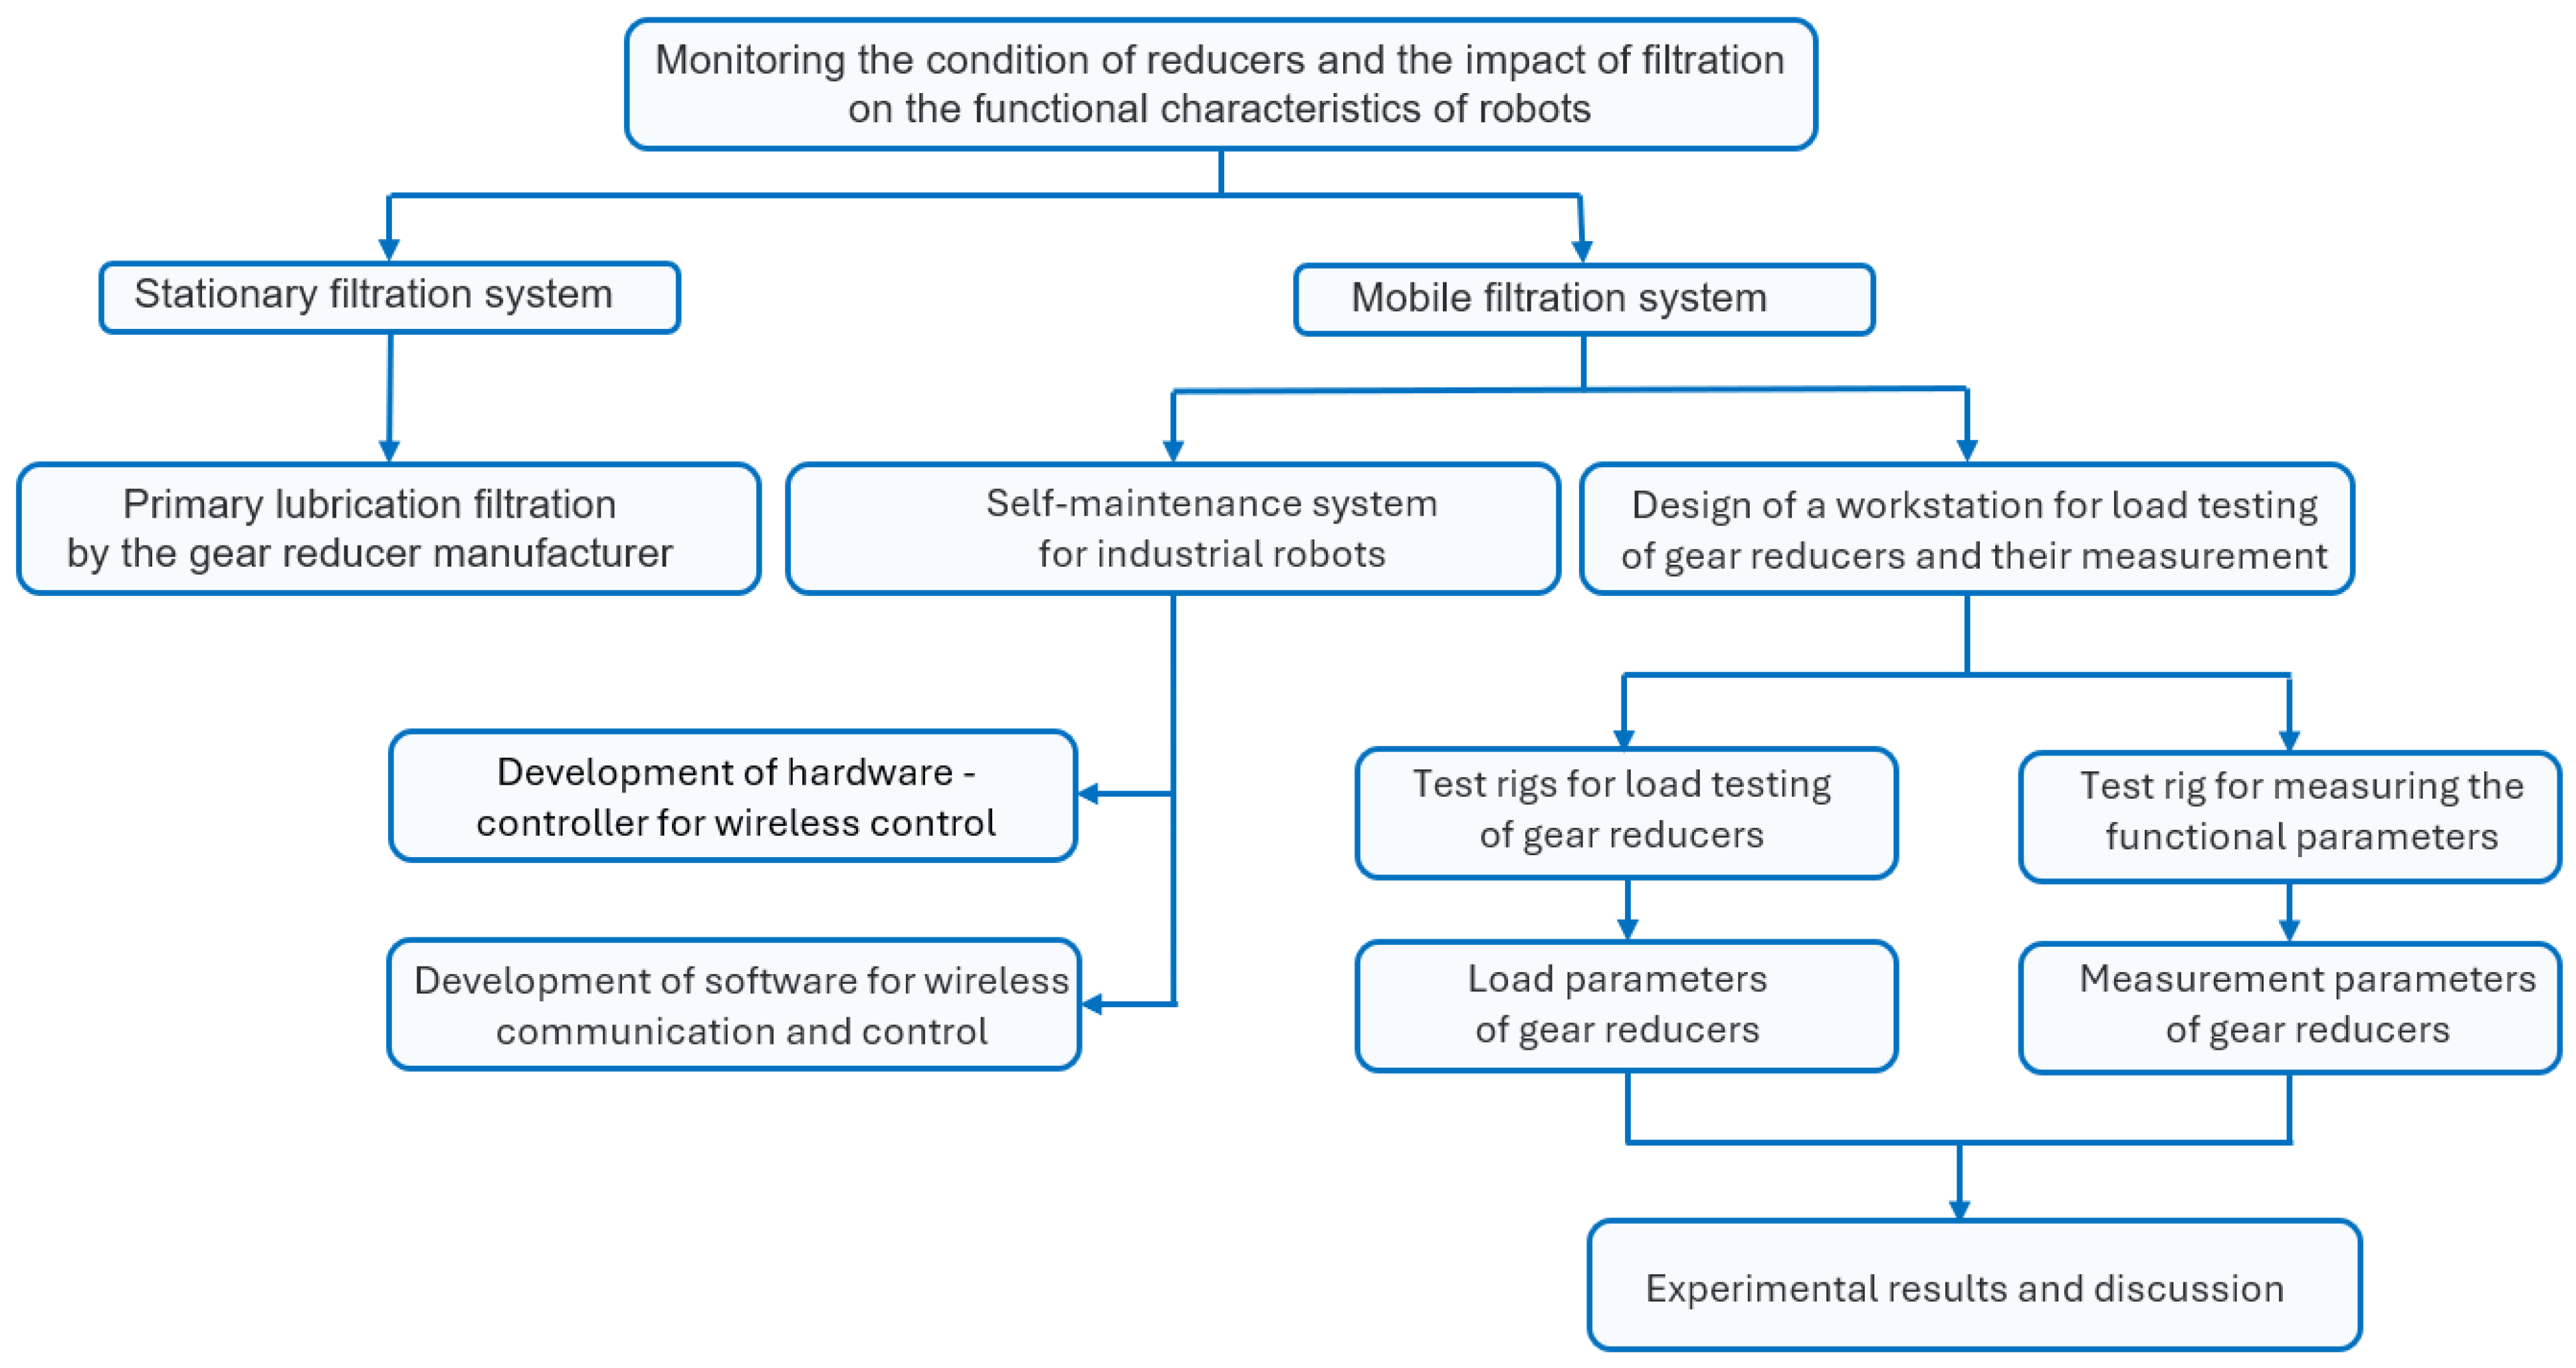
Figure 2.
The gear mechanism used in the test rig.
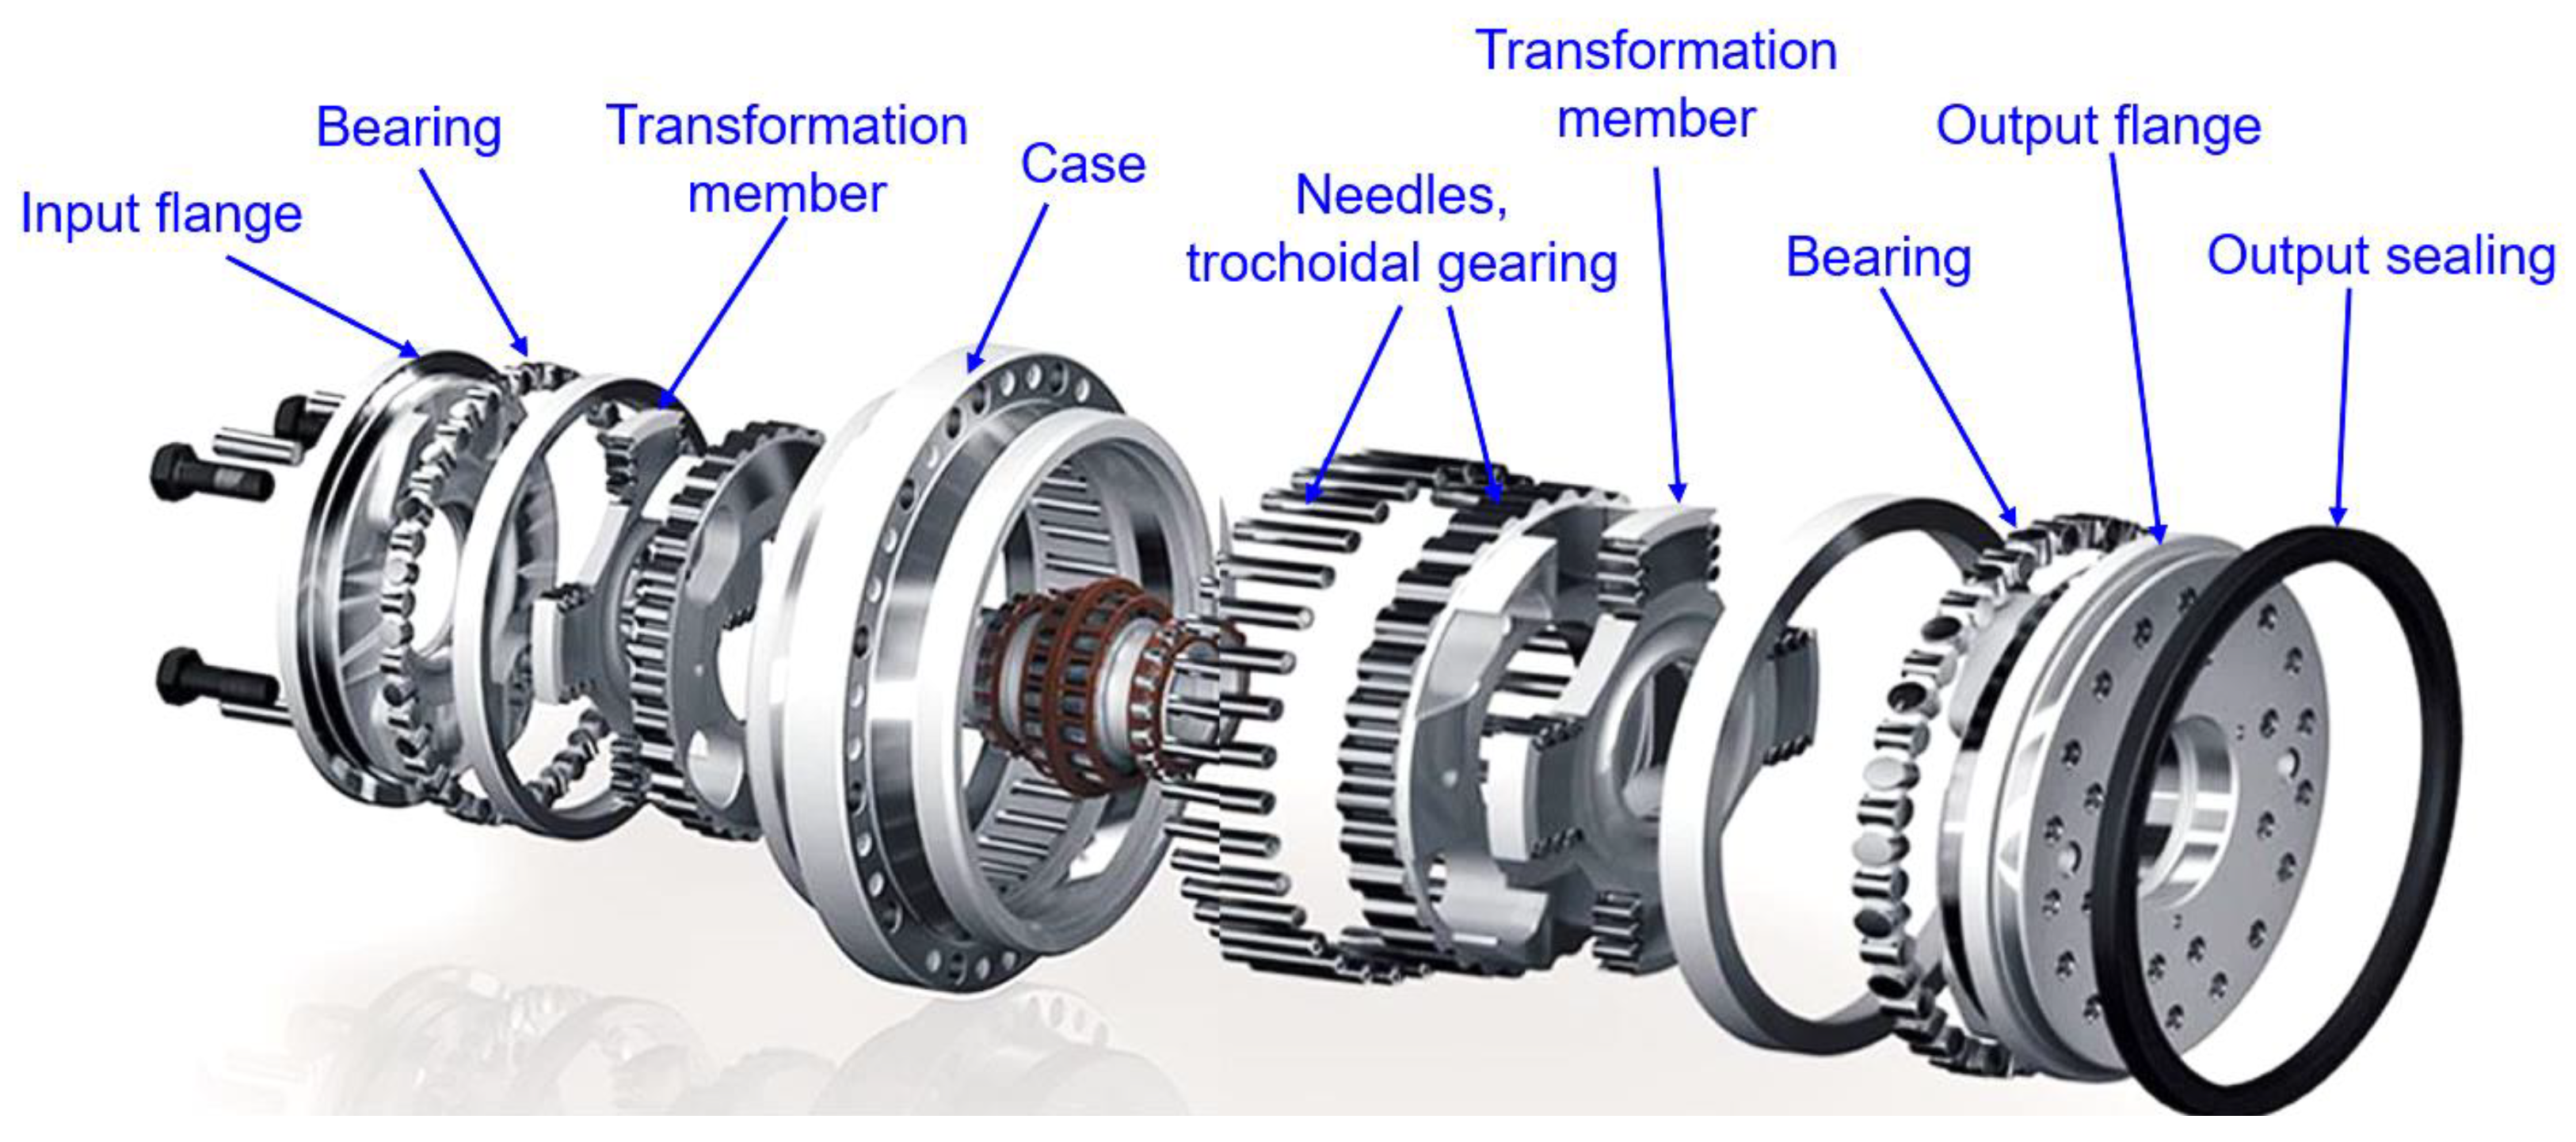
Figure 3.
Structural design of the load test rig.
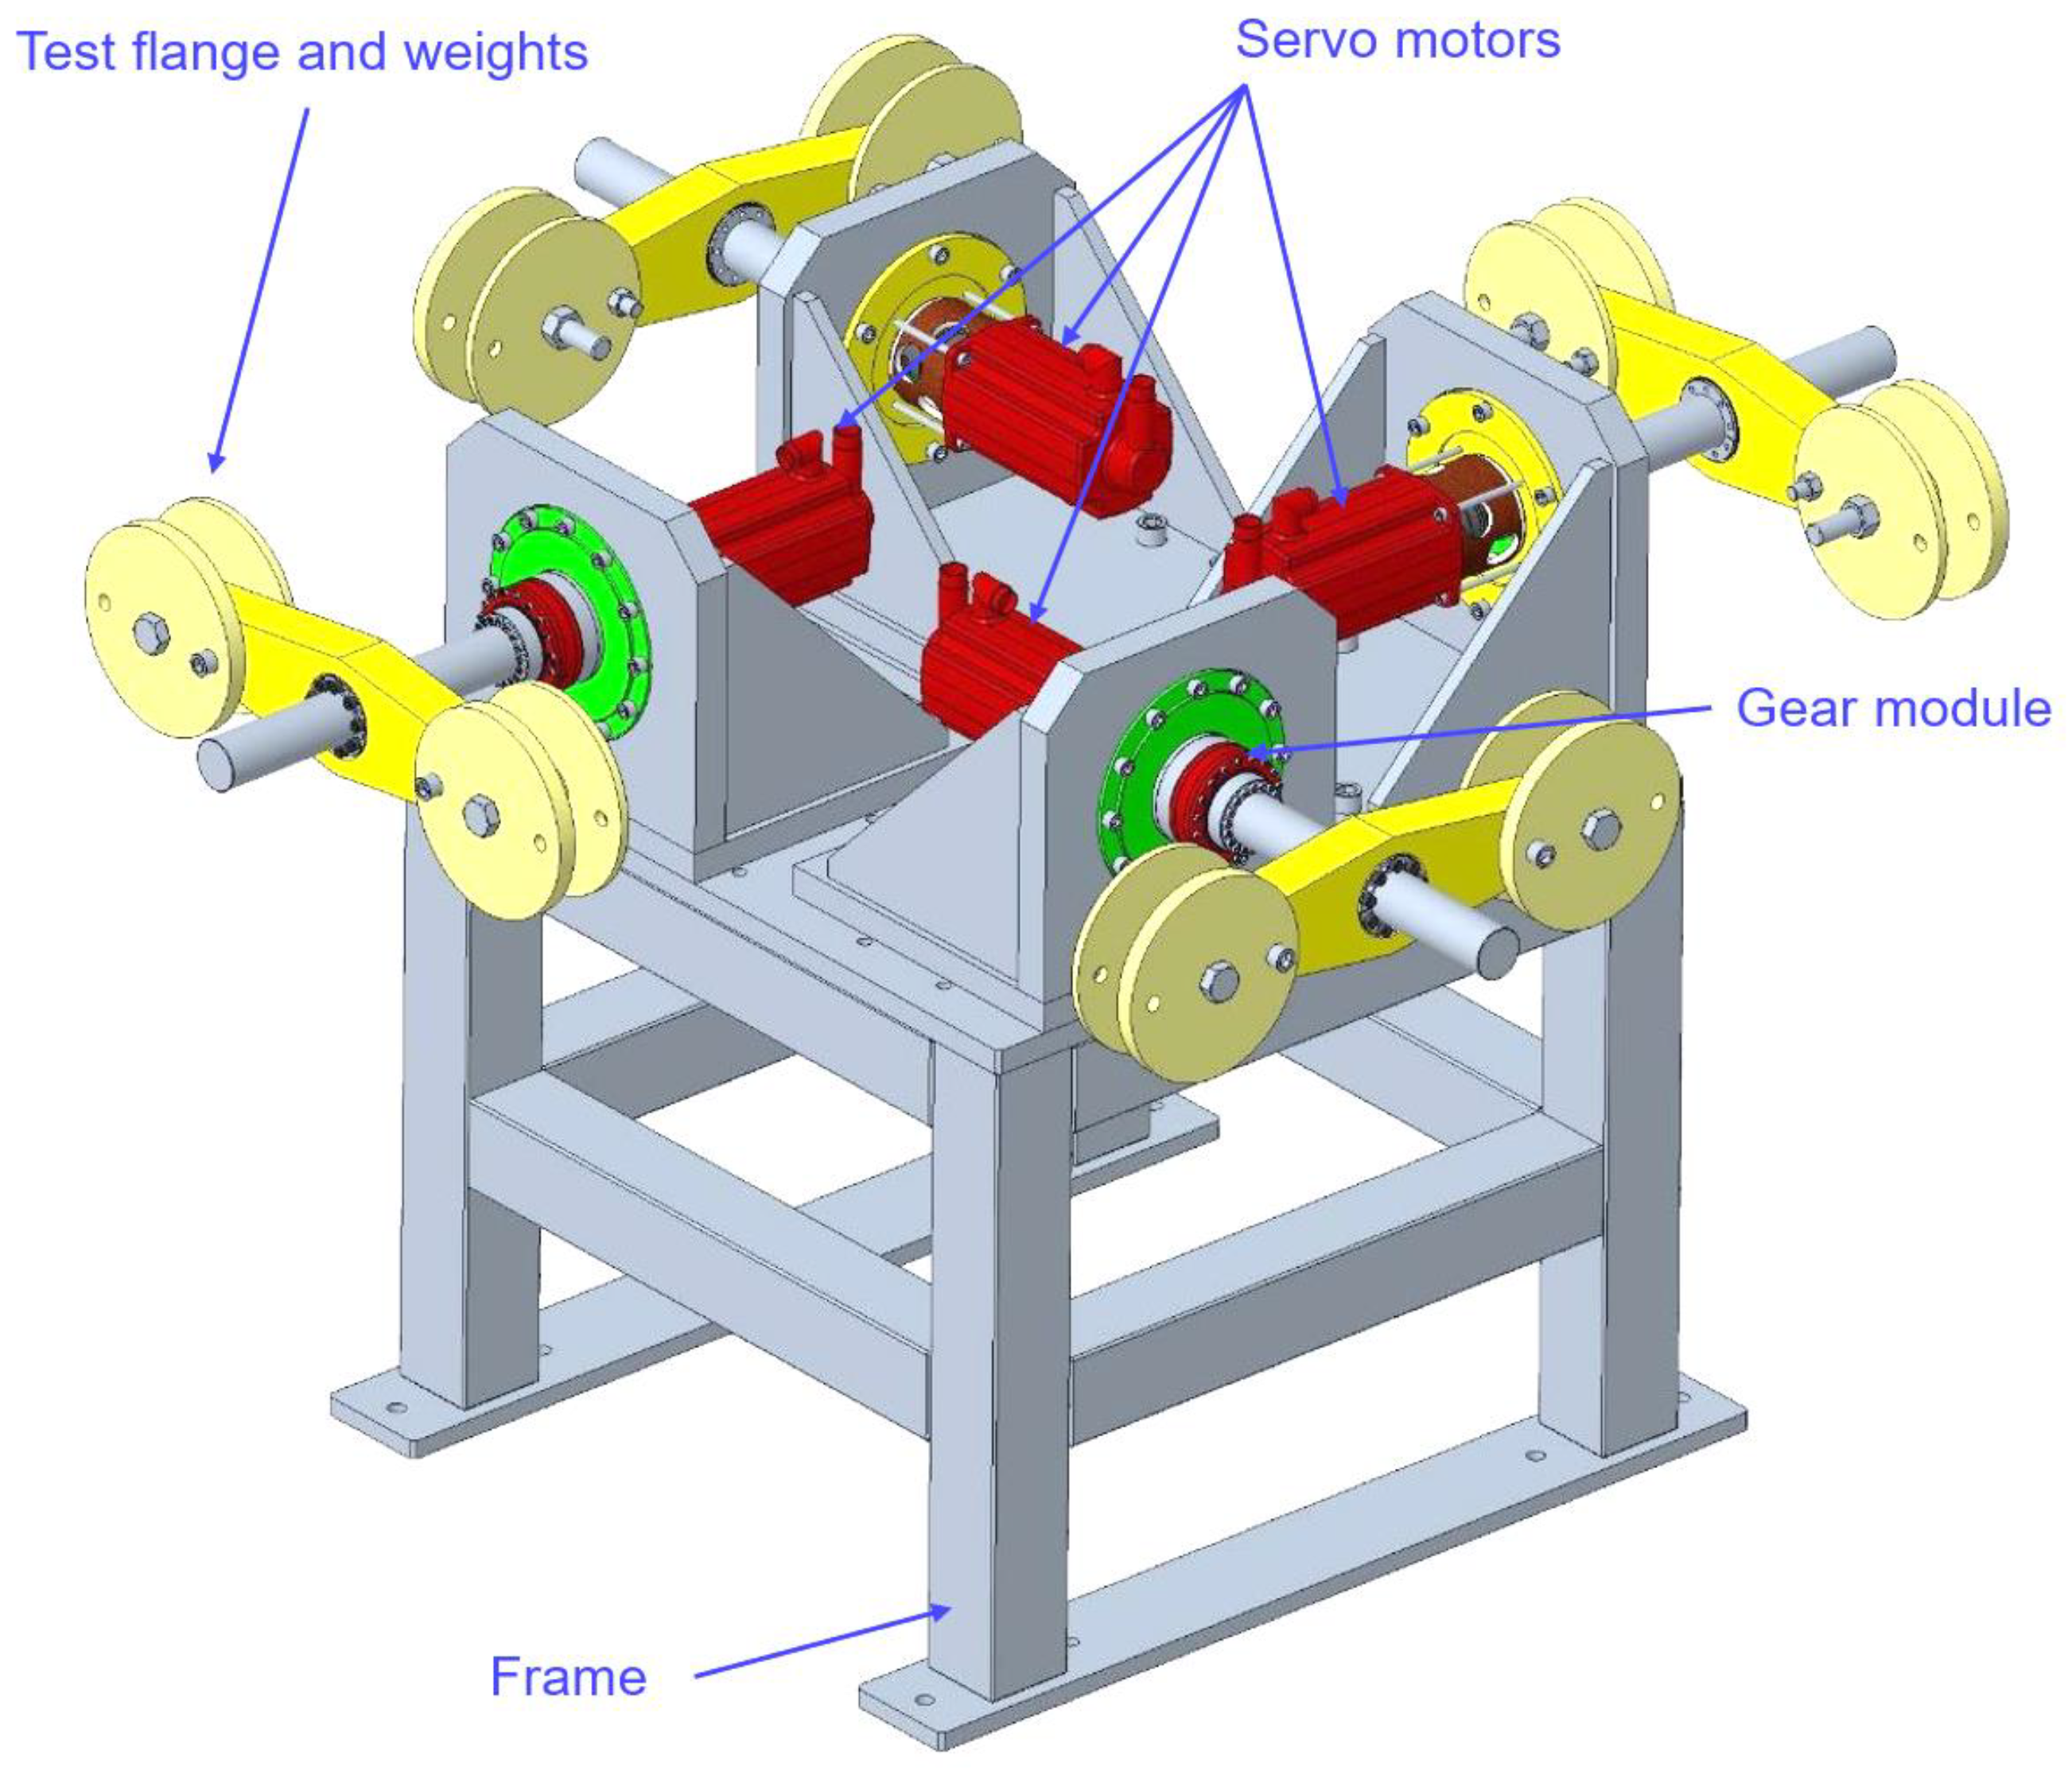
Figure 4.
The proposed measurement test rig.
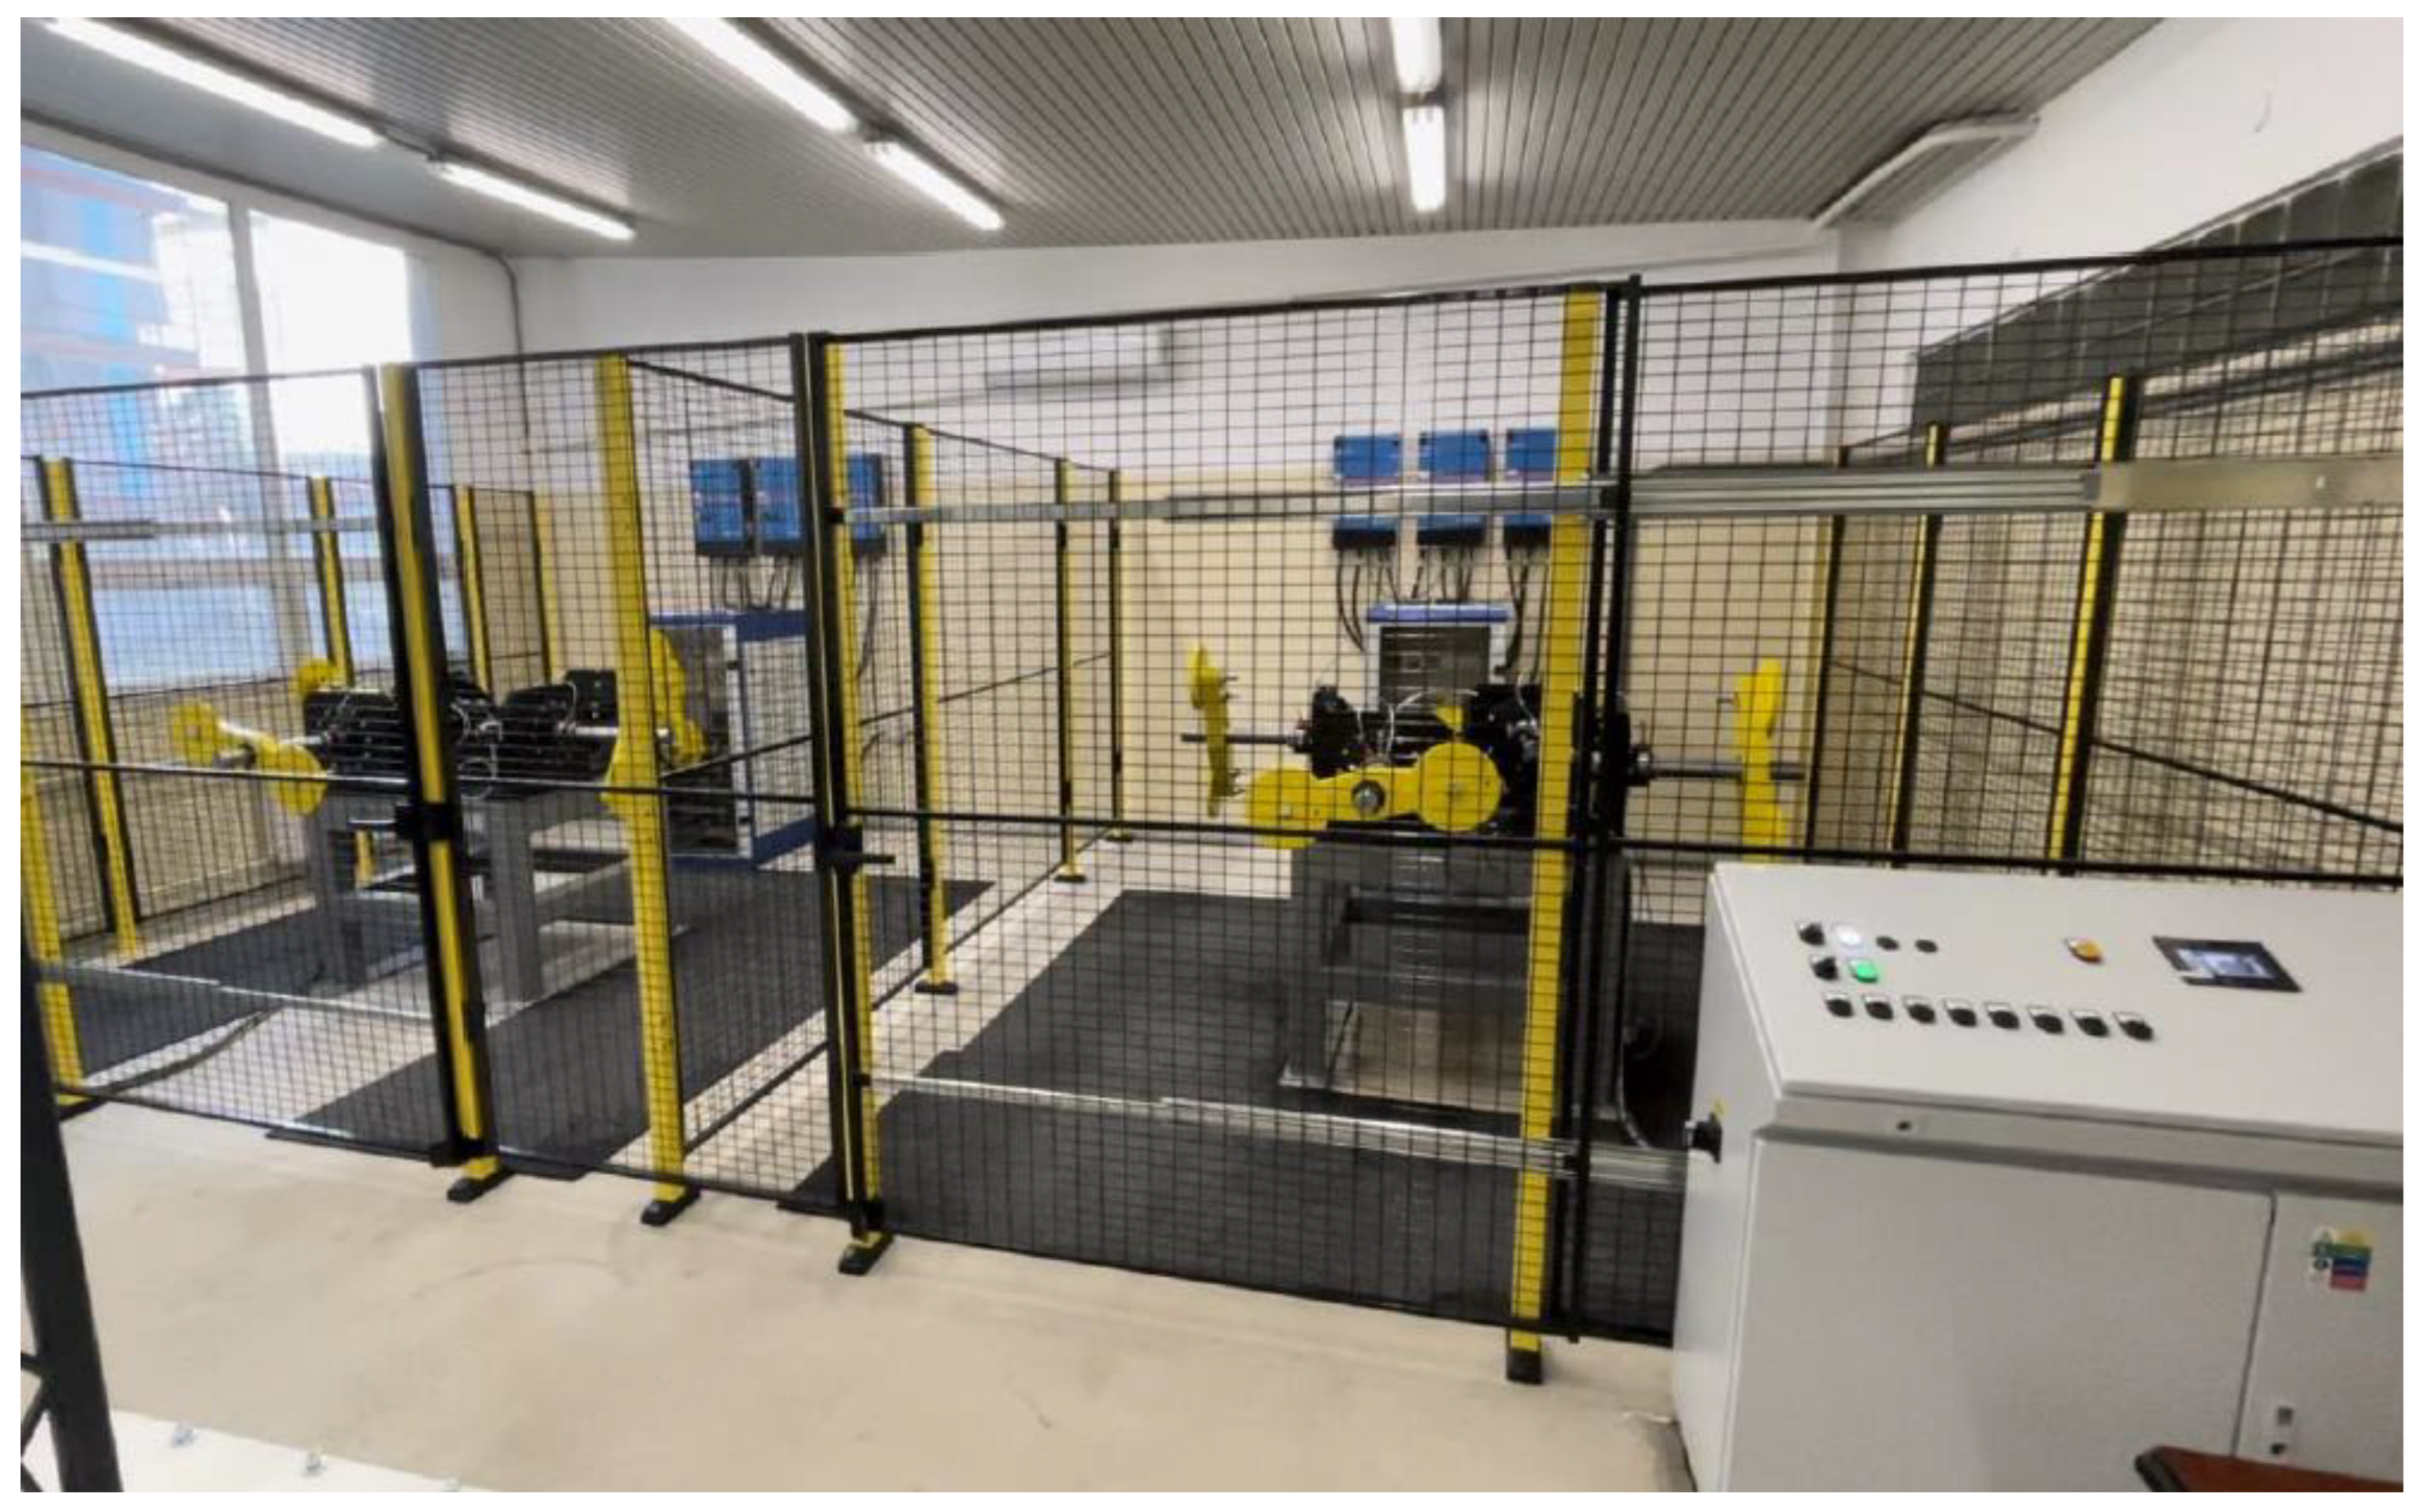
Figure 5.
Analysis of the new lubricant Castrol Optigear Synthetic 150 ALR.
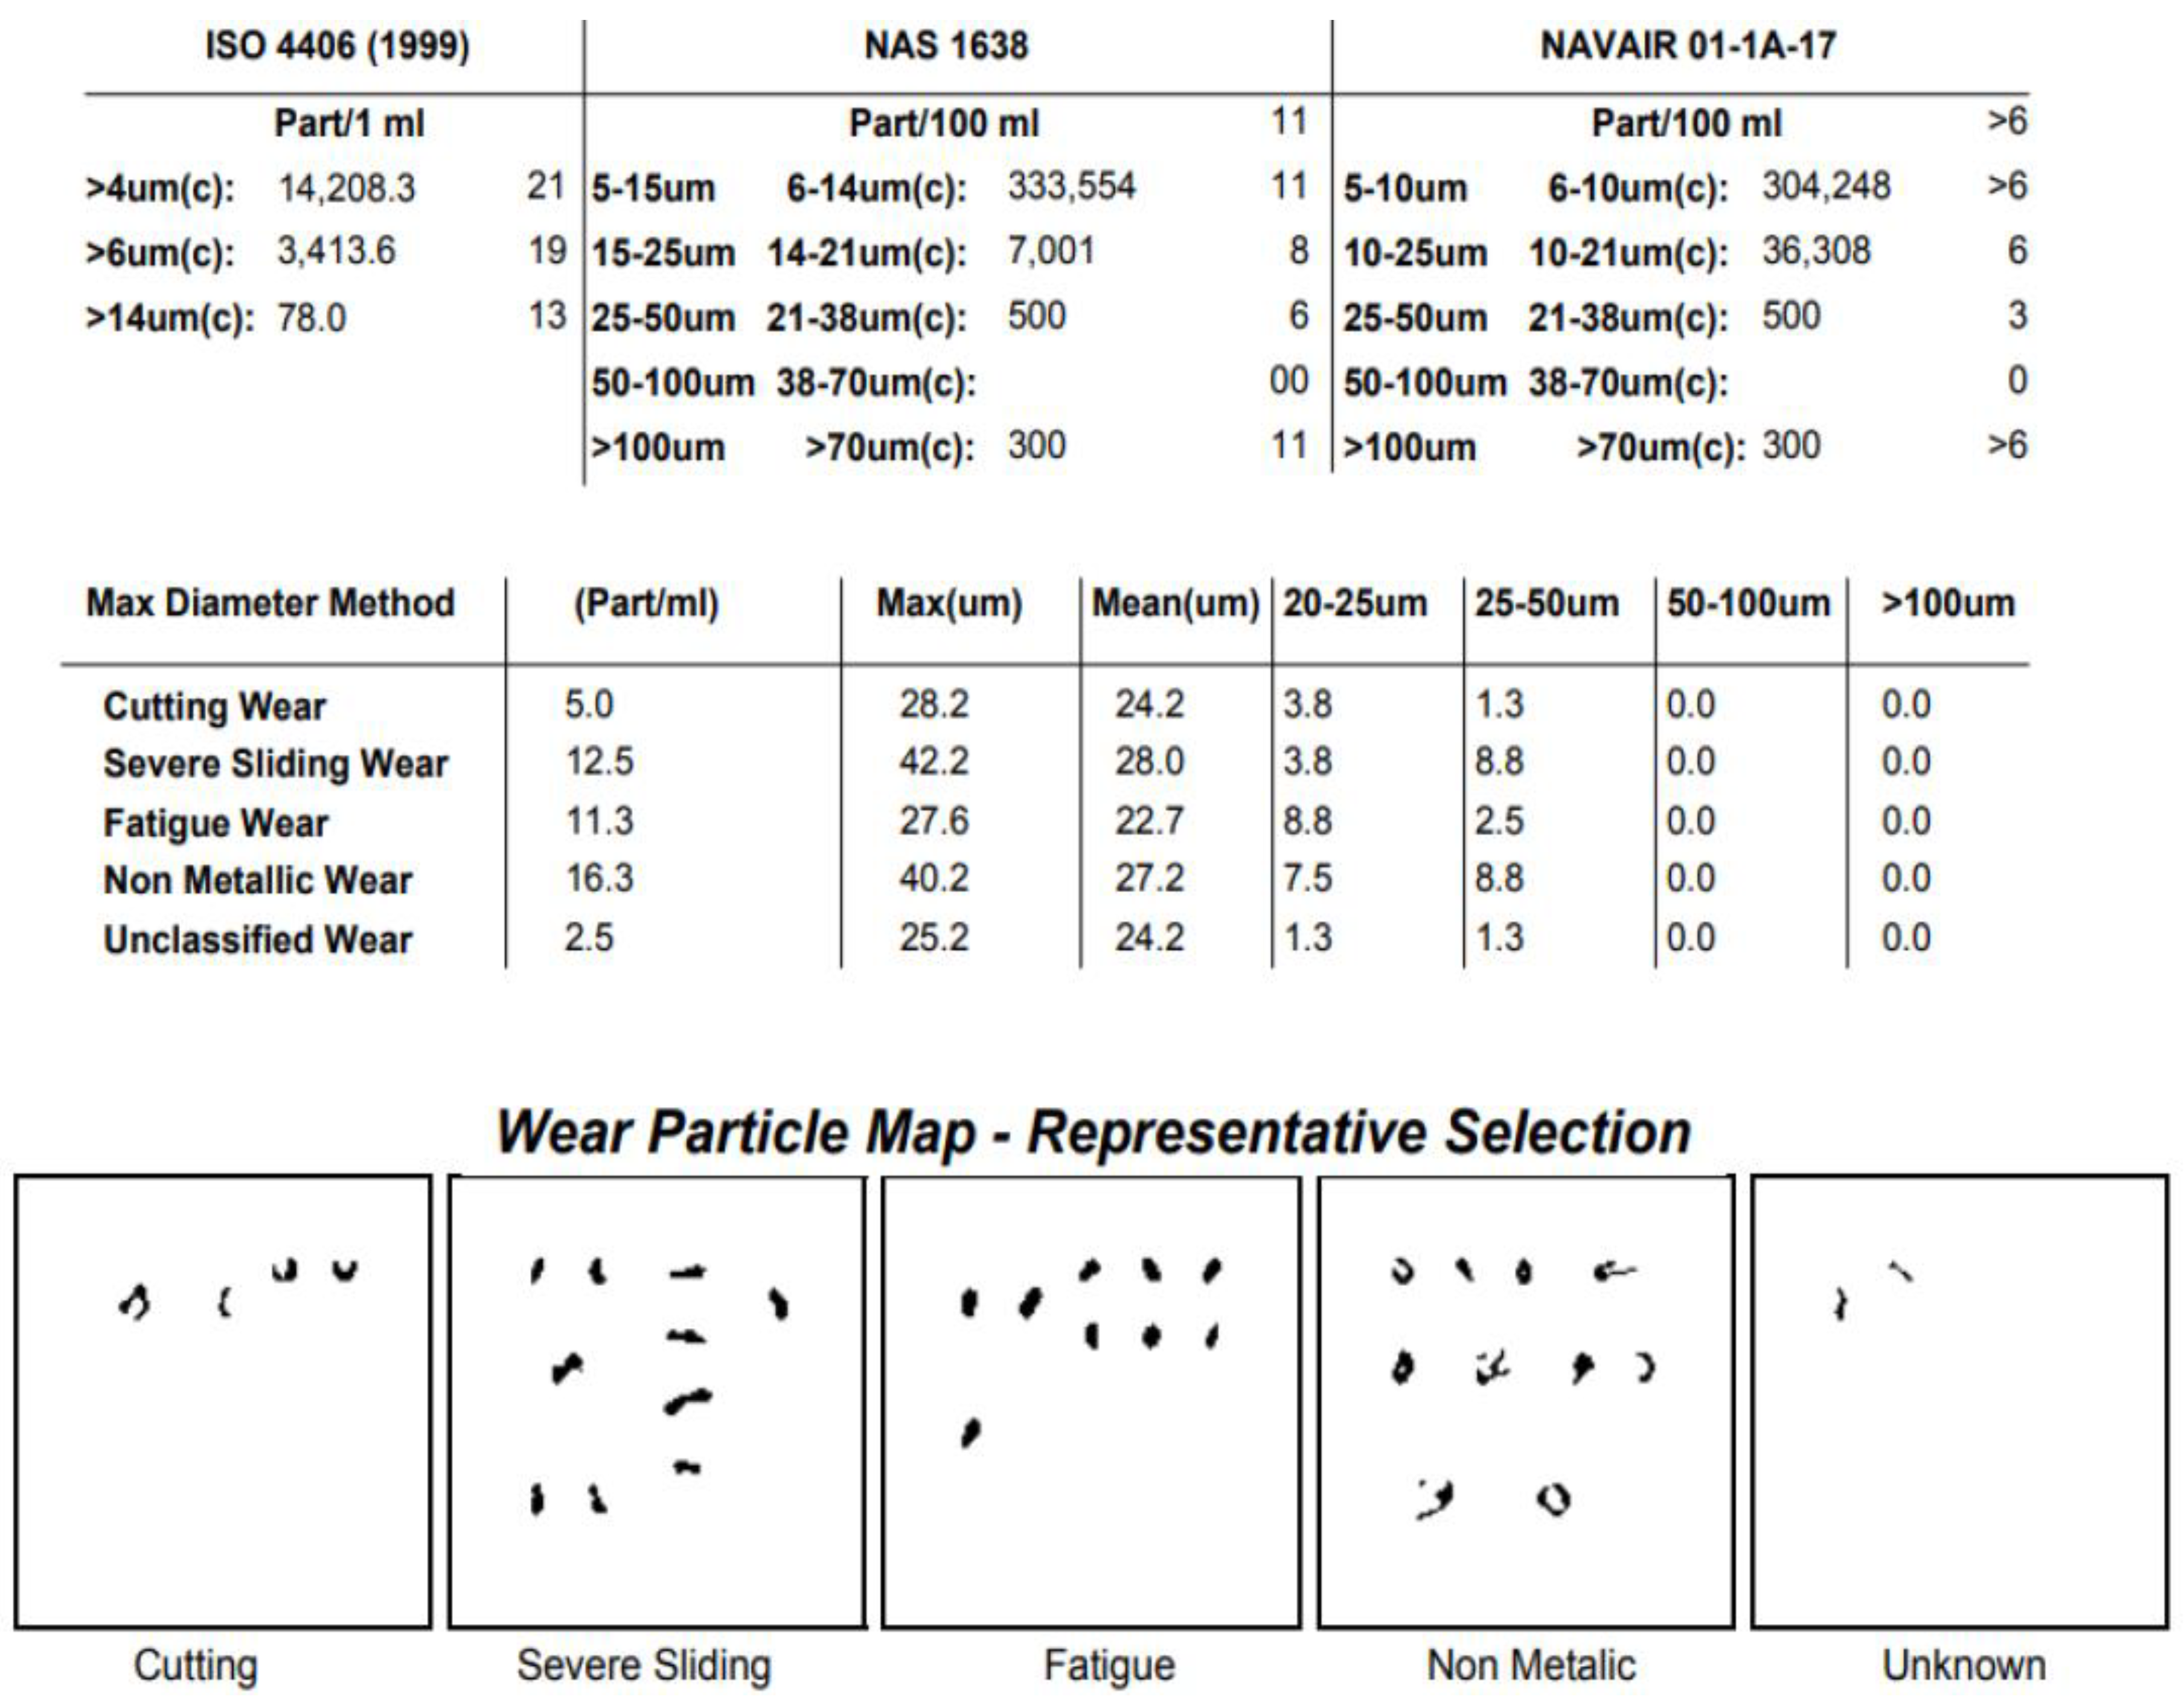
Figure 6.
Lubricant analysis from gear module G1 after the first hour of Run-In.
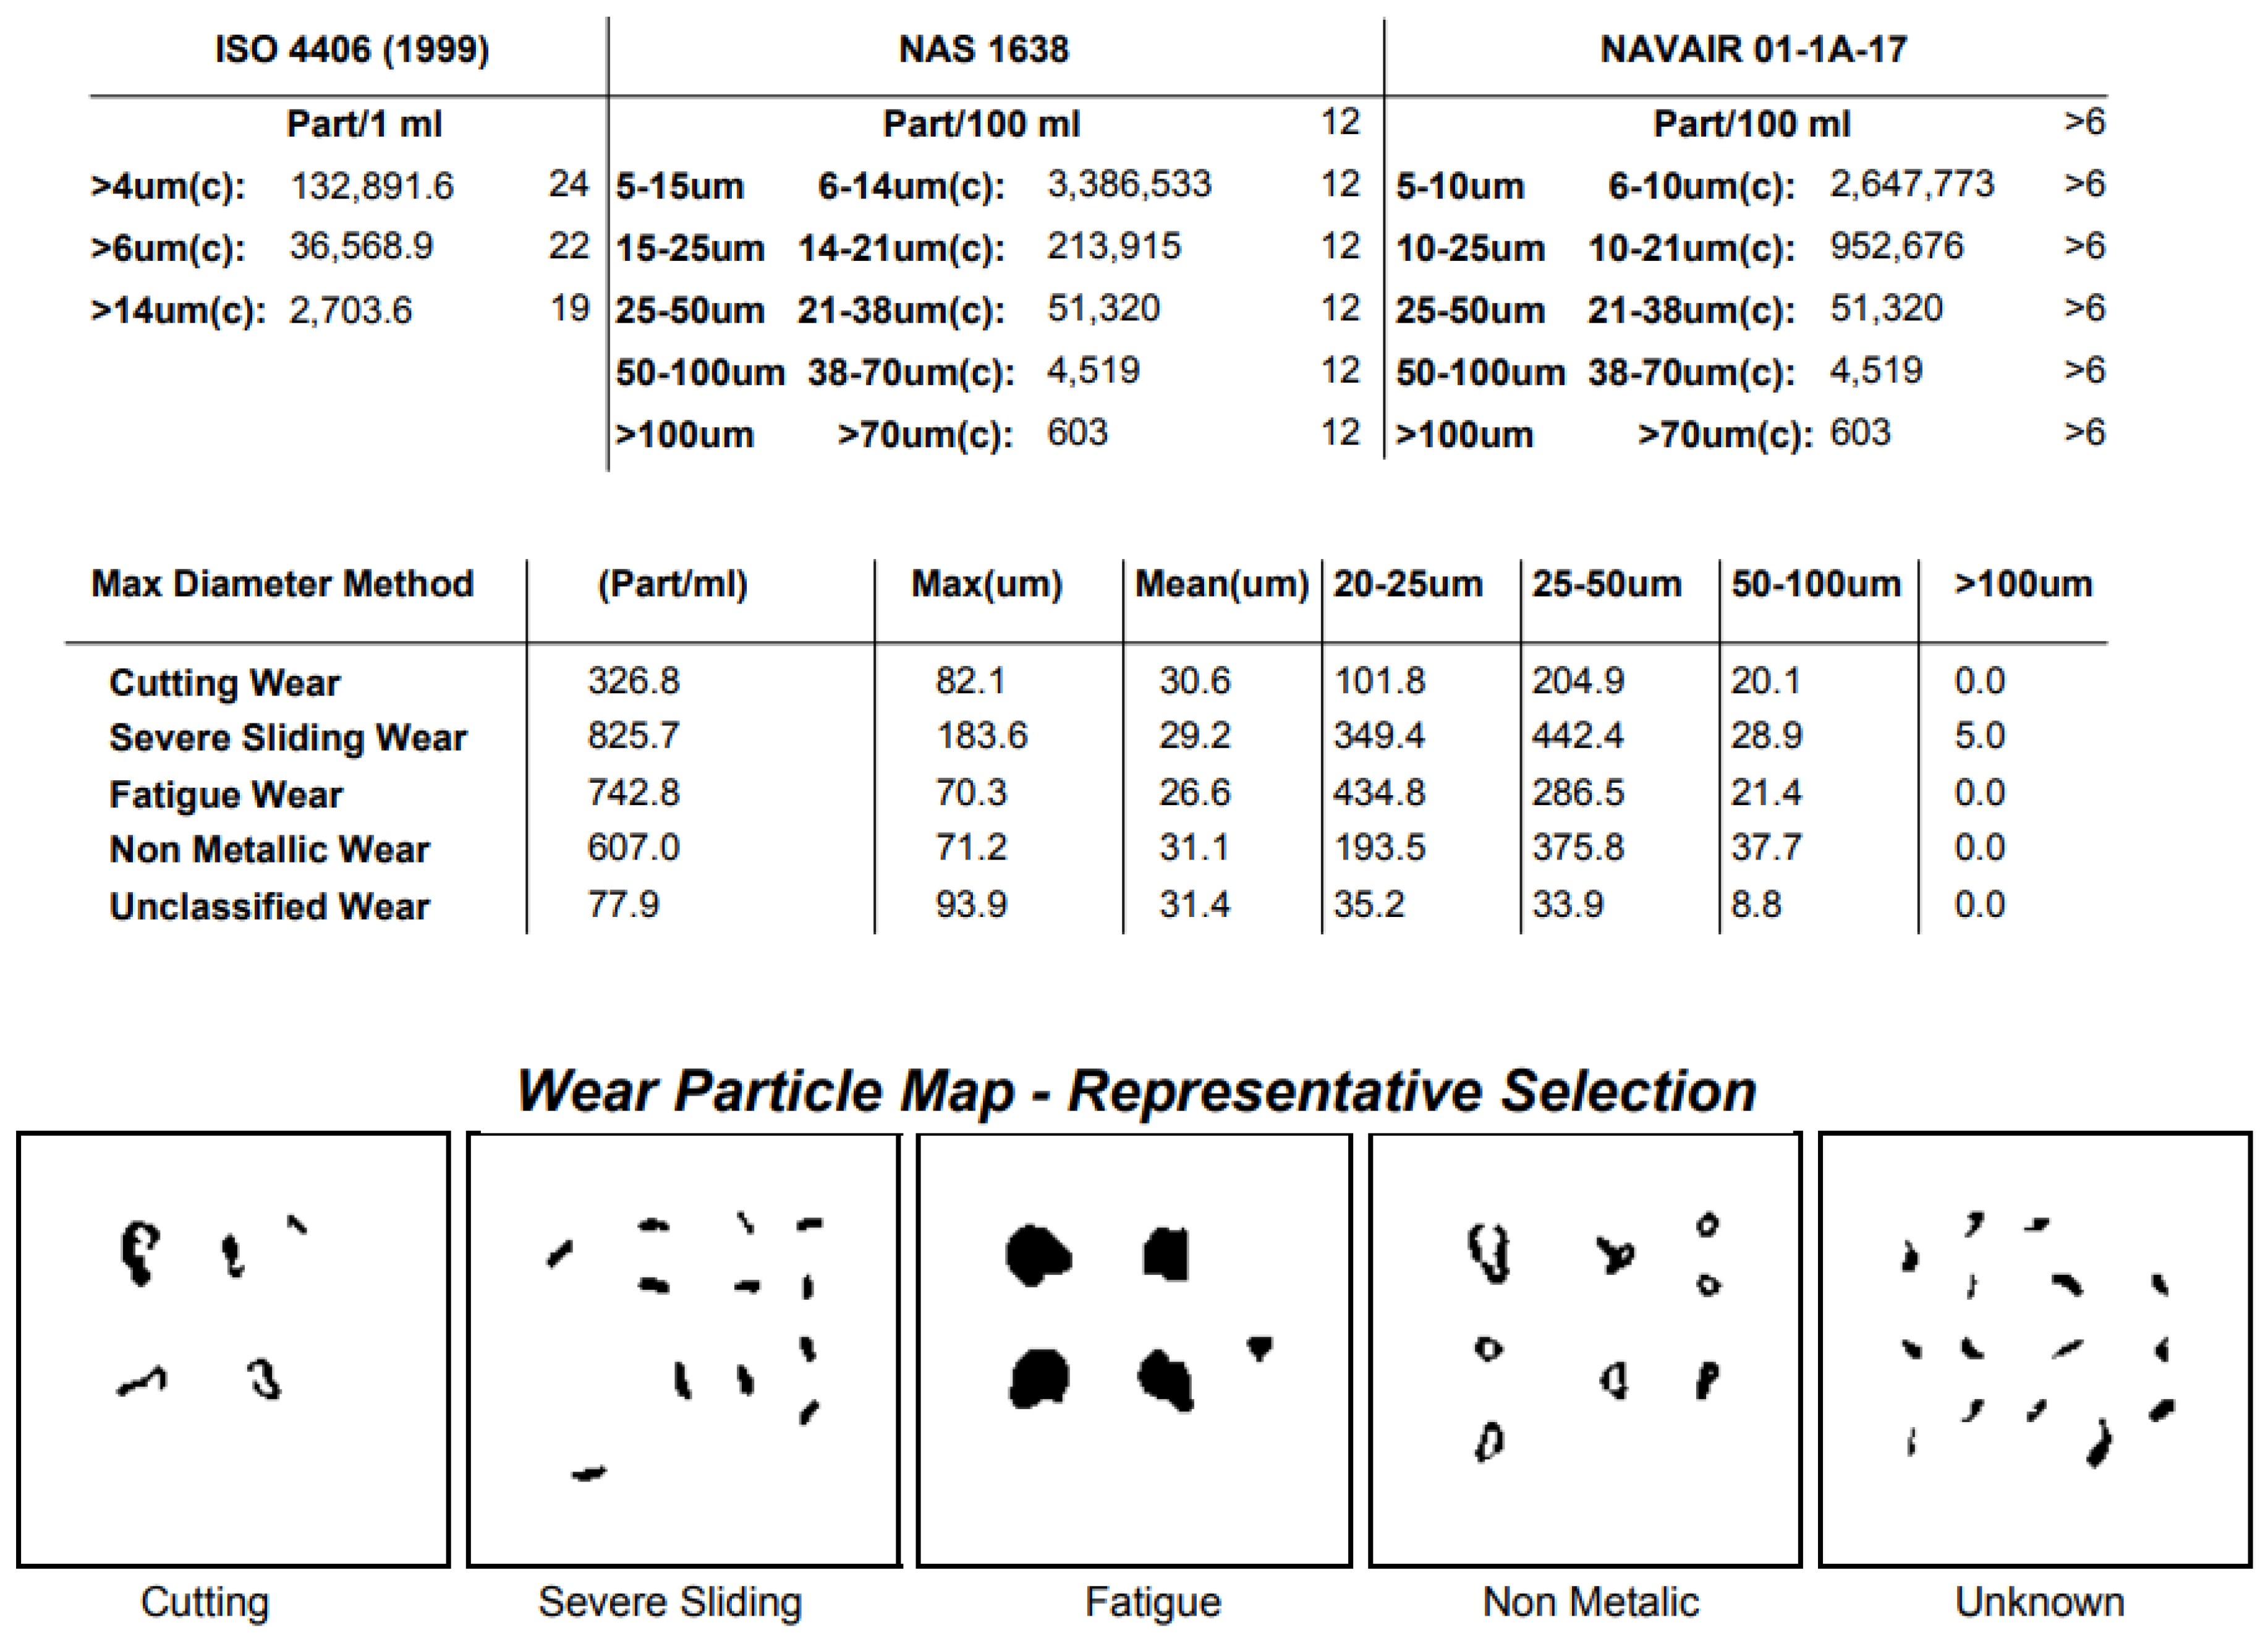
Figure 7.
Graphical representation of lubricant contamination in samples from gearbox module G1.
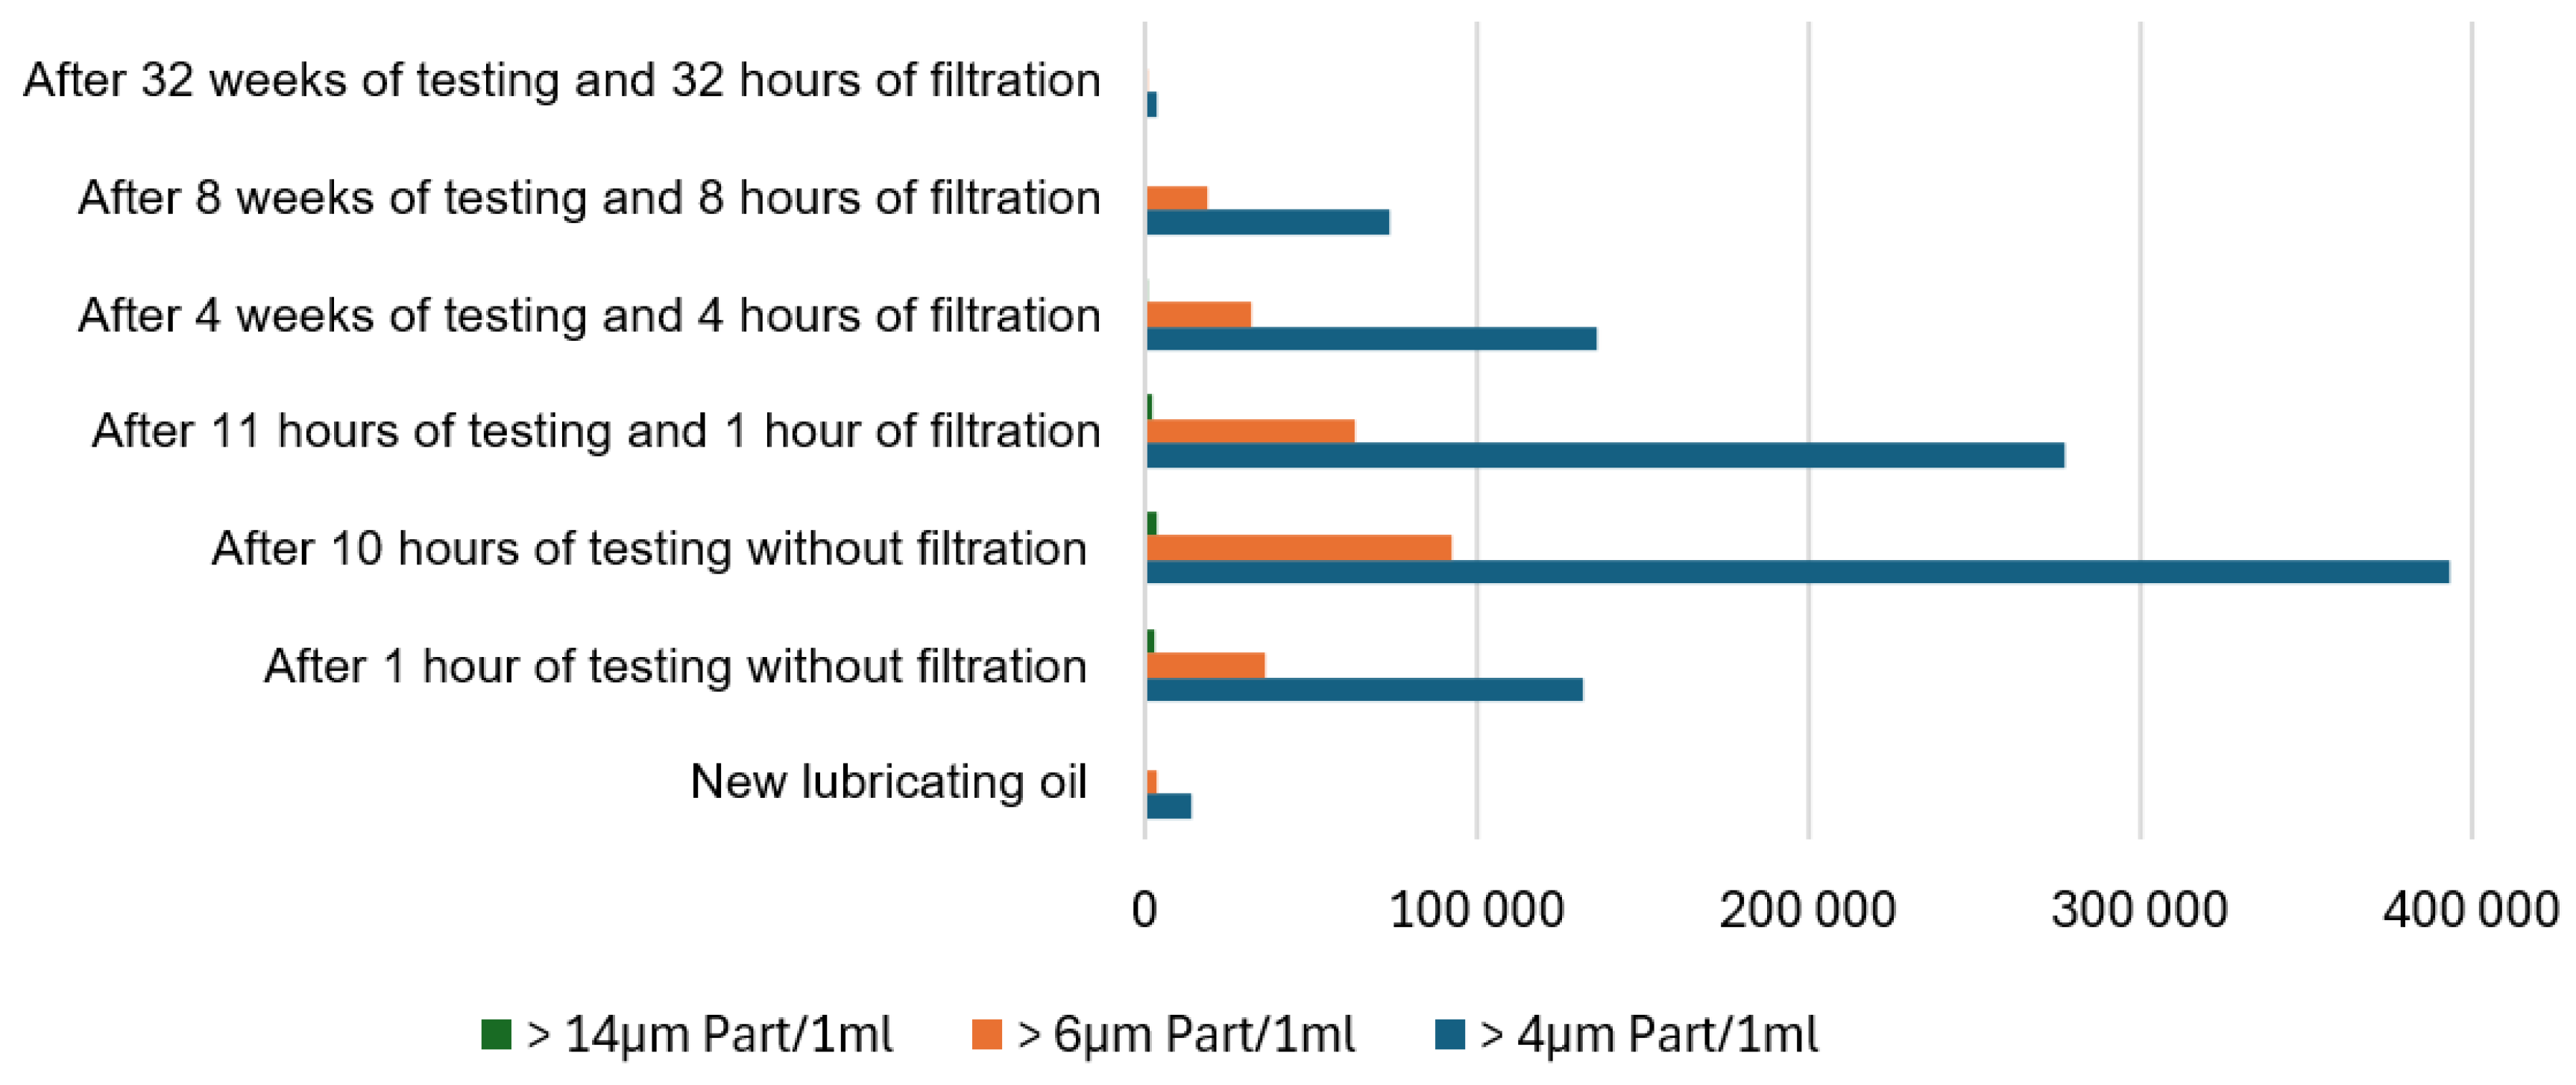
Figure 8.
Elemental analysis of lubricant contamination for selected elements during the operational periods of gearbox module G1.
Figure 8.
Elemental analysis of lubricant contamination for selected elements during the operational periods of gearbox module G1.
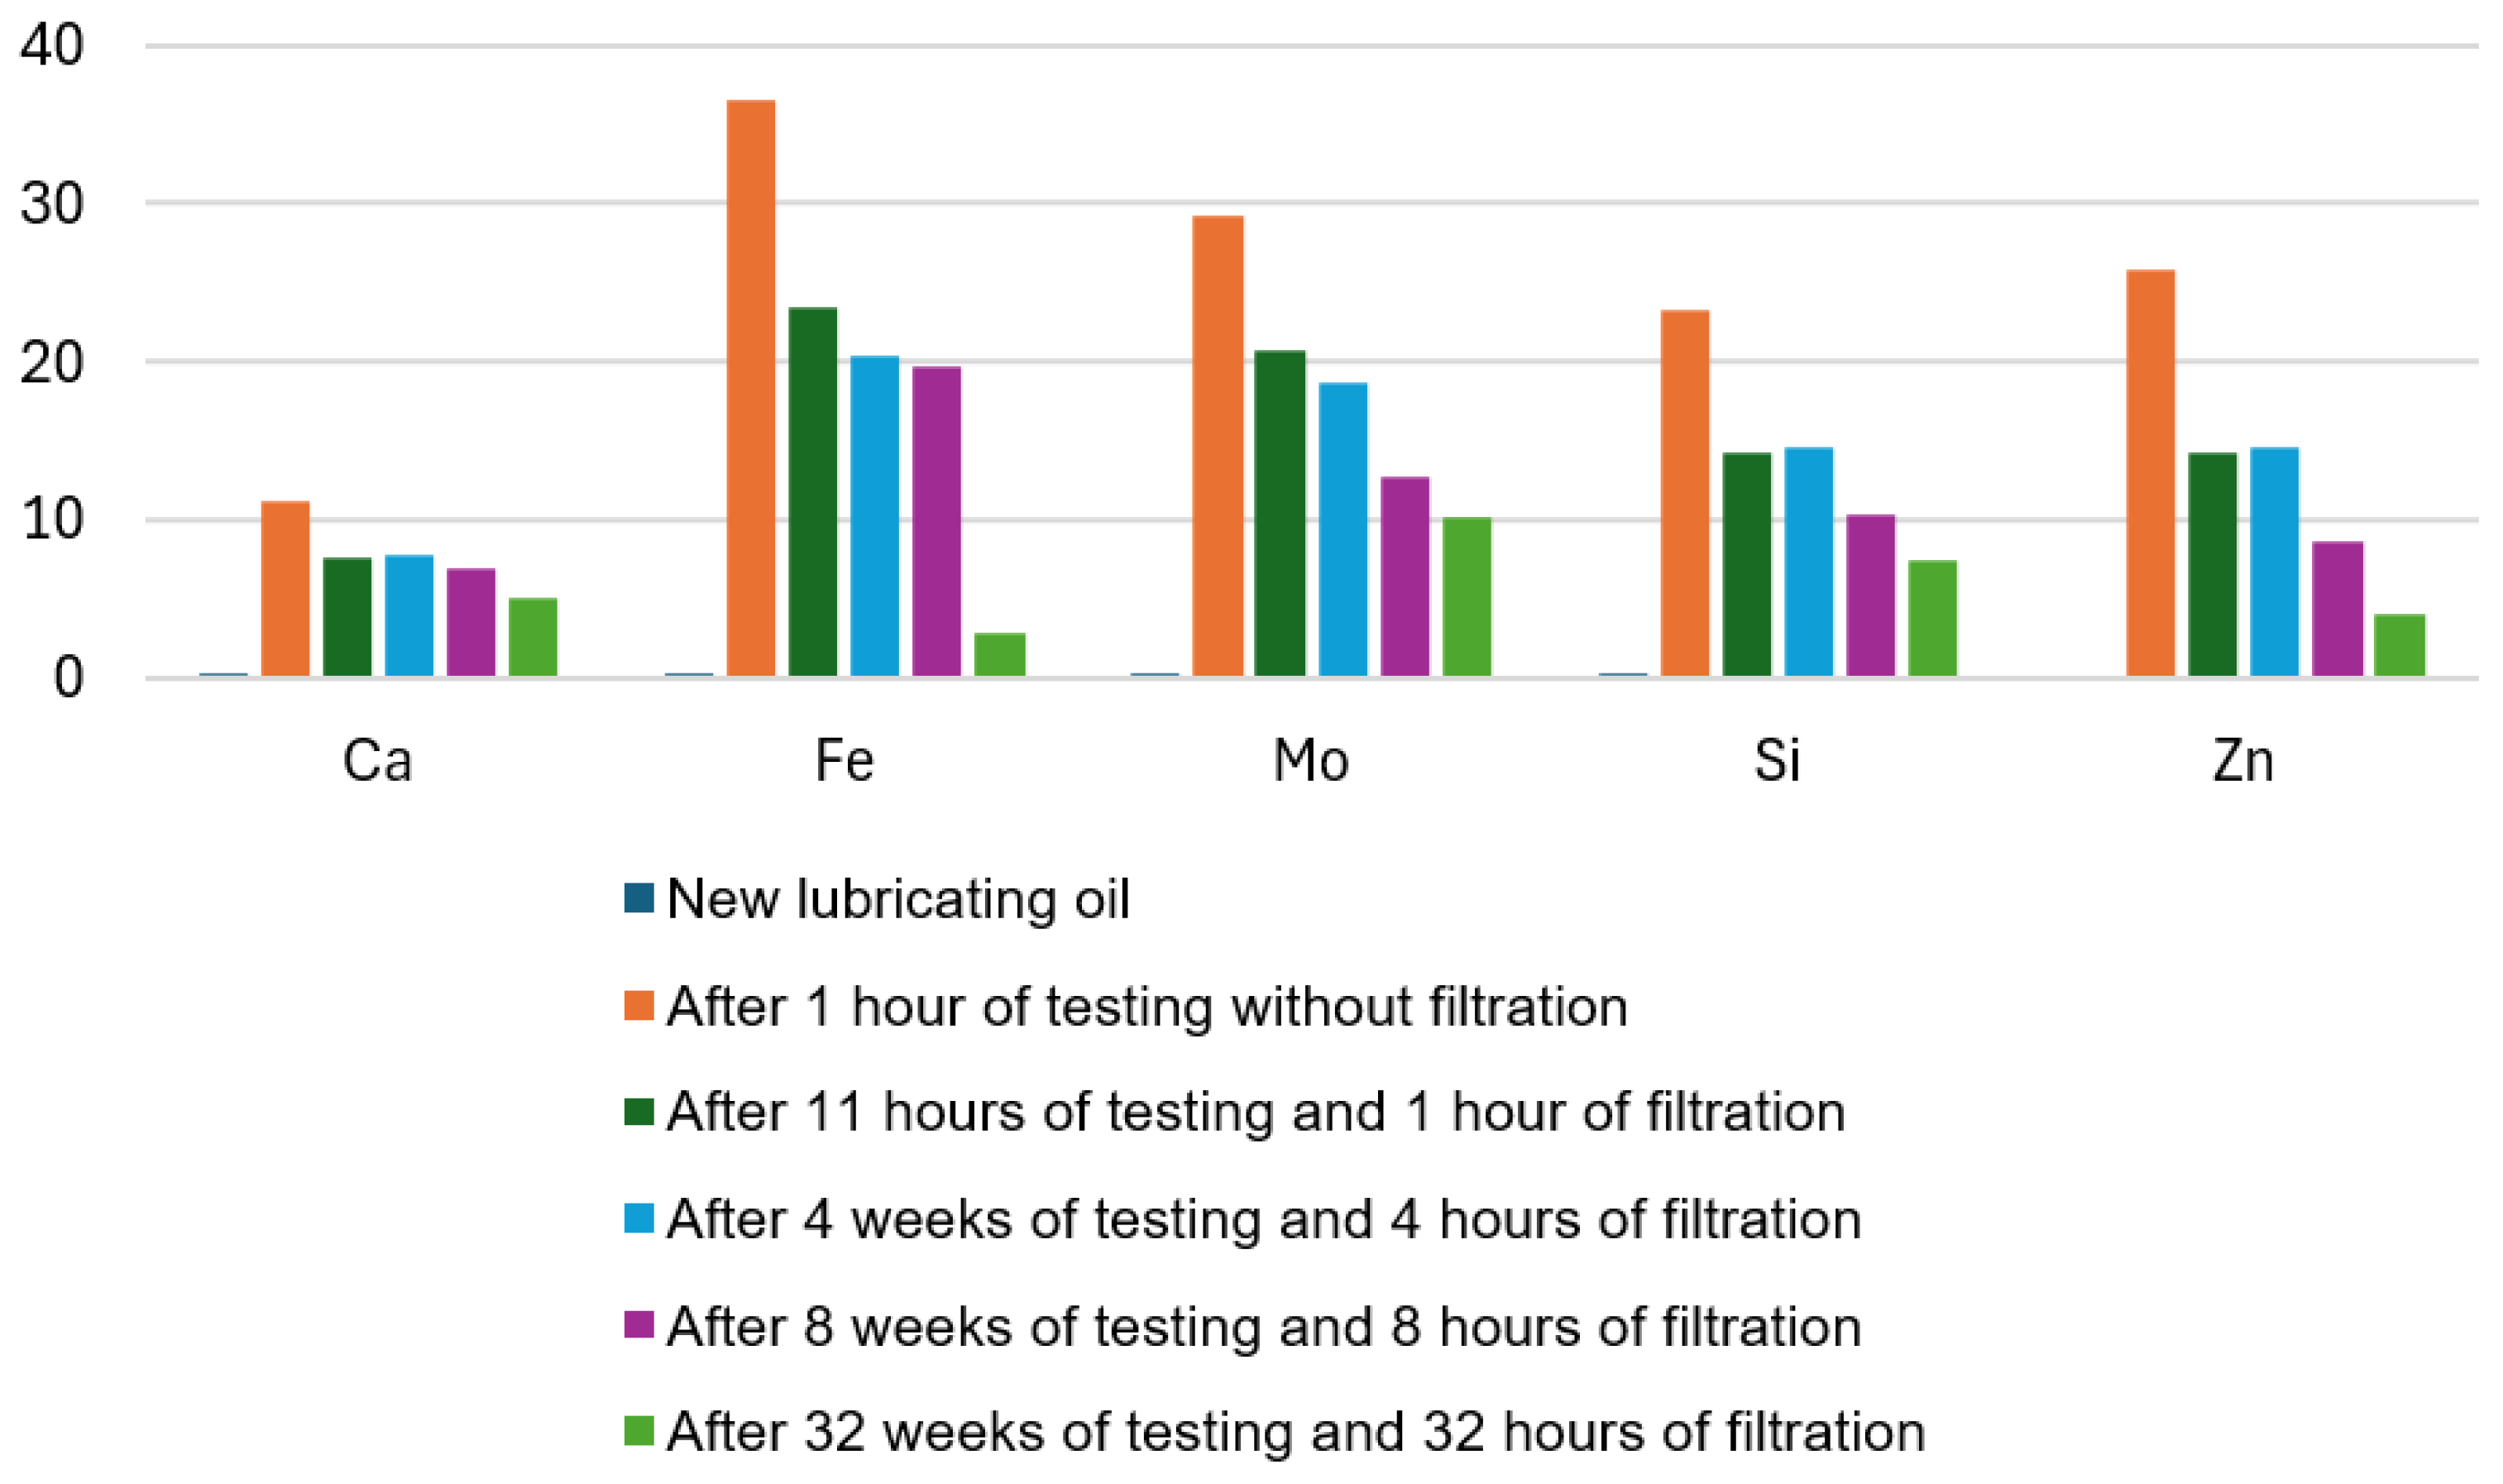
Figure 9.
Graphical representation of lubricant contamination in samples from gearbox module G3.
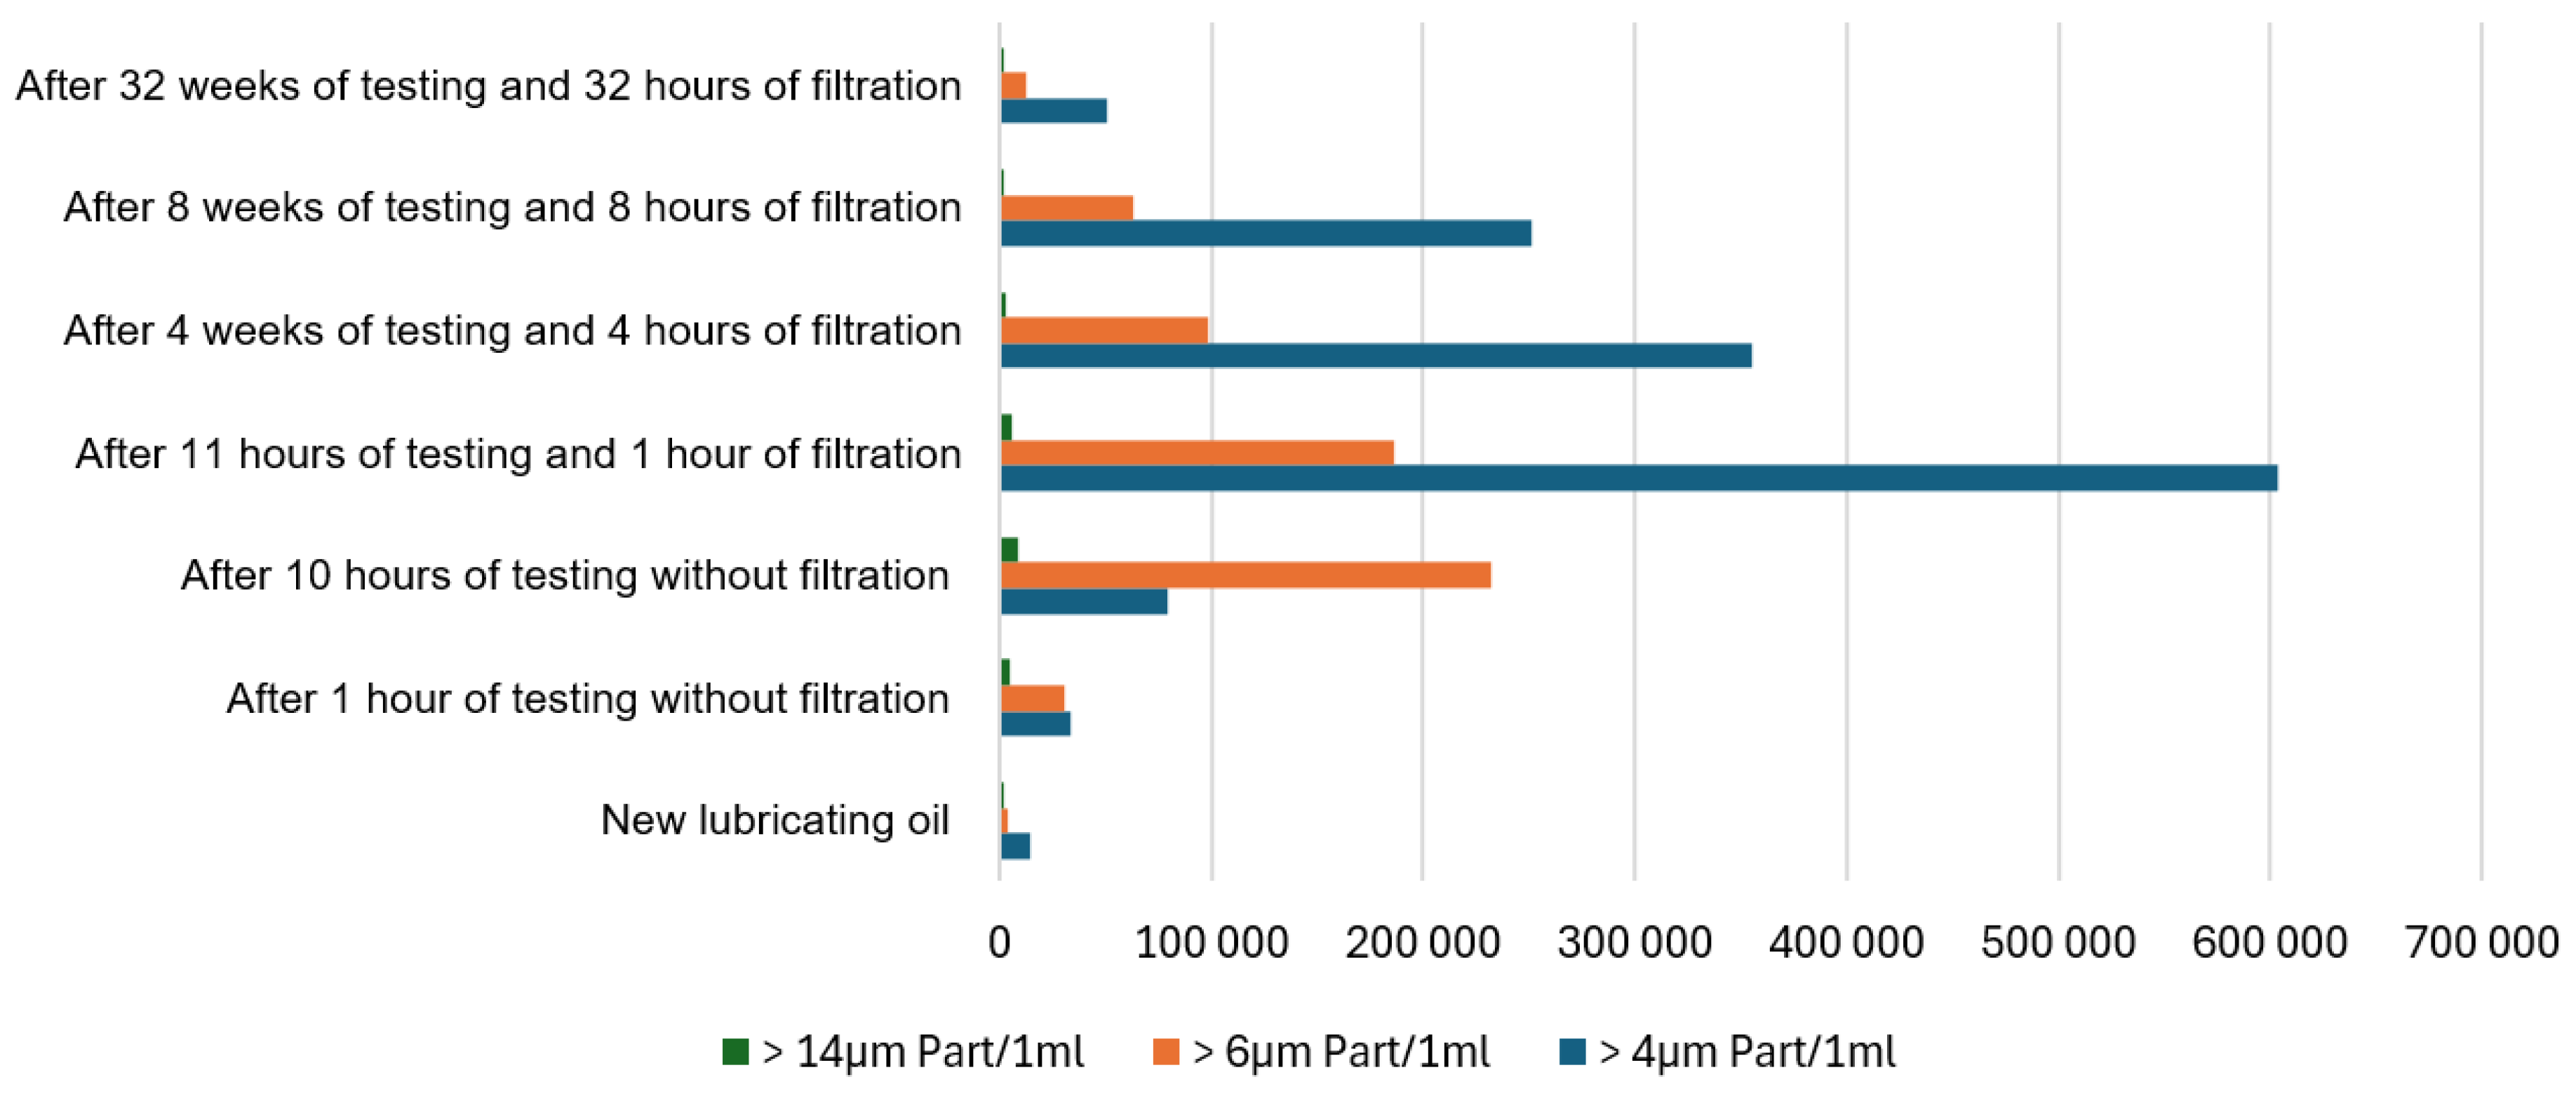
Figure 10.
Elemental analysis of lubricant contamination for selected elements during the operational periods of gearbox module G3.
Figure 10.
Elemental analysis of lubricant contamination for selected elements during the operational periods of gearbox module G3.
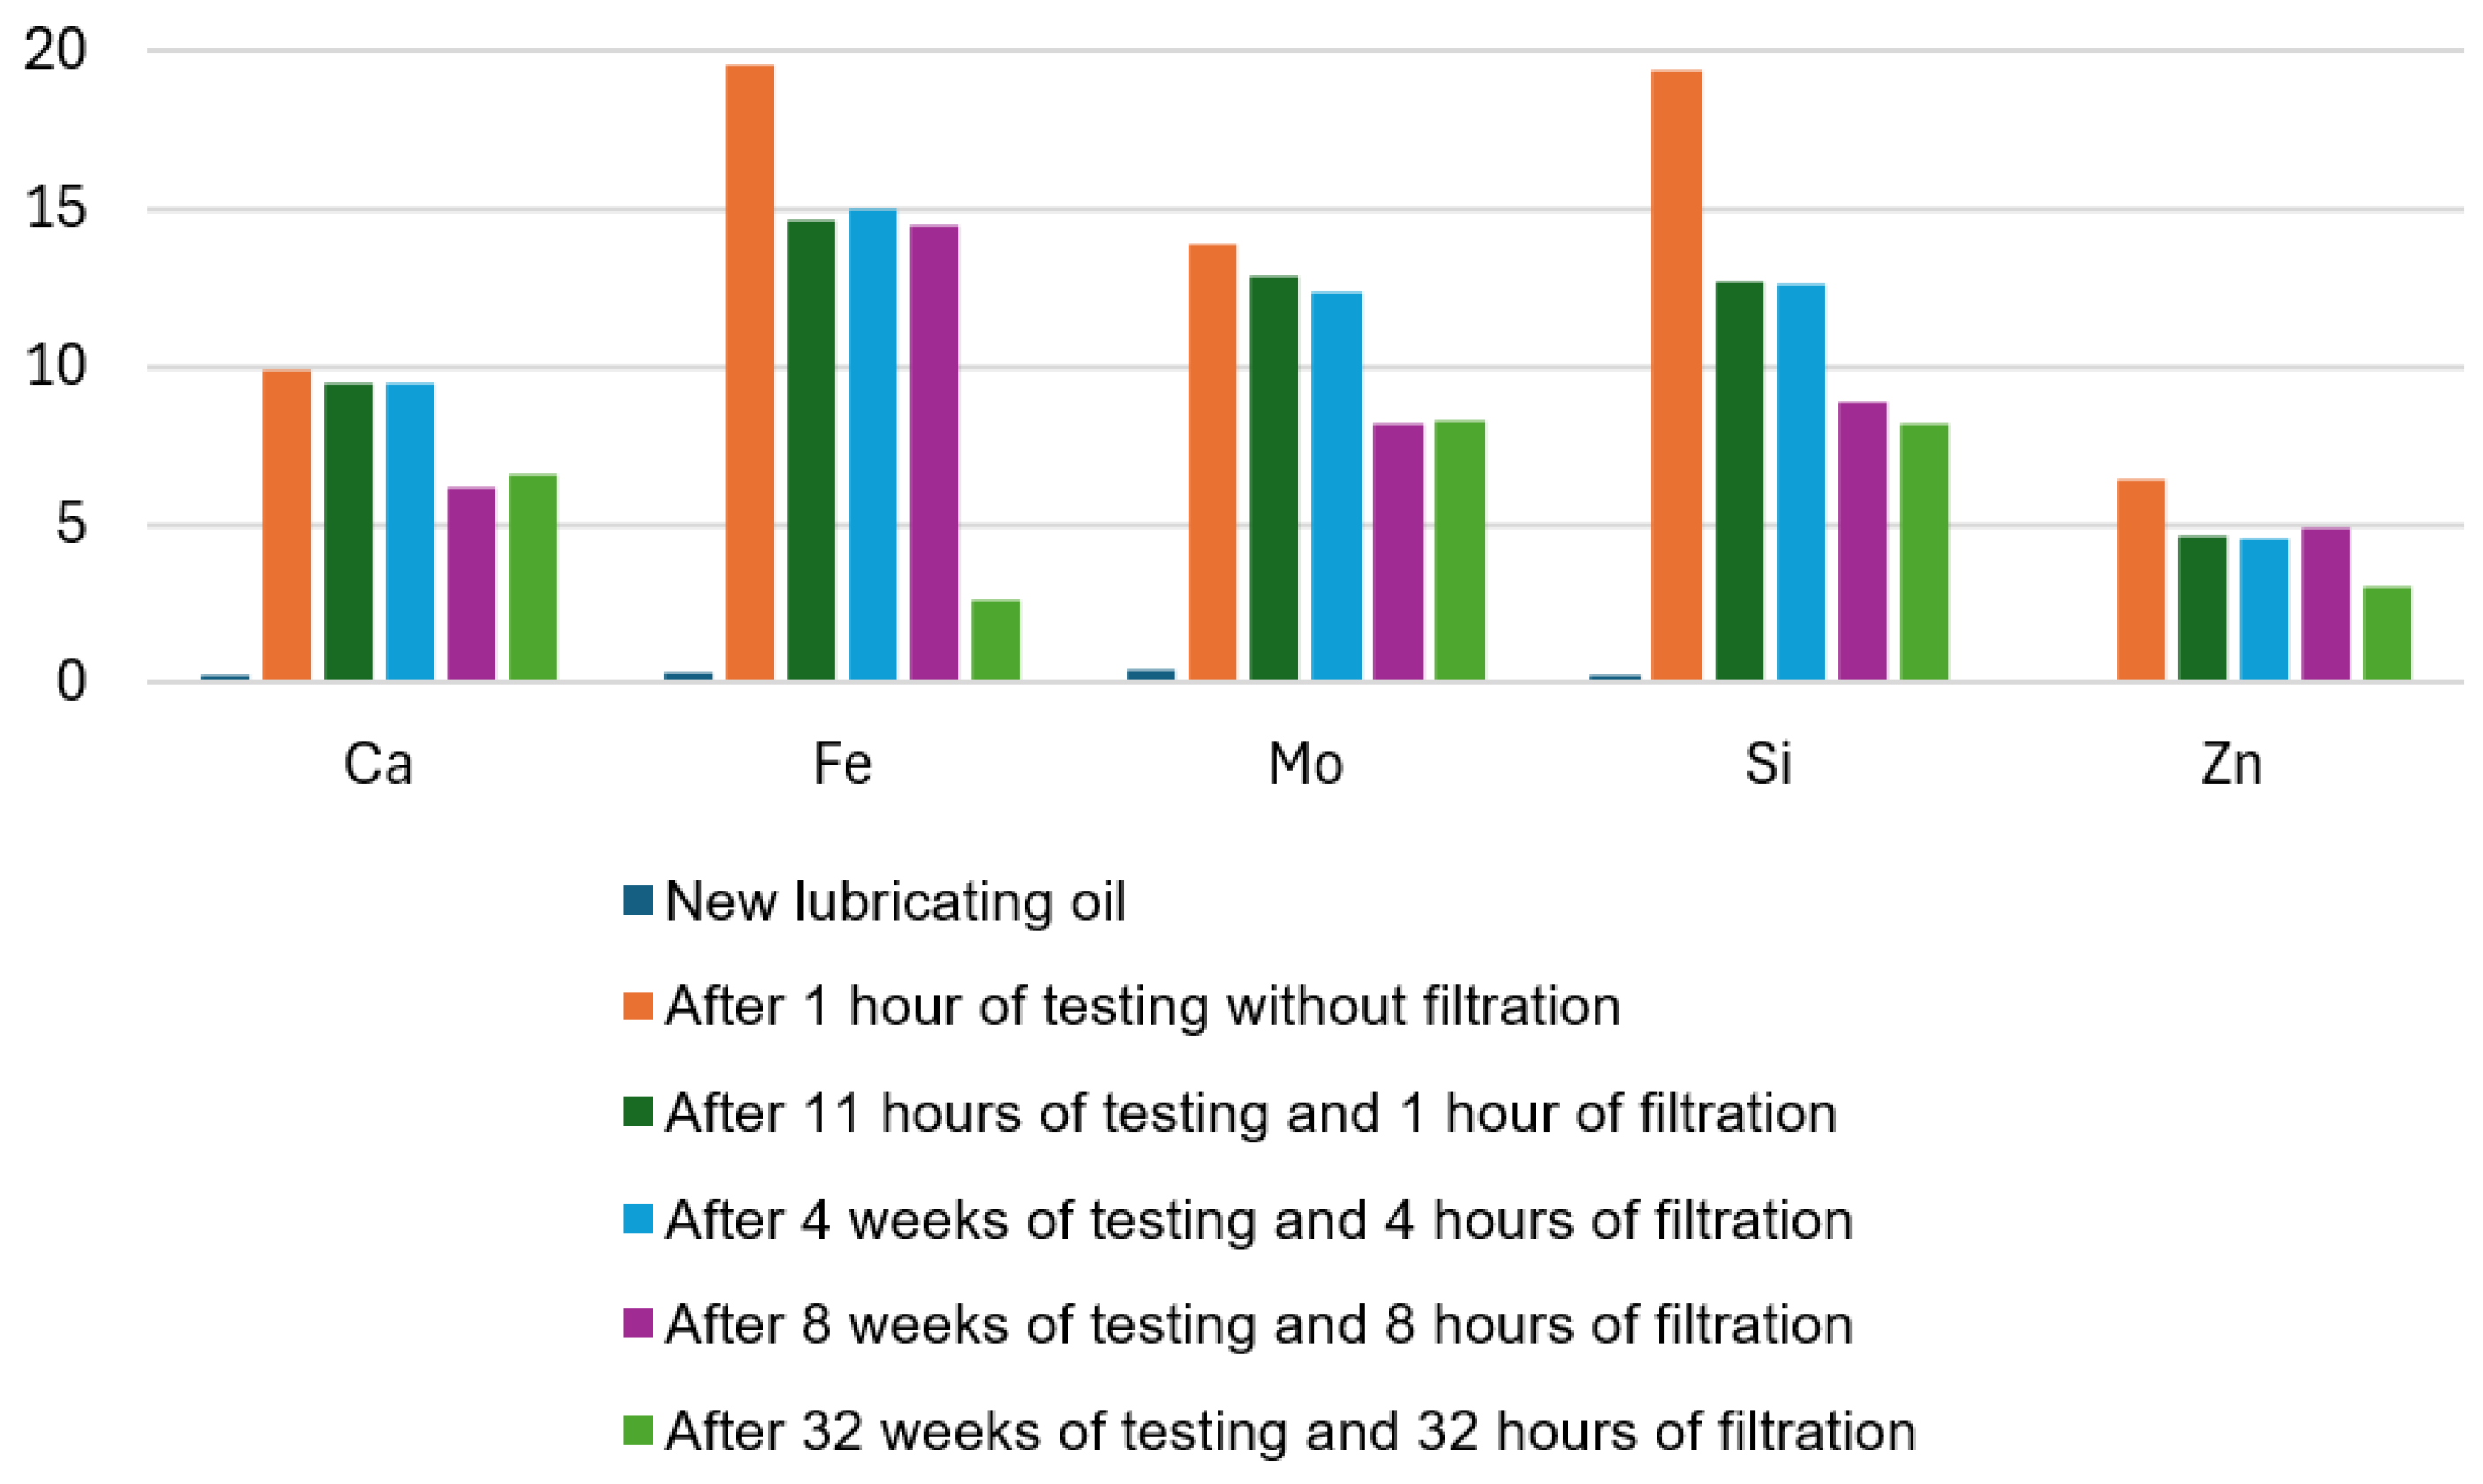
Figure 11.
Graphical representation of the effect of filtration on torque – comparison between gearbox modules G3 and G4.
Figure 11.
Graphical representation of the effect of filtration on torque – comparison between gearbox modules G3 and G4.
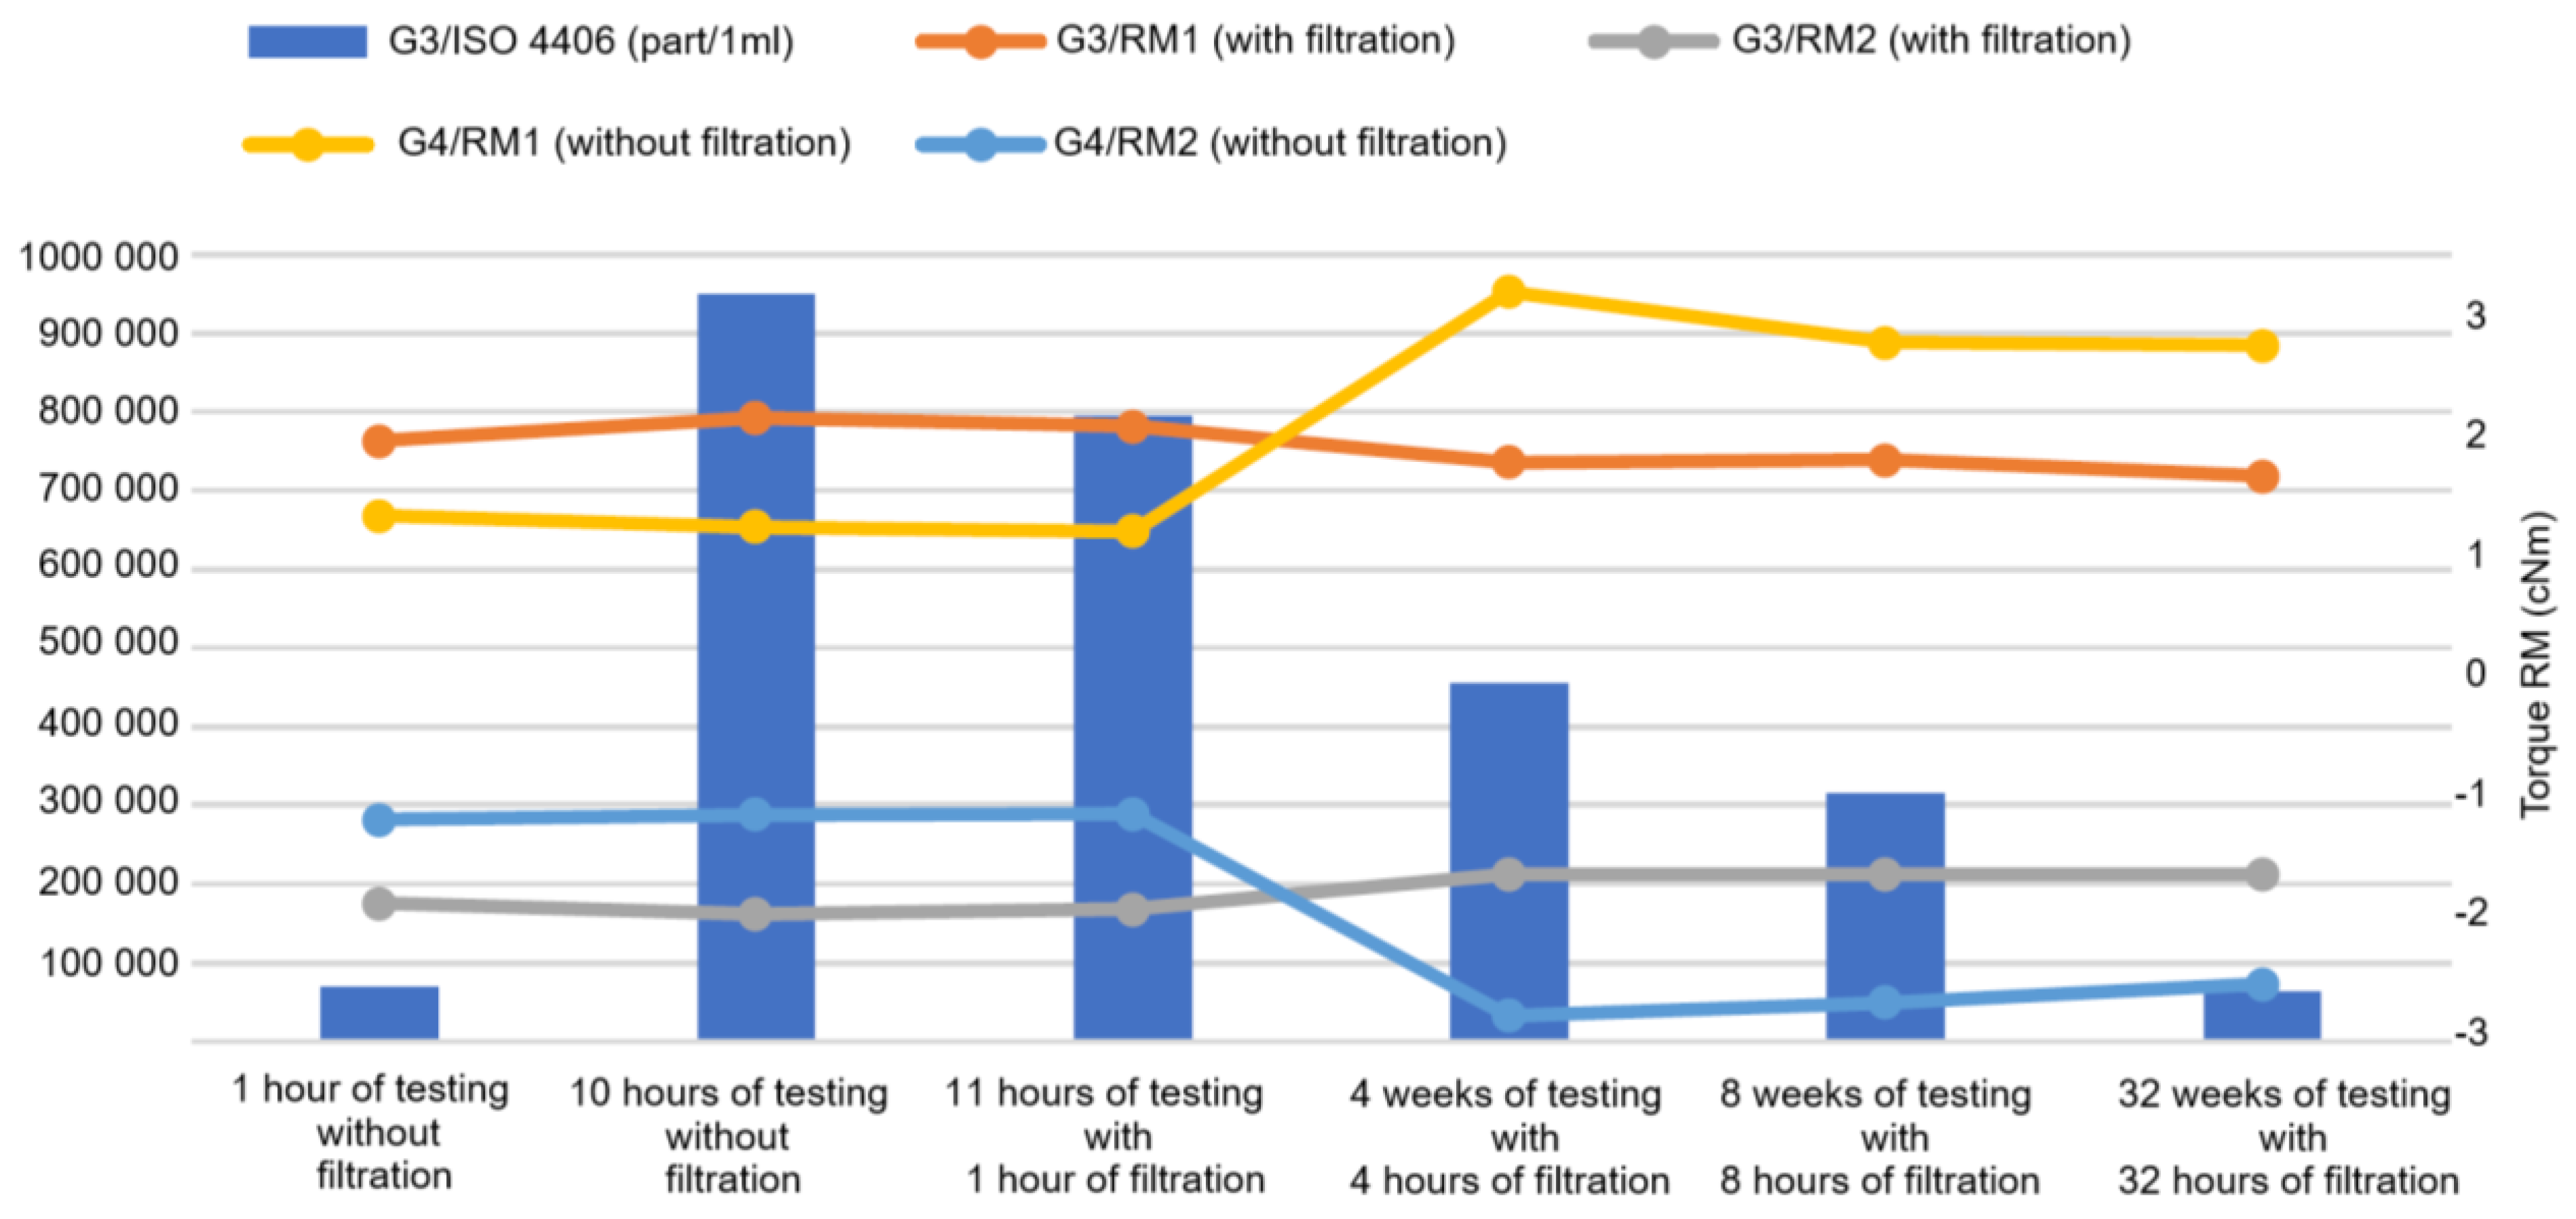
Figure 12.
Graphical representation of the angular transmission error (ATE) – comparison between gearbox modules G3 and G4.
Figure 12.
Graphical representation of the angular transmission error (ATE) – comparison between gearbox modules G3 and G4.
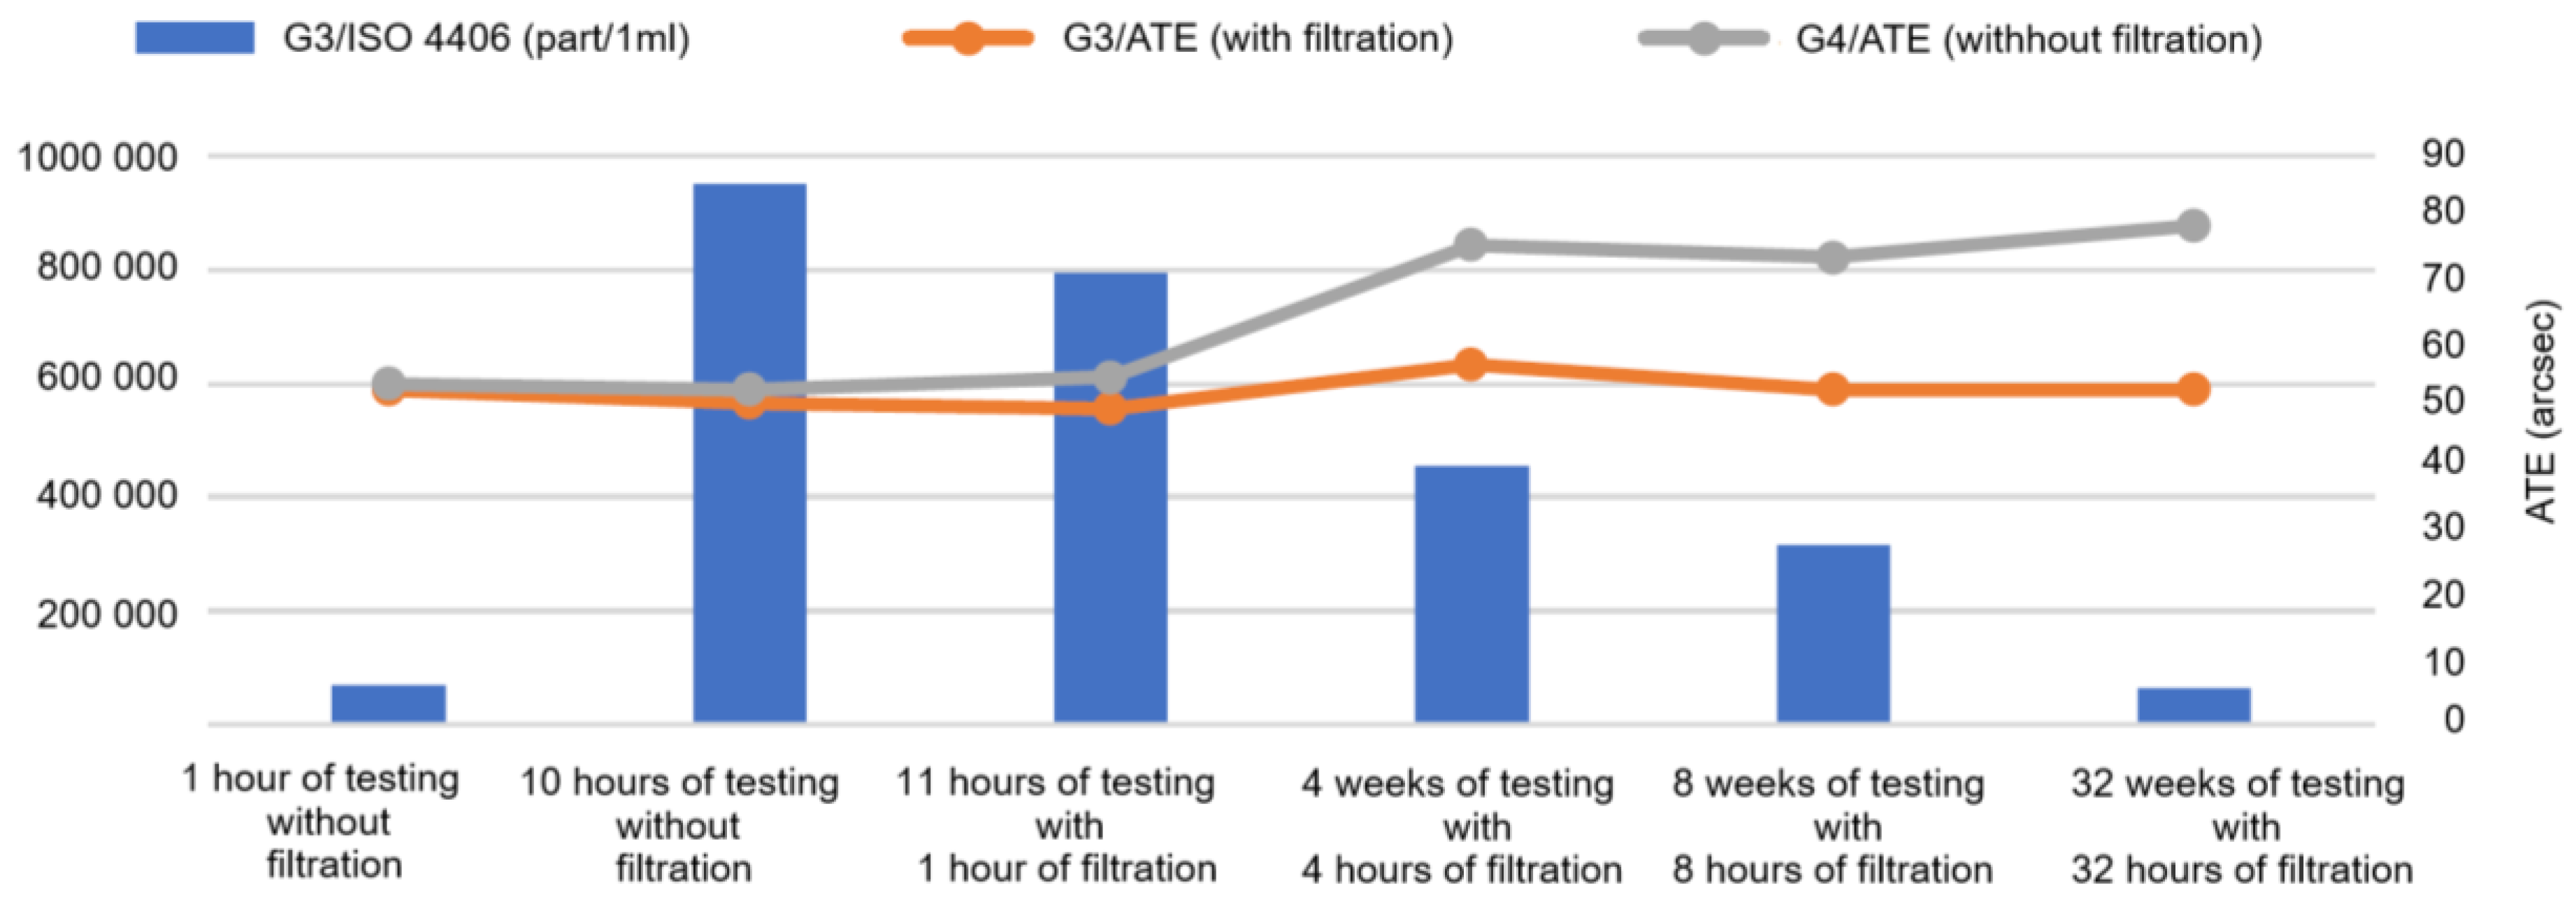

Table 1.
Comparison of Cleanliness Codes.
| Cleanliness Class | Particle Size | ||||||
|---|---|---|---|---|---|---|---|
| Code ISO 4406 | NAS 1638 | 2-5 (μm) | 5-15 (μm) | 15-25 (μm) | 25-50 (μm) | 50-100 (μm) | >100 (μm) |
| 12/10/7 | 1 | 2 500 | 500 | 89 | 16 | 3 | 1 |
| 13/11/8 | 2 | 5 000 | 1 000 | 178 | 32 | 6 | 1 |
| 14/12/9 | 3 | 10 000 | 2 000 | 365 | 63 | 11 | 2 |
| 15/13/10 | 4 | 20 000 | 4 000 | 712 | 126 | 22 | 4 |
| 16/14/11 | 5 | 40 000 | 8 000 | 1 425 | 253 | 45 | 8 |
| 17/15/12 | 6 | 80 000 | 16 000 | 2 850 | 506 | 90 | 16 |
| 18/16/13 | 7 | 160 000 | 32 000 | 5 700 | 1 012 | 180 | 32 |
| 19/17/14 | 8 | 320 000 | 64 000 | 11 400 | 2 025 | 360 | 64 |
| 20/18/15 | 9 | 640 000 | 128 000 | 22 800 | 4 050 | 720 | 128 |
| 21/19/16 | 10 | 1 280 000 | 256 000 | 45 600 | 8 100 | 1 440 | 256 |
| 22/20/17 | 11 | 2 560 000 | 512 000 | 91 200 | 16 200 | 2880 | 512 |
| 23/21/18 | 12 | 5 120 000 | 1 024 000 | 182 400 | 32 400 | 5760 | 1024 |
Table 2.
Cleanliness Classes According to ISO 4406.
| Type of System / Application Environment/ Components Used | Recommended Cleanliness Class According to ISO 4406 |
|---|---|
| Systems with servo components sensitive to fine contamination | 15/13/10 |
Industrial hydraulics
|
17/15/12 |
Industrial and mobile hydraulics
|
18/15/12 19/16/14 |
| Industrial and mobile equipment not requiring high fluid cleanliness | 20/16/15 |
| Pressurized circulating lubrication of gearboxes | 18/16/13 |
Pumps/Drives
|
18/16/13 19/17/13 20/18/15 19/17/14 |
Valves
|
20/18/15 19/17/14 19/17/14 20/18/15 18/16/13 16/14/11 |
Table 3.
Elemental Lubricant Analysis in Individual Modules.
| Chemical Element |
Optigear ALR 150 |
Lubricant in G1 |
Lubricant in G2 |
Lubricant in G3 |
Lubricant in G4 |
|---|---|---|---|---|---|
| Ag | 0.01 | 0.03 | 0.02 | 0.03 | 0.03 |
| Al | 0.36 | 1.68 | 1.75 | 0.86 | 3.25 |
| B | 4.78 | 0.94 | 2.8 | 0.73 | 2.66 |
| Ba | 0.25 | 0.85 | 0.82 | 0.50 | 0.96 |
| Ca | 0.06 | 11.20 | 13.95 | 9.92 | 12.59 |
| Cd | 0.18 | 0.11 | 0.07 | 0.11 | 0 |
| Cr | 0.25 | 0.73 | 1.06 | 0.49 | 1.79 |
| Cu | 0 | 0.74 | 0.74 | 0.11 | 0.53 |
| Fe | 0.33 | 36.61 | 40.72 | 19.60 | 32.88 |
| K | 0.01 | 0.98 | 0.45 | 0.18 | 0.52 |
| Mg | 2.54 | 4.11 | 4.26 | 3.12 | 3.96 |
| Mn | 0.02 | 2.31 | 4.33 | 0.82 | 2.72 |
| Mo | 0.41 | 29.17 | 12.84 | 13.89 | 12.75 |
| Na | 0 | 6.52 | 7.57 | 0.80 | 5.99 |
| Ni | 0 | 1.0 | 0.98 | 0.59 | 1.02 |
| P | 1627.0 | 1434.0 | 1458.5 | 1477.0 | 1475.5 |
| Pb | 0 | 0.20 | 0.43 | 0.32 | 0.30 |
| Sb | 1.9 | 4.08 | 7.10 | 7.72 | 6.20 |
| Si | 0.18 | 23.28 | 21.65 | 19.40 | 16.73 |
| Sn | 1.88 | 1.89 | 1.23 | 0.59 | 1.32 |
| Ti | 0.71 | 1.12 | 1.03 | 1.19 | 1.04 |
| V | 0.38 | 0.30 | 0.37 | 0.43 | 0.70 |
| Zn | 0 | 25.80 | 19.82 | 6.4 | 20.28 |
Table 4.
Lubricant Condition After the First Hour of Run-In According to ISO 4406.
| Modul G1 | Modul G2 | Modul G3 | Modul G4 |
|---|---|---|---|
| Part/1 ml >4μm(c): 132 981.6 24 >6μm(c): 36 568.9 22 >8μm(c): 2 700.6 19 |
Part/1 ml >4μm(c): 9 762.7 20 >6μm(c): 8 695.1 20 >8μm(c): 1 775.9 18 |
Part/1 ml >4μm(c): 33 504.6 22 >6μm(c): 30 250.9 22 >8μm(c): 4 711.0 19 |
Part/1 ml >4μm(c): 291 689.4 25 >6μm(c): 78 166.6 23 >8μm(c): 2 451.3 18 |
Table 5.
Analysis of Lubricant Contamination in Periodic Intervals of Gearbox Module G1.
| Stage of Measurement Interval | ISO 4406 | ||||||
|---|---|---|---|---|---|---|---|
| > 4μm Part/1ml |
Class | > 6μm Part/1ml |
Class | > 14μm Part/1ml |
Class | Final class | |
| New lubricating oil | 14 208 | 21 | 3 413 | 19 | 78 | 13 | 21/19/13 |
| After 1 hour of testing without filtration | 132 088 | 24 | 36 568 | 22 | 2 703 | 19 | 24/22/19 |
| After 10 hours of testing without filtration | 393 088 | 26 | 92 732 | 24 | 3 662 | 19 | 26/24/19 |
| After 11 hours of testing and 1 hour of filtration | 277 427 | 25 | 63 464 | 23 | 2 246 | 18 | 25/23/18 |
| After 4 weeks of testing and 4 hours of filtration | 136 240 | 24 | 32 291 | 22 | 1 132 | 17 | 24/22/17 |
| After 8 weeks of testing and 8 hours of filtration | 73 600 | 23 | 18 626 | 21 | 490 | 16 | 23/21/16 |
| After 32 weeks of testing and 32 hours of filtration | 3 858 | 19 | 943 | 17 | 59 | 13 | 19/17/13 |
Table 6.
Elemental Analysis of Lubricant Contamination across the Monitoring Periods of Gearbox Module G1.
Table 6.
Elemental Analysis of Lubricant Contamination across the Monitoring Periods of Gearbox Module G1.
| Chemical Element |
New lubricating oil |
After 1 hour without filtration |
After 11 hours and 1 hour of filtration |
After 4 weeks and 4 hours of filtration |
After 8 weeks and 8 hours of filtration |
After 32 weeks and 32 hours of filtration |
|---|---|---|---|---|---|---|
| Ag | 0.01 | 0.03 | 0.03 | 0.02 | 0 | 0.02 |
| Al | 0.36 | 1.68 | 0.91 | 1.19 | 0.9 | 0.43 |
| B | 4.78 | 0.94 | 0.57 | 0.75 | 2.3 | 0.27 |
| Ba | 0.25 | 0.85 | 0.58 | 0.58 | 0.4 | 0.46 |
| Ca | 0.06 | 11.20 | 7.64 | 7.84 | 6.9 | 5.19 |
| Cd | 0.18 | 0.11 | 0.15 | 0.13 | 0 | 0.02 |
| Cr | 0.25 | 0.73 | 0.45 | 0.56 | 0.5 | 0.3 |
| Cu | 0 | 0.74 | 0.32 | 0.45 | 0.3 | 0.06 |
| Fe | 0.33 | 36.61 | 23.39 | 20.31 | 19.7 | 2.96 |
| K | 0.01 | 0.98 | 0.39 | 0.39 | 0.2 | 0.04 |
| Mg | 2.54 | 4.11 | 3.48 | 3.47 | 3.2 | 3.22 |
| Mn | 0.02 | 2.31 | 1.46 | 1.36 | 1.1 | 0.58 |
| Mo | 0.41 | 29.17 | 20.68 | 18.68 | 12.7 | 10.19 |
| Na | 0 | 6.52 | 3.21 | 3.12 | 1.7 | 0.85 |
| Ni | 0 | 1.0 | 0.06 | 0.45 | 0.9 | 0.04 |
| P | 1627.0 | 1434.0 | 1490.5 | 1433.5 | 1514.0 | 1407.0 |
| Pb | 0 | 0.20 | 0.39 | 0.12 | 0.3 | 0.18 |
| Sb | 1.9 | 4.08 | 3.21 | 2.98 | 2.6 | 8.01 |
| Si | 0.18 | 23.28 | 14.3 | 14.57 | 10.3 | 7.41 |
| Sn | 1.88 | 1.89 | 1.42 | 1.11 | 1.1 | 1.46 |
| Ti | 0.71 | 1.12 | 0.85 | 0.89 | 0.8 | 0.69 |
| V | 0.38 | 0.30 | 0.42 | 0.42 | 0.2 | 0.66 |
| Zn | 0 | 25.80 | 14.21 | 14.58 | 8.6 | 4.13 |
Table 7.
Analysis of Lubricant Contamination in Periodic Intervals of Gearbox Module G3.
| Stage of Measurement Interval | ISO 4406 | ||||||
|---|---|---|---|---|---|---|---|
| > 4μm Part/1ml |
Class | > 6μm Part/1ml |
Class | > 14μm Part/1ml |
Class | Final class | |
| New lubricating oil | 14 208 | 21 | 3 413 | 19 | 78 | 13 | 21/19/13 |
| After 1 hour of testing without filtration | 33 504 | 22 | 30 250 | 22 | 4 711 | 19 | 22/22/19 |
| After 10 hours of testing without filtration | 79 123 | 27 | 232 354 | 25 | 8 694 | 20 | 27/25/20 |
| After 11 hours of testing and 1 hour of filtration | 603 400 | 26 | 186 233 | 25 | 5 292 | 20 | 26/25/20 |
| After 4 weeks of testing and 4 hours of filtration | 354 996 | 26 | 98 319 | 24 | 2 486 | 18 | 26/24/18 |
| After 8 weeks of testing and 8 hours of filtration | 251 234 | 25 | 63 319 | 23 | 1 414 | 18 | 25/23/18 |
| After 32 weeks of testing and 32 hours of filtration | 50 560 | 23 | 12 583 | 21 | 568 | 16 | 23/21/16 |
Table 8.
Elemental Analysis of Lubricant Contamination across the Monitoring Periods of Gearbox Module G3.
Table 8.
Elemental Analysis of Lubricant Contamination across the Monitoring Periods of Gearbox Module G3.
| Chemical Element |
New lubricating oil |
After 1 hour without filtration |
After 11 hours and 1 hour of filtration |
After 4 weeks and 4 hours of filtration |
After 8 weeks and 8 hours of filtration |
After 32 weeks and 32 hours of filtration |
|---|---|---|---|---|---|---|
| Ag | 0.01 | 0.03 | 0.01 | 0.02 | 0.02 | 0.04 |
| Al | 0.36 | 0.86 | 0.62 | 0.63 | 0.63 | 0.46 |
| B | 4.78 | 0.73 | 0.65 | 0.69 | 0.58 | 0.34 |
| Ba | 0.25 | 0.50 | 0.39 | 0.47 | 0.36 | 0.44 |
| Ca | 0.06 | 9.92 | 9.43 | 9.49 | 6.13 | 6.61 |
| Cd | 0.18 | 0.11 | 0.08 | 0.05 | 0.10 | 0.05 |
| Cr | 0.25 | 0.49 | 0.51 | 0.49 | 0.42 | 0.23 |
| Cu | 0 | 0.11 | 0.09 | 0.14 | 0.10 | 0.04 |
| Fe | 0.33 | 19.60 | 14.65 | 14.99 | 14.50 | 2.63 |
| K | 0.01 | 0.18 | 0.15 | 0.12 | 0.09 | 0 |
| Mg | 2.54 | 3.12 | 3.14 | 3.16 | 3.01 | 3.33 |
| Mn | 0.02 | 0.82 | 0.70 | 0.81 | 0.56 | 0.45 |
| Mo | 0.41 | 13.89 | 12.89 | 12.32 | 8.22 | 8.24 |
| Na | 0 | 0.80 | 1.09 | 1.25 | 0.75 | 0.17 |
| Ni | 0 | 0.59 | 0.54 | 0.48 | 0.55 | 0.02 |
| P | 1627.0 | 1477.0 | 1473.50 | 1483.0 | 1502.5 | 1384.5 |
| Pb | 0 | 0.32 | 0.49 | 0.73 | 0.02 | 0.53 |
| Sb | 1.9 | 7.72 | 6.15 | 3.95 | 5.25 | 8.78 |
| Si | 0.18 | 19.40 | 12.66 | 12.64 | 8.90 | 8.20 |
| Sn | 1.88 | 0.59 | 0.69 | 1.7 | 0.78 | 1.05 |
| Ti | 0.71 | 1.19 | 1.30 | 1.27 | .116 | 0.71 |
| V | 0.38 | 0.43 | 0.26 | 0.42 | 0.32 | 0.50 |
| Zn | 0 | 6.4 | 4.65 | 4.55 | 4.89 | 3.04 |
Disclaimer/Publisher’s Note: The statements, opinions and data contained in all publications are solely those of the individual author(s) and contributor(s) and not of MDPI and/or the editor(s). MDPI and/or the editor(s) disclaim responsibility for any injury to people or property resulting from any ideas, methods, instructions or products referred to in the content. |
© 2025 by the authors. Licensee MDPI, Basel, Switzerland. This article is an open access article distributed under the terms and conditions of the Creative Commons Attribution (CC BY) license (http://creativecommons.org/licenses/by/4.0/).
Copyright: This open access article is published under a Creative Commons CC BY 4.0 license, which permit the free download, distribution, and reuse, provided that the author and preprint are cited in any reuse.


