
Submitted:
03 June 2025
Posted:
04 June 2025
You are already at the latest version
Abstract
The overexpression of atypical protein kinase C-iota (PKC-ι) is a biomarker for carcinogenesis in various cells, such as glioma, ovarian, renal, etc. manifesting as a potential drug target. In previous in vitro studies, ICA-1S and ICA-1T, an experimental candidate for inhibiting PKC-ι, has demonstrated its specificity and promising efficacy against various cancer cell types. Moreover, the in vivo studies have demonstrated low toxicity levels in acute and chronic murine models. Despite these prior developments, the binding affinities of the inhibitors were never thoroughly explored from a biophysical perspective. Here, we present the biophysical characterizations of PKC-ι in combination with ICA-1S/1T. Various methods based on light scattering, intrinsic fluorescence, thermal denaturation, and heat exchange techniques were applied. The biophysical characteristics, including particle sizing, thermal unfolding, aggregation profiles, enthalpy, entropy, free energy changes, and binding affinity (Kd) of the PKC-ι in the presence of ICA-1S were observed. The studies indicate the presence of domain-specific stabilities in the protein-ligand complex. Moreover, the results indicate a spontaneous reaction with an entropic gain, resulting in a possible entropy-driven hydrophobic interaction in the binding pocket. Altogether, the biophysical approaches employed in this research reveal important insights into the binding interactions of PKC-ι and its inhibitors ICA-1S/1T.
Keywords:
PKC-ι inhibitors ICA-1S/1T
; DLS
; nanoDSF
; MST
; ITC
1. Introduction
The protein kinase C (PKC) contributes to the malignant progression of several cancers and pushes past some of the cellular defense mechanisms. It is an enzymatic family of proteins that contributes to carcinogenesis through the action of phosphorylating serine/threonine residues of proteins in cancer cascades [1]. These serine/threonine kinases are generally activated by various stimulating factors such as hormones, growth factors, and neurotransmitters [2,3]. There are three classifications within the PKC family: conventional PKC-α, PKC-βI, and PKC-βII (splice variant) and PKC-γ; novel PKC-δ, PKC-ε, PKC-η and PKC-θ; these two isozyme groups need the neutral lipid diacylglycerol (DAG) as their common activator, where the conventional type needs calcium (Ca2+) additionally. The atypical PKC-ζ and PKC-ι/λ require acidic phospholipids, phosphatidylinositol-1, 3, 5-(PO4)3 (PIP3), and phosphatidic acid (PA) instead of DAG for their activation [4,5].
Both atypical PKCs participate in modulating cancer-promoting cell signaling path-ways [6]. Several in vitro studies, focusing on glioma, melanoma, ovarian and renal cancer cells, indicate the presence of overexpression and the relevance of the PKC-ι oncogene in various cellular mechanisms [7,8,9,10]. Although PKC-ι and PKC-ζ have a close homology (72% overall similar sequence and 84% similar in the catalytic domain), PKC-ι is heavily implicated in regulating tumorigenesis. These characteristics make it a known prognostic biomarker and a therapeutic target [6,11,12,13]. In a previous study, Pillai et al. demonstrated that ICA-1T (Figure 1A) an experimental drug, explicitly inhibits the kinase activity of PKC-ι over PKC-ζ in the presence of myelin basic protein (MBP), a common substrate of PKCs. In addition, ICA-1T exhibited an inhibitory effect inversely proportional to the varying concentrations of MBP, indicating a competitive mode of inhibition [12]. Moreover, in previous in vivo toxicological studies with acute and chronic murine models, ICA-1S (Figure 1B), an analog of ICA-1T, has shown reduced toxicity levels [14,15]. These prior developments necessitate further study to obtain insights into the binding interactions between PKC-ι and these specific inhibitors. Therefore, this study was conducted from a biophysical perspective to address this knowledge gap.
Publications reveal that the full-length and catalytic domain of atypical PKCs is best expressed in insect cell lines due to post-translational modifications (PTMs) and the abundance of eukaryotic protein synthesis machinery [16,17]. Messerschmidt et al. found that the expressed catalytic domain of PKC-ι had a higher molecular mass than predicted using mass spectrometry. However, treatment with the lambda-phosphatase followed by mass spectrometry resulted in a lower molecular mass determination of the purified protein domain. This observation suggested that the post-translational modifications resulted in phosphorylation at one, two, or three different sites within the protein structure [18]. Therefore, in this project, to maintain the optimal environment for PTMs of full-length PKC-ι, High Five Cells (hi5), derived from the ovaries of cabbage loopers (Trichoplusia ni, hereafter referred to as Tn cells) and SF9 cells, derived from the ovaries of Spodoptera frugiperda, were utilized [19]. The Tn cells showed better expression levels during the test expression phase (details in the Materials and Methods section); therefore, the PKC-ι obtained for this study was expressed accordingly from Tn cells.
After an in silico screening of 300,000 compounds (MW<500), 30 potential candidate molecules (Hit), including ICA-1T, a small molecule inhibitor, were selected for specific structural pockets of PKC-ι. In previous investigations, PKC-ι was found to be inhibited by ICA-1T, as determined via in vitro assays and computational analysis. According to the molecular docking results, it was found that ICA-1T interacts with the 469-475 amino acid residues of the catalytic domain of PKC-ι (PDB: 1ZRZ) [12]. In this investigation, besides ICA-1T, we studied the intricate binding interactions and conformational stability profile of PKC-ι while interacting with ICA-1S. The compound is a non-phosphorylated nucleosidic homolog of ICA-1T, which contains a hydroxymethyl group attached in the ‘cyclopentyl’moiety. We have applied micro scale thermophoresis (MST), nano differential scanning fluorimetry (nanoDSF), dynamic light scattering (DLS), and isothermal titration calorimetry (ITC) to understand the biophysical properties of the interactions and further corroborate our previously published in vivo, in vitro, and in silico findings [10,15]. The pre-conditional validation and protein-ligand complex stability characterization were studied with the state-of-the-art instrument PR.Panta by NanoTemper Technologies. The instrument combines multiple characterization factors such as thermal stability, protein folding status, aggregation, turbidity information, and protein self-association during the protein-ligand conjugate formation [20,21]. This multi-parameter information on protein conformational and colloidal stability is crucial in determining the optimum conditions for the protein ligand affinity study. In PR.Panta control outputs software (NanoTemper Technologies) Onset (TON) is a parameter that marks the temperature at which a physical change in the protein molecule, such as unfolding, size increase (cumulant radius), or aggregation, initiates. It must not be exceeded for any subsequent experiments. The inflection point (IP) is the temperature at which these biophysical properties change to their maximum, and the corresponding first derivative plots are used to visualize.
The conformational stability profile of the protein domains due to the introduction of the ligand in the bound state is a crucial factor to understand [22]. Moreover, the buffer system used during experiments must suit the protein-drug affinity study [23]. PR.Panta provides this information on the target protein by utilizing DLS. In brief, the DLS technique (also known as photon correlation spectroscopy) quantifies the Brownian motion of a protein in a solution as the macromolecules are constantly being collided with solvent molecules. The omnidirectional nature and light intensity of the incident laser light on the macromolecule in motion are detected. The continuous motion of the large-sized molecules, such as proteins in solution, will cause a Doppler broadening of both mutually constructive and destructive phases to produce detectable signals. The mathematical correlation of light intensity fluctuations of the scattered light with respect to time in ns-µs level determines the level of rapid intensity fluctuations. This intensity change in scattered light gives insight into the diffusion behavior directly correlated to the homogeneity of the macromolecule [24]. In PR. Panta DLS analysis, the cumulant fit model, first developed by Koppel in 1972, is a frequently used method for DLS data fitting. The autocorrelation function (ACF) was used to obtain a single averaged diffusion coefficient, which results in a single averaged hydrodynamic radius (rH) and a polydispersity index (PDI). Mathematically, the ACF is fit by a polynomial series expanding around the mean decay rate:
here, B is the baseline, β is the amplitude, µ2 is a factor for polydispersity, and τ is the time increment. The mean decay rate Γ is proportional to the mean translational diffusion coefficient D, which calculates rH [25].
g2 (τ) − (B + β exp(−2Γτ)(1 + µ2/2 τ2)2)
The nano-differential scanning fluorimetry (nanoDSF) mechanism utilizes the intrinsic fluorescence of the aromatic side chains of hydrophobic residues like tryptophan and tyrosine in the protein structure. Unlike conventional DSF, the nanoDSF is a dye-free method that monitors the thermal unfolding as the microenvironment polarity of these hydrophobic residues changes [26]. Moreover, the gradual unfolding of the protein structure exposes the tryptophan amino acid residues from the hydrophobic core, and the fluorescence emission spectra result in a redshift profile. The thermally denatured protein provides the intrinsic fluorescence signals at 350 nm (unfolded state emission maximum) and 330 nm (folded state emission maximum), plotted as a ratio against a temperature range. As the gradual exposure to the fluorescence source intensifies, a fluorescence intensity ratio of 350/330 nm is registered. Therefore, the unfolding profile of a protein based on fluorescence signals against temperature provides insight into the structural stability of a protein in the presence and absence of a ligand in a specific buffer [27]. Consequently, the plot provides the biophysical perspective for understanding the transitions from folded to unfolded state with an inflection point (IP), a parameter often interchangeably used with the melting points (Tm). A multi-domain protein may exhibit more than one unfolding event or transition, as indicated by the IPs. If a protein’s stability changes due to a reason, such as introducing a foreign molecule, then its IP will likely change [28]. In general, the higher the IP, the more stable the protein under investigation. Here, we have shown the protein unfolding and aggregation profiles of the PKC-ι with or without ICA-1S in phosphate-buffered saline, PBS (137 mM NaCl, 2.7 mM KCl, 10 mM Na2HPO4, and 1.8 mM KH2PO4, pH 7.4).
The turbidity profile describes the changes in the light scattering pattern due to the cloudiness of a solution caused by the suspended particles [29]. The part of incident light from the light source is transmitted (non-scattered light) and is used for turbidity measurements. In the PR.Panta system, the turbidity is measured using the back-reflected part of the incident light (residual light) attenuation to understand the aggregation behavior of a protein sample. The back reflection technology mainly depends on a non-constant parameter called polarizability, other than constant parameters such as the angle between the detector and light source, the distance between the detector and the particle, the wave number and incident light intensity. Moreover, the intensity of the residual light back-reflected after a light scattering caused by a single particle depends on the refractive index and the diameter of the particle. In a protein sample with aggregates, the incident light will be scattered differently depending on the parameters above for each aggregate. As a result, the rest of the light will proportionally decrease based on the aggregate concentration. Therefore, the back-reflected light was measured in the PR. Panta system is influenced by the refractive index of the protein, particle diameter and aggregate concentrations. An increase in detected mAu indicates an increase in particle size and a decrease in the aggregate concentration. A higher IP in the turbidity profile indicates higher stability of the protein [21]. The turbidity profile of a protein reflects the turbidity average and the inflection increase parameter for both the free-state and bound-state. The turbidity average is the average of all data points after the inflection point. MST uses infrared laser-induced localized temperature fields exerted on a molecule of interest during protein-ligand interaction analysis. The (bio-) molecules in motion due to the temperature fields become highly sensitive to the molecule-solvent interface (thermophoretic effect). During a binding event, minuscule changes in conformation, charge and molecular size induced by the interaction are quantified [30]. When a molecule displays this directed movement due to the temperature gradient, then molecular size, effective surface charge and hydration entropy are affected.
In MST, during a binding event, a local change in concentration results in a quantifiable fluorescence variation in the given sample, which is detected in MST as signals. Hence, when a protein-ligand reaches a binding equilibrium, an affinity constant can be measured where a fluorescence excitation/emission module is coupled with an infrared (IR) laser in the experimental setup. A Kd is calculated for the interaction of two hetero molecules from measured normalized fluorescence (Fnorm) [31]. Usually, for MST analysis, the ratio of fluorescence values after 1 s and 30 s IR-laser heating is recorded with respect to the concentration of the ligand. In this way, the normalized fluorescence values are free from the initial temperature jump (T-jump) and only fluorescence changes due to the change in the concentrations are considered [32,33,34].
In brief, ITC is a label-free method that measures the intricate heat transfer during a protein-ligand or protein-protein interaction in an adiabatic system. In the instrument, changes in heat energy are quantified based on a reference cell filled with water when the other cell contains the sample. The binding partner is injected from an injection syringe. A binding event results in a temperature difference between cells that is compensated by the instrument’s heaters. This heat compensation is represented by the differential power and utilized to obtain the thermodynamic parameters of the binding reaction. The binding event can be exothermic (heat-releasing) or endothermic (heat-absorbing) in nature. Depending on the heat exchange, the thermodynamic parameters such as enthalpy, entropy, free energy of reaction, and affinity can be calculated [35] [36].
2. Results
2.1. The DLS Analysis Indicates PKC-ι and ICA-1S Homogeneity in the Protein-Ligand Complex
The DLS data on PKC-ι shows a predominantly single polydispersity index (PDI) of 0.30 ± 0.02, indicating a vastly monodispersed and homogeneous status of the PKC-ι (Figure 2). As a macromolecular particle, in the presence of ICA-1S, the target PKC-ι retains mostly its macromolecular homogeneity in solution.
2.2. The nanoDSF Results Indicate a Stable PKC-ι and ICA-1S Complex Formation
Upon observing the intrinsic fluorescence of PKC-ι during thermal denaturation represented by the first derivative of the ratio 350 nm / 330 nm, indicates a 0.55 °C shift in the domain-specific unfolding (on Figure 3B, left side, red peak, first domain). In contrast, the other peak remains unperturbed at 50.45 °C (red peak, right side, second domain) before and after the conjugate formation. This thermal shift indicates a change in protein stability, as observed after a potential binding event. The dashed lines indicate the inflection points, and the dotted lines indicate the TON points.
2.3. Turbidity Profile of PKC-ɩ and ICA-1S Indicates a Ligand-Induced Conformational Stability Enhancement
According to the turbidity profile, in the case of the free-state of PKC-ι, the inflection point peaks at 71.90 °C (Figure 4, black dashed line), while the same for the ICA-1S bound state of PKC-ɩ is at 73.30 ◦C (Figure 4, red dashed line). The higher turbidity IP indicates that the aggregation started earlier for the free state of PKC-ɩ than in the bound state. The increased steepness of the slope of the inflection points and higher amplitude of the turbidity signal in the free state compared to the complex indicate that PKC-ɩ in the free state aggregates relatively faster than the PKC-ι and ICA-1S conjugate. This characteristic also indicates that a ligand-induced conformational stability enhancement may have occurred at the binding site. In addition, the cumulant radius profiles for the free and bound states were nearly identical, indicating that in both cases, the change in the average particle size began at the same temperature despite the enhanced stability observed in the bound state of PKC-ι (Figure 5).
2.4. Determination of Binding Affinity by MST Using NHS-Ester Labeled PKC-ι
The efficient stoichiometric NHS-ester (N-hydroxysuccinimidyl) labeling of PKC-ι is the prerequisite for a binding interaction study with MST [37]. The NHS-ester group of the labeling dye covalently bonds with the primary amino acid lysine. In MST analysis, if present, the aggregated biomolecules may indicate a protein sample’s poor quality and functionality. The aggregate can form for various reasons, such as the hydrophobic interaction of the incoming molecule (drug) with the partially denatured protein sample, exposing its hydrophobic core. In addition, the pH level equal to the isoelectric point (pI) of the protein may result in nonspecific binding due to the reduction of electrostatic repulsion between the proteins, causing aggregation. An aggregated sample deteriorates the MST analysis and affects the reproducibility of the experiments by increasing the noise level. Here, an initial single-point protein-ligand titration of 30 nM of PKC-ι with 5 µM ICA-1T reveals a clear binding event with sufficient fluorescence intensity.
Initial screening of MST fluorescent count and binding check for ICA-1S and PKC-ι were performed. These pretest MST experiments were performed to obtain a qualitative yes/no answer for developing an ideal MST binding assay. The concentration of the non-labeled binding partner (ICA-1T) was kept constant at 5 µM, while the concentration of the labeled PKC-ι was tested at 30 nM and 100 nM. After a 30-minute incubation, the samples were loaded into premium Monolith NT.115 Capillaries (NanoTemper Technologies, MOK025), and the MST measurements were performed using the Monolith X (NanoTemper Technologies). An MST on-time of 1.5 s was used for analysis and a Kd of 1.13 ± 0.23 µM. The MST experiments were conducted at medium MST power at 25 °C with the LED (light-emitting diode) power set to 100%. The signal obtained from this pre-conditional screening exhibits no irregularity, indicating the absence of a large cluster of biomolecules (aggregates) and particles that could traverse through the detection volume of the sample (Figure 6). The absence of any aggregation also indicates that no fluorescence variation, adsorption, or ligand-induced photo-bleaching rate changes were present. Moreover, the addition of detergent (0.005% Tween-20) and the pH value of the buffer were found to be suitable for performing additional MST experiments.
Figure 6.
The pre-conditional MST experiments. The relative fluorescence intensities show no presence of fluorescence variation, adsorption, aggregation or ligand-induced photobleaching. Hence, these conditions were followed by all other MST experiments. A) The relative fluorescence at 650 nm and B) The relative fluorescence at 670 nm with their ratio (N=3 independent measurements for both free and bound state).
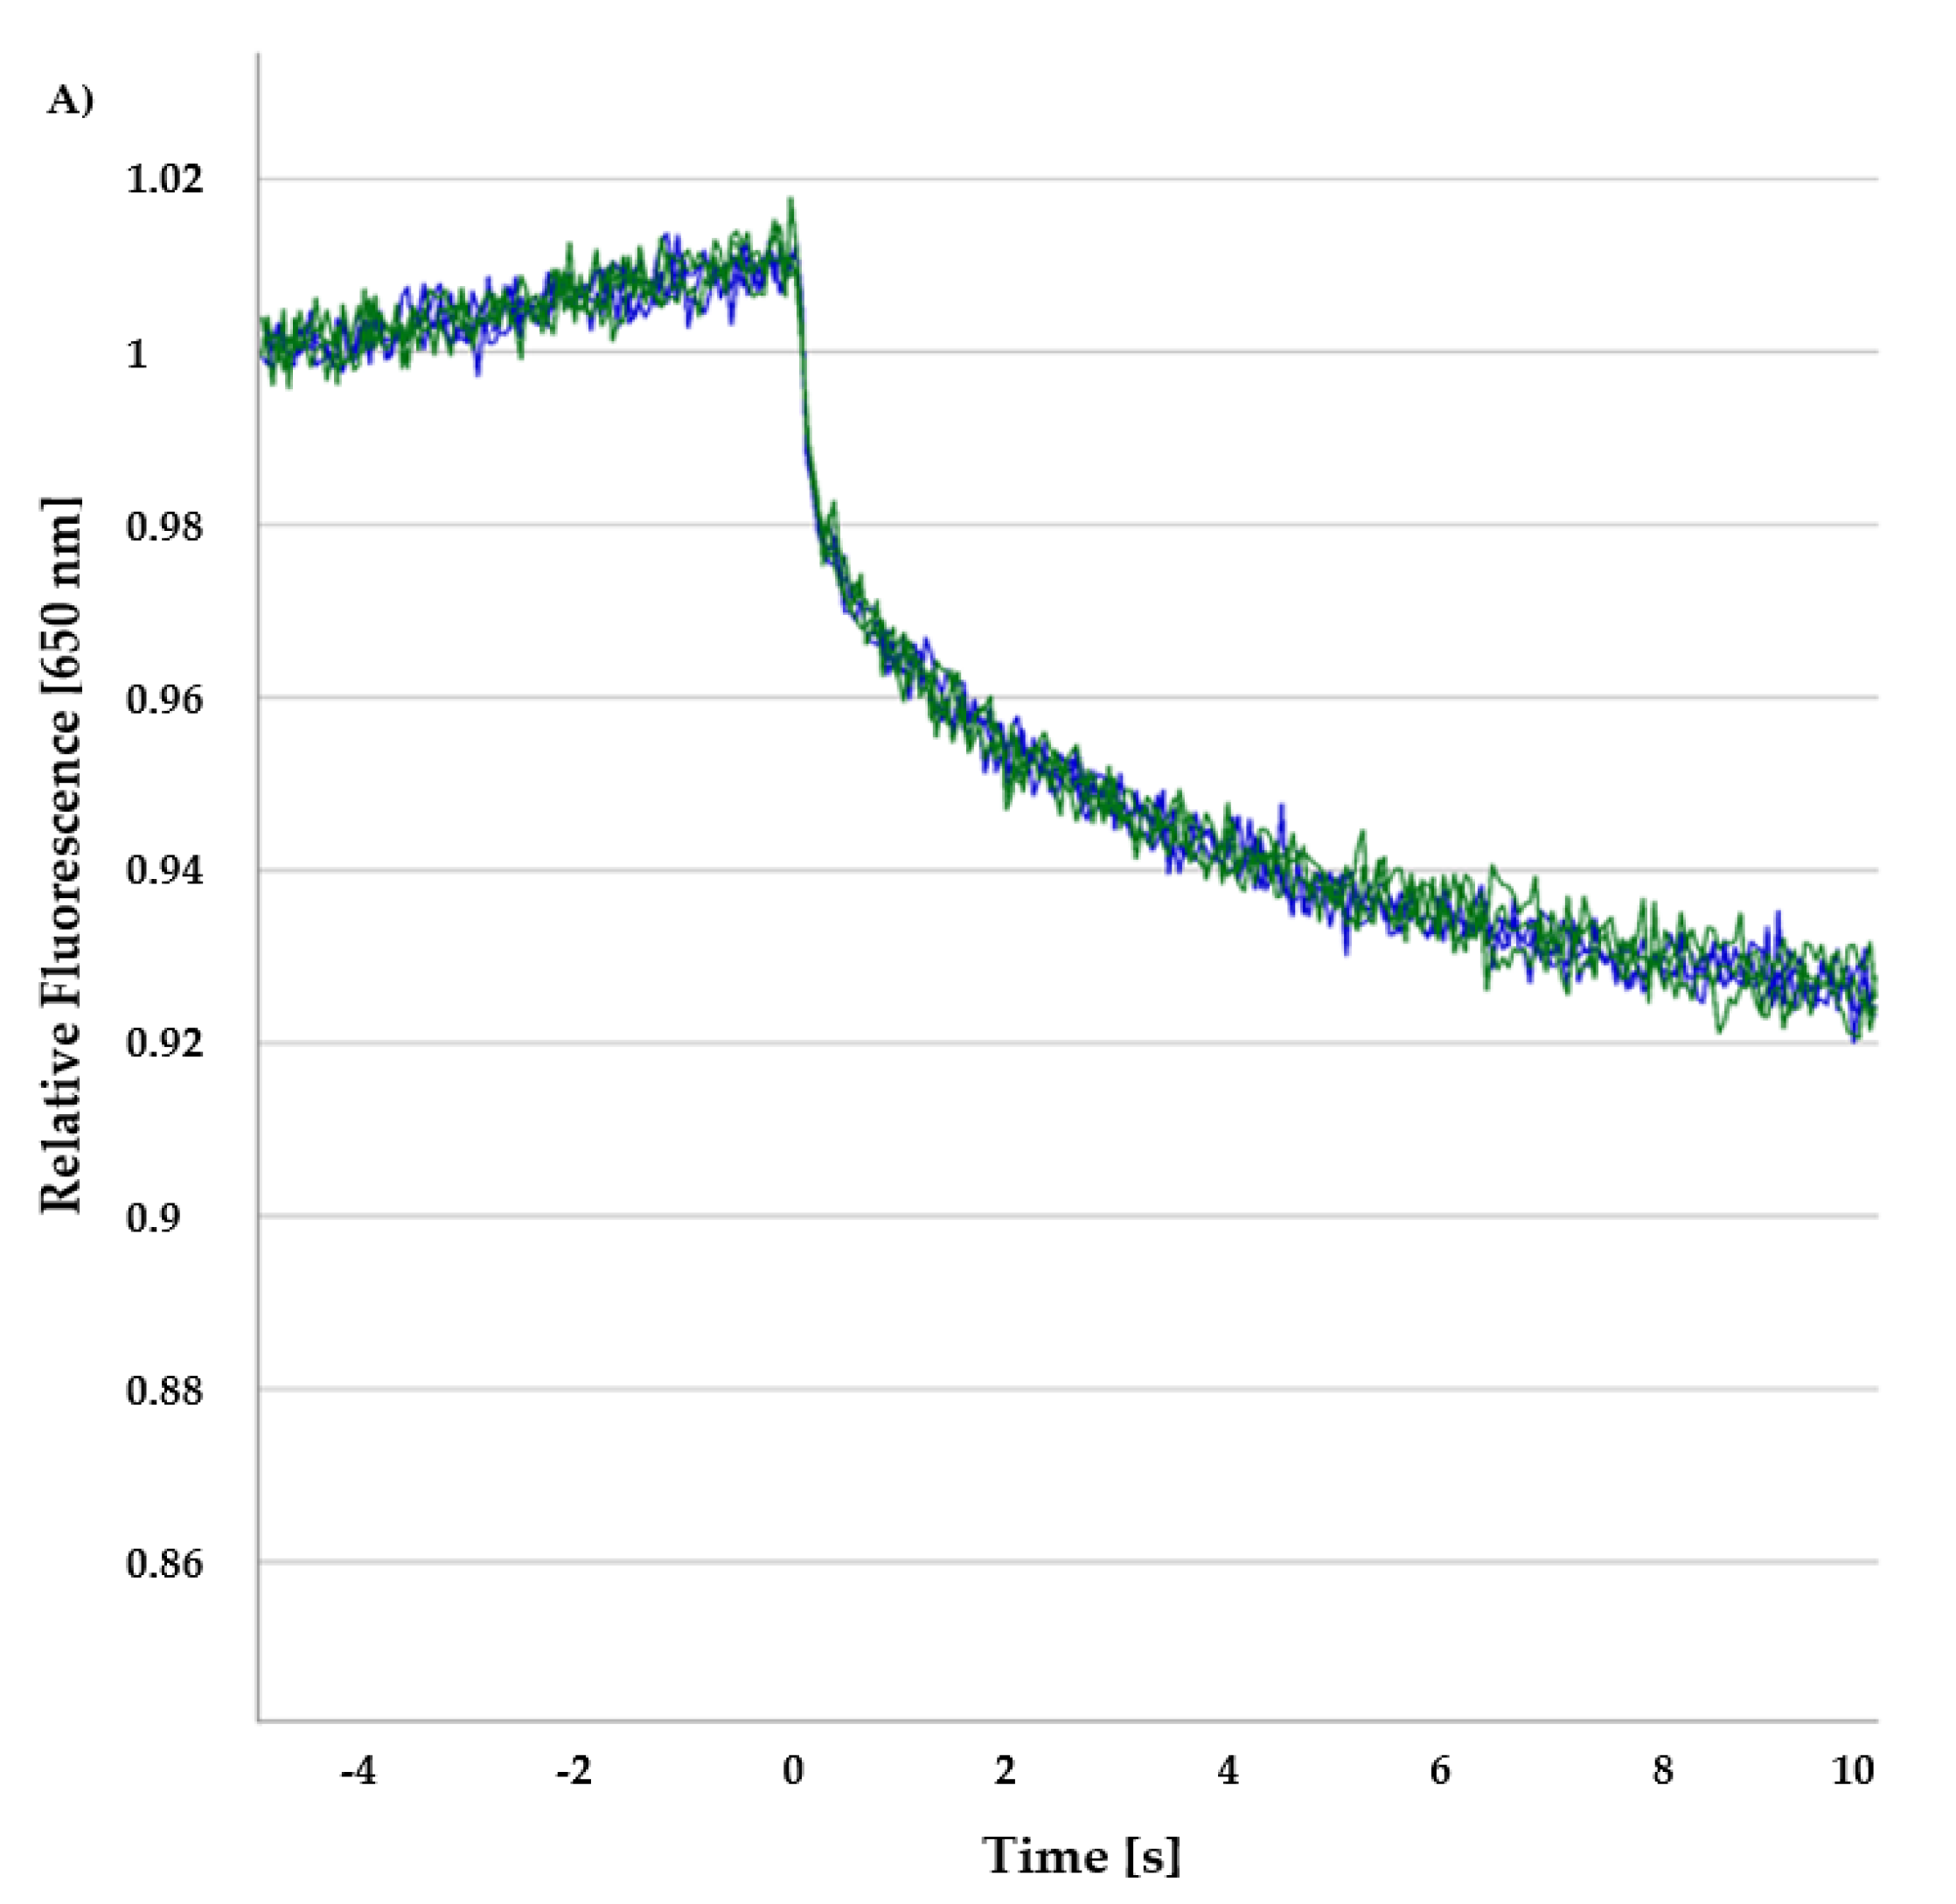
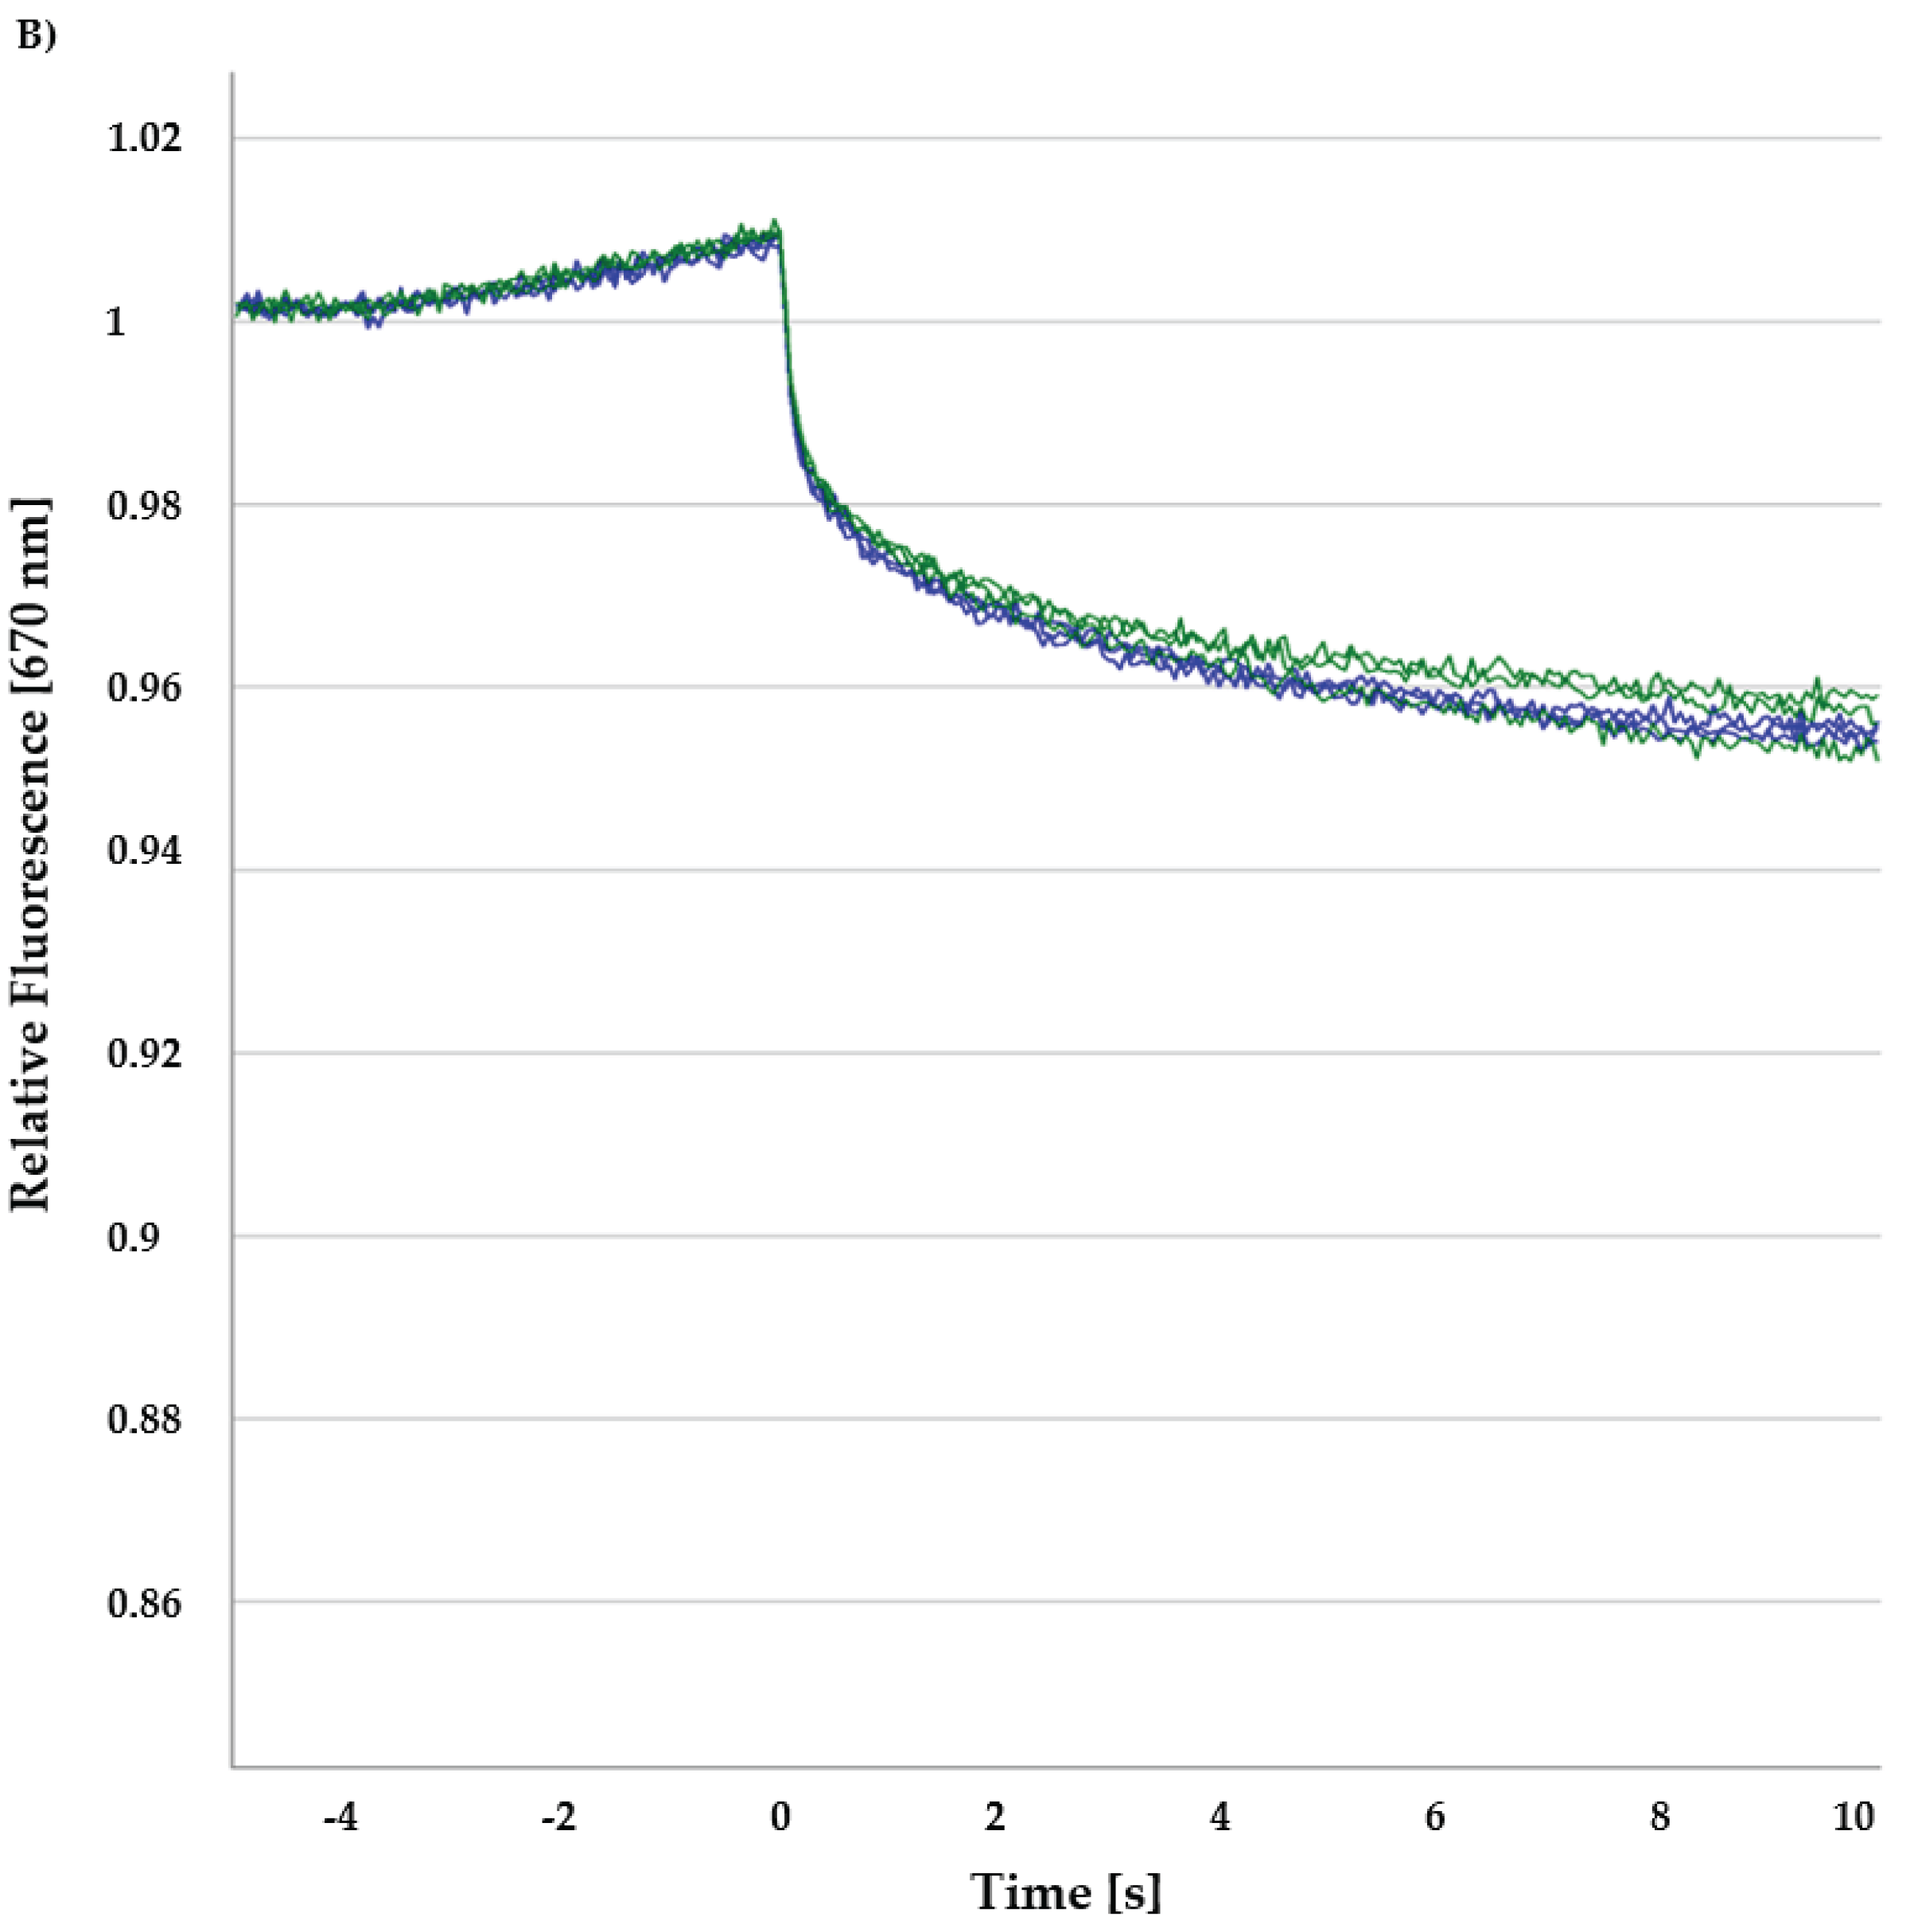
Figure 7.
PKC-ι and ICA-1S interaction on MST. The target protein and the specific inhibitor ICA-1S show interaction, as observed from the normalized fluorescence vs. ligand concentration [M] plot. In this MST experiment, the concentration of the RED-NHS (2nd Gen) labeled PKC-ι was kept constant (30 nM), while the concentration of the non-labeled binding partner (ICA-1S) was varied between 0.0030 µM–100 µM. The MOcontrol software (NanoTemper Technologies) was used to analyze the MST measurements (fit model: Kd model, 670 nm, response amplitude = 2.2, and signal-to-noise ratio = 6.5). Additionally, 0.005 % Tween-20 was added to the PBS buffer during MST data acquisition. Otherwise, both the target and ligand were in identical PBS buffer conditions. After 1 hour of incubation, the samples were loaded into premium Monolith high-sensitivity Capillaries and the MST measurements were performed using the Monolith Xs. An MST on-time of 2.5 s was used for analysis, and a Kd of 9.14 ± 0.19 µM was derived for this interaction (N=3 independent measurements; error bars represent the standard deviation).
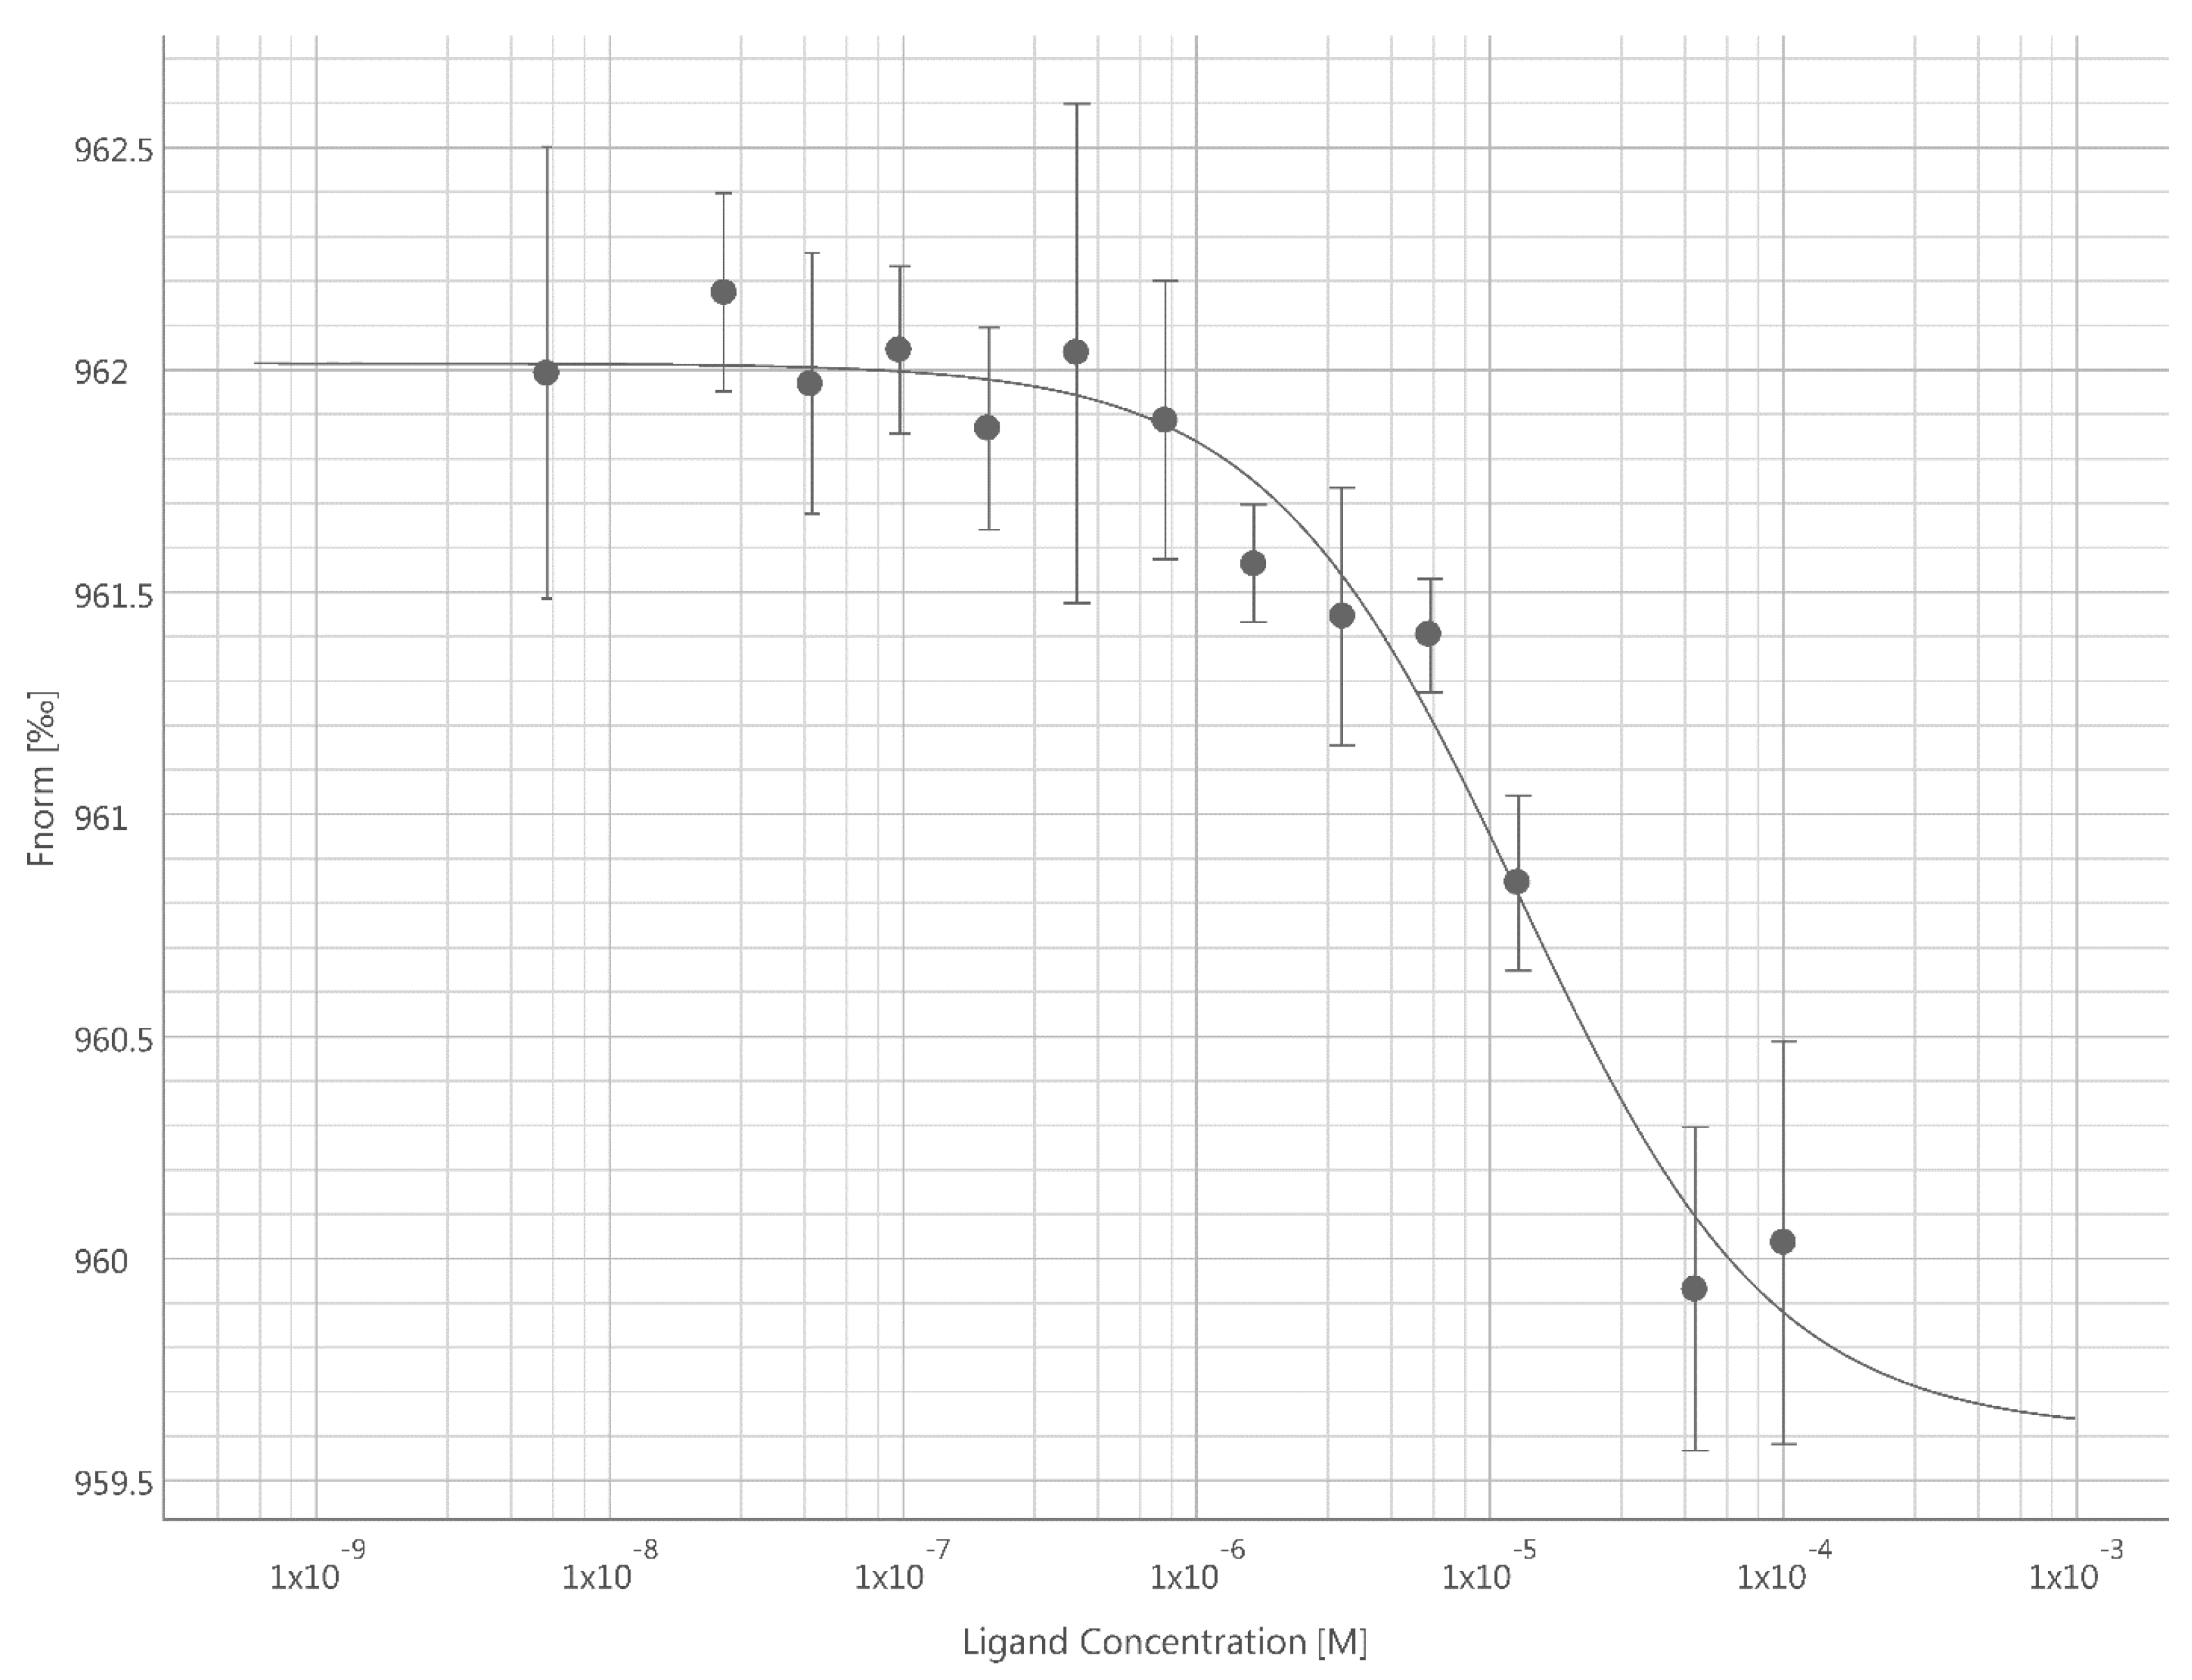
Figure 8.
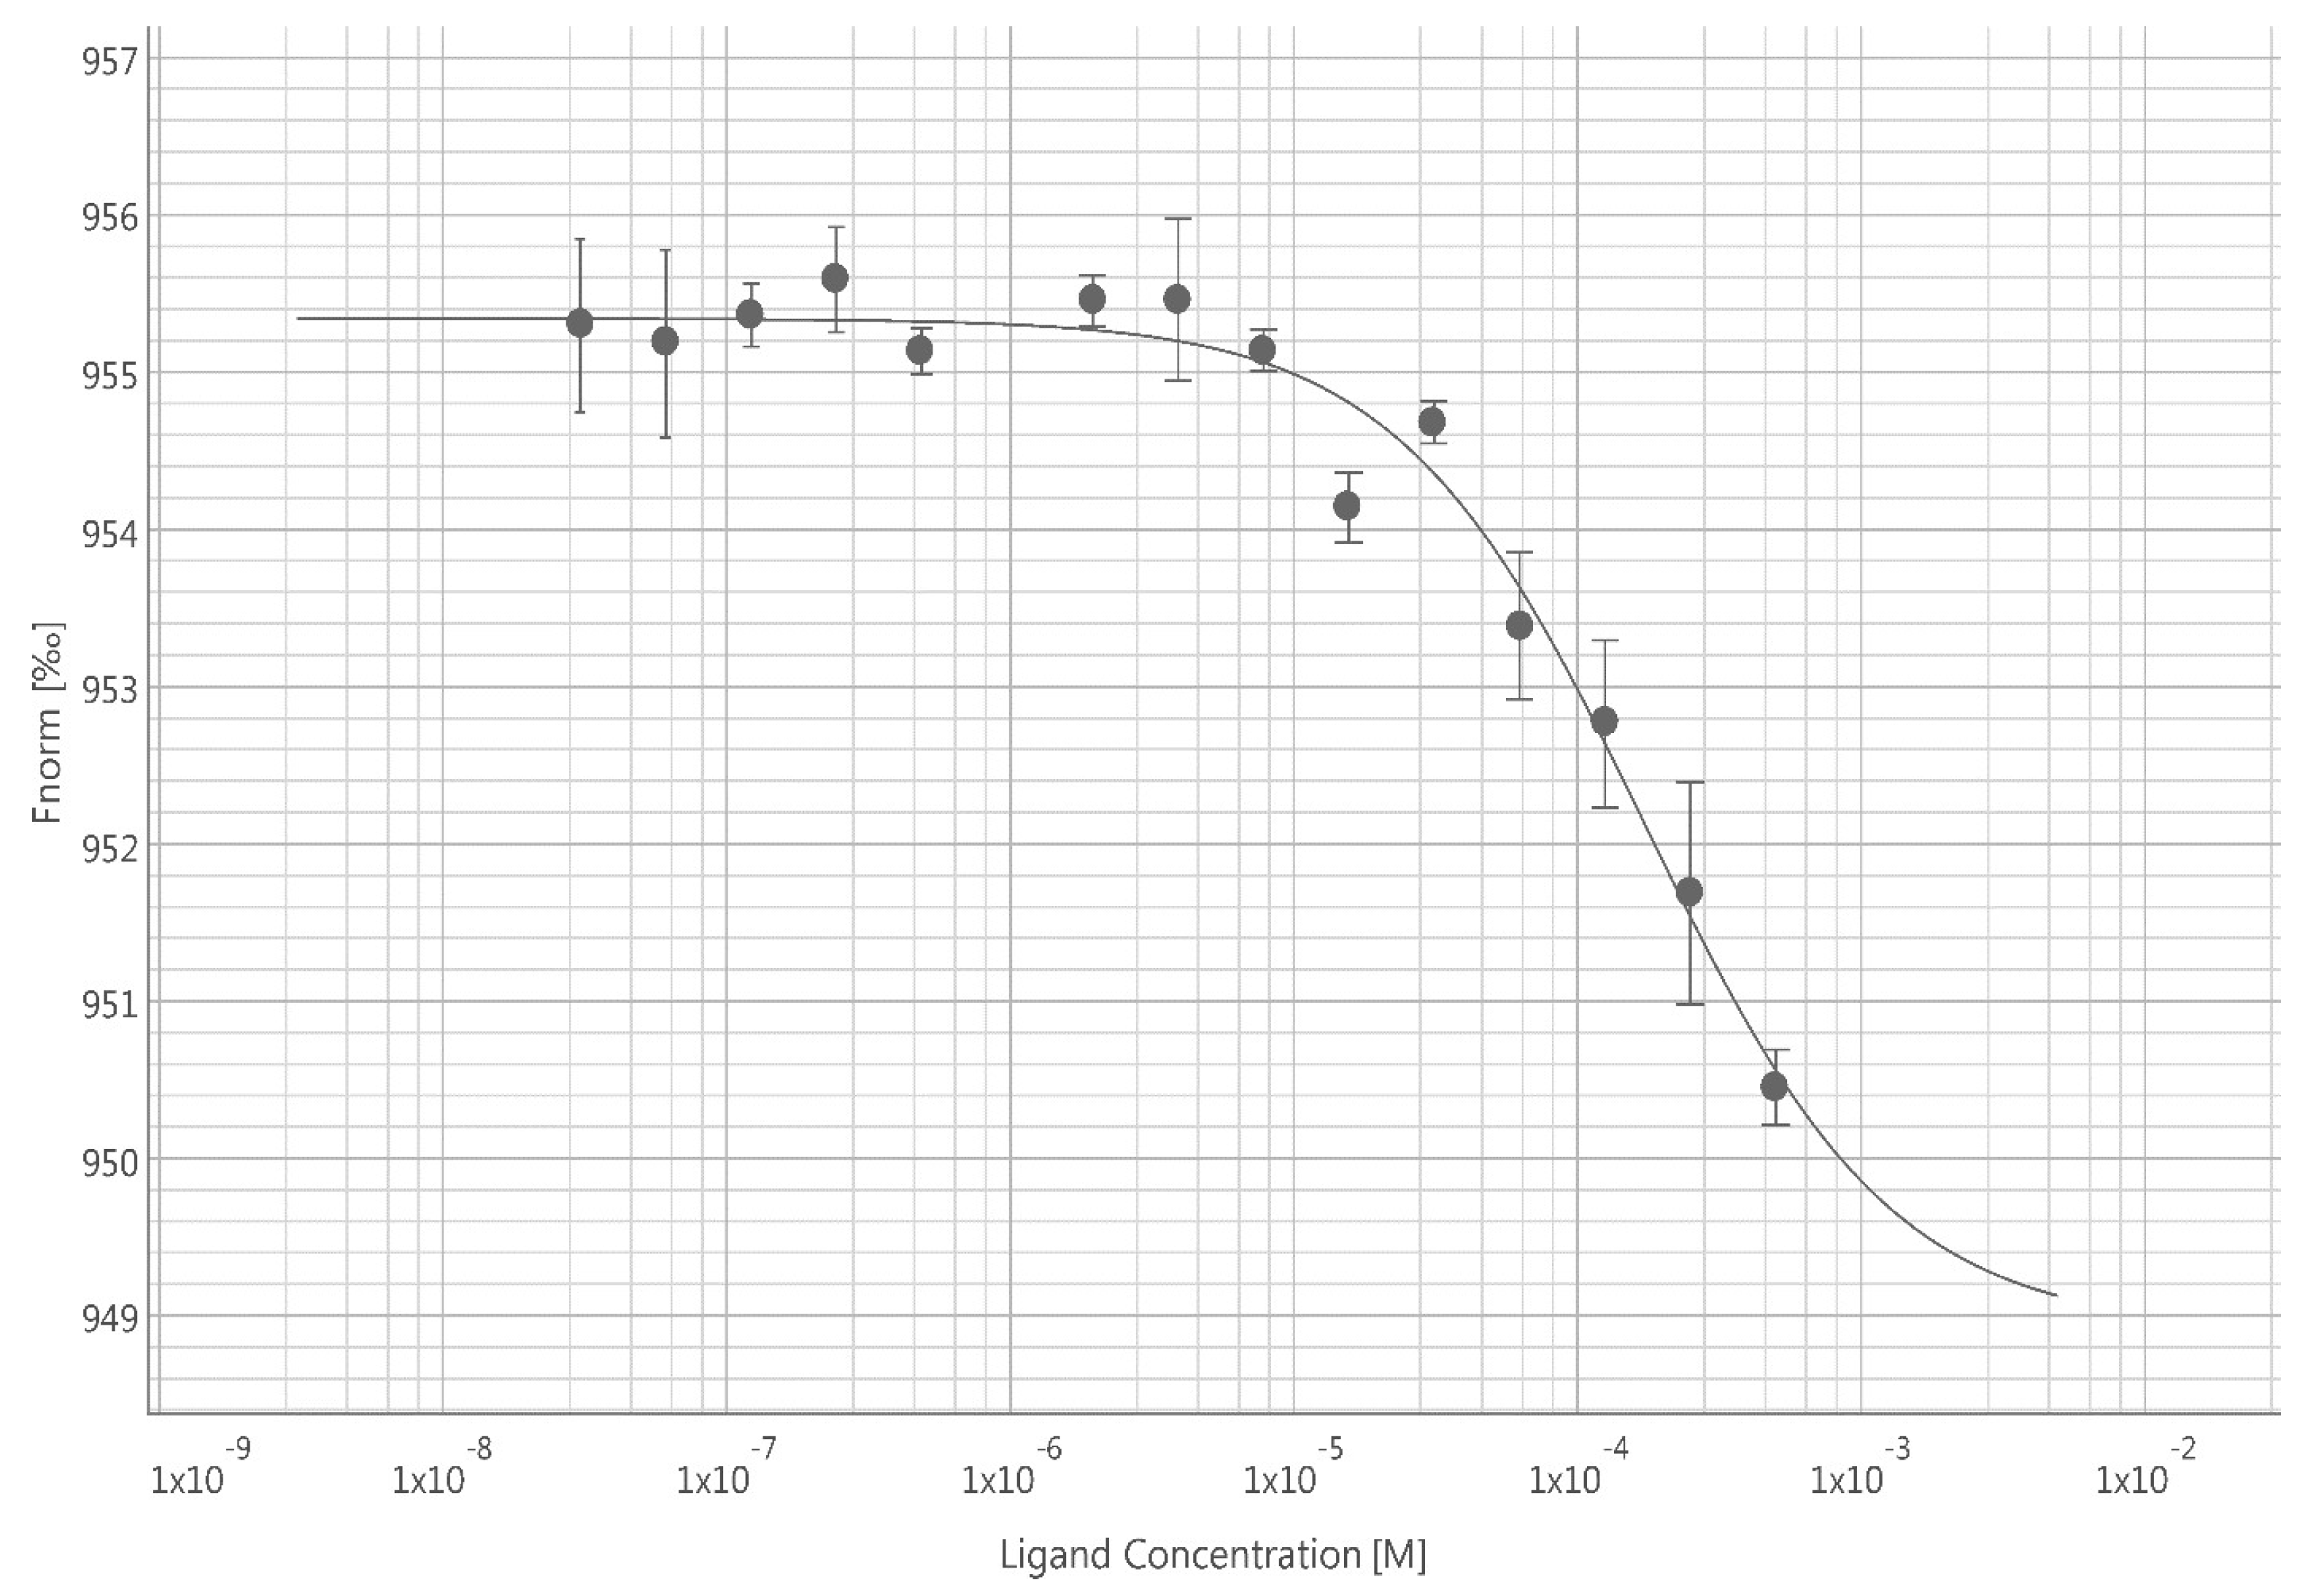
PKC-ɩ and ICA-1T interaction on MST. The target protein and the specific inhibitor ICA-1T exhibit an interaction, as observed from the normalized fluorescence vs. ligand concentration [M] plot. In this MST experiment, the concentration of the RED-NHS (2nd Gen) labeled PKC-ɩ was kept constant (30 nM), while the concentration of the non-labeled binding partner (ICA-1T) was varied between 0.0153 µM- 500 µM. The MOcontrol software was used to analyze the MST measurements (fit model: Kd model, 670 nm, response amplitude = 6.4, signal-to-noise ratio = 15.3). Additionally, 0.005 % Tween-20 was added to the PBS during the MST data acquisition. Otherwise, both the target and ligand were in identical PBS buffer conditions. After 1 hour of incubation, the samples were loaded into premium Monolith high sensitivity Capillaries and the MST measurements were performed using the Monolith X. An MST on-time of 2.5 s was used for analysis, and a Kd of 173 ± 2.32 µM was derived for this interaction (N=3 independent measurements; error bars represent the standard deviation).
Figure 8.
PKC-ɩ and ICA-1T interaction on MST. The target protein and the specific inhibitor ICA-1T exhibit an interaction, as observed from the normalized fluorescence vs. ligand concentration [M] plot. In this MST experiment, the concentration of the RED-NHS (2nd Gen) labeled PKC-ɩ was kept constant (30 nM), while the concentration of the non-labeled binding partner (ICA-1T) was varied between 0.0153 µM- 500 µM. The MOcontrol software was used to analyze the MST measurements (fit model: Kd model, 670 nm, response amplitude = 6.4, signal-to-noise ratio = 15.3). Additionally, 0.005 % Tween-20 was added to the PBS during the MST data acquisition. Otherwise, both the target and ligand were in identical PBS buffer conditions. After 1 hour of incubation, the samples were loaded into premium Monolith high sensitivity Capillaries and the MST measurements were performed using the Monolith X. An MST on-time of 2.5 s was used for analysis, and a Kd of 173 ± 2.32 µM was derived for this interaction (N=3 independent measurements; error bars represent the standard deviation).
2.5. Assessing the Biophysical Properties of PKC-ι and ICA-1S by Isothermal Titration Calorimetry (ITC)
In this study, buffer suitability, pH and temperature for MST were followed while performing experiments on ITC. Therefore, the PKC-ι and ICA-1S remained in this identical buffer system, and the temperature for ITC experiments was kept at room temperature (25 °C). ITC provides ample information on the direct binding event, in addition to the thermodynamic insights into the nature of the noncovalent forces involved in the binding. In a protein-ligand complex, if a polar interaction is present, the thermodynamic data, such as enthalpy, tend to contribute favorably. In contrast, a hydrophobic interaction is indicated by the entropically driven outcome. Here, the thermodynamic data from PKC-ι and ICA-1S titrations indicate a spontaneous binding interaction with a possible entropy- driven hydrophobic interaction at the binding site (Figure 9).
3. Discussion
Since the development of the experimental drug ICA-1T as a PKC-ι specific inhibitor, several in vitro and in vivo studies have been performed. The early efficacy report of the ICA-1T highlighted its potential as a chemotherapeutic agent in inhibiting neuroblastoma cell proliferation and inducing apoptosis (Pillai, Desai et al. 2011) [12]. This potential further inspired more research on the ICA-1T, and ICA-1S was introduced in the scenario. In an in vitro study, the T98G and U87MG glioblastoma cells were treated with ICA-1S in combination with TMZ (Temozolomide), demonstrating a significant inhibitory effect on cellular invasion pathways [39]. Moreover, the acute and sub-acute toxicity studies in the murine models have shown a reduced toxicity level in prostate carcinoma tumors while treated with ICA-1S [14]. Therefore, in these studies, both ICA-1T and ICA-1S demonstrated a potent inhibitory effect on PKC-ι, which regulates biological markers in crucial signaling pathways in various cancer cells. Despite these in vitro and in vivo successes, as a potential therapeutic compound, ICA-1S involved studies were missing vital information on binding characteristics and biophysical properties. In the present study, we report the chemical evidence of binding interactions between PKC-ι and ICA-1S/1T as evidenced by the dissociation constants and biophysical characterizations of the PKC-ι protein in complex with ICA-1S.
According to the DLS analysis, the PDI of 0.30 ± 0.02 (Table S1) is close to the monodisperse range (PDI 0.1-0.2). The analysis indicates that the protein size has a hydrodynamic radius of 42.19 ± 0.44nm in the free state and 43.58 ± 0.46 nm in the ICA-1S-bound state. A slight aggregation or oligomerization of the protein may also be present due to the additional peaks observed in the bound state. This observation may result from the addition of ICA-1S, which may cause the aggregate formation as indicated by a minor peak observed in the bound state (Figure 2, red peak at 626.33 nm). According to NanoTemper Technologies, the PDI value is appropriate for the quantitative DLS analysis, as the higher limit of a sample being inappropriate for DLS analysis is PDI=1.0. In the nanoDSF data analysis of PKC-ι in the presence or absence of ICA-1S interaction, we observe the presence of domain-specific stages in the unfolding profile. Moreover, the protein thermo stability increases due to interaction with ICA-1S as indicated by the derived IP (/Tm) shifts of 0.55 ◦C in the conjugate state (Figure 3A, 3B). This ligand-induced protein stability in PKC-ι may result from modifications attained in the protein structure. In particular, changes in the binding pocket amino acid residues side chain orientations may contribute to the conformational flexibility of PKC-ι [26,28,40]. In MST analysis, the binding of the low molecular weight ICA-1S/1T to the full-length multi-domain PKC-ι exhibited a change in the thermophoretic property of the protein due to the fluorophore dye labeling (NHS labeling method) without any optimization. Moreover, the PKC-ι concentration was maintained at 30 nM which was sufficient to perform the assays. The initial concentrations ranged from 500 µM (ICA-1T) and 100 µM (ICA-1S) to the 10−8 M range. The Kd obtained here for both ligands was under 1 hour of incubation. Further experiments optimized for more extended periods (8 and 24 hours) were also performed, and the effect of the incubation time was observed. However, longer incubation times did not improve (not reported here) the Kd (s) for the binding interaction between ICA-1S/1T and PKC-ι. MST data reported a direct binding event for both ICA-1S and ICA-1T with the fluorescently labeled PKC-ι. The PKC-ι and ICA-1S complex exhibited a tighter binding (Kd = 9.14 ± 0.19 µM) compared to PKC-ι and ICA-1T (Kd = 173 ± 2.32 µM), as indicated by their dissociation constants.
The thermodynamics data obtained from ITC indicate a binding event in an endothermic manner during the calorimetric titrations. The reactions were found to be spontaneous, as indicated by negative free energy differences (∆G = -10.14 Kcal/mol), while the Kd was found to be in the nM range (36.20 nM). The data indicate that the binding event falls within the strong to moderate range, as per Malvern Panalytical (manufacturer of PEAQ-ITC). [35,41]. The initial water-water and ligand-buffer control experiments showed no binding event, confirming that the actual protein-ligand binding event was free from any influence of heat, dilution, or buffer mismatch. The binding equilibrium was achieved, as indicated by the inverse sigmoidal shape of the heat of injection vs. molar ratio plot (Figure 9B). In addition, the calculated thermodynamic data from the 20 µM PKC-ι and 2 µM ICA-1S ITC experiment exhibit a positive entropic gain of +299.80 cal/mol.K, indicating a possible entropy-driven hydrophobic interaction in the binding pocket. Moreover, a significant positive enthalpy (+79.20 Kcal/mol) contribution, which may consist of heat changes due to conformational changes (∆H conformation), water displacement from the protein surface (∆H solvation) and a simultaneous noncovalent hydrogen bond and/or Van Der Waals interactions among the interacting molecules (∆H interaction) [38,42]. It is worth mentioning that the conformational change was also implied by the observation from nanoDSF and DLS experiments, which are in agreement with ITC.
The Kd value determined from ITC is much lower than that determined by MST. These differences might arise due to PKC-ι being labeled with red NHS dye, which covalently binds with the lysine residue of the protein (considering no lysine residue in the ligand binding site). In contrast, protein and ligand remain in identical physiological conditions in ITC. Regardless, the MST-derived affinity constants indicate that the functional group differences from ‘methyl dihydrogenphosphate’ (ICA-1T) to ‘hydroxymethyl’ (ICA-1S) in the ‘cyclopentyl’ moiety resulted in a stronger binding affinity (approximately 18-fold) to PKC-ι. This key information on the chemical structure of these PKC-ι specific inhibitors will be further explored for derivatization to create the next generation of ICA-1S/1T analogs. We aim to explore, in particular, the analogs with long-chain alkyl dihydrogenphosphate, alkyl carboxylic acid and alkyl sulfonic acid functional groups. These analogs are being synthesized in collaboration and will be studied in future. Therefore, for rational drug design, these derivatives of ICA-1S/1T may open a new avenue of structure-activity relationship (SAR) study and enhance our understanding of these inhibitors.
4. Materials and Methods Section
4.1. Expression and Purification of PKC-ι
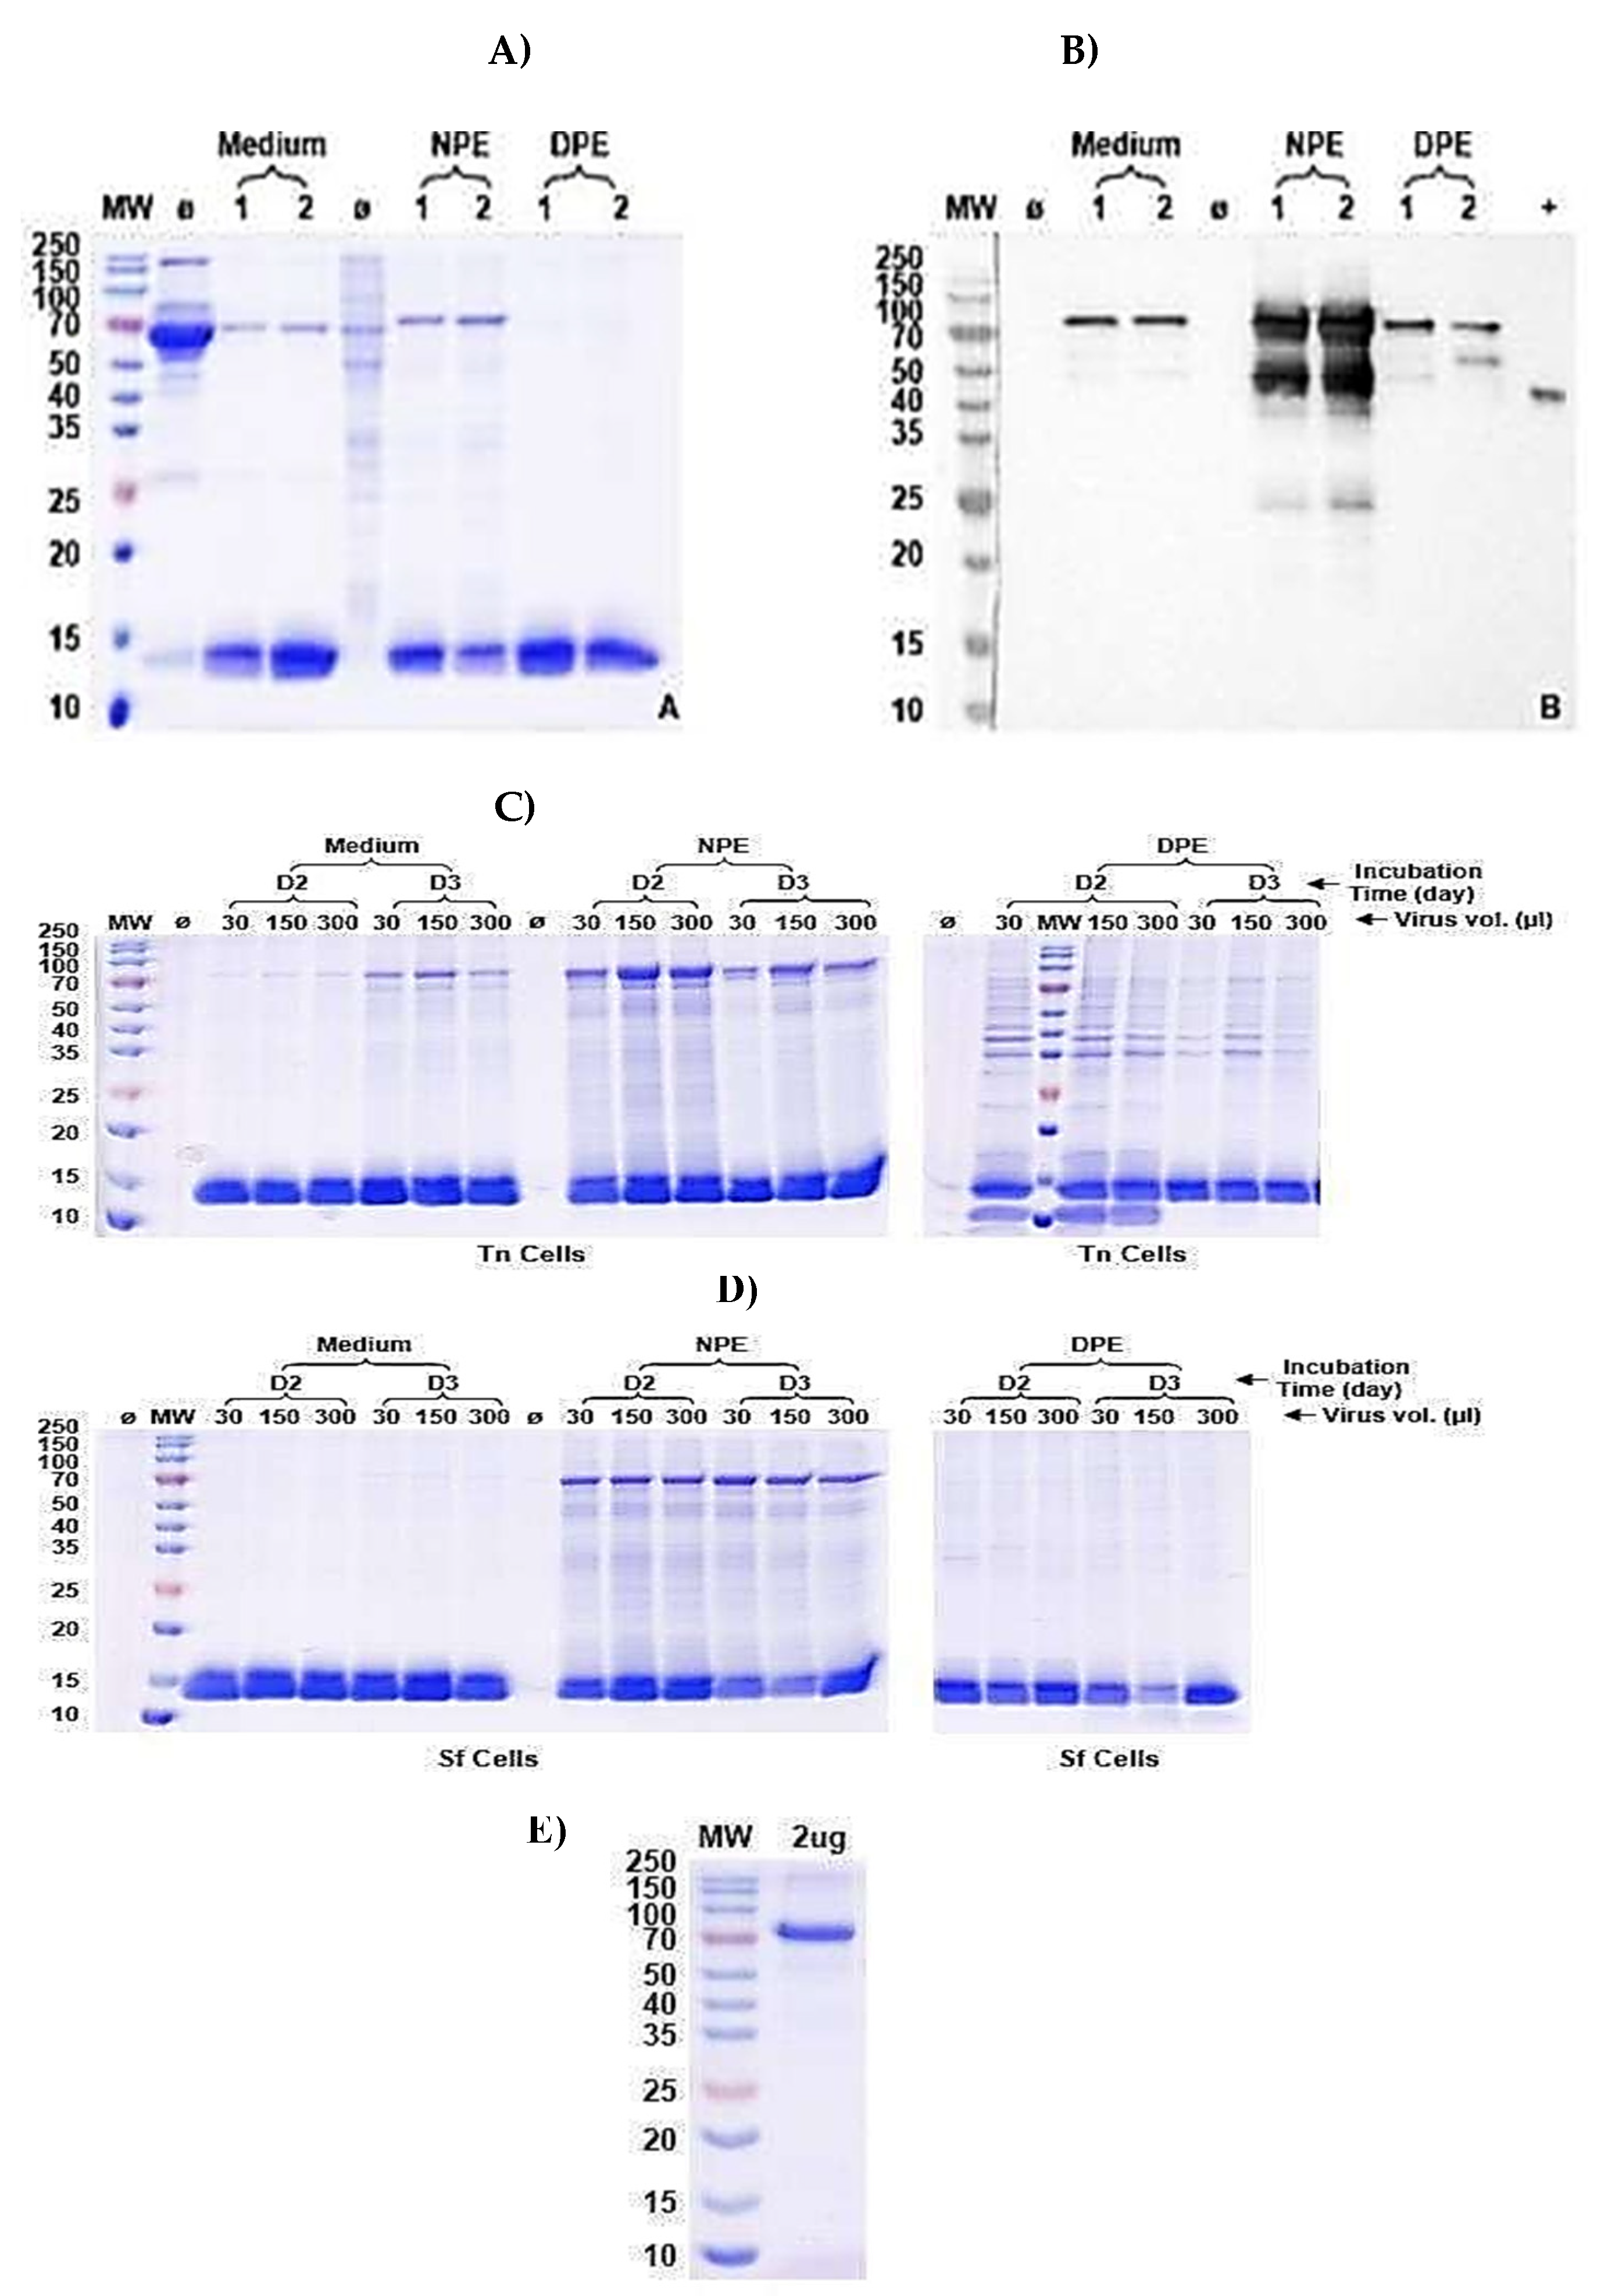
The expression and purification protocol of PKC-ι is proprietary to Bio Bench Technologies (Shijiazhuang Quan Jing Biotechnology Co. Ltd.). In brief, PKC-ι (Uniprot: P41743) with a 6x-His tag, GS linker and Strep-tag II was expressed and purified according to the following protocol. First, the gene codon optimization and synthesis were performed. The sub-cloning of the gene into an expression plasmid was performed, followed by a standard maxi prep for further transfection and cell culture. The pFastBac1 was used as the expression plasmid, and the Spodoptera frugiperda (SF9) cell line was used for P1 generation (Figure 10 A and B). In this test expression and rapid purification phase, 3 mL of the transfected (Bac to Bac) SF9 cells were cultured at 27 °C and collected after 2-3 days post-induction. After 2-3 days of transfection, 1.5 mL of the transfected culture of SF9 cells was used for P2 generation. For the P2 generation, the SF9 and Tn cell lines were transfected (Figure 10 C and 10 D, in the expression and rapid purification test phase). Here, 15 mL of SF9 or Tn cell cultures were induced and kept under the same conditions as above. After 2-3 days of post-transfection, 1.5 mL of the cell culture medium and cells were collected. The cell culture medium was run through rapid purification against the His-tag column. The sample was collected and named as ’Medium’. The cells were collected and lysed using a supersonic system and then centrifuged. The collected supernatant was named ’Nature Protein Extract (NPE). The insoluble fraction was denatured by 8M urea in PBS. The denatured protein was centrifuged and collected as a denatured Protein Extract (DPE). All these samples were detected by SDS-PAGE (AccuPAGETM Precast Gel) with Coomassie blue staining. P2 generation was harvested and used for the large-scale production of the expression of PKC-ι in the transfected Tn cell line. The best multiplicity of infection (MOI) of approximately 1 was observed at 30 µL after 2 days of cell culture transfection upon testing of the medium, NPE and DPE samples at 30, 150, and 300 µL of volume for 2-3 days of incubation time (Figure 10 C and 10 D). For large-scale expression, 1 L of cell culture media of the transfected Tn cell line (P2 generation virus) was incubated at 27 °C and collected after 2 days as a post-transfection sample. The NPE was collected as described above and purified first through a Strep-tag affinity purification system. Sample fractions were collected and loaded onto a His-tag affinity column with Ni2+ resin pre-equilibrated with PBS, pH=7.5. The column was washed with 0 mM, 10 mM and 30 mM imidazole and wash fractions were collected accordingly for analysis. The column was then eluted with 300 mM imidazole in a PBS buffer, and the protein was collected. His-tag was removed at the TEV site by TEV protease, and the protein purity was analyzed by SDS-PAGE (Figure 10 E), and Bradford assays were performed to measure the protein quantity (1.38 mg/L of PKC-ι). The pure protein was then lyophilized and kept at -80 ◦C until further experiments.
4.2. Dynamic Light Scattering (DLS)
DLS measurements were performed using the PR.Panta. For DLS measurements with a good signal-to-noise, 1 mg/mL of PKC-ι in PBS was used. Samples in the presence and absence of 100 µM ICA-1S were loaded in high-sensitivity premium capillaries and heated with a 1 °C /min temperature ramp from 25 °C to 110 °C with a 2 s DLS integration time. The cumulative radius and polydispersity index (PDI) values were determined using the Prometheus Panta analysis software V1.7.4 (NanoTemper Technologies).
4.3. Nano-Differential Scanning Fluorimetry (nanoDSF)
The nanoDSF coupled to scattering measurements were performed with the Prometheus Panta. PKC-ι was diluted to the indicated concentrations in PBS with a final concentration. Samples were loaded in high-sensitivity premium capillaries and heated with a 1 °C/min temperature ramp from 25 °C to 110 °C.
4.4. Microscale Thermophoresis
For the pre-conditional screening, the target protein PKC-ι was labeled (lysine-specific) with the fluorophore dye RED-NHS 2nd generation (Cat # MO-L011, NanoTemper Technologies) at a ratio of 1:1.25 (dye: protein). The conjugate was then incubated for 30 minutes at room temperature in the dark to complete the protein labeling with the dye. Using 100 nM of PKC-ι labeled with 80 nM of the dye resulted in complete saturation, and no separation of the unbound fluorophore was observed. For the binding affinity studies, PKC-ι was labeled similarly using the protein labeling kit RED-NHS 2nd Generation. The labeling reaction was performed according to the manufacturer’s instructions in NHS labeling buffer, using a concentration of 10 µM protein (molar dye: protein ratio= 3:1) at room temperature for 30 min. Unreacted dye was removed using the supplied dye removal column, which was equilibrated with PBS containing 0.005% Tween- 20, pH 7.4. After 30 minutes of incubation, followed by centrifugation at 15000 g for 10 minutes at 4 ºC, the degree of labeling was determined using UV/VIS spectrophotometry at 650 and 280 nm. A degree of labeling of 0.8-1.0 was typically achieved. The labeled PKC-ι was adjusted to 30 nM with PBS with 0.005% Tween-20. The ligand was dissolved in PBS with 0.005% Tween-20, and a series of 16 dilutions were prepared using the same buffer, producing ligand concentrations ranging from 2000 µM to 61 nM. For the measurement, each ligand dilution was mixed with 60 nM of one volume of labeled protein PKC-ι, resulting in a final concentration of 30 nM and final ligand concentrations ranging from 1000 µM to 30.5 nM. After 1-hour incubation followed by centrifugation at 2500 rpm or 850 g for 3 min, the samples were loaded into Monolith Premium Capillaries. MST was measured using a Monolith X instrument at an ambient temperature of 25 °C. Instrument parameters were adjusted to 100 % LED power and medium MST power. Data from three independently pipetted measurements were analyzed (MO. Affinity Analysis software version 3.0) using the signal from an MST on-time of 5 s.
5. Conclusion
ICA-1S and ICA-1T both bind with the target PKC-ι. The conjugate of PKC-ι with ICA-1S results in a thermo stability, which may occur from a local conformational change upon binding. The thermodynamic results support the binding events, indicating a possible entropy-driven, spontaneous hydrophobic interaction between PKC-ι and ICA-1S.
Supplementary Materials
The following supporting information can be downloaded at the website of this paper posted on Preprints.org, TableS1: The PR.Panta (Nanotemper Technologies) size analysis data (DLS) for polydispersity index (PDI) for PKC-ɩ in free and bound state with ICA-1S.; Figure S1: Original SDS-PAGE and Western blot test results for Tn and SF9 cells showing PKC-ɩ rapid expression and purification test results.
Author Contributions
Conceptualization, R.E.N, S.I. and M.A.-D.; methodology, investigation, and data curation, R.E.N., S.I., T.S., D.K., A.J.A., J.W.L., and I.G.; writing, original draft preparation, R.E.N.; writing, review and editing, R.E.N. and S.I.; supervision, M.A.-D.; project administration, M.A.-D.; funding acquisition, M.A.-D. All authors have read and agreed to the published version of the manuscript.
Funding
This research was funded by the William and Ella Owens Medical Research Foundation (USF Foundation account number 42-0232), Mr. Gene Pranzo, and Leo and Anne Albert Charitable Trust (USF Foundation account number 42-0145).
Institutional Review Board Statement
Not applicable.
Informed Consent Statement
Not applicable.
Data Availability Statement
The data supporting this article have been included as part of the Supplementary Information.
Acknowledgments
We acknowledge the generous financial contribution from the William and Ella Owens Medical Research Foundation, Mr. Gene Pranzo and the Leo and Anne Albert Charitable Trust. We also acknowledge Bio Bench Technologies (Shijiazhuang Quan Jing Biotechnology Co., ltd) for the proprietary service for protein expression and purification services. We also thank Mr. Mark Eschenfelder for his assistance with the experiments.
Conflicts of Interest
The authors declare no conflicts of interest. The funders had no role in the design of this study; in the collection, analysis, or interpretation of data; in the writing of this manuscript; or in the decision to publish the results.
References
- Cicenas, J. , et al., Kinases and Cancer. Cancers (Basel) 2018, 10. [Google Scholar] [CrossRef] [PubMed]
- Mochly-Rosen, D., K. Das, and K.V. Grimes, Protein kinase C, an elusive therapeutic target? Nature Reviews Drug Discovery 2012, 11, 937–957. [Google Scholar] [CrossRef] [PubMed]
- Vlahovic, G. and J. Crawford, Activation of Tyrosine Kinases in Cancer. The Oncologist 2003, 8, 531–538. [Google Scholar] [CrossRef] [PubMed]
- Farese, R.V. and M.P. Sajan, Metabolic functions of atypical protein kinase C:“good” and “bad” as defined by nutritional status. American Journal of Physiology-Endocrinology and Metabolism 2010, 298, E385–E394. [Google Scholar] [CrossRef]
- Griner, E.M. and M.G. Kazanietz, Protein kinase C and other diacylglycerol effectors in cancer. Nature Reviews Cancer 2007, 7, 281–294. [Google Scholar] [CrossRef]
- Fields, A.P. and R.P. Regala, Protein kinase Cι: Human oncogene, prognostic marker and therapeutic target. Pharmacological research 2007, 55, 487–497. [Google Scholar] [CrossRef]
- Dey, A. , et al., The interruption of atypical PKC signaling and Temozolomide combination therapy against glioblastoma. Cell Signal 2021, 77, 109819. [Google Scholar] [CrossRef]
- Ratnayake, W.S. , et al., Oncogenic PKC-ι activates Vimentin during epithelial-mesenchymal transition in melanoma; a study based on PKC-ι and PKC-ζ specific inhibitors. Cell Adhesion & Migration 2018, 12, 447–463. [Google Scholar]
- Marzan, M. , et al., Proteasome Inhibitor MG-132 and PKC-ι-Specific Inhibitor ICA-1S Degrade Mutant p53 and Induce Apoptosis in Ovarian Cancer Cell Lines. Int J Mol Sci 2025, 26. [Google Scholar] [CrossRef]
- Khalid, K.M. , et al., Dual inhibition of atypical PKC signaling and PI3K/Akt signaling dysregulates c-Myc to induce apoptosis in clear cell Renal Cell Carcinoma. Frontiers in Oncology 2024, 13, 1213715. [Google Scholar] [CrossRef]
- Nanos-Webb, A. , The Role Of Cyclin E In Pkc Iota-Driven Early Ovarian Tumorigenesis. 2011.
- Pillai, P. , et al., A novel PKC-ι inhibitor abrogates cell proliferation and induces apoptosis in neuroblastoma. Int J Biochem Cell Biol 2011, 43, 784–94. [Google Scholar] [CrossRef] [PubMed]
- Desai, S.R. , et al., Regulation of Cdk7 activity through a phosphatidylinositol (3)-kinase/PKC-ι-mediated signaling cascade in glioblastoma. Carcinogenesis 2012, 33, 10–19. [Google Scholar] [CrossRef]
- Apostolatos, A.H. , et al., Preclinical testing of 5-amino-1-((1R,2S,3S,4R)-2,3-dihydroxy-4-methylcyclopentyl)-1H-imidazole-4-carboxamide: a potent protein kinase C-ι inhibitor as a potential prostate carcinoma therapeutic. Anticancer Drugs 2019, 30, 65–71. [Google Scholar] [CrossRef]
- Apostolatos, C.A. , et al., Preclinical Testing of Chronic ICA-1S Exposure: A Potent Protein Kinase C-ι Inhibitor as a Potential Carcinoma Therapeutic. Drugs and Drug Candidates 2024, 3, 368–379. [Google Scholar] [CrossRef]
- Kost, T.A., J. P. Condreay, and D.L. Jarvis, Baculovirus as versatile vectors for protein expression in insect and mammalian cells. Nature Biotechnology 2005, 23, 567–575. [Google Scholar] [CrossRef] [PubMed]
- Hong, M. , et al., Genetic engineering of baculovirus-insect cell system to improve protein production. Front Bioeng Biotechnol 2022, 10, 994743. [Google Scholar] [CrossRef]
- Messerschmidt, A. , et al., Crystal structure of the catalytic domain of human atypical protein kinase C-iota reveals interaction mode of phosphorylation site in turn motif. J Mol Biol 2005, 352, 918–31. [Google Scholar] [CrossRef]
- Soriano, E.V. , et al., aPKC inhibition by Par3 CR3 flanking regions controls substrate access and underpins apical-junctional polarization. Developmental cell 2016, 38, 384–398. [Google Scholar] [CrossRef] [PubMed]
- Schramm, P. Würtenberger, and C. Kleusch, Sizing accuracy and intra-assay precision of DLS measurements with Prometheus Panta,(2020).
- NT-PR, A.N. , et al., Thermal stability of membrane-bound proteins.
- Tosstorff, A. , et al., Structure-based discovery of a new protein-aggregation breaking excipient. European Journal of Pharmaceutics and Biopharmaceutics 2019, 144, 207–216. [Google Scholar] [CrossRef]
- Kim, S.H. , et al., Nano Differential Scanning Fluorimetry-Based Thermal Stability Screening and Optimal Buffer Selection for Immunoglobulin G. Pharmaceuticals 2022, 15, 29. [Google Scholar] [CrossRef]
- Stetefeld, J., S. A. McKenna, and T.R. Patel, Dynamic light scattering: a practical guide and applications in biomedical sciences. Biophysical reviews 2016, 8, 409–427. [Google Scholar] [CrossRef] [PubMed]
- Hallett, F.R. , Particle size analysis by dynamic light scattering. Food research international 1994, 27, 195–198. [Google Scholar] [CrossRef]
- Chattopadhyay, G. and R. Varadarajan, Facile measurement of protein stability and folding kinetics using a nano differential scanning fluorimeter. Protein Science 2019, 28, 1127–1134. [Google Scholar] [CrossRef]
- Magnusson, A.O. , et al., nanoDSF as screening tool for enzyme libraries and biotechnology development. Febs j 2019, 286, 184–204. [Google Scholar] [CrossRef]
- Celej, M.S., G. G. Montich, and G.D. Fidelio, Protein stability induced by ligand binding correlates with changes in protein flexibility. Protein Sci 2003, 12, 1496–506. [Google Scholar] [CrossRef]
- Hall, D. , et al., Protein aggregate turbidity: Simulation of turbidity profiles for mixed-aggregation reactions. Analytical biochemistry 2016, 498, 78–94. [Google Scholar] [CrossRef]
- Entzian, C. and T. Schubert, Studying small molecule–aptamer interactions using MicroScale Thermophoresis (MST). Methods 2016, 97, 27–34. [Google Scholar] [CrossRef]
- Jerabek-Willemsen, M. , et al., MicroScale Thermophoresis: Interaction analysis and beyond. Journal of Molecular Structure 2014, 1077, 101–113. [Google Scholar] [CrossRef]
- Jerabek-Willemsen, M. , et al., Molecular interaction studies using microscale thermophoresis. Assay and drug development technologies 2011, 9, 342–353. [Google Scholar] [CrossRef]
- Baaske, P. , et al., Optical thermophoresis for quantifying the buffer dependence of aptamer binding. Angew Chem Int Ed Engl 2010, 49, 2238–2241. [Google Scholar] [CrossRef]
- Duhr, S. and D. Braun, Why molecules move along a temperature gradient. Proceedings of the National Academy of Sciences 2006, 103, 19678–19682. [Google Scholar] [CrossRef] [PubMed]
- Saponaro, A. , Isothermal titration calorimetry: a biophysical method to characterize the interaction between label-free biomolecules in solution. Bio-protocol 2018, 8, e2957–e2957. [Google Scholar] [CrossRef] [PubMed]
- Wiseman, T. , et al., Rapid measurement of binding constants and heats of binding using a new titration calorimeter. Analytical biochemistry 1989, 179, 131–137. [Google Scholar] [CrossRef]
- Bartoschik, T. , et al., Near-native, site-specific and purification-free protein labeling for quantitative protein interaction analysis by MicroScale Thermophoresis. Scientific reports 2018, 8, 4977. [Google Scholar] [CrossRef]
- Brautigam, C.A. , et al., Integration and global analysis of isothermal titration calorimetry data for studying macromolecular interactions. Nature protocols 2016, 11, 882–894. [Google Scholar] [CrossRef]
- Dey, A. , et al., The interruption of atypical PKC signaling and Temozolomide combination therapy against glioblastoma. Cellular Signalling 2021, 2, 109819. [Google Scholar] [CrossRef] [PubMed]
- Clark, J.J. , et al., Inherent versus induced protein flexibility: Comparisons within and between apo and holo structures. PLOS Computational Biology 2019, 15, e1006705. [Google Scholar] [CrossRef]
- Panalytical, M. 2025.
- Abraham, T. , et al., Isothermal titration calorimetry studies of the binding of a rationally designed analogue of the antimicrobial peptide gramicidin s to phospholipid bilayer membranes. Biochemistry 2005, 44, 2103–12. [Google Scholar] [CrossRef]
Figure 1.
PKC-ι specific inhibitors were studied in this report. A) The chemical structure ICA-1T,((1R,2R,3S,4R)-4-(5-amino-4-carbamoyl-1H-imidazol-1-yl)-2,3-dihydroxycyclopentyl)methyldihydrogen phosphate. B) The chemical structure of ICA-1S, 5-amino-1-((1R,2S,3R,4R)-2-3-dihydroxy-4-(hydroxymethyl)cyclopentyl)-1H-imidazole-4-carboxamide.
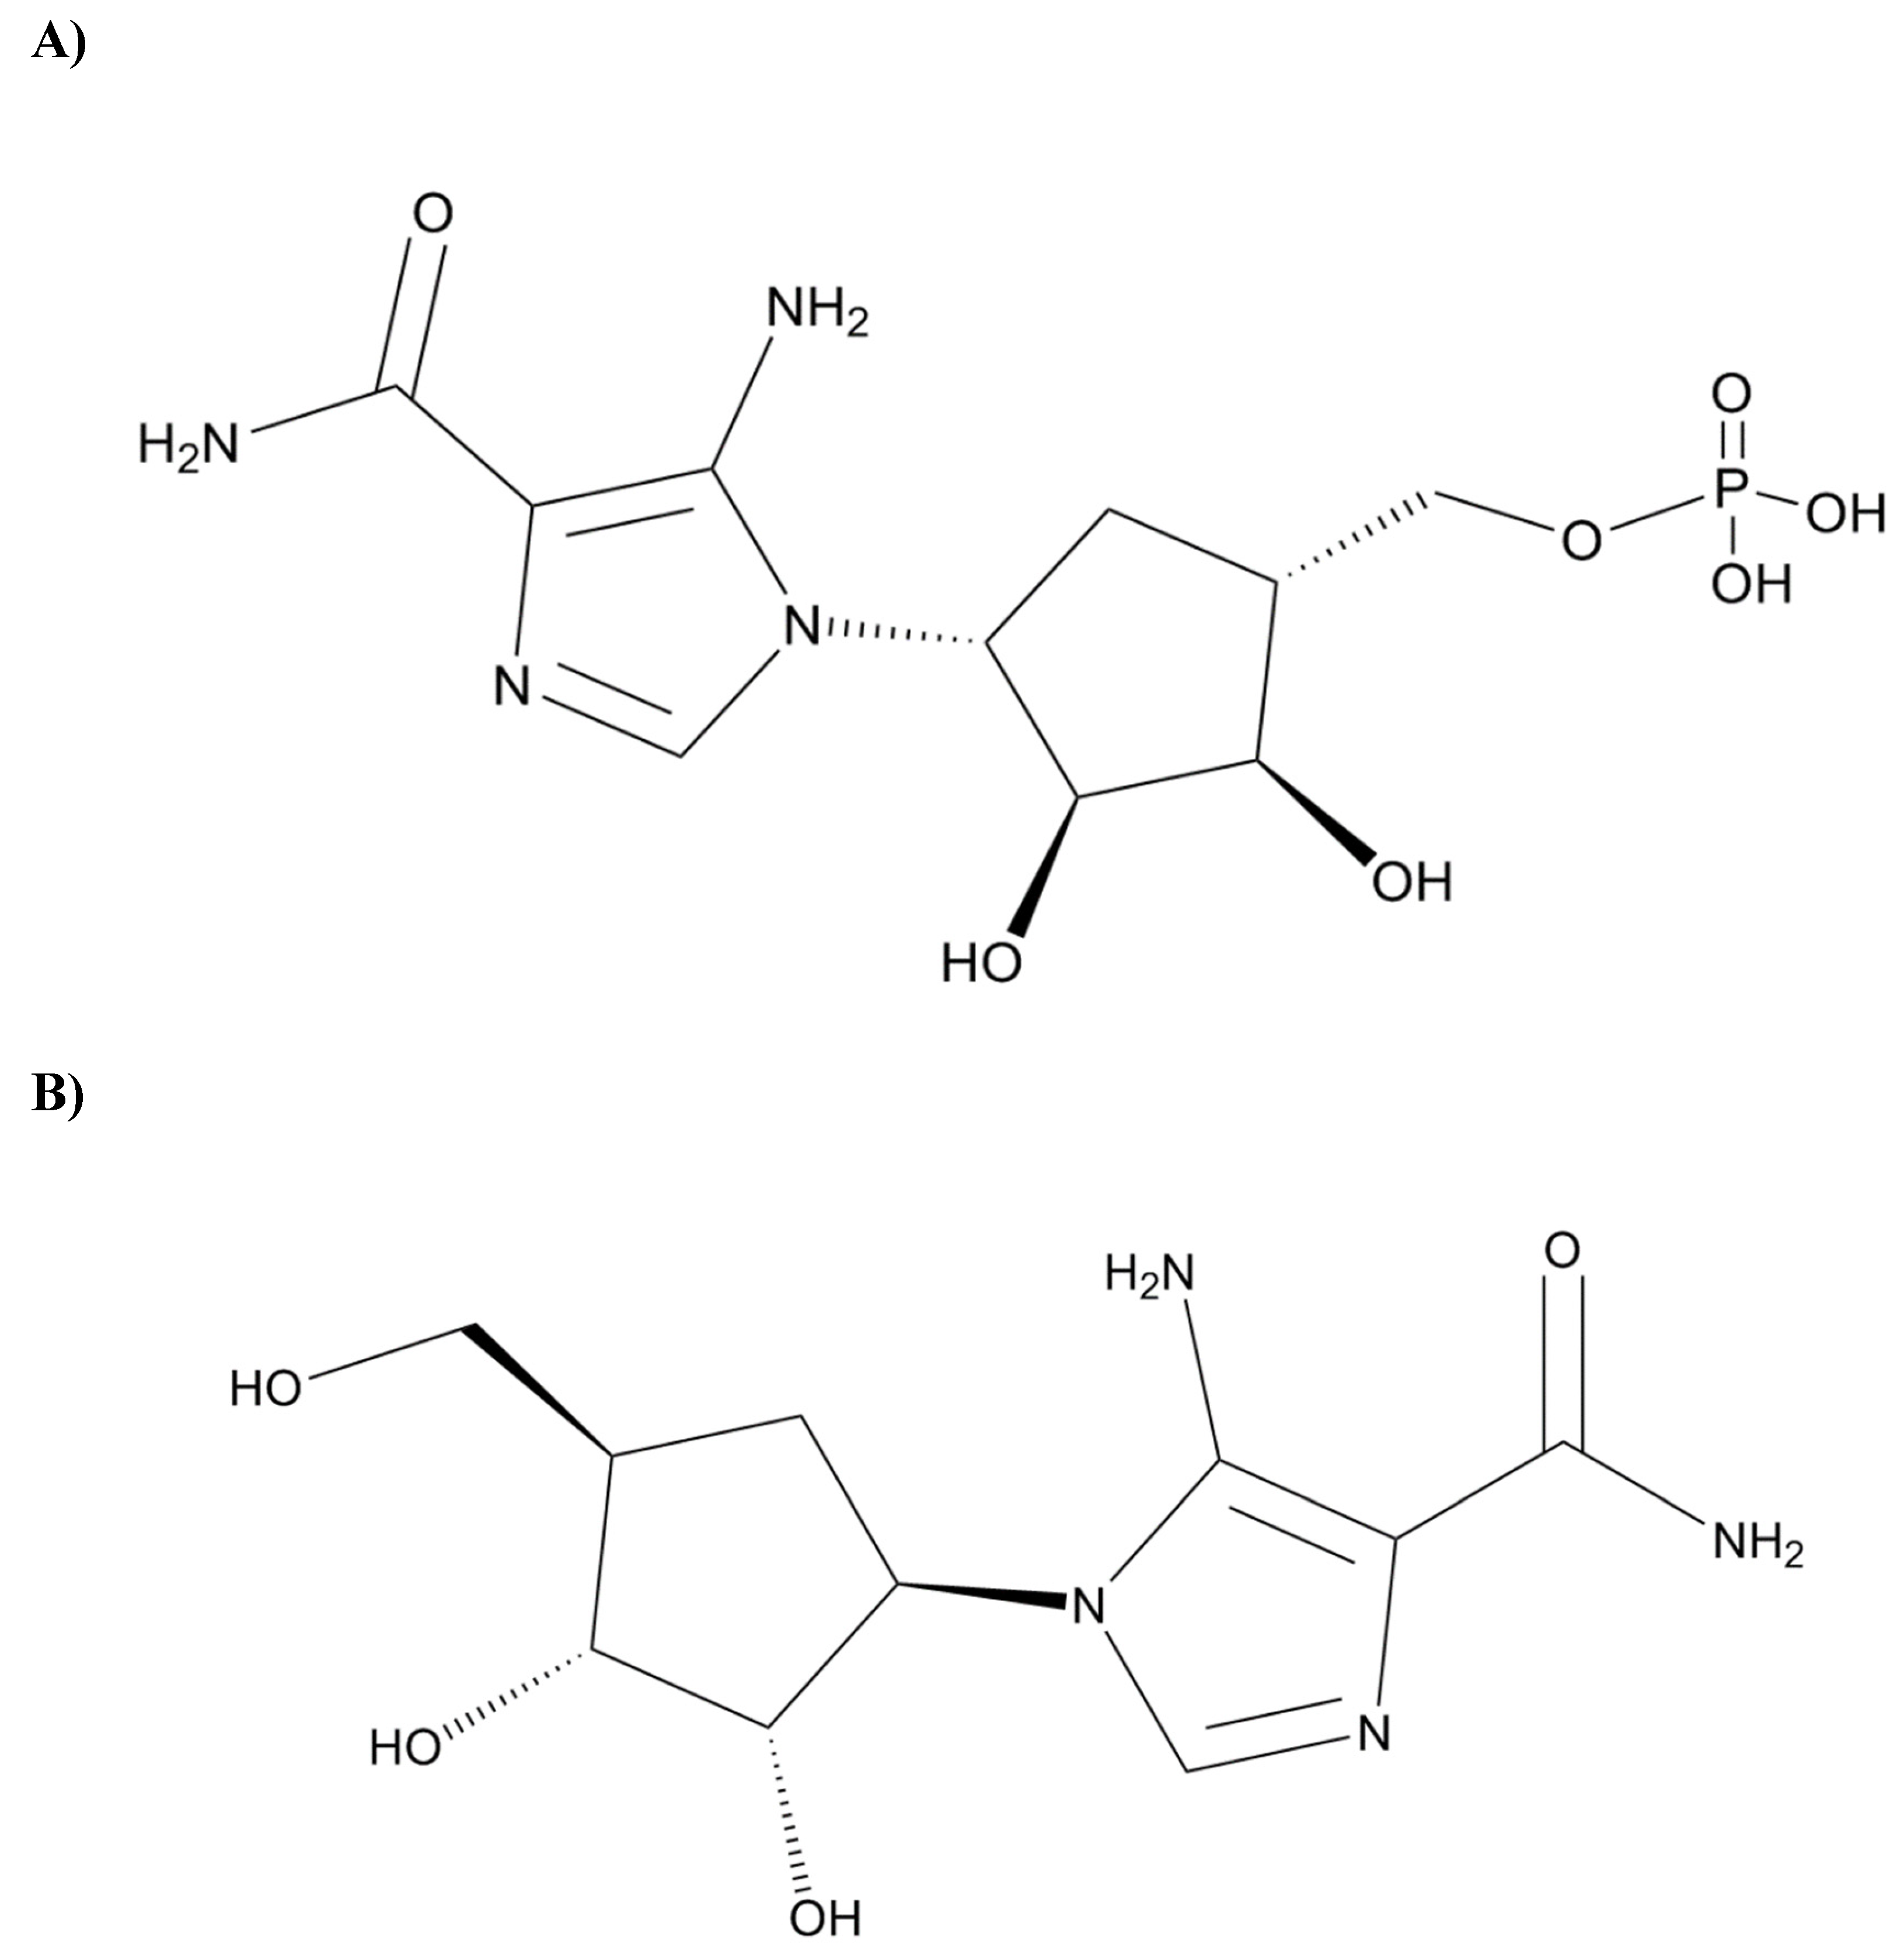
Figure 2.
Dynamic Light scattering data showing Relative Probability vs. Radius (nm) as an indicator of the vastly homogeneous status of the target protein PKC-ι. Introducing the ICA-1S to the protein may cause a slight aggregate formation, indicated by an additional peak in the bound state (rightmost red peak). The free protein state (black peak) and conjugate state (red peak) show sufficient macromolecular homogeneity of the PKC-ι for further analysis. Red and black dotted lines represent intensity peaks, and dashed lines represent the cumulant radius (N=3 independent measurements for free and bound states).
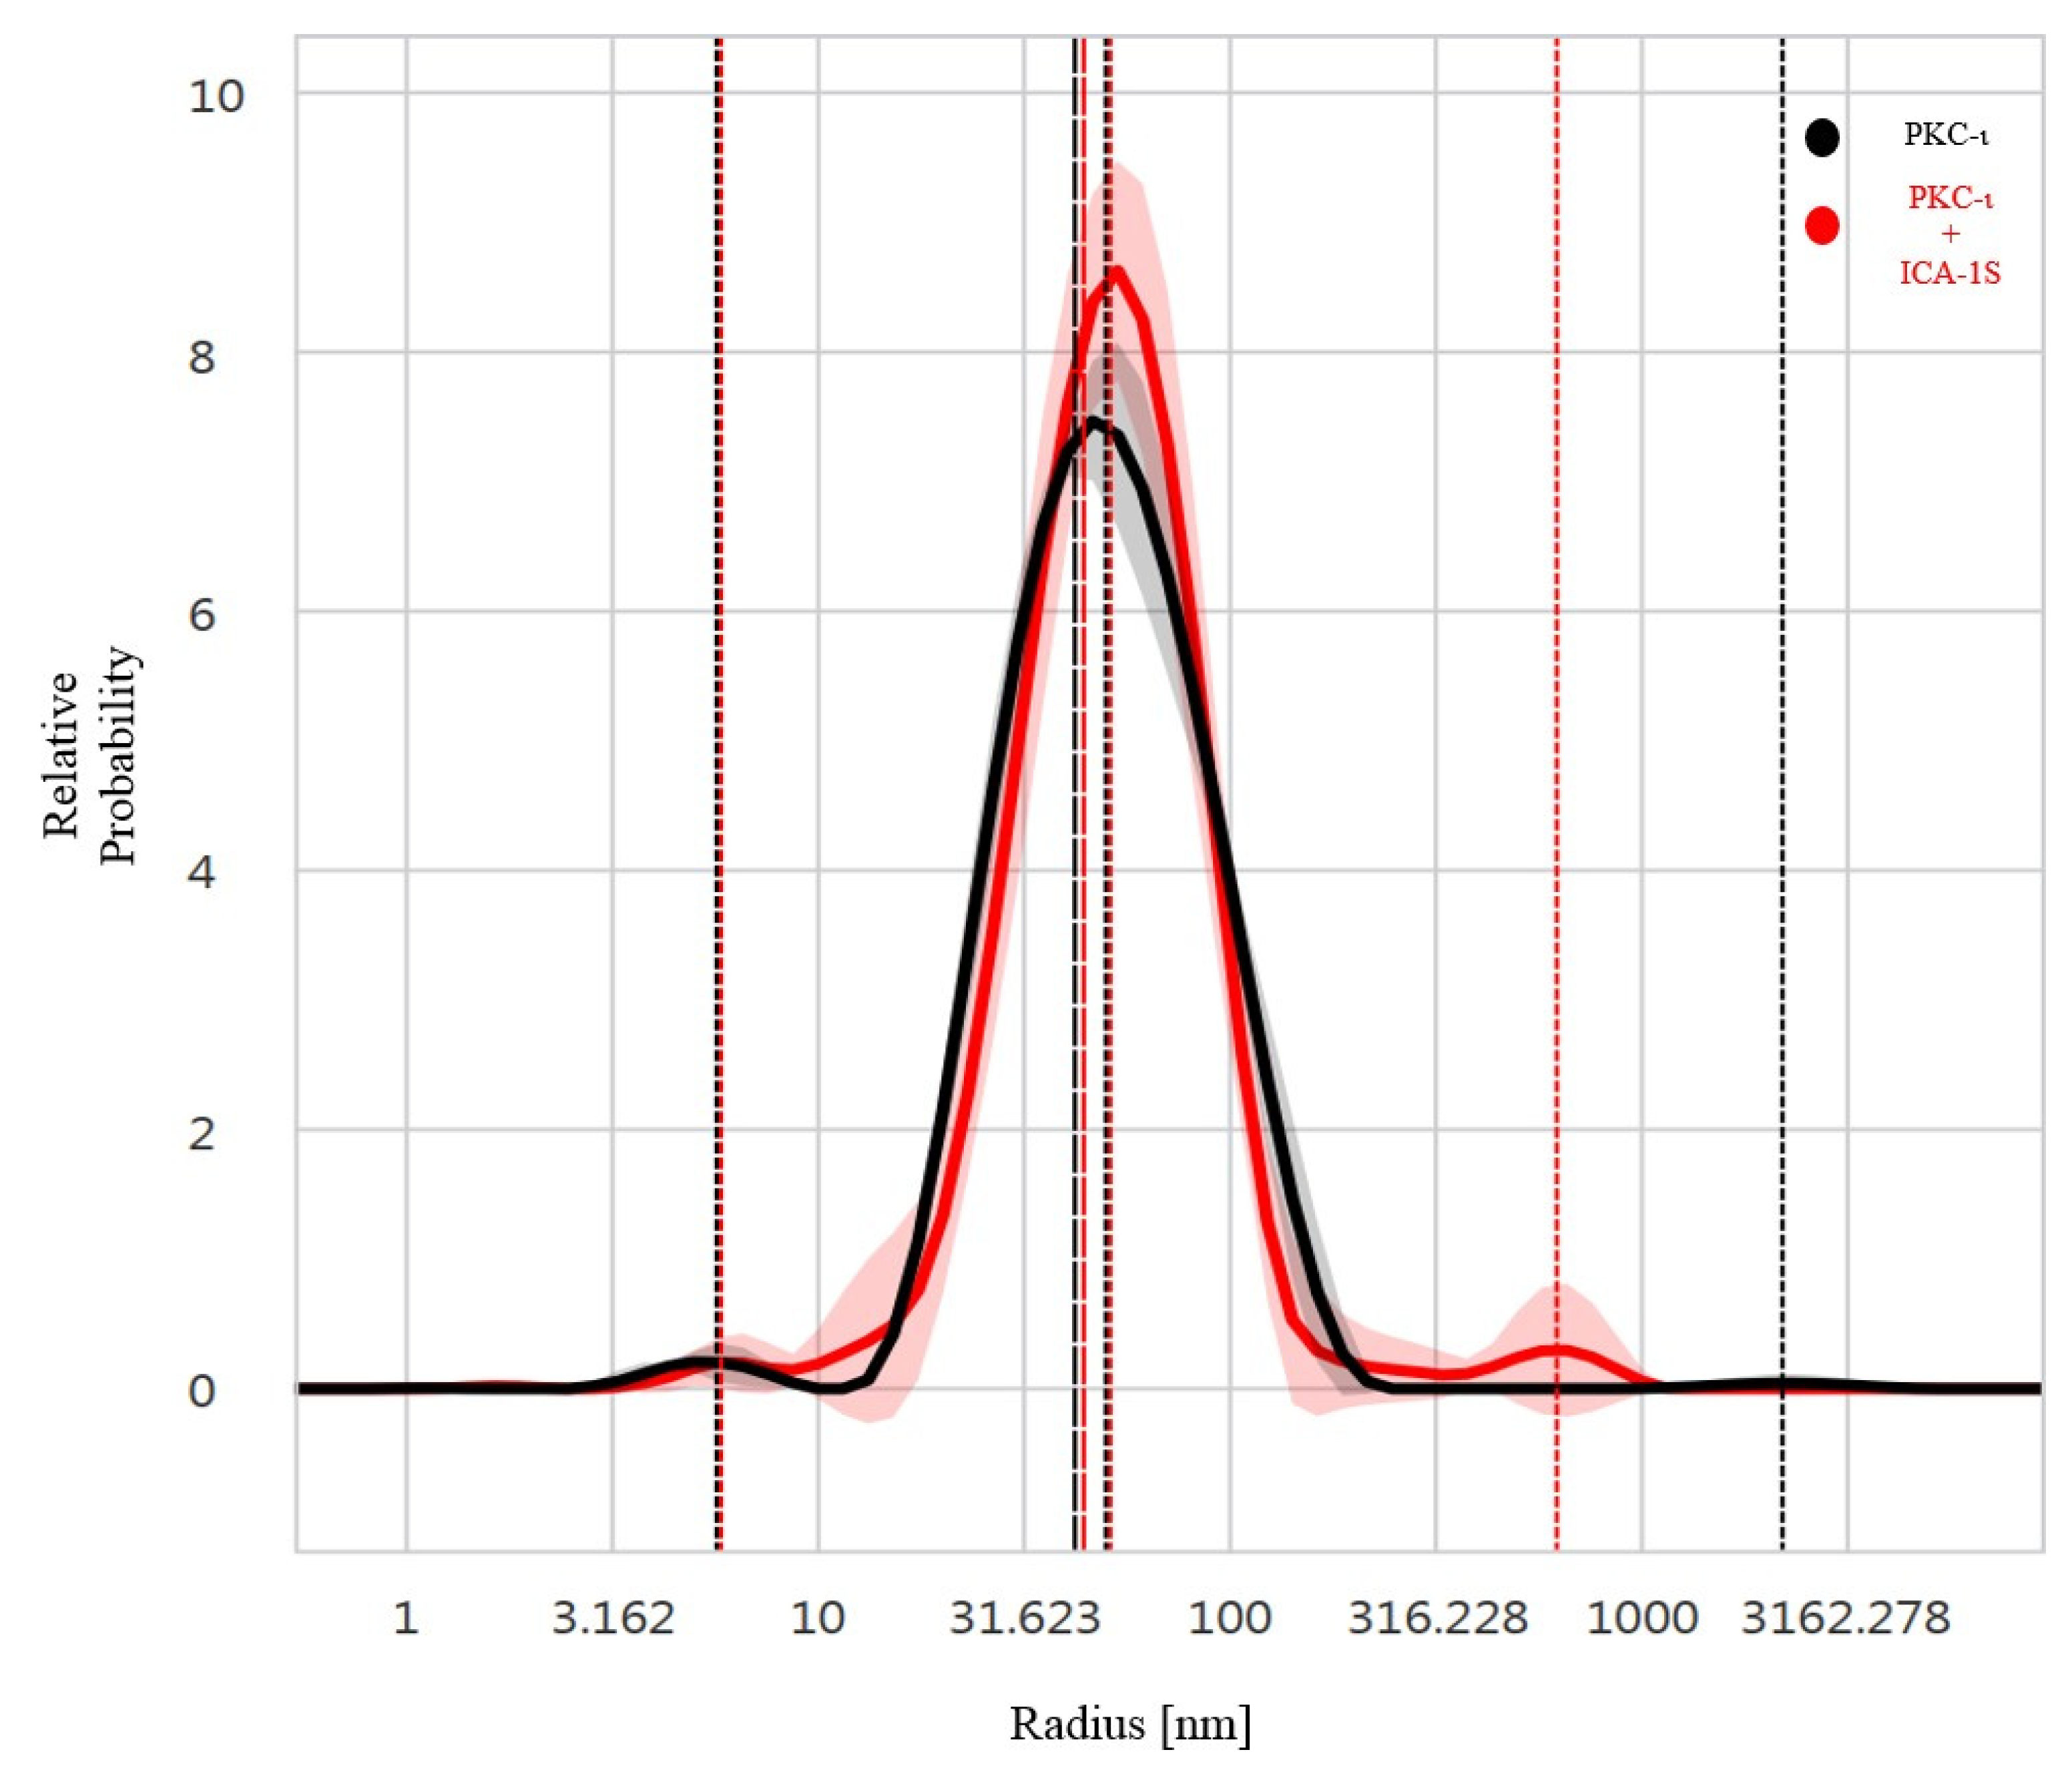
Figure 3.
The nanoDSF thermogram depicts the thermal stability screening for the free-state PKC-ɩ (black line) and with the ICA-1S complex state (red line). In Figures 3A and 3B, the stabilization of inflection points (IP) in the Ratio 350/330 nm vs. temperature (Tm) plot was observed, ranging between 42.26-42.81°C (= 0.55 °C) upon complex formation with ICA-1S. (N=3 independent measurements for both free and bound state).
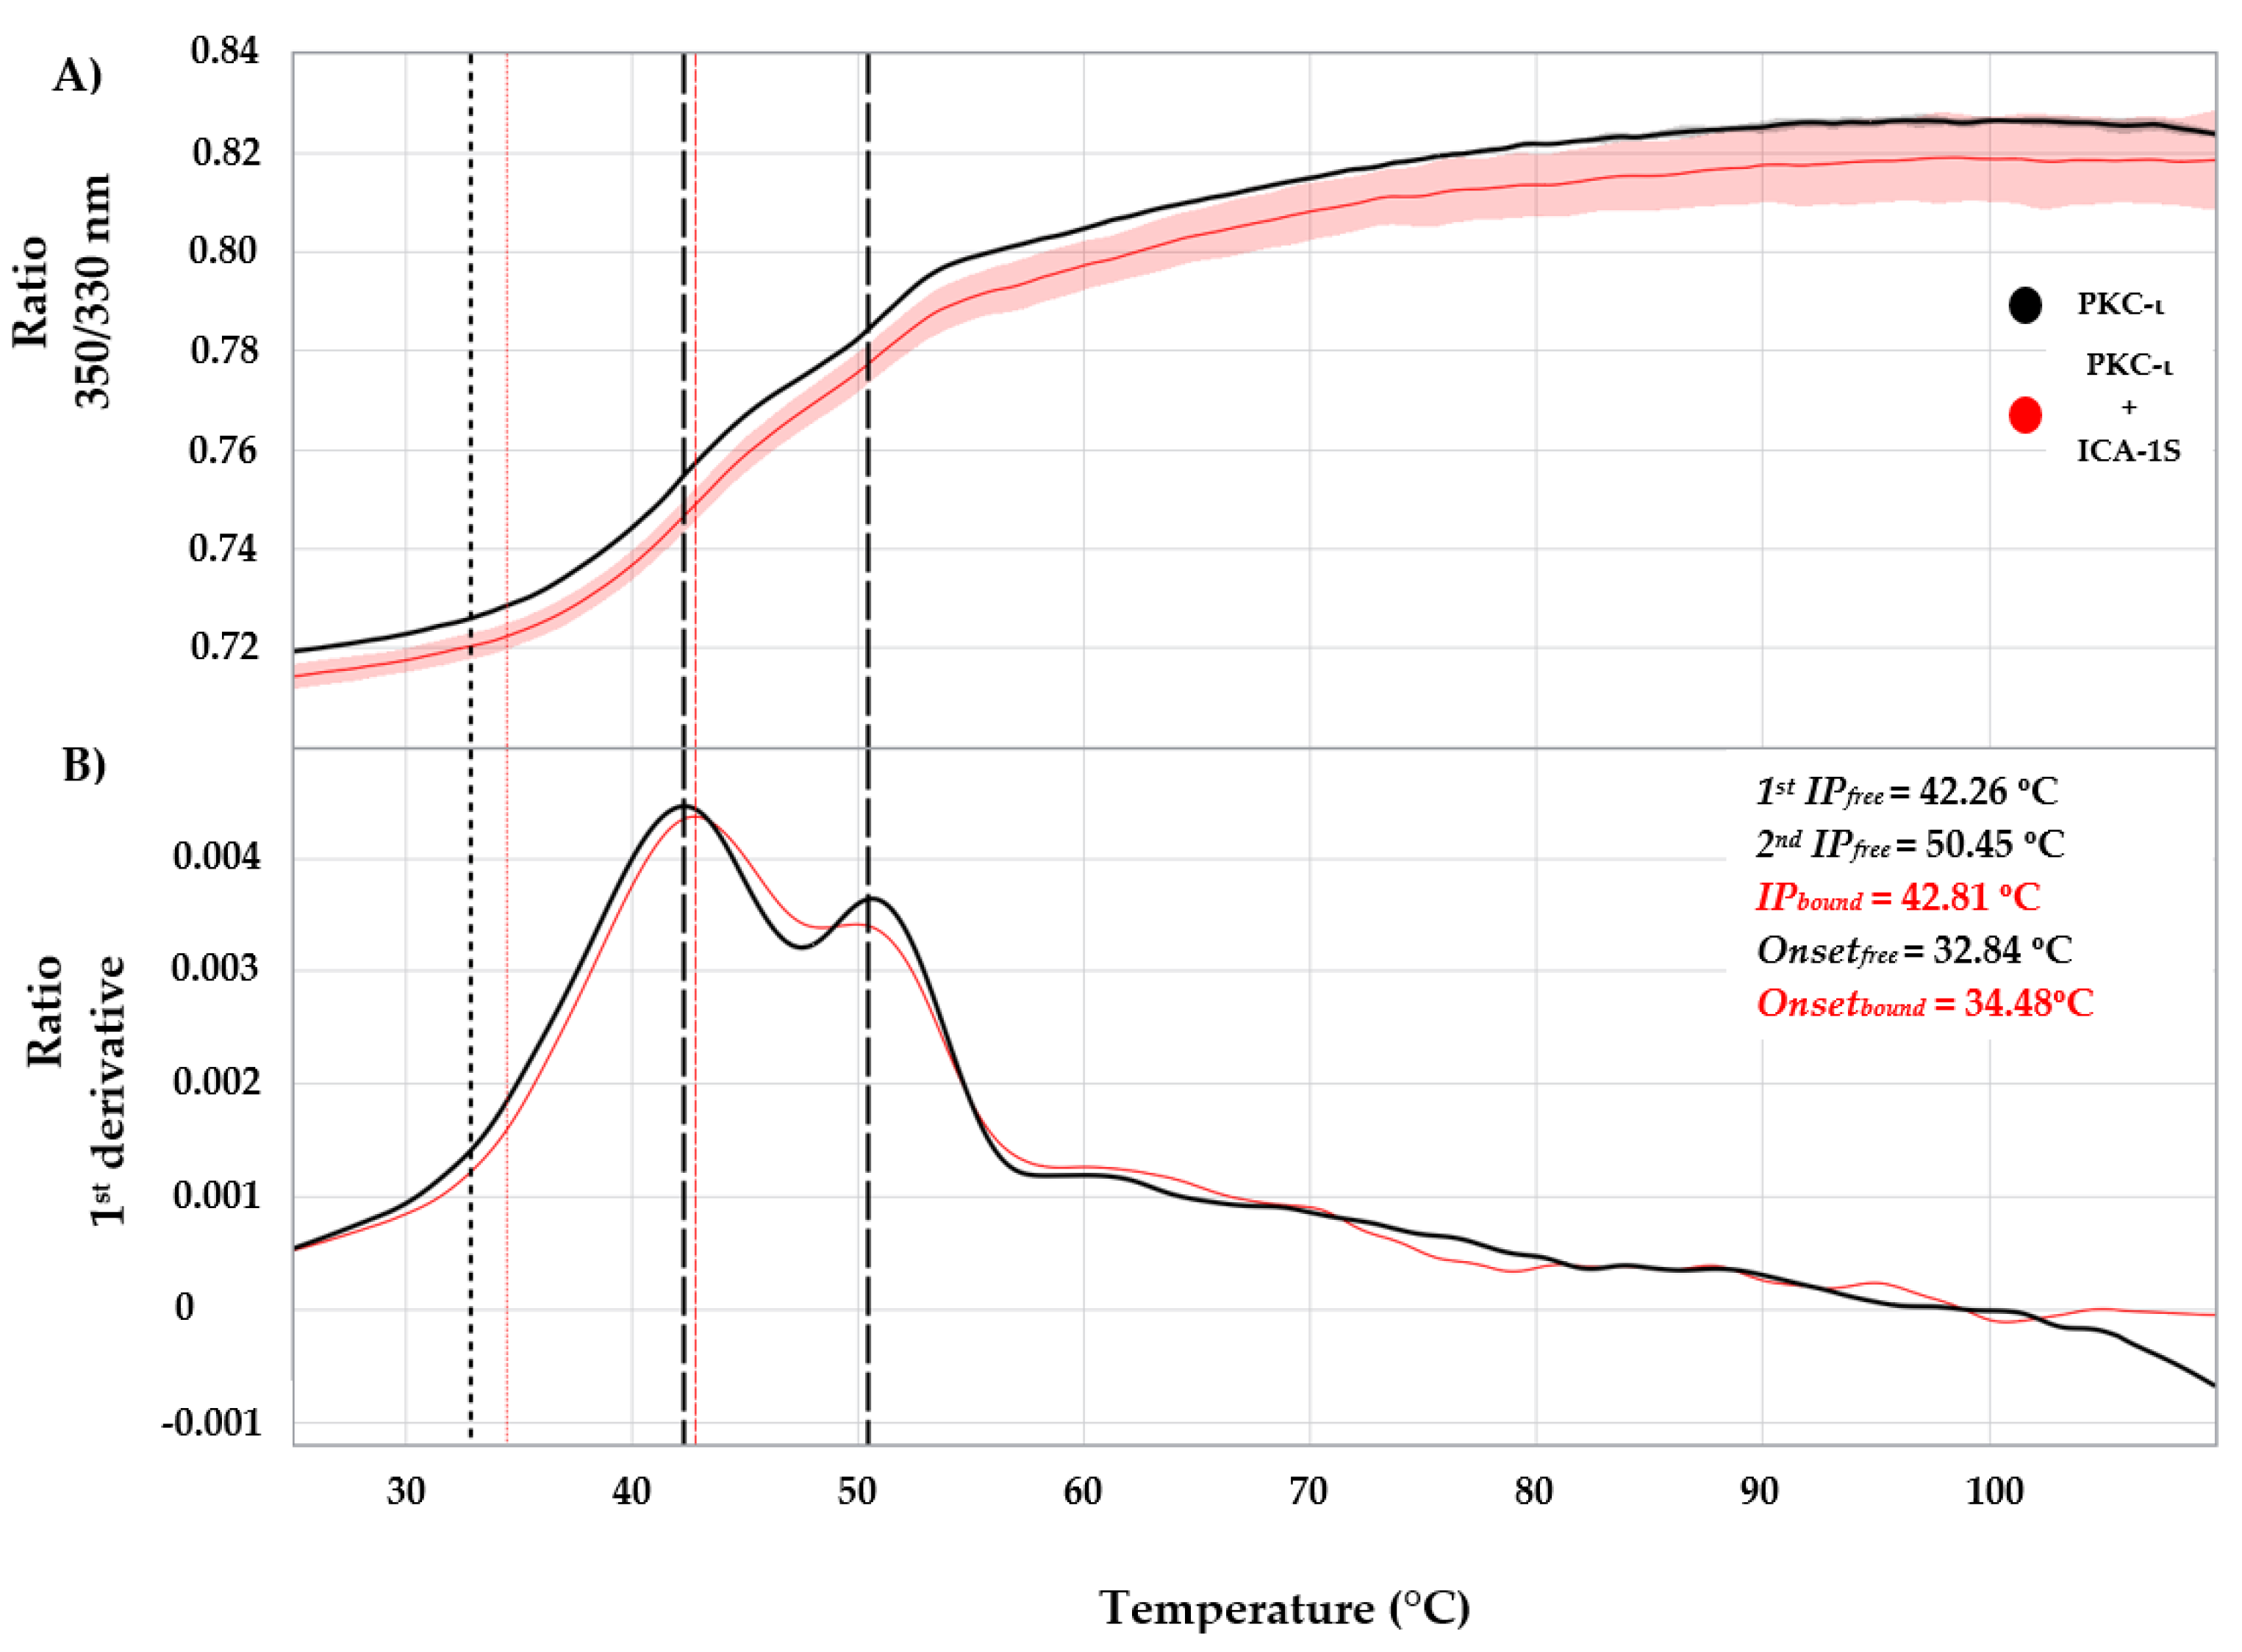
Figure 4.
The turbidity profile shows a rapid aggregation around the unfolding of the second domain, indicating the stepwise domain-specific aggregation in Figure 4B (first derivative). The extrapolation of the vertical dashed lines from Figure 4A indicates the maximum level of aggregation in the second domain. The maximum aggregation due to the denaturation of the protein domains occurred at around 71.90 °C and 73.30 °C in the free and bound states, respectively. These 1.4 °C temperature differences indicate a stability factor in the PKC-ι to ICA-1S complex. The dashed vertical lines represent inflection points (IP), and dotted vertical lines represent onsets (TON), (N=3 independent measurements for both free and bound state).
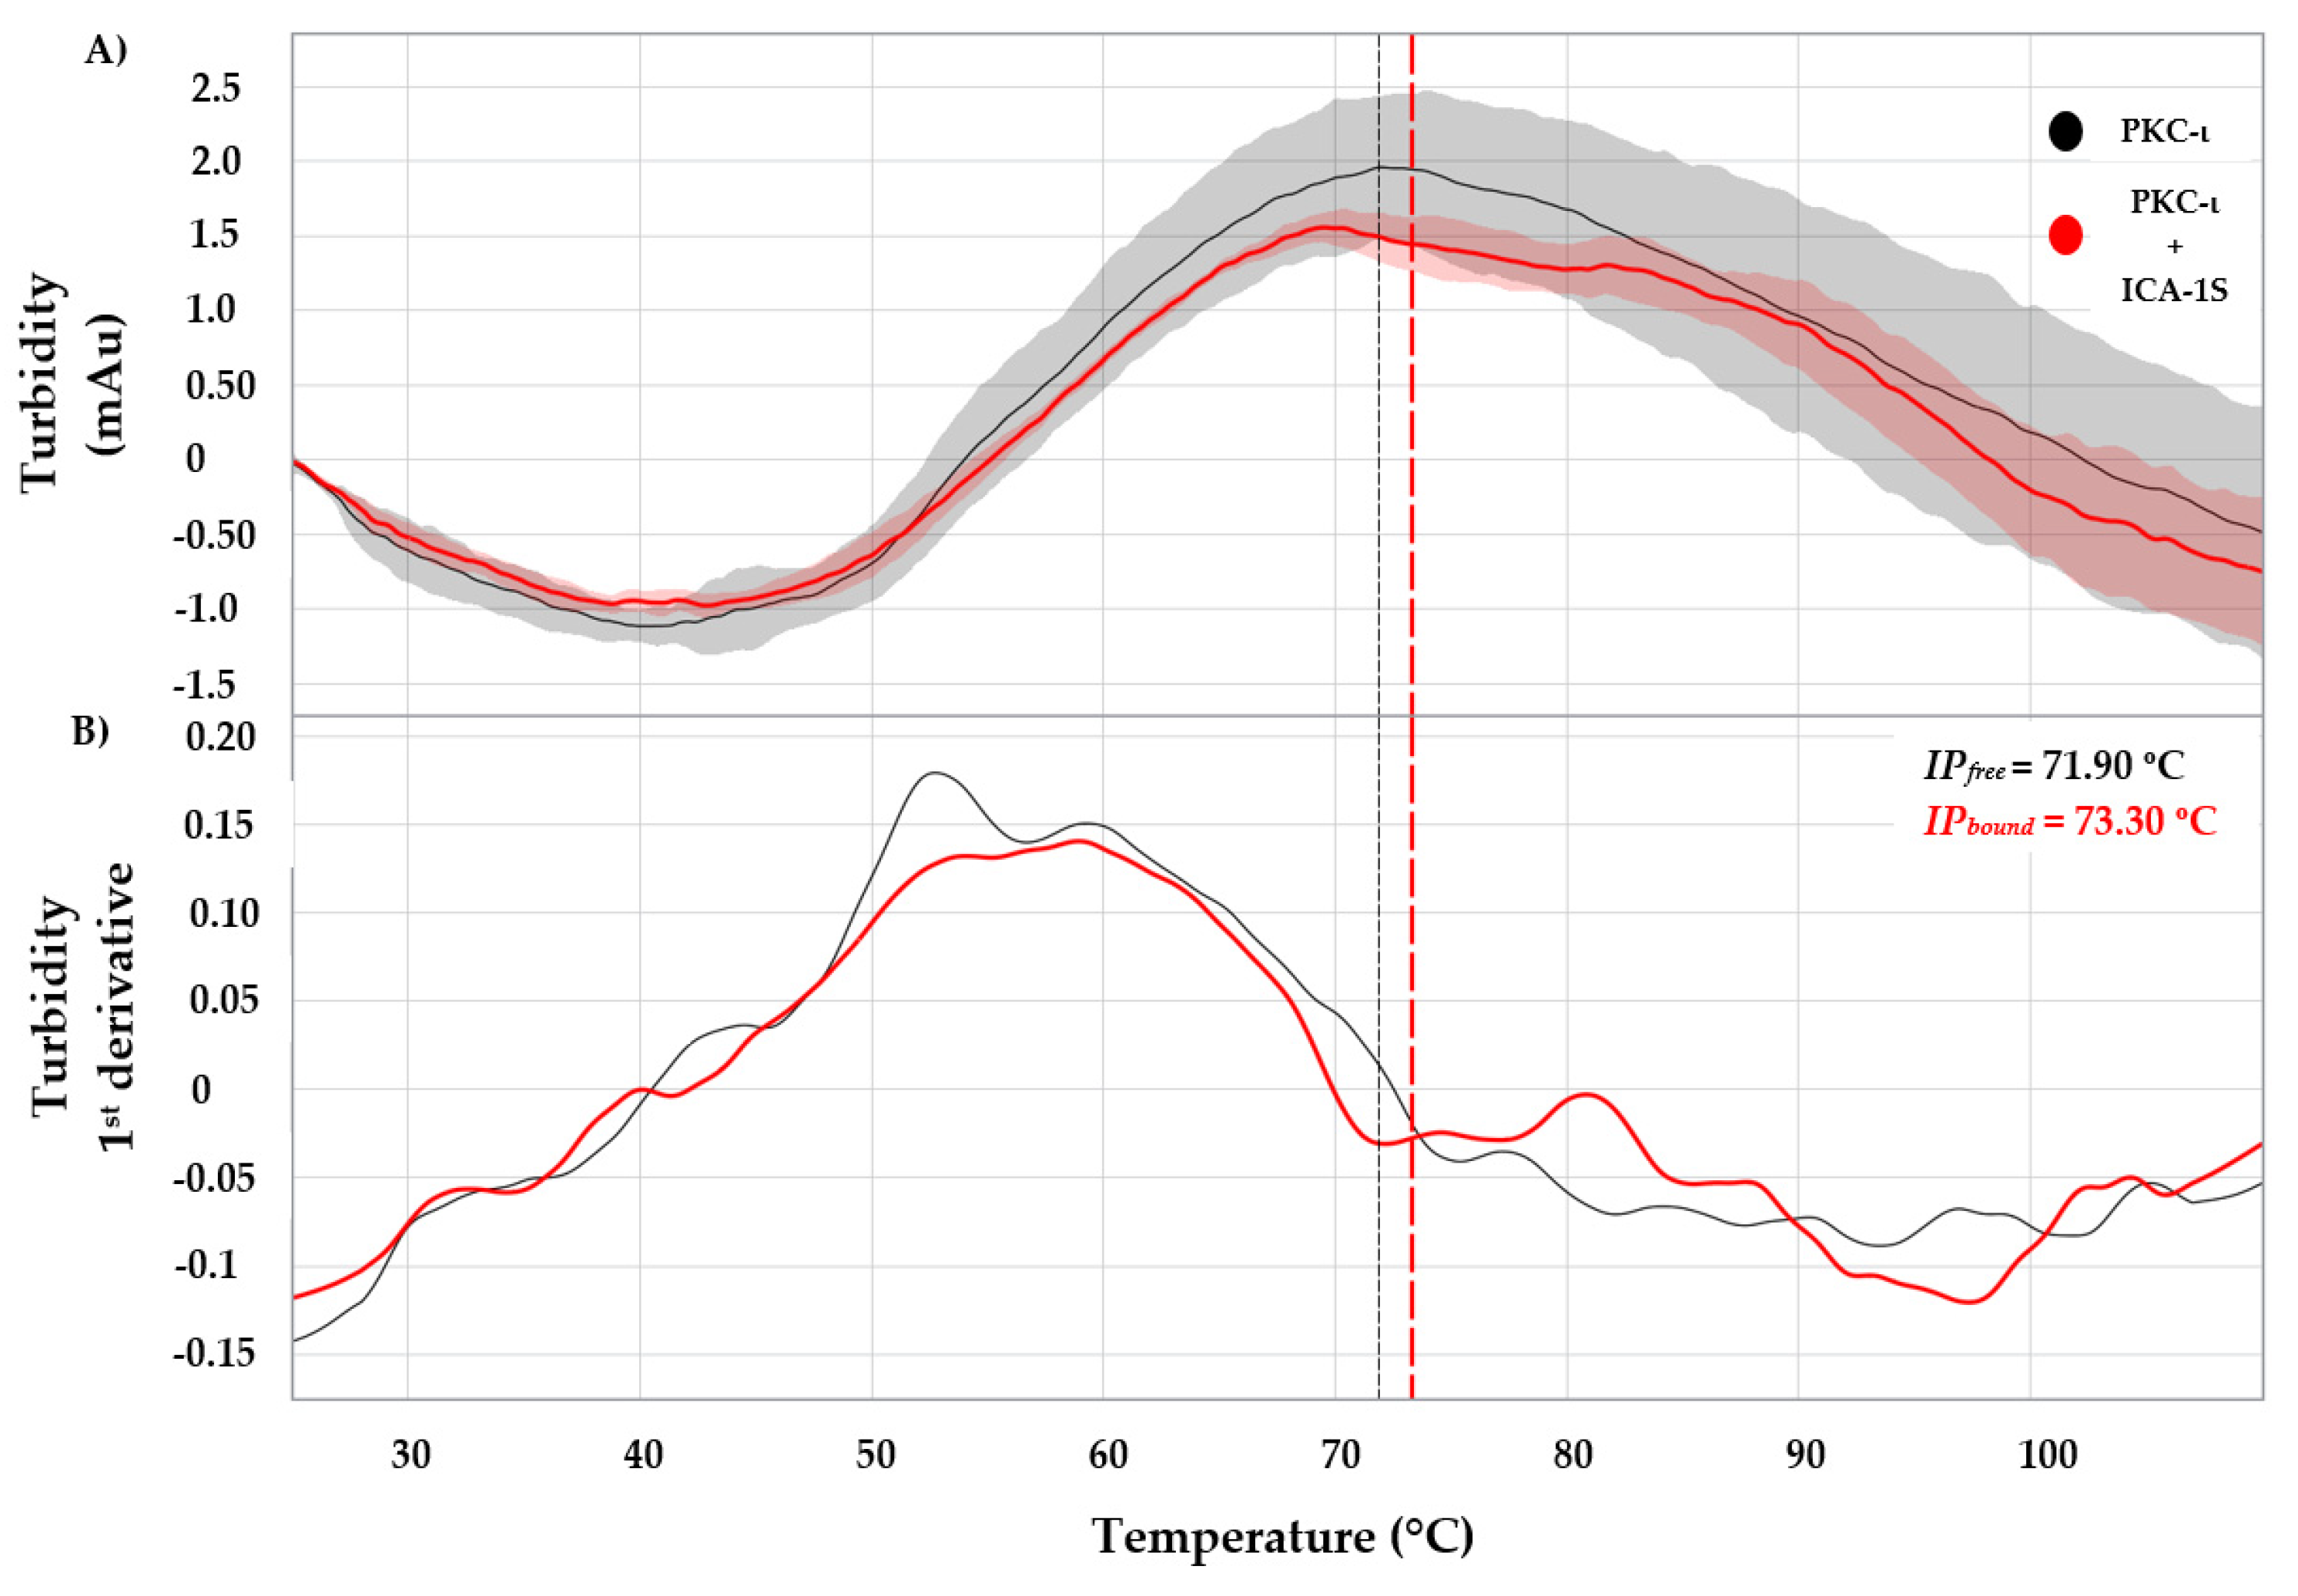
Figure 5.
The cumulant radius profile of PKC-ι as a function of temperature. The plot indicates an identical average particle size change initiated at the 48.53 °C and 48.64 °C temperatures for both the free and bound states of the protein, respectively. (N=3 independent measurements for both free and bound state).
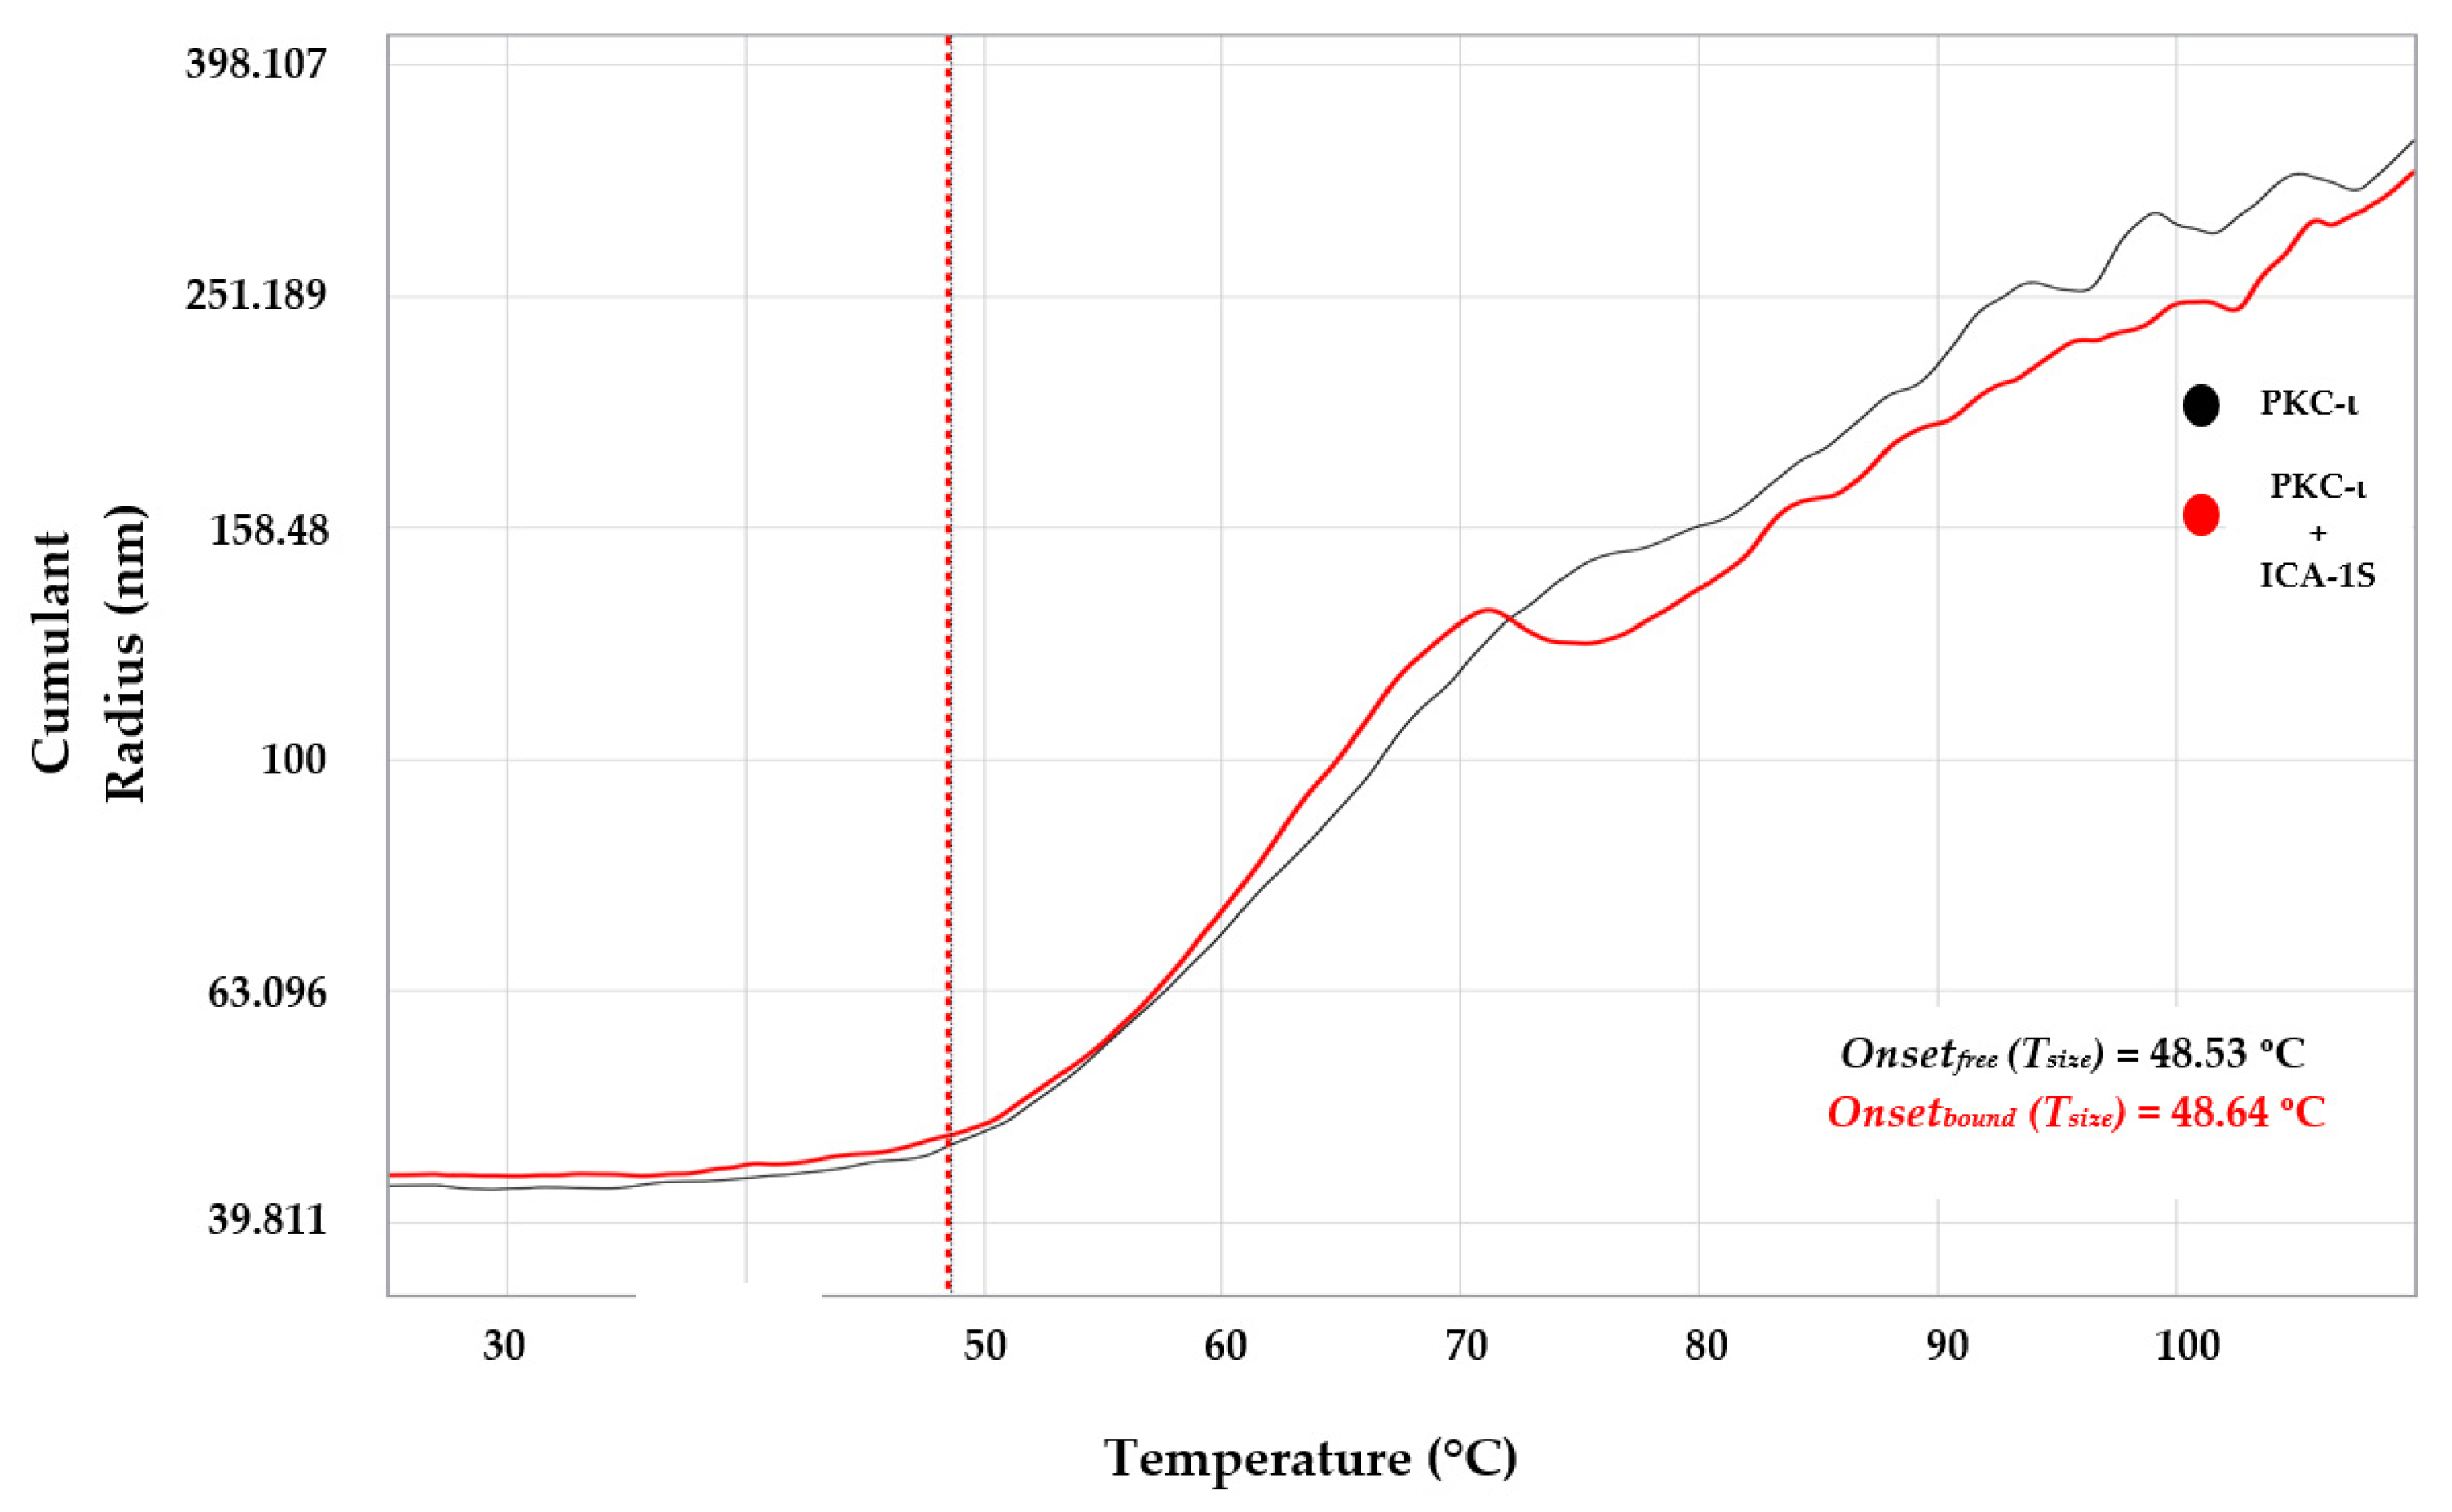
Figure 9.
The isothermal titration calorimetry data of PKC-ι with ICA-1S. A) The plot of differential potential vs. molar ratio, where each peak indicates a single injection of protein with 11 injections of 2 µM each of PKC-ι to 20 µM of ICA-1S in the cell (reverse ITC). The heat of dilution of PKC-ι to PBS buffer has been subtracted. B) The calculated Kd (36.20 nM), enthalpy ∆H (+79.20 Kcal/mol), and entropy ∆S (299.80 cal/mol.K), free energy change ∆G (-10.14 Kcal/mol) from heat of injection vs. molar ratio plot indicating a possible entropy-driven hydrophobic interaction spontaneously occurring in the binding pocket. The plots were drawn according to the guideline of the integrated public-domain software packages NITPIC/SEDPHAT/GUSSI [38].
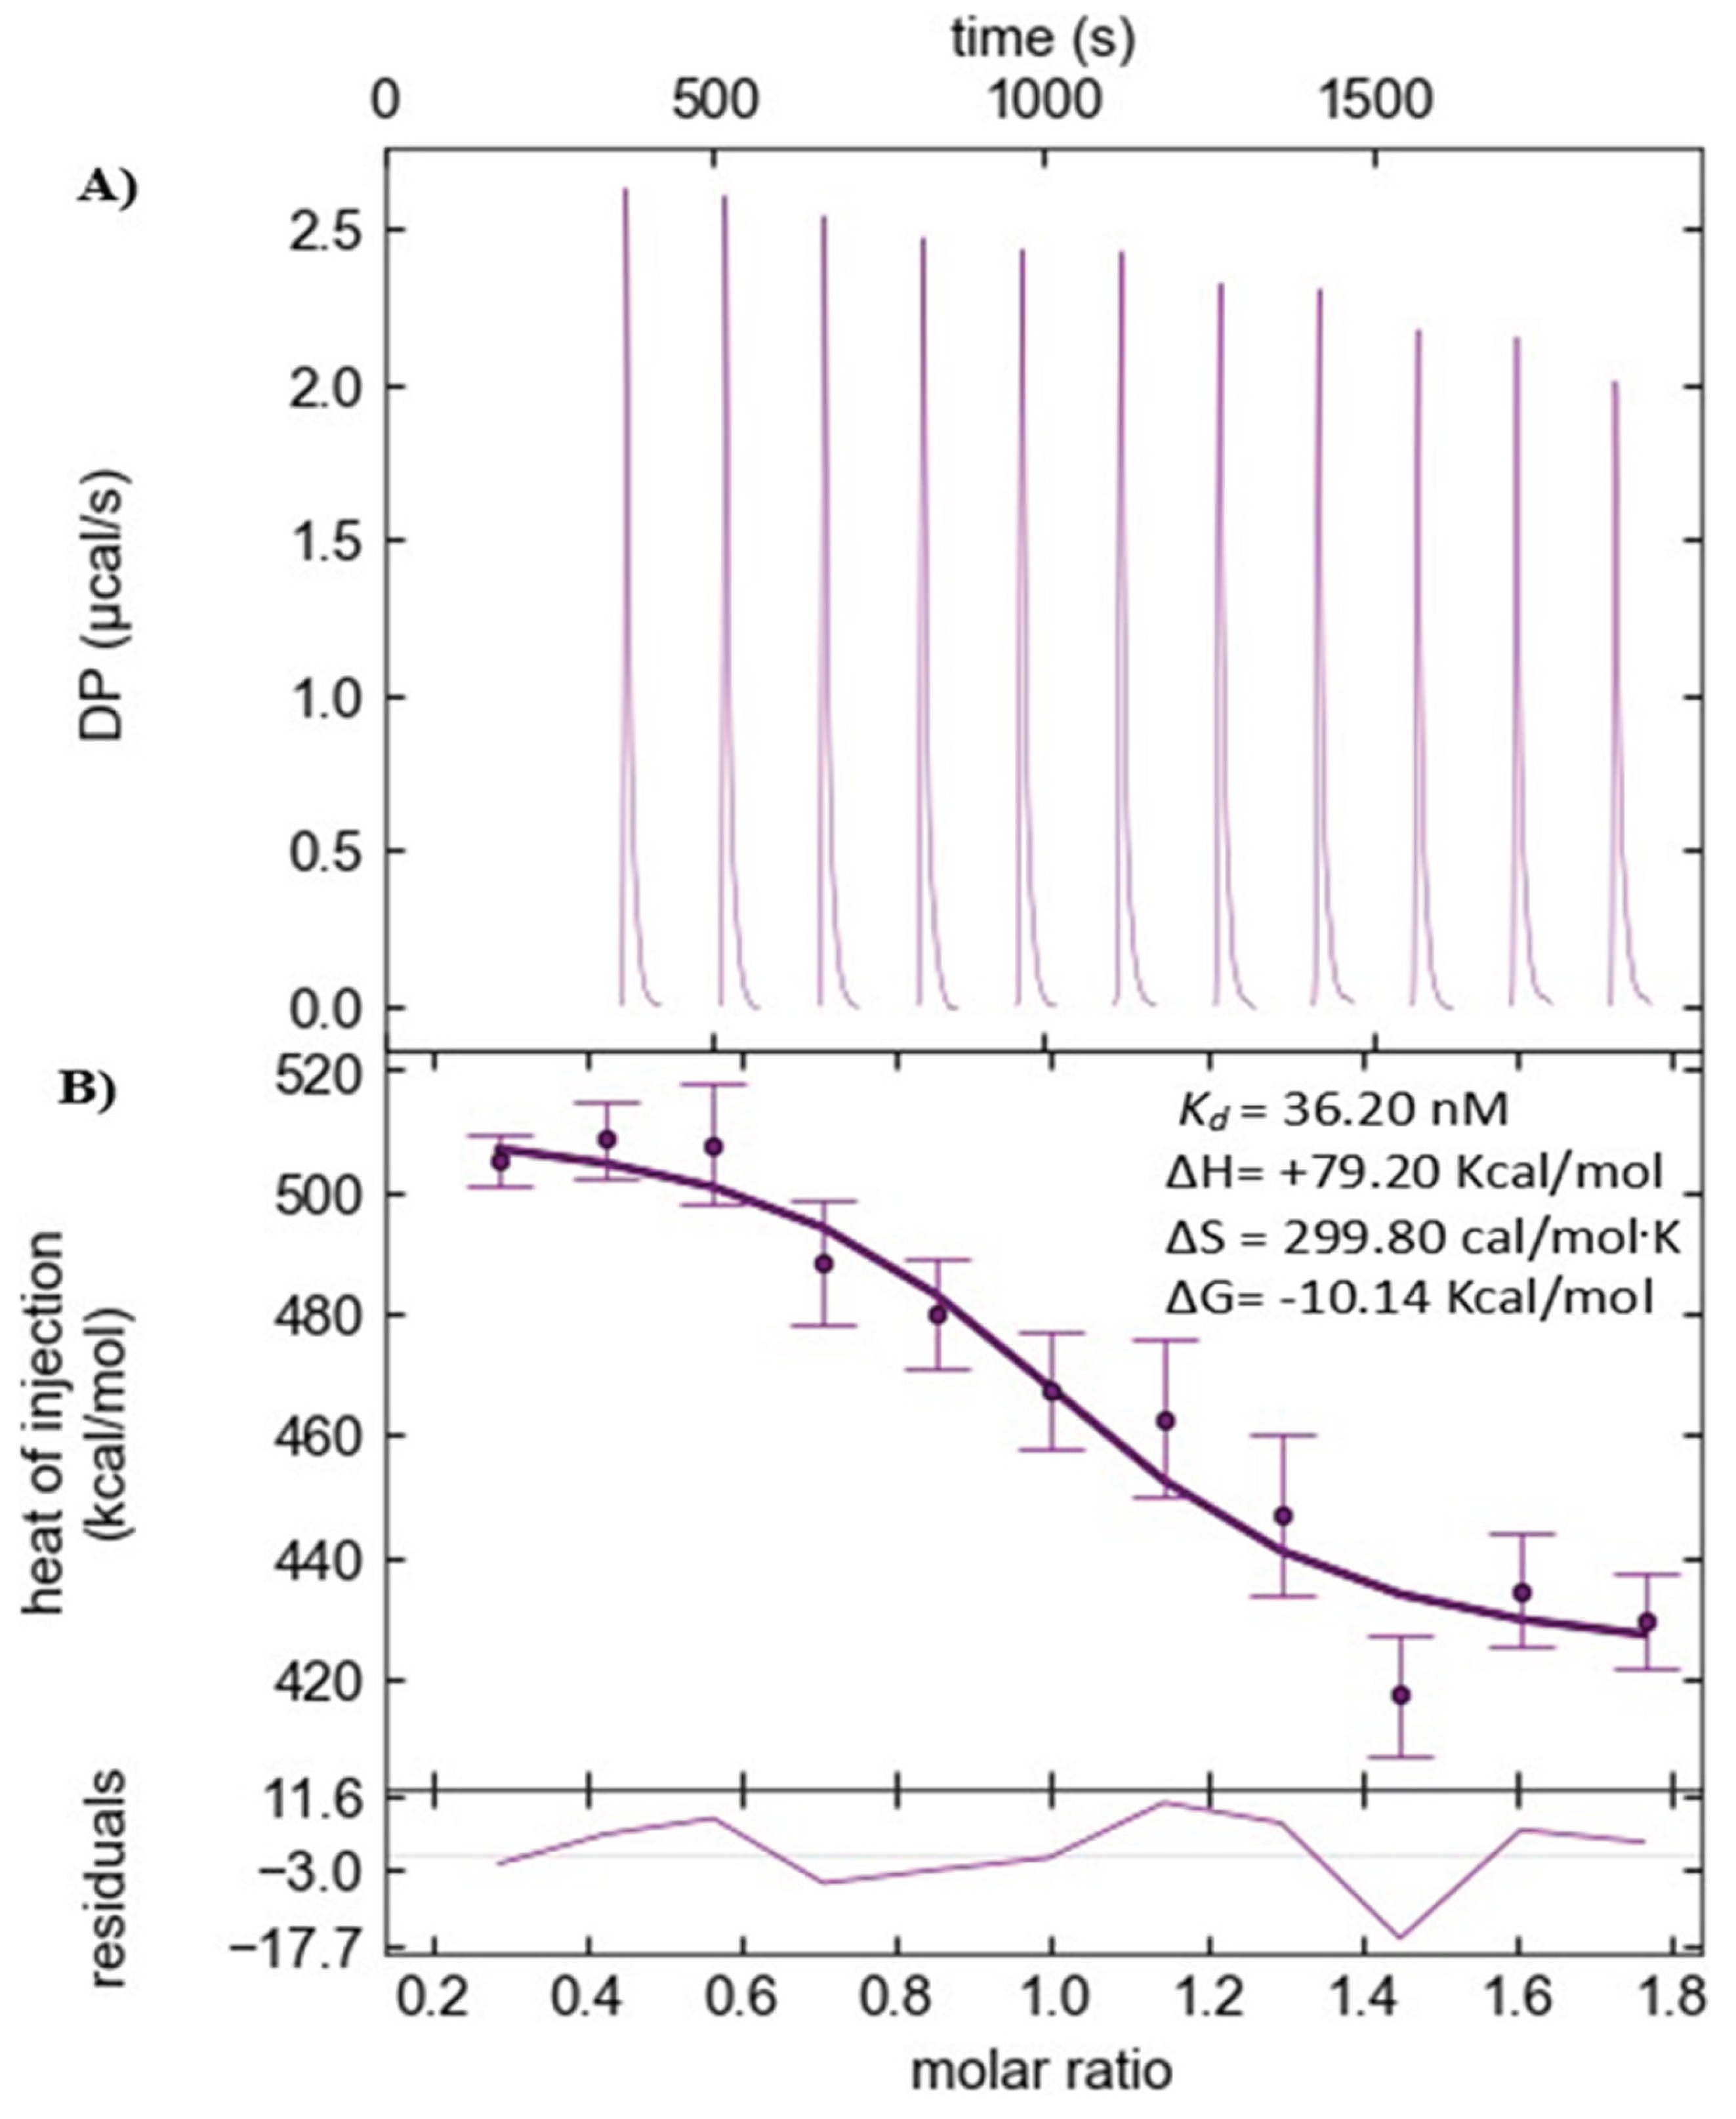
Figure 10.
PKC-ι rapid expression and purification test results. A) SDS-PAGE Coomassie blue stained gel. B) Western Blot (WB) by anti-Strep tag antibody. C) and D) PKC-ι rapid expression and purification test results. Protein was successfully expressed in both Tn cells and SF9 cells. The Tn cell line demonstrated a relatively better expression level and was used for large-scale expression (1L) and purification. E) The purified protein (2µg) was loaded and tested on Sodium dodecyl-sulfate polyacrylamide gel electrophoresis (SDS-PAGE) post-purification of PKC-ι. Here, MW: Molecular weight marker; Ø: Non-induced strain; Medium: Culture medium; NPE: Nature protein extract; DPE: Denatured protein extract.
Disclaimer/Publisher’s Note: The statements, opinions and data contained in all publications are solely those of the individual author(s) and contributor(s) and not of MDPI and/or the editor(s). MDPI and/or the editor(s) disclaim responsibility for any injury to people or property resulting from any ideas, methods, instructions or products referred to in the content. |
© 2025 by the authors. Licensee MDPI, Basel, Switzerland. This article is an open access article distributed under the terms and conditions of the Creative Commons Attribution (CC BY) license (http://creativecommons.org/licenses/by/4.0/).
Copyright: This open access article is published under a Creative Commons CC BY 4.0 license, which permit the free download, distribution, and reuse, provided that the author and preprint are cited in any reuse.


