
Submitted:
02 June 2025
Posted:
03 June 2025
You are already at the latest version
Abstract
The cryopreservation of limited sperm samples, especially those retrieved from patients, poses significant challenges due to the small number of viable cells available for freezing. Traditional microliter cryopreservation methods are fraught with difficulties, as thawed sperm cells become nearly impossible to locate under a microscope due to their mobility and the multiple focal planes presented by larger drops. This search time is critical, as sperm cells enter a state of decline post-thaw. Conversely, when sperm cells are cryopreserved in nanoliter volumes, they do manage to be easily discovered, but they do not survive the freezing and thawing processes entirely. This phenomenon is attributed to the diffusion of water molecules from the droplet into the surrounding oil, which, while designed to limit evaporation, inadvertently increases solute concentrations in the aqueous environment, leading to cellular desiccation. This article elucidates the mechanisms underlying this lethal diffusion effect and presents a novel approach for freezing in nanoliter volumes, which has demonstrated significantly improved survival rates through carefully optimized procedures in clinical trials. Our findings highlight the importance of adapting cryopreservation techniques to enhance the viability of individual sperm cells, ultimately facilitating better outcomes in assisted reproductive technologies. This research presents a significant breakthrough by identifying the critical role of water diffusion in reducing sperm cell viability during nanoliter cryopreservation, a major impediment for limited samples. The novelty of our results lies in both elucidating this specific mechanism of cell death and introducing a novel approach: utilizing water-saturated oil as a protective layer. This method effectively mitigates the osmotic stress caused by water loss, demonstrating remarkably improved cell survival. This work not only advances the scientific understanding of cryopreservation at the nanoscale but also offers a practical, impactful solution poised to revolutionize fertility treatments for patients with low sperm counts and holds promise for broader applications in biological cryopreservation.
Keywords:
cryopreservation
; nanoliter
; sperm cells
; diffusion
; IVF
1. Introduction
Many medical conditions, as well as several biological and environmental factors, can cause temporary or permanent low sperm count [1-4]. The number of men who suffer from fertility problems is increasing, and about 9% of men ages 15 to 44 in the United States reported infertility problems. Around 1.5 million in vitro fertilization (IVF) treatments are performed each year, worldwide [5]. Cryopreservation of human spermatozoa has been recognized as an efficient procedure for managing male fertility [6]. However, patients with severe oligospermia and nonobstructive azoospermia have extremely limited numbers of viable sperm in their epididymal and testicular samples. Consequently, fertility treatments require the freezing and retrieval of very few sperm cells, and in extreme cases, a single cell [7]. This need cannot be addressed with conventional methods used for cryopreservation of a sample of sperm cells. As noted by Nawroth et al., “conventional sperm preservation techniques can result in sperm loss owing to sperm adherence to the carrier vessel, harsh centrifugation or washing procedures” [8]. Furthermore, in standard, large volume cryotubes, individually cryopreserved cells are virtually undetectable after thawing.
Efficient cryopreservation of surgically-retrieved spermatozoa reduces the number of surgical interventions and circumvents the logistical problems associated with coordinating oocyte and spermatozoa retrieval [4]. The current status of single-sperm cryopreservation has been thoroughly reviewed [5].While novel cryopreservation approaches have been designed for limited numbers of motile sperm in very small volumes, a fully established technique is not currently available in most IVF laboratories [5]. Some facilities use a variety of microliter containers; often causing cell loss [7]. This suggests that novel cryopreservation technologies, designed to handle small numbers of sperm or single sperm cells, are essential.
In this study, we discuss problems that arise when using nanoliter droplets to cryopreserve small numbers of sperm cells, or even a single cell that has high optic quality and is physically separated from neighboring cells by the oil that covers the aqueous droplets. It was found that water may diffuse from the freezing liquid droplet into the protective layer of oil surrounding it. Therefore, a new approach was developed to overcome this impediment that causes cell death during the freeze-thaw cycle.
2. Results
2.1. Cryopreservation of sperm cells suspended in freezing medium droplets under oil
No difference was observed in the initial average velocity of 66 μm/s as a function of droplet volume. The results shown in Fig. 1 are an average of at least five measurements. The standard deviation (SD) does not exceed 5%. The results clearly show that in small droplets, none of the sperm cells survived the freeze-thaw cycle. Furthermore, even though there was little reduction in sperm cell count after 30 minutes, the velocity in small droplets is significantly reduced (Figure 1).
2.2. Hypothesis for cause of death during the freeze-thaw cycle
We hypothesized that water molecules diffusing from the droplet medium into the surrounding oil might be the cause for motility loss in nanoliter volumes. This diffusion would result in elevated the solute concentration in the droplet, consequently changing the physiological state of cells. These phenomena, however, only becomes relevant when cells are suspended in nanoliter volumes. This is consistent with the observation that diffusion efficiency is proportional to the ratio between the surface area of a droplet and its volume [9].
This hypothesis was verified by fluorescence polarization measurements of fluorescent droplets. The idea behind this was that if water diffuses from the freezing medium droplet, the glycerol and salts contents are elevated, and consequently, its fluorescence polarization. The results (see Supplementary Material, Part 2) indeed clearly indicate an increase in fluorescence polarization with time, especially in small initial volumes, implying that water is transported from the droplet to the surrounding oil. Loss of distilled water from droplets under oil was also observed using bright field microscopy (see Supplementary Material, Part 3).
2.3. Theoretical calculation of droplet shrinkage rate
Having determined that the elevation in solute concentration to be the main, if not the sole, cause of cell death, we are left with the question as to why this phenomenon seems to behave as a sudden rather than a continuous event, as shown in Figure 1. To explain this, we need to understand how the rate of solute concentration changes with decreasing droplet volume.
During the 30 minutes the nanodroplet is kept under the protective oil layer, the droplet shrinks due to diffusion through the surface of the droplet. If we assume that the droplet is an ideal spherical cap, then its surface area (excluding the cross-section area of its base in contact with the glass surface) and its volume are:
As noted in Part 1 of the Supplementary Material, , which gives:
where the measured contact angle α is 51°. As shown in Part 1 of the Supplementary Material, , and thus:
The rate of change of the surface area with time is the derivative of Equation 2:
We found that (see Online Resource, Part 4).
Another approach to find the rate of droplet shrinkage is to consider the rate of water diffusion into oil through the surface area of the droplet as [10]:
where m = m(t), S = S(t), and V = V(t) are the mass, surface area and volume of the droplet, respectively, and ρ is the density of water at 25 °C (997 kg/m³).
Taking the derivative of Equation 3 gives:
Substituting Equation 5 into 4 yields:
In addition, Fick’s First Law shows that diffusion of molecules is due to a concentration gradient [11]:
where is diffusivity of water in oil (m²/min), I is the total current of molecules across the surface, S and j is the current surface density.
From Equation 1, and inserting this into Equation 7 gives:
Rearranging and integrating gives:
where is the surface area very far from the droplet and is the concentration of water at this point,
which yields:
Since and the concentration in an infinite-sized droplet is , one gets:
and dividing by we get:
Comparing Equations 10 and 6, one gets:
Finally, placing the average value of (from Table S1) gives:
The two approaches give very similar rates.
This leads to the pivotal question as to how changes with droplet volume. Concentration is defined as:
where is the initial number of moles of solute in the droplet (≈ 10-9 mol in small nanoliter volumes, as osmolality of biological solutions is about 0.15 Osmole [12]). The rate of change of droplet solute concentration is:
Taking from Equation 13 and from experiment (see Part 3 of the Supplementary material) gives:
2.4. Determining Changes in Viscosity
Viscosity was determined using two approaches. In the first approach, the viscosity was extracted from the measurements of the fluorescence polarization using Perrin’s Law (Equations 21 and 22) of fluorescein-stained droplets. The following values for fluorescein were taken from the literature: [13,14], τ = 3.8 ns [15,16], ρ = 1 g/cm3, MW = 376.3 g/mol [17]; the molar volume of fluorescein is . The initial viscosity of the medium mixed with cell suspension was measured with a rheometer, giving 1.876 cP.
In the second approach, the viscosity of the droplet is extracted from the changes in its volume (for detailed description, see Supplementary material, Part 4). The relation between the viscosities of the solution (and water () is [18]:
C is the solute concentration and is a constant > 0, depending on the electrostatic forces between the ions, 19], and the initial viscosity of the solvent is :
Then, the viscosity after 30 minutes is:
The results obtained from the two approaches are plotted in Figure 3, where FP is the fluorescence polarization method and BF is the bright field method. There is a very good correlation between the two. This adds reliability to the results and, furthermore, avoids the use of an exogenous fluorescent dye that is potentially toxic to the sperm cells in the droplet.
2.5. The principal reason for velocity decrease after soaking
Figure 1 shows that after soaking cells in droplets, their average velocity in nanoliter volumes was reduced by about 40% compared to those soaked in large volume (10 nL and more). Two hypotheses are proposed: (i) physiological deterioration due to increase in salt concentration caused by water diffusion from the droplet and (ii) deceleration due to the increase in viscosity.
The following physical model is used to describe the expected velocity decrease resulting from the increased viscosity. There are two forces acting on a sperm cell: the driving force of the flagellum [20] in the direction of movement and the drag force of the viscosity in the opposite direction. The sperm cell can be approximated as a tri-axial ellipsoid having axes: a = 2.5 µm, b = 1.0 µm and c = 1.5 µm.
Based on previous work [21], it can be assumed that sperm cells move at a constant average velocity, so these two forces are of equal magnitude. Stokes’ Law for an ellipsoid is [22]:
where F is the drag force, is the involuntary velocity of the sperm cells, η is the viscosity, b, c are the semi-axes perpendicular to the direction of movement, and K is the shape factor of an ellipsoid (30), which is equal to:
where β is the ratio between the major axis and the geometrical mean of the other two minor axes (i.e., ), yielding . Using the measured viscosities of the sperm cell suspension (, see above, section “Determining changes in viscosity”) and velocities (, Figure 1), one can use Equation 18 to determine the drag force on the sperm cell (F). Since the driving force of the flagellum is approximately constant in the absence of physiological phenomena (28), at any given time, the drag force F remains constant and equal to the driving force. The viscosity of the droplet after 30 minutes was determined (see above), and this provides an estimate of the cell velocity under the assumed absence of physiological phenomena:
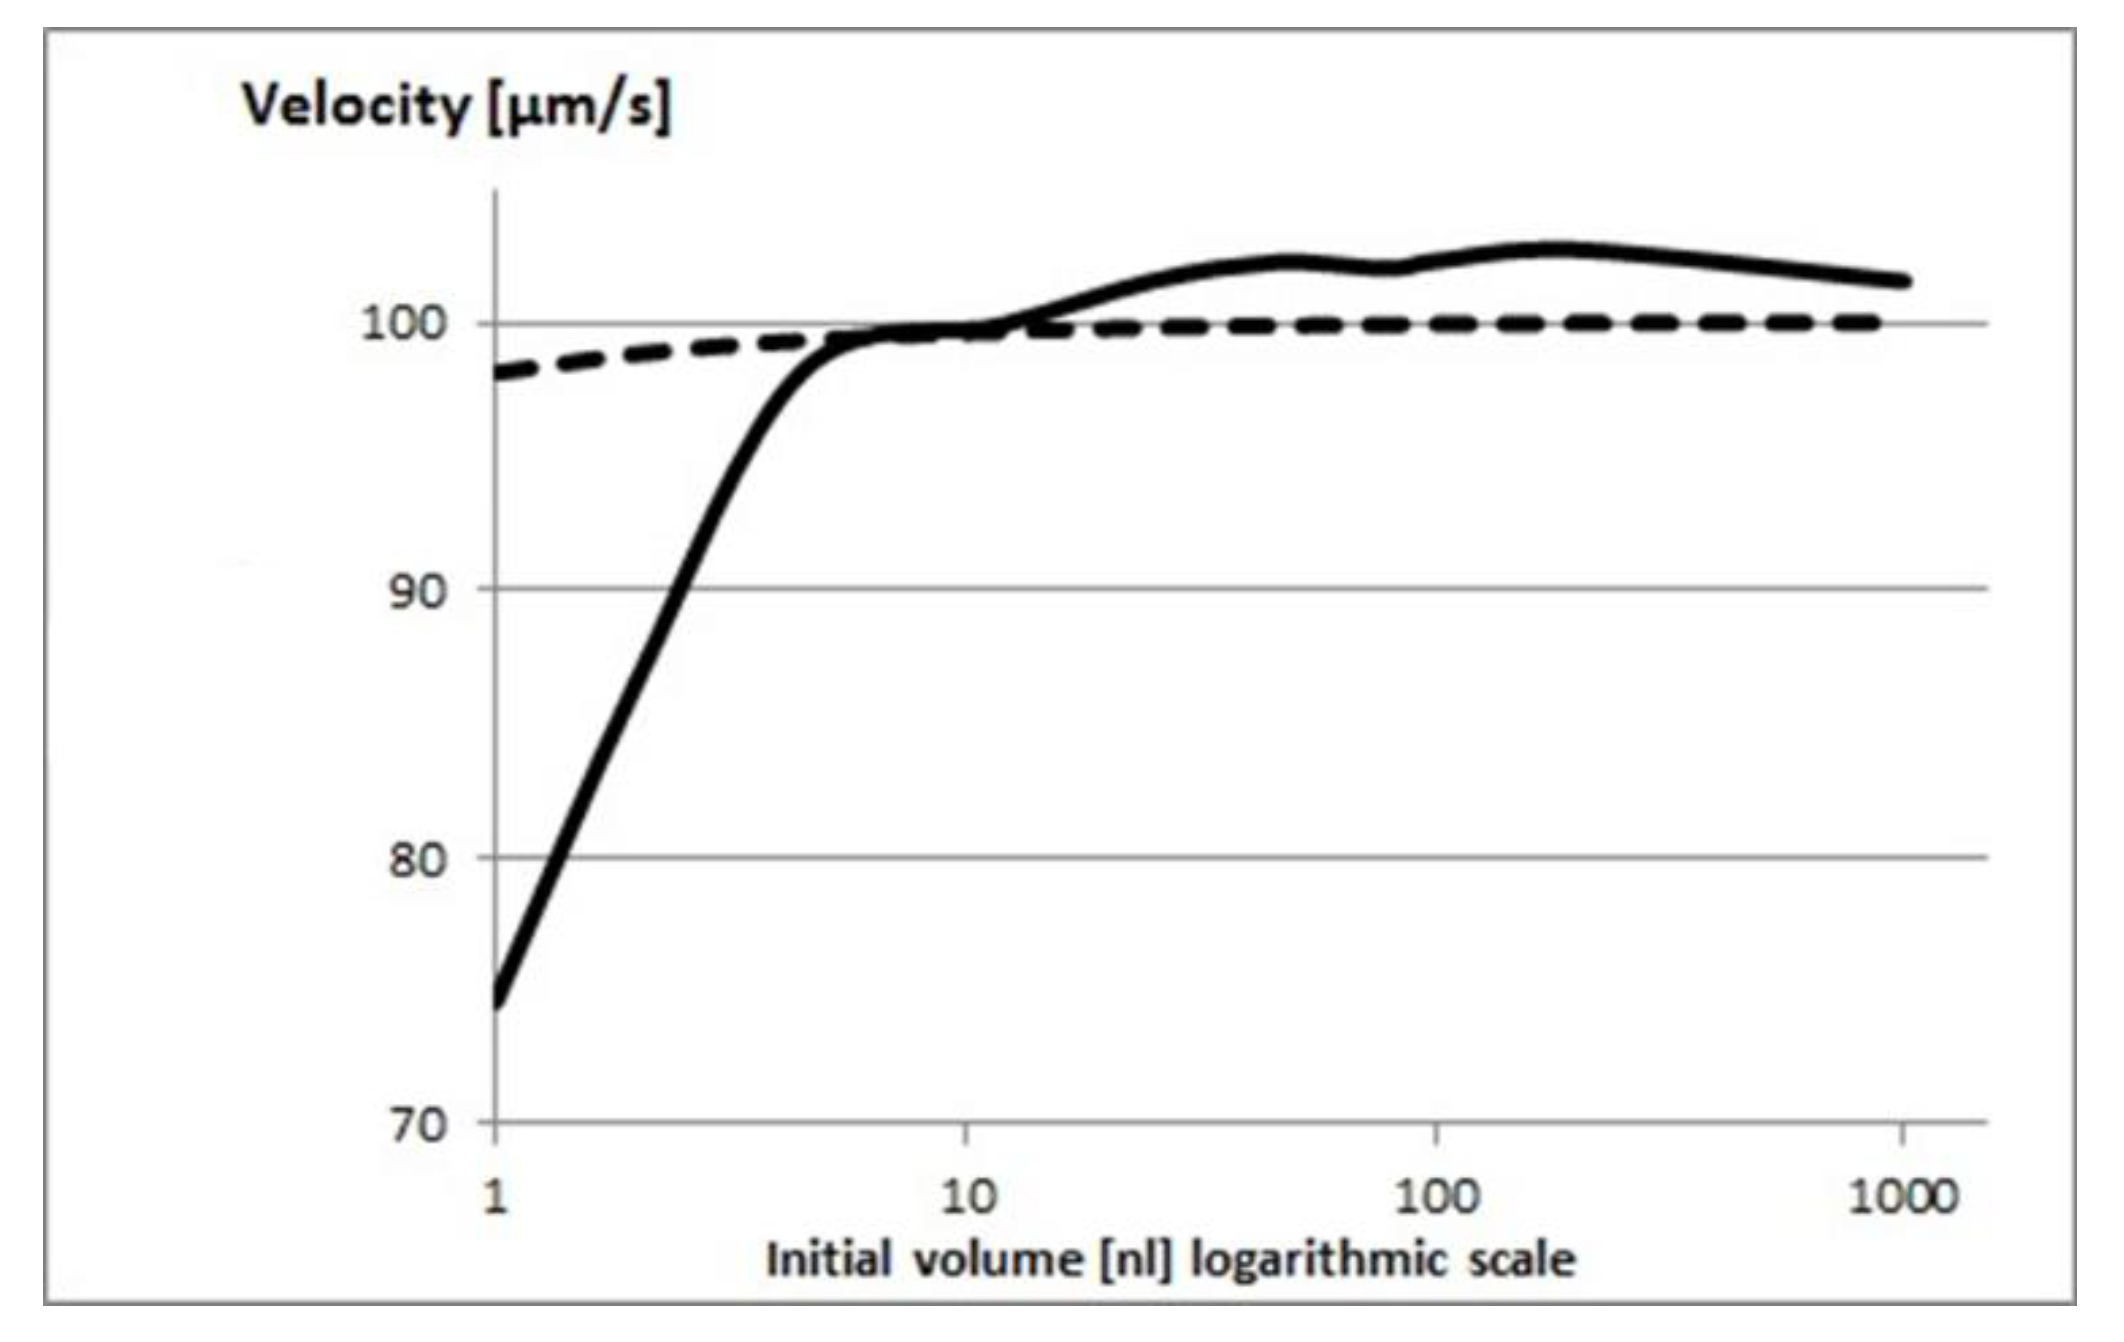
Figure 4 shows the measured velocities compared to the estimates from Equation 20. There is good agreement between the two for larger initial volumes, but at smaller volumes there is a very significant and increasing deviation of the model from the measured velocities. This indicates that viscosity alone cannot explain the deceleration and clearly physiological phenomena – such as increased salt concentration – negatively affecting the sperm cells.
).
2.6. Preventing sperm cell dehydration in nanoliter volumes
Consider Fick’s first law in Equation 10. The diffusion coefficient (D) depends solely on the behavior of the molecules at the oil-water interface [23], which is contingent on the host properties, and apparently unchangeable in any given system. The rate of diffusion (j) is proportional to the concentration gradient across the droplet surface . In principle, reducing this gradient should reduce the rate of diffusion and as a result increase the survivability of the sperm cells within the droplet. To test this, an oil-water mixture was stirred for 1 hour and the saturated oil layer was separated and used for cryopreservation. In a previous study, we showed that the solubility of water in oil is very low but not insignificant [24].
3. Discussion
Cryopreservation of small numbers of sperm cells – or even one – presents special challenges. These samples are at a nanoliter scale but typical preparation methods use a protective oil layer over the nanoliter droplet to protect it from evaporation, which increases with decreasing droplet radius. Unfortunately, we observed that in these nanodroplets, the motility and velocity of the sperm cells is dramatically decreased (Figure 1). In volumes below 30 nl, sperm cells do not survive the freeze-thaw cycle. Two effects were proposed to explain this phenomenon: increased viscosity and increased salt concentration resulting from water diffusion from the droplet. Our modelling of the effect of viscosity on sperm cell velocity showed that this alone cannot explain the deceleration of the sperm cells. This means that diffusion of water from the droplet causes a significant increase in salt concentration, that has a deleterious effect on the sperm cells.
In a previous study [20], we showed that contrary to common perception water has low solubility in oil. Likewise, the rate of diffusion of water from the droplet is proportional to the concentration gradient across the droplet surface. In larger droplets, a small amount of diffusion will have a small effect on salt concentration, but in a nanodroplet this same amount of diffusion will have a more dramatic impact because the proportion of water lost to the amount remaining is larger.
Thus, we propose a simple, user-friendly approach to safely cryopreserve small droplets of sperm cells. By substituting the protective covering layer of oil with water-saturated oil we were able to achieve a remarkable improvement in cell motility and velocity. While the focus of this study was cryopreservation of sperm cells, it is reasonable to assume that the conclusion here can be applied to cryopreservation of other biological samples.
The novelty and significance in this manuscript includes the identification of water diffusion as the primary cause of cell death in nanoliter cryopreservation and the development of a simple, effective method using water-saturated oil to overcome this challenge, demonstrating significantly improved cell survival.
The broader impact is the potential to revolutionize fertility treatments for patients with limited sperm samples and applicability to the cryopreservation of other biological materials, advancing practices in reproductive medicine and biosciences.
4. Materials and Methods
4.1. Materials
Spermatozoa (about 20 samples from anonymous donors) were obtained from the Infertility and IVF Unit of the Chaim Sheba Medical Center, Israel. The recruitment period for this study was August 1, 2019 to December 31, 2022. Quinn’s Advantage Sperm Freezing Medium, (CooperSurgical, Ballerup, Denmark) and oil for tissue culture was purchased from Sage (SAGE In Vitro Fertilization, Målov, Denmark).
4.2. Ethics
Sperm was obtained after receiving signed informed consent from each patient to use cells that would have otherwise been discarded. All personal data were fully anonymized to maintain patient privacy, and samples were coded so that patient information could not be reached. This study was approved by the local Institutional Review Board (approval number 0187-23-SMC).
4.3. Measurement System
Images were acquired using a motorized Olympus inverted IX81 microscope (Tokyo, Japan), which is equipped with a sub-micron Marzhauser Wetzlar motorized stage type SCAN-IM, with an L step controller (Wetzlar-Steindorf, Germany) and a filter wheel including a fluorescein fluorescence cube containing excitation filters (470–490 nm), dichroic mirrors (505 nm long pass), and emission filters (510–530 nm). The filters were obtained from Chroma Technology Corp. (Brattleboro, VT, USA). A cooled, highly sensitive 14-bit, ORCA II C4742-98 camera (Hamamatsu, Japan) was used for imaging. Olympus Cell^P software version 1.7 (Tokyo, Japan) was used for image analysis.
4.4. Freezing and Thawing Sperm Cells
Spermatozoa, washing medium and freezing medium were mixed in a 1:1:2 ratio. Using a pipette, 0.1 µL droplets were deposited under the oil in a glass-bottom Petri dish. With the pipette tip under the microscope, the droplet was broken up into smaller, random droplets. Droplets with circular cross-sections were selected, and their exact volume was calculated (see below).
Droplets of varying volumes of freezing medium containing sperm cells were injected under oil onto a Petri dish. Using software developed in-house. The survival rates and average velocity of the sperm cells in the droplets were measured at three time points: (a) immediately after formation of the droplets (initial state), (b) 30 minutes later, and (c) after the freeze-thaw cycle. The initial state was measured for review and comparison. Initial motility was used to normalize the value of percent motility in subsequent measurements.
The Petri dish was placed in liquid nitrogen vapor for 5-10 minutes and then immersed in liquid nitrogen. In the thawing process, the Petri dish was transferred to a microscope and incubated at 37°C.
4.5. Cell count and viability/motility assessment
To obtain the best statistical information for dozens or hundreds of motile sperm cells within a nanoliter droplet, we developed unique software based on machine learning with neural networks (the software is available from the authors upon request). The software takes a video clip of the sample under the microscope, learns to identify sperm cells, tracks them with an accuracy close to 100%, and reports the percentage of motile cells and their average velocity at the single-cell level. The software tracks sperm movement paths across sequential image frames. It removes immobile or abnormally mobility sperm, enhancing data quality and focus on viable cells. Involuntary movements deviating significantly from the sperm's axis are identified and quantified.
4.6. Viscosity measurement of macroscopic volume media
Viscosity of macroscopic volumes were measured with a HAAKE MARS 60 Rheometer (ThermoScientific, Germany). In this device, the sample liquid is placed within the annulus formed by one cylinder located inside a second. One of the cylinders is rotated at a set speed, which determines the shear rate inside the annulus. The liquid tends to drag the other cylinder, and the force (torque) it exerts on the second cylinder is measured and converted to shear stress. Two speeds give two points on the ‘flow curve’ [25], which is sufficient to define a Bingham plastic model [26] that is widely used in the oil industry for determining the flow characteristics of drilling fluids [27].
4.7. Assessment of the viscosity of a microscopic fluorescent droplet
Fluorescent (Fluorescein, Sigma, USA) microscopic solution droplets were excited with polarized light (470 nm). The parallel and perpendicular intensities of the polarized fluorescence emitted, were measured using analyzer polarizers oriented parallel and perpendicular to the excitation vector field. The fluorescence polarization () is the ratio [13,28]:
The relation between the measured polarization and the intrinsic polarization , the fluorescence polarization of frozen-like gas fluorescent solution, i.e. the fluorescent solution in which there is no rotational movement of molecules, is given by Perrin’s equation [29]: 1/ – 1/3 = (1/ – 1/3) (1 + /), where is the rotational correlation time. For quasispherical fluorophores, it is [30–32]. In this manner one can determine the viscosity from fluorescence measurements, where the viscosity is:
4.8. Volume of a microdroplet
The relation between the volume of a droplet on a surface and its cross sectional area A, as derived in the Supplementary Material Part 1, is:
The contact angle (α) of 51° at room temperature, which was used in determining the coefficient in Equation 3, was measured using an OCA20 goniometer (DataPhysics Instruments GmbH, Filderstadt, Germany). The cross-sectional area was measured using image analysis using the software included with the microscope. The accuracy of this model was tested by injecting known volumes of water onto a glass surface. The obtained relation of is sufficiently close to Equation 3 and the slight deviation could be explained by the level of accuracy in measuring α.
Supplementary Materials
The following supporting information can be downloaded at the website of this paper posted on Preprints.org.
Author Contributions
All of the authors contributed to the study conception and design. Design, development, theoretical development and analysis of experiments, as well as manuscript preparation, were performed by B.-S.G.; experiments in the IVF laboratory was under the management of R.O. The biological aspects of this study were overseen by N.Z.; physical and biophysical aspects were supervised by M.D., who also contributed to writing the manuscript. D.F. reviewed and prepared the article for submission and funded the research. All authors have read and agreed to the published version of the manuscript.
Funding
This research has no external funding.
Institutional Review Board Statement
The study was conducted in accordance with the Declaration of Helsinki, and approved by the Institutional Review Board (IRB) of the Sheba Medical Center (approval number 0187-23-SMC, approved on 26 July 2022). Sperm samples were obtained after receiving signed informed consent from each patient to use cells that would have otherwise been discarded. All personal data were fully anonymized, and samples were coded to ensure that no identifying information could be retrieved.
Informed Consent Statement
Informed consent was obtained from all subjects involved in the study. Each participant signed a written consent form allowing the use of surplus sperm cells for research purposes. All samples were anonymized to ensure full confidentiality.
Data Availability Statement
All data generated or analyzed during this study are included in the manuscript and the supplementary files.
Conflicts of Interest
The authors declare no conflicts of interest.
Abbreviations
The following abbreviations are used in this manuscript:
| MDPI | Multidisciplinary Digital Publishing Institute |
| DOAJ | Directory of open access journals |
| TLA | Three letter acronym |
| LD | Linear dichroism |
References
- Jarow, J.P.; Espeland, M.A.; Lipshultz, L.I. Evaluation of the azoospermic patient. J. Urol. 1989, 142, 62-65. [CrossRef]
- Vladić, T.; Forsberg, L.A.; Järvi, T. Sperm competition between alternative reproductive tactics of the Atlantic salmon in vitro. Aquaculture 2010, 302, 265-269. [CrossRef]
- Berookhim, B.M.; Schlegel, P.N. Azoospermia due to spermatogenic failure. Urol. Clin. 2014, 41, 97-113. [CrossRef]
- Schlegel, P.N.; Su, L.M. Physiological consequences of testicular sperm extraction. Hum. Reprod. 1997, 12, 1688-1692. [CrossRef]
- Liu, S.; Li, F. Cryopreservation of single-sperm: where are we today? Reprod. Biol. Endocrinol. 2020, 18, 1-12. [CrossRef]
- Sherman, J.K. Synopsis of the use of frozen human semen since 1964: state of the art of human semen banking. Fertil. Steril. 1973, 24, 397-412. [CrossRef]
- AbdelHafez, F.; Bedaiwy, M.; El-Nashar, S.A.; Sabanegh, E.; Desai, N. Techniques for cryopreservation of individual or small numbers of human spermatozoa: a systematic review. Hum. Reprod. Update 2009, 15, 153-164. [CrossRef]
- Nawroth, F.; Isachenko, V.; Dessole, S.; Rahimi, G.; Farina, M.; Vargiu, N.; Mallmann, P.; Daten, M.; Capobianco, G.; Peters, D.; Orth, I.; Isachenko, E. Vitrification of human spermatozoa without cryoprotectants. Cryoletters 2002, 23, 93-102.
- Haynes, W.M., Ed. CRC Handbook of Chemistry and Physics, 91st ed.; CRC Press: Boca Raton, FL, USA, 2010; p. 6-251.
- Geankoplis, C.J. Transport Processes and Unit Operations, 4th ed.; Prentice Hall PTR: Englewood Cliffs, NJ, USA, 1993; p. 410.
- Fick, A. On liquid diffusion. J. Membr. Sci. 1995, 100, 33-38. [CrossRef]
- Koeppen, B.M.; Stanton, B.A. Physiology of Body Fluids. In Renal Physiology, 5th ed.; Elsevier: Philadelphia, PA, USA, 2013; pp. 1-14.
- Lakowicz, J.R. Principles of Fluorescence Spectroscopy, 3rd ed.; Springer: New York, NY, USA, 2006.
- Yahav, G.; Weber, Y.; Duadi, H.; Pawar, S.; Fixler, D. Classification of fluorescent anisotropy decay based on the distance approach in the frequency domain. Opt. Express 2022, 30, 6176-6192. [CrossRef]
- Magde, D.; Rojas, G.E.; Seybold, P. Solvent dependence of the fluorescence lifetimes of Xanthene dyes. Photochem. Photobiol. 1999, 70, 737-744. [CrossRef]
- Yahav, G.; Hirshberg, A.; Salomon, O.; Amariglio, N.; Trakhtenbrot, L.; Fixler, D. Fluorescence lifetime imaging of DAPI-stained nuclei as a novel diagnostic tool for the detection and classification of B-cell chronic lymphocytic leukemia. Cytom. Part A 2016, 89, 644-652. [CrossRef]
- Haynes, W.M., Ed. CRC Handbook of Chemistry and Physics, 96th ed.; CRC Press: Boca Raton, FL, USA, 2015; p. 1-11.
- Simha, R. Effect of concentration on the viscosity of dilute solutions. J. Colloid Sci. 1949, 5, 386-392.
- Rumble, J.R., Ed. CRC Handbook of Chemistry and Physics, 99th ed.; CRC Press: Boca Raton, FL, USA, 2018; p. 6-209.
- Silverman, M.; Simon, M. Flagellar rotation and the mechanism of bacterial motility. Nature 1974, 249, 73-74. [CrossRef]
- Katz, D.F. Methods of measuring swimming speed of spermatozoa. J. Reprod. Fertil. 1975, 45, 263-272. [CrossRef]
- Tu, J. Computational Fluid and Particle Dynamics in the Human Respiratory System; Springer: Dordrecht, Netherlands, 2013; p. 154.
- Cussler, E.L. Diffusion: Mass Transfer in Fluid Systems, 2nd ed.; Cambridge University Press: Cambridge, UK, 1997; p. 101.
- Galmidi, B.-S.; Iron, M.A.; Zurgil, N.; Deutsch, M. Measurement of water saturation in soybean oil. ACS Omega 2023, 8, 19385-19390. [CrossRef]
- Duffy, J.J. Getting the complete picture: how to best measure a viscosity flow curve. Am. Lab. 2016, 48, 26-29.
- Rehm, B. Flow drilling: underbalance drilling with liquid single-phase systems. In Underbalanced Drilling: Limits and Extremes; Koederitz, W.L., Tveit, S., Pictures, H., Rehm, B., Eds.; Gulf Professional Publishing: Cambridge, MA, USA, 2012; pp. 37-75. [CrossRef]
- Franck, A. Measuring structure of low viscosity fluids in oscillation using rheometers with and without a separate torque transducer. Annu. Trans. Nord. Rheol. Soc. 2003, 11, 95-100.
- Tzroya, A.; Duadi, H.; Fixler, D. Extracting Superficial Scattering by Q-Sensing Technique. J. Biophotonics 2024, 17, e202400262. [CrossRef]
- Perrin, F. Mouvement Brownien d’un ellipsoide (I). Dispersion dielectrique pour des molecules ellipsoidales. J. Phys. Radium 1934, 1, 497-511.
- Dill, K.A. Molecular Driving Forces: Statistical Thermodynamics in Chemistry and Biology; Garland Science: New York, NY, USA, 2003; p. 327.
- Yahav, G.; Pawar, S.; Weber, Y.; Atuar, B.; Duadi, H.; Fixler, D. Imaging the rotational mobility of carbon dot-gold nanoparticle conjugates using frequency domain wide-field time-resolved fluorescence anisotropy. J. Biomed. Opt. 2023, 28, 056001. [CrossRef]
- Fixler, D.; Namer, Y.; Yishay, Y.; Deutsch, M. Influence of fluorescence anisotropy on fluorescence intensity and lifetime measurement: theory, simulations and experiments. IEEE Trans. Biomed. Eng. 2006, 53, 1141-1152. [CrossRef]
Figure 1.
Survival rate is divided by initial motility (motility, left axis) and average velocity (right axis) of sperm cells in freezing medium droplets injected under oil as a function of droplet volume. The solid and dotted lines are the motility, as a function of initial droplet volume. The solid line was measured after 30 minutes, and the dotted line was after the freeze-thaw cycle. The dashed line is the average velocity after 30 minutes.
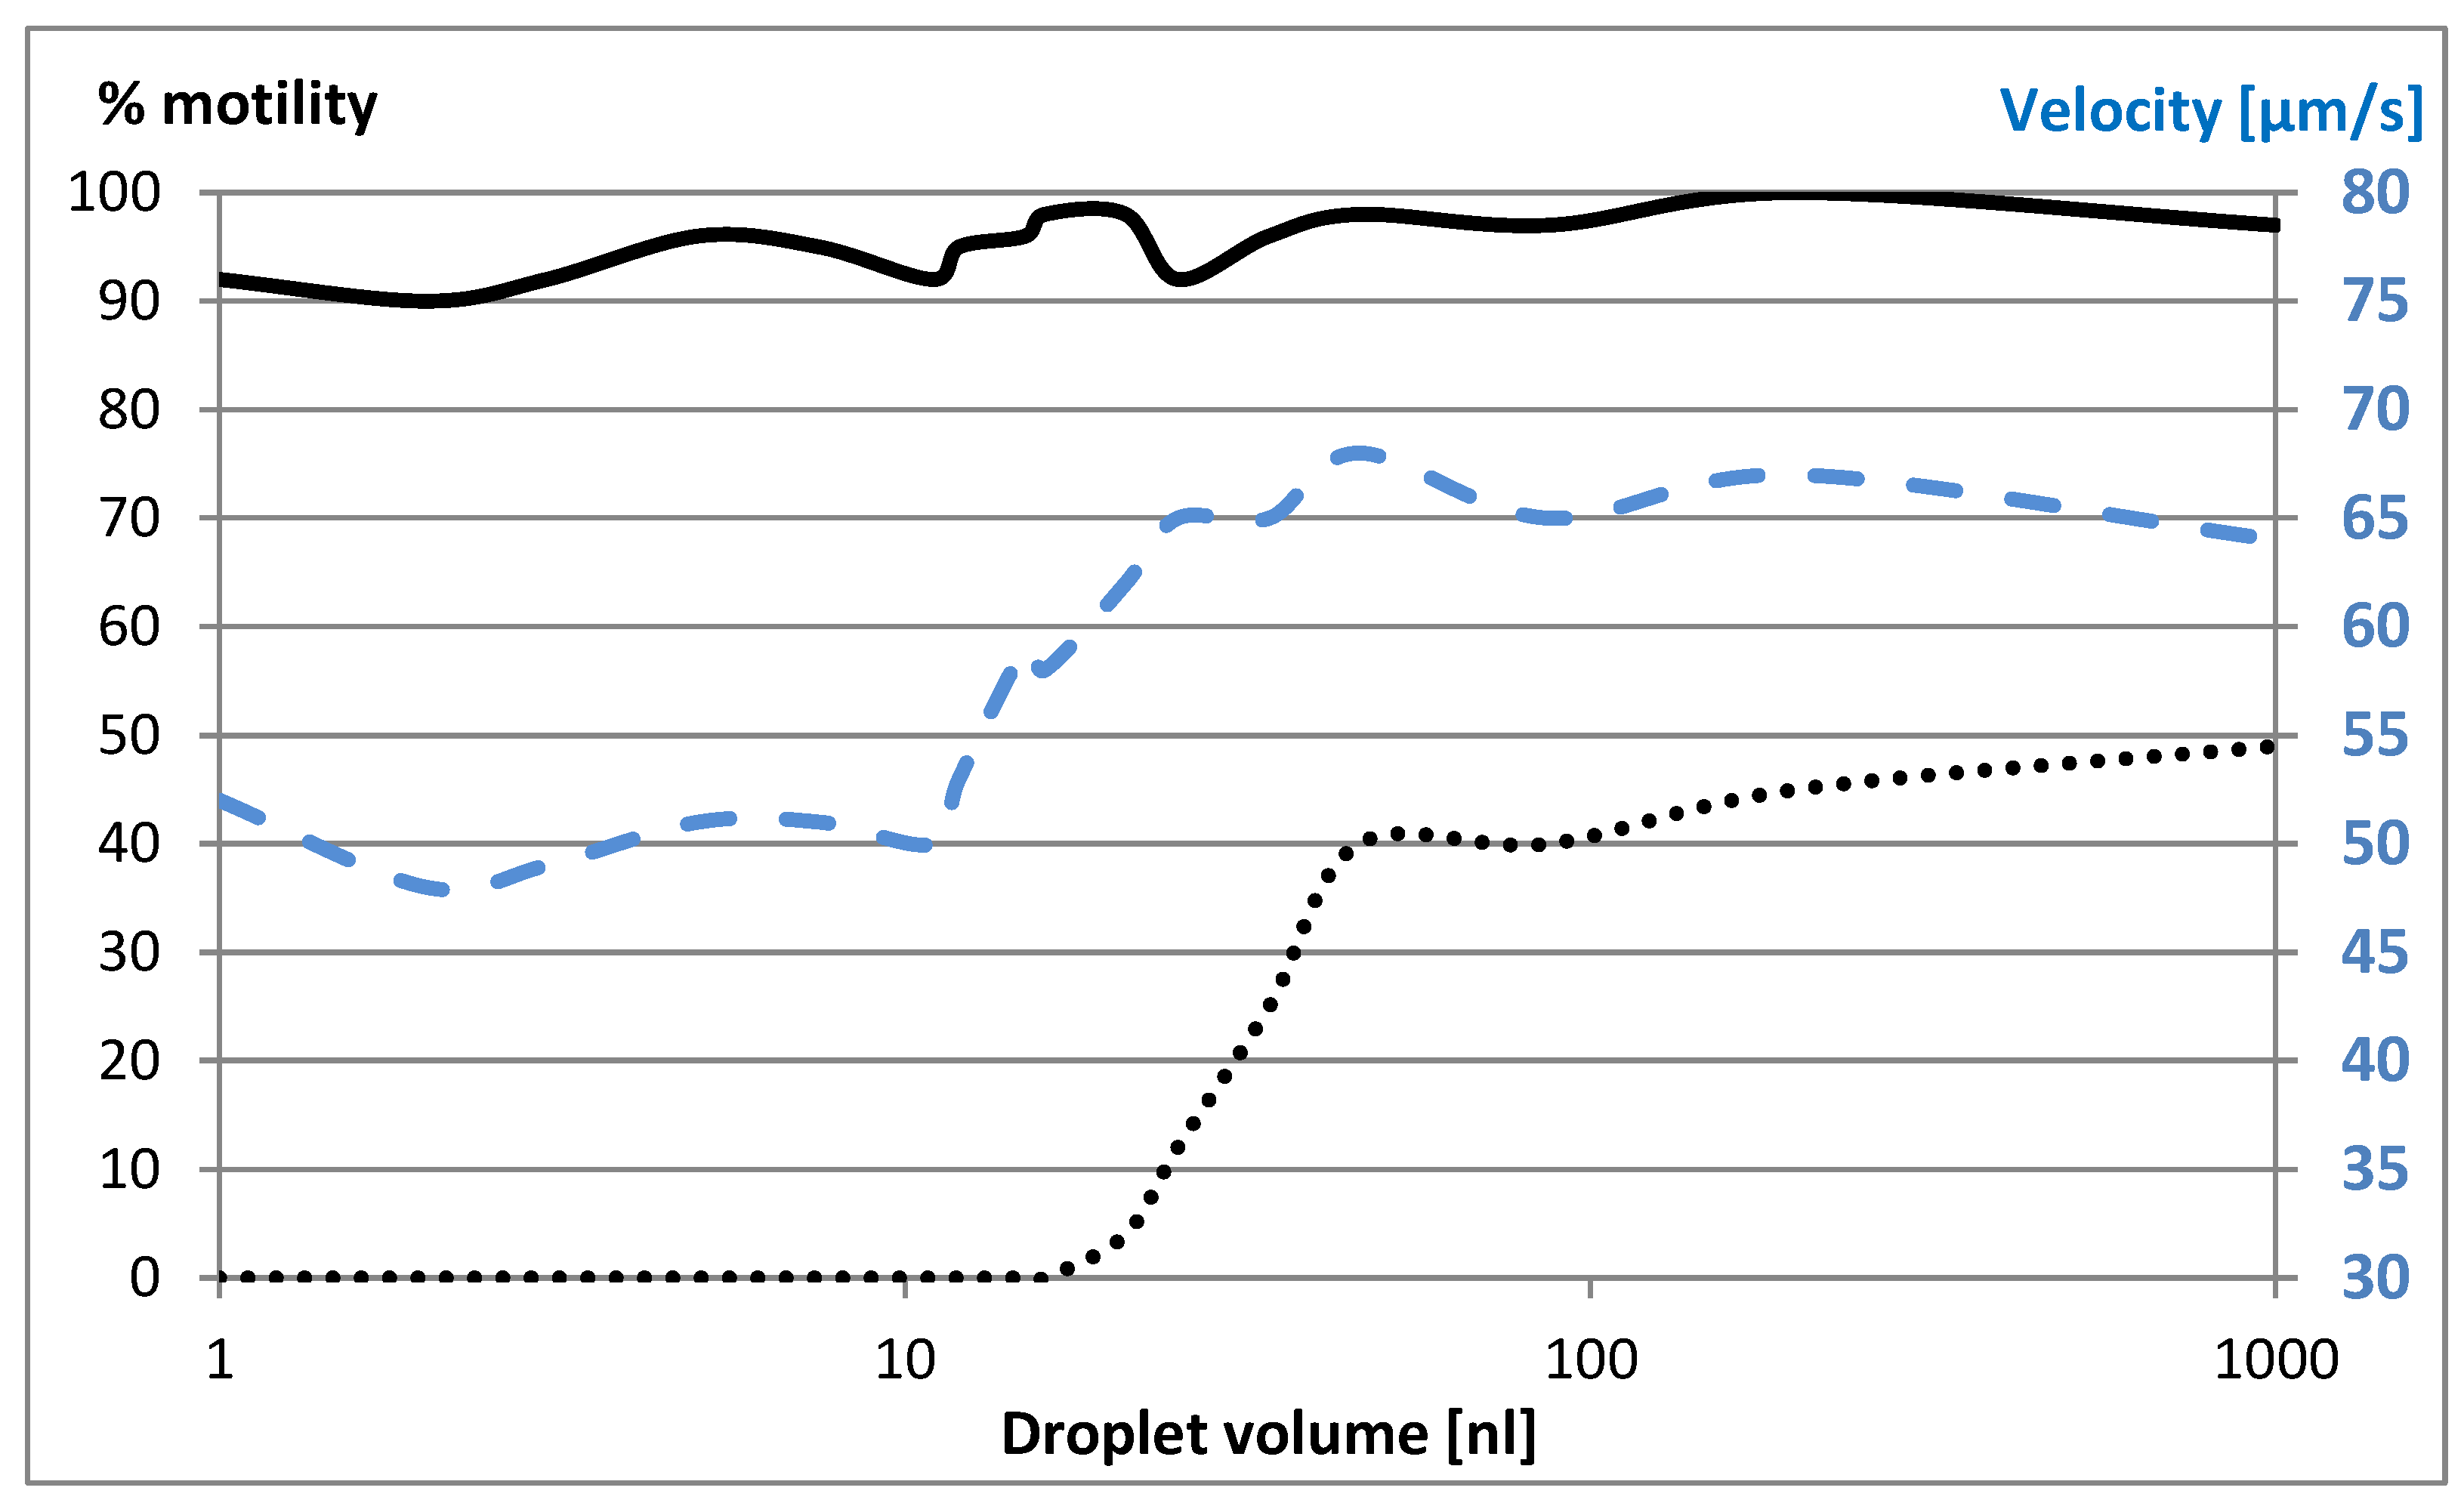
Figure 2.
The rate of solute concentration changes (mol/(nL⋅min)) vs. droplet volume (nL). A sudden leap is clearly observed in small nanoliter volumes (gray arrow) (graph prepared using Symbolab.com/graphing-calculator software).
Figure 2.
The rate of solute concentration changes (mol/(nL⋅min)) vs. droplet volume (nL). A sudden leap is clearly observed in small nanoliter volumes (gray arrow) (graph prepared using Symbolab.com/graphing-calculator software).
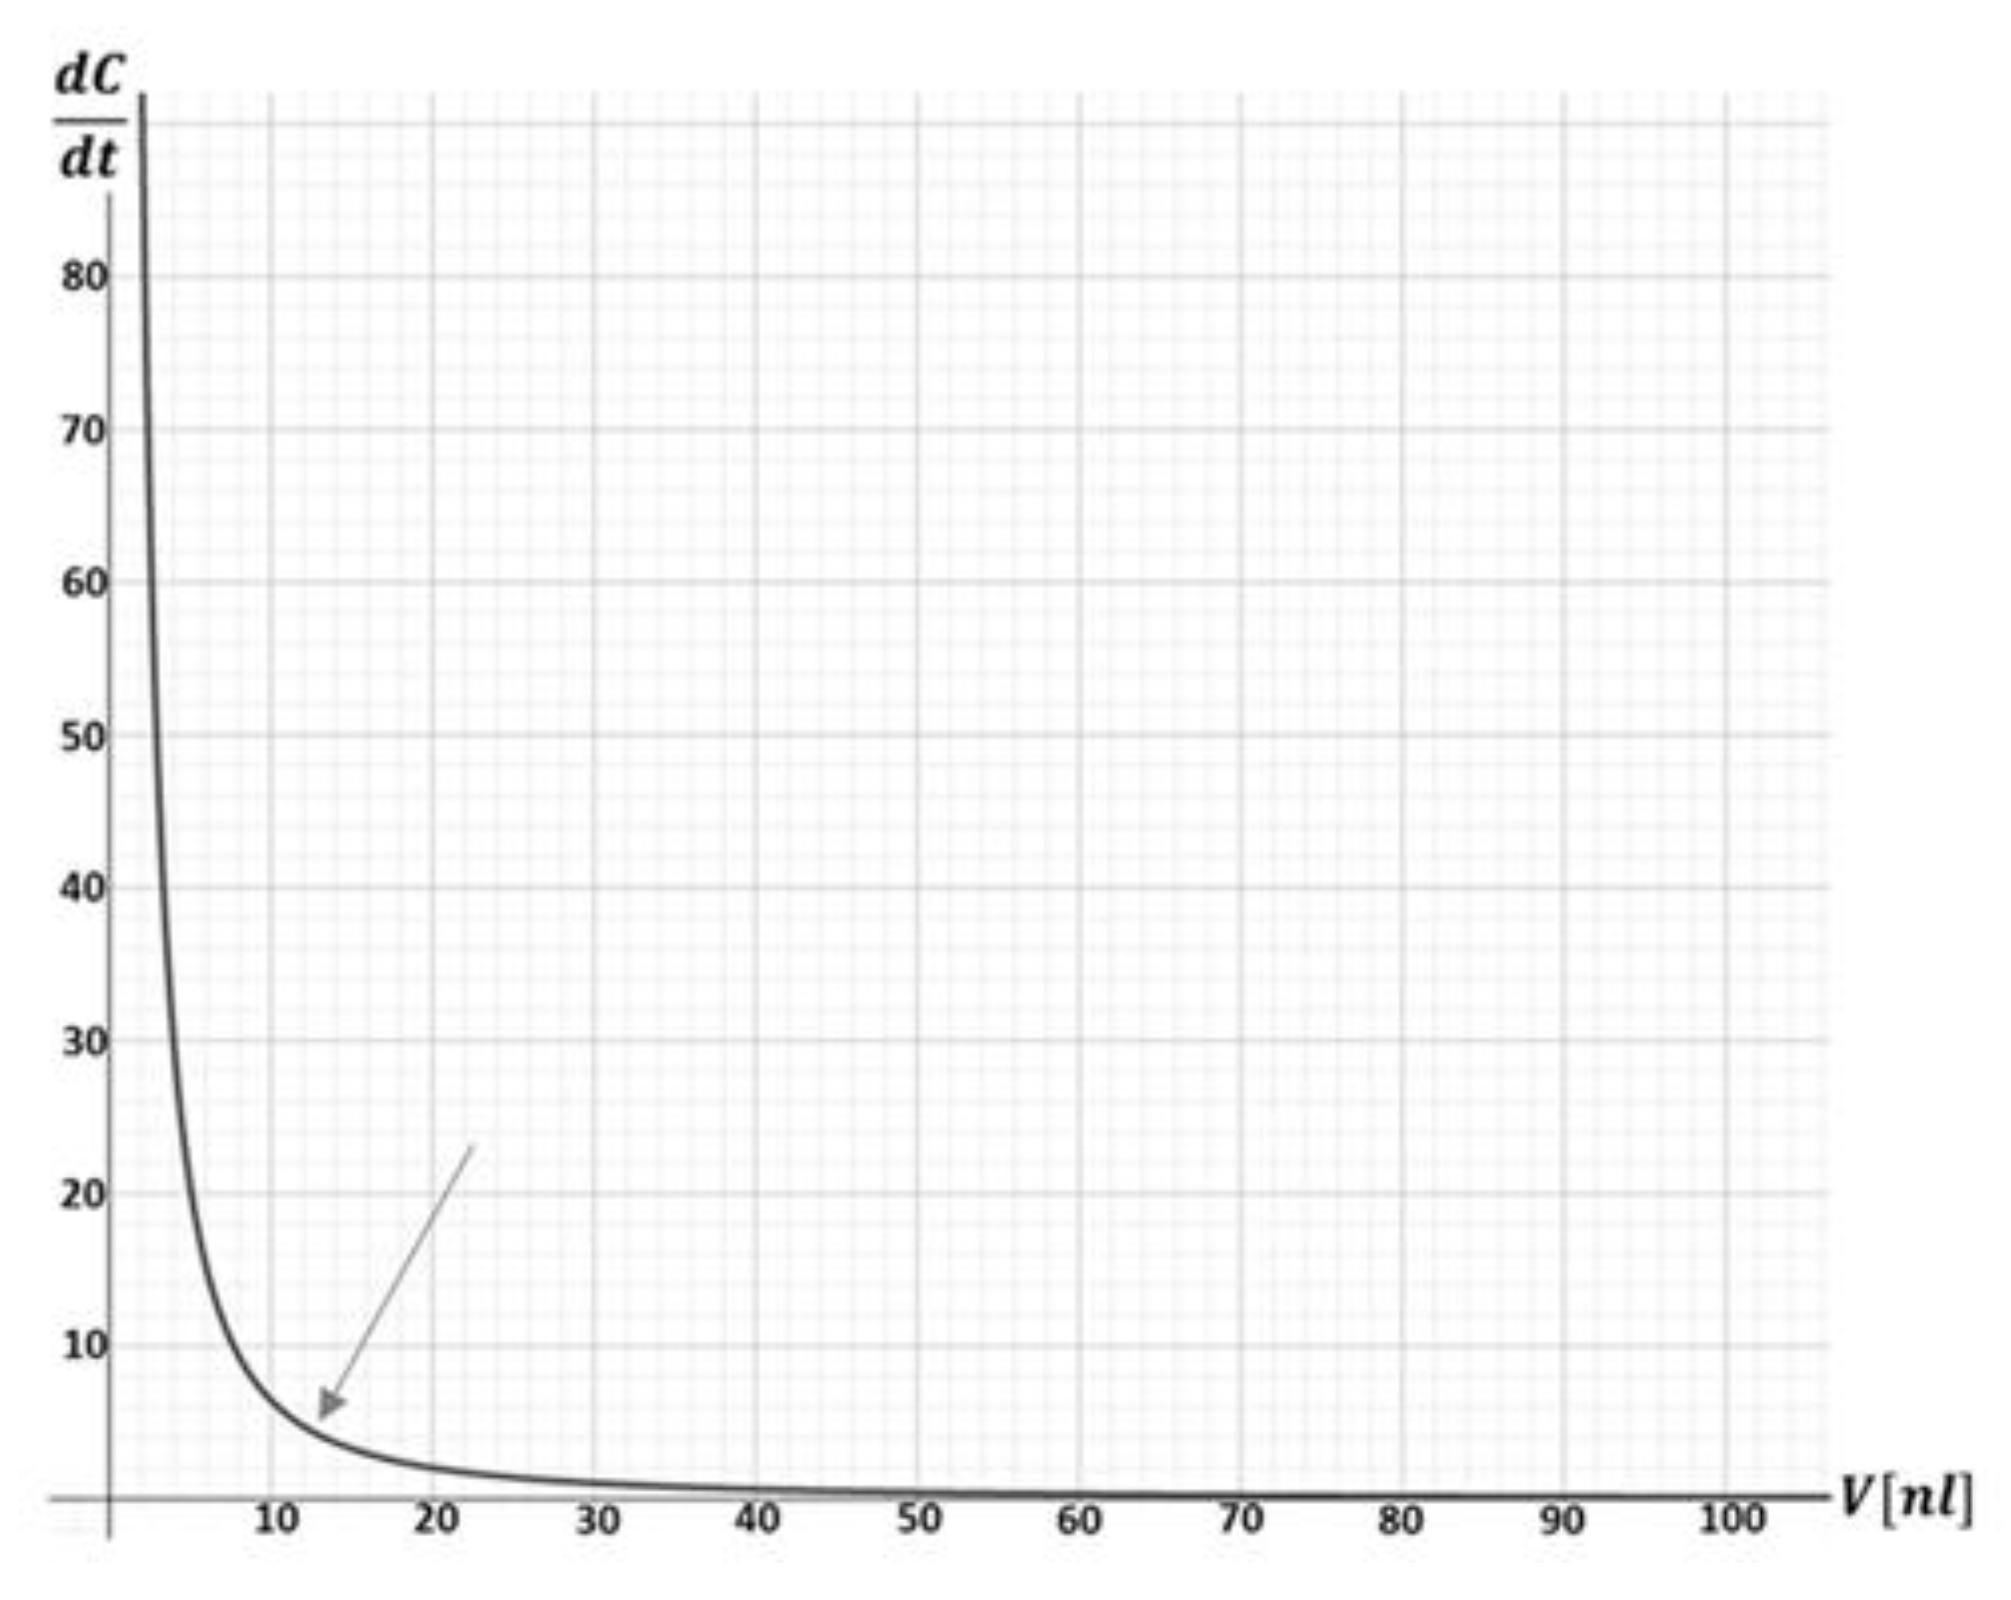
Figure 3.
Calculated viscosity after 30 minutes by two different methods: the increase in fluorescence polarization (blue diamonds) and the decrease in volume measured by bright field (red squares)..
Figure 3.
Calculated viscosity after 30 minutes by two different methods: the increase in fluorescence polarization (blue diamonds) and the decrease in volume measured by bright field (red squares)..
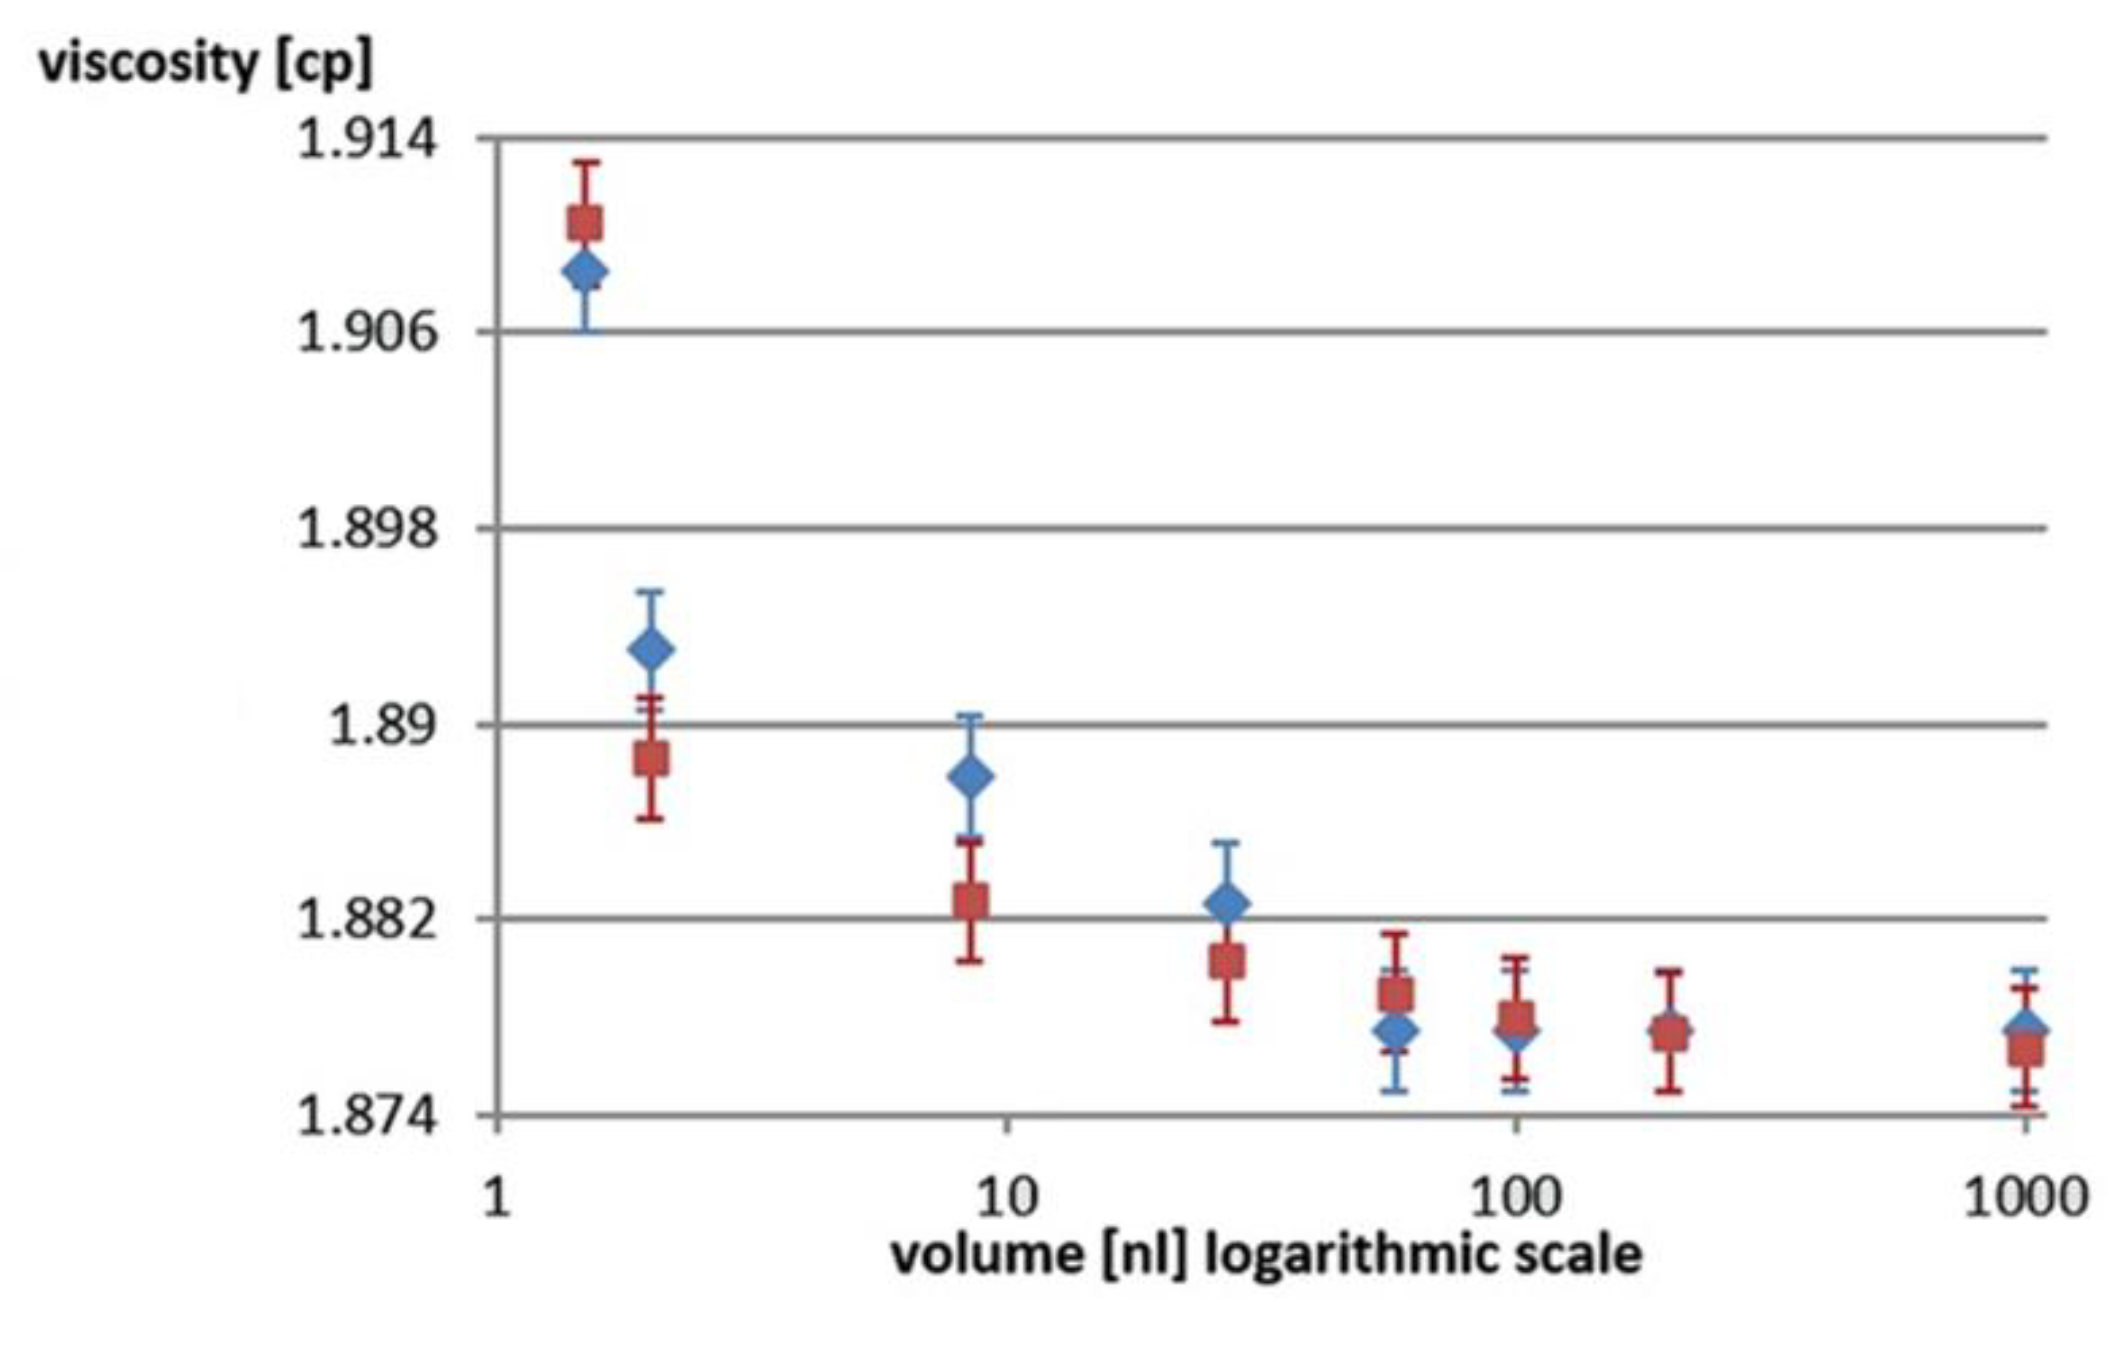
Figure 4.
Estimated (dashed line) and measured (continuous line) velocities (µm/s) of sperm cells in droplets after 30 minutes (at room temperature) versus initial droplet volume. Velocities were normalized by the initial velocities
Figure 4.
Estimated (dashed line) and measured (continuous line) velocities (µm/s) of sperm cells in droplets after 30 minutes (at room temperature) versus initial droplet volume. Velocities were normalized by the initial velocities
Disclaimer/Publisher’s Note: The statements, opinions and data contained in all publications are solely those of the individual author(s) and contributor(s) and not of MDPI and/or the editor(s). MDPI and/or the editor(s) disclaim responsibility for any injury to people or property resulting from any ideas, methods, instructions or products referred to in the content. |
© 2025 by the authors. Licensee MDPI, Basel, Switzerland. This article is an open access article distributed under the terms and conditions of the Creative Commons Attribution (CC BY) license (http://creativecommons.org/licenses/by/4.0/).
Copyright: This open access article is published under a Creative Commons CC BY 4.0 license, which permit the free download, distribution, and reuse, provided that the author and preprint are cited in any reuse.


