
Submitted:
30 May 2025
Posted:
04 June 2025
You are already at the latest version
Abstract
Veterinarians are not just animal health professionals; they are also considered animal welfare experts. Animal-directed empathy, the ability to understand and match an animal’s emotional state, is essential for recognizing animal welfare issues. It is there-fore a vital competency for veterinarians. Factors that play a role in shaping this em-pathy are animal, personal, and cultural influences, as well as the categorization of animals based on their benefit or harm to people: Pet, Pest or Profit (used for economic purposes). We conducted a survey among veterinary students in the Netherlands to assess their levels of animal-directed empathy by scoring their attitude towards ani-mals with the “Pet, Pest, Profit Scale”. Analysis of 321 completed surveys revealed that students showed the highest empathy for pets, followed by pests and profit animals respectively. Empathy levels also differed depending on career choice, background, and diet. These findings indicate that categorizing animals influences veterinary stu-dents' empathy levels, which can lead to unrecognized welfare issues, especially for Pest and Profit animals. It is important to enhance empathy for these categories through targeted educational interventions, to help prepare veterinary students for their responsibility as veterinarians, ensuring the welfare of all animals, Pet, Pest and Profit.
Keywords:
animal welfare
; attitude toward animals
; veterinary students
; empathy
; animal categories
; Pet Pest Profit
1. Introduction
Animal welfare is becoming increasingly important to society, but even though most people would agree that humans need to care for animals and treat them respectfully, human concern is not equal for all animals [1,2,3,4]. The concept of animal welfare is much debated and constantly evolving[5,6].
We define animal welfare as the physical and mental well-being of sentient animals in relation to the conditions they experience throughout their life and at the time of their demise. An animal is deemed to have good welfare when it is in good health, comfortable, well-fed, secure, free from unpleasant conditions like pain, fear, and distress, and able to exhibit behaviors crucial for a predominantly positive physical and mental state and react to changing circumstances. The maintenance of good animal welfare for animals kept by humans involves measures such as disease prevention, appropriate veterinary care, suitable shelter, effective management and nutrition, a stimulating and secure environment, and humane treatment and euthanasia. In animal welfare research, the focus has shifted from being free from negative experiences to having positive experiences or thriving, which includes expressing agency, having a sense of control, and being able to adapt to circumstances. All this makes ‘a life worth living’ [7].
As animal health professionals, veterinarians are regarded by society as animal welfare experts and animal advocates [8]. They bear responsibility for the health and welfare of their patients. In the Netherlands, this responsibility is based on national legislation, the national and European Veterinary Code of Conduct, the veterinary oath, and the attainment targets of the Faculty of Veterinary Medicine of Utrecht University, the only veterinary faculty in the country [9,10,11,12]. For veterinarians to recognize welfare issues and to be motivated to prevent or resolve them, it is important that they have a deep understanding of what these welfare issues consist off and which emotions of the animal are involved under which circumstances. More specifically, the veterinarian needs the capacity for animal-directed empathy, the ability to experience another being’s point of view based on understanding (cognitively) or matching (affectively) their emotional state [13]. This makes animal-directed empathy [14] a vital core competency for veterinarians and veterinary students.
Empathy is a complex construct to measure, but the attitude of humans toward animals can be scored. Previous research has shown that empathy and attitude toward animals are significantly linked [15,16,17]. In addition, it has been identified that several factors can influence or correlate with humans’ attitudes toward animals. Those factors can be animal-related, such as cuteness, likeness and sentience [18,19], personal, such as gender, diet, and experience with animals [20,21], or cultural, such as acceptance of animal use in traditional events like bullfighting [22]. A human’s attitude toward animals can also be affected by the category of animal one assigns the animal to [2,23].
Signal and Taylor suggest three main animal categories, based on their use and their benefit or harm to us: Pet, Pest, and Profit animals. Pets are animals that are considered part of the family, Pest are animals that harm us or damage human property, and Profit animals are those used for monetary gains, such as production and research animals [23]. If you have a pet mouse, you will most likely place them in the Pet category, if you have been plagued by mice you will consider them a Pest category animal, and if you work as a researcher in a lab, you will probably see them as lab animals, which places them in the Profit category. One species can thus be attributed to different categories, each with different sets of norms regarding their welfare status as a result.
In this way, categorization of animals influences what we as humans consider acceptable or not when dealing with them. It enables us to justify our attitude toward animals and even legalizes differences in the way they are treated. For example: the ‘in vivo ocular tolerance test’ (Draize test, applying chemicals to rabbits’ eyes to assess the effect and damage) [24] is a legal procedure that can be performed in laboratory rabbits under specific circumstances but would be considered illegal and abuse when done to a pet rabbit.
In turn, this categorization of animals is also shaped by various factors: not only by features of the animal, but also by a combination of the person’s cultural background and experiences. In many countries, consumption of dogs and cats is not acceptable, but eating cattle, pigs, and poultry is. The reason is that in those countries dogs and cats are by culture categorized as Pets, whereas cattle, pigs and poultry are categorized as food, i.e. Profit animals.
When categorization influences veterinarians’ and veterinary students’ attitudes toward animals, this may significantly affect their animal-directed empathy and as a result the welfare of the animal involved. When veterinarians have lower levels of empathy toward certain animal categories, the welfare of the animals in these categories could be compromised. This could result in situations where welfare issues may not be readily recognized, prevented, or resolved, or the motivation to do so might be lacking. The potential influence of animal categorization is not limited to welfare issues, it also can influence a vet’s decision about treatment or euthanasia [13,25,26,27].
This paper explores the relationship between the three mentioned animal categories and empathy. For this aim, the Animal Attitude Scale (AAS) has been used to measure the level of animal-directed empathy [28]. Application of this scale results in a single total score for animal-directed empathy and can be used to identify differences in empathy level between people or over time when repeated with the same subject. However, this single score does not take into consideration different animal categories [23]. Therefore, a high score does not provide information about the different levels of empathy a person has for different categories. To resolve this, Signal and Taylor developed the Pet, Pest, Profit (PPP) Scale based on the AAS. This PPP Scale consists of three subscales that can be used to measure the attitudes toward animals in the Pet, Pest, and Profit categories. Each subscale contains ten statements, resulting in a Pet, a Pest, and a Profit Score [23]. Using this method, differences in attitudes of subjects toward animal categories in a certain human population can be identified.
This paper presents the results of a study that explored the potential differences in attitude toward animals in different categories, as a measure of animal-directed empathy. We did this by analyzing the Pet, Pest, and Profit scores in veterinary students at Utrecht University. Based on the assumption that most students choose to study veterinary medicine because of their love for animals and their desire to help them, we wanted to find out whether students’ attitudes towards animals differ depending on categorization of animals. We also explored whether the student-related variables year of study, career choice, background, diet, and gender were associated with the Pet, Pest, and Profit scores in the veterinary students.
The relationship between animal category and attitude toward animals has been previously studied in different populations, including veterinary practitioners and students [29,30,31,32,33]. One study investigating the effect of an animal welfare course on attitude scores in students also included a small sample of veterinary students, but the main focus of that study was not the difference between categories but the effect of the welfare course on the scores [34]. These previous studies suggest that animal categories can influence the attitude towards animals and thus the level of animal-directed empathy in veterinary students and maybe also in the general population. In students, there was also an association with student-related factors, such as career choice, gender and diet [21,32,33,35].
Based on the outcomes of this previous research, we hypothesized that the total Pet empathy score will be higher than the total Pest and Profit empathy scores. Regarding the student-related variables, we hypothesized that students in the early part of their study, students with an ethical diet (vegetarian or plant-based), and female students would have higher Pet, Pest, and Profit scores, whereas students choosing a career in production animals and students coming from a rural background would have lower Pet, Pest, and Profit scores.
If these hypotheses are confirmed and animal-directed empathy depends on the position of an animal in one of the categories, this bias would be ethically problematic because all sentient animals have equal moral standing to which we can have duties [36,37]. This study will focus on vertebrate species because they play a central role in the veterinary practice and because there is overwhelming evidence that vertebrates are of sentient beings [38,39].
2. Materials and Methods
2.1. Study Design
We used the Pet, Pest, and Profit scales in an online survey on Qualtrics consisting of three parts (Appendix) to measure the PPP scores. The first part dealt with information and consent. The second part included eight questions on student demographics: gender, age, nationality, background, pet ownership, diet, study year, and career choice. The third part consisted of the ‘Pet, Pest, Profit Scale’ [23].
The Pet, Pest and Profit Likert subscales each contained ten Likert items (PPP statements) with scores: 1 = strongly disagree, 2 = disagree, 3 = neither agree nor disagree, 4 = agree, and 5 = strongly agree. Where applicable, the questions were reverse scored. This resulted in attitude scores for all three categories: the Pet score, the Pest score, and the Profit score, ranging between ten and fifty each. A higher score indicates a more positive attitude toward animals representing a higher level of animal-directed empathy. All scores were converted to the percentage of the maximum possible and analyzed as continuous data [40].
In order to use the Pet, Pest, Profit Scale in the Netherlands context, we made the following adjustments: The PPP statements were translated to the Dutch language, back translation was performed by a native English speaker. Instead of the Pest example ‘cane toad’ used in the original survey, we used ‘muskrat’, as cane toads are considered a pest in Australia but not in The Netherlands, where muskrats are considered a pest. Five veterinarians tested the survey for wording and flow. The data we wanted to collect was deemed anonymous by the GDPR officer of Utrecht University. The NVMO (Dutch Association for Medical Education) granted ethical approval for the study (ERB dossier 2022.1.8, 01/02/2022).
2.2 Participants and Settings
In agreement with the Directors of Education (Bachelor and Master) of the Utrecht Faculty of Veterinary Medicine, the students were invited via the faculty’s Student Desk by email to participate in the research. The email contained an anonymous link to the survey and the NVMO-approved information letter to inform the students that participation was voluntary and anonymous, participation (or non-participation) would not affect study results, and their responses would only be used for scientific research.
The survey was sent out to 1,390 students. The students received reminder emails 11 days and 32 days later and the survey was taken offline after 50 days. The second reminder went to 1,377 students, as 13 students had terminated their study in the meantime. The survey was also promoted on social media (LinkedIn and Facebook) targeted at veterinary students and referring to the email they had received, without sharing the survey link itself on the internet.
To avoid potential response bias, the aim of the study was described as 'gaining an understanding of the human-animal relationship in veterinary students’ rather than assessing attitudes toward different animal categories [17]
2.3. Data Analysis
Based on the population size of 1,390, an ideal sample size of 301 respondents was determined with a 95% confidence level and a 5% margin of error [41]. The raw data were exported from Qualtrics, checked, and cleaned (incomplete responses, duplicates, missing data etc.). Incomplete surveys were excluded from analysis. We analyzed the data in SPSS (version 28.0, IBM Corp., Armonk, NY, USA) with a significance level determined at p<.05.
Three measured variables were not analyzed. The question about student age was disqualified because it contained an unclear answer option. Secondly and thirdly, there was lack of contrast for the variables nationality and pet ownership. This was to be expected as most students attending the Dutch-language veterinary program at Utrecht University are Dutch, and due to the nature of the study there are not many students who have never had a pet.
2.4. Outcomes of Interest
1) We measured internal consistency of the Pet, Pest, and Profit scales for the current research population with Cronbach’s alpha.
2) We tested the differences between Pet, Pest, and Profit scores with the Friedman test, a nonparametric alternative to the analysis of variance based on ranks, followed by a pairwise post hoc test with Bonferroni correction.
3) We tested whether Pet, Pest, and Profit scores differed depending on student-related variables (year of study, career choice, background, diet, and gender) with a one-way analysis of variance or, in case of violated equal variance, a Kruskal-Wallis test, followed by an appropriate pairwise post hoc test with Bonferroni correction.
3. Results
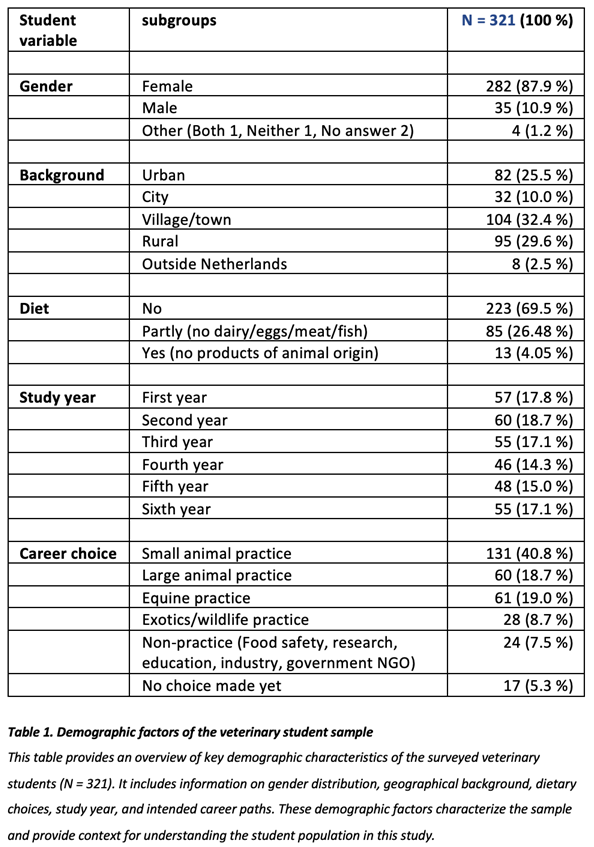
A total of 360 students responded to the survey. After removing incomplete surveys, possible bots, and duplicates, 321 responses were left to be included in the analysis. Respondents (Table 1) were evenly spread over the 6 study years. Year 1-3 is the Bachelor phase and year 4-6 is the Master phase. Respondents were mainly female (nearly 88%), which is in line with the high percentage of female veterinary students at the faculty. The students' background was mainly village/town, followed by rural and urban. The largest career choice group was the group of veterinarian students specializing in small animals (41%), followed by ‘large animal veterinarian’ students and ‘equine animal veterinarian’ students (both 19%). Most respondents did not follow a vegetarian or plant-based diet (70%), 26% partly followed a diet without meat, fish, dairy or eggs or a combination thereof, and 4% consumed plant-based products only. Most students were Dutch (99.4%), and almost everyone had had a pet (98.1%) at some point in their lives. The latter two results are not surprising given the nature of the study that is offered in the Dutch language and attracts students with a relationship with animals.
3.1. Reliability of Pet, Pest, Profit subscales
The Pet, Pest, Profit subscales consisted of 10 Likert items each. Testing subscale reliability for this population with Cronbach alpha resulted in the following: Pet (α = .771), Pest (α = .857), and Profit (α = .846), these α values are considered acceptable [42].
3.2. Attitude toward Animals Scores for Pet, Pest, Profit categories
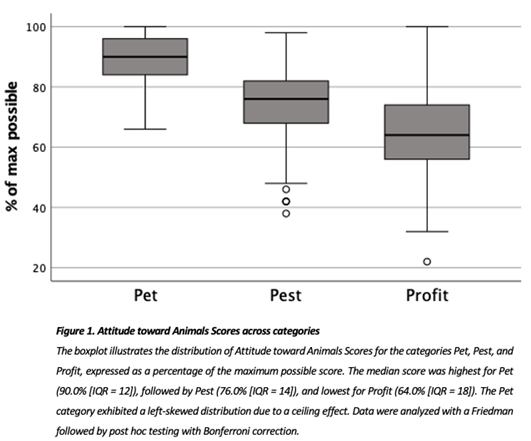
The median score, in percentage of maximum possible, was highest for category Pet (90.0% [IQR=12]), followed by Pest (76.0% [IQR=14]), with the lowest score for Profit (64.0% [IQR=18]) (Fig. 1).
The Pet score distribution was skewed left due to a ceiling effect also reported in other studies, so we compared the Pet, Pest, and Profit scores with the Friedman test [34,43,44]. The p-value of <.001 (x2= 489.571) indicated that there was a significant difference between at least two groups. Post hoc testing with Bonferroni correction for multiple comparisons between groups revealed statistically significant differences between Pet-Pest, Pet-Profit and Pest-Profit scores (p<.001). This indicates that the Attitude toward Animals Score differed across animal categories in this sample of veterinary students. Their Attitude towards Animals Score is higher for animals they consider Pets, followed respectively by animals they categorize as Pest or Profit.
3.3. Study Year
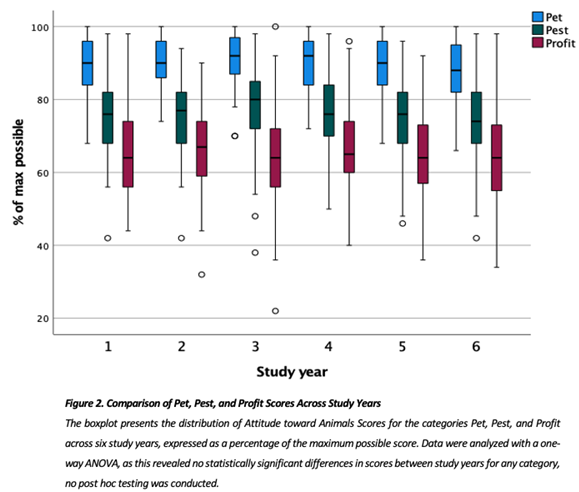
The groups for this factor were first to sixth year. A one-way ANOVA did not result in statistically significant different Pet, Pest, and Profit scores between the study year groups, therefore no further post hoc testing was performed. (Fig. 2)
Test results: Pet (F(5, 315) = [1.129], p = .300), Pest (F(5, 315) = [1.352], p = .242) and Profit (F(5, 315), =.621, p=.684).
3.4. Career Choice
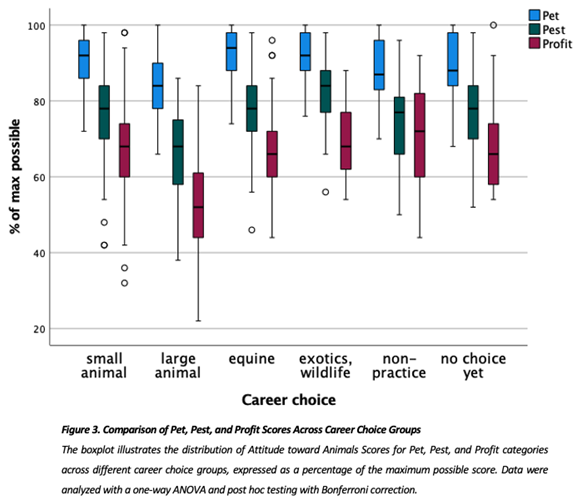
The groups for this factor were: small animal practice, large animal practice, equine practice, exotics/wildlife practice, non-practice (Netherlands Food & Consumer Product Safety Authority / Research / Education / Business / Government / NGO), no choice made yet. The one-way ANOVA used to test the effect of career choice on Pet, Pest, and Profit scores resulted in a significant difference between at least two career groups (p <.001). Post hoc testing with Bonferroni correction revealed that the large animal practice group scores differed significantly from the other career choice groups (Fig. 3). The students in this group had significantly lower Pet and Pest scores compared to the small animal, equine and exotics/wildlife groups. The lower Profit score of these students was significant compared to all the other career choice groups.
The effect size (partial eta-squared) is a quantification of the variance in the Pet, Pest, and Profit scores that can be explained by the career choice. The effect size was medium for Pet (.140) and Pest (.160) and high for Profit (.213). The high eta squared for Profit score indicates a strong relation between career choice groups and Profit score. This means that students choosing a career in large animal practice have significantly lower Attitude toward Animals scores, this is most pronounced for animals categorized as Profit animals.
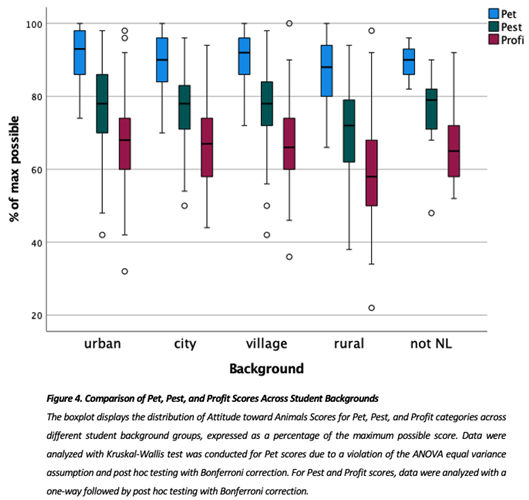
3.5. Background of the Students
The groups for this factor were: urban (NL Randstad), city (NL outside Randstad), village/town, rural, not in The Netherlands. As the ANOVA equal variance assumption for the Pet score was violated, we performed a Kruskal-Wallis test to compare the student background groups, which resulted in a statistically significant difference in Pet score between at least two background groups (p<.001). Post hoc testing with Bonferroni correction showed that the students in the rural group had a statistically significant lower Pet score than students in the urban (p<.001) and village/town group (p<.010). (Fig. 4).
We tested the effect of student background on Pest and Profit scores with a one-way ANOVA, which revealed a statistically significant difference in the Pest and Profit scores between at least two background groups. Post hoc testing with Bonferroni correction showed that the lower Pest and Profit scores of the students in the rural group were statistically significant compared to students in both the urban and the village/town group (p <.001) with a medium effect size (eta-squared) for Pet (.078), Pest (.068) and Profit (.074). (Fig. 4). This means that students in this sample with a rural background have significantly lower Pet, Pest and Profit scores than students with a village/town or urban background.
Kruskal-Wallis results: H(4)= 23.900, p<.001Test results: Pest (F(5, 315) = [11.957], p <.001) and Profit (F(5, 315) = 17.012, p <.001)
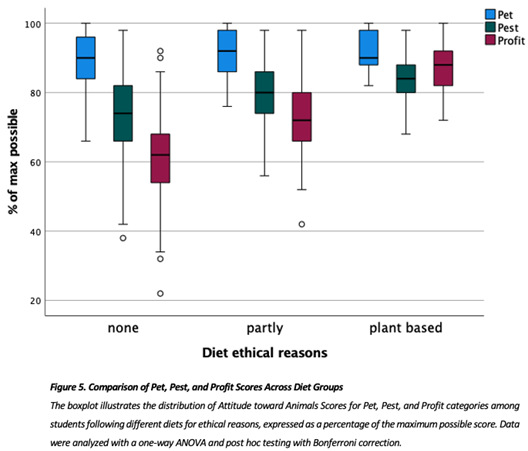
3.6. Diet for Ethical Reasons
The groups for this factor were: no-diet (student does not follow a diet for ethical reasons), partly (diet without dairy, eggs/meat, fish), plant-based diet. We performed a one-way ANOVA to test the effect of the diet groups on the Pet, Pest, and Profit scores. This revealed a statistically significant difference in Pet, Pest, and Profit scores between at least two diet groups. Post hoc testing with Bonferroni correction showed that the plant-based diet and ‘partly diet’ groups had statistically significant higher Pest and Profit scores than the no-diet group. Furthermore, the partly diet group also had a significantly higher Pet score than the no-diet group. (Fig. 5). The effect size (partial eta squared) was low for Pet (.022), medium for Pest (.073), and very high for Profit (.282). The students that follow a diet for ethical reasons had significantly higher Pest and Profit scores than students that did not. This was especially the case for the Profit score.
Test results: Pet (F(2, 318) = [3.625], p=.028), Pest (F(2, 318) = [12.451], p <.001) and Profit (F(2, 318) = 62.333, p <.001).
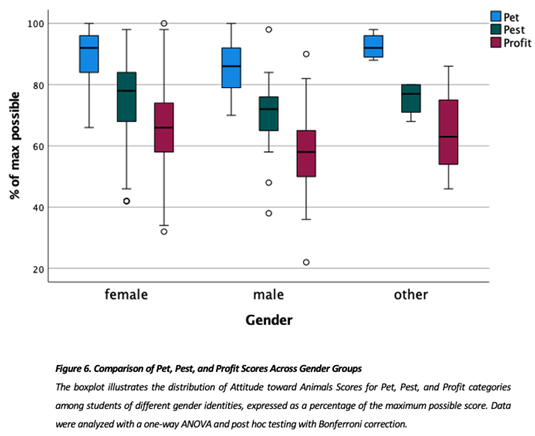
3.7. Gender
The groups for this factor were: female, male, other (neither, both, no answer). The one-way ANOVA performed to test the effect of gender on Pet, Pest, and Profit scores revealed that there was a statistically significant difference in Pet, Pest, and Profit scores between at least two gender groups. Post hoc testing with Bonferroni correction showed that the female group had significantly higher Pet, Pest, and Profit scores than the male group (Fig. 6). However, the effect size was small for all categories; Pet 11 (.033), Pest (.022), and Profit (.026).
Test results: Pet (F(2, 318) = [5.404], p=0.005), Pest (F(2, 318) = [3.600], p=0.028) and Profit (F(2, 318) = 4.299, p=0.014) scores.
The median score for the female subgroup (n=282) was highest for category Pet (92.0% [IQR=12]), followed by Pest (78.0% [IQR=16]), with the lowest score for Profit (66.0% [IQR=16]).
Eta squared quantifies the variance of the dependent variable, in this case the Pet, Pest and Profit scores, that is explained by the independent variables, in this case the student-related variables and the animal categories. A higher eta squared value means that a larger part of the variance is explained by that specific variable, indicating a stronger relation. The percentage quantified by eta squared is the part of the differences in the Pet score that can be explained by the student-related variables, the remaining percentage is due to other factors that were not studied, or random variation.
The Pet score eta squared of 27.3%, is mainly explained by the variables career (14%) and background (7.8%). The Pest score eta squared of 32.3% is mainly explained by the variables career (16%), diet (7.3%), and background (6.8%). The Profit score had the highest eta squared; 59.5%, this is mainly explained by the variables diet (28.2%), career (21.3%), and background (7.4%).
Therefore, in this sample, diet, career, and background are the student-related variables that partly explain the variation in the Pet, Pest, Profit scores of the students, especially the variation in the Profit score.
4. Discussion
This cross-sectional study, done in May 2022, explored potential significant differences between the Pet, Pest, and Profit scores in the veterinary student population at Utrecht University. We also studied the effect of student related variables, study year, career choice, background, diet, and gender on the Pet, Pest, and Profit scores. We found statistically significant differences between the Pet, Pest, and Profit scores: the Pet score was higher than the Pest and Profit scores. Other than expected, there was no significant effect of study year, but students with an ethical diet and female students did have significantly higher scores. Students choosing a career in production animals and students coming from a rural background scored significantly lower. These findings will be discussed in detail below. This implies that veterinary students’ attitudes toward animals correlate with animal categories and certain student-related variables. This bias in empathy in veterinary students can be problematic since this may result in the unequal treatment of animals in otherwise morally equal situations. Since this can also affect the assessment of and care for the welfare of animals this bias needs to be addressed during the veterinary study program.
4.1. Pet, Pest, and Profit Score
The statistically significant differences found between Pet, Pest, and Profit scores are in line with other studies [43,44], indicating that attitude towards animals in veterinary students correlates with animal category. These results reflect differences in animal-directed empathy. Biases against Pest and Profit animals may lead to unrecognized welfare issues or diminished advocacy for these groups [13,25,26,27]. Profit animals are already subject to less stringent legal protection and may receive suboptimal care due to lower empathy levels [13]. Harmful procedures that are deemed unacceptable in the Pet category are normalized for Pest and Profit animals. Therefore, classifying animals as Pest or Profit can be used to justify the way we treat them and allows for diminished concern for the welfare of these animals. Addressing these biases in veterinary medicine curricula is vital to equip students with the skills and motivation to uphold welfare standards across all animal categories.
4.2. Student-Related Variables
The finding that study year has no significant influence on the Pet, Pets, and Profit scores in this cohort was unexpected as other studies did find an effect. We expected a decline in empathy during the course of the study as found in other published studies [32,45]. A decline was found in Italian veterinary students' Animal Attitude Score (AAS) over time [32], and Paul & Podberscek found that empathy toward animals decreased over time among male students [45]. The Attitudes toward Animal Welfare in a study done on veterinary students in Malaysia fluctuated and indicated an improvement over time [46]. The authors do not have an explanation for this fluctuation, but they also found that the majority of the students had an anti-animal welfare attitude regardless of the year of study. This low baseline could explain the improvement over time. However, all these studies were cross-sectional, so no accurate conclusions can be made on the change in attitude scores over the years. To investigate whether there is a significant trend and if this trend is positive or negative a longitudinal cohort study surveying the students each year throughout their entire study is needed.
Career choice, background, and diet emerged as significant predictors of empathy levels. Finding lower ATA scores in students with a preference for a career with large animals is consistent with results from other studies [21,44,47,48]. The exotic/wildlife group scored highest on the Pest score, which seems logical as pest species are often wildlife species that are forced to compete with humans for resources. This was also found by Hazel et al [44]. The significantly lower score for Profit animals in the large animal practice group is worrisome as Profit animals are already less protected by law, and their welfare is subservient to the benefit of humans.
The lower Pet, Pest and particularly Profit scores of the rural group are in line with studies that found reduced concern for animal welfare and rights in students from a rural background [21,48]. A study focused on Italian veterinary students found a less pro-animal welfare attitude, mainly in fifth-year students from the more urban North of the country. However, they also found a decline in their pro-animal welfare attitude over the years, which could offer an alternative explanation of this lower score in students with an urban background in this particular study year after more than four years of veterinary training [32]. Additionally, in this study more than 60% of the students in the rural group opt for a career in large animal practice, which is also the career choice group that scores lowest on the Profit score; a lower Profit score could thus be a cumulative effect of background and career choice. Veterinary faculties who want to address these biases and enhance empathy for especially Profit animals, could investigate mandatory targeted interventions, such as courses that highlight sentience, communications, emotions, and welfare of farmed animals.
The relation between diet and attitude toward animals is also found in other studies [32,35,43,44,48]. Despite the fact that people generally care about animals, people tend to underestimate animals’ capacity to suffer when they are considered food, and moral concern is diminished [26]. The survey question did not specify animal welfare. The question was: ‘Do you refrain from eating certain products for ethical reasons (not for health reasons or taste preferences)?’ A follow-up question asking if the ethical reason was animal welfare related could have had added value because there are more reasons for a diet that avoids animal products, especially those based on the environment and climate change. However, people’s attitude toward environmental issues has also been identified as correlating with attitude toward animals [49].
In line with other research [21,32,43,44], female students consistently scored higher on animal-directed empathy than males across all categories, albeit with small effect sizes. Additionally, we performed a Friedman test to find out if the Pet, Pest, Profit scores were significantly different within the female subgroup. The result revealed that the differences between Pet-Pest, Pet-Profit and Pest-Profit scores were statistically significant (p<.001). So, even though the female students had higher Pet, Pest, and Profit scores than the male students, the animal category nevertheless had a statistically significant effect on the Pet, Pest, and Profit scores.
This gender difference is widely reported in empathy research. It would be interesting to investigate whether this is due to societal norms, educational experiences, or intrinsic factors. And, though females score higher than males, the ATA score of female participants is predicted by category as well with a significant difference between Pet (highest), Pest, and Profit (lowest) score.
4.3. Implications
The variance in the animal-directed empathy scores between Pet, Pest and Profit categories and the relationship with variables investigated in this study demonstrate that attitude toward animals is a construct that cannot be easily explained due to the multiple factors that play a role. However, the relevance of category, career choice and diet, particularly in Pest and Profit scores are indicated by their significant effect sizes. Attitude toward animals categorized as Profit animals is lowest in general and is linked to student related variables, especially career choice and diet and to a lesser degree background. Therefore, differences in attitude toward animals and animal-directed empathy in veterinarians and veterinary students based on animal categories could have consequences for animals in their care as well as reducing advocacy for Pest and especially for Profit animals.
4.4. Recommendations
Keeping up with the latest research on animal welfare and animal mind, including sentience, cognition, feelings, and emotions of animals, is paramount for (future) veterinarians [25,43,44,50,51,52]. The significant differences in Pet, Pest, and Profit scores and the effect size of the variables on these scores, especially for Profit animals, emphasize the need to address the possibility of bias in empathy toward different categories of animals, in relation to these variables, during veterinary education.[25,43,44,50,51,52]This education could be provided in courses as part of the core curriculum, book club assignments, research projects on these topics, or even extra-mural work experience, e.g., in large animal rescue centers. Measuring the Pet, Pest, and Profit scores before and after the course or module could be done to assess the impact of this education. This could be combined with research into which type of education is most effective, as previous studies report mixed results [43,44,52,53,54].
This study is the first of its kind in a cohort of veterinary students in The Netherlands. It would be worthwhile to follow up with a study exploring the attitude toward animals of educators at the university as their attitudes can also influence student attitudes [55]. Another cohort of interest is graduated veterinarians in The Netherlands; research in this group may provide more insight into how they perceive the veterinarian’s role in animal welfare and which variables influence their attitude toward animals and their animal-directed empathy.
5. Conclusions
This study shows that categorizing animals based on their benefit or harm to humans predicts and may affect the Attitude toward Animals (ATA) score in veterinary students, resulting in significantly different Pet, Pest, and Profit scores. The student-related variables career choice, background, and diet significantly predict these Pet, Pest, and Profit scores, with particularly negative implications for animals in the Profit and Pest categories. It is recommended to further study these and other influences on animal-directed empathy in veterinary students (such as experience with animals of different species and knowledge of animal sentience, minds, intelligence and emotions) to create awareness and help them prepare for their professional responsibility to optimize the welfare of all animal patients they are confronted with, regardless of the category we as humans assign them to.
5.1. Limitations
This study has a number of limitations. First, the statements in the Pet, Pest, Profit subscales are quite different in nature as noted by Van der Weijden [34], with positive but general and subjective statements for the Pet subscale, an actual species named in the Pest subscale and a mix of statements in the Profit subscale. Combining different scales to measure attitude toward animals could have been of added value but this would also have increased the risk of attrition.
Secondly, we used a Likert scale consisting of ten 5-point Likert items. Although easy to analyze, this has some disadvantages. Respondents can only choose from the given options that may not represent their feelings accurately as opposed to for example slider responses. Some respondents may avoid the most extreme options, while others may prefer extremes. The statements can also solicit socially acceptable answers. Likert items are considered ordinal data, but a Likert scale can be treated as continuous data as long as the items are related within the scale [34].
A third limitation is the fact that three measured variables could not be included in the analyses for the following reasons: student age response options were not clear, and there was lack of contrast for the variables nationality and pet ownership. This was to be expected as most students at the Utrecht faculty of veterinary medicine are Dutch, and due to the nature of the study most students had lived with pets at some point in their lives.
The final limitation has an external cause: Shortly after the invitation to the survey was sent to the students, the survey was unavailable for eight days due to a technical issue with the university account. This may have affected the number of respondents and caused some of the responses to be incomplete. Despite this mishap, the minimum sample size was acquired.
Author Contributions
For research articles with several authors, a short paragraph specifying their individual contributions must be provided. The following statements should be used Conceptualization, methodology, validation, formal analysis, investigation, data curation: Angelika V. Dijkstra Klaasse. Software: SPSS (version 28.0, IBM Corp., Armonk, NY, USA). Resources: not applicable. Writing—original draft preparation: Angelika V. Dijkstra Klaasse. Writing—review and editing: Angelika V. Dijkstra Klaasse, Monique R.E. Janssens, Daniela Salvatori. Visualization: Angelika V. Dijkstra Klaasse. Supervision: Daniela Salvatori. Project administration, funding acquisition: not applicable. All authors have read and agreed to the published version of the manuscript.
Funding
This research received no external funding.
Institutional Review Board Statement
The NVMO (Dutch Association for Medical Education) granted ethical approval for the study (ERB dossier 2022.1.8, 01/02/2022).
Informed Consent Statement
Informed consent was obtained from all subjects involved in the study.
Data Availability Statement
Dataset available on request from the first author.
Acknowledgments
Martin A. Bryant, Prof. Dr. Mariska M.G. Leeflang, Prof. Dr. Franck L.B. Meijboom.
Conflicts of Interest
No conflicts of interest were encountered.
Abbreviations
AAS – Animal Attitude Scale
ANOVA – Analysis of Variance
ERB – Ethical Review Board
GDPR – General Data Protection Regulation
IQR – Interquartile Range
KNMvD – Koninklijke Nederlandse Maatschappij voor Diergeneeskunde (Royal Dutch Veterinary Association)
NGO – Non-Governmental Organization
NL – Nederland (The Netherlands)
NVMO – Nederlandse Vereniging voor Medisch Onderwijs (Dutch Association for Medical Education)
PPP – Pet, Pest, Profit (Scale)
SPSS – Statistical Package for the Social Sciences
UU – Utrecht University (Utrecht University)
References
- Bradley, A.; Mennie, N.; Bibby, P.A.; Cassaday, H.J. Some Animals Are More Equal than Others: Validation of a New Scale to Measure How Attitudes to Animals Depend on Species and Human Purpose of Use. PLoS One 2020, 15, e0227948. [Google Scholar] [CrossRef]
- Signal, T.; Taylor, N.; Maclean, A.S. Pampered or Pariah: Does Animal Type Influence the Interaction between Animal Attitude and Empathy? Psychology, Crime & Law 2018, 24, 527–537. [Google Scholar] [CrossRef]
- Higgs, M.J.; Bipin, S.; Cassaday, H.J. Man’s Best Friends: Attitudes towards the Use of Different Kinds of Animal Depend on Belief in Different Species’ Mental Capacities and Purpose of Use. R Soc Open Sci 2020, 7, 191162. [Google Scholar] [CrossRef] [PubMed]
- Macauley, L.P.J. Friends, Food, or “Free Egg Machines”? A Qualitative Study of Chicken Owners’ Perceptions of Chickens and Chicken Meat., University of Adelaide: Adelaide, 2018.
- Arndt, S.S.; Goerlich, V.C.; van der Staay, F.J. A Dynamic Concept of Animal Welfare: The Role of Appetitive and Adverse Internal and External Factors and the Animal’s Ability to Adapt to Them. Frontiers in Animal Science 2022, 3. [Google Scholar] [CrossRef]
- Schukken, Y.H., van T.J.C.M., van A.J.J.M., & H.H. (Eds. ). The State of the Animal in the Netherlands. Den Haag: Raad Voor Dierenaangelegenheden. ; Raad voor Dieraangelegenheden: Den Haag, 2019.
- Mellor, D. Updating Animal Welfare Thinking: Moving beyond the “Five Freedoms” towards “A Life Worth Living. ” Animals 2016, 6, 21. [Google Scholar] [CrossRef]
- Littlewood, K.E.; Beausoleil, N.J. Two Domains to Five: Advancing Veterinary Duty of Care to Fulfil Public Expectations of Animal Welfare Expertise. Animals 2021, 11, 3504. [Google Scholar] [CrossRef] [PubMed]
- Federation of Veterinarians of Europe (FVE) European Veterinary Code of Conduct. Available online: https://fve.org/cms/wp-content/uploads/FVE_Code_of_Conduct_2019_R1_WEB.pdf (accessed on 9 October 2022).
- Koninklijke Nederlandse Maatschappij voor Diergeneeskunde (KNMvD) Code Voor de Dierenarts. Available online: https://www.knmvd.nl/app/uploads/2022/06/Code-voor-de-Dierenarts-2022.pdf (accessed on 9 October 2022).
- Faculty Veterinary Medicine, U.U. Veterinaire Eed (Veterinary Oath). Available online: https://students.uu.nl/sites/default/files/dgk_eed_-_belofte_voor_de_dierenarts_mrt_2019.pdf (accessed on 9 October 2022).
- Faculty Veterinary Medicine, U.U. Eindtermen Masteropleiding Diergeneeskunde 2020; 2018. 2020.
- Norring, M.; Wikman, I.; Hokkanen, A.-H.; Kujala, M. V.; Hänninen, L. Empathic Veterinarians Score Cattle Pain Higher. The Veterinary Journal 2014, 200, 186–190. [Google Scholar] [CrossRef]
- Prguda, E.; Neumann, D.L. Inter-Human and Animal-Directed Empathy: A Test for Evolutionary Biases in Empathetic Responding. Behavioural Processes 2014, 108, 80–86. [Google Scholar] [CrossRef]
- Henry, B.C. Empathy, Home Environment, and Attitudes toward Animals in Relation to Animal Abuse. Anthrozoos 2006, 19, 17–34. [Google Scholar] [CrossRef]
- Taylor, N.; Signal, T.D. Empathy and Attitudes to Animals. Anthrozoos 2005, 18, 18–27. [Google Scholar] [CrossRef]
- Cuff, B.M.P.; Brown, S.J.; Taylor, L.; Howat, D.J. Empathy: A Review of the Concept. Emotion Review 2016, 8, 144–153. [Google Scholar] [CrossRef]
- Marriott, S.; Cassaday, H.J. Attitudes to Animal Use of Named Species for Different Purposes: Effects of Speciesism, Individualising Morality, Likeability and Demographic Factors. Humanit Soc Sci Commun 2022, 9, 138. [Google Scholar] [CrossRef]
- Batt, S. Human Attitudes towards Animals in Relation to Species Similarity to Humans: A Multivariate Approach. Bioscience Horizons 2009, 2, 180–190. [Google Scholar] [CrossRef]
- Randler, C.; Adan, A.; Antofie, M.-M.; Arrona-Palacios, A.; Candido, M.; Boeve-de Pauw, J.; Chandrakar, P.; Demirhan, E.; Detsis, V.; Di Milia, L.; et al. Animal Welfare Attitudes: Effects of Gender and Diet in University Samples from 22 Countries. Animals 2021, 11, 1893. [Google Scholar] [CrossRef]
- Serpell, J.A. Factors Influencing Veterinary Students’ Career Choices and Attitudes to Animals. J Vet Med Educ 2005, 32, 491–496. [Google Scholar] [CrossRef]
- Knight, S.; Vrij, A.; Bard, K.; Brandon, D. Science versus Human Welfare? Understanding Attitudes toward Animal Use. Journal of Social Issues 2009, 65, 463–483. [Google Scholar] [CrossRef]
- Taylor, N.; Signal, T.D. Pet, Pest, Profit: Isolating Differences in Attitudes towards the Treatment of Animals. Anthrozoos 2009, 22. [Google Scholar] [CrossRef]
- Wilhelmus, K.R. The Draize Eye Test. Surv Ophthalmol 2001, 45, 493–515. [Google Scholar] [CrossRef]
- Hernandez, E.; Fawcett, A.; Brouwer, E.; Rau, J.; Turner, P. Speaking Up: Veterinary Ethical Responsibilities and Animal Welfare Issues in Everyday Practice. Animals 2018, 8, 15. [Google Scholar] [CrossRef]
- Bratanova, B.; Loughnan, S.; Bastian, B. The Effect of Categorization as Food on the Perceived Moral Standing of Animals. Appetite 2011, 57, 193–196. [Google Scholar] [CrossRef]
- Bubeck, M.J. Justifying Euthanasia: A Qualitative Study of Veterinarians’ Ethical Boundary Work of “Good” Killing. Animals 2023, 13, 2515. [Google Scholar] [CrossRef] [PubMed]
- Herzog, H.; Grayson, S.; McCord, D. Brief Measures of the Animal Attitude Scale. Anthrozoos 2015, 28, 145–152. [Google Scholar] [CrossRef]
- Romero, M.H.; Escobar, L.; Sánchez, J.A. Empathy Levels Among Veterinary Medicine Students in Colombia (South America). J Vet Med Educ 2021, e20210048. [Google Scholar] [CrossRef] [PubMed]
- Binngießer, J.; Wilhelm, C.; Randler, C. Attitudes toward Animals among German Children and Adolescents. Anthrozoos 2013, 26, 325–339. [Google Scholar] [CrossRef]
- Morrison, R.; Maust-Mohl, M.; Charlton, K. Friend, Foe, or Food: What Influences Students’ Attitudes Toward Animals? Anthrozoos 2021, 34, 187–200. [Google Scholar] [CrossRef]
- Pirrone, F.; Mariti, C.; Gazzano, A.; Albertini, M.; Sighieri, C.; Diverio, S. Attitudes toward Animals and Their Welfare among Italian Veterinary Students. Vet Sci 2019, 6, 19. [Google Scholar] [CrossRef]
- Calderón-Amor, J.; Luna-Fernández, D.; Tadich, T. Study of the Levels of Human–Human and Human–Animal Empathy in Veterinary Medical Students from Chile. J Vet Med Educ 2017, 44, 179–186. [Google Scholar] [CrossRef]
- van der Weijden, J. (3516660) Attitudes towards the Use of Animals of Students Enrolled in Animal Welfare and Laboratory Science Courses in The Netherlands. Thesis The Department Animals in Science & Society (AISS) of the Faculty of Veterinary Medicine 2013.
- Menor-Campos, D.J.; Diverio, S.; Sánchez-Muñoz, C.; López-Rodríguez, R.; Gazzano, A.; Palandri, L.; Mariti, C. Attitudes toward Animals of Students at Three European Veterinary Medicine Schools in Italy and Spain. Anthrozoos 2019, 32, 375–385. [Google Scholar] [CrossRef]
- Singer, P. Animal Liberation; HarperCollins, New York., 2009.
- Korsgaard, C.M. Fellow Creatures: Our Obligations to the Other Animals; 9780198753858th ed.; Oxford University Press, Oxford, 2018.
- Marino, L. Thinking Chickens: A Review of Cognition, Emotion, and Behavior in the Domestic Chicken. Anim Cogn 2017, 20, 127–147. [Google Scholar] [CrossRef]
- Dawkins, M.S. Animal Suffering: The Science of Animal Welfare. ; Chapman & Hall, London., 1980.
- Harpe, S.E. How to Analyze Likert and Other Rating Scale Data. Curr Pharm Teach Learn 2015, 7, 836–850. [Google Scholar] [CrossRef]
- Qualtrics Sample Size Calculator. Available online: https://www.qualtrics.com/blog/calculating-sample-size/ (accessed on 5 November 2022).
- Guyatt, G.; Drummond, R.; Meade, M.O.; Cook, D.J. Users’ Guides to the Medical Literature; 3rd ed.; 2015; ISBN 978-0-07-179071-0.
- Robbins, J.; Danielson, J.; Johnson, A.; Parsons, R.; Jorgensen, M.; Millman, S. Attitudes towards Animals and Belief in Animal Mind among First-Year Veterinary Students before and after an Introductory Animal Welfare Course. Animal Welfare 2021, 30, 409–418. [Google Scholar] [CrossRef]
- Hazel, S.J.; Signal, T.D.; Taylor, N. Can Teaching Veterinary and Animal-Science Students about Animal Welfare Affect Their Attitude toward Animals and Human-Related Empathy? J Vet Med Educ 2011, 38, 74–83. [Google Scholar] [CrossRef] [PubMed]
- Paul, E.S.; Podberscek, A.L. Veterinary Education and Students’ Attitudes towards Animal Welfare. Veterinary Record 2000, 146, 269–272. [Google Scholar] [CrossRef] [PubMed]
- Mohamed Azahar, F.A.; Mohd Fakri, N.M.R.; Mat Pa, M.N. Associations between Gender, Year of Study and Empathy Level With Attitudes towards Animal Welfare among Undergraduate Doctor of Veterinary Medicine Students in Universiti Putra Malaysia. Education in Medicine Journal 2014, 6. [Google Scholar] [CrossRef]
- Cornish, A.R.; Caspar, G.L.; Collins, T.; Degeling, C.; Fawcett, A.; Fisher, A.D.; Freire, R.; Hazel, S.J.; Hood, J.; Johnson, A.J.; et al. Career Preferences and Opinions on Animal Welfare and Ethics: A Survey of Veterinary Students in Australia and New Zealand. J Vet Med Educ 2016, 43, 310–320. [Google Scholar] [CrossRef]
- Mariti, C.; Pirrone, F.; Albertini, M.; Gazzano, A.; Diverio, S. Familiarity and Interest in Working with Livestock Decreases the Odds of Having Positive Attitudes towards Non-Human Animals and Their Welfare among Veterinary Students in Italy. Animals 2018, 8, 150. [Google Scholar] [CrossRef] [PubMed]
- Binngießer, J.; Randler, C. Association of the Environmental Attitudes “Preservation” and “Utilization” with Pro-Animal Attitudes. International Journal of Environmental & Science Education 2015, 10, 477–492. [Google Scholar]
- Knight, S.; Vrij, A.; Cherryman, J.; Nunkoosing, K. Attitudes towards Animal Use and Belief in Animal Mind. Anthrozoos 2004, 17, 43–62. [Google Scholar] [CrossRef]
- de Waal, F.B.M.; Andrews, K. The Question of Animal Emotions. Science (1979) 2022, 375, 1351–1352. [Google Scholar] [CrossRef]
- Hazel, S.; O’Dwyer, L.; Ryan, T. “Chickens Are a Lot Smarter than I Originally Thought”: Changes in Student Attitudes to Chickens Following a Chicken Training Class. Animals 2015, 5, 821–837. [Google Scholar] [CrossRef]
- Ventura, B.A.; Terreaux, C.M.H.A.; Zhitnitskiy, P.E. Veterinary Student Knowledge and Attitudes about Swine Change after Lectures and a Farm Visit. J Vet Med Educ 2021, 48, 492–502. [Google Scholar] [CrossRef] [PubMed]
- Johnstone, E.C.S.; Frye, M.A.; Lord, L.K.; Baysinger, A.K.; Edwards-Callaway, L.N. Knowledge and Opinions of Third Year Veterinary Students Relevant to Animal Welfare Before and After Implementation of a Core Welfare Course. Front Vet Sci 2019, 6. [Google Scholar] [CrossRef] [PubMed]
- Tzioumis, V.; Freire, R.; Hood, J.; Johnson, A.J.; Lloyd, J.; Phillips, C.J.C.; McGreevy, P.D. Educators’ Perspectives on Animal Welfare and Ethics in the Australian and New Zealand Veterinary Curricula. J Vet Med Educ 2018, 45, 448–463. [Google Scholar] [CrossRef] [PubMed]
Disclaimer/Publisher’s Note: The statements, opinions and data contained in all publications are solely those of the individual author(s) and contributor(s) and not of MDPI and/or the editor(s). MDPI and/or the editor(s) disclaim responsibility for any injury to people or property resulting from any ideas, methods, instructions or products referred to in the content |
© 2025 by the authors. Licensee MDPI, Basel, Switzerland. This article is an open access article distributed under the terms and conditions of the Creative Commons Attribution (CC BY) license (http://creativecommons.org/licenses/by/4.0/).
Copyright: This open access article is published under a Creative Commons CC BY 4.0 license, which permit the free download, distribution, and reuse, provided that the author and preprint are cited in any reuse.


