Submitted:
01 June 2025
Posted:
03 June 2025
You are already at the latest version
Abstract
AI-assisted thyroid nodule evaluation shows promise in improving thyroid nodule detection, which can be missed by ultrasound(US)-guided hand-held transducer due to the complexity of nodules segmentation. this paper proposed the paper proposes an efficient 4-level framework for ultrasound images segmentation, consisting of Dus-KFCM, Patch Learning, One Class Cross Learning, and parallel computing layer. The developed ML-OCX network considers the contributions of patches to predict the final image-level label by using a GS agent. The authors also created a novel ultrasonography dataset with 4 types of thyroid ultrasound scanning images. Extensive experiments demonstrate the effectiveness of the ML-OCX model, which outperforms other learning methods. The paper also presents an effective multi-modality learning framework to enhance segmentation performance by utilizing prior knowledge of one modality and finding a set of reliable positive and negative examples. The parallel algorithm achieves ~50% improvement in computation efficiency compared to the original serial algorithm. The model is trained on FL-TN, TI-RADS, and DDTI datasets and achieves an accuracy of 97.574%, Fmeasure of 86.150%, and precise judgement of GS-thyroid nodules location from ultrasound assessment, demonstrating its generalization ability. This can help endocrinologist more easily find missed atypia and decrease the follicular lesion miss rate. It may be applicable in daily clinical practice to reduce the burden on physicians. The technology also allows high-risk precancerous lumps to be detected, which has the clinical and biological significance analysis on thyroid nodules echotherapy finding. More prospective studies are needed to make AI-aided thyroid ultrasound diagnosis universal in thyroid nodule clinic.
Keywords:
Tyroid Nodule(TN)
; computer aided detection and prognosis
; grid search(GS)
; one class cross learning(OCX)
1. Introduction
The early and accurate diagnosis of computer-aided thyroid cancer has been the subject of research over the past few decades [1]. Ultrasonography remains a crucial tool in the workup of thyroid nodules. The integration of multi-modal ultrasonography techniques enhances the evaluation and management, allowing for more informed clinical decisions [2]. Automatic medical image segmentation plays a critical role in scientific research and medical care [3]. Timely detection of thyroid nodule ultrasound could provide a tool for decreasing both cancer mortality and incidence [4]. The operative clinical trials link on TN assessment staging system was used to stratify the presence/absence and risk level of the lesions. Detection of thyroid nodules’ lesions would allow surveillance to be performed, making early detection of the transformation to cancer possible [5]. However, despite significant advances, automatic TN detection in real time is still an unsolved problem. One concept for predicting the thyroid nodule lesions is to construct statistical models using some lesion appearance features or sonographic characteristics [6]. A more comprehensive analysis using more quantitative imaging features may provide better accuracy in predicting thyroid nodules [7]. For this reason, we investigated the feasibility of ultrasonography in predicting thyroid nodules.
Before proposing our models, we had established a number of challenges that needed to be overcome in order to make the developed AI models better applicable to clinical practice.
The first challenge is about difficult for fine grained US-guided thyroid nodule detection with such US-TN images themselves such as having multi-classes [8], shape variations [9], indistinct boundaries [10], appearance, the heterogeneous and dynamic environment compared to other patterns on MRI, CT or X-ray in 2D and etc [11]. and we need to combine distant view and close-up view too better achieve target lesion detection [12], we call it global and local view in this thesis. Also because of large variety of TN types and characteristics. What is more, some very subtle appearance in US-TN, which is hard to be detected [13]. For the above reasons, we need highly customized or a new CNN design to deal with. Meanwhile, for a training model, a good quality and large quantity of training data is also important, it requires high resolution and take a data augmentation to achieve high performance training models [14]. And on the hardware side, we need to extract effective features and different model’s fusion [15]. More importantly, the last one is about the domain adaptation, and DA for short, which has recently raised strong interests in the medical imaging community [16]. By encouraging algorithms to be robust to unseen situations or different input data domains [17]. Domain Adaptation improves the applicability of machine learning approaches to various clinical settings [18]. While a large variety of DA techniques has been proposed, most of these techniques have been validated either on private datasets or on small publicly available datasets [19]. Moreover, these datasets mostly address single-class problems [20].
-
Our research targets and goals:
- (a)
- Our motivation is to be able to detect, identify, locate and mark the boundary of the target lesions for fine grained TN detection.
- (b)
- The thyroid nodules system should be an adaptive, robust, and fast prediction system that works for US-TN image data with multi-modal technology [21].
- (c)
- The system can be able to work with real-time ultrasonography imaging.
- (d)
- Future more, in order to achieve domain adaptation(DA), and It will be able to scale and fuse with features and data from other sources [22] (e.g. different thyroid nodules features from various devices.)
- (e)
- And algorithm wise, we will implement a multi-level optimized adaptive precise segmentation approach for thyroid nodules. This will involve comparatively testing various state-of-the-art deep learning algorithms available in open source. We aim to improve and extend these models to ultimately design a deep learning model that is most suitable for our specific thyroid nodule case.
- (f)
- And it will test under non-public real-life US-TN images and video clips.
- (g)
- In last, we construct it to an operational prototype.
-
In summary, the major contributions of this paper are as follows.
- (a)
- In our approach, we present an efficient 4-level framework including DuS-KFCM, Patch Learning, Cross Learning and the lowest layer called parallel computing for the US-TN image segmentation. And they are a progressive relationship.
- (a)
- We proposed a feature learning scheme that engineers class-specific features that are generically discriminative.
- (b)
- What’s more, the developed novel multiple level one class cross learning model(ML-OCX for short) considers different contributions of patches to predict the final image-level by introducing GS agent automatically.
- (c)
- We construct a novel early gastric image dataset which consist of 4 types of US-TN images. The extensive experiments on the dataset demonstrate the effectiveness of our ML-OCX model and our method outperforms other learning methods.
2. Overview of the Proposed Model
The overall procedure of the ML-OCX model can be divided into 4 part, which are mainly the physical layer and 3 upper model architecture respectively. Here the brief introduction of these 4 parts is given.
2.1. The Overall Procedure of The Layer Architecture
In this section, we first introduce the proposed multi-level one class cross learning model with parallel GPU computing, based on parallel computing structure, global Dus-KFCM fuzzy model, local patch learning model and one class cross learning block, a novel multi-level layer fusion network of ML-OCX model is designed, as shown in Figure 1. The following will elaborate on these 4-levels aspects.
2.2. Methodology and Design
2.2.1. Dus-KFCM Fuzzy Segmentation
In our early work, we the continuous interactions and selective focus are used to better capture the information. The GLCM feature extraction method is employed, which consists of a 22 spatial attention block. We fuse the multi attention block and 3 channel-level attention blocks to improve the SKFCM model [23]. Specifically, the GLCM feature map can locate the informative regions, can channel-level attention block aim to enhance the feature presentation by modeling the interdependence between convolution channels.
2.2.2. Local Patch Learning
The local patch learning is the higher level, which are designed to improve the segmentation result of global fuzzy clustering model. The model divides into two stages, including LPM and GPM model separately [24], and the first stage is rough segmentation model to utilize prior knowledge of one modality to enhance the segmentation performance of another modality. And we input different kinds of the raw gastric cancer images firstly, we take a global pre-segmentation using the GLCM. For each image, we could get a ‘stream-patch’ from a set of image patches to a vector [25]. And we present a method to analyze patches by embedding them to a vector space [26]. The cross-correlation with patches analysis in calculated for each feature vectorized representations are fused as the super-vector and normalized [27]. We could get the significant patches based on the trained optimized parameters. For different type of patch of different class of image, including lesion type1t̃ype4, we divide different class of the patch to the different GPM model, we could update the GPM model by optimizing parameters [28]. And then we could transfer the GPM output to the LPM model. we use the fuzzy segmentation result as the new gastric image set. And different class of patches go to different LPM model for further improvement.
2.2.3. One Class Cross Learning Model for Post-Processing and Fine-Tuning
However, the boundary is not yet accurate, and we present an effective one-class cross-learning framework to implement future fine-tuning. This framework is composed of two main sub-models: the Positive Only Learning Model (PL) and the Negative Only Learning Model (NL). Based on previous work, we can select high-quality negative samples for effective prediction and potential positive patches for positive learning [29]. In this way, we can obtain relatively effective negative patches.
In the Negative Only Learning Model, the background label is more prevalent than the lesion label, while in the Positive Learning Model, there are more lesion labels than background labels. Thus, the problem of imbalanced training samples between the two sub-networks can be addressed, which is one of the advantages of our model.
The output of the network (after SoftMax is applied) for each transformed image associated with the original one is a vector . The DeepLab classification model in this study, with the base model (ResNet-50), is trained to predict the patches, where represents the probability of the transformed image belonging to the new four classes, for example .
We propose an inference process to fuse the outputs of these two transformed images and to predict the label of the original image based on the fusion of DeepLab twins. For each pair , the prediction of the original image will be either P or N.
Thus, we obtain the trained cross-learning model, which is used on the test image set, employing the four sub-networks (Sub-Network A, Sub-Network B, Sub-Network C, and Sub-Network D) with the same structure via confidence, referred to as the positive reliability of the prediction. The learning model is enhanced by adding the confidence score, which mathematically corresponds to the probability of whether the data belongs to a positive class or not [30].
2.2.4. GPU Based Multiple Parallel Programs as the Base Layer
In hardware side, we explore a parallel model technique to train out models in an end-to-end fashion [31]. We load dataset from the cloud and make our parallel-based implementation of the proposed model.
Here, we refer to a GPU worker thread as a host thread that manages work dispatched to a single device for the compute-intensive function [32]. Some sequential code execution will be prior to parallel construct [33]. Parallelizable calculations in spatial data from the data pool are divided into individual tasks and performed using a pool of CPU and GPU worker threads that asynchronously consume the work on the host or the device [34], respectively. The sequential code forks N-1 threads specified by environment. We can parallelize 10 threads. Forking involves overheads of threads of thread creation and can slow down the code.
The master thread continues to process in parallel mode, and other starts processing their own chunk of data over multiple CPI’s [35]. In dynamic mode, threads are spawned slowly as each thread requests for chunks of data to process [36]. Since there is a possibility of a job being completed before spawning of all specified threads, it is necessary to choose the chunk size and number of threads wisely if the system is used for multiple parallel programs [37]. Iterations processed closer to the allocated memory location will complete faster, as compared to distant iteration processing nodes, due to memory access latencies [38].
3. Automatic Medical Image Segmentation for Thyroid Nodule Cancer Detection Based on Deep Dus-KFCM Clustering
In this section, Detection and classification of thyroid nodules are one of the challenging tasks in ultrasonography image analysis [39]. Lesion detection plays an important role in thyroid nodule diagnosis and follow-up [40]. Manual segmentation of TN images is a very time-consuming task and subject to intra- and inter-rater variability [41]. Accurate thyroid nodules lesion segmentation in abdominal sequences is an essential and crucial task for surgical planning and navigation in thyroid radiofrequency ablation [42]. However, thyroid nodule lesion segmentation in ultrasound image is a substantially challenging work because the intensity values of thyroid nodules are similar to those of adjacent structures [43].
In Figure 2, the idea is to combine two parts: Neural Network and Fuzzy Logic–Hybrid Neuro-Fuzzy system. The objective of this manuscript is to provide an efficient way to segment the thyroid nodules lesion area. This work focuses on design and development of an automated diagnostic system using thyroid nodules images. In this thesis, a coarse-to-fine method was applied to segment thyroid nodules lesion from ultrasonography images, which consists of two stages including rough segmentation and refined segmentation [44]. The rough segmentation is based on a kernel fuzzy C-means algorithm with spatial information (SKFCM) algorithm combined with spatial gray level co-occurrence matrix (GLCM) and the refined segmentation is implemented with deeplabv3+ (backbone with resnet50) algorithm to improve the overall accuracy.
Experimental results for thyroid nodules segmentation show that the method provides an accuracy of 87.9476% with specificity of 96.3343% and performs better than other related methods. The performance of the method was evaluated using two benchmark datasets including the thyroid nodules Segmentation and the non-cancerous datasets. Then use the real-time ultrasound strain elastography dataset to do the final test to verify robust sonographic features detection ability [45]. Our method achieves high accuracy in thyroid nodules lesion segmentation. The work describes an innovative way of using GLCM based textural features to extract underlying information in thyroid nodule cancer imagery. Modified deep DuS-KFCM endoscopy image segmentation method based on GLCM feature, The experimental results shown to be effective in image segmentation and has good performance of resisting noise, segmentation effect more ideal.
4. Research on Parallel and GPU-Accelerated Computing for Accurate Diagnoisis and Prognosis Prediction and Segmentation of Thyroid Nodule Cancer Recognition Using Patch Learning on Ultrasonography Image Automatic Medical Image Segmentation for Thyroid Nodule Cancer Detection Based on Deep Dus-KFCM Clustering
In this section, we propose a novel method for the thyroid incidentalomas detection with a small number of thyroid incidentalomas US images via fine-tuning LPLs model techniques. The proposed method newly annotates the regions of the TN and assigns three kinds of patch-level class labels considering not only the image-level GT (“ thyroidoma”/“non-thyroidoma”) but also the regions of the TN. Note that TN region annotation can be easily executed by non-clinicians. By using a LPLs model fine-tuned with patches to predict the patch-level class labels, we can select patches extracted from the inside of the thyroid gland for estimating the image-level class labels since the outside of the thyroid gland is unrelated to the image-level GT [46]. In the experiment, we use only 1,808 ultrasonography of thyroid nodules images for training and evaluate the detection performance with 615 ultrasonography of thyroid nodules images. Experimental results show that the proposed method achieves highly accurate detection with a small number of US-TN images for training.
As shown in Figure 2(B), the proposed pipeline encompasses four main components: Prepossessing and preparation of input data, feature extraction, fusion and feature abstraction, and classification segmentation.
This study proposes a DL model for detecting thyroid nodule lesions from fused GLCM and US data. GLCM map is a comprehensive analysis for describing lesion salience based on high-dimensional quantitative features extracted from the large quantity of medical images collected [47]. It has the potential to be an effective tool for personalized medicine based on feature descriptions of lesion from medical images [48].
The first component, that is, data preparation, includes the GLCM correction. The pixel map was filtered to create autoc, contr, corrm corrp and etc. The final map was created by interpolating each GLCM value map using the normalization method. The low-level features were calculated based on the image objects created via GLCM map and binary mark difference segmentations. The features extracted from the GLCM data and patch level endo images were fused at the low-level feature level.
In Figure 2B(a), we try to decomposition the TN-US image into patches: For each frame image in TN video clip, it needs to be divided into n non overlapping P×P patches, and these n patches are required to completely cover the whole slice, that is,
To identify potential lesion development, we assessed TN patches by incorporating GLCM data to capture influential aspects. We ensured patch dimensions aligned with US-TN resolution for thyroid nodule relevance. Each patch underwent analysis using various depth thresholds for comprehensive evaluation [40]. The program generated patch sequences based on specified conditions, forming a detailed list utilized in subsequent procedures [49].
In the next step, the matched positive and texture of all TN frame were formatted into patch vector files, with the patch selection established according to the predefined conditions. For each TN clip, a series of these patch vector files are generated, one file per patch. Each file contains the following for all patches: the patch ID, GLCM measurement of the TN patch under calculation. Due to the high dimensionality of the data, incorporating the individual pixel changes was not computationally feasible. Additionally, since our goal was to identify key regions likely to be TN hotspots, using the exact GLCM value at each pixel as opposed to a single GLCM value representation for the patch of the TN wasn’t expected to make a significant difference in the outcome of the study.
In Figure 2B(b), using the patch vector files as input, we performed statistical and grid search techniques to correlate the GLCM response as measured by the patch with the fixed size [50].
GT was applied to the patch in each captured frame as binary 0/1 vectors and we correlate the patch features composition to the image as a continuous sequence [51]. After jointing multi space attention(S), We classified embedding TN GLCM sensitivity against each patch as lesion or no-lesion corresponding to each image <or> GLCM search threshold, respectively [52]. GS avg search range was also utilized as a univariate analysis calculating odds-ratio and statistical significance to identify strong associations between presence or absence of a lesion [53].
These data mining models were applied to all sets of patch vectors, each set corresponding to a particular patch. Patches that included statistically significant patch sites by fussing GLCM map, normalizing fussing att., and achieved an overall accuracy of >5% by GS, were marked as significant and were considered for further evaluation. Notably, no correction for multiple accumulated searches was performed, as the goal was to be inclusive for discovering the most potential TN targets. Only patches identified as significant by the maximum statistics of the optimal evaluation index were used, with the hypothesis that patches with highest agreement by multiple indexes would be more likely to be substantially develop the TN lesion in Table 1, and therefore, more probable to be part of an FT network input.
In each significant patch, patch with significant correlation with the TN lesion identified were highlighted and stored as TN potential area that are impactful with regards to the TN prediction.
In Figure 2B(c), we examined a set of conditions for patch composition, as defined by the same patch size and resolution [54]. We then selected the condition that included patch threshold previously reported to be part of known TN and by eliminating conditions that resulted in redundant patch clusters. Patches were generated based on the selected range and evaluated by the evaluation indexes. We obtained patches determined to be significant by GS models, i.e., patches that contain statistically significant GLCM value range and high concordance of the elevation value with the predicted response by GS. To identify frequently occurring clusters of patches in these key patches which are likely to be important in TN binding as a network input, the frequency of occurrence of each patch across the significant multi evaluation value array was obtained.
5. Towards GS-Based One Class Cross-Learning for Accurate Segmentation of Thyroid Nodule Cancer Detection with Limited Source Labels
In this section, we describe our proposed method. We begin with a brief overview of the entire framework, followed by specific details. We introduced a deep learning solution for the problem of one-class classification, where only training samples of a single class are available during training. In the experiment, we use a real-world dataset consisting of 4 types of thyroid nodules images and 400 weakly supervised thyroid nodules images. Each thyroid nodules image contains a slide of a TN Lesion that is up to 108, 000 × 54, 000 × 3 pixels in size and was annotated by two thyroid nodule specialist. The supervised images have pixel-wise class labels, and the weakly supervised images only have a general ratio of cancer types. The supervised images are annotated into one non-cancer region and 4 cancer regions, PTC, Follicular Thyroid Carcinoma (FTC), medullary thyroid cancer (MTC) and Anaplastic thyroid carcinoma (ATC) [55]. In addition, there are vague areas in the lesion area, indicated in black, which were difficult for the acoustician and ultrasoundist to classify [56]. These difficult regions were excluded when evaluating the accuracy of the cancer type segmentation.
5.1. Description of The Process
5.1.1. Implementation Details
As shown in Figure 3(A), in negative learning, a randomly chosen class will most likely yield a correct label. Hence, its labels are less informative. In positive learning, a randomly chosen class will most likely yield an incorrect label. Hence, its labels are more informative. So negative learning labels are much more likely to be true than positive learning labels. Negative learning labels are much more likely to be true than positive learning labels, which tries to learn a classifier to model the distribution of positive data and negative data by using only positive labeled data and unlabeled data.
There exist a large number of two-step algorithms. The most primitive method is to consider all unlabeled examples as negative, including other types of thyroid nodules classes. A classifier trained with these negative examples and a positive data set may do some correct classifications since most of the unlabeled examples were already negative. On the other hand, since there are also positives in the unlabeled set, this classification may result in many false positives or false negatives. We implemented this method with the name .
Seminal work led to six different kinds of choices: large positive-small positive (Pp), large positive-small negative (nP), large positive-large negative (PN). In prior work, the overall framework of the search strategy and study selection could refer to the section, and this is represented as the Positive Selectivity (PS) of the patch being assigned a pseudo label. PS is a parameter that determines how much of the images are given a positive pseudo label, and is defined by:
Where is the distance between the ratios defined by Eq. 2, and and are the true cancer ratio and predicted cancer ratio, respectively. Eq. 2 is calculated for each class of thyroid ultrasound images, and positive pseudo labels are assigned to only total patch images in the order of confidence.
As shown in Figure 3(B), this framework is composed of two main sub-models: the positive only learning model (PL for short) and the negative only learning model (NL for short) [57].
In Figure 4, firstly, we trim the image-set based on patching. In general, the class of interest is commonly called the positive class, and the rest are negative classes. In our study, we use the grid search model, GS for short, and with this model, we can select high-quality negative samples for effective prediction and potential positive patches for positive learning. This way, we can obtain relatively effective negative patches. In the negative only learning model, the background label outnumbers the lesion label. Conversely, in the positive learning model, there are more lesion labels than background labels [58]. Thus, the problem of imbalanced training samples in the two sub-networks can be addressed. This is one of the advantages of our model.
The output of the network (after SoftMax is applied) for each transformed image associated with the original one is a vector . The DeepLab classification model in this study, using the base model (ResNet-50), is trained to predict the patches where represents the probability of the transformed image belonging to one of these four classes: . We propose an inference process to fuse the outputs of these two transformed images and to predict the label of the original image based on the Fusion of DeepLab Twins. For each pair , the prediction of the original image will be either P or N.
Thus, we develop the trained cross-learning model, which is used in part B. In part B, these four sub-networks (Sub-Net A, Sub-Net B, Sub-Net C, and Sub-Net D) with the same structure are utilized in a one-class cross-learning model. Finally, the model provides an anomaly score via the confidence, which we refer to as the positive reliability of the prediction. This enables computers to learn effectively by incorporating the confidence score, mathematically corresponding to the probability of the data belonging to a positive class.
5.1.2. Construction of Prediction Models
The effectiveness of the proposed method is shown in results for AlexNet and VGG16-based backbone architectures. The performance of the proposed method is tested on publicly available datasets for abnormal image detection, novelty detection, and face-based mobile active authentication. The proposed method obtained state-of-the-art performance in each test case. The output of the network (after SoftMax is applied) for each transformed image associated with the original one is a vector
where is the probability of the transformed image belonging to class . Herein, we propose an inference process to fuse the outputs of the two transformed images and to predict the label of the original image . In this way, for each pair , the prediction of the original image will be either P or N. Let
and
be the ResNet-50 predictions for and respectively. Then: If and , then . If and , then .
If none of the above applies, then
Let computers learn well by adding the confidence score, which mathematically corresponds to the probability whether the data belongs to a positive class or not. They succeeded in developing a method that can let computers learn a classification boundary only from positive data and information on its confidence (positive reliability) against classification problems of machine learning that divide data positively and negatively.
6. Comparison with State-of-the-Art Methods
In this section, we provide detailed experiments and comparisons with state-of-the-art methods. We compare our method with segmentation models such as DeepLabV3+ (backbone: ResNet18), DeepLabV3+ (backbone: MobileNet), and DeepLabV3+ (backbone: Xception). The overall experimental results are depicted in Figure 5(a)–(l). We can clearly observe that:
False Positive/Negative Rates solve the problem where the training data only contain positive and reliable negative examples. The prediction results were quantitatively evaluated using three evaluations recommended for F-measure, False Positive Rate (FPR), False Negative Rate (FNR), Accuracy (ACC), and the Intersection over Union (IoU).
As shown in Figure 5, we find that the inherent problem of F-measure is improved; that is, the metric penalizes false negatives more heavily than false positives. This is mainly because our model can balance the sample size in positive learning and negative learning. We observe that in other existing methods, the sensitivity of the FPR is not high when the FNR changes vertically. Conversely, the bias effect of our model in this respect is lessened, and the overall F-measure remains relatively stable.
The F-measure remains high when FPR and FNR are at low values, reflecting the predictive robustness of our model. This result is also applicable to the evaluation indicators of F-measure, Accuracy, and IoU. Compared to other methods, our model shows a strong correlation between IoU and Accuracy, which reflects our model’s high sensitivity to IoU and robustness without significant changes. In other methods, the correlation between Accuracy and IoU does not exist; however, in our model, there is a certain correlation between IoU and Accuracy, which facilitates studying boundary accuracy.
7. Conclusion
The experimental results showed that the PM achieves a high patient-level gastritis detection performance with only a few annotations. This result also suggests the effectiveness of the automatic determination of threshold value to extract the lesion candidate region. The experiments show that the proposed method facilitates direct and overall analysis on thyroid ultrasound images and realizes highly accurate judgment of thyroid nodules location. This can help thyroid cancer diagnosis specialists more easily find missed lesion and decrease the thyroid carcinoma miss rate. It may be applicable in daily clinical practice to reduce the burden on physicians. The technology also allows high-risk precancerous lesions to be detected, which has the clinical and biological significance analysis on thyroid ultrasound finding. Experimental results on the constructed ultrasonography dataset demonstrate the significant improvement on the accuracy of our proposed framework compared with other state-of-the-art multi-instance learning methods.
In future research, our framework aims to predict genomic features of thyroid nodule through extensive patient data collection. The system has potential for detecting various diseases, including thyroid nodule-related conditions. Leveraging spatial features and temporal data enhances predictive capabilities for lesion-specific markers. Integrating diverse data sources, such as treatments, medical history, and diagnostic imaging, will improve model generalization and segmentation accuracy. And Humans struggle to integrate mixed data, extends the segmentation task by including multi-institutional data and introduces a new classification task. We could mix the different modality to improve our model generalization. For example, we could incorporate additional treatments into our model, including prescriptions, patient and family history, clinical notes, and reports. Furthermore, we could consider vital signs, lab diagnostics, genetics, second harmonic generation (SHG) microscopy, and the time-based clinical value of multi-gene testing.
Our research has several limitations. The experimental data used in this study were obtained from a single medical facility, which could affect the robustness of our method. Several studies have shown that extra data help increase the representation learning performance in self-supervised learning. Exploring the effect of data from multiple medical facilities on self-supervised learning will be one of our future works. Moreover, our previous study can improve the effectiveness and security of medical data sharing among different medical facilities, which fits well with self-supervised learning. And the major limitation of the proposed method is the small number of images. Training and evaluation of the proposed method were carried out using the data collected at a single facility only for comparison with our previous method. We plan to expand the dataset by including data from external facilities.
Author Contributions
X.X.L. and J.Y. contributed equally to the work. J.Y. and X.X.L. conceived the idea and designed the study. J.Y. and X.X.L. collected and double-checked the clinical data. J.Y. and X.X.L. developed the deep learning algorithm. J.Y. and X.X.L. analyzed the results. C.Y.G., J.Y.L., Y.L.L., L.Z., and J.M.Y. analyzed the ultrasonography Thyroid nodule images. J.Y., X.X.L. and K.K. wrote and revised the manuscript. All the authors participated in revising the manuscript before submission and the formal revision, including literature searching, information extraction, and text modification.
Funding
This work was supported by MOE (Ministry of Education in China) Project of Humanities and Social Science (Project No.22YJCZH213), Key Program of The Science and Technology Research of Chongqing Municipal Education Commission (No. KJZD-K202203601), The Natural Science Foundation of Chongqing, China (No. cstc2021jcyj-msxmX1108), Chunhui Plan Research Program, Ministry of Education, China (No. 202200006).
Institutional Review Board Statement
Not applicable.
Informed Consent Statement
Not applicable.
Data Availability Statement
The data from FL-TN that support the findings of this study are available from the corresponding author, J.Y., upon reasonable request. Codes used in this study are publicly available at https://github.com/liu37972/GS-OCMXM.git.
Acknowledgments
The authors are thankful Fuling Center Hospital of Chongqing for granting access to their extensive non-public ultrasound thyroid nodules medical imaging repository. Utilizing these resources effectively is crucial for advancing medical research and improving patient care. The hospital also provides annotations, clinical data, and usage guidelines for research and development purposes. We appreciate their valuable feedback and suggestions in our artificial intelligence development.
Conflicts of Interest
The authors declare no conflict of interest.
References
- Xia, S.; Yao, J.; Zhou, W.; Dong, Y.; Xu, S.; Zhou, J.; Zhan, W. A computer-aided diagnosing system in the evaluation of thyroid nodules-experience in a specialized thyroid center. World Journal of Surgical Oncology 2019, 17, 210. [Google Scholar] [CrossRef] [PubMed]
- Borlea, A.; Moisa-Luca, L.; Popescu, A.; Bende, F.; Stoian, D. Combining CEUS and ultrasound parameters in thyroid nodule and cancer diagnosis: a TIRADS-based evaluation. Frontiers in Endocrinology 2024, 15, 1417449. [Google Scholar] [CrossRef] [PubMed]
- Wang, S.; Li, C.; Wang, R.; Liu, Z.; Wang, M.; Tan, H.; Wu, Y.; Liu, X.; Sun, H.; Yang, R.; et al. Annotation-efficient deep learning for automatic medical image segmentation. Nature Communications 2021, 12, 5915. [Google Scholar] [CrossRef] [PubMed]
- Wang, J.; Yang, X.; Jia, X.; Xue, W.; Chen, R.; Chen, Y.; Zhu, X.; Liu, L.; Cao, Y.; Zhou, J.; et al. Thyroid ultrasound diagnosis improvement via multi-view self-supervised learning and two-stage pre-training. Computers in Biology and Medicine 2024, 171, 108087. [Google Scholar] [CrossRef]
- Grimmichova, T.; Pacesova, P.; Hill, M.; Pekova, B.; Vankova, M.; Moravcova, J.; Vrbikova, J.; Novak, Z.; Mastnikova, K.; Vaclavikova, E.; et al. Thyroid Cancer Detection in a Routine Clinical Setting: Performance of ACR TI-RADS, FNAC, and Molecular Testing in Prospective Cohort Study. Biomedicines 2022, 10, 954. [Google Scholar] [CrossRef]
- Li, G.; Ma, S.; Zhang, F.; Jia, C.; Liu, L.; Gao, F.; Shi, Q.; Wu, R.; Du, L.; Li, F. The predictive models based on multimodality ultrasonography for the differential diagnosis of thyroid nodules smaller than 10 mm. British Journal of Radiology 2023, 96, 20221120. [Google Scholar] [CrossRef]
- Xu, Y.; Xu, M.; Geng, Z.; Liu, J.; Meng, B. Thyroid nodule classification in ultrasound imaging using deep transfer learning. BMC Cancer 2025, 25, 544. [Google Scholar] [CrossRef]
- Lee, Y.H.; Baek, J.H.; Jung, S.L.; Kwak, J.Y.; Kim, J.H.; Shin, J.H. Ultrasound-guided fine needle aspiration of thyroid nodules: a consensus statement by the Korean Society of Thyroid Radiology. Korean Journal of Radiology 2015, 16, 391–401. [Google Scholar] [CrossRef]
- Anil, G.; Hegde, A.; Chong, F.H. Thyroid nodules: risk stratification for malignancy with ultrasound and guided biopsy. Cancer Imaging 2011, 11, 209–223. [Google Scholar] [CrossRef]
- Alexander, E.K.; Heering, J.P.; Benson, C.B.; Frates, M.C.; Doubilet, P.M.; Cibas, E.S.; Marqusee, E. Assessment of nondiagnostic ultrasound-guided fine needle aspirations of thyroid nodules. Journal of Clinical Endocrinology & Metabolism 2002, 87, 4924–4927. [Google Scholar] [CrossRef]
- Hussain, S.; Mubeen, I.; Ullah, N.; Shah, S.; Khan, B.A.; Zahoor, M.; Ullah, R.; Khan, F.A.; Sultan, M.A. Modern Diagnostic Imaging Technique Applications and Risk Factors in the Medical Field: A Review. Biomedical Research International 2022, 2022, 5164970. [Google Scholar] [CrossRef] [PubMed]
- Zhang, H.; Chung, A.C.S. Depth-Aware Networks for Multi-Organ Lesion Detection in Chest CT Scans. Bioengineering (Basel) 2024, 11. [Google Scholar] [CrossRef] [PubMed]
- Zaidman, C.M.; Seelig, M.J.; Baker, J.C.; Mackinnon, S.E.; Pestronk, A. Detection of peripheral nerve pathology: comparison of ultrasound and MRI. Neurology 2013, 80, 1634–1640. [Google Scholar] [CrossRef] [PubMed]
- Younis, E.M.G.; Mahmoud, M.N.; Albarrak, A.M.; Ibrahim, I.A. A Hybrid Deep Learning Model with Data Augmentation to Improve Tumor Classification Using MRI Images. Diagnostics 2024, 14, 2710. [Google Scholar] [CrossRef]
- Qiao, Y.; Zhou, H.; Liu, Y.; Chen, R.; Zhang, X.; Nie, S.; Hou, F.F.; Zhao, Y.; Xu, X.; Zhao, L. A multi-modal fusion model with enhanced feature representation for chronic kidney disease progression prediction. Briefings in Bioinformatics 2025, 26. [Google Scholar] [CrossRef]
- Dorent, R.; Kujawa, A.; Ivory, M.; Bakas, S.; Rieke, N.; Joutard, S.; Glocker, B.; Cardoso, J.; Modat, M.; Batmanghelich, K.; et al. CrossMoDA 2021 challenge: Benchmark of cross-modality domain adaptation techniques for vestibular schwannoma and cochlea segmentation. Medical Image Analysis 2023, 83, 102628. [Google Scholar] [CrossRef]
- Hong, H.S.; Kumar, A.; Lee, D.G. Robust unsupervised domain adaptation by retaining confident entropy via edge concatenation. Expert Systems with Applications 2024, 238, 122120. [Google Scholar] [CrossRef]
- Guan, H.; Liu, M. Domain Adaptation for Medical Image Analysis: A Survey. IEEE Transactions on Biomedical Engineering 2022, 69, 1173–1185. [Google Scholar] [CrossRef]
- Roberts, M.; Driggs, D.; Thorpe, M.; Gilbey, J.; Yeung, M.; Ursprung, S.; Aviles-Rivero, A.I.; Etmann, C.; McCague, C.; Beer, L.; et al. Common pitfalls and recommendations for using machine learning to detect and prognosticate for COVID-19 using chest radiographs and CT scans. Nature Machine Intelligence 2021, 3, 199–217. [Google Scholar] [CrossRef]
- Guo, J.; Liu, Y.; Wu, Z. Decoupling Deep Domain Adaptation Method for Class-imbalanced Learning with Domain Discrepancy. In Proceedings of the 2021 7th IEEE International Conference on Network Intelligence and Digital Content (IC-NIDC), Beijing, China, 2021; pp. 76–80. [CrossRef]
- Zhang, N.; Liu, J.; Jin, Y.; Duan, W.; Wu, Z.; Cai, Z.; Wu, M. An adaptive multi-modal hybrid model for classifying thyroid nodules by combining ultrasound and infrared thermal images. BMC Bioinformatics 2023, 24, 315. [Google Scholar] [CrossRef]
- Zhang, X.; Huang, W.; Ding, C.; Wang, J.; Shen, C.; Shi, J. Cross-Supervised multisource prototypical network: A novel domain adaptation method for multi-source few-shot fault diagnosis. Advanced Engineering Informatics 2024, 61, 102538. [Google Scholar] [CrossRef]
- Sun, J.; Zhang, J.; Gao, X.; Wang, M.; Ou, D.; Wu, X.; Zhang, D. Fusing Spatial Attention with Spectral-Channel Attention Mechanism for Hyperspectral Image Classification via Encoder–Decoder Networks. Remote Sensing 2022, 14, 1968. [Google Scholar] [CrossRef]
- Xu, W.; Zou, L.; Fu, Z.; Wu, L.; Qi, Y. Two-stage 3D object detection guided by position encoding. Neurocomputing 2022, 501, 811–821. [Google Scholar] [CrossRef]
- Zhou, T.; Niu, Y.; Lu, H.; Peng, C.; Guo, Y.; Zhou, H. Vision transformer: To discover the “four secrets” of image patches. Information Fusion 2024, 105, 102248. [Google Scholar] [CrossRef]
- Wei, B.; Wang, X.; Su, Y.; Zhang, Y.; Li, L. Semantic Interaction Meta-Learning Based on Patch Matching Metric. Sensors 2024, 24, 5620. [Google Scholar] [CrossRef]
- Shabir, A.; Ahmed, K.T.; Mahmood, A.; Garay, H.; Prado González, L.E.; Ashraf, I. Deep image features sensing with multilevel fusion for complex convolution neural networks & cross domain benchmarks. PLoS ONE 2025, 20, e0317863. [Google Scholar] [CrossRef]
- Yang, L.M.; Grooms, I. Machine learning techniques to construct patched analog ensembles for data assimilation. Journal of Computational Physics 2021, 443, 110532. [Google Scholar] [CrossRef]
- Al Debeyan, F.; Madeyski, L.; Hall, T.; Bowes, D. The impact of hard and easy negative training data on vulnerability prediction performance. Journal of Systems and Software 2024, 211, 112003. [Google Scholar] [CrossRef]
- Pozdeyev, N.; Dighe, M.; Barrio, M.; Raeburn, C.; Smith, H.; Fisher, M.; Chavan, S.; Rafaels, N.; Shortt, J.A.; Lin, M.G.; et al. Thyroid Cancer Polygenic Risk Score Improves Classification of Thyroid Nodules as Benign or Malignant. The Journal of Clinical Endocrinology & Metabolism 2023, 109, 402–412. [Google Scholar] [CrossRef]
- Ahmed, S.F.; Alam, M.S.B.; Hassan, M.; Rozbu, M.R.; Ishtiak, T.; Rafa, N.; Mofijur, M.; Shawkat Ali, A.B.M.; Gandomi, A.H. Deep learning modelling techniques: current progress, applications, advantages, and challenges. Artificial Intelligence Review 2023, 56, 13521–13617. [Google Scholar] [CrossRef]
- Halbiniak, K.; Meyer, N.; Rojek, K. Single- and multi-GPU computing on NVIDIA- and AMD-based server platforms for solidification modeling application. Concurrency and Computation: Practice and Experience 2024, 36, e8000. [Google Scholar] [CrossRef]
- Wang, D.; Wang, Z.; Chen, L.; Xiao, H.; Yang, B. Cross-Parallel Transformer: Parallel ViT for Medical Image Segmentation. Sensors 2023, 23, 9488. [Google Scholar] [CrossRef] [PubMed]
- Bilotta, G. From GPU to CPU (and Beyond): Extending Hardware Support in GPUSPH Through a SYCL-Inspired Interface. Concurrency and Computation: Practice and Experience 2025, 37, e8313. [Google Scholar] [CrossRef]
- Kadah, Y.M.; Abd-Elmoniem, K.Z.; Farag, A.A. Parallel computation in medical imaging applications. International Journal of Biomedical Imaging 2011, 2011, 840181. [Google Scholar] [CrossRef]
- Ruan, X.; Mueller, M.; Liu, G.; Görlitz, F.; Fu, T.M.; Milkie, D.E.; Lillvis, J.L.; Kuhn, A.; Gan Chong, J.L.; Hong, J.L.; et al. Image processing tools for petabyte-scale light sheet microscopy data. Nature Methods 2024, 21, 2342–2352. [Google Scholar] [CrossRef]
- Langmead, B.; Wilks, C.; Antonescu, V.; Charles, R. Scaling read aligners to hundreds of threads on general-purpose processors. Bioinformatics 2018, 35, 421–432. [Google Scholar] [CrossRef]
- Chou, W.H.; Wu, C.H.; Jin, S.C.; Chen, J.C. Iterative Reconstruction of Micro Computed Tomography Scans Using Multiple Heterogeneous GPUs. Sensors 2024, 24, 1947. [Google Scholar] [CrossRef]
- Kang, Q.; Lao, Q.; Li, Y.; Jiang, Z.; Qiu, Y.; Zhang, S.; Li, K. Thyroid nodule segmentation and classification in ultrasound images through intra- and inter-task consistent learning. Medical Image Analysis 2022, 79, 102443. [Google Scholar] [CrossRef]
- AlSaedi, A.H.; Almalki, D.S.; ElKady, R.M. Approach to Thyroid Nodules: Diagnosis and Treatment. Cureus 2024, 16, e52232. [Google Scholar] [CrossRef]
- Gut, D.; Trombini, M.; Kucybała, I.; Krupa, K.; Rozynek, M.; Dellepiane, S.; Tabor, Z.; Wojciechowski, W. Use of superpixels for improvement of inter-rater and intra-rater reliability during annotation of medical images. Medical Image Analysis 2024, 94, 103141. [Google Scholar] [CrossRef]
- Akgun, E.; Romero-Velez, G.; Berber, E. Assessing the efficacy of thyroid nodule radiofrequency ablation using patient-reported outcome measures. Surgery 2024, 175, 654–660. [Google Scholar] [CrossRef] [PubMed]
- Yang, C.; Ashraf, M.A.; Riaz, M.; Umwanzavugaye, P.; Chipusu, K.; Huang, H.; Xu, Y. Improving diagnostic precision in thyroid nodule segmentation from ultrasound images with a self-attention mechanism-based Swin U-Net model. Frontiers in Oncology 2025, 15, 1456563. [Google Scholar] [CrossRef] [PubMed]
- Nie, X.; Zhou, X.; Tong, T.; Lin, X.; Wang, L.; Zheng, H.; Li, J.; Xue, E.; Chen, S.; Zheng, M.; et al. N-Net: A novel dense fully convolutional neural network for thyroid nodule segmentation. Frontiers in Neuroscience 2022, 16, 872601. [Google Scholar] [CrossRef] [PubMed]
- Almalki, Y.E.; E.-D. Mansour, M.G.; Ali, S.A.; A. A. Basha, M.A.; Abdelkawi, M.M.; Alduraibi, S.K.; Almushayti, Z.A.; Aldhilan, A.S.; Aboualkheir, M.; Amin, D.; et al. Advanced strain elastography is a reliable approach for prostate cancer detection in patients with elevated PSA levels. Scientific Reports 2024, 14, 2917. [CrossRef]
- Prochazka, A.; Gulati, S.; Holinka, S.; Smutek, D. Patch-based classification of thyroid nodules in ultrasound images using direction independent features extracted by two-threshold binary decomposition. Computers in Medicine and Biology 2019, 71, 9–18. [Google Scholar] [CrossRef]
- Tan, J.; Gao, Y.; Liang, Z.; Cao, W.; Pomeroy, M.J.; Huo, Y.; Li, L.; Barish, M.A.; Abbasi, A.F.; Pickhardt, P.J. 3D-GLCM CNN: A 3-Dimensional Gray-Level Co-Occurrence Matrix-Based CNN Model for Polyp Classification via CT Colonography. IEEE Transactions on Medical Imaging 2020, 39, 2013–2024. [Google Scholar] [CrossRef]
- Rezayi, S.; K. S, R.N.; Saeedi, S. Effectiveness of Artificial Intelligence for Personalized Medicine in Neoplasms: A Systematic Review. Biomedical Research International 2022, 2022, 7842566. [CrossRef]
- Roy, M.; Ghander, C.; Bigorgne, C.; Brière, M.; Deniziaut, G.; Ansart, F.; Lussey-Lepoutre, C.; Buffet, C. An update on management of cytologically indeterminate thyroid nodules. Annales d’Endocrinologie 2025, 86, 101711. [Google Scholar] [CrossRef]
- Kim, M.; Kim, K.; Jeong, H.W.; Lee, Y. Quantitative Evaluation of Kidney and Gallbladder Stones by Texture Analysis Using Gray Level Co-Occurrence Matrix Based on Diagnostic Ultrasound Images. Journal of Clinical Medicine 2025, 14, 2268. [Google Scholar] [CrossRef]
- Attarpour, A.; Osmann, J.; Rinaldi, A.; Qi, T.; Lal, N.; Patel, S.; Rozak, M.; Yu, F.; Cho, N.; Squair, J.; et al. A deep learning pipeline for three-dimensional brain-wide mapping of local neuronal ensembles in teravoxel light-sheet microscopy. Nature Methods 2025, 22, 600–611. [Google Scholar] [CrossRef]
- Chen, Y.Y.; Chan, H.T.; Wang, H.C.; Wang, C.S.; Chen, H.H.; Chen, P.H.; Chen, Y.J.; Hsu, S.H.; Hsia, C.H. Feature Feedback-Based Pseudo-Label Learning for Multi-Standards in Clinical Acne Grading. Bioengineering 2025, 12, 342. [Google Scholar] [CrossRef]
- Liang, Q.; Qi, Z.; Li, Y. Machine learning to predict the occurrence of thyroid nodules: towards a quantitative approach for judicious utilization of thyroid ultrasonography. Frontiers in Endocrinology 2024, 15, 1385836. [Google Scholar] [CrossRef]
- Quintana, G.I.; Li, Z.; Vancamberg, L.; Mougeot, M.; Desolneux, A.; Muller, S. Exploiting Patch Sizes and Resolutions for Multi-Scale Deep Learning in Mammogram Image Classification. Bioengineering 2023, 10, 534. [Google Scholar] [CrossRef] [PubMed]
- Guo, H.; Zhang, J.; Li, Y.; Pan, X.; Sun, C. Advanced pathological subtype classification of thyroid cancer using efficientNetB0. Diagnostic Pathology 2025, 20, 28. [Google Scholar] [CrossRef] [PubMed]
- Wojtowicz, I.; Żychowska, M. Dermoscopy of Basal Cell Carcinoma Part 3: Differential Diagnosis, Treatment Monitoring and Novel Technologies. Cancers 2025, 17, 1025. [Google Scholar] [CrossRef] [PubMed]
- Liu, Y.; Zhao, J.; Xu, Y. Robust and unbiased positive and unlabeled learning. Knowledge-Based Systems 2023, 277, 110819. [Google Scholar] [CrossRef]
- Wang, H.; Ahn, E.; Bi, L.; Kim, J. Self-supervised multi-modality learning for multi-label skin lesion classification. Computer Methods and Programs in Biomedicine 2025, 265, 108729. [Google Scholar] [CrossRef]
Figure 1.
General idea of our objective. The framework outlines a multi-level approach to enhance computational efficiency and segmentation accuracy. At Level 1, it leverages parallel computing with multiple GPU cores to implement stream parallelism. Level 2 employs the Dus-KFCM fuzzy segmentation method, utilizing a GLCM profile for initial segmentation, while integrating dual spatial features through adaptive GLCM feature selection and RGB color histograms. The output from Level 2 feeds into Level 3, where flexible threshold segmentation generates positive and negative training data for patch learning. Finally, Level 4 focuses on one-class cross-learning, training on labeled data for the positive class alongside unlabelled data representing negative classes or noise patches, thereby improving model robustness.
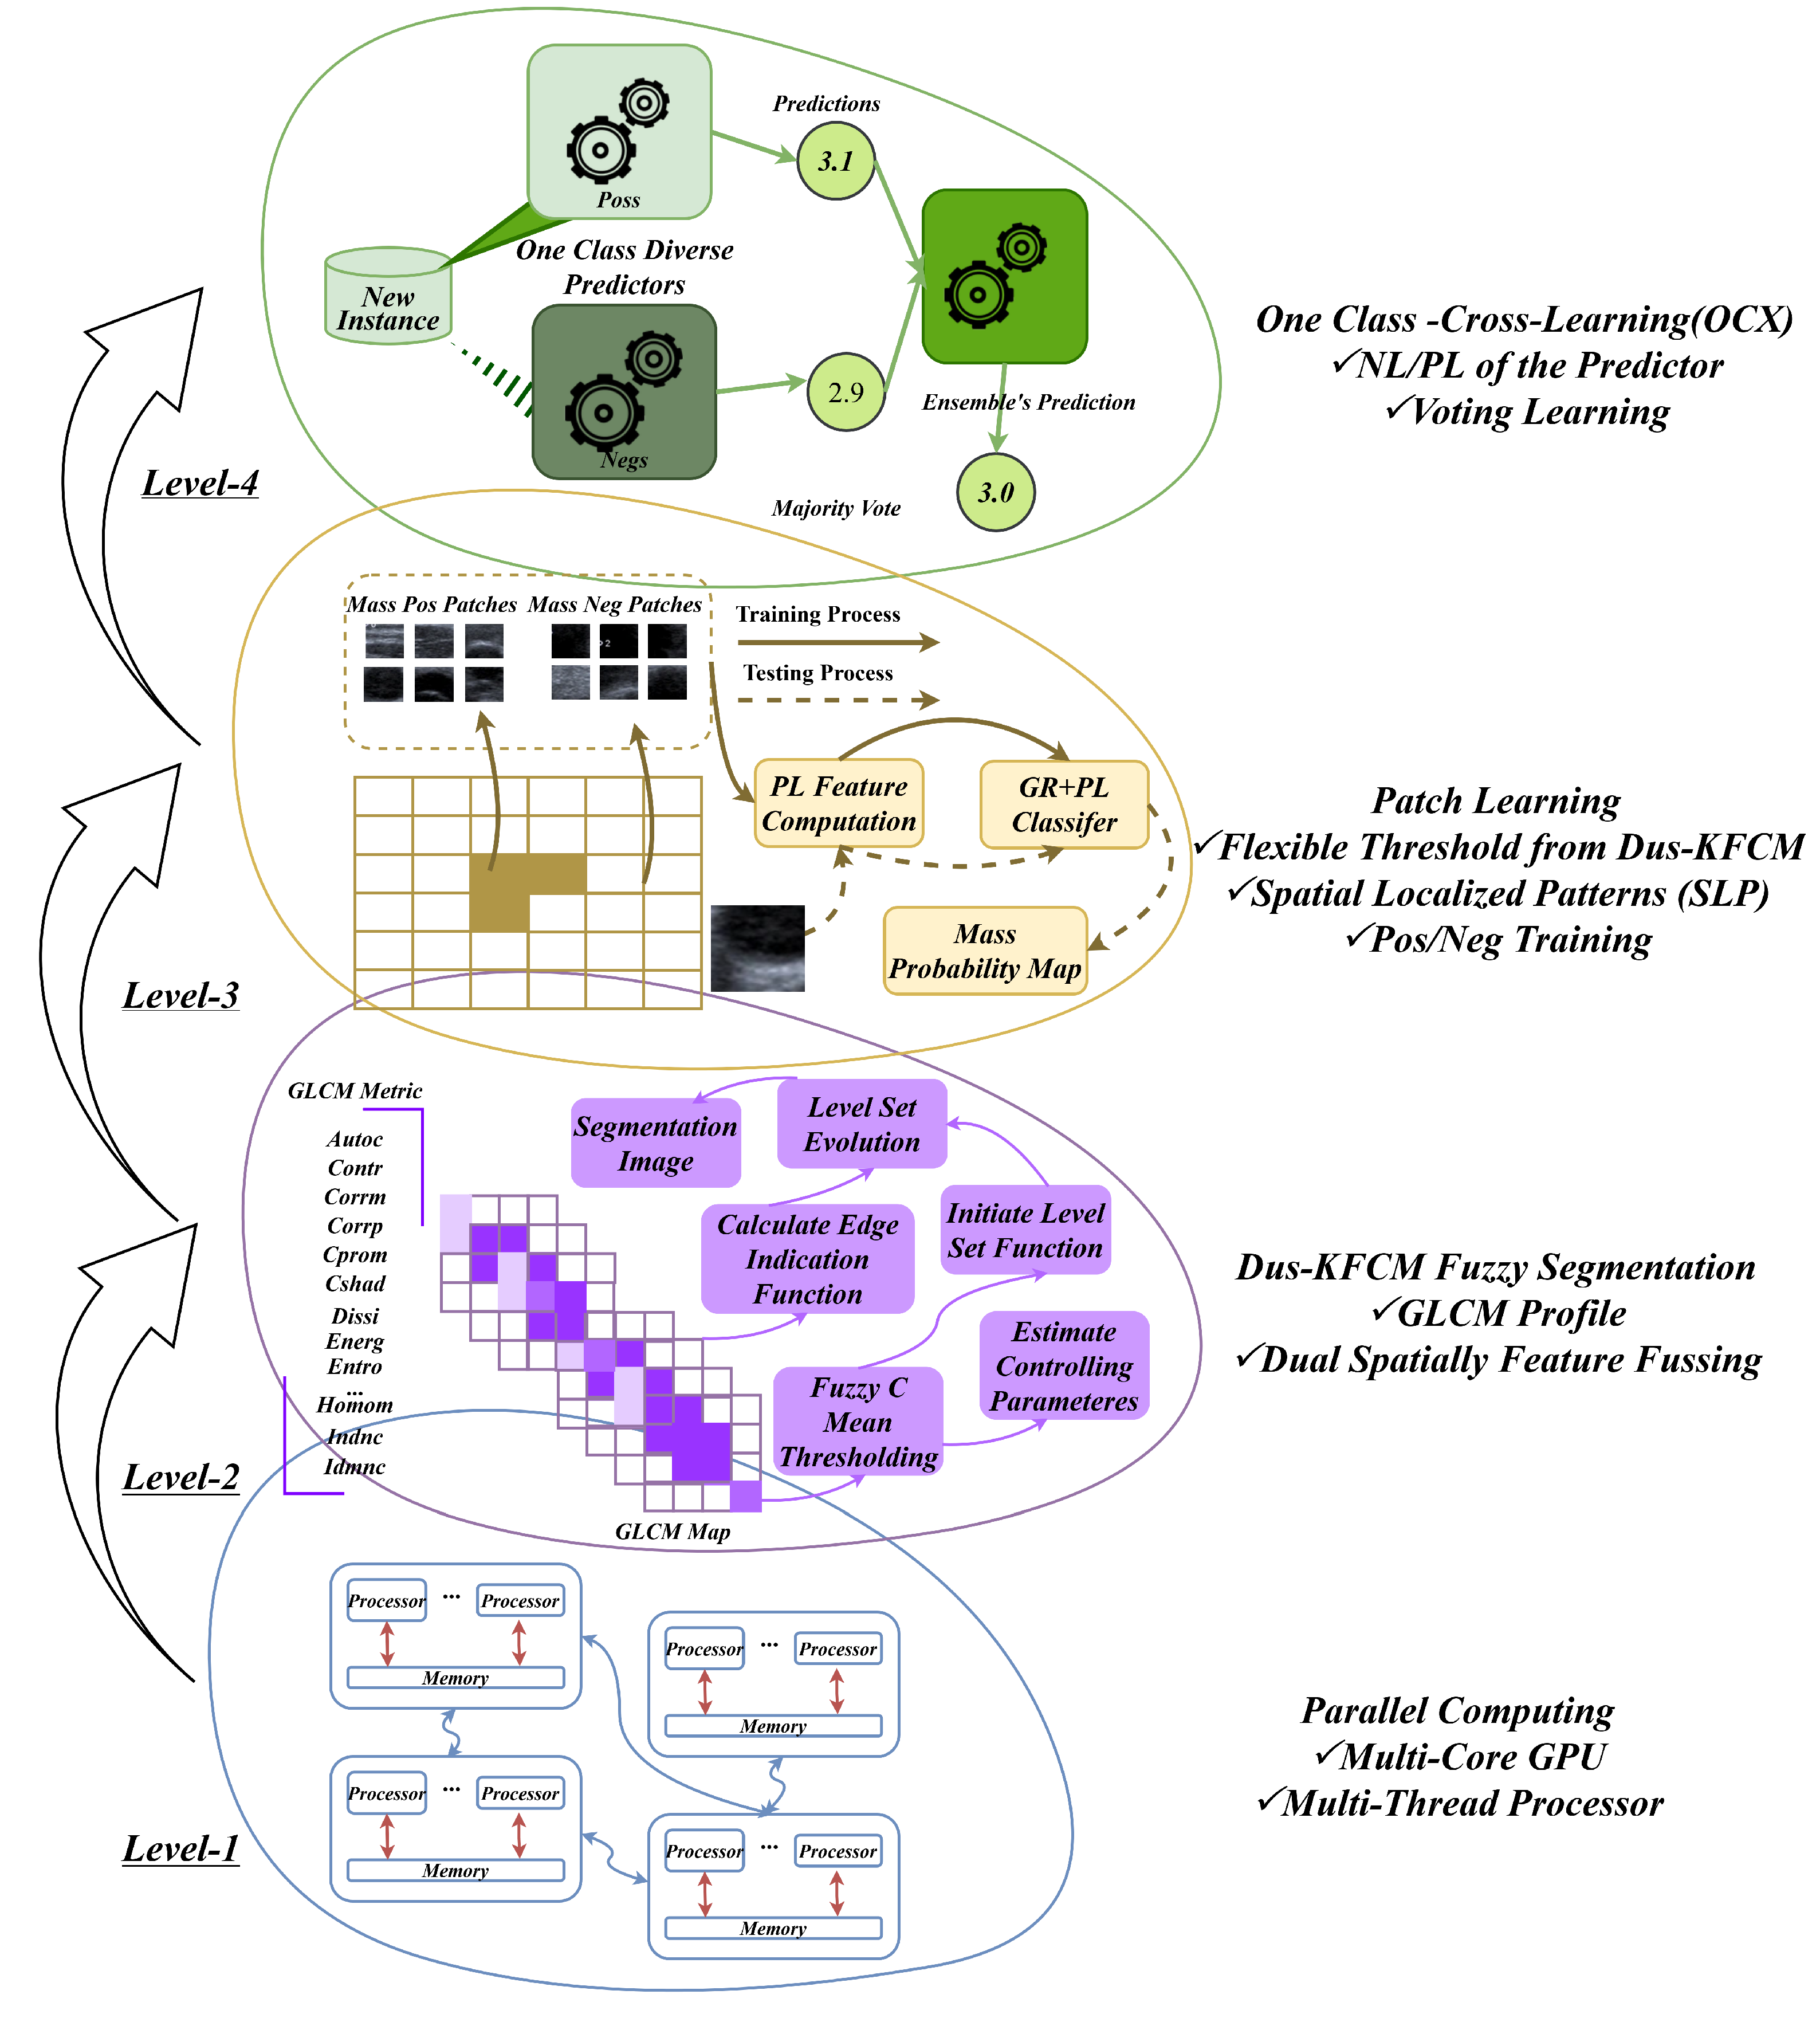
Figure 2.
Pre-segmentation in Level 2-Level 3. A. Overview of the Feature Extraction System. The US-TN utilizes 22 GLCM combination features along with a color histogram vector to create a consolidated feature vector. This process includes feature selection, concentration vector Images and clustering. B. Overall Architecture of the Image GS Retrieval System and Key Links. a. The GS method creates patch vector files and forms patch sequences, downsampling by a factor of 5 (default size: 5 pixels x 5 pixels). b. Patches from the original image are calculated using the GLCM method, and the patch vectors are fused with normalization to create new patches for the feature map. The feature map identifies the significant patches. c. the significant patches carry greater weight in predicting US-TN lesions.
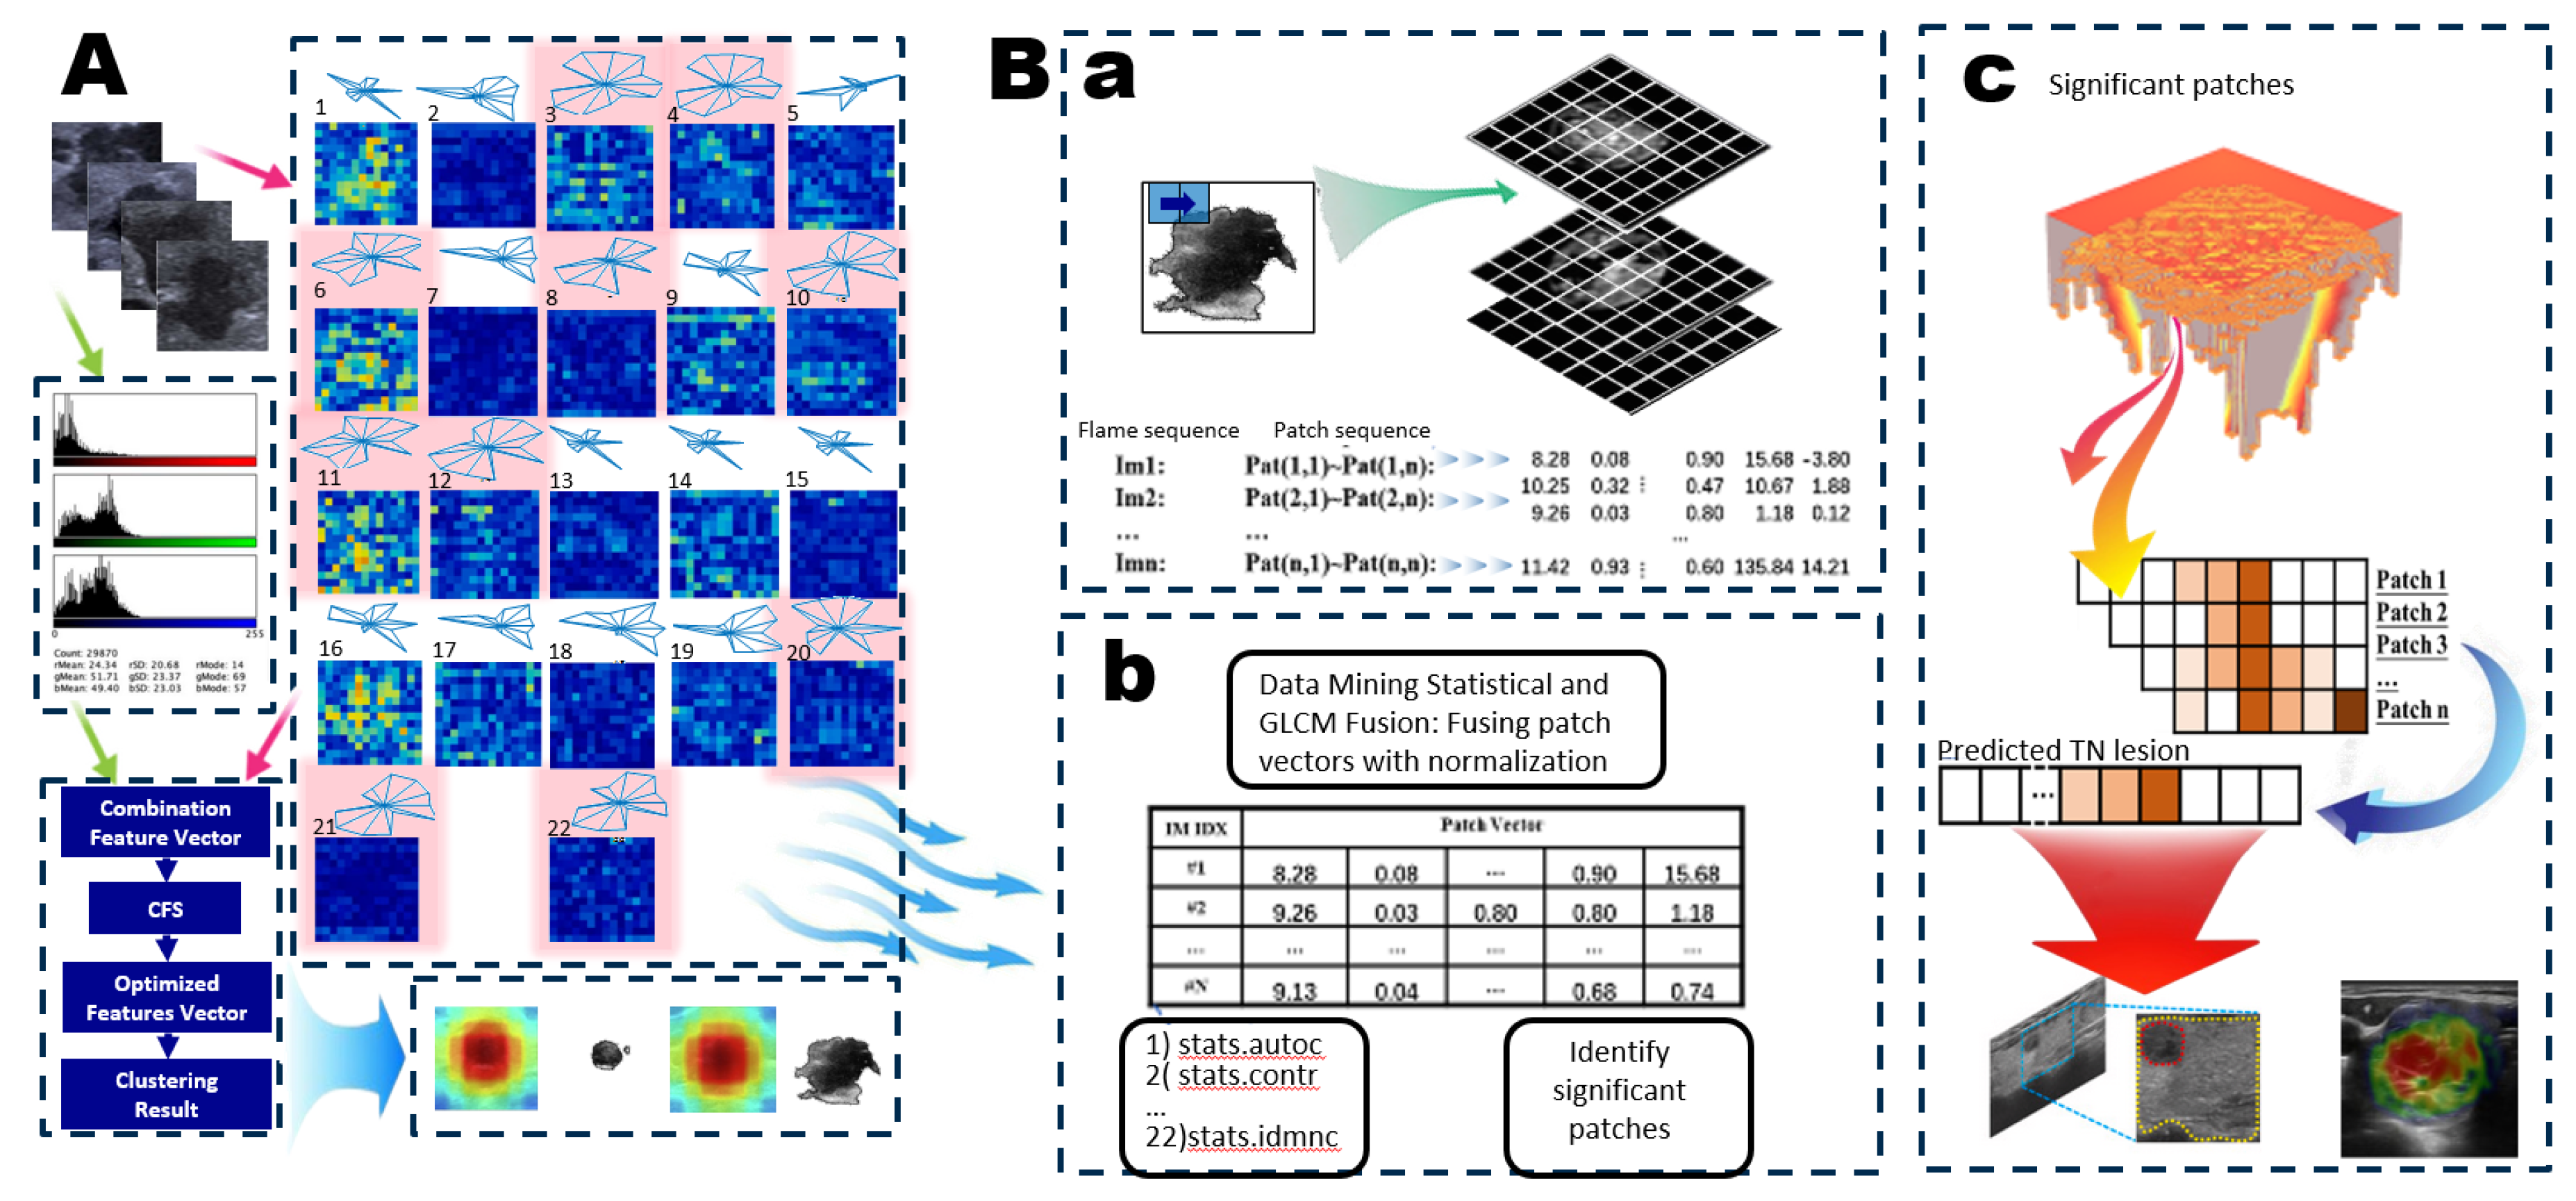
Figure 3.
One-Class Learning Scheme. A. Joint Negative and Positive Parallel Learning Approach for Noisy Labels. In the One-Class Positive Learning framework, we enhance the candidate selection process for positive examples through patch learning. Additionally, we improve the candidate selection for negative examples within the parallel One-Class Negative Learning framework. This approach distinguishes between Negative Samples (NS) and Reliable Negatives (RN), denoted as (NL+ & PL+). By refining the training dataset for selecting reliable examples, we aim to bolster the robustness and accuracy of the learning model, particularly in the presence of noisy labels. This dual enhancement strategy not only optimizes the learning process but also ensures more reliable predictions in challenging scenarios. B. Flow Chart of the Proposed Method. This flow chart illustrates the sequential steps involved in our proposed method, detailing the design of the OCX learning experiment. It outlines the integration of both negative and positive learning processes, culminating in the final prediction. By clearly mapping these steps, we provide a comprehensive overview of how the interplay between these learning mechanisms enhances the predictive accuracy and overall efficacy of the model.
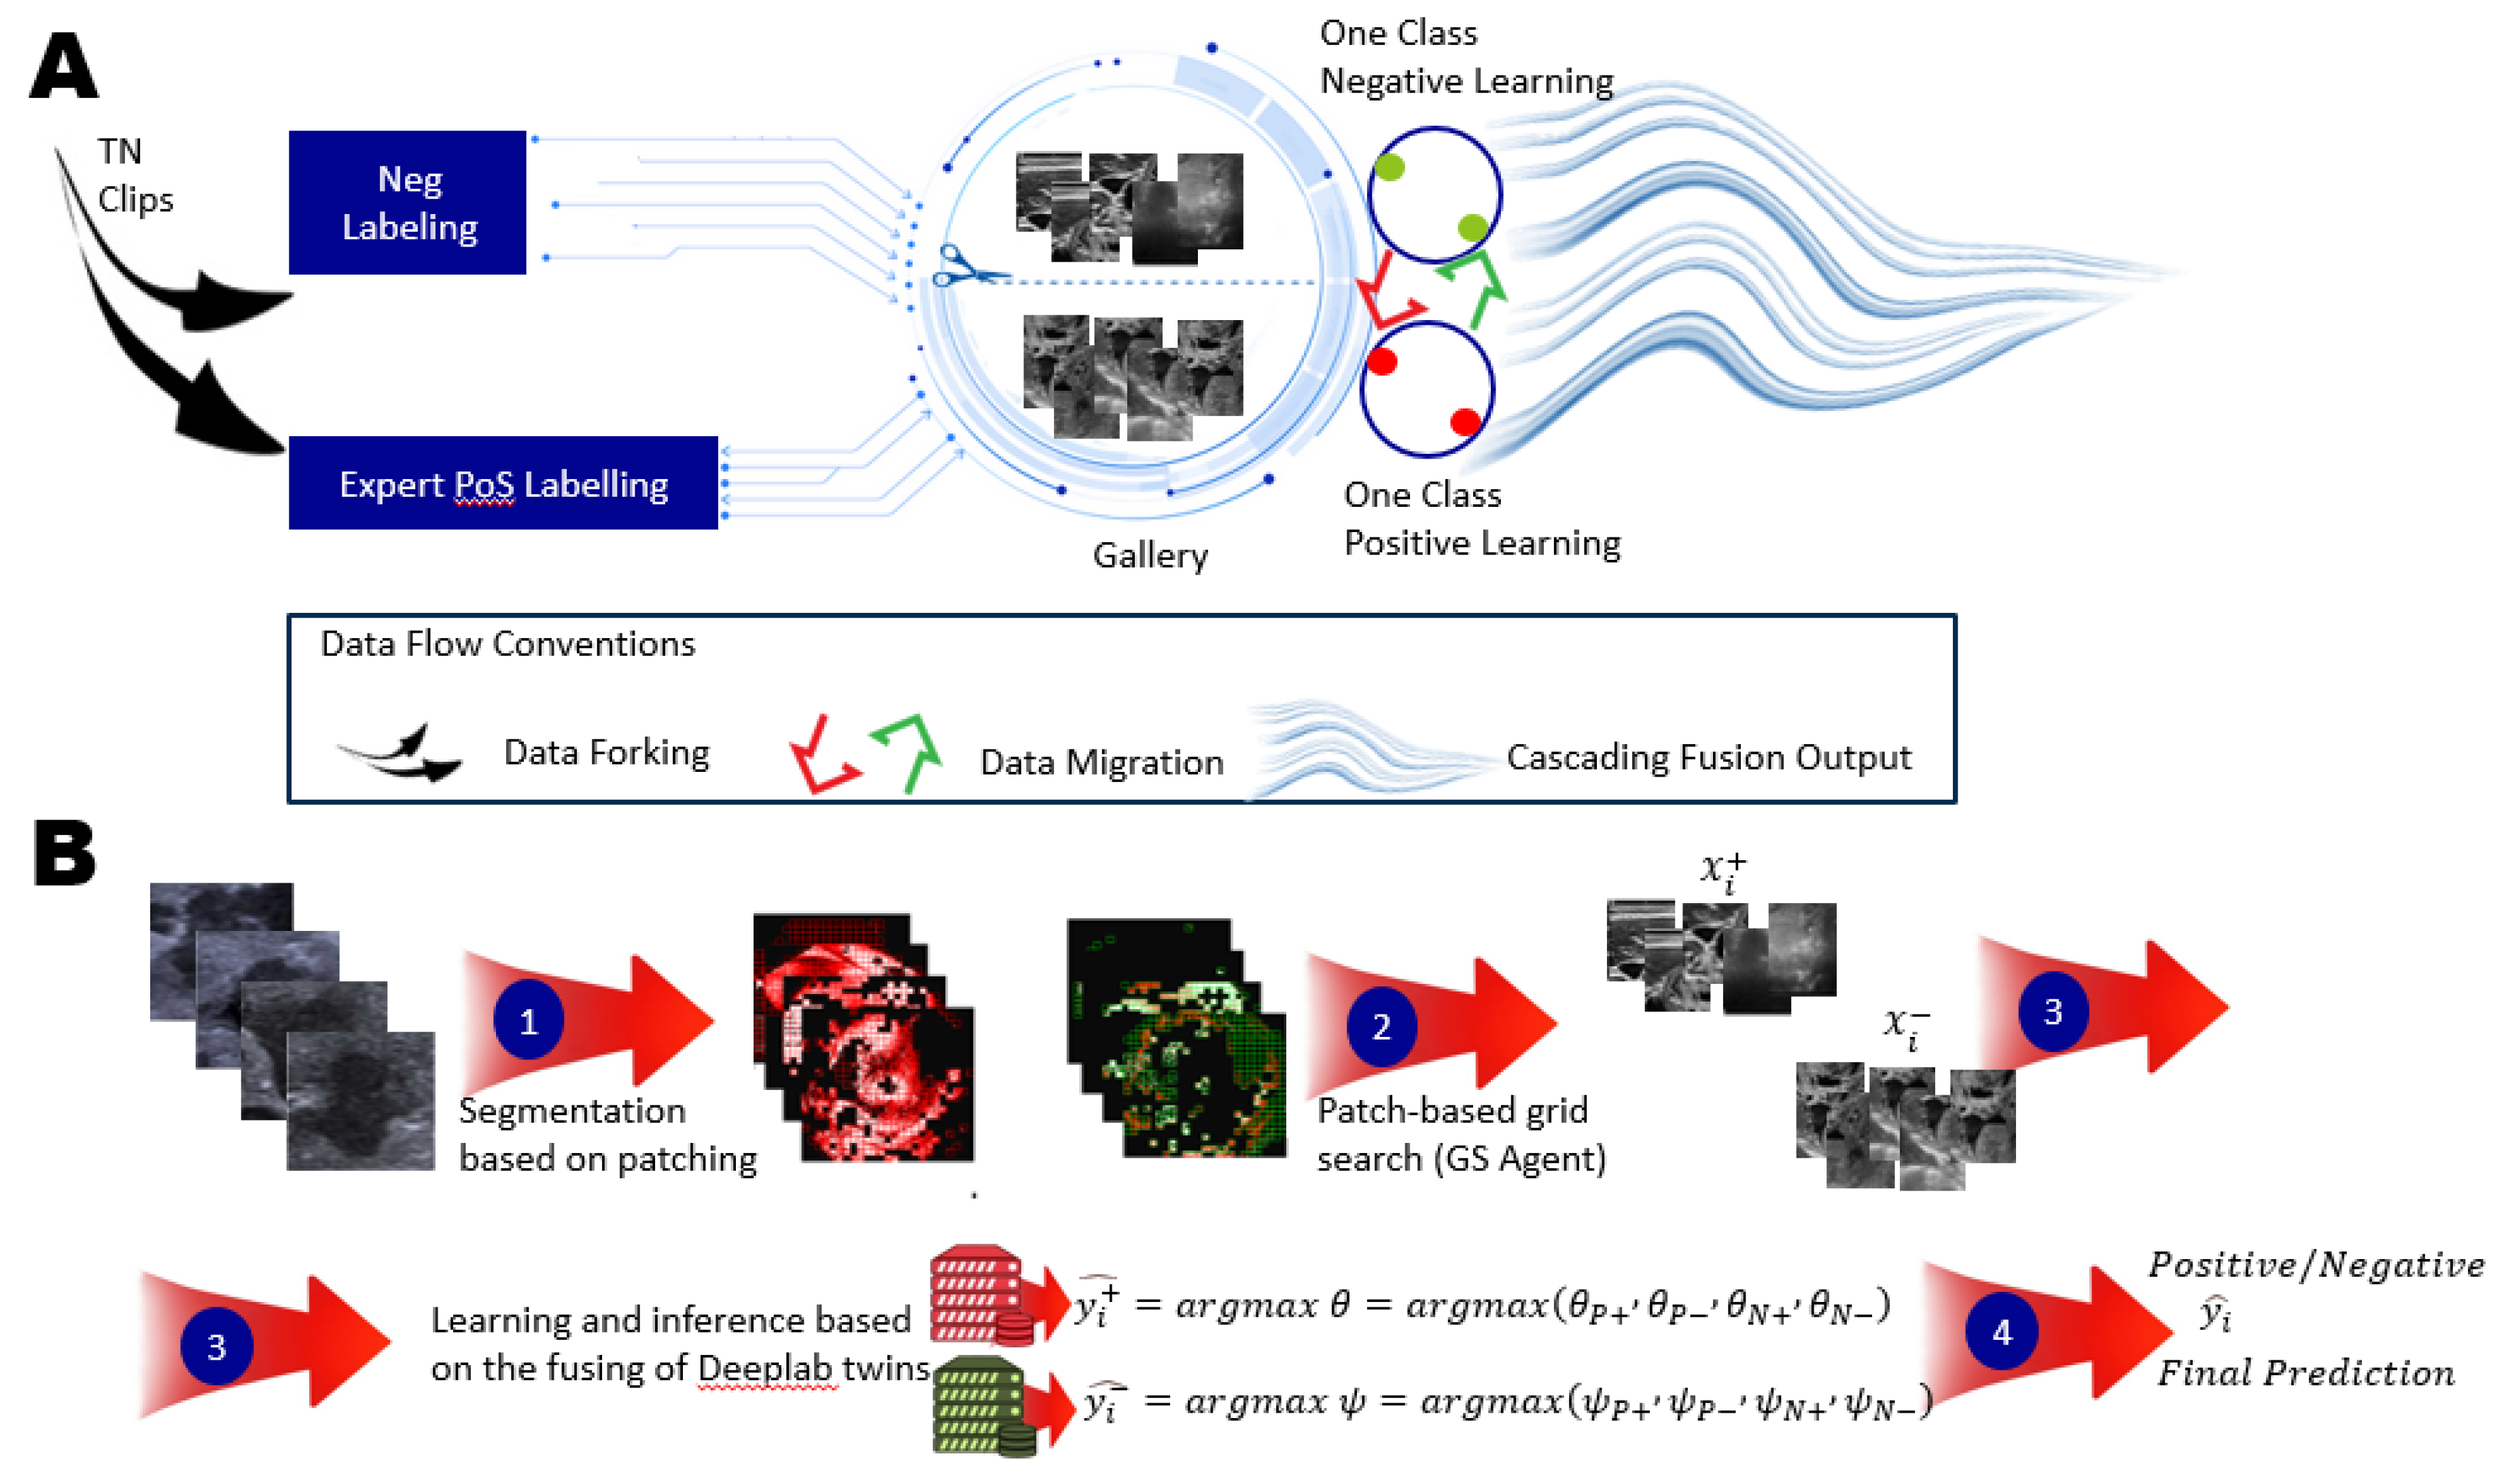
Figure 4.
Architecture of the OCX Model. A. The OCX model processes input data derived from the patch learning results, utilizing a grid search (GS) agent to optimize performance. This initial step involves pre-segmentation, ensuring that the data is accurately prepared for subsequent analysis. B. The architecture of two primary sub-models designed for parallel training of multi-modal data: the Positive-Only Learning (POL) model and the Negative-Only Learning (NOL) model. The first step incorporates data (denoted as Di) from the pre-segmentation phase, which is crucial for effective learning with di. Each sub-model is trained using specific datasets, enabling the network to learn distinct patterns associated with positive and negative instances. C. The output of the OCX model includes the probability estimates for four distinct modalities of TN lesions: TN-PTC (Thyroid Nodules - Papillary Thyroid Carcinoma), TN-FTC (Follicular Thyroid Carcinoma), TN-MTC (Medullary Thyroid Carcinoma), and TN-ATC (Anaplastic Thyroid Carcinoma). These modalities demonstrate significant performance improvements in the detection of TN lesions, underscoring the effectiveness of the dual learning framework.
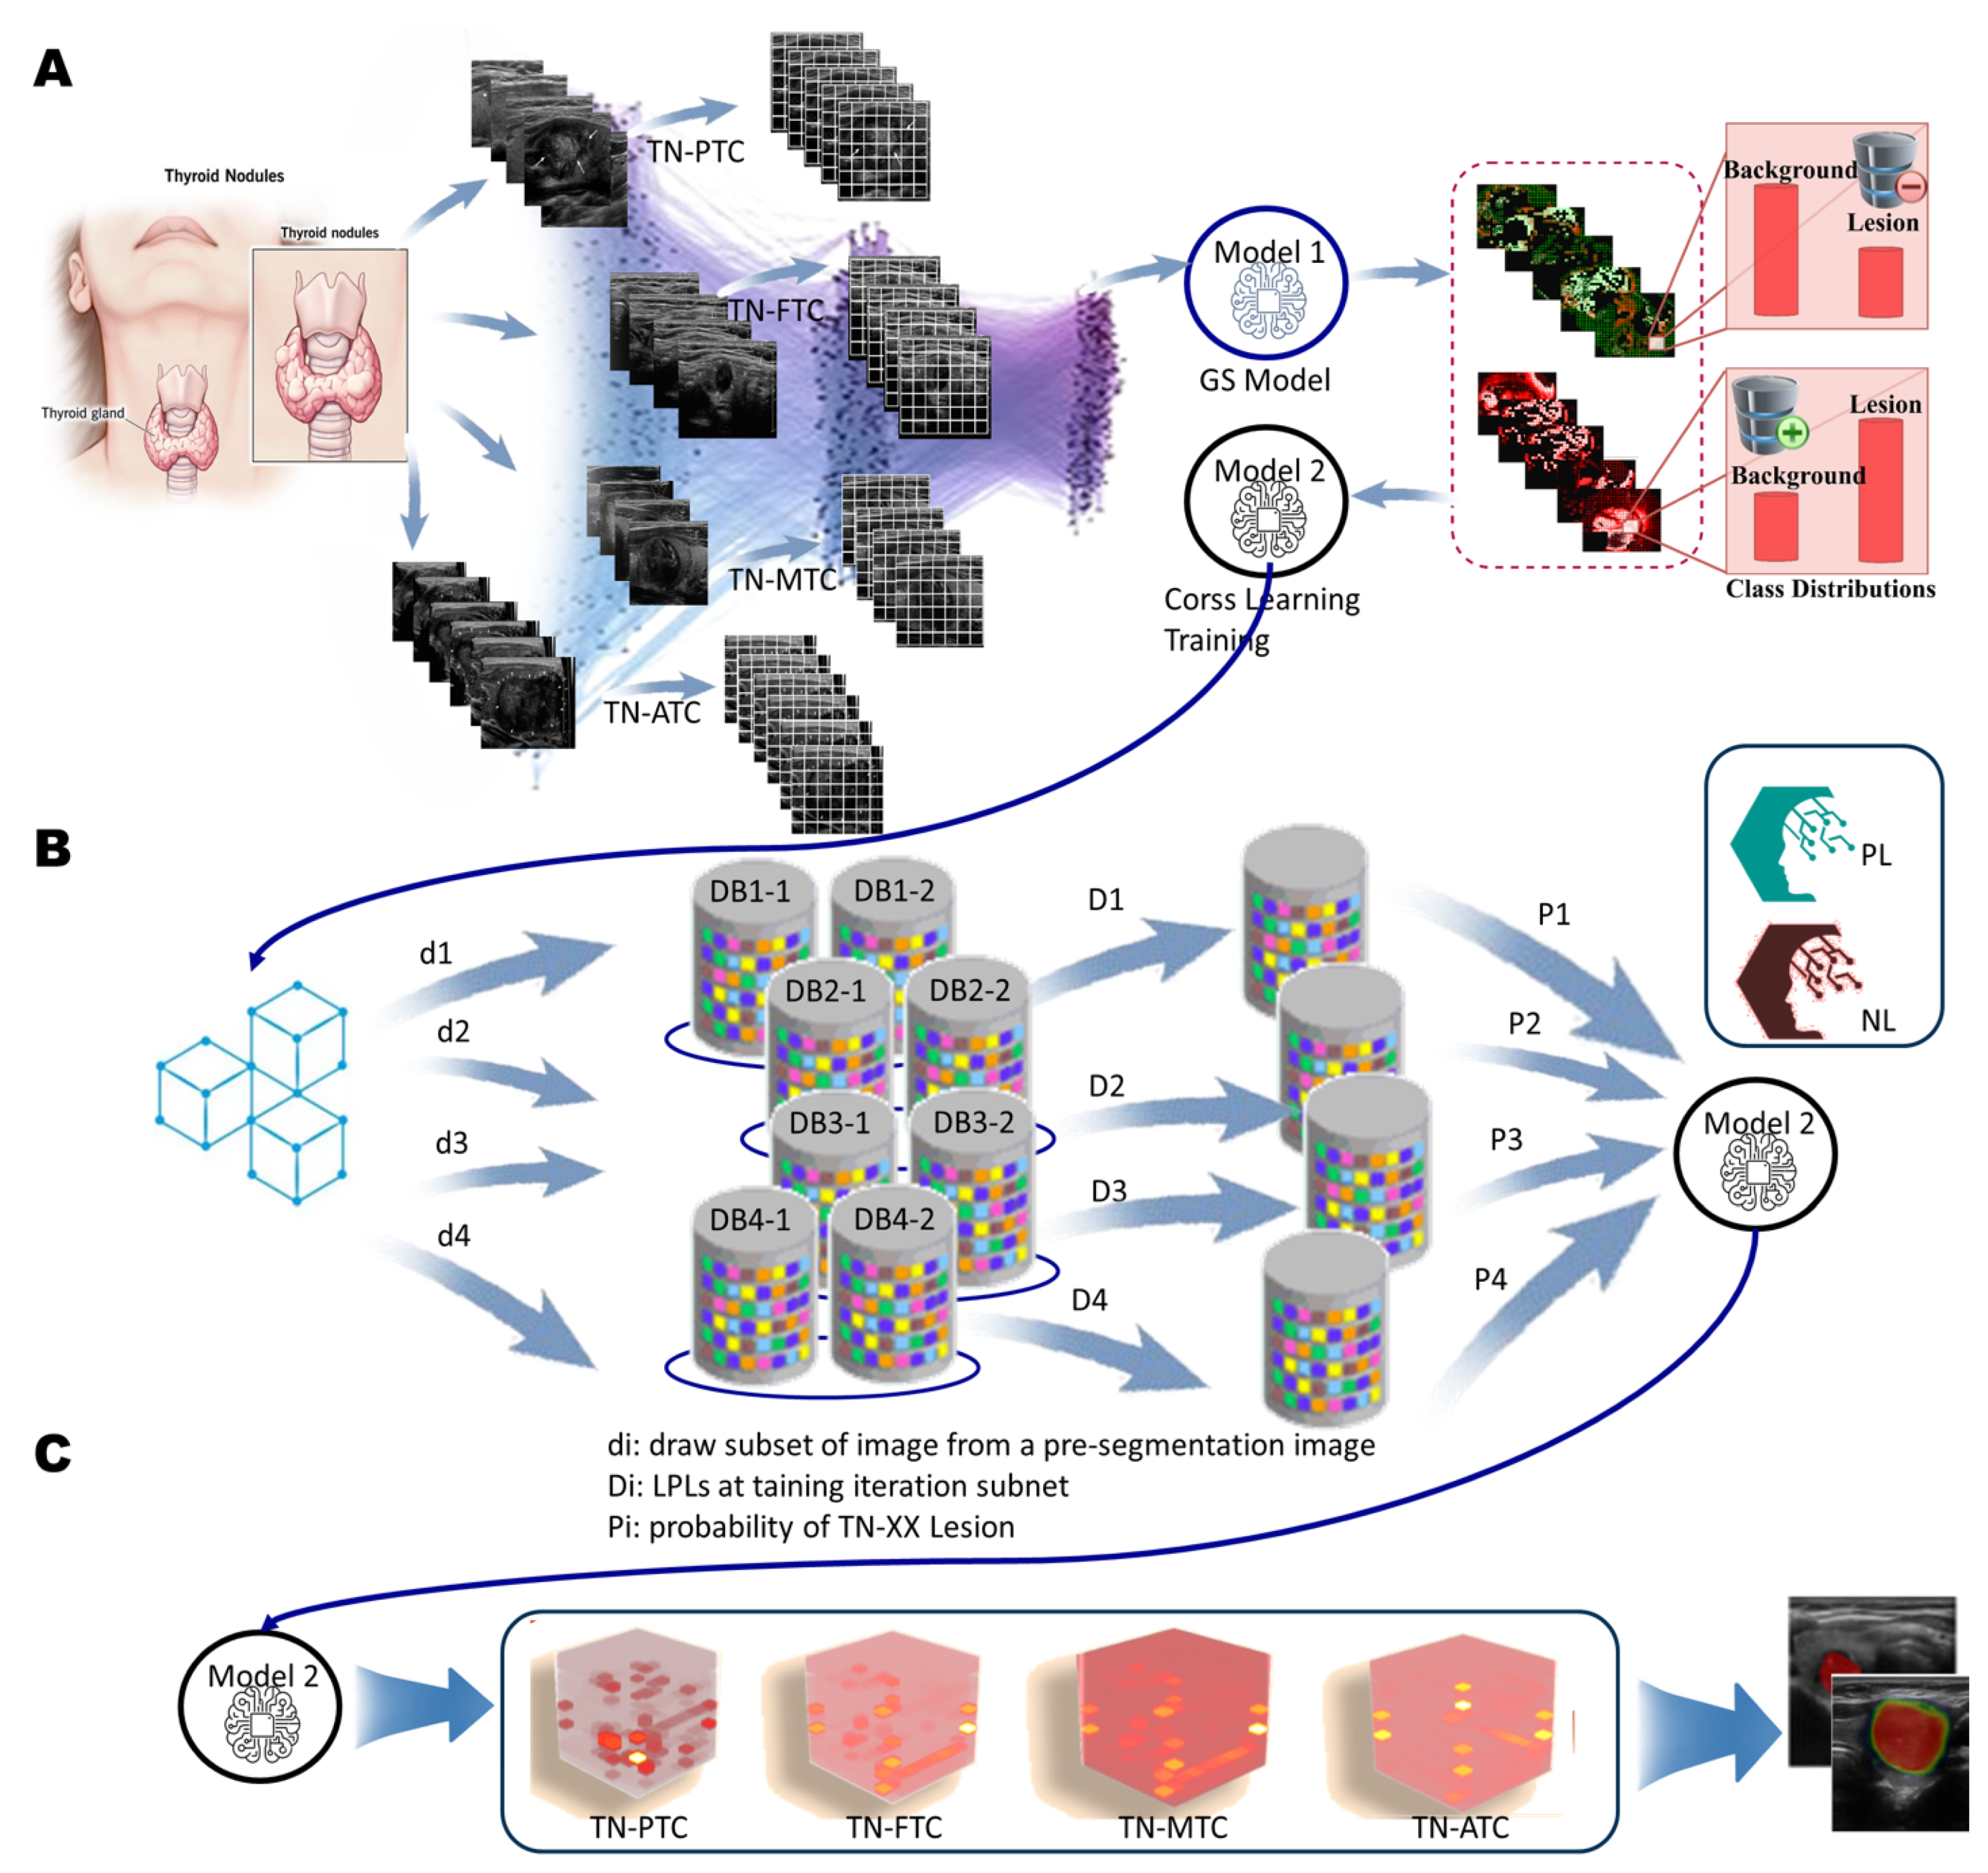
Figure 5.
In the experiment, cross learning from positive versus negative performance feedback, Representative examples of (a c) true positive (d f) false negative, (g h) false positive from the PL approach and (i l) false negative from the NL approach. Automatically generated thyroid nodules segmentations are shown as green lines while manual segmentations are shown in red, the green circle shows the area to be magnified for better visuals.
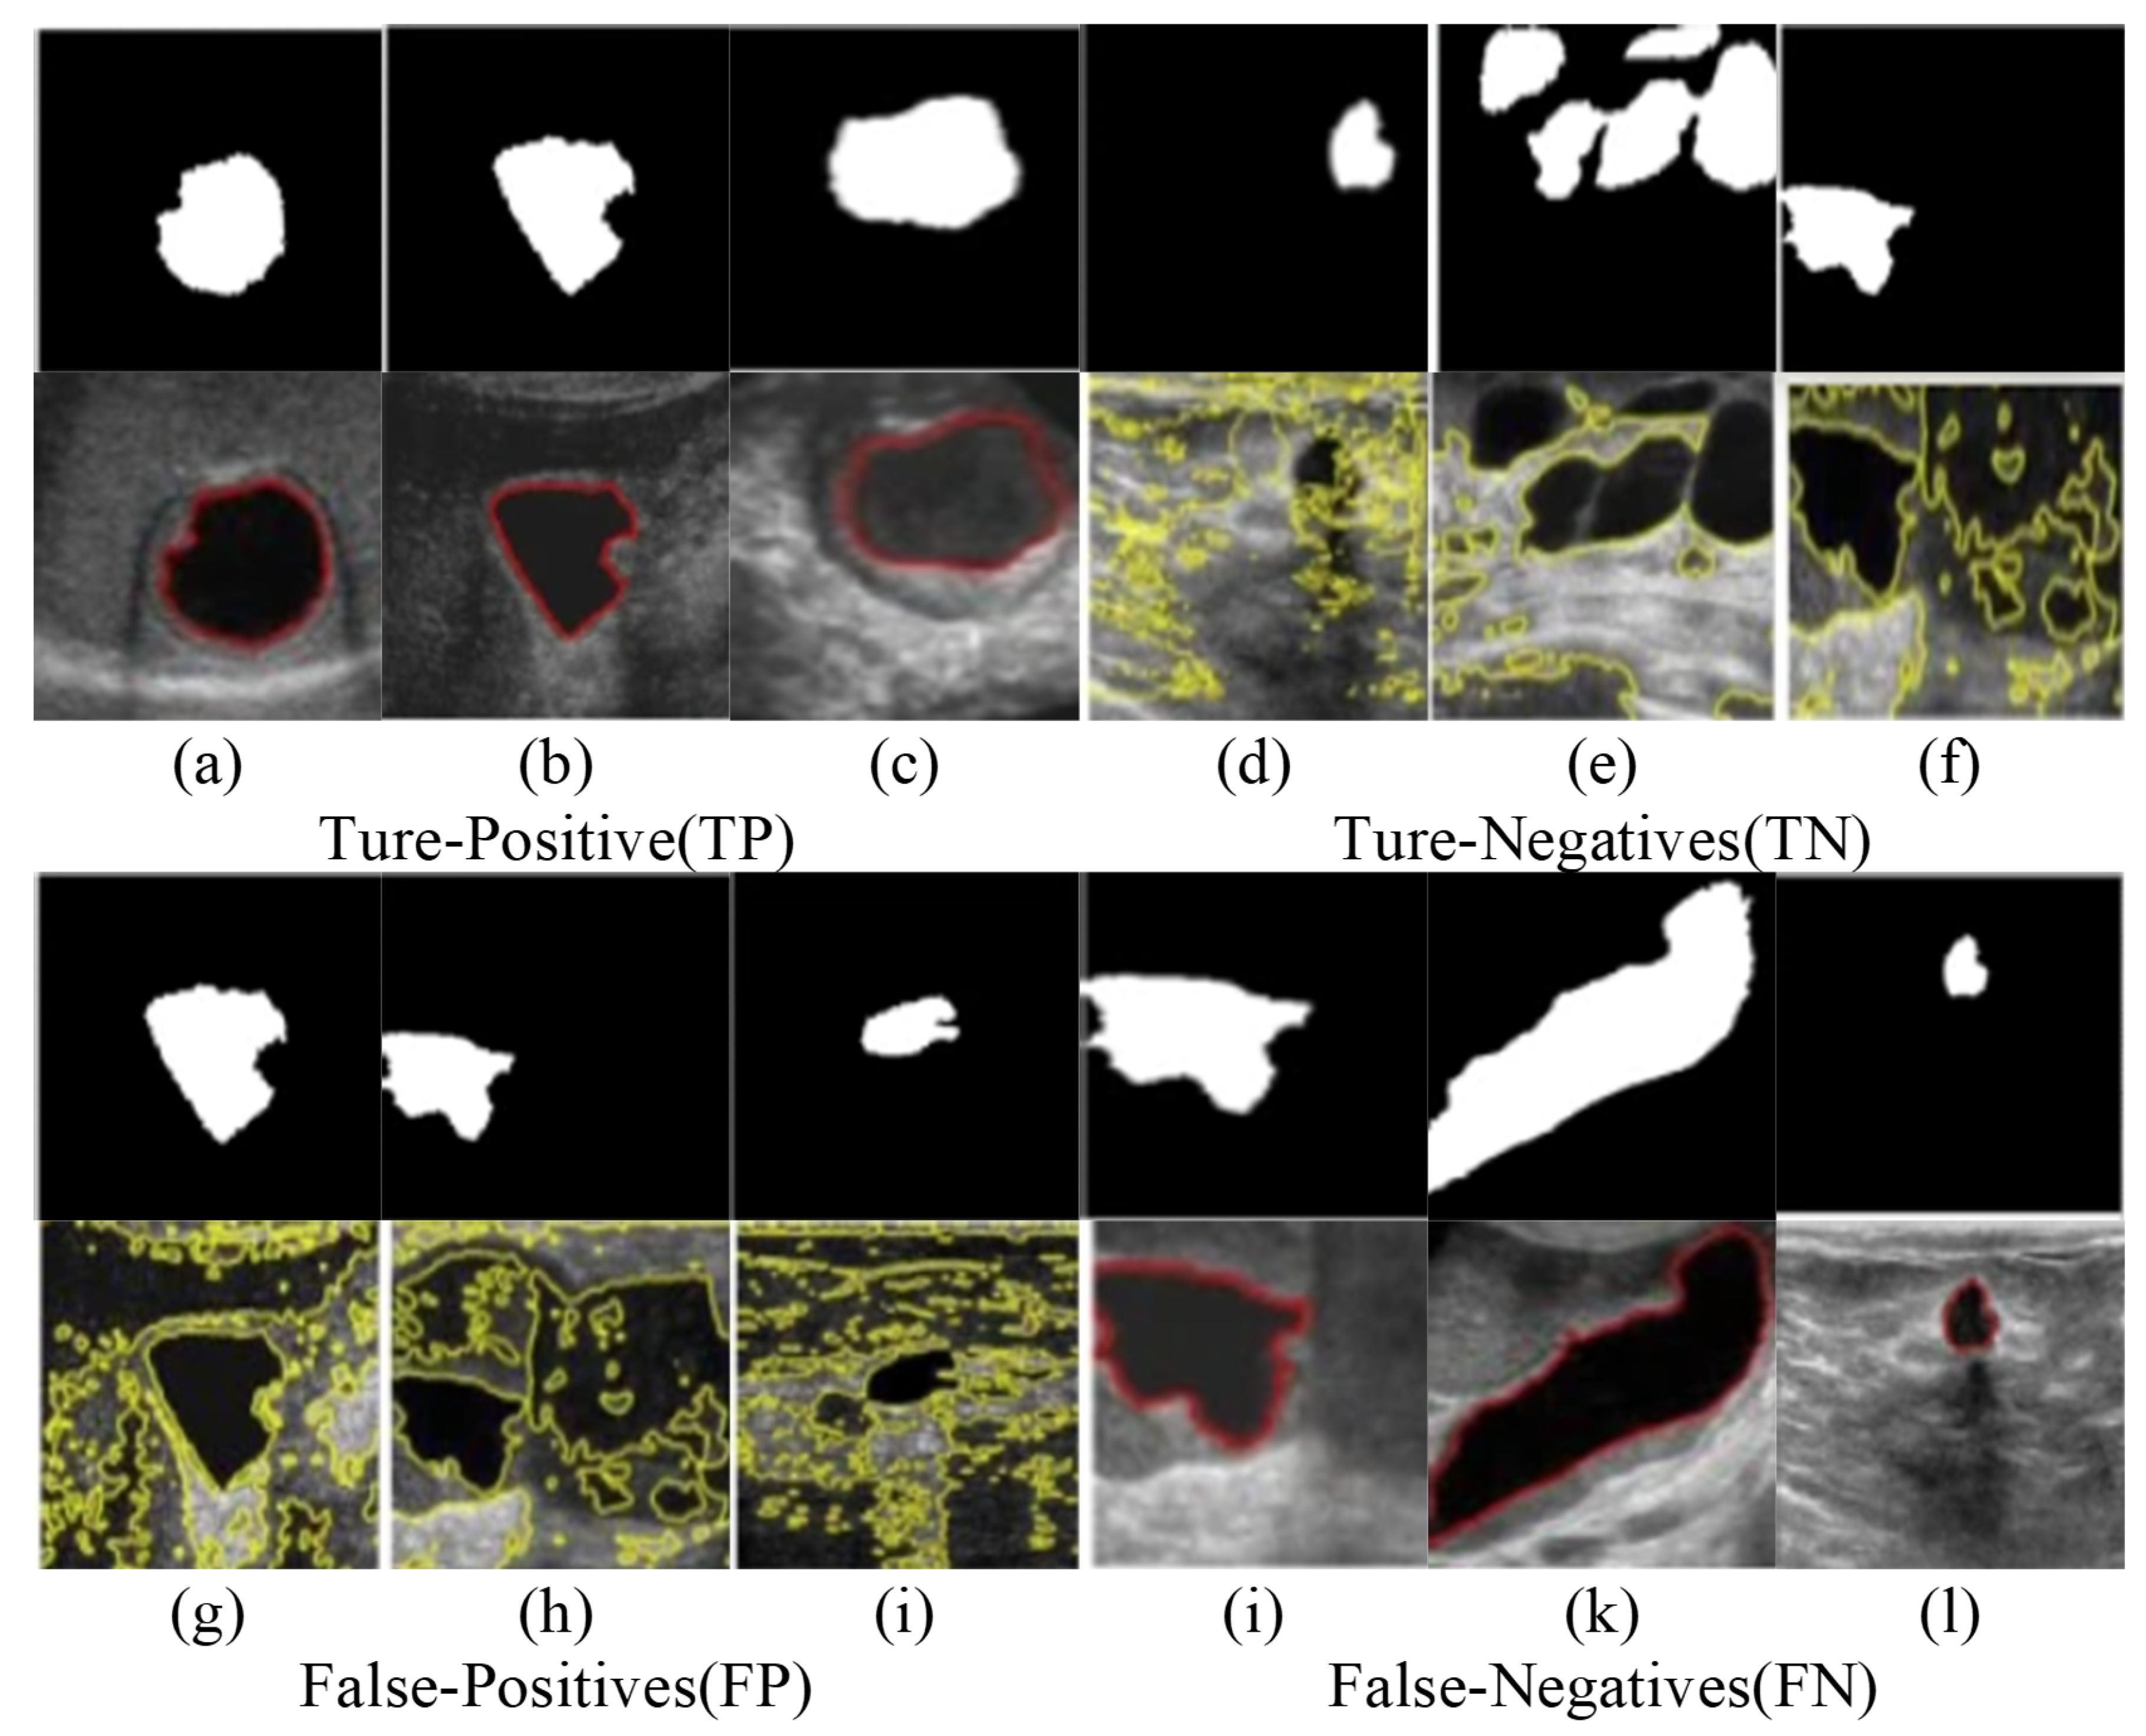

Table 1.
Detailed Parameters for the Three Implementations in Each Case of Ablative Study.
| FL-TN | TI-RADS | DDTI | ||||||
|---|---|---|---|---|---|---|---|---|
| im_idx | XLo | Xhi | im_idx | XLo | Xhi | im_idx | XLo | Xhi |
| 1 | 0.9658 | 0.9672 | 1 | 0.9623 | 0.9627 | 1 | 0.9594 | 0.9616 |
| 2 | 0.9612 | 0.9634 | 2 | 0.9626 | 0.9628 | 2 | 0.9504 | 0.9602 |
| 3 | 0.9549 | 0.9649 | 3 | 0.9640 | 0.9662 | 0.9503 | 0.9603 | |
| 4 | 0.9561 | 0.9613 | 4 | 0.9656 | 0.9658 | 3 | 0.9520 | 0.9590 |
| 5 | 0.9652 | 0.9670 | 5 | 0.9659 | 0.9661 | 0.9519 | 0.9591 | |
| 6 | 0.9599 | 0.9637 | 6 | 0.9648 | 0.9664 | 0.9518 | 0.9592 | |
| 7 | 0.9656 | 0.9662 | 7 | 0.9656 | 0.9660 | 4 | 0.9560 | 0.9580 |
| 8 | 0.9634 | 0.9650 | 8 | 0.9637 | 0.9649 | 5 | 0.9547 | 0.9583 |
| 9 | 0.9589 | 0.9633 | 9 | 0.9635 | 0.9647 | 6 | 0.9546 | 0.9594 |
| 10 | 0.9585 | 0.9683 | 10 | 0.9637 | 0.9649 | 0.9537 | 0.9603 | |
| 11 | 0.9607 | 0.9613 | 11 | 0.9639 | 0.9649 | 0.9536 | 0.9604 | |
| 12 | 0.9590 | 0.9678 | 12 | 0.9638 | 0.9648 | 7 | 0.9527 | 0.9561 |
| 13 | 0.9609 | 0.9663 | 13 | 0.9640 | 0.9646 | 8 | 0.9549 | 0.9579 |
| 14 | 0.9639 | 0.9669 | 14 | 0.9635 | 0.9647 | 9 | 0.9596 | 0.9598 |
| 15 | 0.9593 | 0.9635 | 15 | 0.9657 | 0.9663 | 0.9581 | 0.9613 | |
| 16 | 0.9599 | 0.9647 | 16 | 0.9656 | 0.9674 | 10 | 0.9560 | 0.9590 |
| 17 | 0.9646 | 0.9654 | 17 | 0.9629 | 0.9641 | 11 | 0.9572 | 0.9590 |
| 18 | 0.9661 | 0.9673 | 18 | 0.9633 | 0.9645 | 12 | 0.9571 | 0.9587 |
| 19 | 0.9583 | 0.9629 | 19 | 0.9628 | 0.9642 | 13 | 0.9577 | 0.9623 |
| 20 | 0.9624 | 0.9642 | 20 | 0.9632 | 0.9650 | 14 | 0.9560 | 0.9602 |
| - | - | - | - | - | - | 15 | 0.9566 | 0.9602 |
| - | - | - | - | - | - | 16 | 0.9562 | 0.9598 |
| - | - | - | - | - | - | 17 | 0.9563 | 0.9599 |
| - | - | - | - | - | - | 18 | 0.9558 | 0.9604 |
| - | - | - | - | - | - | 19 | 0.9552 | 0.9576 |
| - | - | - | - | - | - | 20 | 0.9566 | 0.9594 |
The threshold range for each dataset is defined by the average scores of and . 1 In , a greater number of images leads to more accurate parameter values, enabling us to derive the optimized parameter mean as the segmentation metric for the GS agent. 2 represents the lowest threshold, while denotes the highest cutting threshold. By examining the interval between these two thresholds, we can infer that the lesion area exhibits higher pixel values after removing image noise, indicating the presence of thyroid nodules with cystic, solid, or mixed characteristics. These nodules may contain fluid, small bubbles, or cystic cavities, which could result from fluid accumulation or necrotic tissue within the nodule. They often appear as hypoechoic areas on ultrasound examination. 3 Determining the optimal threshold is crucial for distinguishing normal tissue from pathological tissue, thereby highlighting areas of interest for further analysis.
Disclaimer/Publisher’s Note: The statements, opinions and data contained in all publications are solely those of the individual author(s) and contributor(s) and not of MDPI and/or the editor(s). MDPI and/or the editor(s) disclaim responsibility for any injury to people or property resulting from any ideas, methods, instructions or products referred to in the content. |
© 2025 by the authors. Licensee MDPI, Basel, Switzerland. This article is an open access article distributed under the terms and conditions of the Creative Commons Attribution (CC BY) license (http://creativecommons.org/licenses/by/4.0/).
Copyright: This open access article is published under a Creative Commons CC BY 4.0 license, which permit the free download, distribution, and reuse, provided that the author and preprint are cited in any reuse.


