1. Introduction
In recent years, the incidence of papillary thyroid carcinoma (PTC), the most common type of thyroid cancer, has been on the rise globally. Fine-needle aspiration cytology (FNAC) has become an essential preoperative diagnostic modality for PTC . However, the current diagnostic systems for PTC have limitations that can be addressed through the application of artificial intelligence (AI).
The Bethesda System for Reporting Thyroid Cytopathology (TBS) provides a standardized approach for interpreting FNAC results by categorizing them into six diagnostic categories based on the likelihood of malignancy. Nonetheless, the interpretation of TBS categories can be subjective, leading to interobserver variability, and there can be overlaps between categories. For instance, certain cytological findings may fall between categories such as "III. Atypia of Undetermined Significance (AUS)" and "IV. Suspicious for Malignancy (SFM)," which can lead to varying interpretations by different pathologists. Such subjectivity and category overlap are inherent limitations of TBS, which may hinder accurate and reliable assessment. Furthermore, TBS categories do not provide localized diagnostic information from digital pathology slides, which limits their ability to offer detailed insights into specific areas of the thyroid cell. The lack of regional specificity makes it challenging to assess the risk of malignancy (ROM) in different regions and this is crucial for making accurate diagnoses.
To overcome these limitations, our study proposes two deep learning diagnostic frameworks based on the convolutional neural network (CNN) and the multiple instance learning. The first proposed framework focuses on patch-level classification, utilizing a task-specific (thyroid cytopathology-specific) CNN architecture and is designed to accurately train cytopathological features indicative of localized thyroid cancer, enabling the model to capture critical patterns related to malignancy. The second one leverages an attention-based deep multiple instance learning (AD-MIL) approach, combining a feature extractor based on the same CNN structure with an attention mechanism. This allows the model to effectively integrate information from small patch-level regions and aggregate these features into higher-level predictions for larger, contextual regions, referred to as "bag-level" predictions. By expanding predictions from smaller to larger regions, this increases the diagnostic coverage, enabling more comprehensive and accurate identification of malignant areas within the thyroid cytopathological slides. This hierarchical approach ensures precise diagnosis across varying spatial resolutions, addressing critical challenges in clinical assessment. To evaluate the performance of our proposed frameworks, we utilize various metrics such as recall, precision, F1-score, accuracy, area under the curve (AUC), and average precision (AP). Additionally, we employ techniques such as the confusion matrix, classification report. And, to analyze the results and identify the strengths and weaknesses of our models, we show intuitive uncertainty analysis and visualizations of Grad-CAM and attention score map.
By leveraging AI and deep learning in cytopathological slides, our study addresses the critical limitations of traditional diagnostic methods, such as the subjectivity and interobserver variability inherent in the TBS, by introducing two innovative deep learning frameworks and approaches of understanding outputs. Our approaches not only enhance the accuracy of localized malignancy detection but also expand scalable, contextual insights at larger diagnostic levels. The integration of explainability tools like Grad-CAM and uncertainty measurements further ensures reliability and high availability in model predictions, making these frameworks highly adaptable in clinical practice.
This paper is organized as follows: In Section.
Section 2, we provide a comprehensive overview of related works in the domain of thyroid cancer diagnosis using deep learning, highlighting key advancements and methodologies. Section.
Section 3 expounds upon the dataset utilized for our study, outlining the process of patch generation and image pre-processing. Subsequently, Section.
Section 4 provides a thorough exposition of both the CNN-based approach and the application of the AD-MIL framework to our task. The experimental framework is outlined in Section.
Section 5, where we detail the selection of loss functions, experimental settings and metrics chosen for evaluating the performance of the proposed models. Following that, Section.
Section 6 shows the empirical results, presenting a exhaustive assessment of the performance of models through cross-validation, accompanied by the visualization of confusion matrices, ROC curves, and PR curves. In addition, it introduces the simple uncertainty analysis of the prediction outputs generated by our proposed models and visualizes important areas in images using Grad-CAM and attention scores. In Section.
Section 7, we engage in discussion, interpreting the implications of our findings, addressing potential limitations, and highlighting avenues for future research. Section.
Section 8 encapsulates our study with a concise conclusion, summarizing the contributions of our work in the context of image classification on thyroid cytopathology.
2. Related Works
In the realm of thyroid cancer and lesions analysis, conventional methods using numerical features and parameters have been extensively employed in previous research. Frasoldati et al. [
1] proposed the diagnostic role of computer-assisted image analysis in the presurgical assessment of thyroid follicular neoplasms. It involved the analysis of cellular features, such as ploidy histogram, proliferation index, nuclear area coefficient of variation, and anisocariosis ratio, to distinguish between benign and malignant nodules. Similarly, Gupta et al. [
2] aimed to distinguish papillary and follicular neoplasms of the thyroid. They analyzed 60 cases using quantitative subvisual nuclear parameters with an image analysis system. Murata et al. [
3] analyzed chromatin texture to detect malignancy in aspiration biopsy cytology, while Karslıoğlu et al. [
4] used statistical approaches to examine geometric nuclear features, providing insights into how subsets of extreme values can simulate the morphological examination process. Furthremore, Aiad et al. [
5] conducted an objective morphological analysis to differentiate between benign and malignant thyroid lesions using nuclear morphometric parameters. The results showed that quantitative measurements of nuclear parameters could accurately predict neoplastic nature in thyroid lesions. Other works, such as those by Tsantis et al. [
6] and Ozolek et al. [
7] introduced advanced classification schemes. [
6] used morphological and wavelet-based features to evaluate the malignancy risk of thyroid nodules in ultrasound images. And, [
7] utilized an optimal transport-based linear embedding and existing classification methods to distinguish between follicular lesions of the thyroid based on nuclear morphology. However, these methods rely on manual feature engineering and subjective interpretation, which can be time-consuming and prone to errors.
Thyroid image analysis using traditional methods was gradually evolved into an attempt to diagnose and classify cancer through machine learning-based image recognition. Daskalakisa et al. [
8] developed a multi-classifier for distinguishing between benign and malignant thyroid nodules using the k-nearest neighbor (KNN), the probabilistic neural network (PNN) and bayesian classifiers. The proposed system achieved a high classification accuracy of 95.7%. Wang et al. [
9] presented a method for detecting and classifying thyroid lesions, specifically follicular adenoma, follicular carcinoma, and normal thyroid, based on nuclear chromatin distribution in histological images. They utilized numerical features, a support vector machine (SVM), and a voting strategy to classify the nuclei sets. Gopinath et al. [
10] developed an diagnostic system for thyroid cancer diagnosis using FNAC images. The system used statistical texture features and a SVM classifier and achieved a diagnostic accuracy of 96.7%. Margari et al. [
11] explored the use of classification and regression trees (CARTs) for evaluating thyroid lesions. They constructed two CART models, one for predicting cytological diagnoses and the other for predicting histological diagnoses, based on contextual and cellular morphology features. Maleki et al. [
12] used the SVM to distinguish the classic PTC from noninvasive follicular thyroid neoplasm with papillary-like nuclear features and the encapsulated follicular variant of the papillary thyroid carcinoma. SVM successfully differentiated the classic PTC with 76.05% accuracy.
With the advancement of machine learning algorithms and computational power, deep learning has emerged as a powerful technique for automatic feature extraction and classification of pathological images. Deep learning can learn complex and high-level features from the images without requiring manual feature engineering. Convolutional neural network (CNN) is a type of deep learning model that is specifically designed for image analysis [
13,
14]. Several CNN-based models, such as VGG-16 [
15], ResNet [
16], and Inception [
17], have garnered significant attention due to their strong performance in image classification and feature extraction tasks. These models have revolutionized computer vision, laying the foundation for numerous studies, including the application of CNNs to histopathological and cytopathological images, where they effectively capture distinct cellular characteristics and pathologies [
18,
19,
20,
21,
22]. Kim et al. [
18] proposed a deep semantic mobile application designed for cytopathology, specifically for the diagnosis of thyroid lesions and diseases. The application utilized Random Forest (RF), Linear Support Vector Machines (SVM), K-nearest neighbor (KNN), and CNN for feature extraction and classification, and outperformed hand-engineered features. Sanyal et al. [
19] proposed the use of CNNs to differentiate PTC from non-PTC nodules using
pixel images from cytology smears. They demonstrated the accuracy of CNN-based thyroid cytopathological image analysis and potential applications in clinical practice. Moreover, Guan et al. [
20] utilized CNNs to differentiate between PTC and benign thyroid nodules using cytological images and achieved high accuracy rates of 97.66% and 92.75% for VGG-16 and Inception-v3, respectively. Wang et al. [
21] investigated the potential of CNNs to improve diagnostic efficiency and interobserver agreement in classifying thyroid nodules based on histopathological slides. VGG-19 model demonstrated successful classification of various thyroid carcinoma, achieving excellent diagnostic capability for malignant types with accuracy of 97.34%. Additionally, Elliott Range et al. [
22] developed a CNN-based machine learning algorithm (MLA) to analyze whole slide images of thyroid fine-needle aspiration biopsies (FNABs). The performance of the MLA in predicting thyroid malignancy was comparable to expert cytopathologists.
Analysis of thyroid cytopathological slides poses several challenges, such as high variability and complexity due to the size of the whole slide images, as well as the lack of sufficient and reliable labels. Patch-based methods have been employed to address these issues, where large high-resolution images are divided into smaller patches for efficient processing. This approach not only reduces computational overhead but also allows for a focus on local features, resulting in improved performance in tasks such as classification and detection [
21,
22,
23,
24,
25]. However, a major limitation of patch-based methods is the lack of patch-level labels. Since patch labels are often inferred from image-level annotations, this can introduce noise and ambiguity, reducing the overall reliability and precision of the analysis. Moreover, generating precise labels for every small patch is highly labor-intensive and time-consuming, making it impractical for large-scale datasets. To overcome these limitations, prominent directions have emerged in recent years, namely, weakly supervised learning (WSL) and multiple instance learning (MIL). WSL reduces the annotation effort by relying on less detailed patch-level labeling, such as bag-level or image-level labels, and leverages unlabeled data to enhance the model’s robustness and generalization capabilities. MIL is a type of the WSL that deals with data that are organized into bags of instances, where only the bag-level labels are available. This approach is particularly effective for capturing global context and integrating localized features into higher-order representations. This can handle the uncertainty and ambiguity of the labels, and identify the relevant patterns within the bags. In particular, attention-based MIL extends this concept by incorporating an attention mechanism, which learns the importance of each instance in a bag and aggregates them into a comprehensive bag-level feature representation [
26,
27,
28,
29,
30,
31].
Consequently, recent research has shown a growing interest in applying MIL to analysis of thyroid cytopathology, particularly for distinguishing between benign and malignant lesions [
32,
33,
34]. Dov et al. [
32] focused on preoperative prediction of thyroid cancer using ultra-high-resolution whole-slide cytopathology images. They proposed a CNN architecture that distinguishes between informative cytology regions and irrelevant background, training the model with both malignancy labels and TBS categories. They aggregated local estimates into a single prediction of thyroid malignancy, and simultaneously predicted thyroid malignancy and a diagnostic score assigned by a human expert. Similarly, Qiu et al. [
33] proposed a MIL framework using the attention mechanism with multi-scale feature fusion based on CNNs. The researchers utilized whole slide images and identified key areas for classification without the fine-label data. The method achieved a high accuracy of 93.2% on the thyroid cytopathological data and outperformed other existing methods. Dov et al. [
34] addressed machine-learning-based prediction of thyroid malignancy from cytopathological whole-slide images. They proposed a maximum likelihood estimation (MLE) framework and a two-stage deep-learning-based algorithm to handle the unique bag structure in cytopathology slides with sparsely located informative instances. The algorithm identified informative instances and incorporated them into global malignancy prediction. These research trends in analysis of thyroid cytopathological images advance the frontiers of medical diagnosis and enhance the clinical utility of deep learning-based tools.
3. Data
3.1. Data Collection and Preprocessing
We collect 187 whole slide images (WSIs) for classification with TBS categories [
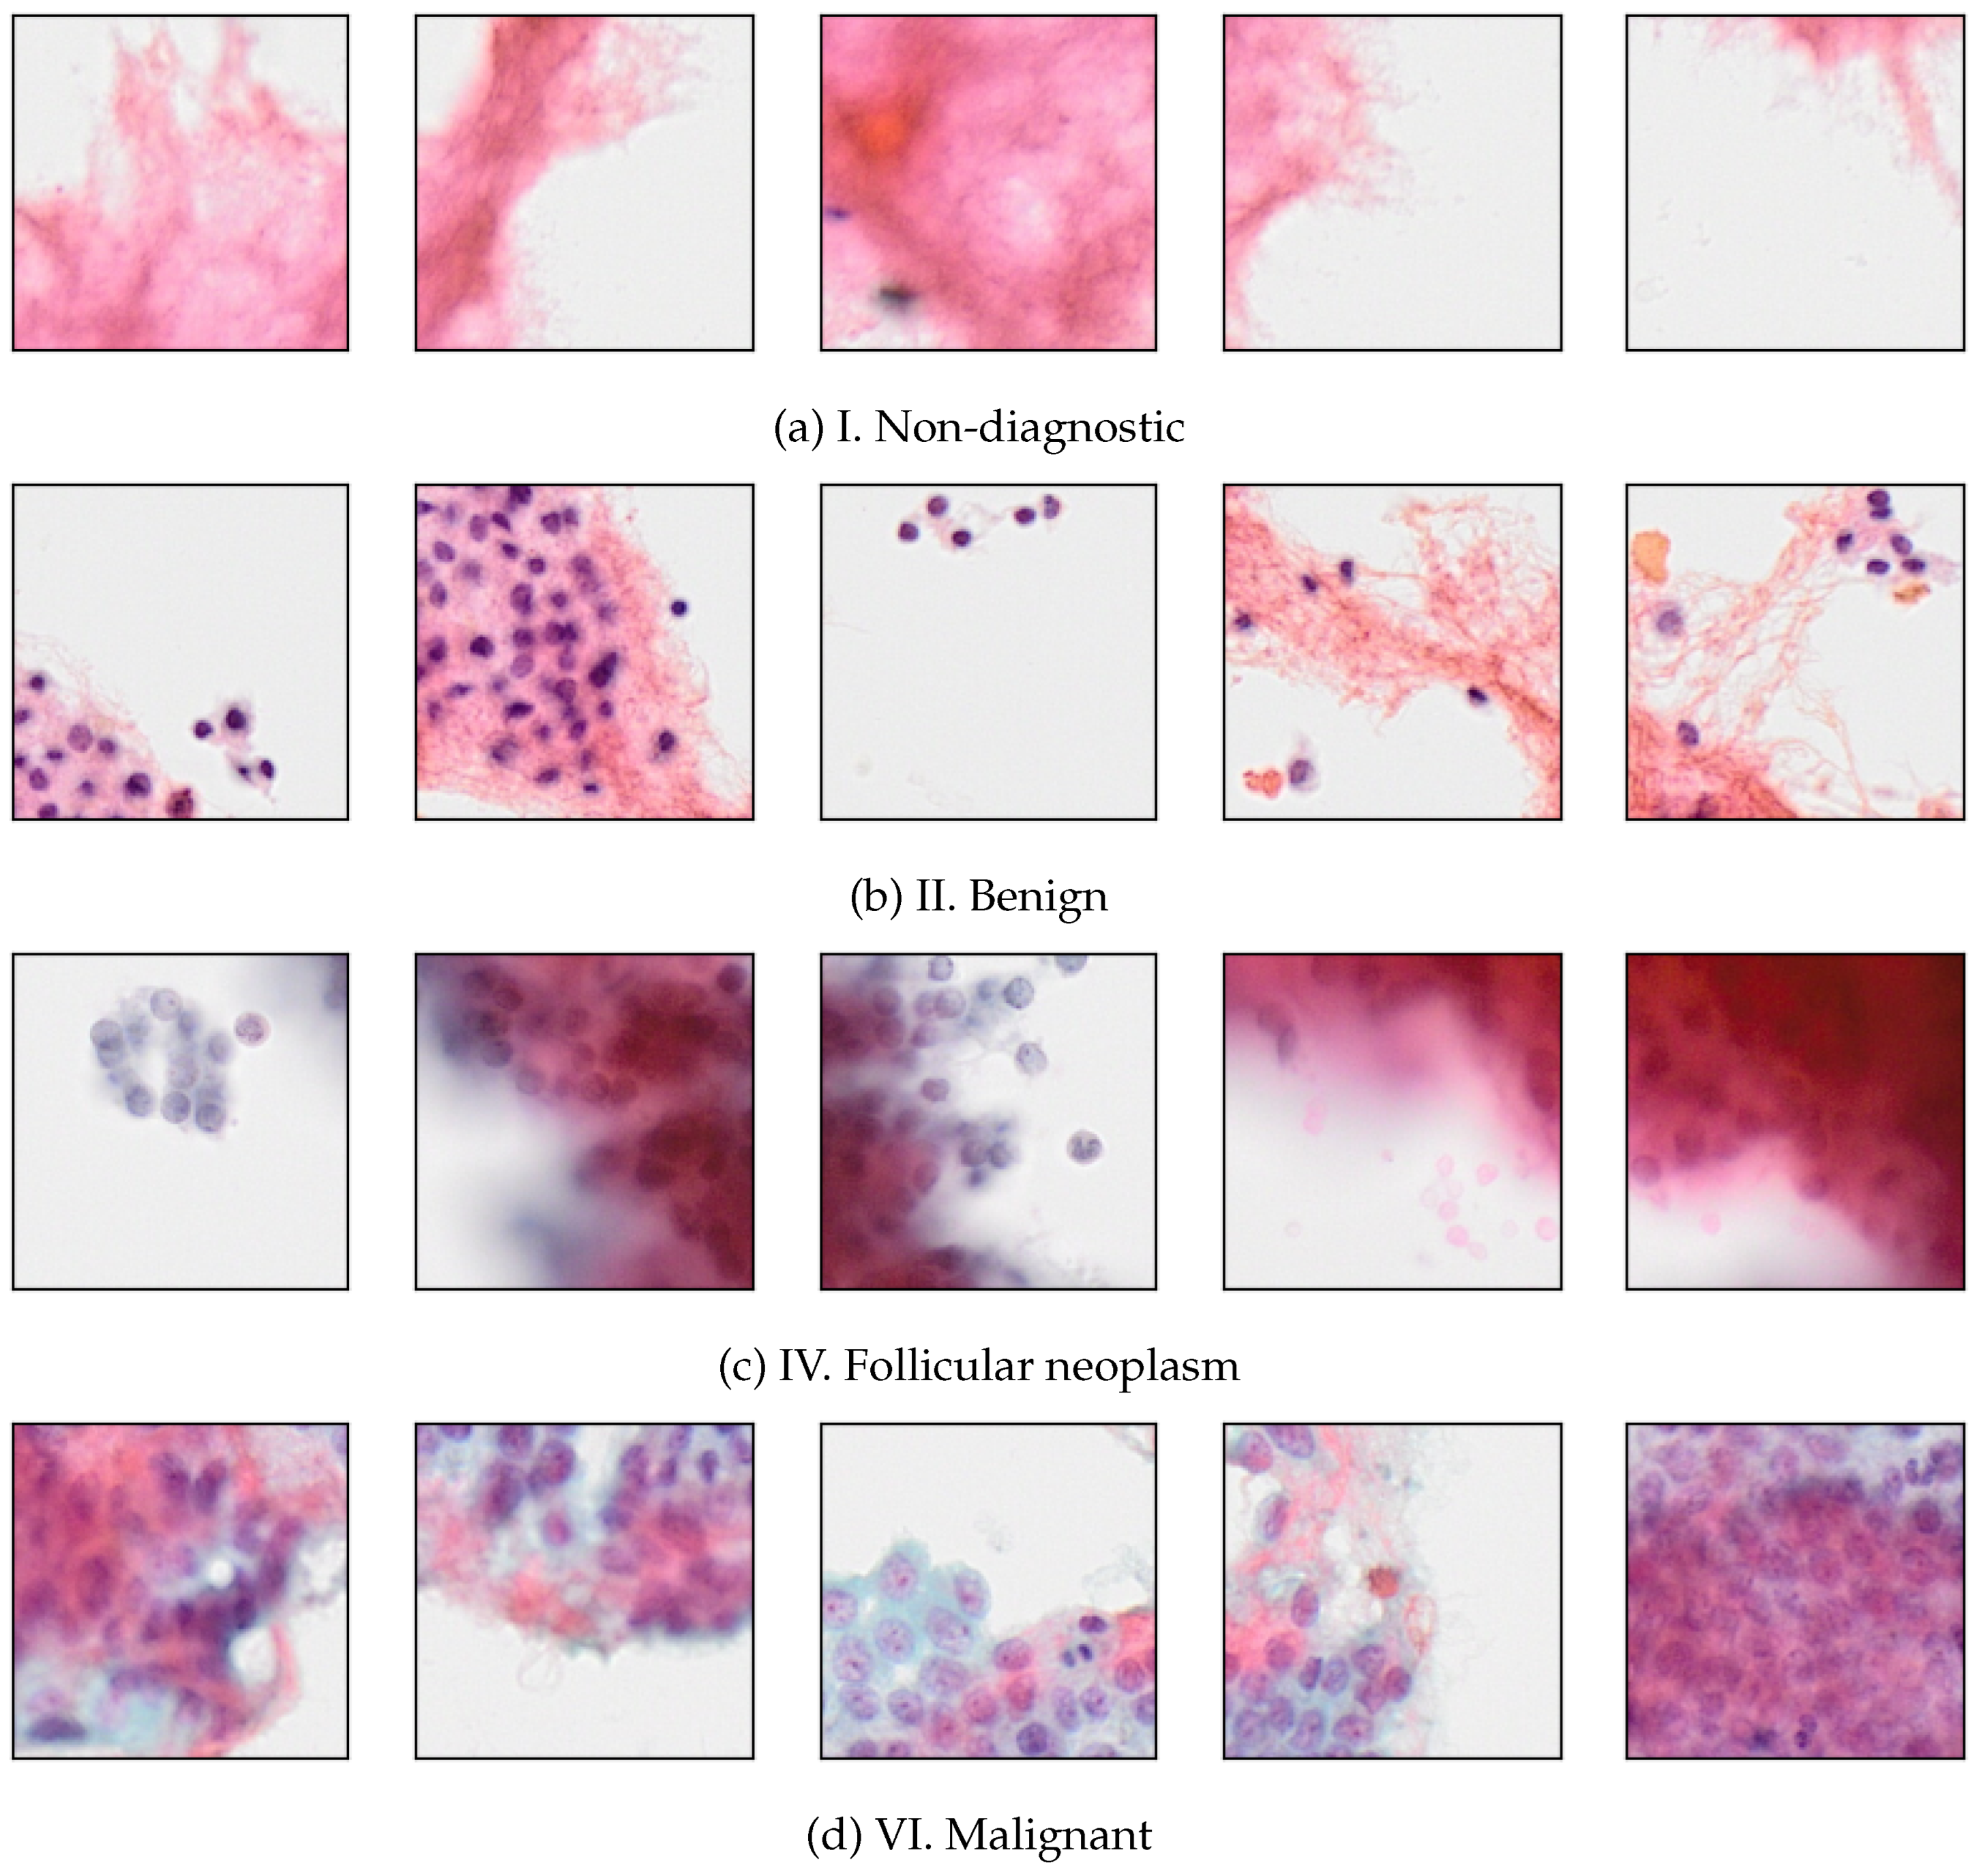
35]. The WSIs are obtained from Wonju Severance Christian Hospital and Seoul Severance Hospital and scanned using Olympus VS200 Digital Slide scanner (SlideView) at 20x magnification. They are stored in the Olympus VSI format and labeled by two expert pathologists. Of the 187 slides, those labeled as TBS categories III (Atypia of Undetermined Significance) and V (Suspicious for Malignancy) are excluded from our study due to their high subjectivity and diagnostic variability. The remaining 151 slides are classified into four types from TBS category: I. Insufficient for diagnosis, II. Benign, IV. Follicular neoplasm and VI. Malignant (Papillary carcinoma).
3.2. Patch Extraction and Filtering
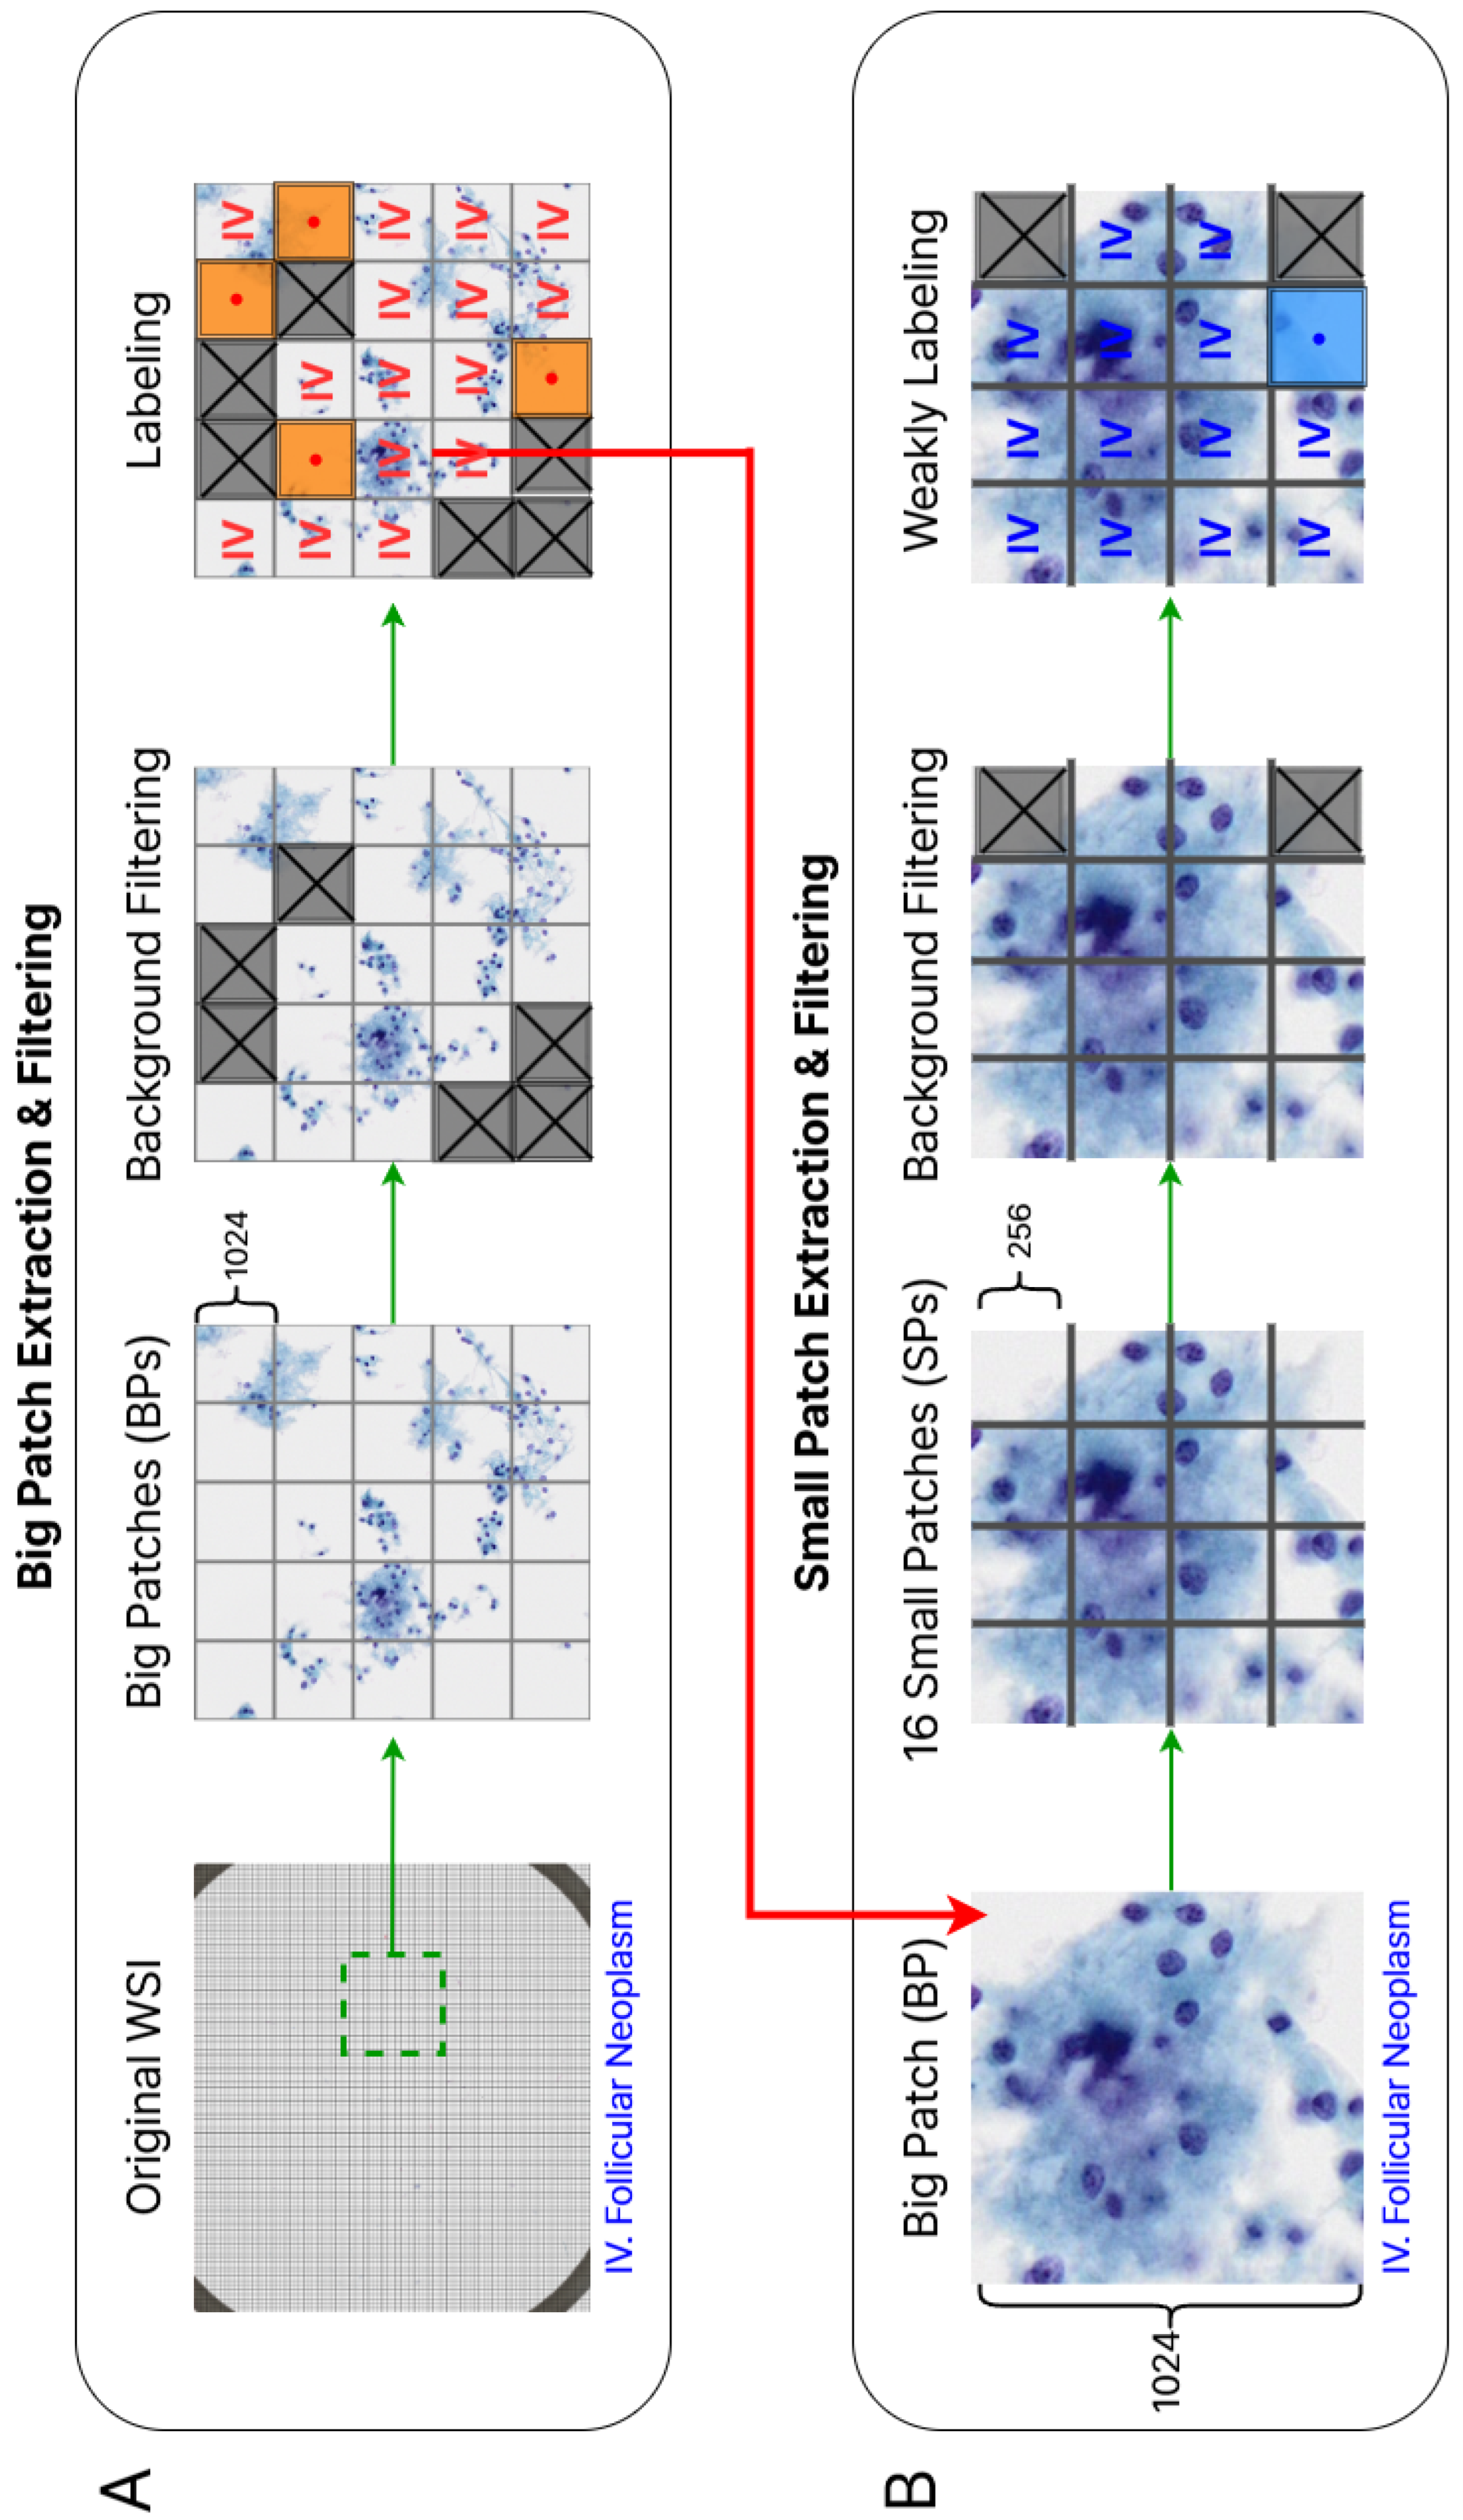
We create two patch-level dataset with different sizes, which we refer to as big patch(BP) and small patch(SP). The process of generating these datasets is described as follows (see also
Figure 1): A-1. We divide high-resolution WSIs into BP images with
size without overlapping.
A-2. For deleting the background BPs, we convert the BP images from BGR to RGB, followed by grayscale conversion, blurring, and binary thresholding by a threshold value of 127. We discard the patches that have a ratio of black pixels lower than in the binary image, as they are considered as background areas that do not contain cells.
A-3. The remaining BP images are reviewed by two cytopathologists and manually deleted if they are not consistent with the WSI-level label or belong to another category.
B-1. To reduce the computational cost during the training process, we split each BP image into 16 SP images with size.
B-2. We applied the same process of background patch removal as described in A-2.
B-3. We also manually remove some diagnostically irrelevant patches, such as those containing only pen marks or defects without any cellular structures. The remaining SPs are used for the deep learning experiment without any additional labeling.
The total number of BPs is
and the number of SPs is
. The label distributions for each category are shown in
Table 1 and
Table 2, respectively.
Figure 2 shows some samples of SPs for 4 Bethesda categories.
3.3. Dataset Partitioning and Normalization
We separate our dataset into a train and validation set with a ratio of by stratified sampling. The method improves model generalization across all classes and enables the capture of patterns even within infrequently occurring classes. The distribution of each class is preserved during dataset partitioning, ensuring similar class ratios within all sets. In the image preprocessing step, we simply convert the patch images into JPEG format, and then normalize them to values between 0 and 1.
4. Methodologies
This paper presents patch-level classifications of two types of datasets by a convolutional neural network (CNN) and an attention-based deep multiple instance learning (AD-MIL) architectures. Specifically, our custom CNN architecture, referred to as "Thyroid Cytopathology-specific CNN (TCS-CNN)", excels at classifying small patch images divided from cytological WSIs into 4 Bethesda categories. The TCS-CNN model is tailored for accurately identifying small regions of thyroid lesions and effectively discerning malignancy-related information, offering significant advantages in patch-level classification tasks.
4.1. SP Classifier Using TCS-CNN Architecture
Lack of accurate labels for SP images (
size) due to highly labor-intensive labeling, we assume them as having the same label as the BP images (
size). The SP dataset including the weakly annotated SP-level label is denoted as
where a small patch
and a weakly annotated label
for multi-class classification of PTC based on TBS categories.
refers the number of SP-level data
.
CNN is a type of neural network that possesses a specialized structure capable of extracting visual features from image data. It is characterized by its ability to perform convolutions, enabling it to capture local patterns and spatial relationships in the input image. To classify thyroid cytopathology images, employing CNNs presents notable advantages [
18,
19,
20,
21,
22]. We build a CNN-based classifier to distinguish the PTC into four categories.
Typically, a CNN is composed of elements such as convolutional layers, pooling layers, and fully connected layers. Convolutional layers apply filters (kernels) to input image with convolution operation, allowing them to extract local features and spatial patterns as a feature map. Pooling layers downsample the spatial dimensions of feature maps, effectively serving to mitigate overfitting, emphasize visual representations. Finally, fully connected layers establish inter-connections between neurons, enabling complex feature learning and multi-class classification.
Among the various convolution operation-based approaches explored, a lot of advanced architectures, such as residual blocks, inception blocks, and squeeze-and-excitation blocks, are implemented and evaluated through ablation studies to gain insights necessary for building networks specialized in accurately recognizing malignant thyroid cell structures. Incorporating those CNN variants into the Conv-Pool architecture does not result in any notable performance improvements, suggesting that such modifications may not be well-suited for this dataset or tasks. In contrast, simpler architectures, with standard convolution and pooling layers, achieve better performance. Specifically, configurations with 64 to 512 nodes per layer and 4 to 6 convolutional layers yield the stable performance on our SP dataset. In addition, we use both pooling techniques, max pooling and global average pooling (GAP). The max pooling layer following each convolutional layer extracts the maximum value within each polling region. In a similar way, the GAP layer computes the average of all elements in each feature map.
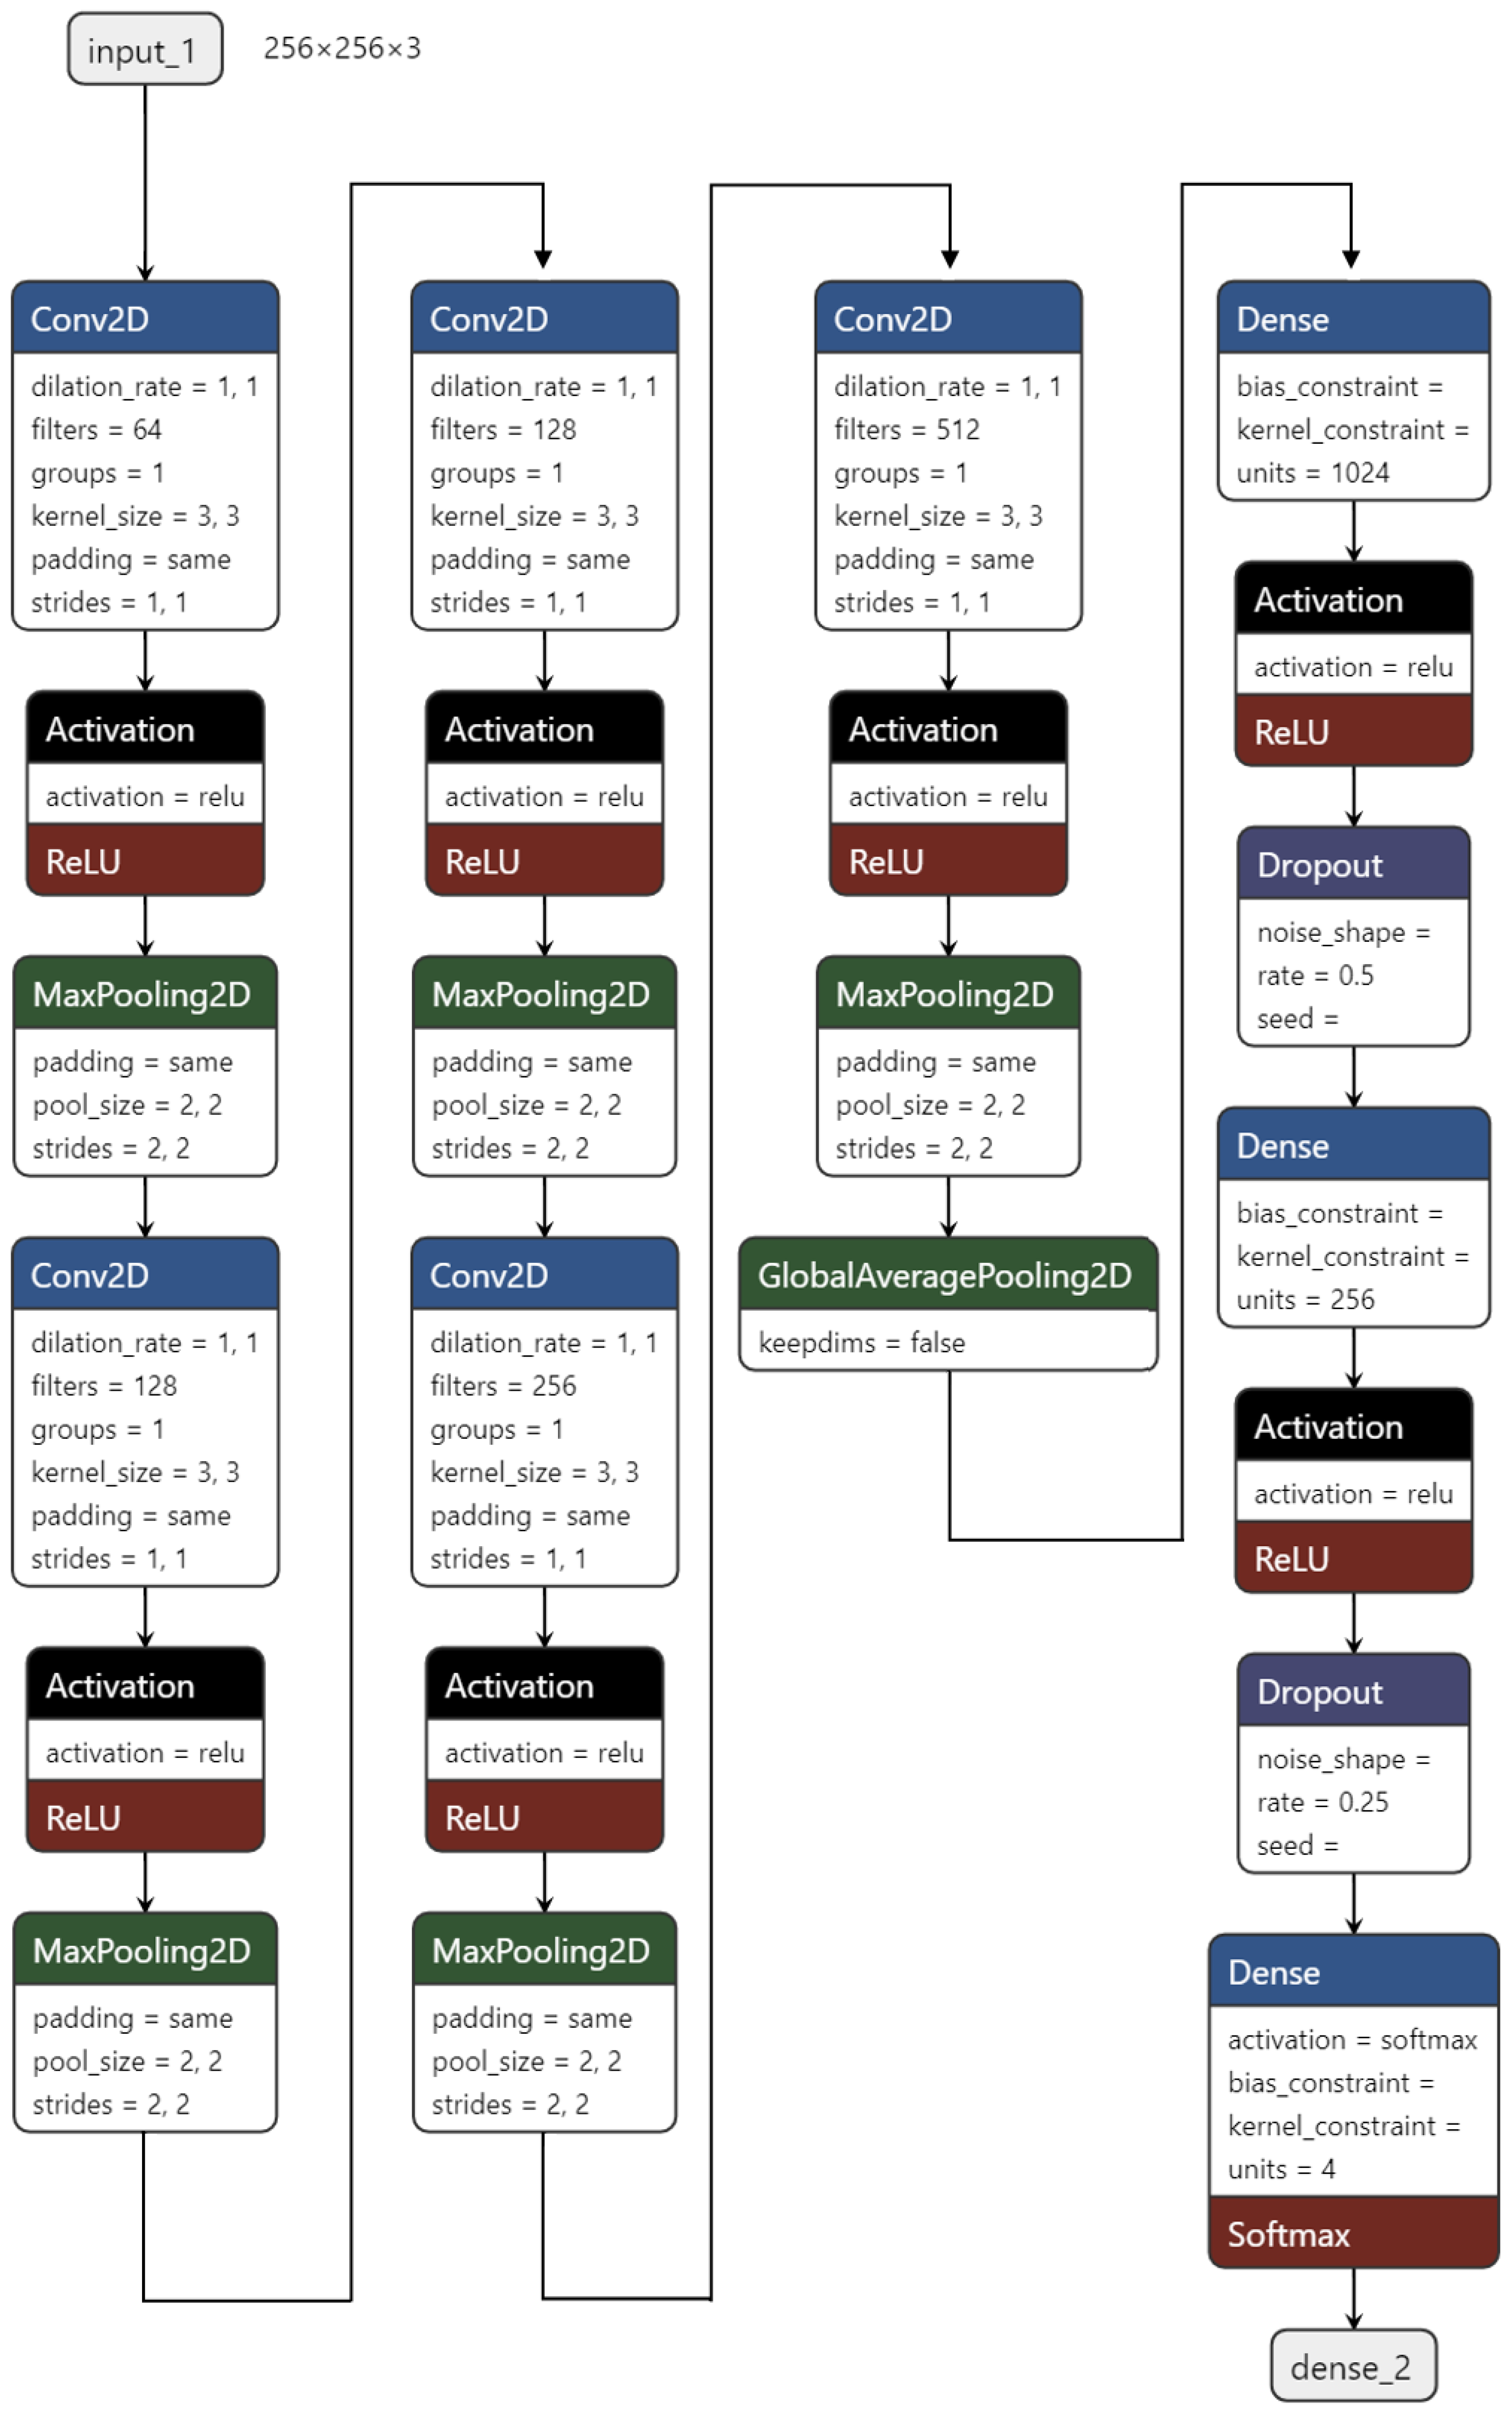
Finally, our TCS-CNN model consists of 5 convolutional layers, 5 max pooling layers, a global average pooling (GAP) layer, and 3 fully connected layers. The filter size in all convolutional layers is
. All the convolutional blocks contain a convolutional layer followed by ReLU activation function and a max-pooling layer. The two fully connected layers are used with the ReLU activation function. The last layer is a softmax layer for the multi-class classification task and it is given by
To prevent over-fitting, He initialization [
36] is applied to initiate all the trainable parameters in convolutional layers and fully connected layers and
regularization and Dropout regularization are utilized for the fully connected layers.
Within the TCS-CNN architecture, increasing/decreasing the number of layers or nodes generally leads to a decline in performance, indicating that the TCS-CNN structure is a well-balanced and simple design for this specific task. The detail architecture design of our proposed TCS-CNN is shown in
Figure 3 below.
4.2. BP Classifier Using AD-MIL
The weakly-labeled data used in Section.
Section 4.1 may lead to potential inaccuracy in the classification performance, either underestimating or overestimating it, thereby introducing biases into the model’s predictions. This issue arises because the SP images were generated by re-tiling each big patch into 16 smaller regions, and the category assigned to each SP was inherited from the corresponding a BP image (i.e., weakly annotated label). For instance, SP images that do not fully encompass the lesion area within the BP still retain the same label of the BP. This discrepancy may introduce noise into the training data, potentially affecting the model’s ability to train precise and localized patterns. Hence, we overcome this problem by adopting the multiple instance learning (MIL) to take the bag-level analysis using instance-level small patches.
In MIL, the dataset consists of bags and instances. The concept of a bag-level dataset in MIL involves aggregating instances into groups called bags, where the label assigned to the entire bag, rather than individual instance labels. The MIL aggregates each instance-level predictions into a bag-level decision. Firstly, instance-level embeddings are generated through a deep learning network, capturing meaningful features. Subsequently, a pooling operation combines these embeddings into a comprehensive bag-level representation, which encapsulates the essential elements latent in instances. In this process, we utilize the attention-based deep multiple instance learning (AD-MIL) to which the attention mechanism [
29,
37,
38] is applied in the pooling operation. In AD-MIL, the bag-level feature is calculated from the weighted average of instance embeddings, where the weights reflect the importance of each instance obtained by the attention mechanism. It enables the model to de-emphasize less important ones, thereby effectively capturing the relationships between instances. The bag-level representation is fed into a classifier, such as a neural network. The network is trained by iteratively adjusting the parameters, which are shared across multiple inputs, to minimize prediction errors using bag-level labels.
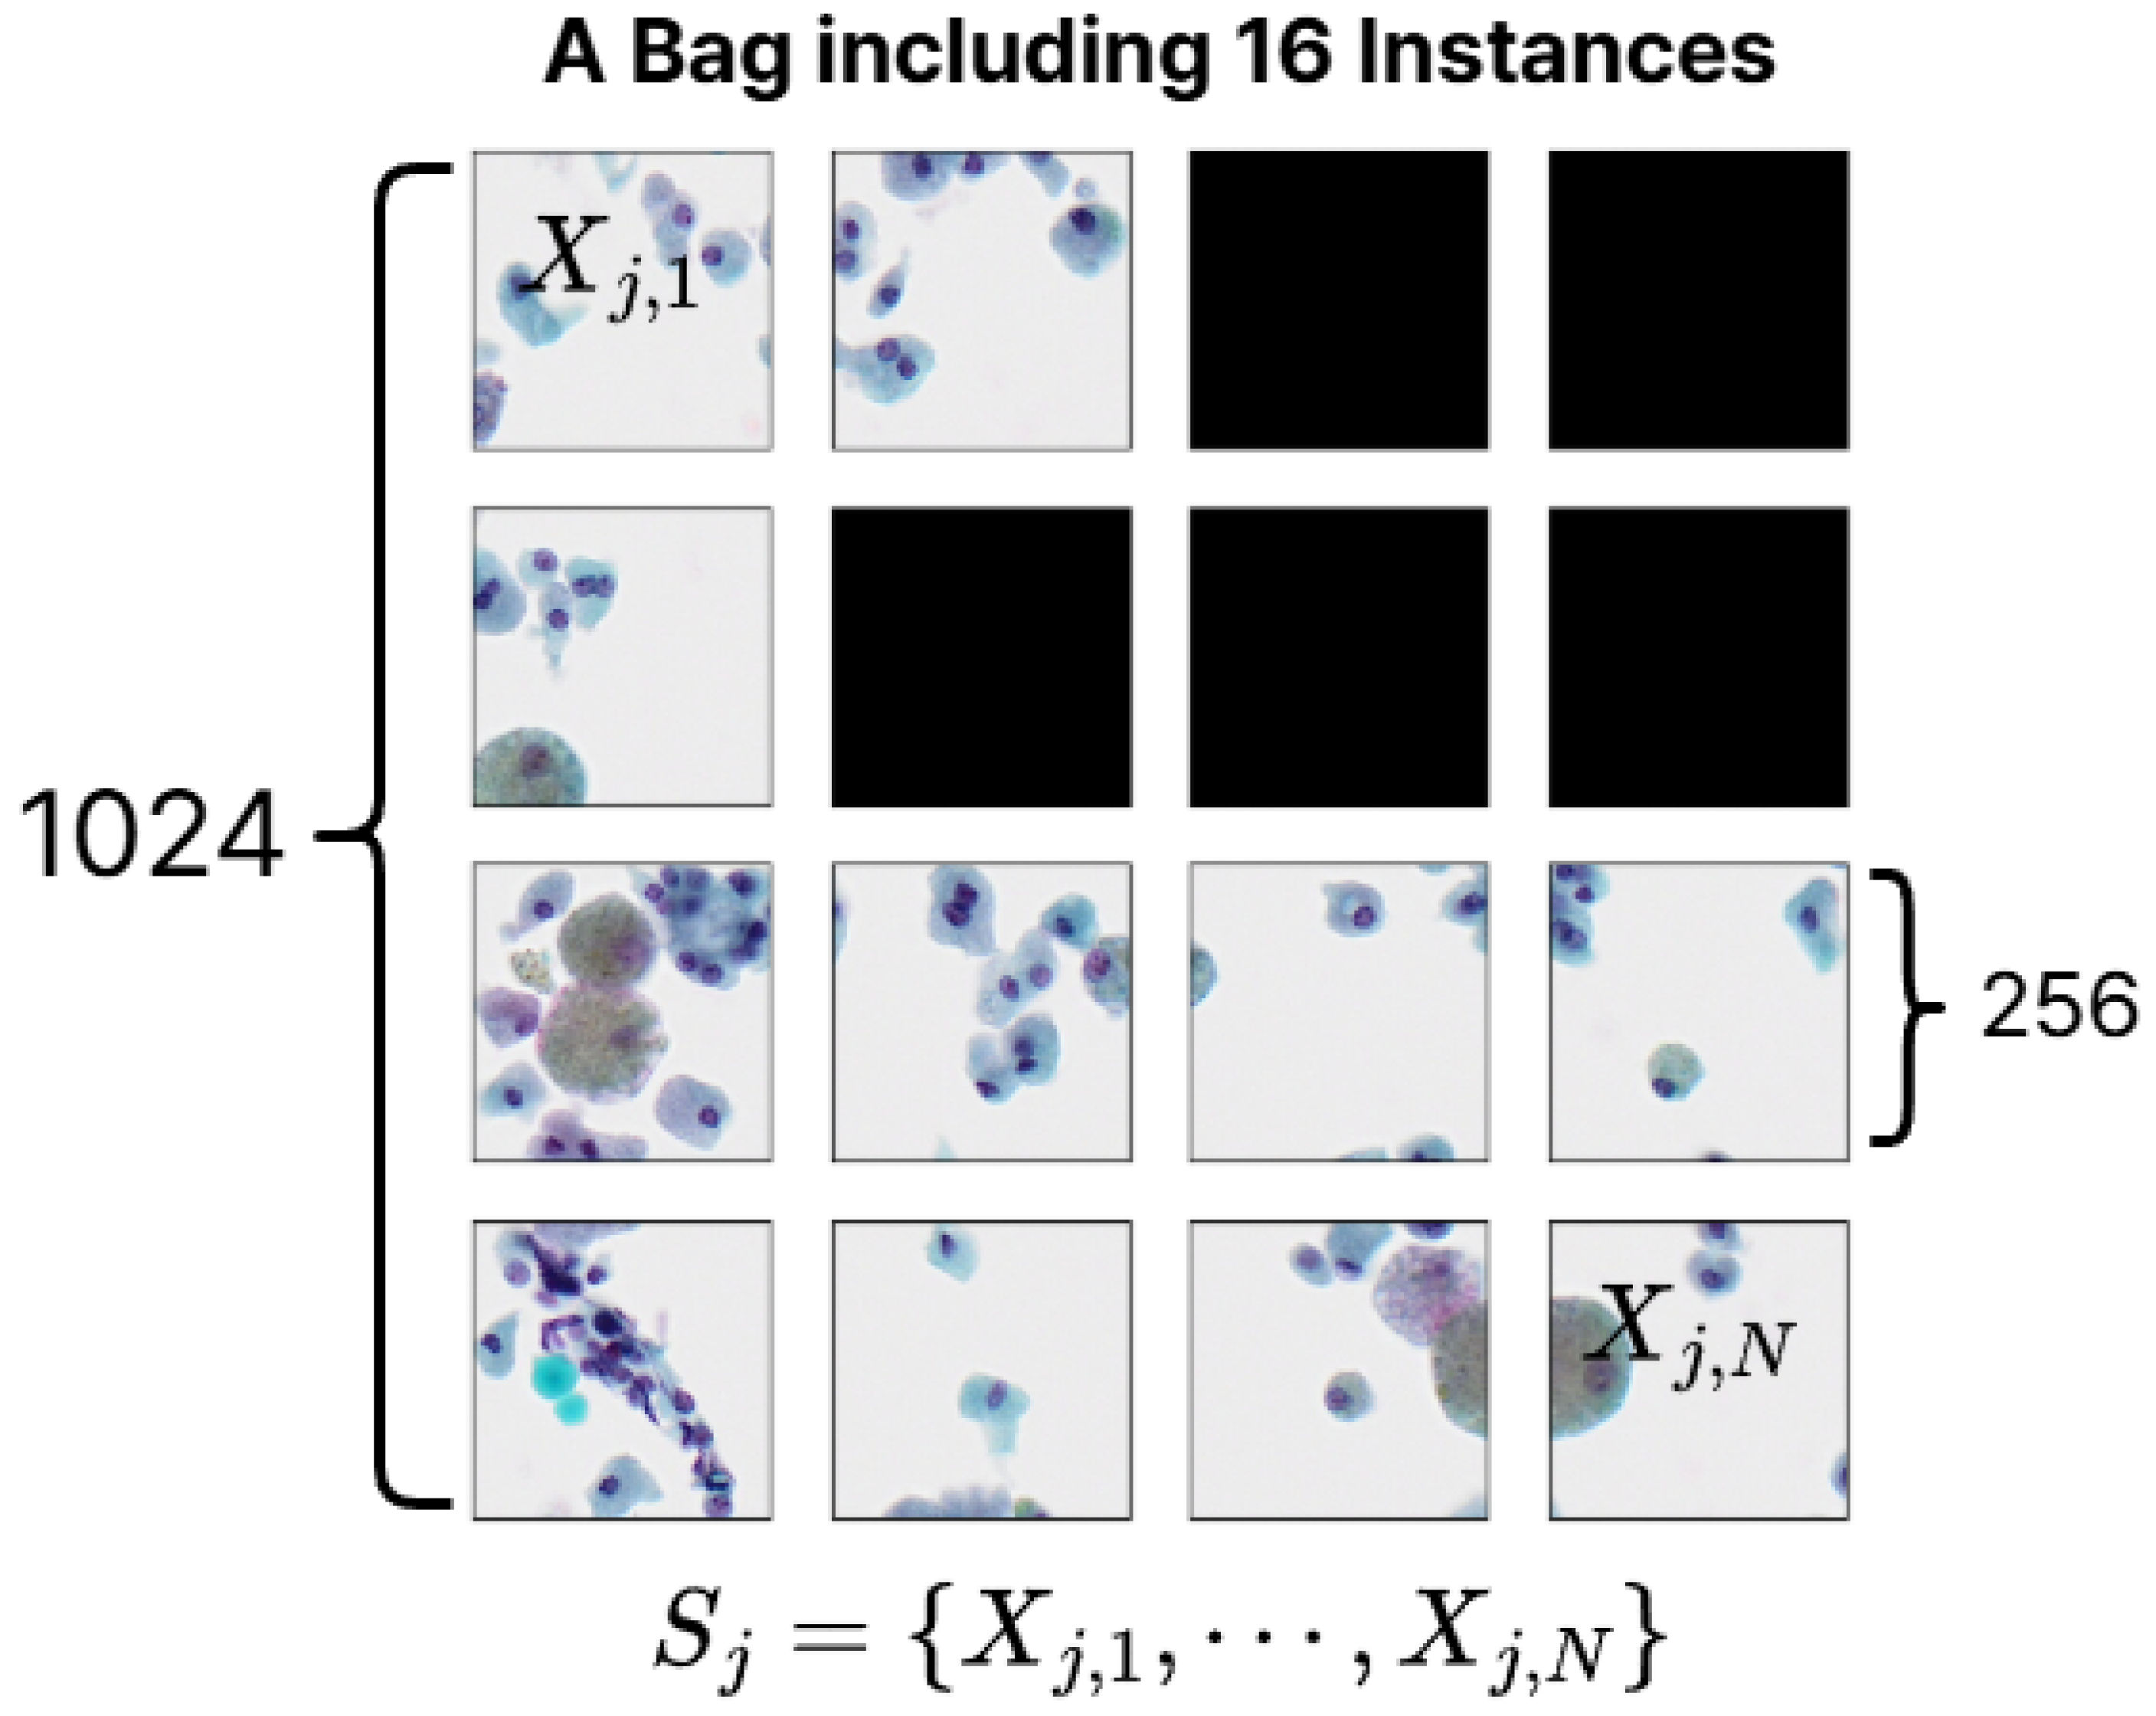
We take an label for each BP image as a bag-level label and each bag contains 16 instances (SP images). Therefore, the bag-level dataset can be represented as follows.
where
for
. A bag-level label
is in
and
is the number of bag-level data
.
N is the number of instances in a bag and we set N to 16 (since a
sized BP image is tiled into 16 smaller
images). However, as mentioned in
Section 3, since some instance-level patches have been removed, the empty instance position in a bag is padded with a 0-value matrices. The process of constructing a bag-level dataset in MIL, as described, is illustrated in
Figure 4
We utilize (non-pretrained) TCS-CNN architecture in Section.
Section 4.1 as a feature extractor on MIL framework to extract low-dimensional representations from the instance-level patch images. And the attention networks combine these instance-level representations
into bag-level representations
, weighing the key instance SPs that have a major impact on thyroid malignancy prediction. This MIL is formulated as Eq. (
3). The attention scores
show the importance of each instance-level patches, and we use the gated attention mechanism [
29] denoted as Eq. (
4) below:
where
,
and
.
L is a dimension of weights and
D is a dimension of the instance-level feature vector. Additionally, ⊙ represents a Hadamard operator for the element-wise multiplication and
is the sigmoid function. The utilization of a sigmoid gate in the gated attention mechanism enables the capture of interactions among instances with varying strengths, facilitating the extraction of more sophisticated information.
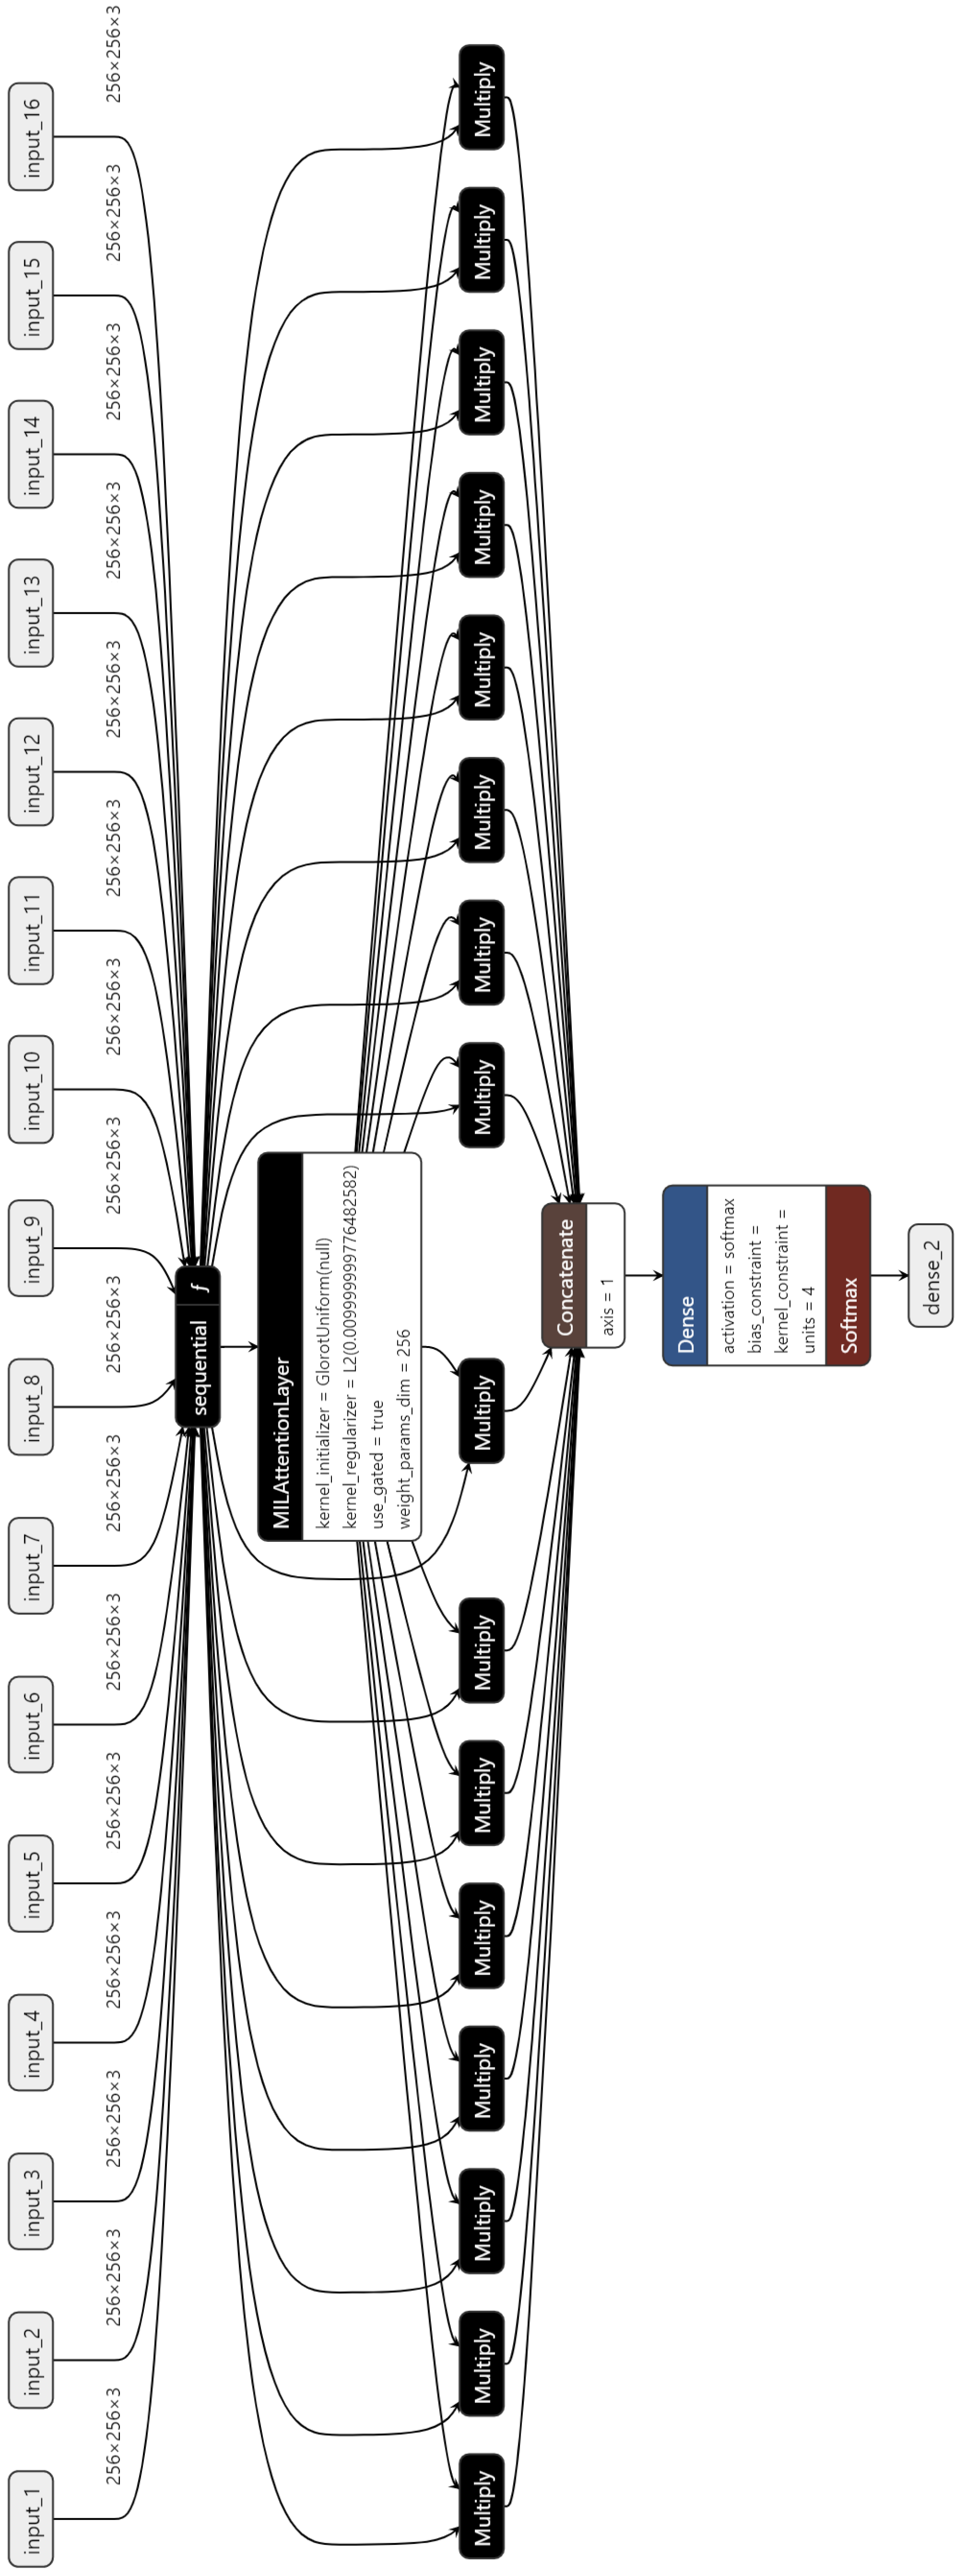
These bag-level embeddings are concatenated and they are classified by a fully connected layer with the softmax activation.
Figure 5 shows the architecture of the MIL, which has the 16 inputs.
5. Experiment
Our two classification models are trained and evaluated on two datasets mentioned in Section.
Section 3. The inputs of TCS-CNN and AD-MIL are instance-level (SP-level) dataset and bag-level dataset, respectively. These proposed methods are evaluated in comparison with pre-trained CNN models with ImageNet [
39] which are VGG16 [
15], Inception-v3 [
17] and Mobilenet [
40].
For each of these models, we perform an ablation study to identify the best configuration by freezing all layers and progressively unfreezing them from the final layers to the initial layers, allowing each layer to become trainable. The performance is evaluated at each stage, and the models with the highest validation recall scores are selected. We apply the training process and evaluation settings in the same way as the TCS-CNN experiment in Section.
Section 4.1 to these comparative models.
5.1. Training Procedure
Due to the unbalanced distribution of the classes, we use the weighted cross entropy (WCE) loss function. During the computation of the loss function, it confers higher weights upon the minority classes while endowing the majority classes with comparatively lower weights. The weights are inversely proportional to the size of the class containing the
i-th sample as shown in below Eq. (
5).
where
M is the number of samples and
C is the number of classes. Additionally,
represents the number of
j-th class samples.
corresponds to the weight ascribed to class
j and this weight is computed inversely proportional to the frequency of the class.
For training the networks, Adam optimizer [
41] is chosen with the adaptive learning rate that decreases when a validation recall stopped increasing. The learning rate starts with
and decays by a factor
with 3-patience. It ensures stable convergence by mitigating overfitting through controlled learning rate adjustments. Furthermore, the automated regulation of the learning rate during training streamlines the hyperparameter tuning, contributing to improved model generalization by prioritizing stability.
The epoch is set to 50 and the batch size is set to 8. We select the model with the best recall score for the validation set during training. All experiments are conducted in the same environment using the same hyper-parameters and optimization method and implemented in Python 3.8.19 with Tensorflow 2.9.0. All models are trained on a NVIDIA GeForce RTX 4080 GPU with 16 GB of memory.
5.2. Evaluation Metrics
We utilize the accuracy, precision, recall and f1-score metrics to compare the performance of the models. The metrics are represented as follows:
where
represents the true positive,
is the false positive,
and
are the true negative and false negative, respectively. Accuracy quantifies the overall correctness of predictions of the model, but it can be misleading for imbalanced datasets. Therefore, we analyze the following three metrics together. Precision focuses on the accuracy of positive predictions and recall assesses how well the model accurately makes predictions belonging to the positive class. A high precision ensures reliable identification of positive cases, minimizing unnecessary treatments, while a high recall guarantees thorough recognition of cancer. In addition, f1-score offers a balanced evaluation of the performance of the model by harmonizing precision and recall.
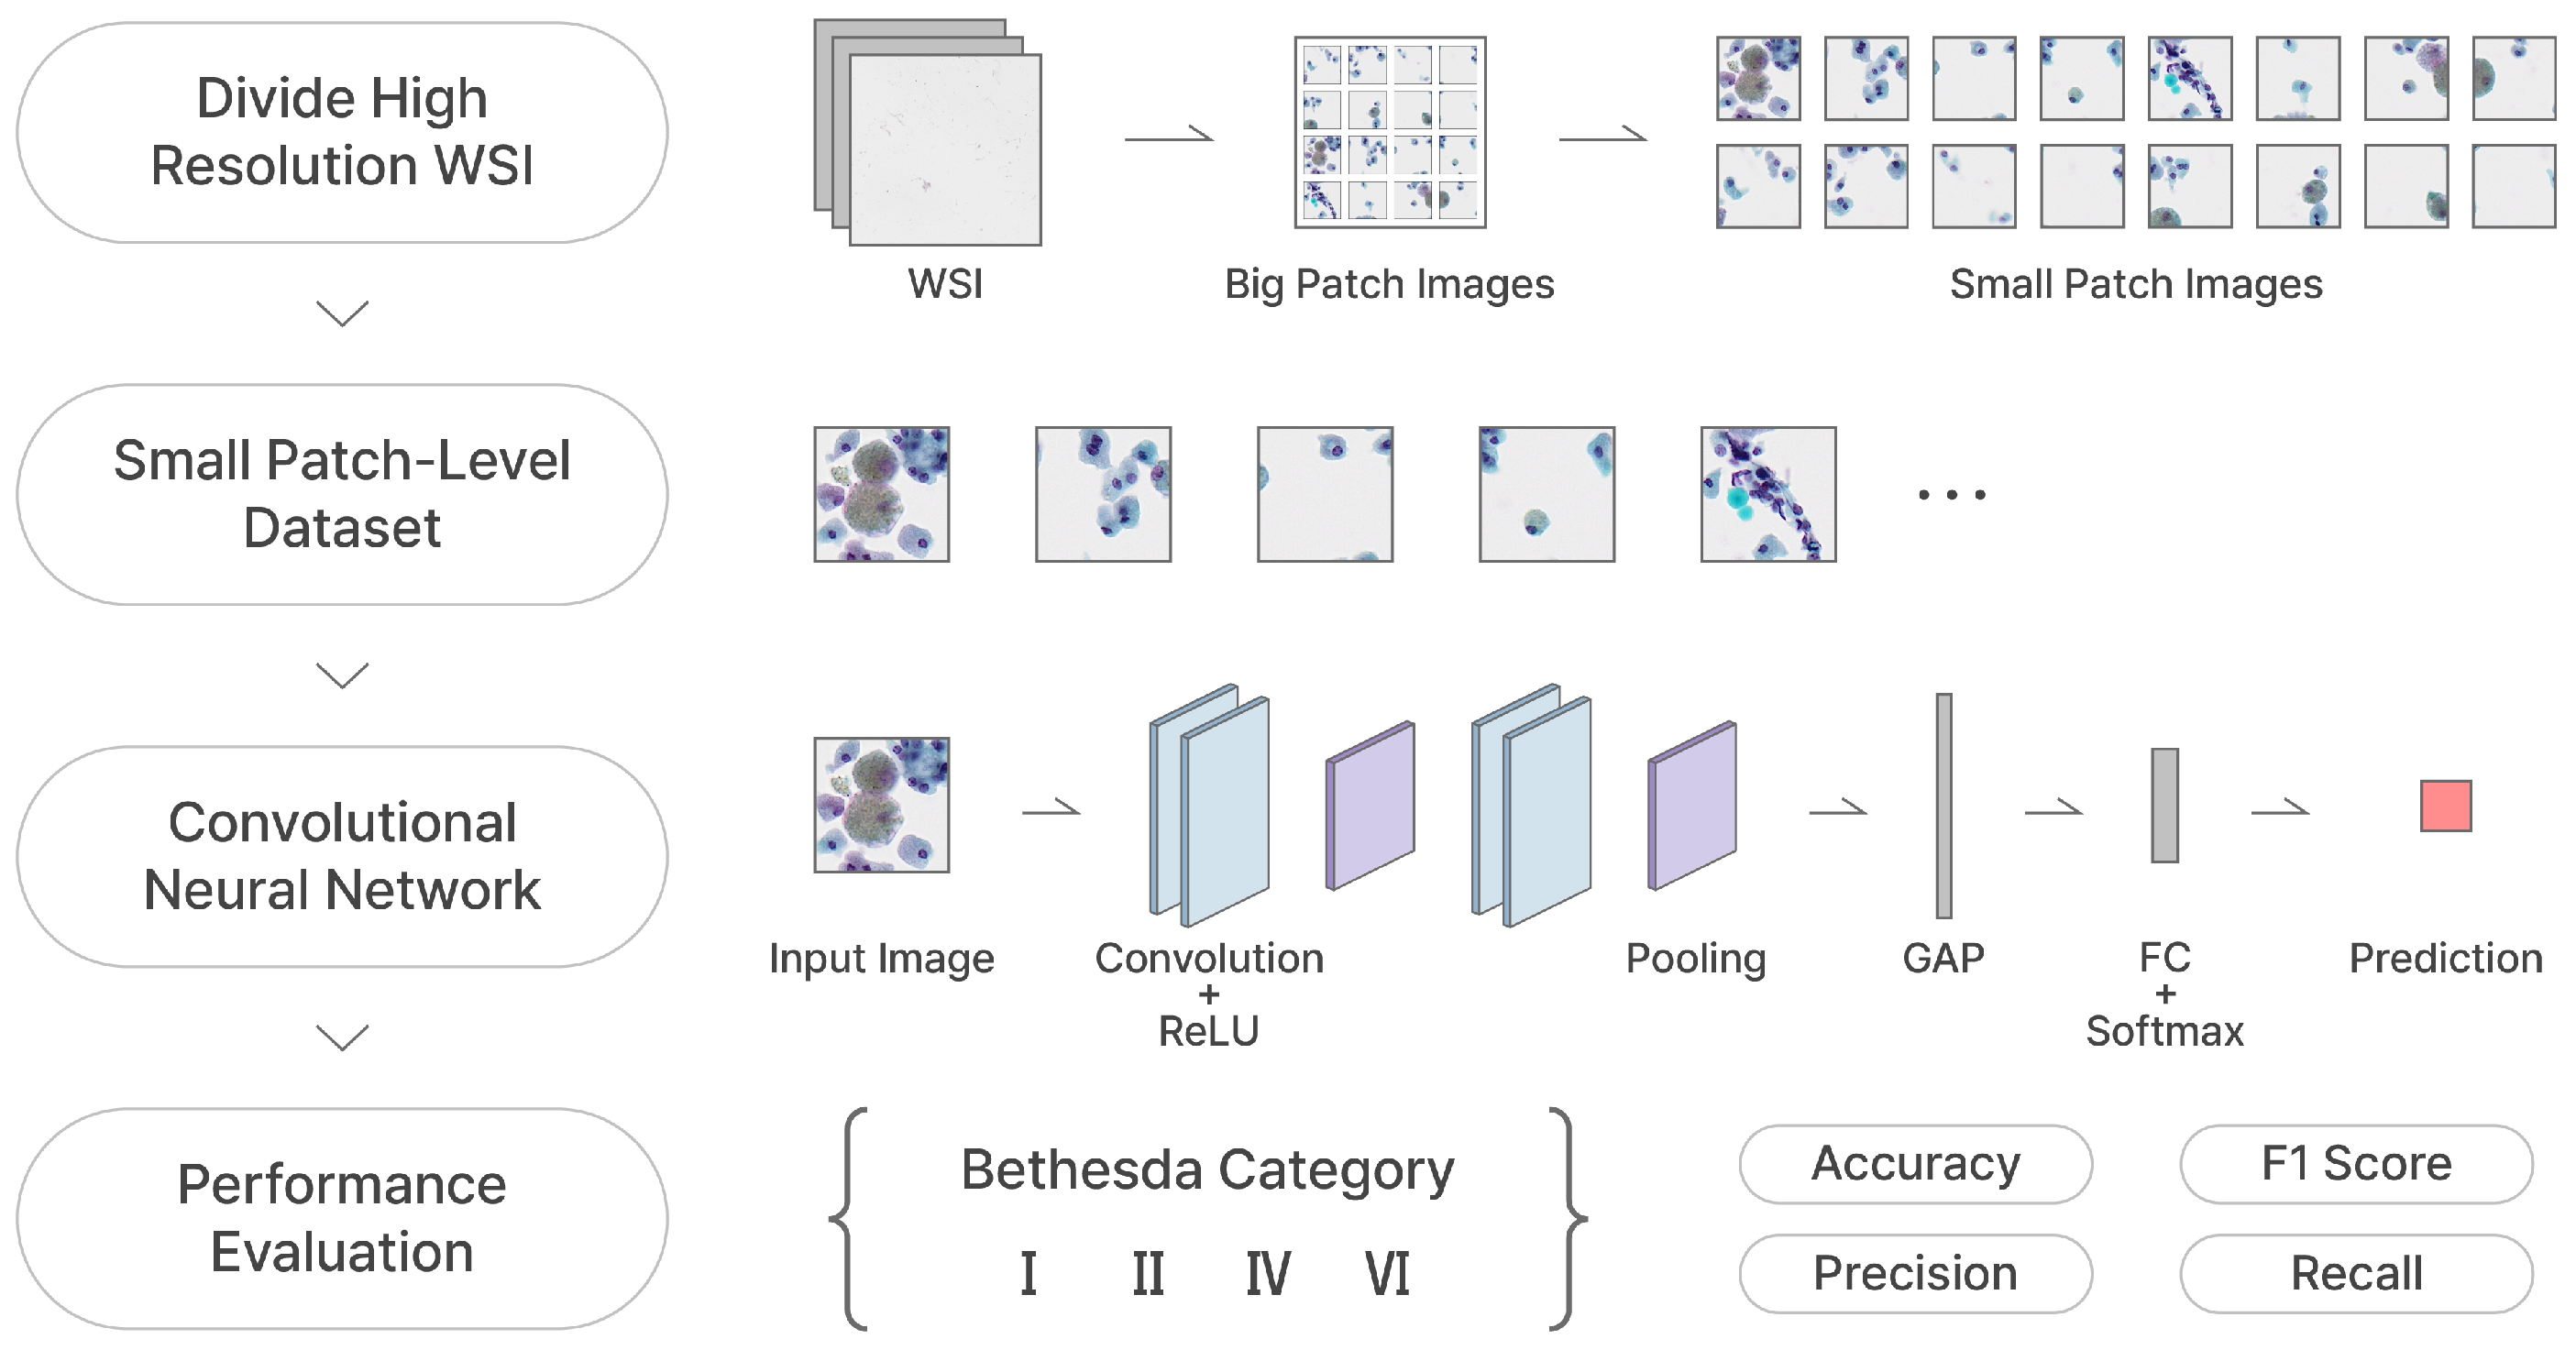
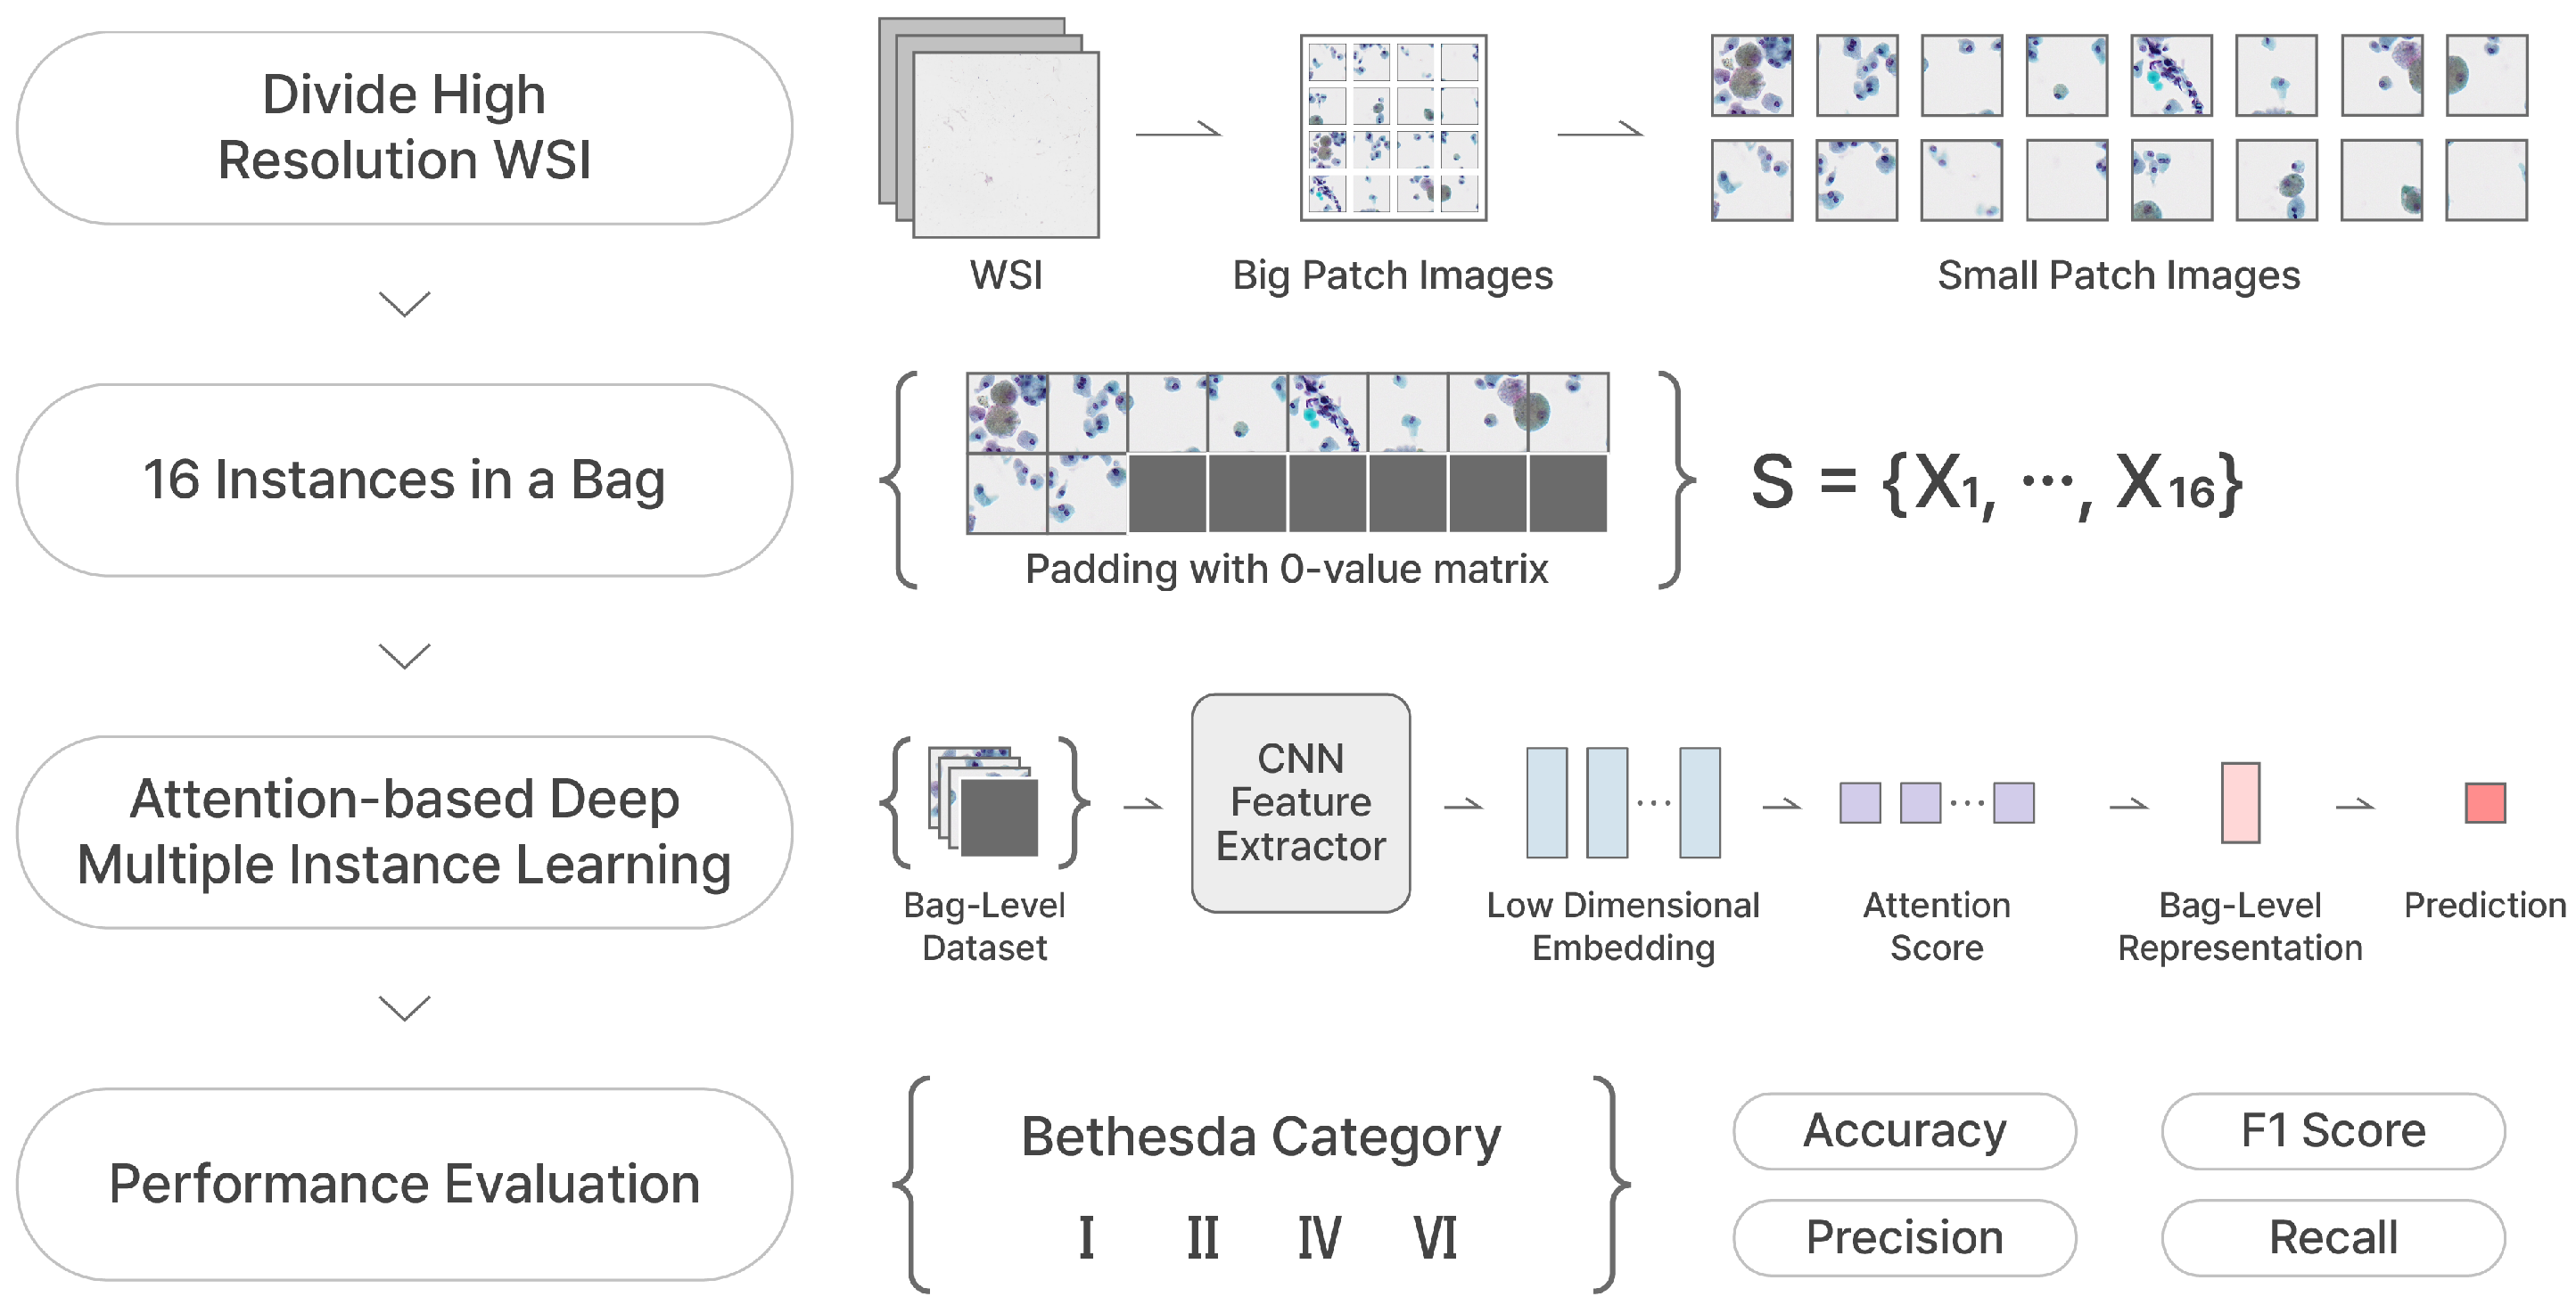
Our two proposed frameworks are represented in
Figure 6 and
Figure 7, respectively. We crop the WSIs into small patches with
size and feed them into the TCS-CNN model for 4-class classification. Prior to global average pooling (GAP), meaningful feature maps are obtained from convolutional blocks including convolution, ReLU and pooling. After that, the fully connected (FC) layers are used to integrate global information and learn parameters for the final prediction. In the AD-MIL framework as shown in
Figure 7, we generate a bag containing 16 instances and utilize it as the input of AD-MIL training process. TCS-CNN feature extractor trains the features for instances and their significance in a bag is applied to the classification by the attention score. Through the two processes, two types of dataset are classified into four Bethesda categories, and finally we use four metrics to conduct the quantitative evaluation.
6. Results
6.1. Performance
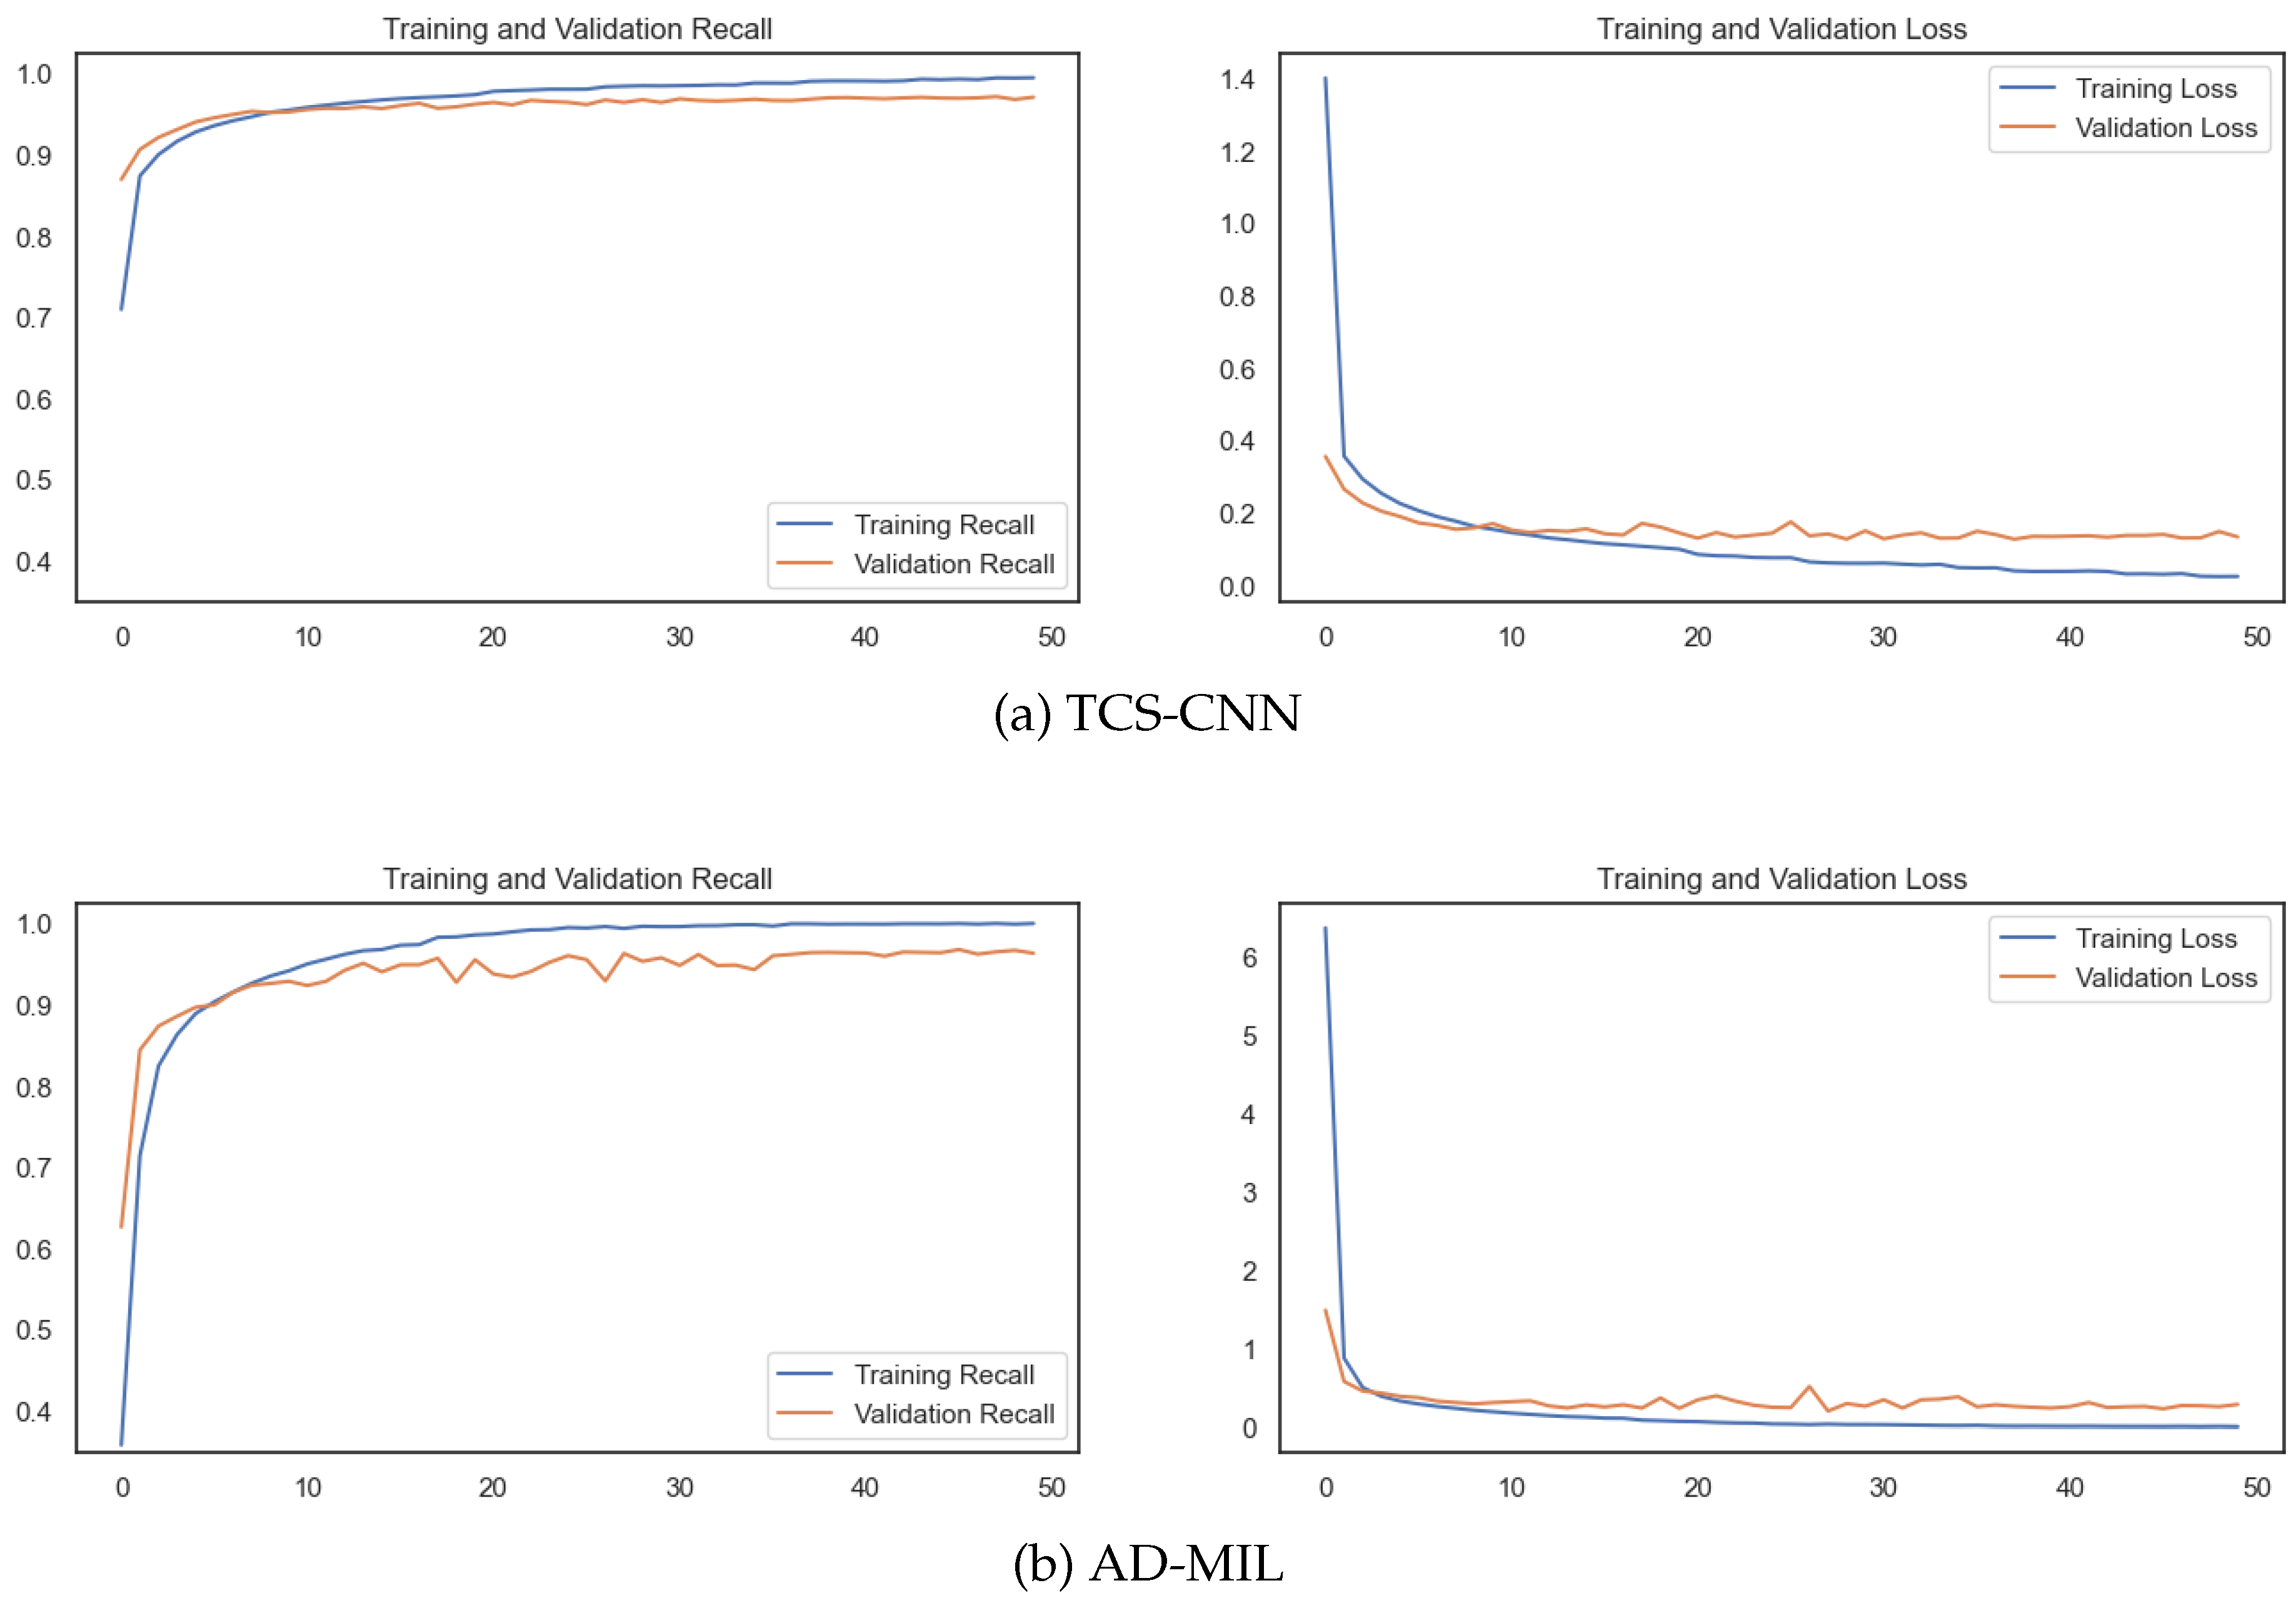
As shown in
Figure 8, the training convergence is achieved before 50 epochs. Both the training and validation loss consistently decrease, indicating the model rapidly adapted to the intricacies of the AI task. Importantly, the recall metrics for both sets show a consistent increase, further supporting the model’s capability.
Model performance is evaluated on validation set using accuracy, precision, recall and f1-score. In addition, receiver operating characteristic (ROC) curve and precision-recall (PR) curve are utilized for comprehensive and accurate assessment of performance.
Table 3 represents the quantitative evaluation for the TCS-CNN by using stratified k-fold cross-validation. It is performed with the ratio of
as mentioned in
Section 3 and this allows us to make better use of all the dataset while providing confidence in model outcomes. Overall, our proposed TCS-CNN achieves
precision,
recall,
f1-score and
accuracy. All later results for the TCS-CNN and AD-MIL are for a 1-split subset of the cross validation sets.
We compare our proposed models with VGG16, Inception-v3 and Mobilenet in
Table 4. The TCS-CNN, a SP classifier, and AD-MIL, which utilizes the TCS-CNN architecture as a feature extractor to perform bag-level classification, show comparable performance levels. This comparison highlights the significance of an efficient architecture. Notably, the simpler architectures of both TCS-CNN and AD-MIL outperform the other models across four metrics. The success of these models, achieved while maintaining simplicity, challenges the common belief that increasing model complexity always leads to better results.
The TCS-CNN effectively extracts meaningful features related to thyroid malignancy from SP images, enabling accurate diagnosis at the small regions in large-scale slides. These extracted features, when aggregated, contribute to more accurate predictions at the bag-level, demonstrating that the model enables the successful extension of diagnosis to larger patch-level areas through the thyroid carcinoma-specific structure.
Table 5 shows the comparative classification performance of TCS-CNN and AD-MIL models for four categories. Two models exhibit commendable performance across all classes and demonstrate consistent results in terms of precision, recall, and F1-score. For the TCS-CNN model, overall performances are highest for category I and IV, indicating the model’s proficiency in accurately identifying these classes.
Notably, the classification performed using the AD-MIL surprisingly shows improved performance in category VI. This observation underscores the success of expanding the diagnostic region and offers valuable insights into the capabilities of the model in addressing the complexities associated with the malignant case. This is achieved through its attention mechanism, which dynamically allocates importance to specific areas, thus capturing subtle features essential for accurate predictions within the malignant class.
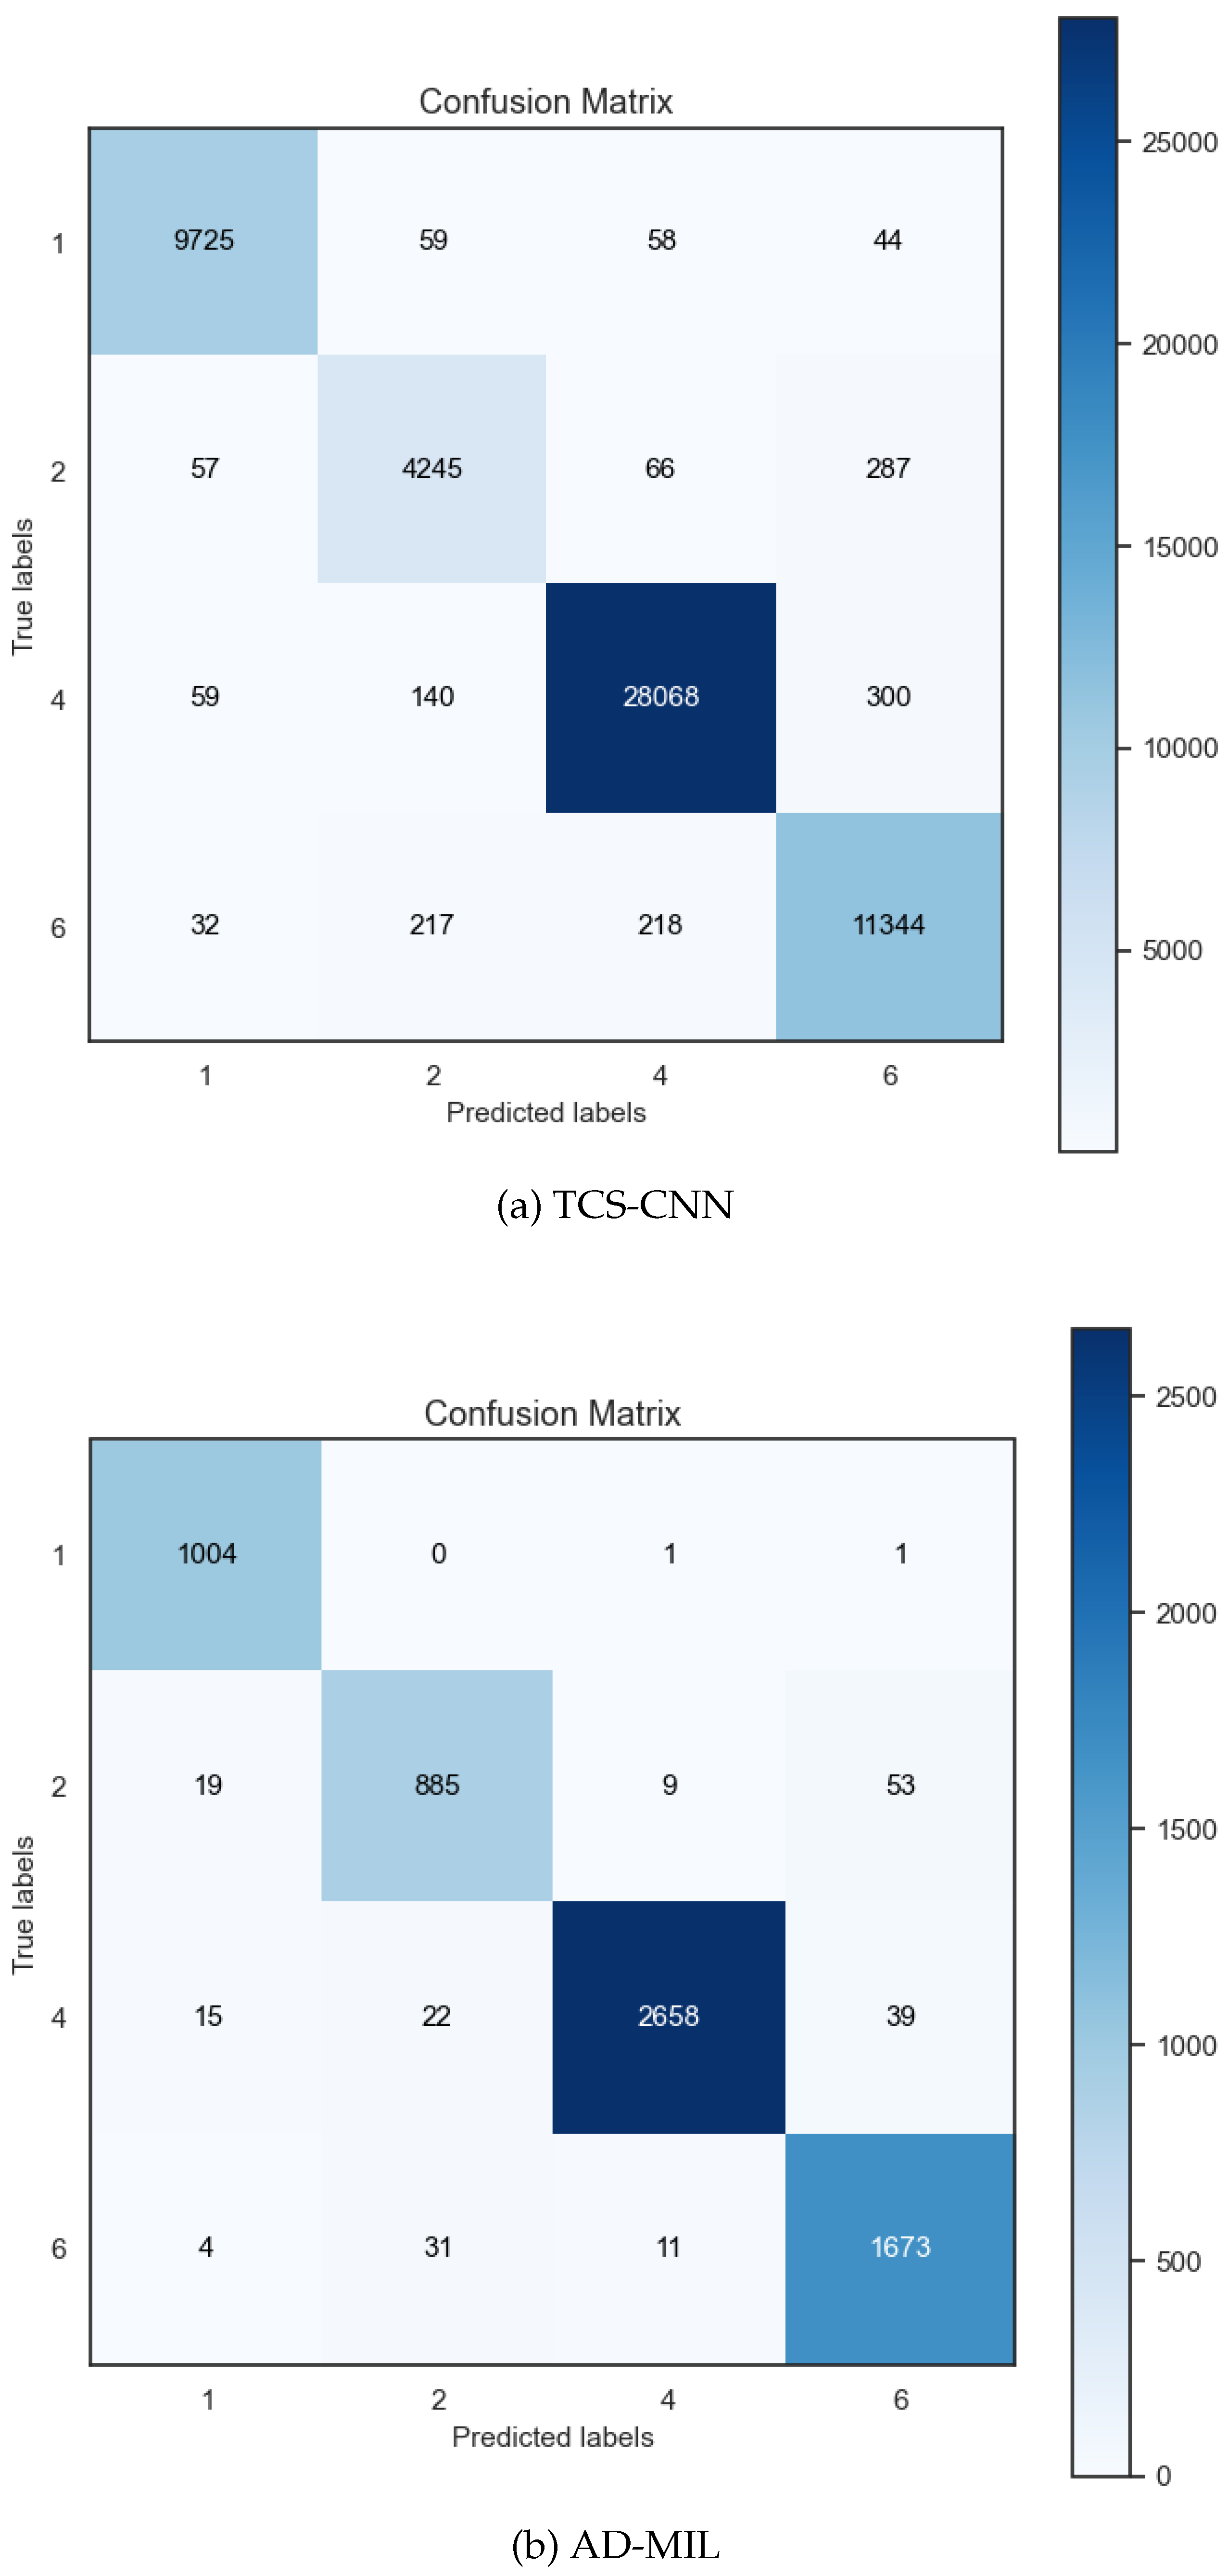
Additionally,
Figure 9 shows confusion matrices of two proposed algorithm, each trained on different datasets: the TCS-CNN model trained on the SP dataset and the AD-MIL model trained on the bag-level(BP-level) dataset. The confusion matrix summarizes models’ predictions against the ground truth labels for each class. We can see that each confusion matrix exhibits high values predominantly along its main diagonal. This pattern signifies that both models possess a remarkable proficiency in correctly predicting outputs within their respective classes.
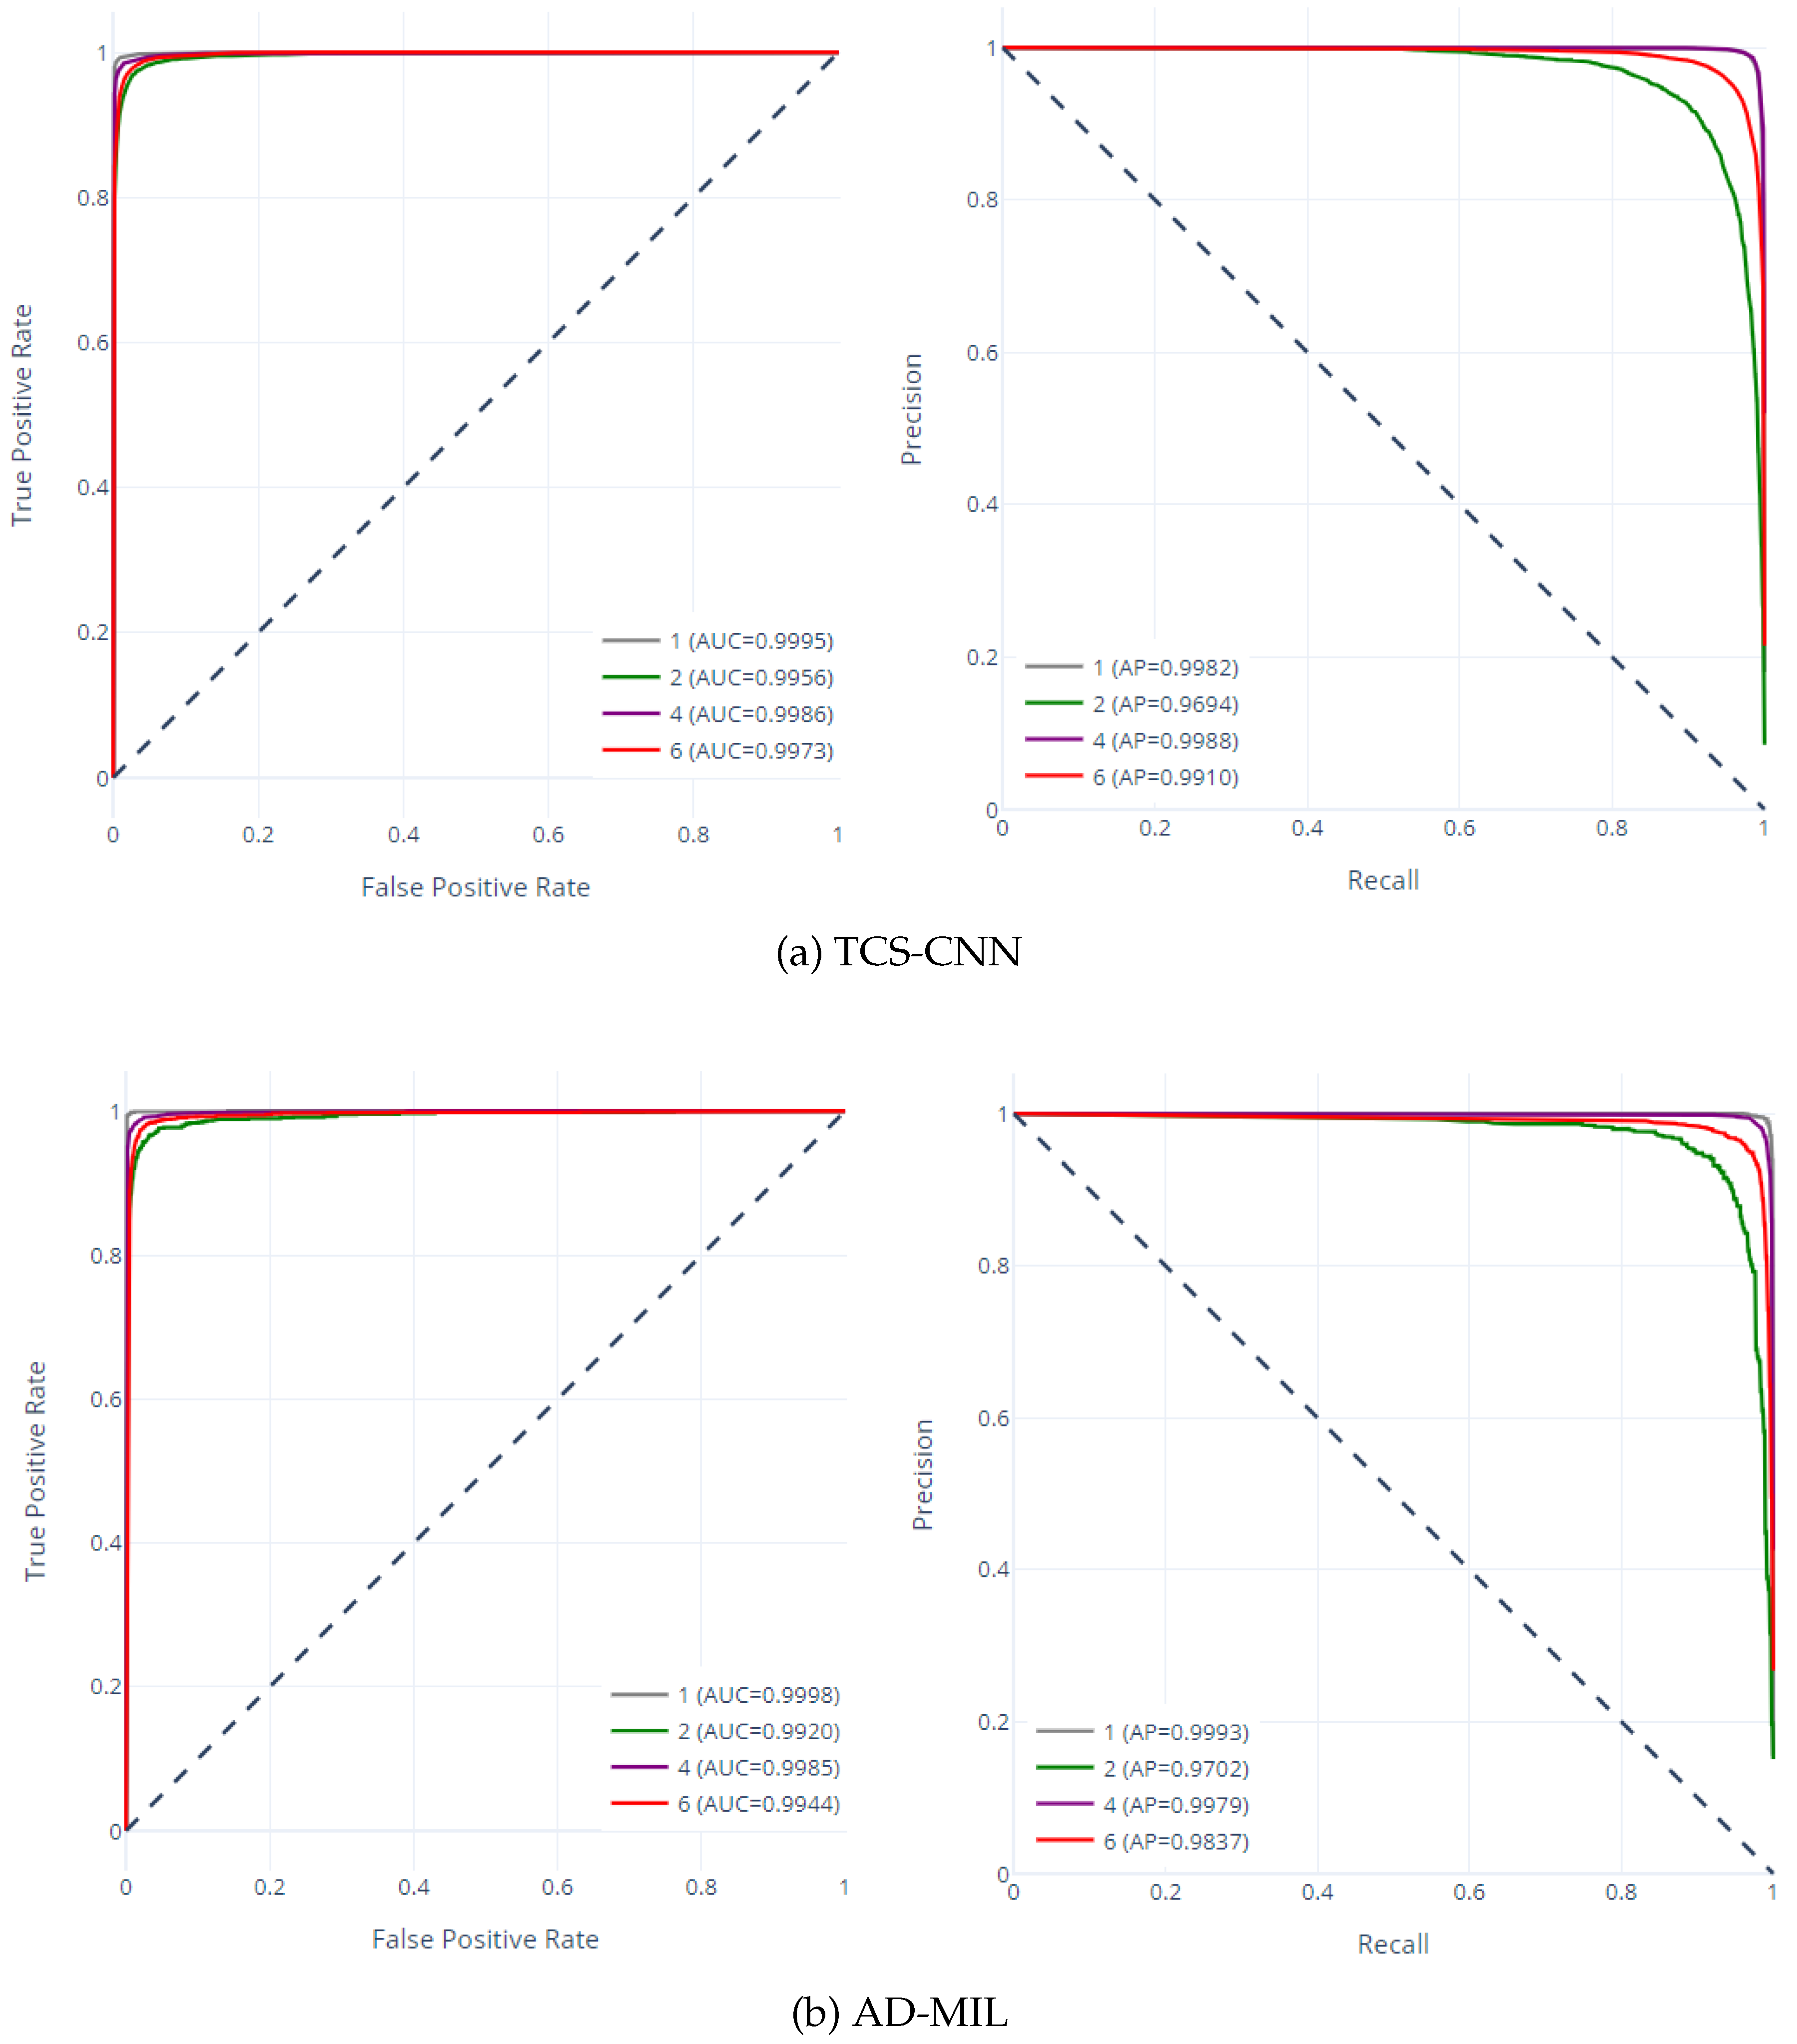
The receiver operating characteristic (ROC) curve and precision-recall (PR) curve for two models are shown in
Figure 10. The ROC curve has a representation of the trade-off between the true positive rate and the false positive rate and provides understanding into a model’s ability to discriminate between classes. Moreover, the PR curve represents the relationship between precision and recall, offering a perspective on a model’s performance in capturing true positives while minimizing false positives. The high area under the curve (AUC) values, ranging from
to
, emphasize the impressive discriminatory capabilities of both models across all classes. Similarly, the elevated average precision (AP) values affirm the models’ efficacy in accurately identifying true positive instances while maintaining low false positive rates. These exceptional and highly accurate performances highlight their potential for real-world applications in medical diagnostics and research.
In addition, we analyze confidence distributions from TCS-CNN predictions to understand uncertainty and to obtain reliability of the model. We observe that over 97% of the confidence values generated by the TCS-CNN for all small patches are greater than
. This suggests that the model confidently classifies each patch into one of the 4 Bethesda categories. However, this can also reflect the over-confident nature of modern neural networks [
42,
43]. Therefore, it is essential to check the uncertainty of these patch-level predictions to ensure that the model is indeed making reliable diagnoses.
6.2. Uncertainty Analysis
To better understand the predictions from TCS-CNN and evaluate the reliability of its output, we can calculate the uncertainty inherent in each patch-level prediction. Neural networks, especially deep models like CNN, can generate highly confident predictions for input patches. However, high confidence value does not necessarily indicate accuracy, and it is crucial to quantify the uncertainty associated with these predictions. Uncertainty analysis plays a pivotal role in assessing how much trust can be placed in the model’s outputs, particularly when dealing with rare or ambiguous cases. In this section, we focus on measuring the uncertainty of the TCS-CNN’s predictions and offer a deeper understanding of how confident the model is about its decisions [
42,
43].
To address the high confidence values produced by TCS-CNN, we aim to directly and intuitively assess the uncertainty associated with each patch’s prediction. As described in Section.
Section 4.1 and illustrated in
Figure 3, the final layer of TCS-CNN is a fully connected layer with 256 nodes. A single output of this layer, denoted as
, feeds into the softmax function (Eq.
1) to compute category predictions, represented as
.
By leveraging the final hidden layer activations
, we calculate
and
, providing a measure of uncertainty for each patch.
is the negative value of the confidence value and the higher
indicates lower uncertainty. Similarly,
applies the logarithm to each class probability and computes the weighted sum of these values, yielding a negative value for uncertainty. Higher uncertainty corresponds to increased entropy, making it useful for capturing various possibilities in the patches.
where
is the softmax function and
C is the number of classes
.
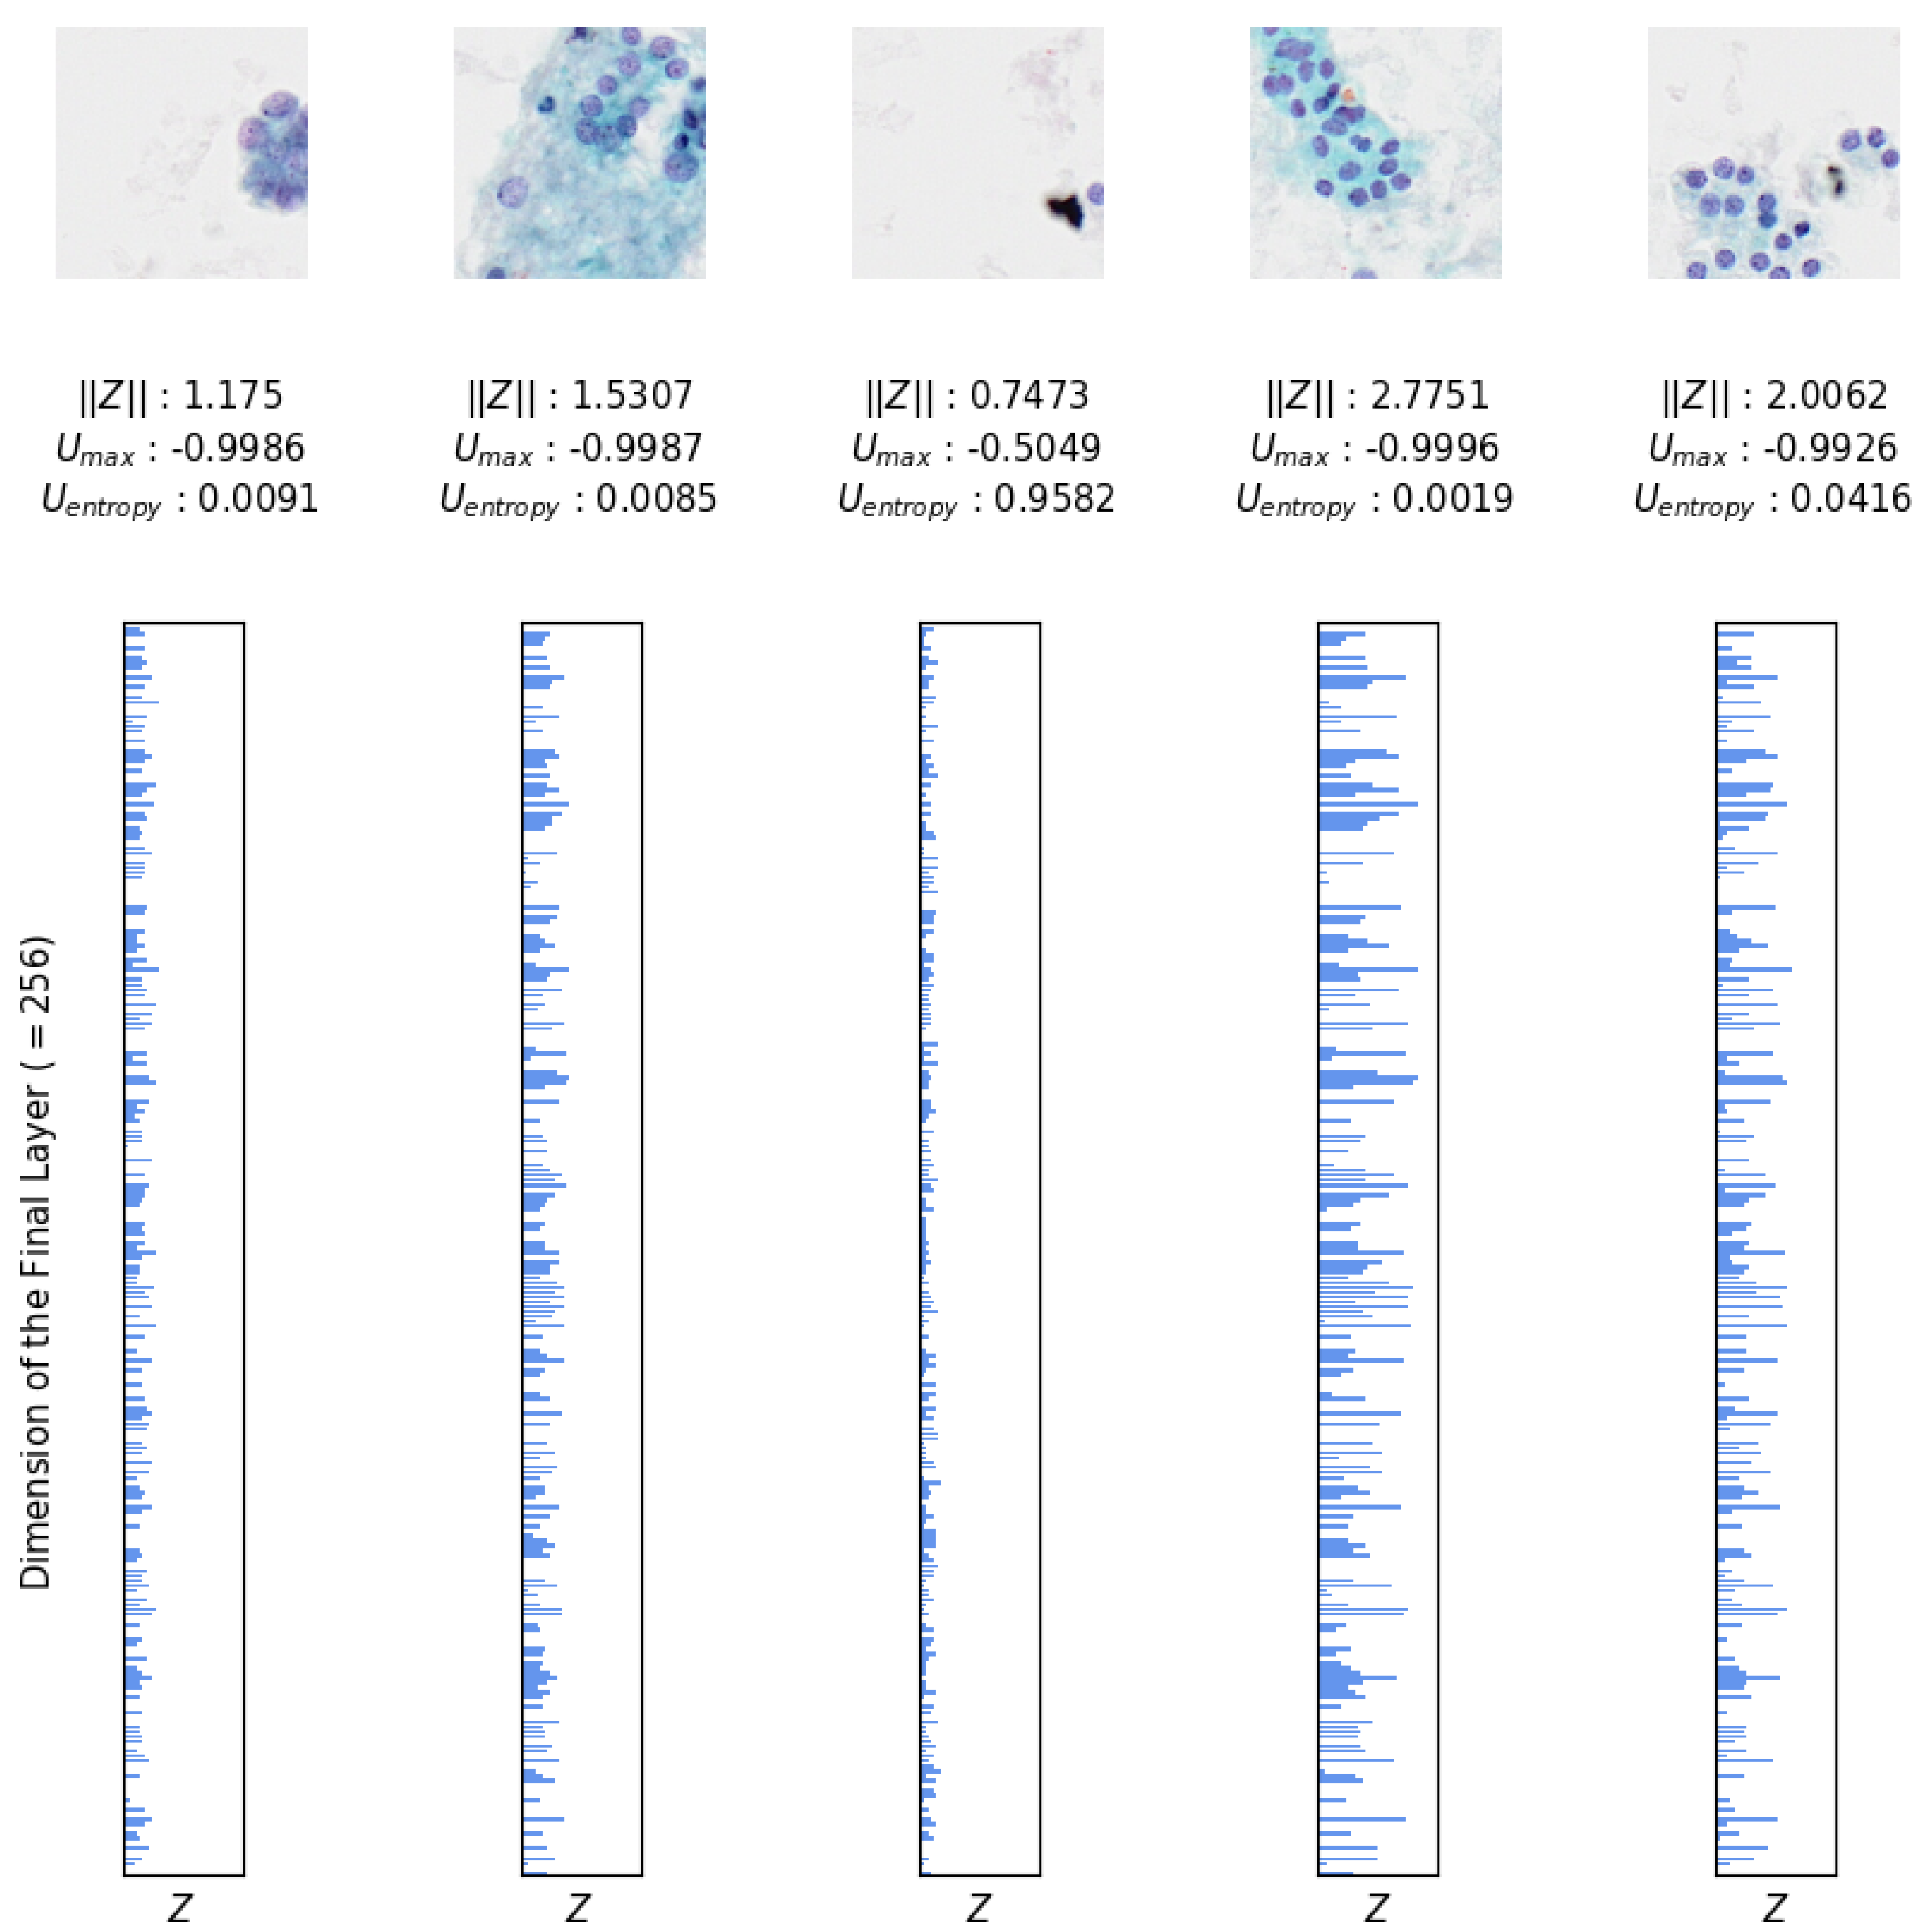
Additionally, the magnitude of
is used to further analyze and quantify the confidence associated with TCS-CNN’s outputs. TCS-CNN is effectively trained using only the patches that play a significant role in diagnosis within the slide. Therefore, when patches that are irrelevant to the diagnosis feed into the model, the uncertainty associated with these patches increases. This indicates that the model recognizes these patches as not contributing meaningfully to the diagnosis and therefore has lower confidence in its predictions. Therefore, by observing
, we can infer how diagnostically relevant, meaningful, and indicative of ROI (Region of Interest) a given patch image is. The larger the magnitude of the final layer’s output, the more important it is, and this greatly influences the subsequent calculation of softmax probabilities. These measurements are illustrated in
Figure 11, providing insights derived directly from the outputs of the strongly trained classifier, enabling an interpretation of its confidence and uncertainty for each patch.
6.3. Visualization
The gradient-weighted class activation mapping (Grad-CAM) is a widely employed for visual interpretation of CNN-based deep learning models [
44]. It elucidates the important regions within an input image that contribute significantly to a particular network’s classification decision. In more detail, Grad-CAM operates on the gradients of the target class’s score with respect to feature maps of the final convolutional layer and assigns relevance scores to individual spatial locations by analyzing these gradients, thereby highlighting areas that strongly influence the network’s prediction. In the context of utilizing TCS-CNN and Grad-CAM for the classification of thyroid cytopathological images into Bethesda categories, it is noteworthy that the regions highlighted by Grad-CAM within the cellular constituents of the input images are likely to hold pivotal importance in the classification process.
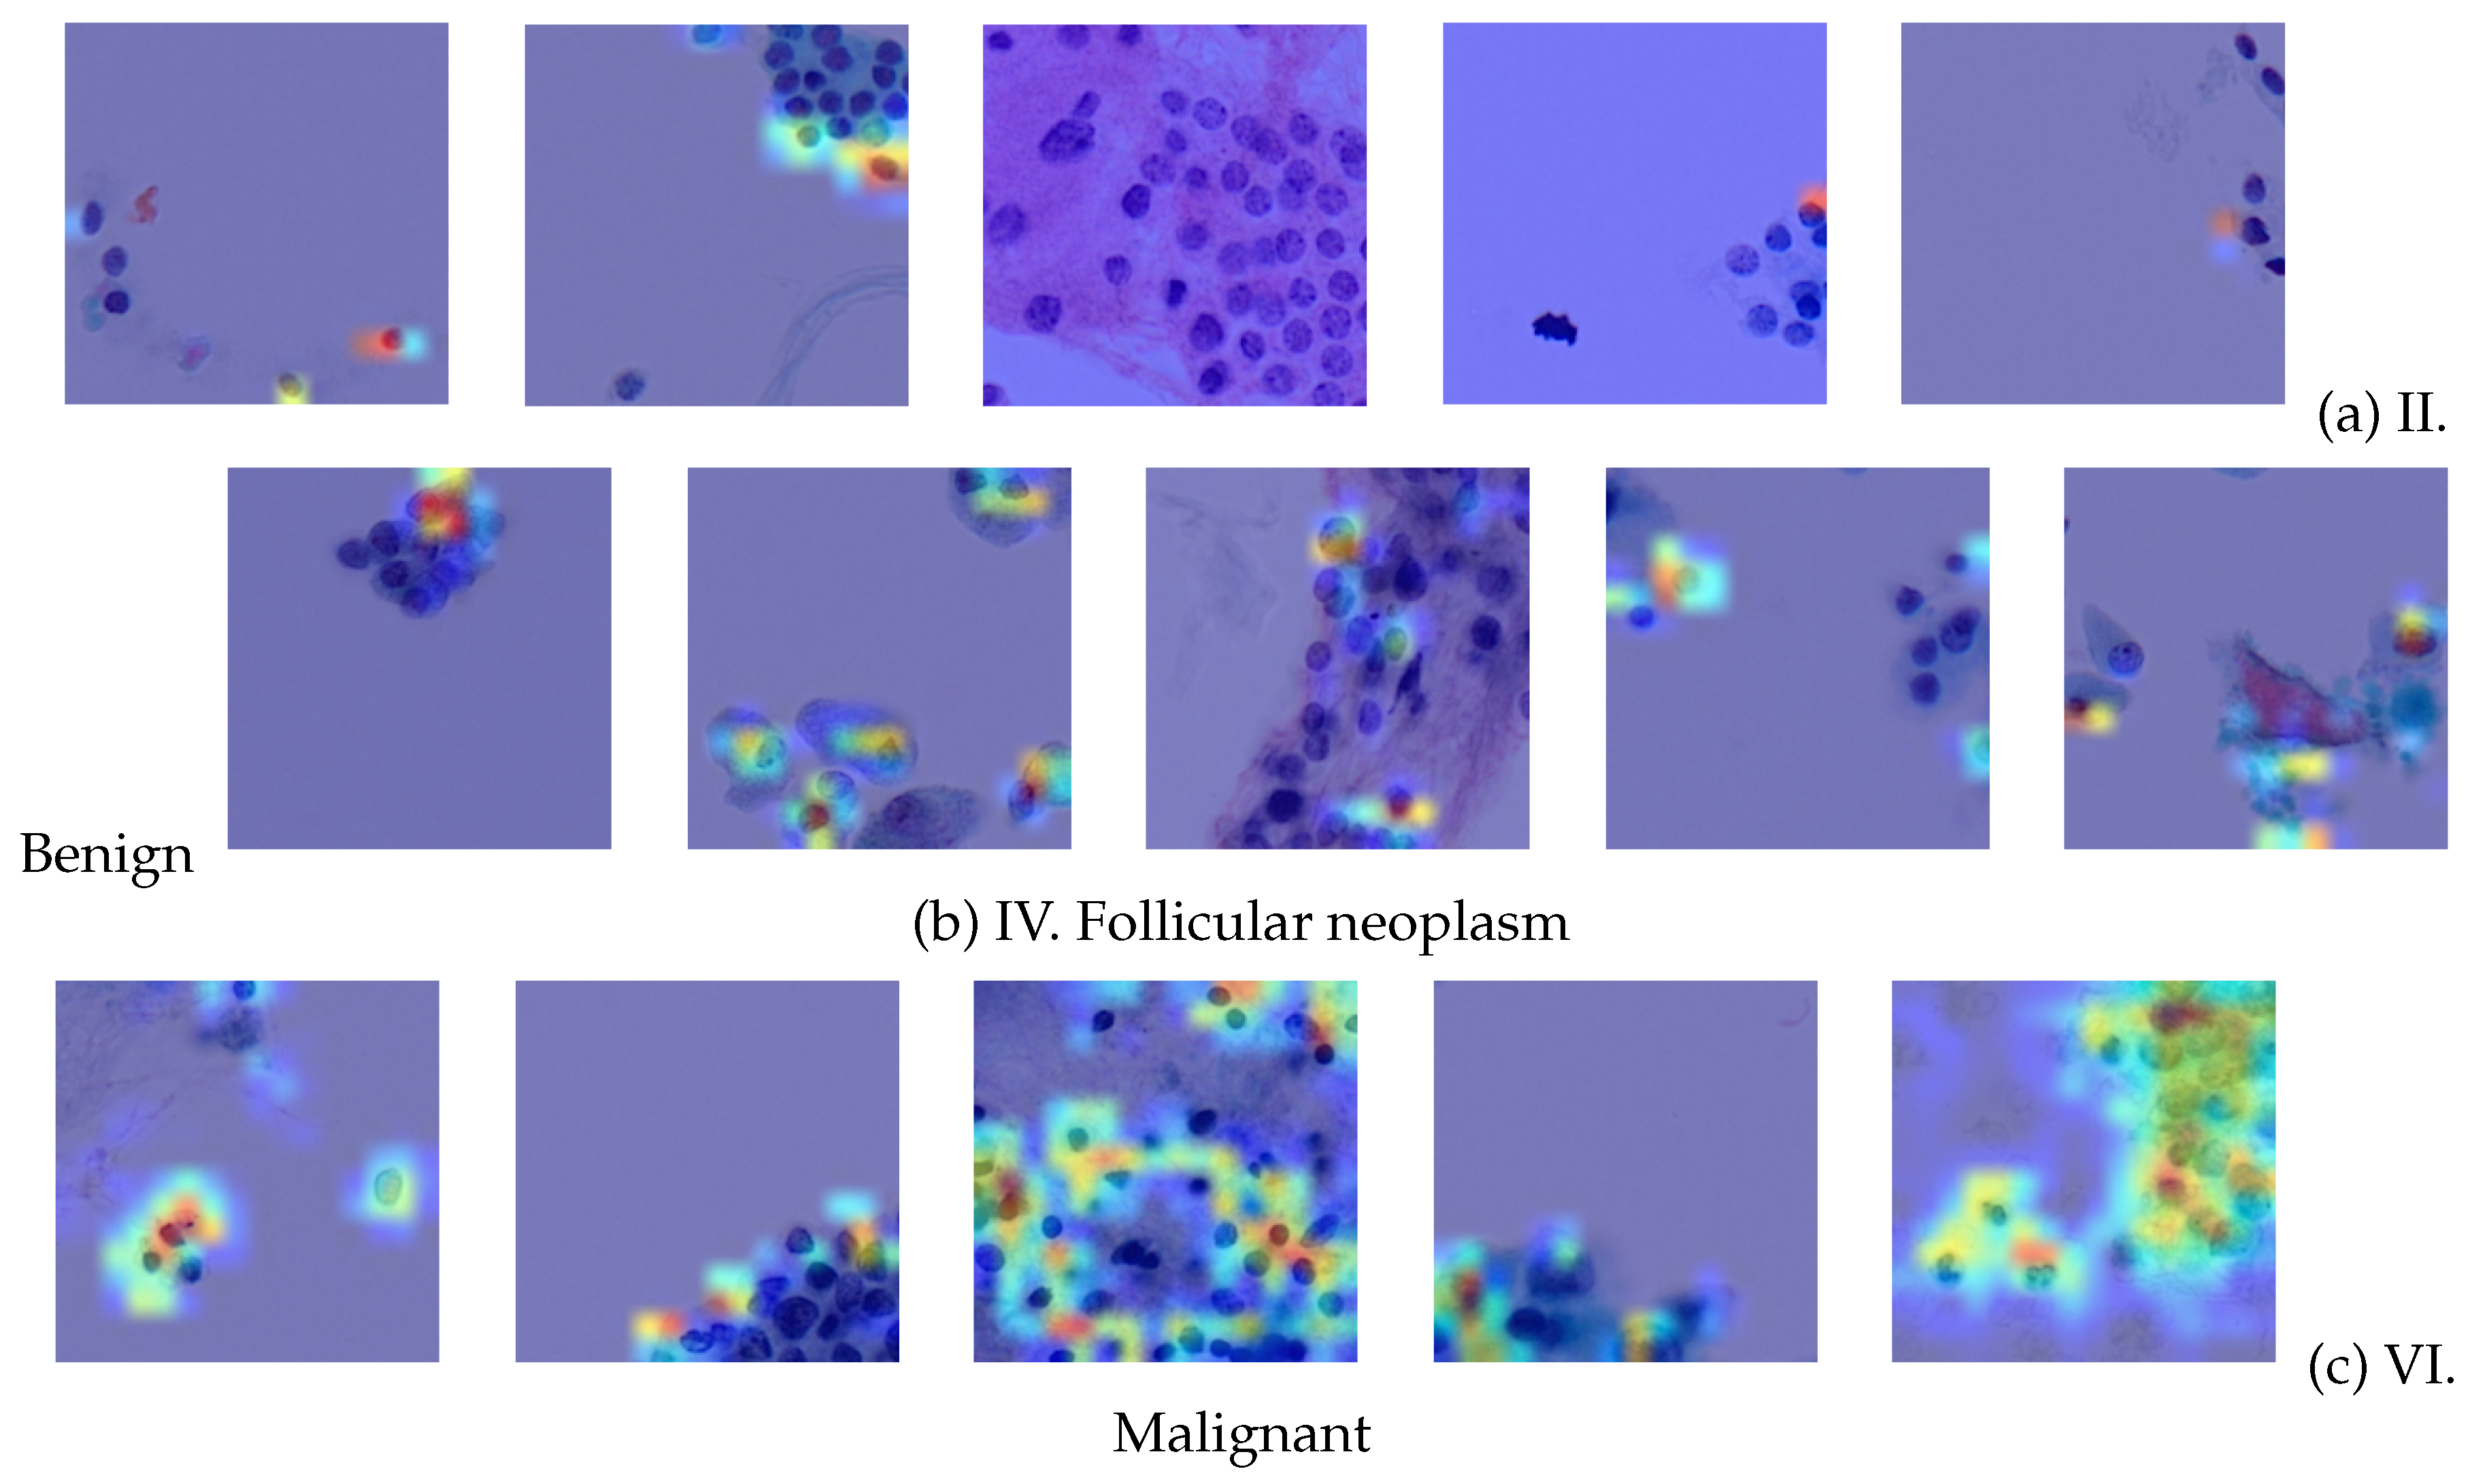
Therefore, we show the interpretability of the proposed TCS-CNN by the Grad-CAM algorithm.
Figure 12 exhibits a comprehensive visual analysis of the Grad-CAM activations for five samples from each Bethesda category II,IV and VI. The SP images corresponding to these categories often contain cellular structures such as nuclei, which are critical for diagnosis of thyroid cytopathology. By observing these Grad-CAM activations, it becomes evident that the network does not highlight every cellular structure indiscriminately. Instead, the activations predominantly focus on more malignant cellular features, selectively emphasizing regions indicative of higher diagnostic significance. This selective attention suggests that the TCS-CNN model effectively differentiates between benign and malignant features, showcasing a level of precision that aligns closely with the diagnostic reasoning like human pathologists.
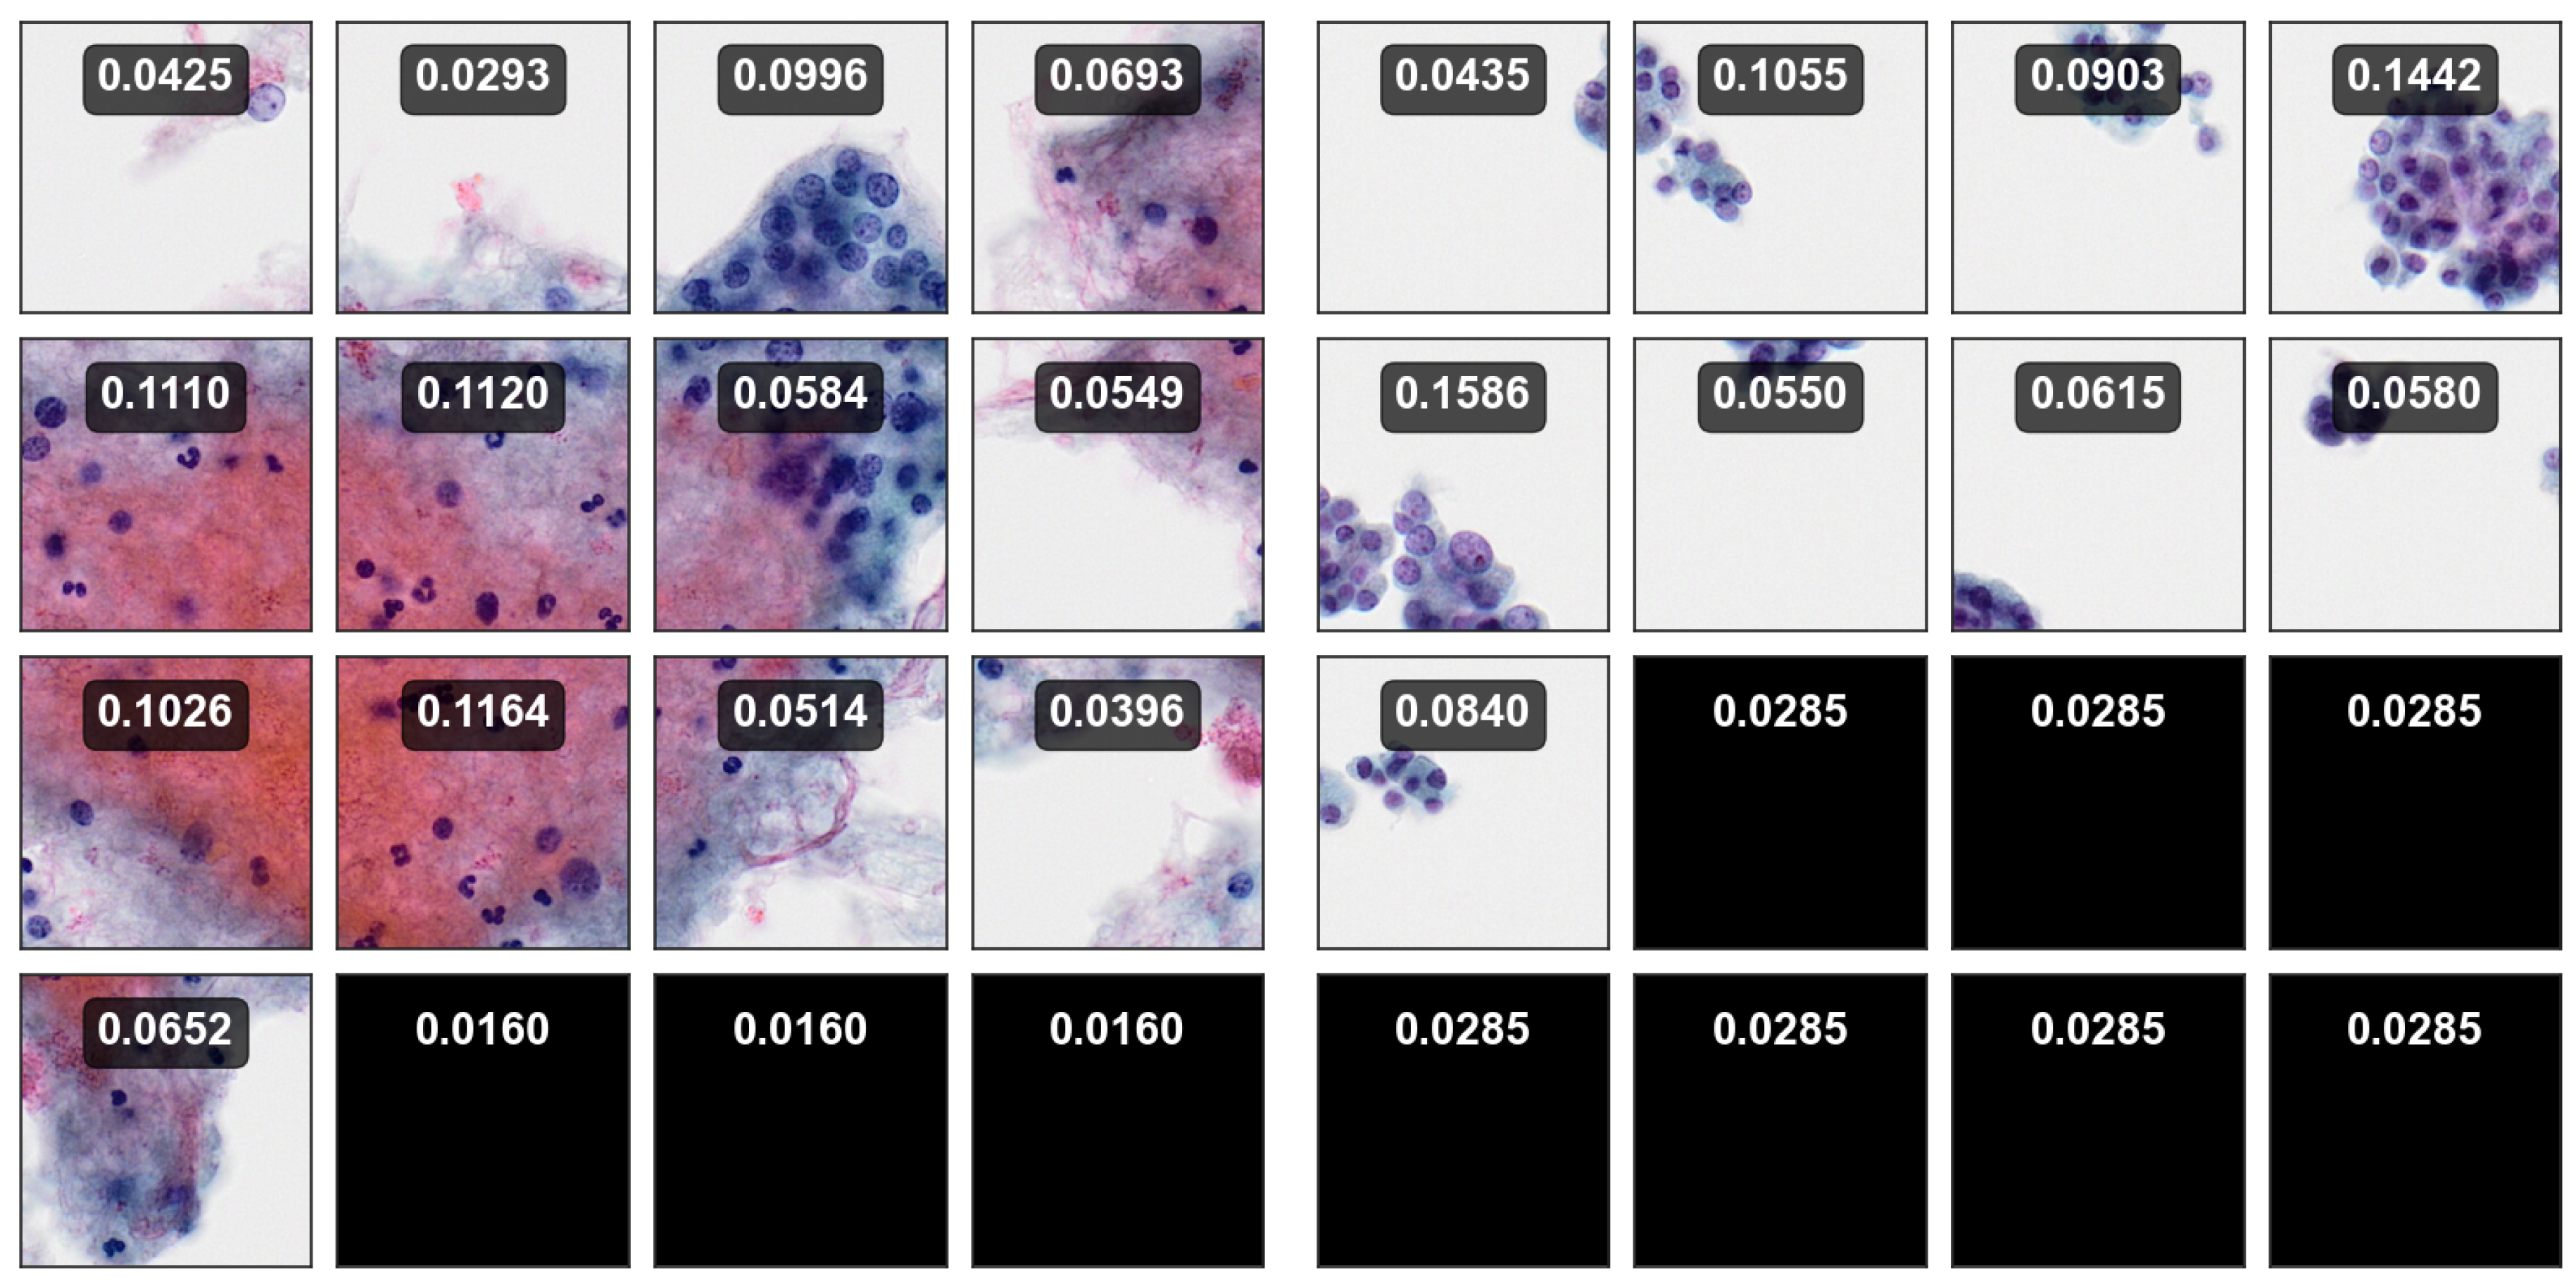
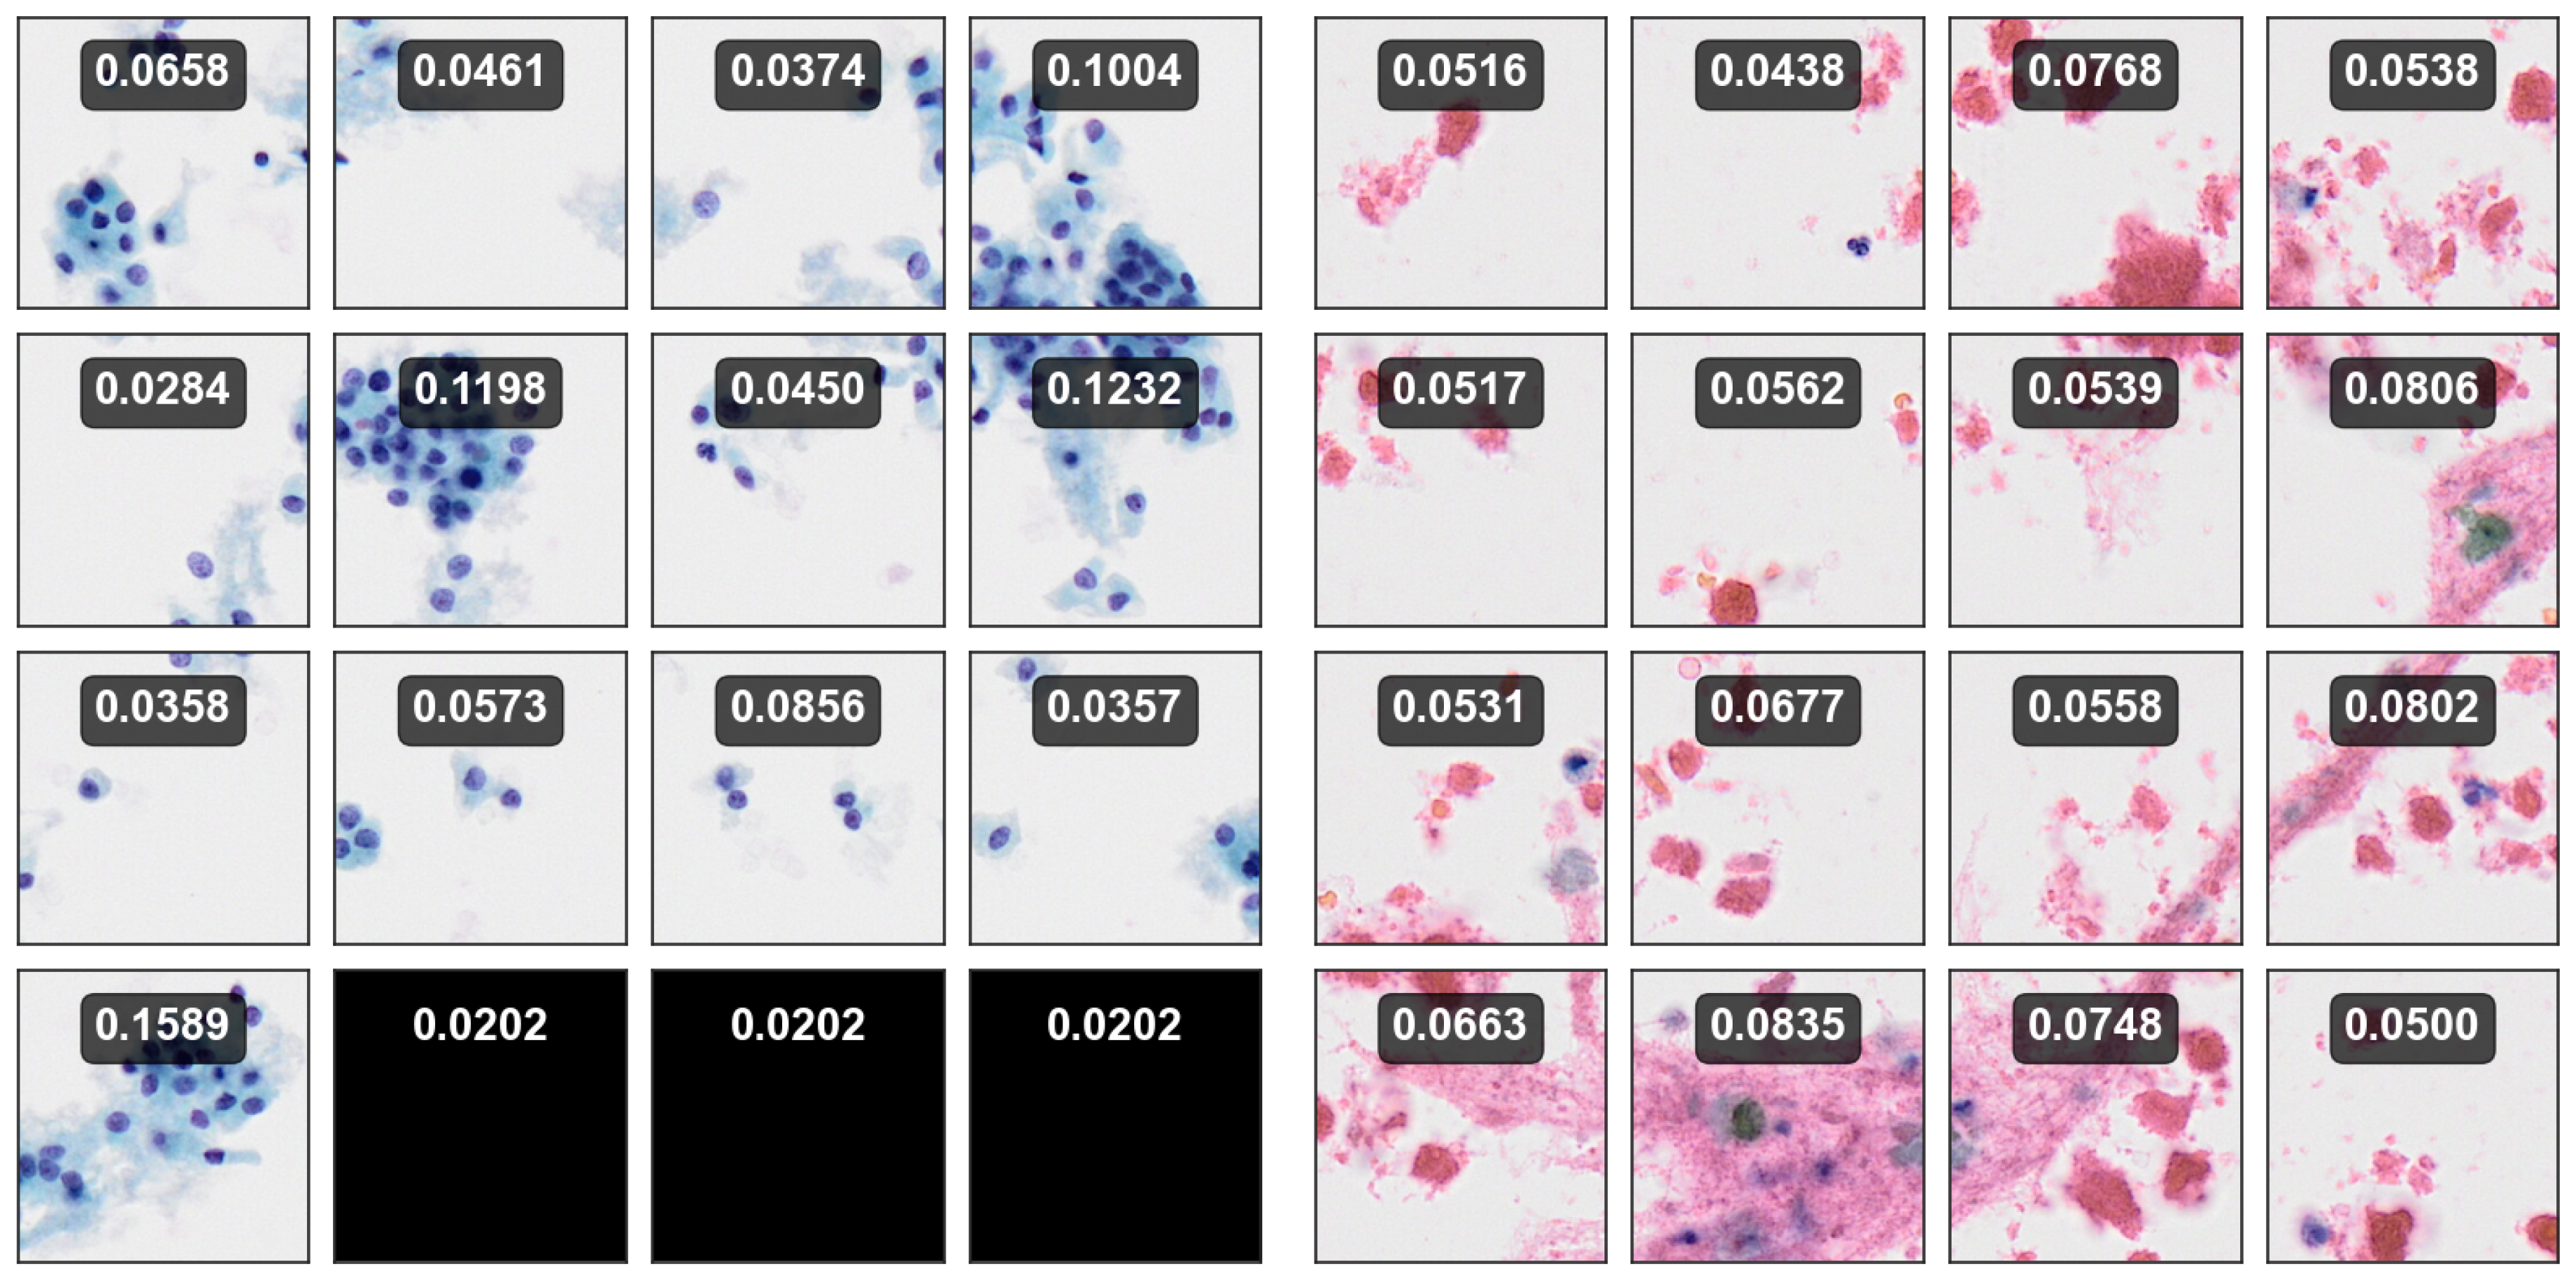
Furthermore, we can visually examine the attention scores of AD-MIL to provide evidence that such accurate diagnoses can be extended to larger regions. The AD-MIL introduced in Section.
Section 4.2 trains the attention score values
for multiple instance patches within a bag and uses these scores to make bag-level decisions by considering the relative importance of each region.
Figure 13 illustrates attention score maps for 4 BP images, each consisting of 16 SP images. The maps depict the importance of each SP, where higher attention scores are assigned to regions that contribute more significantly to the bag-level diagnosis. This highlights the model can focus on regions that are more diagnostically important and relevant.
7. Discussion
In this paper, we have presented two deep learning frameworks for the classification of thyroid cytopathology images based on the TBS categories. The first framework is a CNN-based model that classifies small patch images into four categories and the second one is an AD-MIL model that classifies bag of small patch images into the same categories based on their bag-level (big patch-level) labels. We have evaluated the performance of both frameworks using various metrics, such as accuracy, precision, recall, F1-score, AUC, and AP. And, we have also used confusion matrices, classification reports, simple analysis of uncertainty, and visualizations using Grad-CAM and attention scores to identify the strengths and weaknesses of the models.
Our results show that the TCS-CNN model effectively classifies small patch images from WSIs, achieving notable performance in distinguishing between four distinct TBS categories, including benign and malignant lesions. The simplicity of the model architecture, consisting of basic convolutional layers with regularization strategies, contributes to its efficiency in classifying small patches while avoiding over-fitting. The addition of AD-MIL, designed to handle weakly labeled data, represents high accuracy for larger patch-level datasets by aggregating instance-level features into bag-level predictions using an attention mechanism. The model demonstrates the potential of such methods for large-scale medical image datasets, where manual labeling at the small patch-level is impractical and offers more scalable and cost-effective approach to analyzing large cytopathological datasets.
Our findings are consistent with prior studies, which used CNNs and the multiple instance learning for thyroid cytopathology analysis. However, we define a unit for the small patch and sequentially aggregate them to create bag-level datasets, transitioning from smaller patch units to slightly larger patch areas. This approach demonstrates a difference from other studies that construct bag-level datasets based on whole-slide images. Furthermore, the incorporation of a simple, efficient CNN architecture is key to improving classification performance without requiring highly complex model designs.
Despite the promising results, several limitations need to be addressed. One of the primary challenges is the inherent noise introduced by weak annotations, particularly in small patches that did not fully labeled by expert cytopathologists. Although AD-MIL mitigates this to some extent, the overall quality of small patch-level labels still impacts the model’s ability to classify instances with high precision. Moreover, while our model achieves good performance on the validation dataset, its generalizability to other datasets with different characteristics or annotation quality remains to be tested.
Finally, future works can focus on several key areas to further improve the model’s performance and applicability. First, improving labeling techniques using semi-supervised or active learning methods can help alleviate the impact of weak annotations by dynamically refining label quality. Additionally, evaluating the generalization of models to other malignancies or cytopathological datasets, possibly through transfer learning, can enhance its versatility. Data augmentation strategies can also be explored to strengthen the robustness of models by generating synthetic samples that reflect various lesion characteristics. Similarly, enhancing model explainability, particularly identifying which patches or features contribute most to the final classification, can improve its clinical relevance and facilitate its integration into medical practice.
8. Conclusions
Our study presents a novel contribution to the field of thyroid cytopathology by applying artificial intelligence and deep learning techniques to analyze cytological images obtained from fine-needle aspiration cytology. We propose two deep learning frameworks, utilizing two distinct types of datasets: a small patch-level classifier employing TCS-CNN architecture, and a bag-level(big patch-level) classifier employing an AD-MIL framework.
Our results show that both frameworks achieve high accuracy and recall scores, demonstrating their effectiveness in distinguishing between different types of thyroid lesions. TCS-CNN achieves an accuracy of 97% and a recall of 96%, while the AD-MIL model achieves an accuracy of 97% and a recall of 96%. These results are comparable or superior to the existing methods for image analysis of thyroid cytopathology. Moreover, both frameworks outperform the pre-trained CNN models, such as VGG-16, Inception-v3, and Mobilenet, indicating that our custom-designed TCS-CNN model is more suitable for the task.
However, both frameworks also have some limitations and challenges that need to be addressed. The TCS-CNN relies on small patch-level labels for the small patch images and the weakly annotated labels are derived from the labels of the big patch images, which may not reflect the true labels of the small patch images. The AD-MIL model overcomes this problem by using the bag-level labels, which are more accurate and consistent. However, the AD-MIL model also faces some challenges, such as the handling of missing or irrelevant instances and the interpretation of the attention scores. In addition, although our study did not directly perform WSI-level classification due to the limited availability of WSIs, this remains a crucial task in the field of thyroid cytopathology. We believe that our patch-level classification approach can serve as a foundation for advancing towards WSI-level diagnosis via patch aggregation methods in the future.
In summary, we have shown that both frameworks can achieve high accuracy and recall scores, and can capture the relevant features and small and big regions of interest in the whole slide images. We have also discussed the limitations and challenges of both frameworks, and suggested some possible directions for future research. Our work contributes to the field of thyroid cytopathology by providing novel and effective methods for the analysis of cytological images derived from FNAC, offering rapid and precise results for PTC differential diagnosis. Our work also opens avenues for enhanced patient outcomes and cost-effective healthcare solutions.
Author Contributions
Conceptualization, S.Y.O, S.C. and Y.M.L; methodology, S.Y.O. and D.J.K; validation, S.C. and D.J.K; investigation, J.H.P. and H.J.K.; resources, J.H.P. and H.J.K.; data curation, S.C. and Y.M.L.; writing—original draft preparation, S.Y.O; writing—review and editing, S.C. and Y.M.L.; All authors have read and agreed to the published version of the manuscript.
Funding
This research received no external funding.
Institutional Review Board Statement
This study was conducted with the approval of the ethics committee from the Institutional Review Board (IRB) of Wonju Severance Christian Hospital, Yonsei University, Wonju College of Medicine (IRB approval number: CR320109).
Informed Consent Statement
Not applicable.
Data Availability Statement
Some or all datasets generated during and/or analyzed during the current study are not publicly available but are available from the corresponding author on reasonable request.
Conflicts of Interest
The authors declare no conflicts of interest.
References
- Frasoldati, A.; Flora, M.; Pesenti, M.; Caroggio, A.; Valcavi, R. Computer-assisted cell morphometry and ploidy analysis in the assessment of thyroid follicular neoplasms. Thyroid 2001, 11, 941–946. [Google Scholar] [CrossRef]
- Gupta, N.; Sarkar, C.; Singh, R.; Karak, A.K. Evaluation of diagnostic efficiency of computerized image analysis based quantitative nuclear parameters in papillary and follicular thyroid tumors using paraffin-embedded tissue sections. Pathology Oncology Research 2001, 7, 46–55. [Google Scholar] [CrossRef] [PubMed]
- Murata, S.i.; Mochizuki, K.; Nakazawa, T.; Kondo, T.; Nakamura, N.; Yamashita, H.; Urata, Y.; Ashihara, T.; Katoh, R. Detection of underlying characteristics of nuclear chromatin patterns of thyroid tumor cells using texture and factor analyses. Cytometry: The Journal of the International Society for Analytical Cytology 2002, 49, 91–95. [Google Scholar] [CrossRef] [PubMed]
- Karslıoğlu, Y.; Celasun, B.; Günhan, Ö. Contribution of morphometry in the differential diagnosis of fine-needle thyroid aspirates. Cytometry Part B: Clinical Cytometry: The Journal of the International Society for Analytical Cytology 2005, 65, 22–28. [Google Scholar] [CrossRef]
- Aiad, H.; Abdou, A.; Bashandy, M.; Said, A.; Ezz-Elarab, S.; Zahran, A. Computerized nuclear morphometry in the diagnosis of thyroid lesions with predominant follicular pattern. Ecancermedicalscience 2009, 3. [Google Scholar] [CrossRef]
- Tsantis, S.; Dimitropoulos, N.; Cavouras, D.; Nikiforidis, G. Morphological and wavelet features towards sonographic thyroid nodules evaluation. Computerized Medical Imaging and Graphics 2009, 33, 91–99. [Google Scholar] [CrossRef] [PubMed]
- Ozolek, J.A.; Tosun, A.B.; Wang, W.; Chen, C.; Kolouri, S.; Basu, S.; Huang, H.; Rohde, G.K. Accurate diagnosis of thyroid follicular lesions from nuclear morphology using supervised learning. Medical image analysis 2014, 18, 772–780. [Google Scholar] [CrossRef] [PubMed]
- Daskalakisa, A.; Kostopoulosa, S.; Spyridonosa, P.; Glotsosa, D.; Ravazoulab, P.; Kardarib, M.; Kalatzisc, I.; Cavourasc, D.; Nikiforidisa, G. Design of a multi-classifier system for discriminating benign from malignant thyroid nodules using routinely H&E-stained cytological images 3. Computers in Biologyand Medicine 2008, 38, 196–203. [Google Scholar]
- Wang, W.; Ozolek, J.A.; Rohde, G.K. Detection and classification of thyroid follicular lesions based on nuclear structure from histopathology images. Cytometry Part A: The Journal of the International Society for Advancement of Cytometry 2010, 77, 485–494. [Google Scholar] [CrossRef]
- Gopinath, B.; Shanthi, N. Support Vector Machine based diagnostic system for thyroid cancer using statistical texture features. Asian Pacific Journal of Cancer Prevention 2013, 14, 97–102. [Google Scholar] [CrossRef] [PubMed]
- Margari, N.; Mastorakis, E.; Pouliakis, A.; Gouloumi, A.R.; Asimis, E.; Konstantoudakis, S.; Ieromonachou, P.; Panayiotides, I.G. Classification and regression trees for the evaluation of thyroid cytomorphological characteristics: a study based on liquid based cytology specimens from thyroid fine needle aspirations. Diagnostic Cytopathology 2018, 46, 670–681. [Google Scholar] [CrossRef] [PubMed]
- Maleki, S.; Zandvakili, A.; Gera, S.; Khutti, S.D.; Gersten, A.; Khader, S.N. Differentiating noninvasive follicular thyroid neoplasm with papillary-like nuclear features from classic papillary thyroid carcinoma: Analysis of cytomorphologic descriptions using a novel machine-learning approach. Journal of pathology informatics 2019, 10, 29. [Google Scholar] [CrossRef]
- LeCun, Y.; Bottou, L.; Bengio, Y.; Haffner, P. Gradient-based learning applied to document recognition. Proceedings of the IEEE 1998, 86, 2278–2324. [Google Scholar] [CrossRef]
- LeCun, Y.; Bengio, Y.; Hinton, G. Deep learning. nature 2015, 521, 436–444. [Google Scholar] [CrossRef]
- Simonyan, K.; Zisserman, A. Very deep convolutional networks for large-scale image recognition. arXiv 2014, arXiv:1409.1556 2014. [Google Scholar]
- He, K.; Zhang, X.; Ren, S.; Sun, J. Deep residual learning for image recognition. In Proceedings of the Proceedings of the IEEE conference on computer vision and pattern recognition, 2016, pp.
- Szegedy, C.; Vanhoucke, V.; Ioffe, S.; Shlens, J.; Wojna, Z. Rethinking the inception architecture for computer vision. In Proceedings of the Proceedings of the IEEE conference on computer vision and pattern recognition, 2016, pp.
- Kim, E.; Corte-Real, M.; Baloch, Z. A deep semantic mobile application for thyroid cytopathology. In Proceedings of the Medical Imaging 2016: PACS and Imaging Informatics: Next Generation and Innovations. SPIE, Vol. 9789; 2016; pp. 36–44. [Google Scholar]
- Sanyal, P.; Mukherjee, T.; Barui, S.; Das, A.; Gangopadhyay, P. Artificial intelligence in cytopathology: a neural network to identify papillary carcinoma on thyroid fine-needle aspiration cytology smears. Journal of pathology informatics 2018, 9, 43. [Google Scholar] [CrossRef] [PubMed]
- Guan, Q.; Wang, Y.; Ping, B.; Li, D.; Du, J.; Qin, Y.; Lu, H.; Wan, X.; Xiang, J. Deep convolutional neural network VGG-16 model for differential diagnosing of papillary thyroid carcinomas in cytological images: a pilot study. Journal of Cancer 2019, 10, 4876. [Google Scholar] [CrossRef] [PubMed]
- Wang, Y.; Guan, Q.; Lao, I.; Wang, L.; Wu, Y.; Li, D.; Ji, Q.; Wang, Y.; Zhu, Y.; Lu, H.; et al. Using deep convolutional neural networks for multi-classification of thyroid tumor by histopathology: a large-scale pilot study. Annals of translational medicine 2019, 7. [Google Scholar] [CrossRef] [PubMed]
- Elliott Range, D.D.; Dov, D.; Kovalsky, S.Z.; Henao, R.; Carin, L.; Cohen, J. Application of a machine learning algorithm to predict malignancy in thyroid cytopathology. Cancer cytopathology 2020, 128, 287–295. [Google Scholar] [CrossRef]
- Irshad, H.; Veillard, A.; Roux, L.; Racoceanu, D. Methods for nuclei detection, segmentation, and classification in digital histopathology: a review—current status and future potential. IEEE reviews in biomedical engineering 2013, 7, 97–114. [Google Scholar] [CrossRef]
- Nayak, N.; Chang, H.; Borowsky, A.; Spellman, P.; Parvin, B. Classification of tumor histopathology via sparse feature learning. In Proceedings of the 2013 IEEE 10th international symposium on biomedical imaging. IEEE; 2013; pp. 410–413. [Google Scholar]
- Hou, L.; Samaras, D.; Kurc, T.M.; Gao, Y.; Davis, J.E.; Saltz, J.H. Patch-based convolutional neural network for whole slide tissue image classification. In Proceedings of the Proceedings of the IEEE conference on computer vision and pattern recognition, 2016, pp.
- Durand, T.; Thome, N.; Cord, M. Weldon: Weakly supervised learning of deep convolutional neural networks. In Proceedings of the Proceedings of the IEEE conference on computer vision and pattern recognition, 2016, pp.
- Courtiol, P.; Tramel, E.W.; Sanselme, M.; Wainrib, G. Classification and disease localization in histopathology using only global labels: A weakly-supervised approach. arXiv 2018, arXiv:1802.02212 2018. [Google Scholar]
- Couture, H.D.; Marron, J.S.; Perou, C.M.; Troester, M.A.; Niethammer, M. Multiple instance learning for heterogeneous images: Training a cnn for histopathology. In Proceedings of the Medical Image Computing and Computer Assisted Intervention–MICCAI 2018: 21st International Conference, Granada, Spain, 2018, Proceedings, Part II 11. Springer, 2018, September 16-20; pp. 254–262.
- Ilse, M.; Tomczak, J.; Welling, M. Attention-based deep multiple instance learning. In Proceedings of the International conference on machine learning. PMLR; 2018; pp. 2127–2136. [Google Scholar]
- Wang, Z.; Poon, J.; Sun, S.; Poon, S. Attention-based multi-instance neural network for medical diagnosis from incomplete and low quality data. In Proceedings of the 2019 International joint conference on neural networks (IJCNN). IEEE; 2019; pp. 1–8. [Google Scholar]
- Wang, S.; Zhu, Y.; Yu, L.; Chen, H.; Lin, H.; Wan, X.; Fan, X.; Heng, P.A. RMDL: Recalibrated multi-instance deep learning for whole slide gastric image classification. Medical image analysis 2019, 58, 101549. [Google Scholar] [CrossRef] [PubMed]
- Dov, D.; Kovalsky, S.Z.; Cohen, J.; Range, D.E.; Henao, R.; Carin, L. Thyroid cancer malignancy prediction from whole slide cytopathology images. In Proceedings of the Machine Learning for Healthcare Conference. PMLR; 2019; pp. 553–570. [Google Scholar]
- Qiu, S.; Guo, Y.; Zhu, C.; Zhou, W.; Chen, H. Attention Based Multi-Instance Thyroid Cytopathological Diagnosis with Multi-Scale Feature Fusion. In Proceedings of the 2020 25th International Conference on Pattern Recognition (ICPR). IEEE; 2021; pp. 3536–3541. [Google Scholar]
- Dov, D.; Kovalsky, S.Z.; Assaad, S.; Cohen, J.; Range, D.E.; Pendse, A.A.; Henao, R.; Carin, L. Weakly supervised instance learning for thyroid malignancy prediction from whole slide cytopathology images. Medical image analysis 2021, 67, 101814. [Google Scholar] [CrossRef]
- Cibas, E.S.; Ali, S.Z. The 2017 Bethesda system for reporting thyroid cytopathology. Thyroid 2017, 27, 1341–1346. [Google Scholar] [CrossRef]
- He, K.; Zhang, X.; Ren, S.; Sun, J. Delving deep into rectifiers: Surpassing human-level performance on imagenet classification. In Proceedings of the Proceedings of the IEEE international conference on computer vision, 2015, pp.
- Pappas, N.; Popescu-Belis, A. Explaining the stars: Weighted multiple-instance learning for aspect-based sentiment analysis. In Proceedings of the Proceedings of the 2014 Conference on Empirical Methods In Natural Language Processing (EMNLP), 2014, pp.
- Pappas, N.; Popescu-Belis, A. Explicit document modeling through weighted multiple-instance learning. Journal of Artificial Intelligence Research 2017, 58, 591–626. [Google Scholar] [CrossRef]
- Deng, J.; Dong, W.; Socher, R.; Li, L.J.; Li, K.; Fei-Fei, L. Imagenet: A large-scale hierarchical image database. In Proceedings of the 2009 IEEE conference on computer vision and pattern recognition. Ieee; 2009; pp. 248–255. [Google Scholar]
- Howard, A.G.; Zhu, M.; Chen, B.; Kalenichenko, D.; Wang, W.; Weyand, T.; Andreetto, M.; Adam, H. Mobilenets: Efficient convolutional neural networks for mobile vision applications. arXiv 2017, arXiv:1704.04861 2017. [Google Scholar]
- Kingma, D.P.; Ba, J. Adam: A method for stochastic optimization. arXiv 2014, arXiv:1412.6980 2014. [Google Scholar]
- Guo, C.; Pleiss, G.; Sun, Y.; Weinberger, K.Q. On calibration of modern neural networks. In Proceedings of the International conference on machine learning. PMLR; 2017; pp. 1321–1330. [Google Scholar]
- Pearce, T.; Brintrup, A.; Zhu, J. Understanding softmax confidence and uncertainty. arXiv 2021, arXiv:2106.04972 2021. [Google Scholar]
- Selvaraju, R.R.; Cogswell, M.; Das, A.; Vedantam, R.; Parikh, D.; Batra, D. Grad-cam: Visual explanations from deep networks via gradient-based localization. In Proceedings of the Proceedings of the IEEE international conference on computer vision, 2017, pp.
|
Disclaimer/Publisher’s Note: The statements, opinions and data contained in all publications are solely those of the individual author(s) and contributor(s) and not of MDPI and/or the editor(s). MDPI and/or the editor(s) disclaim responsibility for any injury to people or property resulting from any ideas, methods, instructions or products referred to in the content. |
© 2025 by the authors. Licensee MDPI, Basel, Switzerland. This article is an open access article distributed under the terms and conditions of the Creative Commons Attribution (CC BY) license (http://creativecommons.org/licenses/by/4.0/).