
Submitted:
30 May 2025
Posted:
03 June 2025
You are already at the latest version
Abstract
Salinity is one of the major abiotic factors that limits citrus productivity. This research focused on the effects of bio-stimulants derived from Rosmarinus officinalis, Pinus pinea) and shrimp chitin, on the biochemical responses, as well as the adaptive strategies of citrus under salt stress. Photosynthetic pigments, osmolytes such as proline and soluble sugars, nutrition availability, iron rheostats and secondary metabolites were analyzed to determine salt stress tolerance. Our results demonstrated that different bio-stimulant enhances photosynthetic efficiency and increases chlorophyll levels. In addition, the negative impact of salinity on citrus was mitigated by increasing osmoprotectant levels, which play a crucial role in reactive oxygen species (ROS) balance. The present study elucidates the impact of rosemary bio-stimulant which has been found to enhance better salt stress tolerance, increasing levels of soluble sugars to maintain photosynthetic sta-bility. Furthermore, plants treated with Rosemary maintained moderate levels of stress biomarkers, namely proline and carotenoids. To tolerate salt stress, this bio-stimulant helps to optimize soil homeostasis and improves its edaphic properties, by reducing electrical conductivity and stabilizing K+/Na+ ratio. Nevertheless, it maintains the availability of essential nutrients, including sodium, Potassium, Phosphorus and iron. LCMS/MS analysis revealed significant accumulation of defense-related secondary me-tabolites in citrus plants treated with rosemary, including kojic acid and kaempferol. Nevertheless, stressed plants accumulated increased levels of stress-signaling compo-nents and defensive antioxidants, particularly salicylic acid and ferulic acid.
Keywords:
bio-stimulant
; salt stress
; citrus
; homeostasis
; adaptative strategies
; secondary metabolites
1. Introduction
Citrus, a genus belonging to the Rutaceae family, includes orange, lemons and grapefruit. Mainly in tropical and subtropical zones, these fruit trees are grown in over 130 countries [1,2]. Annual world citrus production is estimated at around 158.5 million tones. In 2021, the main producing countries were China, Brazil, India and Mexico [3]. According to the data from FAO, global citrus exports in 2019 exceeded 17.4 million tons, with an economic value that surpassed $14 billion. These exports reached $16 billion in 2021 and $17.2 billion in 2023. In that year, citrus ranked 23rd in terms of world trade value among the 1,217 traded products. Spain was the main exporter, with exports valued at 3.75 billion dollars. South Africa and Turkey followed, with exports valued at 2.43 billion and 1.27 billion dollars, respectively. The main importers were the USA, Germany, and France [4]. Conversely, in developing countries such as Algeria and Egypt, citrus is among the most economically significant crops. In Algeria, for instance, production has surpassed 1.5 million tons (FAO, 2021). [5] CNCC data in 2015 revealed a total of 272 citrus varieties in Algeria, of which 34 are indigenous varieties, with clementine being the most popular [6,7]. Although citrus species are considered significant and strategic crops from an economic and nutritional standpoint, their global production is gradually declining due to unfavourable climatic conditions [8].
Salt stress, one of the major abiotic stresses that affects plant development and growth, from germination to harvest. Recently, salinity has precipitated a decline in productivity particularly in arid and semi-arid zones, where low precipitation rates and high evaporation are noted [9]. Salinity increases osmotic pressure and reduces water uptake [10]. Ionic imbalance, due to high concentrations of soluble ions associated with salinity, has been demonstrated to induce toxicity and nutrient deficiency in plants. Mitochondria and chloroplasts are also affected by this ionic disturbance [11,12]. Salt stress induces an alteration in molecular oxygen, leading to excessive production of reactive oxygen species (ROS) [13,14]. Citrus are widely considered the most sensitive crop to salinity [15]. This stress alters their growth rate and nutrient uptake, as well as their net synthetic productivity [16,17,18]. To better adapt to salt stress, citrus plants modify their morphological profiles, developing smaller, thicker leaves to limit water loss [19]. Additionally, these plants undergo biochemical changes by accumulating compatible osmolytes, such as proline and sugars, to maintain their osmotic homeostasis [20]. Salt stress induces oxidative stress through the excessive accumulation of ROS. To cope with this disruption, Citrus plants increase the activity of specific enzymes, such as catalase (CAT), as well as calcium (Ca) uptake, in order to strengthen their antioxidant defense system and stabilize membranes [21,22,23]. To better tolerate abiotic stress, bio-stimulants can be applied to boost plant resilience and limit damages caused by climate change [24]. The application of plant-derived bio-stimulants leads to physiological and molecular changes, including osmotic adjustments and adaptation mechanisms through the biosynthesis of secondary metabolites, such as alkaloids and phenolic compounds. It also activates antioxidant defenses while improving plant growth and development and enhancing resistance to biotic and abiotic stresses [25,26,27,28].
The aim of this research was to study the effects of bio-stimulants based on Rosemary (Rosmarinus officinalis), Pinyon pine (Pinus pinea) and shrimp chitin on various physiological and phytochemical parameters in citrus plants under salt stress conditions. This study focused on the analysis of photosynthetic pigments (chlorophyll a, b, total and carotenoid), proline accumulation and soluble sugars, ion homeostasis as well as secondary metabolite biosynthesis, suggesting the bio-stimulant that could give better photosynthetic efficiency, osmotic adjustment and salinity adaptation.
2. Results
2.1. Effect of Different Bio-Stimulants on Phytochemical Parameters in Citrus Plants Under Salt Stress
2.1.1. Effects of Bio-Stimulants on Chlorophyll Levels Under Salinity Stress
- Chlorophyll, a crucial photosynthetic pigment, is essential for capturing light energy and plant growth. The results of this study indicated that the Rosemary’s (TRRO), Pinyon pine (TRPP) and shrimp chitin’s (TRSC) bio-stimulants led to significant variations in the accumulation of chlorophyll a (Chl a), chlorophyll b (Chl b), total chlorophyll (a + b), and carotenoids (Carot), compared to the salt-stressed control (CBSS) (Figure 1).
- All bio-stimulants showed higher chlorophyll a (Chl a) contents compared to the CBSS throughout the year, especially during the growth period (March to July). Whereas, in the later block, an increase was observed in April and July, reaching 1.48 mg. g-1 FM. Early in the season, TRPP noted the highest peak in April 1.60 mg. g-1 FM. While TRSC, showed significant values in July, October and December. However, TRRO displayed moderate peaks all over the year, with its highest level observed in April (1.42 mg. g-1 FM) (Figure 1a).
- The stressed control block (CBSS) showed the lowest chlorophyll b levels throughout the year. While TRPP noted a notable increase, especially in January (1.12 mg.g-1 FM), June (3.27 mg.g-1 FM) and December (0.91 mg.g-1 FM), followed by TRSC, with peaks in June and August (3.31 mg.g-1 FM and 1.74 mg.g-1 FM). In contrast, TRRO showed moderate but consistent levels, reaching 1.45 mg. g-1 FM in July and 0.67 mg.g-1 FM in November (Figure 1b).
- Total chlorophyll (Chl a + b) was positively influenced by bio-stimulants compared to CBSS. TRPP exhibited important total chlorophyll levels, particularly at the start of the season, reaching 3.15 mg. g-1 FM in April and 4.14 mg. g-1 FM in June. TRRO and TRSC evolved in a similar way. The maximum value of total chlorophyll on TRSC was noted in June (3.64 mg. g-1 FM), followed by TRRO in July (2.26 mg. g-1 FM) (Figure 1c).
- Carotenoides are stress indicators that usually increase under salt stress. In the present study, TRPP and TRSC exhibited higher carotenoid contents for most of the season, reaching their maximum values in May (~0. 7mg.g-1 FM). Then, they decreased but they maintained higher levels than those of TRRO and CBSS. TRRO noted stable and moderate carotenoid levels throughout the year, reaching a maximum value of 0. 34mg.g-1 FM, indicating better stress management (Figure 1d).
2.1.2. Effects of Bio-Stimulants on Proline Content Under Salinity Stress
The graph presents the monthly variation of proline content in the experimental blocs. Significant variation between these blocks is marked. TRRO showed the lowest proline levels throughout most of the year (0.003 mg. g-1 FM in January). TRPP and TRSC exhibited the highest values, especially during the stress period from April to July, with a peak in May (23.48 mg. g-1 FM in TRPP and 25.97 mg. g-1 FM in TRSC). After August, proline levels decreased in all groups, However, the TPRO maintained the lowest values (Figure 2).
2.1.3. Effects of Bio-Stimulants on Soluble Sugars Content Under Salinity Stress
All treated groups exhibited a progressive increase in soluble sugars content from March to November. TRPP recorded the highest accumulation in April (3.96 mg.g-1 FM), followed by CBSS and TRSC (~3.3mg.g-1 FM), while the TPRO showed the lowest value (0.27 mg.g-1 FM). However, from July to December, soluble sugars levels follow a similar pattern across all treatments (figure 3).
2.1.4. Correlation Matrix Between Different Phytochemical Parameters
To better understand the seasonal dynamics and treatment induced responses, a correlation matrix was established between the different phytochemical parameters, in particular chlorophyll a, chlorophyll b, total chlorophyll, carotenoids, soluble sugars and proline to determinate any relationship between them. From January (J) to April (A), these different parameters showed significant correlation (elongated dark blue ellipses). The strongest positive correlation coefficient noted in February (F) (r = 0.87). However, the strongest negative correlation (Red ellipses) was found in May (M) (r = - 0.30). From September (S) to December (D), the correlation strengthened once more, becoming strongly positive in December (r = 0.91) (Figure 4).
2.1.5. Clustering and Grouping of Physicochemical Parameters Under Salt Stress
This PCA allows us to visualize the effect of different bio-stimulants (TRRO, TRPP, TRSC) on the accumulation of primary and secondary metabolites (chlorophyll a, chlorophyll b, total chlorophyll, carotenoids, proline and soluble sugars) comparing to the control block (CBSS). PC1 contributed 86.08% and PC2 5.59%, together showed a significant proportion of the total variance (over 91%). This PCA reveals three main groups. The first one included the proline levels across the different blocks, showing a strong correlation with axis 02 during the month of May (M). The lowest proline content is noted in TRRO (13.22 mg. g-1FM). The second group includes contents of soluble sugars and total chlorophyll, which are strongly correlated with axis 01 during the period from July (JUI) to December (D). TRRO exhibited the lowest soluble sugars content (1.4 mg. g-1 FM), whereas the total chlorophyll was the highest (2.26 mg. g-1 FM). The third group, comprising chlorophyll a, chlorophyll b and carotenoid levels, was positively correlated with axis 01. Within this group, carotenoid’s accumulation, a marker of stress, was lower in TRRO (0.01 mg. g-1FM) (Figure 5a).
In addition to the PCA, we performed a hierarchical clustering analysis (dendrogram) to show the similarities between the different parameters. This approach allowed us to identify 4 clusters. The 1st one includes chlorophyll levels (a, b, and total chlorophyll). However, the second cluster includes carotenoids, marker of stress. The last one is closely related to the third cluster, which contains proline levels. Finally, soluble sugars are grouped in the 4th cluster (Figure 5b).
2.2. Effect of Different Bio-Stimulants on Soil Elements in Citrus Plants Under Salt Stress
A comparative study of soil chemical parameters showed that the TRRO block was more tolerant to salt stress. In fact, these plants show a low electrical conductivity (EC= 0.571 dS/m) and a moderate sodium content (Na= 15.12 mg/l), compared to CBSS, which shows the highest electrical conductivity (1.672 dS/m) and a significant accumulation of sodium (Na= 94.05 mg/l). In contrast, the TRSC also showed high EC and sodium content (EC= 1.39 dS/m, Na= 69.09 mg/l). Although the TRPP has a low sodium content (Na= 14.90 mg/l), it retains a relatively high EC (EC= 1.267 dS/m). In addition, the exchangeable potassium content of TRRO (K= 12.17 mg/l) is higher than that of the controls (7.33 mg/l) and closer to that of TRSC (11.34 mg/l). TRPP had the highest level (K= 38.81 mg/l). Calcium and magnesium, two key elements for cell stability and enzyme activation under stress, show remarkable levels in TRRO (Mg = 34.29 mg/l, Ca = 469.3 mg/l). However, this block is very rich in iron compared to the other blocks (TRRO = 12.7 mg/l, CBSS = 2 mg/l, TRPP = 3.4 mg/l, TRSC = 3.6 mg/l) Table 1.
2.3. Valorisation of Rosemary's Bio-Stimulant (TRRO) Under Salt Stress
Based on plant phytochemistry results and soil physico-chemical parameters, secondary metabolite analysis by LC-MS/MS was carried out on the rosemary-treated block (TRRO) compared with the control block (CBSS), to achieve a more profound comprehension of stress tolerance mechanism.
The choice of Venn analysis was established to better understand the distribution of secondary metabolite components in Rosemary treated plants (TRRO) compared with control (CBSS) under salt stress.
2.3.1. Venn Analysis of Secondary Metabolites Under Salt Stress
The Venn flower depicts the distribution of 23 identified secondary metabolites including flavonoids, phenolic acids and beta carotene, with 13 compounds common in both blocks (CBSS and TRRO) and 10 compounds present in a single block (Figure 6a). Venn network analysis was employed to reveal more details of the various compounds. 4 compounds were detected in the leaves of plants treated with rosemary bio-stimulant (TRRO) which are: Kojic acid, Kaempferol, Cis-p coumaric acid and Hydroxy quinoline. However, Thymol, Ferulic acid, Caffeic acid, coumaric acid, salicylic acid and 2-methoxybenzoic acid were present only in the leaves of control plants (CBSS). 13 compounds were commonly found in both blocks, notably Rutin, Quercetin, Beta carotene, Chrysin (Figure 6b).
2.3.2. Mantel Scalogram
The figure shows a Mantel scalogram, revealing a homogeneous co-structure between the phytochemical, soil parameters and secondary metabolites matrix in citrus plants treated with a rosemary bio-stimulant (TRRO) and stressed control plants (CBSS).
The dominant bright red zone demonstrated a strong positive correlation between phytochemicals, including chlorophyll a, b, total chlorophyll and carotenoids, soil parameters and secondary metabolites. This association suggests a close relationship between variation in secondary metabolites and the other parameters. However, the yellow-orange zone shows a moderate correlation.
A partial breakdown of the correlation is shown by a slight greenish-blue spot, which signifies non-linear changes in the various matrix mentioned above. These changes are caused by the negative effect of salt stress (Figure 7).
3. Discussion
Crops grown in arid and semi-arid zones are frequently confronted with extreme abiotic conditions, including drought, elevated temperatures, and soil salinity. These environmental constraints significantly disrupt key physiological and metabolic processes in plants [29,30]. Salinity, in particular, promotes the accumulation of soluble salts in the soil [31], thereby impairing vegetative growth and leading to considerable declines in crop productivity [32,33,34]. It adversely affects water and nutrient uptake mechanisms [35], and induces both ionic and oxidative stress that compromise vital cellular functions, including photosynthesis [36,37,38,39]. In response, plants activate a range of physiological and biochemical defense mechanisms to preserve ion homeostasis, osmotic balance, and the regulation of reactive oxygen species (ROS) levels [40].
Salinity-induced oxidative stress results from the accumulation of ROS within plant cells. This excessive production disrupts the delicate balance between their generation and detoxification, leading to oxidative damage at the cellular level [41]. Such damage includes the peroxidation of proteins, lipids, and even nucleic acids [42,43].
Photosynthetic pigments, including carotenoids, are essential for the photosynthetic process in plants [44,45]. Under salt stress, plants exhibit a significant reduction in chlorophyll content due to the instability of protein complexes and the accumulation of chlorophyll-degrading enzymes such as chlorophyllase [46,47,48]. Simultaneously, plants activate natural defense mechanisms, including the synthesis of compatible osmolytes. These molecules help mitigate oxidative stress caused by the overproduction of ROS, thereby protecting subcellular structures [49,50].
In this study, control plants (CBSS) under salinity stress showed a significant decline in photosynthetic pigments. Our findings are consistent with those of [51], who reported that salinity reduces photosynthetic pigment levels in tomato plants. This decline may result from the reduction in leaf surface area, which is critical for light capture and photosynthesis [52,53]. Furthermore, salinity alters the thylakoid membranes in chloroplasts and restricts photosystem II (PSII) activity. These changes lead to a reduction in quantum efficiency and photochemical quenching—two key parameters for optimal energy conversion during photosynthesis [54].
Da Silva and his collaborators in [55] , confirmed that salinity stress severely impairs photosynthetic function and chlorophyll concentration in Oryza sativa, as sodium ion (Na⁺) accumulation disrupts ionic balance and osmotic potential, inducing structural and functional damage to the photosynthetic system.
Numerous studies indicate that natural plant extracts enhance the growth of various cultivated crops, such as wheat [56,57], fenugreek, chickpea, and maize [45,58,59] respectively. This strategy has been proposed as a cost-effective and environmentally friendly solution [60,61].
Rania and her collaborators in [62], demonstrated that the application of rosemary essential oil to wheat plants alleviated the negative effects of salinity stress on photosynthetic efficiency, as evidenced by increased chlorophyll fluorescence. These results align with our findings, where TRRO plants exhibited moderate chlorophyll peaks throughout the growing season. Rosemary extract stimulates the plant’s primary defense mechanisms against salinity stress by enhancing osmoprotectant synthesis for osmotic adjustment and improving photosynthetic efficiency.
Pinus spp. extracts also function as bio-stimulants that can enhance plant salinity tolerance. Azevedo and his collaborators in [63], reported that Pinus pinaster cells exposed to salt stress exhibited marked oxidative stress due to ROS accumulation. Moreover, Ferreira and his collaborators in [63], confirmed that P. Pinaster bark is notably rich in phenolic and flavonoid compounds, which possess strong antioxidant activity by scavenging salinity-induced ROS. In our study, citrus plants treated with a pinecone bio-stimulant (TRPP) maintained high chlorophyll levels throughout the growth cycle, indicating sustained photosynthetic activity even under saline conditions.
Chitin and chitosan found in the exoskeletons of insects, fungal cell walls, and certain fish scales [64], also contribute to enhanced salinity tolerance in several plant species [65]. Our findings are consistent with those of Peykani and Sepehr in [66], who showed that chitosan application mitigates salinity stress and promotes growth in Triticum aestivum L. And Zea mays L. Similarly, the study of Turk in [67] found that chitosan improves salinity tolerance in maize seedlings. Foliar application of chitosan extracts in salt-stressed tomato plants resulted in significantly increased photosynthetic pigments and improved stress tolerance [51] . Similar findings have been reported in Oryza sativa [68], likely due to chitosan’s role in stimulating ROS scavenging mechanisms in stressed plants [69].
Carotenoids are essential for protecting the photosynthetic apparatus against excess light and play a signaling role during plant development under both abiotic and biotic stress conditions. These photosynthetic pigments, embedded in cellular membranes, mitigate light-induced oxidative damage by scavenging ROS [70,71]. The findings of Gomathi and Rakkiyapan in [72], demonstrated that salinity stress in sugarcane leads to a significant reduction in carotenoid content. Similarly, Yildiz and Terzi in [73], observed comparable results in wheat plants exposed to high temperatures. Merlene and her collaborators in [74], further reported that Lycopersicon esculentum subjected to salinity stress exhibited downregulation of carotenoid biosynthesis genes in the leaves. In contrast to these studies, our observations revealed a notable increase in carotenoid levels following various treatments compared to the stressed control. This enhancement may be attributed to the protective role of carotenoids in shielding the photosynthetic machinery from oxidative damage by neutralizing ROS and stabilizing cellular membranes [70,71].
Proline, a key signaling molecule, accumulates in response to abiotic stresses, particularly salinity. As a compatible osmoprotectant, it plays a critical role in maintaining redox homeostasis and scavenging ROS [53,75]. Under saline conditions, levels of osmolytes such as proline significantly increase to sustain plant water balance and enhance osmotic stress tolerance [76,77]. In our study, significant increases in proline content were observed in (TRPP) plants and stressed control plants (CBSS), especially during the vegetative growth phase. Mahmoud and his collaborators in [18], reported similar proline accumulation in soybean plants under salinity stress. Comparable results have been approved by [78,79,80]. Moreover, plants treated with the shrimp chitin bioproduct (TRSC) also showed elevated proline levels, confirming findings by [81] and [82] for plant of Carthamus tinctorius L. and Helianthus annuus L., as well as those by [51] for tomato plants. However, rosemary treated plants (TRRO) displayed relatively low proline concentrations throughout the year. This could be due to rosemary’s capacity to induce salinity stress tolerance and promote osmotic adjustment, thereby reducing the need for excessive proline accumulation. These findings contrast with those reported by [62].
In response to abiotic stresses such as salinity, plants activate defense systems to protect cells from oxidative stress. This response requires vital energy sources, notably soluble sugars [83,84]. In salt-stressed plants, the content of soluble sugars increases. These sugars function as osmoprotectants, helping to decrease membrane permeability and limit water loss [85,86]. In our study, both stressed citrus control (CBSS) plants and those treated with various bio-stimulants exhibited a progressive increase in soluble sugar content. These findings are consistent with those of Mustapha and his collaborators in [87], who reported that three citrus rootstocks increased their soluble sugar content under salinity stress. Similarly, [88] confirmed that leaves and sheaths of Oryza sativa L. show elevated soluble sugar levels under salt stress. Foliar application of chitosan also led to a significant increase in soluble sugars by promoting the synthesis of enzymes essential for glycolysis [89,90]. According to [91], this accumulation helps protect soluble enzymes from the toxicity caused by high intracellular concentrations of inorganic ions. The increase in soluble sugar content in rosemary-treated wheat seedlings under salt stress, as reported by [62], can be attributed to rosemary’s ability to stabilize photosynthetic activity.
Cluster analysis, principal component analysis (PCA), and correlation matrix all revealed a positive correlation between osmolyte content (soluble sugars) and photosynthetic pigments in response to salinity stress. Meanwhile, proline another key osmoprotectant increases under salt stress to scavenge ROS [92,93], in line with the findings of Mohamed and his collaborators in [51].
Salt-stressed plants often exhibit disrupted uptake of essential nutrients required for photosynthesis and biomass accumulation [94], such as nitrogen (N), phosphorus (P), which is vital for energy storage, and potassium (K), essential for guard cell turgor [95,96]. Salinity disrupts the K⁺/Na⁺ balance, which is critical for cellular ion homeostasis. After different treatment, comparative analysis of soil chemical parameters and Mantel scalogram revealed that the TRRO group showed the highest tolerance to salinity. This was evidenced by the lowest electrical conductivity (EC), indicating reduced salt accumulation in the soil. Additionally, sodium, potassium, and phosphorus levels were moderate in this block compared to other treatments and controls, with a particularly favorable K⁺/Na⁺ ratio, a key indicator of ionic balance and salinity tolerance. Ion homeostasis, especially the K⁺/Na⁺ ratio, is a crucial physiological strategy for salinity adaptation [97,98]. Other studies [99,100], note that under salt stress, plants tend to absorb more Na⁺ and less K⁺, thereby lowering the K⁺/Na⁺ ratio. While [101], highlighted deficiencies in Ca²⁺, Mg²⁺, and K⁺ due to ionic competition from Na⁺ and Cl⁻, our results showed substantial levels of calcium and magnesium, both essential for cellular stability and enzymatic activity under stress. Furthermore, iron (Fe), known for its antioxidant role in enhancing stress tolerance, was also present in significant concentrations.
Both biotic and abiotic stresses, especially salinity, significantly alter plant metabolite profiles, leading to the production of secondary metabolites that form part of the plant’s natural defense system [20,102]. Among these, phenolic compounds play a critical role in protecting against oxidative stress induced by salinity [103,104,105], by inhibiting hydroperoxide breakdown and neutralizing lipid free radicals. Due to their structure, these antioxidants detoxify ROS and mitigate the harmful effects of salt stress [106,107], Flavonoids, a class of phenolics, are synthesized and accumulated during biotic and abiotic stress to trap ROS [108,109,110,111].
LC-MS/MS analysis of secondary metabolites revealed significant differences in the metabolite profiles between rosemary-treated plants (TRRO) and salt-stressed controls (CBSS). TRRO plants accumulated greater quantities of defense-related antioxidant compounds, including kojic acid, which mitigates ROS-induced cellular damage; kaempferol, a flavonoid involved in cell elongation and differentiation [112]; hydroxyquinoline, which mitigates sodium toxicity; and cis-p-coumaric acid, a potent antioxidant that strengthens cell walls and neutralizes free radicals [113]. Similarly, Huirong and his collaborators in [114], reported increased p-coumaric acid levels in Salicornia europaea roots under salt stress, attributed to its antioxidant role in mitigating salt-induced damage.
In contrast, the CBSS group exhibited higher levels of caffeic acid, a phenolic antioxidant that promotes cell growth, division, and elongation [115]. Under salinity stress, caffeic acid enhances nutrient uptake and reduces ion toxicity [116], prevents chlorophyll degradation by scavenging ROS [117], improves water relations, and facilitates potassium absorption in stressed wheat plants [118]. This group also showed elevated levels of salicylic acid, a well-known stress signaling compound with roles in oxidative stress [119], drought [120,121,122], salinity, and osmotic stress responses. Salicylic acid enhances antioxidant enzyme activity and facilitates ROS accumulation to improve stress tolerance [123]. It has been shown to alleviate growth inhibition in salt-stressed tomato plants [124,125] and to enhance net CO₂ assimilation in mustard plants [126].
Ferulic acid was also significantly accumulated in the control block. Its foliar application in Brassica rapa under salt stress enhances antioxidant activity and reduces oxidative damage [127], Both blocks accumulated additional antioxidant flavonoids such as rutin, myricetin, and quercetin which scavenge ROS in roots and shoots, offering protection to Apocynum venetum against salt-induced oxidative stress [128].
Our findings suggest that rosemary bio-stimulant treatment enhances salinity tolerance by scavenging ROS, activating antioxidant defense mechanisms, improving photosynthesis, and promoting the synthesis of osmoprotectants for osmotic balance. These results align with the findings of Rania Ben Saad and her collaborators [62], who demonstrated that rosemary essential oil treatment improves salinity tolerance in durum wheat seedlings.
4. Materials and Methods
4.1. Plant Materials and Experimental Site
The experiment was carried out at a nursery in TEBESSA, eastern Algeria (35° 27 '42 “N, 7°58'54” E), a region characterized by a semi-arid climate. In 2021, the average annual temperature was 17.9°C and the total annual precipitation was 192.02 mm. Forty-eight three-year-old Citrus plants (Thomson variety), cultivated in large pots, were subjected to salt stress for a specified period. The plants were then divided into four experimental blocks. The first one served as the control (CBSS), receiving irrigation exclusively from water. The remaining three blocks were also irrigated with water, but in addition, once a month, they received a foliar application of a bio-stimulant we had previously prepared based on pinecone (TRPP), a rosemary (TRRO) and a shrimp chitin (TRSC). Irrigation was provided once a week during the winter, and daily in the evening during the summer season. One week after each application, leaves were randomly collected from different leaf orientations, for the analysis of phytochemical parameters and secondary metabolites.
4.2. Extraction and Preparation of Bio-Stimulant
4.2.1. Rosemary's Bio-Stimulant
In January 2021,The rosemary shrub (Rosmarinus officinalis L) of the Lamiaceae family was harvested in optimal health conditions from their plantations of the Departments of Biotechnology and Agroecology of the Faculty of Sciences of the University of Blida 1 during the flowering season. The plant samples experienced were physical cleaning and rinsed four times with distilled water to remove any dust or other residues. These shrubs were dried for two weeks in the dark at 24°C. Then, grounded into powder. Afterward, they were extracted using Soxhlet apparatus coupled with ultrasonic application. We used pure methanol (99.7%) as a solvent for 1 h at 60°C. Using a rotary evaporator (Buchi Rotavapor R-210), the extracted raw product was concentrated under reduced pressure, and then stored at 4°C until further analysis [129,130].
4.2.2. Shrimp Chitin’s Bio-Stimulant
Chitin is found in a diverse range of organisms, such as insects, fishes and crustaceans [64]. Shrimp shells were washed, stripped of their legs, dried and ground to a powder. The same rosemary's extraction method was adopted for these shrimp shells.
4.2.3. Pinion Pin’s Bio-Stimulant
Pinecones (Pinus pinea L.) were collected in December 2020 in the Mhaba/Gouraya region, Tipaza, Algeria. The pine cones were oven-dried at 180° for 10 min to facilitate decortication. After decortication, the pine cones were ground to a powder in a grinder. A sufficient quantity of powder was soaked in a 95% ethanol solution for 24 hours in three cycles. The mixture was then filtered and the residues extracted with boiling water for 2 hours, repeated in three successive cycles, then at room temperature with a 1% NaOH solution. After filtration, the filtered solution was successively precipitated with 3 then 5 volumes of ethanol. Before evaporation under reduced pressure at 40°C, we washed the sediment with pure ethanol and then with ethyl ether [131].
4.3. Determination of Photosynthetic Pigments in Citrus Leaves
The contents of chlorophyll a,b and carotenoids were measured by taking 50 g of citrus leaf powder inserted into 5 ml of 95% ethanol solution and put in dark for 24 h, followed by centrifugation at 2500 rpm for 5 min. After that, the supernatant was collected in a new and clean tube. For the remaining tissues, we repeated the same procedure, and the supernatant was added to the new tube. Using a spectrophotometer U.V. (Perkin Elmer Lambda 5 U.V), the optical density was recorded at 665, 649 and 447 [132,133].
Chlorophyll a, b and carotenoid contents were determined in milligrams per gram of fresh material (mg/g MF) by putting the absorbance values in the following formula, while pure ethanol was used as a blank:
- Chlorophyll a concentration(mg/L) = 12.7× OD665 - 2.69 × OD649
- Chlorophyll b concentration(mg/L) = 22.9× OD649 - 4.86 × OD665
- Total chlorophyll concentration (mg/L) = 8.02× OD6655 +20.20× OD649
- Photosynthetic pigment content (mg/g) = (photosynthetic pigment concentration × extraction volume) / sample mass
4.4. Determination of Free Proline Content
The procedure of [134] was employed to estimate the proline content in fresh leaves of Citrus. We homogenized 0.5 g of fresh leaf with 3% of sulphosalicylic acid in a mortar. During 10 minutes, this homogenate was centrifuged at 10,000×g in a centrifuge machine. After that, we add a mix of 5 ml of sulphosalicylic acid, 2 ml of glacial acetic acid and 25 mg of ninhydrin to the supernatant. We heated this mixture in a boiling water bath for one hour and stopped the reaction by placing these test tubes into an ice bath. 5 ml of toluene was mixed to the reaction mixture and shaking vigorously for 20–30 s. Finaly, the toluene layer was aspirated and incubated at room temperature and the absorbance of red colour read at 520 nm using a spectrophotometer U.V. (Perkin Elmer Lambda 5 U.V) .
4.5. Determination of Soluble Sugars
1.0 g fresh Citrus leaves was crushed and rinsed with 5 to 10 ml ddH₂O, then the extracts were filtered and boiled for 30 min. After that, 0.5ml of extract solution and 1.5ml ddH₂O were added to 25ml tube and slowly mixed with 0.5ml anthrone-ethyl acetate and 5 ml concentrated sulfuric acid, then boiled for 1 min. After cooling down at room temperature, we measured the absorbance at 630 nm using a spectrophotometer U.V. (Perkin Elmer Lambda 5 U.V) [135].
4.6. Soil Analysis
To measure the chemical characteristics of the soil, we used the method adapted from Jackson [136]. Soil samples were ground and pulverized. The suspension (1:2.5, soil: distilled water) was then stirred and equilibrated for 30 minutes. PH values were sustained following the method of Schofield and his collaborators [137], applying a hydrogen ion-selective electrode. Soluble salts (Na⁺, K₂O, Ca²⁺, Mg²⁺) were analysed using a PSP flame photometer (Jenway 6405 UV/Vis, Algiers, Algeria) but electrical conductivity (EC) was assessed with a calibrated conductivity meter. Olsen's protocol was employed to determine assimilable phosphorus (P₂O₅). While iron (Fe) and copper (Cu) were extracted using the DTPA method Lindsay and his collaborators [138].
4.7. LC-MS /MS Methode
In order to analyze secondary metabolites in the control (CBSS) and rosemary-treated block samples (TRRO), UPLC-ESI-MS-MS Shimadzu 8040 Ultra-High sensitivity with UFMS technology was employed and equipped with binary bump Nexera XR LC-20AD. On a Restek Ultra C18 3µm 150x4.6mm column, the mobile phase consisted of solvent A (water, 0.1% formic acid) and solvent B (methanol). the flow rate was : 0.4 mL/min, and the following gradient program was used: 0.1- 2 min, A 95%, 2-15 min, A 95%, 15-18 min, A 5%, 18 -20 min, A 5% and finally up to 25 minute, A95%. With a total analysis time of 25 minutes, we have injected 5 µL per sample. A negative ESI mode, with the following parameters ensured detection; CID gas, 230 KPs; conversion dynode, −6.00 Kv; interface temperature, 350 ◦C; DL temperature, 250 ◦C; nebulizing gas flow, 3.00 L/min; heat block, 400 ◦C; drying gas flow, 15.00 L/min. For optimization of polyphones standards, we used direct injection without columns.
4.8. Statistical Analysis
Statistical analysis, graphing and standard error were performed by using Microsoft Excel 2024. Correlation analyses, Mantel correlogram, hierarchical clusters analysis (HCA) and principatel component analysis (PCA) were analyzed using the Past program (Version 5.0 Algiers, Algeria). Our Data were subjected to a one-way analysis of variance (ANOVA) and Kruskal-Wallis tests with significance level estimated at p ≤0.05 using the same statistical program. Venn interactive flower plot and network analysis of secondary metabolites were performed by using the free online program, the EVenn (http://www.ehbio.com/test/venn/#/, accessed on 18 March 2025 at 21:27 pm).
5. Conclusions
In conclusion, the present study highlighted the positive impacts of different bio-stimulants derived from Rosmarinus officinalis, Pinus pinea, and shrimp chitin on the biochemical and metabolic processes of citrus plants under salt stress. These bio-stimulants enhance citrus adaptation, by maintaining photosynthetic efficiency and increasing osmoprotectants synthesis to ensure osmotic balance. Furthermore, they contribute to ROS scavenging, thus limiting oxidative damage and strengthening the plant’s defense system. Our results suggest that rosemary bio-stimulant demonstrated the greatest efficacy in terms of phytochemistry and edaphically. Citrus plants treated with rosemary showed stable chlorophyll contents. In addition, they exhibited moderate proline and carotenoid levels, indicating stress mitigation. Soluble sugars increased gradually, indicating an enhanced metabolic activity. At edaphic level, rosemary bio-stimulants reduced electrical conductivity and maintained a better K+/Na+ ratio, which is responsible for cellular ionic homeostasis. Finally, from a metabolic perspective, it promotes the accumulation of secondary metabolites of defense, notably phenolic compounds, which play a crucial role in protecting plants against oxidative stress induced by salt stress.
Funding
This research received no external funding
Conflicts of Interest
The authors declare no conflict of interest.
Abbreviations
The following abbreviations are used in this manuscript:
| DTPA | Diethylene Triamine Pentaacetic Acid |
| ROS | Reactive Oxygen Species |
| FAO | Food and Agriculture Organization |
| CAT | Catalase |
| CNCC | National Company of Statutory Auditors |
References
- Citrus Genetics and Breeding. In Advances in Plant Breeding Strategies: Fruits; Springer International Publishing: Cham, 2018; pp. 403–436 ISBN 978-3-319-91943-0.
- Kalita, B.; Roy, A.; Annamalai, A.; Ptv, L. A Molecular Perspective on the Taxonomy and Journey of Citrus Domestication. Perspectives in Plant Ecology, Evolution and Systematics 2021, 53, 125644. [CrossRef]
- Citrus Fruit Fresh and Processed Statistical Bulletin 2020.
- OEC (2023) The Observatory of Economic Complexity 2025.
- CNCC (2015) Bulletin Des Variétés Des Agrumes. Centre National de Contrôle et de Certification Des Semences et Plants, Alger.
- INRAA (2006) Rapport National Sur l’état Des Ressources Phytogénétiques Pour l’alimentation et l’agriculture. Institut National de La Recherche Agronomique d’Algérie, Alger.
- Citrus Production Conditions in Algeria: Drought and Irrigation Issues. In Greening of Industry Networks Studies; Springer Nature Switzerland: Cham, 2024; pp. 61–83 ISBN 978-3-031-63792-6.
- United States Department of Agriculture Foreign Agricultural Service. Citrus: World Markets and Trade; Foreign Agricultural Service/USDA: Washington, DC, USA, January 2025. 2025.
- Jha, U.C.; Bohra, A.; Jha, R.; Parida, S.K. Salinity Stress Response and ‘Omics’ Approaches for Improving Salinity Stress Tolerance in Major Grain Legumes. Plant Cell Rep 2019, 38, 255–277. [CrossRef]
- Romero, P.; Dodd, I.C.; Martinez-Cutillas, A. Contrasting Physiological Effects of Partial Root Zone Drying in Field-Grown Grapevine (Vitis Vinifera L. Cv. Monastrell) According to Total Soil Water Availability. Journal of Experimental Botany 2012, 63, 4071–4083. [CrossRef]
- Numan, M.; Bashir, S.; Khan, Y.; Mumtaz, R.; Shinwari, Z.K.; Khan, A.L.; Khan, A.; AL-Harrasi, A. Plant Growth Promoting Bacteria as an Alternative Strategy for Salt Tolerance in Plants: A Review. Microbiological Research 2018, 209, 21–32. [CrossRef]
- Dourmap, C.; Roque, S.; Morin, A.; Caubrière, D.; Kerdiles, M.; Béguin, K.; Perdoux, R.; Reynoud, N.; Bourdet, L.; Audebert, P.-A.; et al. Stress Signalling Dynamics of the Mitochondrial Electron Transport Chain and Oxidative Phosphorylation System in Higher Plants. Annals of Botany 2020, 125, 721–736. [CrossRef]
- Halliwell, B. Reactive Species and Antioxidants. Redox Biology Is a Fundamental Theme of Aerobic Life. Plant Physiology 2006, 141, 312–322. [CrossRef]
- Oukarroum, A.; Bussotti, F.; Goltsev, V.; Kalaji, H.M. Correlation between Reactive Oxygen Species Production and Photochemistry of Photosystems I and II in Lemna Gibba L. Plants under Salt Stress. Environmental and Experimental Botany 2015, 109, 80–88. [CrossRef]
- Maas, E.V. Salinity and Citriculture. Tree Physiology 1993, 12, 195–216. [CrossRef]
- Anjum, M.A. Effect of NaCl Concentrations in Irrigation Water on Growth and Polyamine Metabolism in Two Citrus Rootstocks with Different Levels of Salinity Tolerance. Acta Physiol Plant 2007, 30, 43–52. [CrossRef]
- Ruiz, D.; Martinez, V.; Cerda, A. Citrus Response to Salinity: Growth and Nutrient Uptake. Tree Physiology 1997, 17, 141–150. [CrossRef]
- Mahmoud, L.; Dutt, M.; Vincent, C.; Grosser, J. Salinity-Induced Physiological Responses of Three Putative Salt Tolerant Citrus Rootstocks. Horticulturae 2020, 6, 90. [CrossRef]
- Kalal, P. Impact of Salinity Stress on Citrus Production and Its Alleviation Strategies.
- Munns, R.; Tester, M. Mechanisms of Salinity Tolerance. Annu. Rev. Plant Biol. 2008, 59, 651–681. [CrossRef]
- Mittler, R. Oxidative Stress, Antioxidants and Stress Tolerance. Trends in Plant Science 2002, 7, 405–410. [CrossRef]
- Asada, K. Production and Scavenging of Reactive Oxygen Species in Chloroplasts and Their Functions. Plant Physiology 2006, 141, 391–396. [CrossRef]
- Larkindale, J.; Knight, M.R. Protection against Heat Stress-Induced Oxidative Damage in Arabidopsis Involves Calcium, Abscisic Acid, Ethylene, and Salicylic Acid. Plant Physiology 2002, 128, 682–695. [CrossRef]
- Mandal, S.; Anand, U.; López-Bucio, J.; Radha; Kumar, M.; Lal, M.K.; Tiwari, R.K.; Dey, A. Biostimulants and Environmental Stress Mitigation in Crops: A Novel and Emerging Approach for Agricultural Sustainability under Climate Change. Environmental Research 2023, 233, 116357. [CrossRef]
- Di Sario, L.; Boeri, P.; Matus, J.T.; Pizzio, G.A. Plant Biostimulants to Enhance Abiotic Stress Resilience in Crops. IJMS 2025, 26, 1129. [CrossRef]
- Ceccarelli, A.V.; Miras-Moreno, B.; Buffagni, V.; Senizza, B.; Pii, Y.; Cardarelli, M.; Rouphael, Y.; Colla, G.; Lucini, L. Foliar Application of Different Vegetal-Derived Protein Hydrolysates Distinctively Modulates Tomato Root Development and Metabolism. Plants 2021, 10, 326. [CrossRef]
- Rouphael, Y.; Carillo, P.; Ciriello, M.; Formisano, L.; El-Nakhel, C.; Ganugi, P.; Fiorini, A.; Miras Moreno, B.; Zhang, L.; Cardarelli, M.; et al. Copper Boosts the Biostimulant Activity of a Vegetal-Derived Protein Hydrolysate in Basil: Morpho-Physiological and Metabolomics Insights. Front. Plant Sci. 2023, 14, 1235686. [CrossRef]
- Lucini, L.; Miras-Moreno, B.; Rouphael, Y.; Cardarelli, M.; Colla, G. Combining Molecular Weight Fractionation and Metabolomics to Elucidate the Bioactivity of Vegetal Protein Hydrolysates in Tomato Plants. Front. Plant Sci. 2020, 11, 976. [CrossRef]
- Sanchez, D.H.; Siahpoosh, M.R.; Roessner, U.; Udvardi, M.; Kopka, J. Plant Metabolomics Reveals Conserved and Divergent Metabolic Responses to Salinity. Physiologia Plantarum 2008, 132, 209–219. [CrossRef]
- Kumari, A.; Das, P.; Parida, A.K.; Agarwal, P.K. Proteomics, Metabolomics, and Ionomics Perspectives of Salinity Tolerance in Halophytes. Front. Plant Sci. 2015, 6. [CrossRef]
- Vartanian, N.; Lemée, G. La notion d’adaptation à la sécheresse. Bulletin de la Société Botanique de France. Actualités Botaniques 1984, 131, 7–15. [CrossRef]
- Greenway, H.; Munns, R. Mechanisms of Salt Tolerance in Nonhalophytes. Annu. Rev. Plant. Physiol. 1980, 31, 149–190. [CrossRef]
- Shannon, M.C. Adaptation of Plants to Salinity. In Advances in Agronomy; Elsevier, 1997; Vol. 60, pp. 75–120 ISBN 978-0-12-000760-8.
- Munns, R. Comparative Physiology of Salt and Water Stress. Plant Cell & Environment 2002, 25, 239–250. [CrossRef]
- Chourasia, K.N.; Lal, M.K.; Tiwari, R.K.; Dev, D.; Kardile, H.B.; Patil, V.U.; Kumar, A.; Vanishree, G.; Kumar, D.; Bhardwaj, V.; et al. Salinity Stress in Potato: Understanding Physiological, Biochemical and Molecular Responses. Life 2021, 11, 545. [CrossRef]
- Carillo, P.; Grazia, M.; Pontecorvo, G.; Fuggi, A.; Woodrow, P. Salinity Stress and Salt Tolerance. In Abiotic Stress in Plants - Mechanisms and Adaptations; Shanker, A., Ed.; InTech, 2011 ISBN 978-953-307-394-1.
- Nouha, K.; Mkaddem Mounira, G.; Lamia, H.; Shahhat, I.; Mehrez, R.; Arbi, G. Physiological and Biochemical Responses in Mediterranean Saltbush (Atriplex Halimus L., Amaranthaceae Juss.) to Heavy Metal Pollution in Arid Environment. PAK. J. BOT. 2024, 56. [CrossRef]
- Iftikhar, N.; Perveen, S. Riboflavin (Vitamin B2) Priming Modulates Growth, Physiological and Biochemical Traits of Maize (Zea Mays L.) under Salt Stress. PAK. J. BOT. 2024, 56. [CrossRef]
- Hamdi, J.; Kmeli, N.; Bettaieb, I.; Bouktila, D. Genome-Wide Analysis of bZIP Family Genes Identifies Their Structural Diversity, Evolutionary Patterns and Expression Profiles in Response to Salt Stress in Sugar Beet. PAK. J. BOT. 2024, 56. [CrossRef]
- Yang, Y.; Guo, Y. Unraveling Salt Stress Signaling in Plants. JIPB 2018, 60, 796–804. [CrossRef]
- Hao, S.; Wang, Y.; Yan, Y.; Liu, Y.; Wang, J.; Chen, S. A Review on Plant Responses to Salt Stress and Their Mechanisms of Salt Resistance. Horticulturae 2021, 7, 132. [CrossRef]
- Hayat, S.; Hayat, Q.; Alyemeni, M.N.; Wani, A.S.; Pichtel, J.; Ahmad, A. Role of Proline under Changing Environments: A Review. Plant Signaling & Behavior 2012, 7, 1456–1466. [CrossRef]
- Farissi, M.; Aziz, F.; Bouizgaren, A.; Ghoulam, C. La symbiose Légumineuses-rhizobia sous conditions de salinité : Aspect Agro-physiologique et biochimique de la tolérance.
- Gururani, M.A.; Venkatesh, J.; Tran, L.S.P. Regulation of Photosynthesis during Abiotic Stress-Induced Photoinhibition. Molecular Plant 2015, 8, 1304–1320. [CrossRef]
- Abdel Latef, A.A.H.; Mostofa, M.G.; Rahman, Md.M.; Abdel-Farid, I.B.; Tran, L.-S.P. Extracts from Yeast and Carrot Roots Enhance Maize Performance under Seawater-Induced Salt Stress by Altering Physio-Biochemical Characteristics of Stressed Plants. J Plant Growth Regul 2019, 38, 966–979. [CrossRef]
- Reddy MP, V.A. Salinity Induced Changes in Pigment Composition and Chlorophyllase Activity of Wheat. Indian Journal of Plant Physiology, 1986, Vol. 29, 331–334 ref. 9.
- Sayyari, M.; Ghanbari, F.; Fatahi, S.; Bavandpour, F. Chilling Tolerance Improving of Watermelon Seedling by Salicylic Acid Seed and Foliar Application. Not Sci Biol 2013, 5, 67–73. [CrossRef]
- Abdel Latef, A.A.H.; Srivastava, A.K.; Saber, H.; Alwaleed, E.A.; Tran, L.-S.P. Sargassum Muticum and Jania Rubens Regulate Amino Acid Metabolism to Improve Growth and Alleviate Salinity in Chickpea. Sci Rep 2017, 7, 10537. [CrossRef]
- Abdallah, M.M.-S.; Abdelgawad, Z.A.; El-Bassiouny, H.M.S. Alleviation of the Adverse Effects of Salinity Stress Using Trehalose in Two Rice Varieties. South African Journal of Botany 2016, 103, 275–282. [CrossRef]
- Abdel Latef, A.A.H.; Srivastava, A.K.; El-sadek, M.S.A.; Kordrostami, M.; Tran, L.P. Titanium Dioxide Nanoparticles Improve Growth and Enhance Tolerance of Broad Bean Plants under Saline Soil Conditions. Land Degrad Dev 2018, 29, 1065–1073. [CrossRef]
- Attia, M.S.; Osman, M.S.; Mohamed, A.S.; Mahgoub, H.A.; Garada, M.O.; Abdelmouty, E.S.; Abdel Latef, A.A.H. Impact of Foliar Application of Chitosan Dissolved in Different Organic Acids on Isozymes, Protein Patterns and Physio-Biochemical Characteristics of Tomato Grown under Salinity Stress. Plants 2021, 10, 388. [CrossRef]
- Xu, Y.; This, D.; Pausch, R.C.; Vonhof, W.M.; Coburn, J.R.; Comstock, J.P.; McCouch, S.R. Leaf-Level Water Use Efficiency Determined by Carbon Isotope Discrimination in Rice Seedlings: Genetic Variation Associated with Population Structure and QTL Mapping. Theor Appl Genet 2009, 118, 1065–1081. [CrossRef]
- Abdel Latef, A.A.H.; Abu Alhmad, M.F.; Kordrostami, M.; Abo–Baker, A.-B.A.-E.; Zakir, A. Inoculation with Azospirillum Lipoferum or Azotobacter Chroococcum Reinforces Maize Growth by Improving Physiological Activities Under Saline Conditions. J Plant Growth Regul 2020, 39, 1293–1306. [CrossRef]
- Tabassam, T.; Kanwal, S.; Saqlan Naqvi, S.M.; Ali, A.; Zaman, B.-; Akhtar, M.E. Effect of Manganese Application on PS-II Activity in Rice under Saline Conditions. IJAB 2016, 18, 837–843. [CrossRef]
- Viana, J.D.S.; Lopes, L.D.S.; Carvalho, H.H.D.; Cavalcante, F.L.P.; Oliveira, A.R.F.; Silva, S.J.D.; Oliveira, A.C.D.; Costa, R.S.D.; Mesquita, R.O.; Gomes-Filho, E. Differential Modulation of Metabolites Induced by Salt Stress in Rice Plants. South African Journal of Botany 2023, 162, 245–258. [CrossRef]
- Tomar, N.S.; Agarwal, R.M. Influence of Treatment of <I>Jatropha Curcas</I> L. Leachates and Potassium on Growth and Phytochemical Constituents of Wheat (<I>Triticum Aestivum</I> L.). AJPS 2013, 04, 1134–1150. [CrossRef]
- Tomar, N.S.; Sharma, M.; Agarwal, R.M. Phytochemical Analysis of Jatropha Curcas L. during Different Seasons and Developmental Stages and Seedling Growth of Wheat (Triticum Aestivum L) as Affected by Extracts/Leachates of Jatropha Curcas L. Physiol Mol Biol Plants 2015, 21, 83–92. [CrossRef]
- Abdel Latef, A.A.H.; Abu Alhmad, M.F.; Abdelfattah, K.E. The Possible Roles of Priming with ZnO Nanoparticles in Mitigation of Salinity Stress in Lupine (Lupinus Termis) Plants. J Plant Growth Regul 2017, 36, 60–70. [CrossRef]
- Latef, A.A.A.; Alhmad, M.F.A.; Hammad, S.A. Foliar Application of Fresh Moringa Leaf Extract Overcomes Salt Stress in Fenugreek (Trigonellafoenum-Graecum) Plants. 2017.
- Farooq, M.; Nadeem, F.; Arfat, M.Y.; Nabeel, M.; Musadaq, S.; Cheema, S.A.; Nawaz, A. Exogenous Application of Allelopathic Water Extracts Helps Improving Tolerance against Terminal Heat and Drought Stresses in Bread Wheat ( Triticum Aestivum L. Em. Thell.). J Agronomy Crop Science 2018, 204, 298–312. [CrossRef]
- Ben-Jabeur, M.; Chamekh, Z.; Jallouli, S.; Ayadi, S.; Serret, M.D.; Araus, J.L.; Trifa, Y.; Hamada, W. Comparative Effect of Seed Treatment with Thyme Essential Oil and Paraburkholderia Phytofirmans on Growth, Photosynthetic Capacity, Grain Yield, δ15 N and δ13 C of Durum Wheat under Drought and Heat Stress. Annals of Applied Biology 2022, 181, 58–69. [CrossRef]
- Ben Saad, R.; Ben Romdhane, W.; Wiszniewska, A.; Baazaoui, N.; Taieb Bouteraa, M.; Chouaibi, Y.; Alfaifi, M.Y.; Kačániová, M.; Čmiková, N.; Ben Hsouna, A.; et al. Rosmarinus Officinalis L. Essential Oil Enhances Salt Stress Tolerance of Durum Wheat Seedlings through ROS Detoxification and Stimulation of Antioxidant Defense. Protoplasma 2024, 261, 1207–1220. [CrossRef]
- Ferreira-Santos, P.; Genisheva, Z.; Botelho, C.; Santos, J.; Ramos, C.; Teixeira, J.A.; Rocha, C.M.R. Unravelling the Biological Potential of Pinus Pinaster Bark Extracts. Antioxidants 2020, 9, 334. [CrossRef]
- Lárez-Velásquez, C. Chitosan: An Overview of Its Multiple Advantages for Creating Sustainable Development Poles. Polímeros 2023, 33, e20230005. [CrossRef]
- Malerba, M.; Cerana, R. Chitin- and Chitosan-Based Derivatives in Plant Protection against Biotic and Abiotic Stresses and in Recovery of Contaminated Soil and Water. Polysaccharides 2020, 1, 21–30. [CrossRef]
- Peykani, L.S.; Sepehr, M.F. Effect of Chitosan on Antioxidant Enzyme Activity, Proline, and Malondialdehyde Content in Triticum Aestivum L. and Zea Maize L. under Salt Stress Condition.
- Turk, H. Chitosan-Induced Enhanced Expression and Activation of Alternative Oxidase Confer Tolerance to Salt Stress in Maize Seedlings. Plant Physiology and Biochemistry 2019, 141, 415–422. [CrossRef]
- Faculty of Science and Technology, Nakhon Sawan Rajabhat University, Nakhon Sawan 60000, Thailand; Phothi, R.; Theerakarunwong, C.D.; Faculty of Science and Technology, Nakhon Sawan Rajabhat University, Nakhon Sawan 60000, Thailand Effect of Chitosan on Physiology, Photosynthesis and Biomass of Rice (Oryza Sativa L.) under Elevated Ozone. Aust J Crop Sci 2017, 11, 624–630. [CrossRef]
- Vidhyasekaran, P. Switching on Plant Innate Immunity Signaling Systems; Signaling and Communication in Plants; Springer International Publishing: Cham, 2016; ISBN 978-3-319-26116-4.
- Davison, P.A.; Hunter, C.N.; Horton, P. Overexpression of β-Carotene Hydroxylase Enhances Stress Tolerance in Arabidopsis. Nature 2002, 418, 203–206. [CrossRef]
- Verma, S.; Mishra, S.N. Putrescine Alleviation of Growth in Salt Stressed Brassica Juncea by Inducing Antioxidative Defense System. Journal of Plant Physiology 2005, 162, 669–677. [CrossRef]
- Gomathi, R.; Rakkiyapan, P. Comparative Lipid Peroxidation, Leaf Membrane Thermostability, and Antioxidant System in Four Sugarcane Genotypes Differing in Salt Tolerance.
- Yildiz, M.; Terzi, H. Small Heat Shock Protein Responses in Leaf Tissues of Wheat Cultivars with Different Heat Susceptibility. Biologia 2008, 63, 521–525. [CrossRef]
- Merlene Ann Babu, D.S. and K.M.G. Effect of Salt Stress on Expression of Carotenoid Pathway Genes in Tomato. Journal of Stress Physiology & Biochemistry, 2011, 7, 87–94.
- Szabados, L.; Savouré, A. Proline: A Multifunctional Amino Acid. Trends in Plant Science 2010, 15, 89–97. [CrossRef]
- Kordrostami, M.; Rabiei, B.; Kumleh, H.H. Different Physiobiochemical and Transcriptomic Reactions of Rice (Oryza Sativa L.) Cultivars Differing in Terms of Salt Sensitivity under Salinity Stress. Environ Sci Pollut Res 2017, 24, 7184–7196. [CrossRef]
- Silva-Ortega, C.O.; Ochoa-Alfaro, A.E.; Reyes-Agüero, J.A.; Aguado-Santacruz, G.A.; Jiménez-Bremont, J.F. Salt Stress Increases the Expression of P5cs Gene and Induces Proline Accumulation in Cactus Pear. Plant Physiology and Biochemistry 2008, 46, 82–92. [CrossRef]
- Zhang, L.; Ma, H.; Chen, T.; Pen, J.; Yu, S.; Zhao, X. Morphological and Physiological Responses of Cotton (Gossypium Hirsutum L.) Plants to Salinity. PLoS ONE 2014, 9, e112807. [CrossRef]
- Dawood, M.G. Alleviation of Salinity Stress on Vicia Faba L. Plants via Seed Priming with Melatonin. Acta biol. Colomb. 2014, 20. [CrossRef]
- Selem, E. Physiological Effects of Spirulina Platensis in Salt Stressed Vicia Faba L. Plants. Egypt. J. Bot. 2018, 0, 0–0. [CrossRef]
- Ma, L.; Li, Y.; Yu, C.; Wang, Y.; Li, X.; Li, N.; Chen, Q.; Bu, N. Alleviation of Exogenous Oligochitosan on Wheat Seedlings Growth under Salt Stress. Protoplasma 2012, 249, 393–399. [CrossRef]
- Jabeen, N.; Ahmad, R. The Activity of Antioxidant Enzymes in Response to Salt Stress in Safflower ( Carthamus Tinctorius L.) and Sunflower ( Helianthus Annuus L.) Seedlings Raised from Seed Treated with Chitosan. J Sci Food Agric 2013, 93, 1699–1705. [CrossRef]
- Zhang, H.; Zhu, J.; Gong, Z.; Zhu, J.-K. Abiotic Stress Responses in Plants. Nat Rev Genet 2022, 23, 104–119. [CrossRef]
- Mehdi, F.; Galani, S.; Wickramasinghe, K.P.; Zhao, P.; Lu, X.; Lin, X.; Xu, C.; Liu, H.; Li, X.; Liu, X. Current Perspectives on the Regulatory Mechanisms of Sucrose Accumulation in Sugarcane. Heliyon 2024, 10, e27277. [CrossRef]
- Chaves, M.M. Effects of Water Deficits on Carbon Assimilation. J Exp Bot 1991, 42, 1–16. [CrossRef]
- Baki, G.K.A.; Siefritz, F.; Man, H. -M.; Weiner, H.; Kaldenhoff, R.; Kaiser, W.M. Nitrate Reductase in Zea Mays L. under Salinity. Plant Cell & Environment 2000, 23, 515–521. [CrossRef]
- Mustapha Ait Haddou Mouloud; Bousrhal, A.; Benyahia, H.; Benazzoouz, A. Effet Du Stress Salin Sur l’accumulation de La Proline et Des Sucres Solubles Dans Les Feuilles de Trois Porte-Greffes d’agrumes Au Maroc. Fruits 2002, 57, 335–340. [CrossRef]
- Nemati, I.; Moradi, F.; Gholizadeh, S.; Esmaeili, M.A.; Bihamta, M.R. The Effect of Salinity Stress on Ions and Soluble Sugars Distribution in Leaves, Leaf Sheaths and Roots of Rice (Oryza Sativa L.) Seedlings. Plant Soil Environ. 2011, 57, 26–33. [CrossRef]
- Chamnanmanoontham, N.; Pongprayoon, W.; Pichayangkura, R.; Roytrakul, S.; Chadchawan, S. Chitosan Enhances Rice Seedling Growth via Gene Expression Network between Nucleus and Chloroplast. Plant Growth Regul 2015, 75, 101–114. [CrossRef]
- Rabêlo, V.M.; Magalhães, P.C.; Bressanin, L.A.; Carvalho, D.T.; Reis, C.O.D.; Karam, D.; Doriguetto, A.C.; Santos, M.H.D.; Santos Filho, P.R.D.S.; Souza, T.C.D. The Foliar Application of a Mixture of Semisynthetic Chitosan Derivatives Induces Tolerance to Water Deficit in Maize, Improving the Antioxidant System and Increasing Photosynthesis and Grain Yield. Sci Rep 2019, 9, 8164. [CrossRef]
- Singh, P.; Choudhary, K.K.; Chaudhary, N.; Gupta, S.; Sahu, M.; Tejaswini, B.; Sarkar, S. Salt Stress Resilience in Plants Mediated through Osmolyte Accumulation and Its Crosstalk Mechanism with Phytohormones. Front. Plant Sci. 2022, 13, 1006617. [CrossRef]
- Soshinkova, T.N.; Radyukina, N.L.; Korolkova, D.V.; Nosov, A.V. Proline and Functioning of the Antioxidant System in Thellungiella Salsuginea Plants and Cultured Cells Subjected to Oxidative Stress. Russ J Plant Physiol 2013, 60, 41–54. [CrossRef]
- Azooz, M.M.; Metwally, A.; Abou-Elhamd, M.F. Jasmonate-Induced Tolerance of Hassawi Okra Seedlings to Salinity in Brackish Water. Acta Physiol Plant 2015, 37, 77. [CrossRef]
- Montgomery, R. Relative Importance of Photosynthetic Physiology and Biomass Allocation for Tree Seedling Growth across a Broad Light Gradient. Tree Physiology 2004, 24, 155–167. [CrossRef]
- Ramzan, M.; Haider, S.T.A.; Hussain, M.B.; Ehsan, A.; Datta, R.; Alahmadi, T.A.; Ansari, M.J.; Alharbi, S.A. Potential of Kaempferol and Caffeic Acid to Mitigate Salinity Stress and Improving Potato Growth. Sci Rep 2024, 14, 21657. [CrossRef]
- . F.N.; . R.A.K.-N.; . F.R.; . M.S. Growth and Some Physiological Attributes of Pea (Pisum Sativum L.) As Affected by Salinity. Pakistan J. of Biological Sciences 2007, 10, 2752–2755. [CrossRef]
- Assaha, D.V.M.; Ueda, A.; Saneoka, H.; Al-Yahyai, R.; Yaish, M.W. The Role of Na+ and K+ Transporters in Salt Stress Adaptation in Glycophytes. Front. Physiol. 2017, 8, 509. [CrossRef]
- Ren, Z.-H.; Gao, J.-P.; Li, L.-G.; Cai, X.-L.; Huang, W.; Chao, D.-Y.; Zhu, M.-Z.; Wang, Z.-Y.; Luan, S.; Lin, H.-X. A Rice Quantitative Trait Locus for Salt Tolerance Encodes a Sodium Transporter. Nat Genet 2005, 37, 1141–1146. [CrossRef]
- Zhu, J.-K. Regulation of Ion Homeostasis under Salt Stress. Current Opinion in Plant Biology 2003, 6, 441–445. [CrossRef]
- Horie, T.; Yoshida, K.; Nakayama, H.; Yamada, K.; Oiki, S.; Shinmyo, A. Two Types of HKT Transporters with Different Properties of Na+ and K+ Transport in Oryza Sativa. The Plant Journal 2001, 27, 129–138. [CrossRef]
- Grieve, C.; Grattan, S. Mineral Nutrient Acquisition and Response by Plants Grown in Saline Environments. In Handbook of Plant and Crop Stress, Second Edition; Pessarakli, M., Ed.; Books in Soils, Plants, and the Environment; CRC Press, 1999; Vol. 19990540, pp. 203–229 ISBN 978-0-8247-1948-7.
- Radi, A.A.; Farghaly, F.A.; Hamada, A.M. Physiological and Biochemical Responses of Salt-Tolerant and Salt-Sensitive Wheat and Bean Cultivars to Salinity. 2013, 3, 72–88.
- Castillo, J.M.; Mancilla-Leytón, J.M.; Martins-Noguerol, R.; Moreira, X.; Moreno-Pérez, A.J.; Muñoz-Vallés, S.; Pedroche, J.J.; Figueroa, M.E.; García-González, A.; Salas, J.J.; et al. Interactive Effects between Salinity and Nutrient Deficiency on Biomass Production and Bio-Active Compounds Accumulation in the Halophyte Crithmum Maritimum. Scientia Horticulturae 2022, 301, 111136. [CrossRef]
- Jaleel, C.A.; Riadh, K.; Gopi, R.; Manivannan, P.; Inès, J.; Al-Juburi, H.J.; Chang-Xing, Z.; Hong-Bo, S.; Panneerselvam, R. Antioxidant Defense Responses: Physiological Plasticity in Higher Plants under Abiotic Constraints. Acta Physiol Plant 2009, 31, 427–436. [CrossRef]
- Zhu, J.-K. Genetic Analysis of Plant Salt Tolerance Using Arabidopsis. Plant Physiology 2000, 124, 941–948. [CrossRef]
- Ghanem, A.-M.F.M.; Mohamed, E.; Kasem, A.M.M.A.; El-Ghamery, A.A. Differential Salt Tolerance Strategies in Three Halophytes from the Same Ecological Habitat: Augmentation of Antioxidant Enzymes and Compounds. Plants 2021, 10, 1100. [CrossRef]
- Noctor, G.; Foyer, C.H. ASCORBATE AND GLUTATHIONE: Keeping Active Oxygen Under Control. Annu. Rev. Plant. Physiol. Plant. Mol. Biol. 1998, 49, 249–279. [CrossRef]
- Agati, G.; Biricolti, S.; Guidi, L.; Ferrini, F.; Fini, A.; Tattini, M. The Biosynthesis of Flavonoids Is Enhanced Similarly by UV Radiation and Root Zone Salinity in L. Vulgare Leaves. Journal of Plant Physiology 2011, 168, 204–212. [CrossRef]
- Agati, G.; Azzarello, E.; Pollastri, S.; Tattini, M. Flavonoids as Antioxidants in Plants: Location and Functional Significance. Plant Science 2012, 196, 67–76. [CrossRef]
- Górniak, I.; Bartoszewski, R.; Króliczewski, J. Comprehensive Review of Antimicrobial Activities of Plant Flavonoids. Phytochem Rev 2019, 18, 241–272. [CrossRef]
- Wang, F.; Chen, L.; Chen, H.; Chen, S.; Liu, Y. Analysis of Flavonoid Metabolites in Citrus Peels (Citrus Reticulata “Dahongpao”) Using UPLC-ESI-MS/MS. Molecules 2019, 24, 2680. [CrossRef]
- Felice, M.R.; Maugeri, A.; De Sarro, G.; Navarra, M.; Barreca, D. Molecular Pathways Involved in the Anti-Cancer Activity of Flavonols: A Focus on Myricetin and Kaempferol. IJMS 2022, 23, 4411. [CrossRef]
- Pei, K.; Ou, J.; Huang, J.; Ou, S. P -Coumaric Acid and Its Conjugates: Dietary Sources, Pharmacokinetic Properties and Biological Activities. J Sci Food Agric 2016, 96, 2952–2962. [CrossRef]
- Duan, H.; Tiika, R.J.; Tian, F.; Lu, Y.; Zhang, Q.; Hu, Y.; Cui, G.; Yang, H. Metabolomics Analysis Unveils Important Changes Involved in the Salt Tolerance of Salicornia Europaea. Front. Plant Sci. 2023, 13, 1097076. [CrossRef]
- Huang, R.; Li, C.; Guo, M.; Liu, J.; Qu, L.; Fan, Y.; Zhang, C.; Ge, Y. Caffeic Acid Enhances Storage Ability of Apple Fruit by Regulating Fatty Acid Metabolism. Postharvest Biology and Technology 2022, 192, 112012. [CrossRef]
- Zafar-ul-Hye, M.; Nawaz, M.S.; Asghar, H.; Waqas, M.; Mahmood, F. Caffeic Acid Helps to Mitigate Adverse Effects of Soil Salinity and Other Abiotic Stresses in Legumes.
- Huang, R.; Li, C.; Guo, M.; Xu, H.; Zhang, S.; Wang, M.; Ge, Y. Caffeic Acid Regulated Respiration, Ethylene and Reactive Oxygen Species Metabolism to Suppress Senescence of Malus Domestica. Postharvest Biology and Technology 2022, 194, 112074. [CrossRef]
- Mehmood, H.; Abbasi, G.H.; Jamil, M.; Malik, Z.; Ali, M.; Iqbal, R. Assessing the Potential of Exogenous Caffeic Acid Application in Boosting Wheat (Triticum Aestivum L.) Crop Productivity under Salt Stress. PLoS ONE 2021, 16, e0259222. [CrossRef]
- Shim, I.-S.; Momose, Y.; Yamamoto, A.; Kim, D.-W.; Usui, K. Inhibition of Catalase Activity by Oxidative Stress and Its Relationship to Salicylic Acid Accumulation in Plants. Plant Growth Regulation 2003, 39, 285–292. [CrossRef]
- Senaratna, T.; Touchell, D.; Bunn, E.; Dixon, K. Acetyl Salicylic Acid (Aspirin) and Salicylic Acid Induce Multiple Stress Tolerance in Bean and Tomato Plants. Plant Growth Regulation 2000, 30, 157–161. [CrossRef]
- Németh, M.; Janda, T.; Horváth, E.; Páldi, E.; Szalai, G. Exogenous Salicylic Acid Increases Polyamine Content but May Decrease Drought Tolerance in Maize. Plant Science 2002, 162, 569–574. [CrossRef]
- Singh, B.; Usha, K. Salicylic Acid Induced Physiological and Biochemical Changes in Wheat Seedlings under Water Stress. Plant Growth Regulation 2003, 39, 137–141. [CrossRef]
- Borsani, O.; Valpuesta, V.; Botella, M.A. Evidence for a Role of Salicylic Acid in the Oxidative Damage Generated by NaCl and Osmotic Stress in Arabidopsis Seedlings. Plant Physiology 2001, 126, 1024–1030. [CrossRef]
- Ma, X.; Zheng, J.; Zhang, X.; Hu, Q.; Qian, R. Salicylic Acid Alleviates the Adverse Effects of Salt Stress on Dianthus Superbus (Caryophyllaceae) by Activating Photosynthesis, Protecting Morphological Structure, and Enhancing the Antioxidant System. Front. Plant Sci. 2017, 8, 600. [CrossRef]
- Mimouni, H.; Wasti, S.; Manaa, A.; Gharbi, E.; Chalh, A.; Vandoorne, B.; Lutts, S.; Ahmed, H.B. Does Salicylic Acid (SA) Improve Tolerance to Salt Stress in Plants? A Study of SA Effects On Tomato Plant Growth, Water Dynamics, Photosynthesis, and Biochemical Parameters. OMICS: A Journal of Integrative Biology 2016, 20, 180–190. [CrossRef]
- Fariduddin, Q.; Hayat, S.; Ahmad, A. Salicylic Acid Influences Net Photosynthetic Rate, Carboxylation Efficiency, Nitrate Reductase Activity, and Seed Yield in Brassica Juncea. Photosynt. 2003, 41, 281–284. [CrossRef]
- Linić, I.; Mlinarić, S.; Brkljačić, L.; Pavlović, I.; Smolko, A.; Salopek-Sondi, B. Ferulic Acid and Salicylic Acid Foliar Treatments Reduce Short-Term Salt Stress in Chinese Cabbage by Increasing Phenolic Compounds Accumulation and Photosynthetic Performance. Plants 2021, 10, 2346. [CrossRef]
- Xu, Z.; Zhou, J.; Ren, T.; Du, H.; Liu, H.; Li, Y.; Zhang, C. Salt Stress Decreases Seedling Growth and Development but Increases Quercetin and Kaempferol Content in Apocynum Venetum. Plant Biol J 2020, 22, 813–821. [CrossRef]
- Sultana, B.; Anwar, F.; Ashraf, M. Effect of Extraction Solvent/Technique on the Antioxidant Activity of Selected Medicinal Plant Extracts. Molecules 2009, 14, 2167–2180. [CrossRef]
- Alhaithloul, H.A.S.; Alqahtani, M.M.; Abdein, M.A.; Ahmed, M.A.I.; Hesham, A.E.-L.; Aljameeli, M.M.E.; Al Mozini, R.N.; Gharsan, F.N.; Hussien, S.M.; El-Amier, Y.A. Rosemary and Neem Methanolic Extract: Antioxidant, Cytotoxic, and Larvicidal Activities Supported by Chemical Composition and Molecular Docking Simulations. Front. Plant Sci. 2023, 14, 1155698. [CrossRef]
- Zhang, X.; Yang, L.-M.; Liu, G.-M.; Liu, Y.-J.; Zheng, C.-B.; Lv, Y.-J.; Li, H.-Z.; Zheng, Y.-T. Potent Anti-HIV Activities and Mechanisms of Action of a Pine Cone Extract from Pinus Yunnanensis. Molecules 2012, 17, 6916–6929. [CrossRef]
- Li, C.; Ran, M.; Liu, J.; Wang, X.; Wu, Q.; Zhang, Q.; Yang, J.; Yi, F.; Zhang, H.; Zhu, J.-K.; et al. Functional Analysis of CqPORB in the Regulation of Chlorophyll Biosynthesis in Chenopodium Quinoa. Front. Plant Sci. 2022, 13, 1083438. [CrossRef]
- Xing, Y.; Wang, K.; Huang, C.; Huang, J.; Zhao, Y.; Si, X.; Li, Y. Global Transcriptome Analysis Revealed the Molecular Regulation Mechanism of Pigment and Reactive Oxygen Species Metabolism During the Stigma Development of Carya Cathayensis. Front. Plant Sci. 2022, 13, 881394. [CrossRef]
- Yusuf, M.; Saeed Almehrzi, A.S.; Nasir Alnajjar, A.J.; Alam, P.; Elsayed, N.; Khalil, R.; Hayat, S. Glucose Modulates Copper Induced Changes in Photosynthesis, Ion Uptake, Antioxidants and Proline in Cucumis Sativus Plants. Carbohydrate Research 2021, 501, 108271. [CrossRef]
- Wang, L.; Zhang, S.; Li, J.; Zhang, Y.; Zhou, D.; Li, C.; He, L.; Li, H.; Wang, F.; Gao, J. Identification of Key Genes Controlling Soluble Sugar and Glucosinolate Biosynthesis in Chinese Cabbage by Integrating Metabolome and Genome-Wide Transcriptome Analysis. Front. Plant Sci. 2022, 13, 1043489. [CrossRef]
- Jackson,M.L. Soil Chemical Analysis; Advanced Course.; Jackson, M.L. (1973) Soil Chemical Analysis. Advanced Course Ed. 2. A Manual of Methods Useful for Instruction and Research in Soil Chemistry, Physical Chemistry of Soils, Soil Fertility and Genesis ., 1073;
- Schofield, R.K.; Taylor, A.W. The Measurement of Soil pH. Soil Science Society of America Journal 1955, 19, 164–167. [CrossRef]
- Lindsay, W.L.; Norvell, W.A. Development of a DTPA Soil Test for Zinc, Iron, Manganese, and Copper. Soil Science Soc of Amer J 1978, 42, 421–428. [CrossRef]
Figure 1.
Effect of salinity, foliar application with different bio-stimulants based on (TRRO) Rosemary, (TRPP) Pinyon pine, (TRSC) and shrimp chitin, compared to the salt-stressed control (CBSS) and their interactions on (a) chlorophyll a; (b) chlorophyll b; (c) chlorophyll a+b and (d) carotenoids of citrus plants. Tukey’s test was used to compare the treated citrus with their control at p*** ≤0.05. FM: Fresh material. J: January; F: February; MA: Marsh; A: April; M: Mai; J: Juin; JUI: July; AO: August; S: September; O: October; N: November; D: December. .
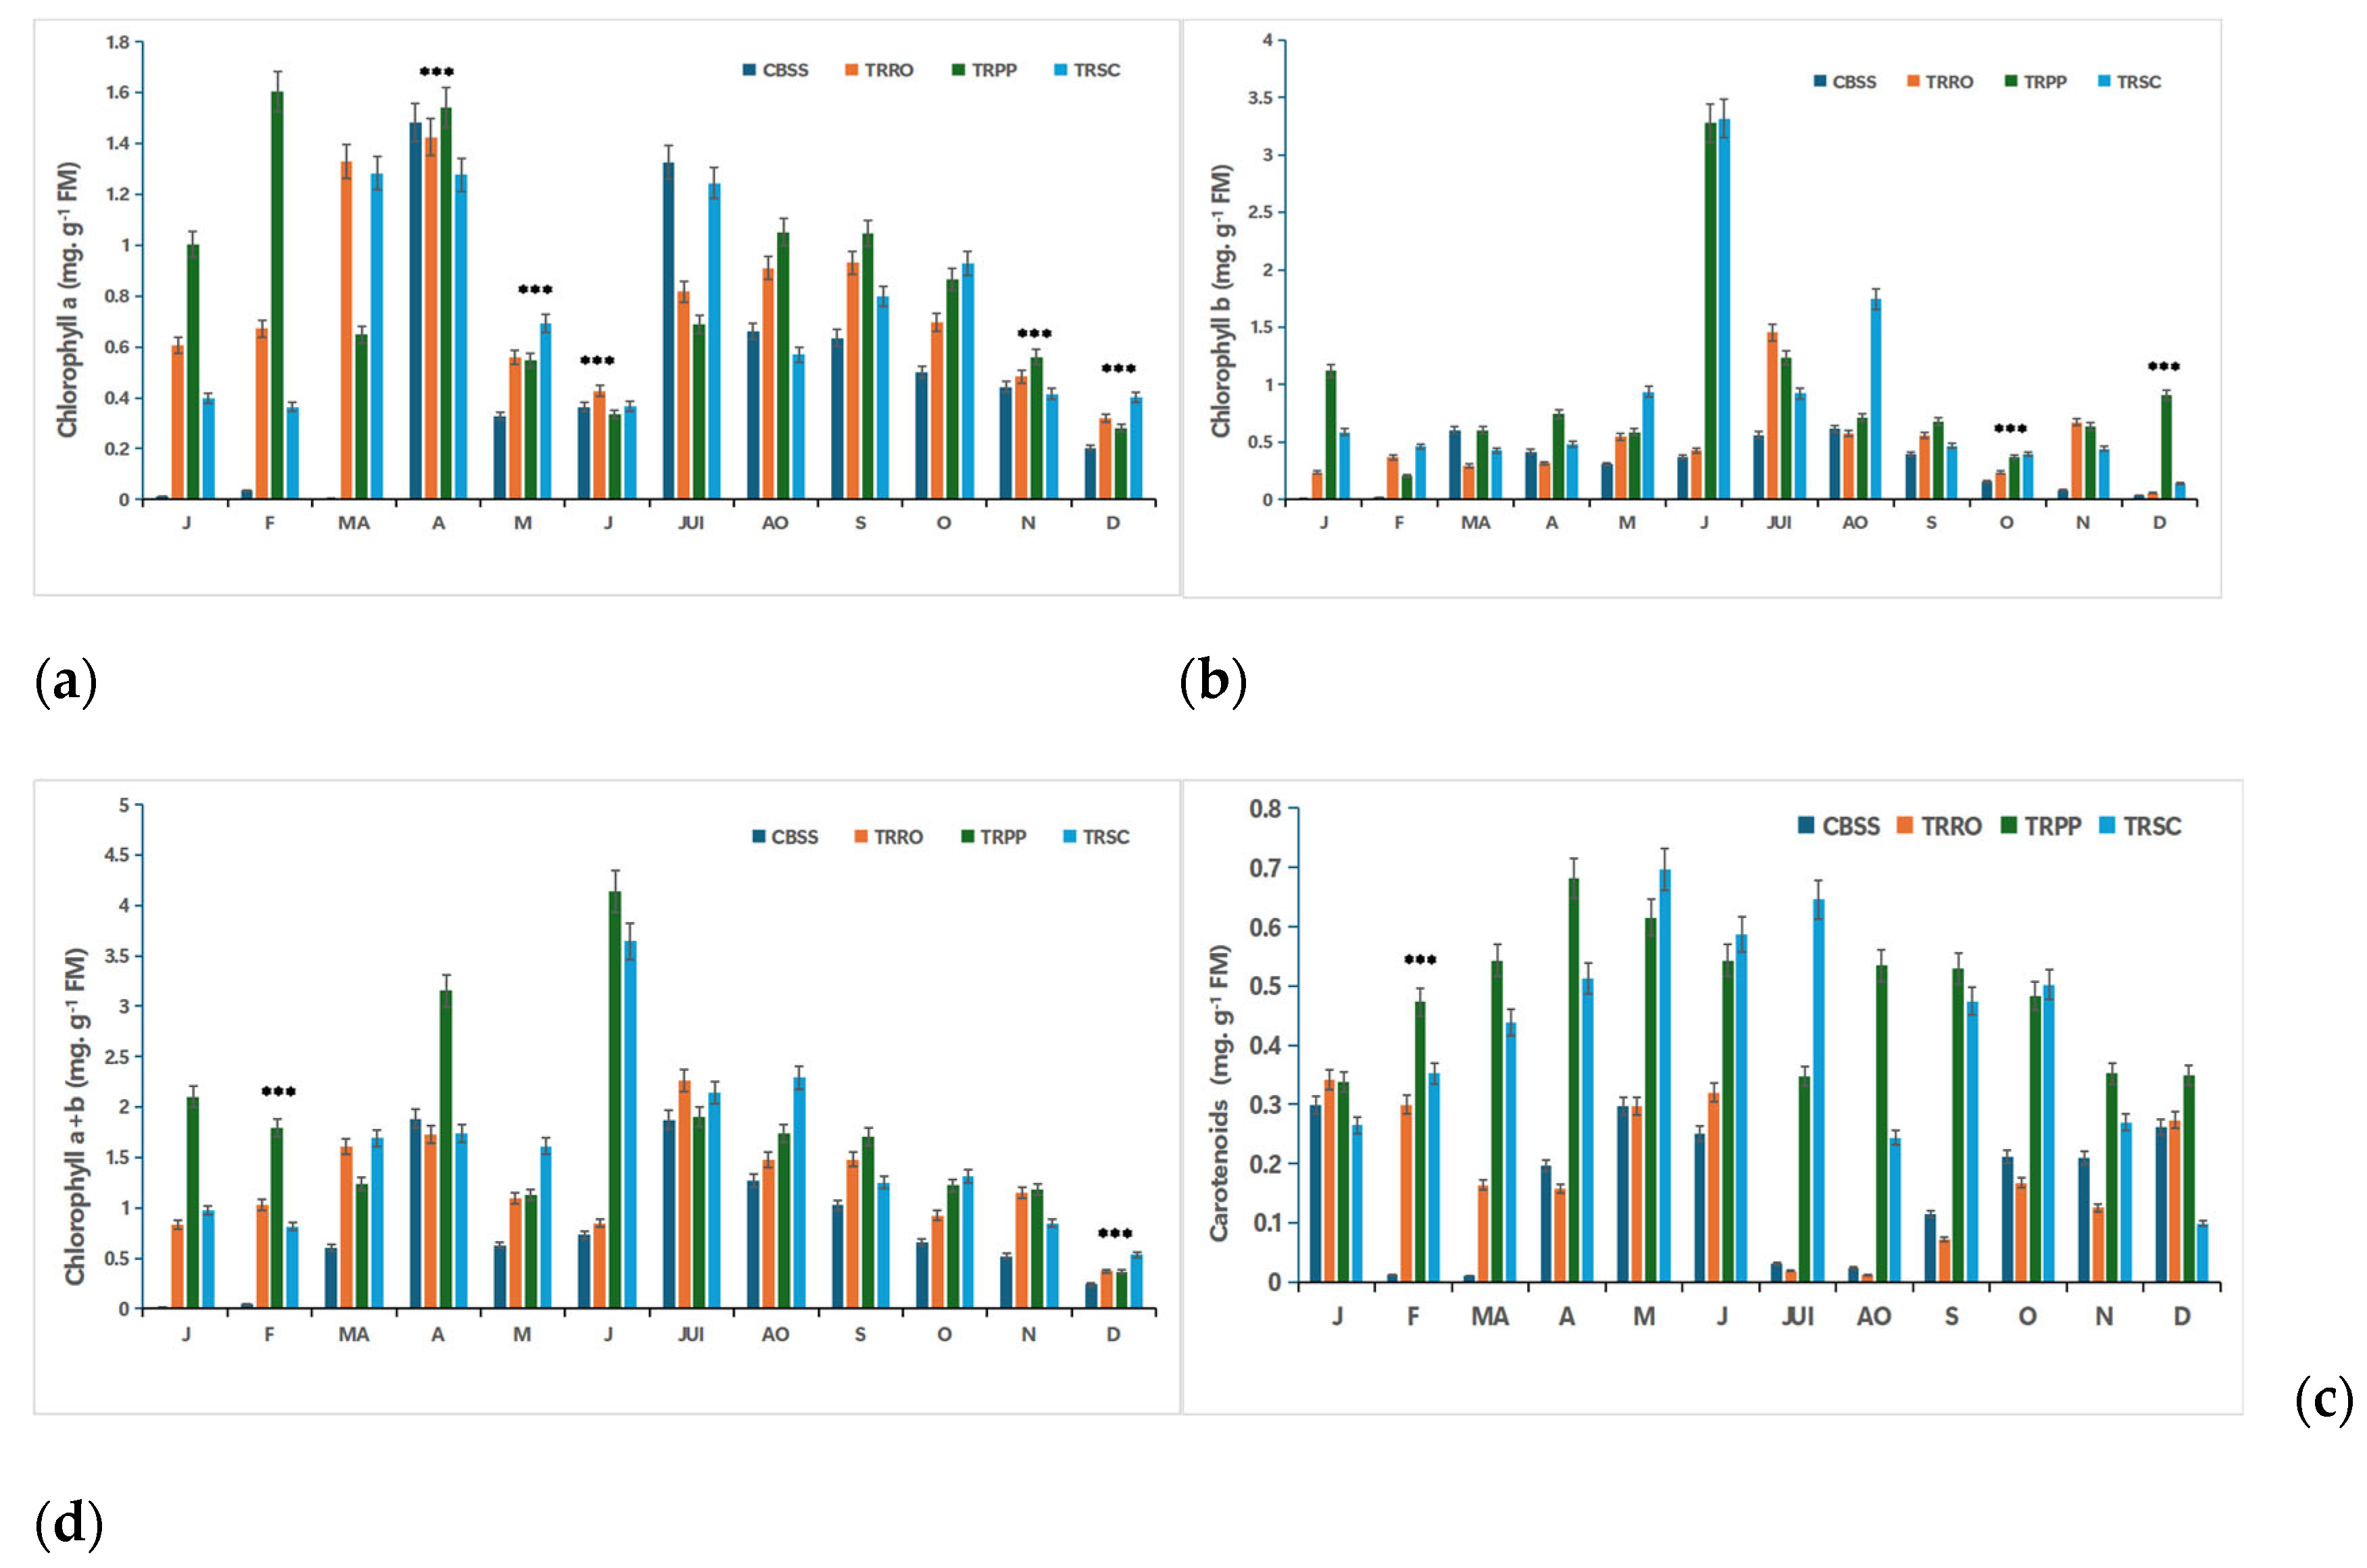
Figure 2.
Effect of salinity, foliar application with different bio-stimulants based on (TRRO) Rosemary, (TRPP) Pinyon pine, (TRSC) and shrimp chitin, compared to the salt-stressed control (CBSS) and their interactions on proline content in citrus plants. Tukey’s test was used to compare the treated citrus with their control at p*** ≤0.05. FM: Fresh material. J: January; F: February; MA: Marsh; A: April; M: Mai; J: Juin; JUI: July; AO: August; S: September; O: October; N: November; D: December. .
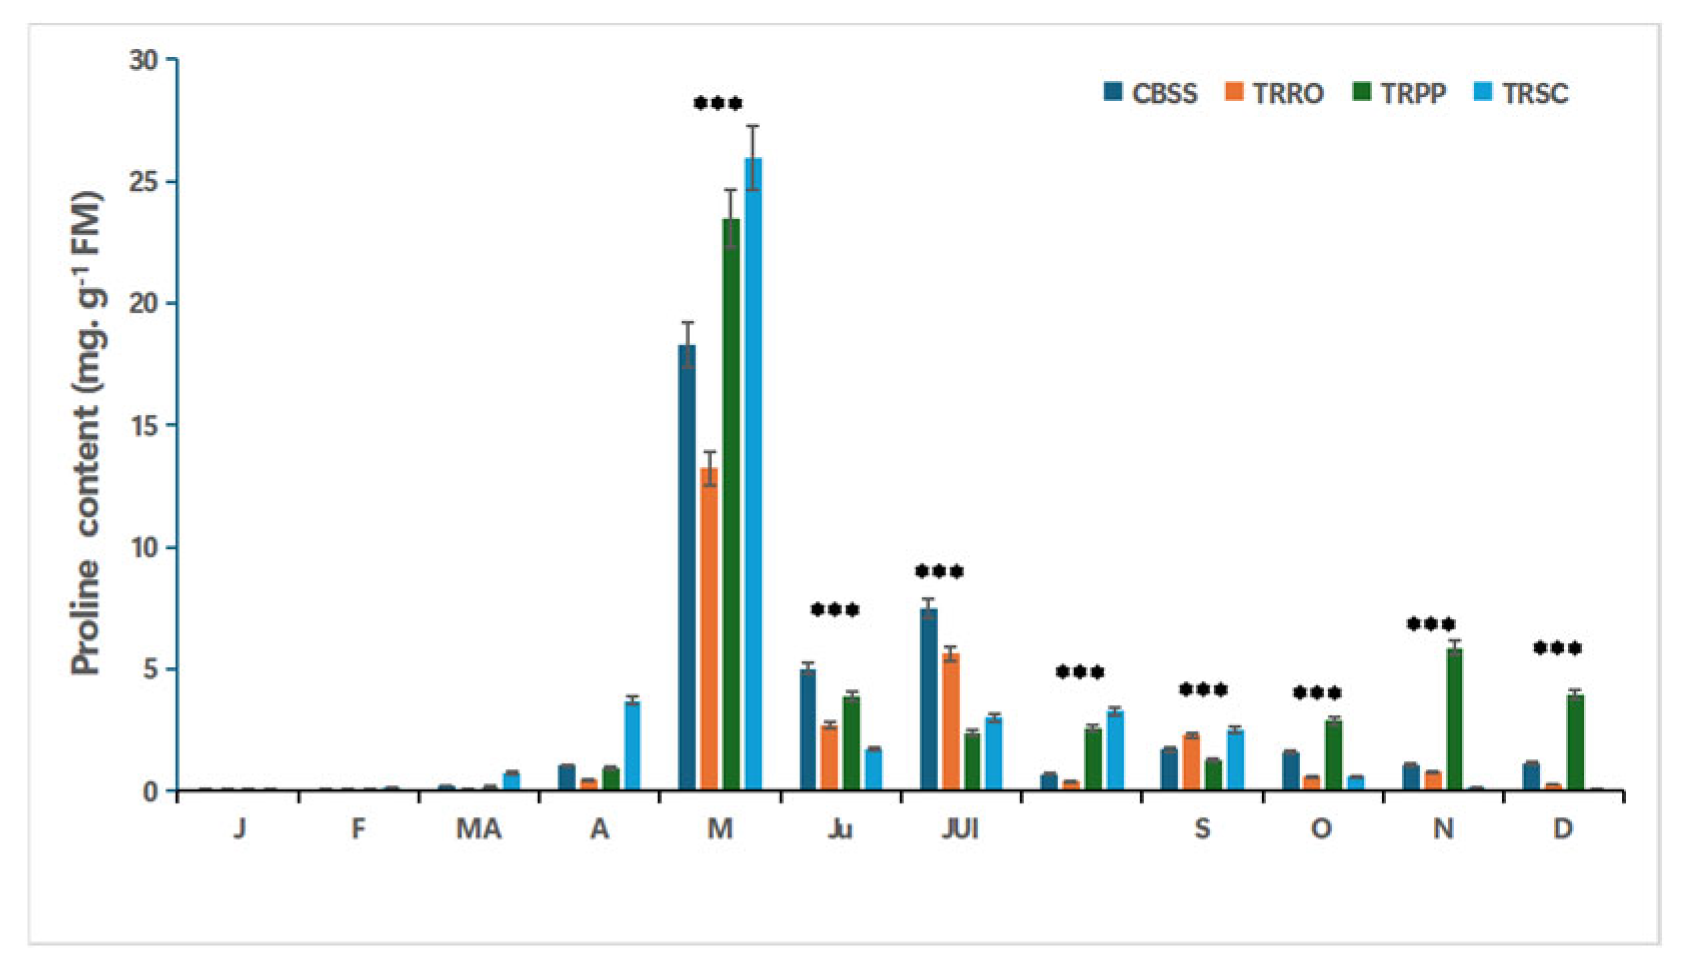
Figure 3.
Effect of salinity, foliar application with different bio-stimulants based on (TRRO) Rosemary, (TRPP) Pinyon pine, (TRSC) and shrimp chitin, compared to the salt-stressed control (CBSS) and their interactions on soluble sugars content in citrus plants. Tukey’s test was used to compare the treated citrus with their control at p*** ≤0.05. FM: Fresh material. J: January; F: February; MA: Marsh; A: April; M: Mai; J: Juin; JUI: July; AO: August; S: September; O: October; N: November; D: December.
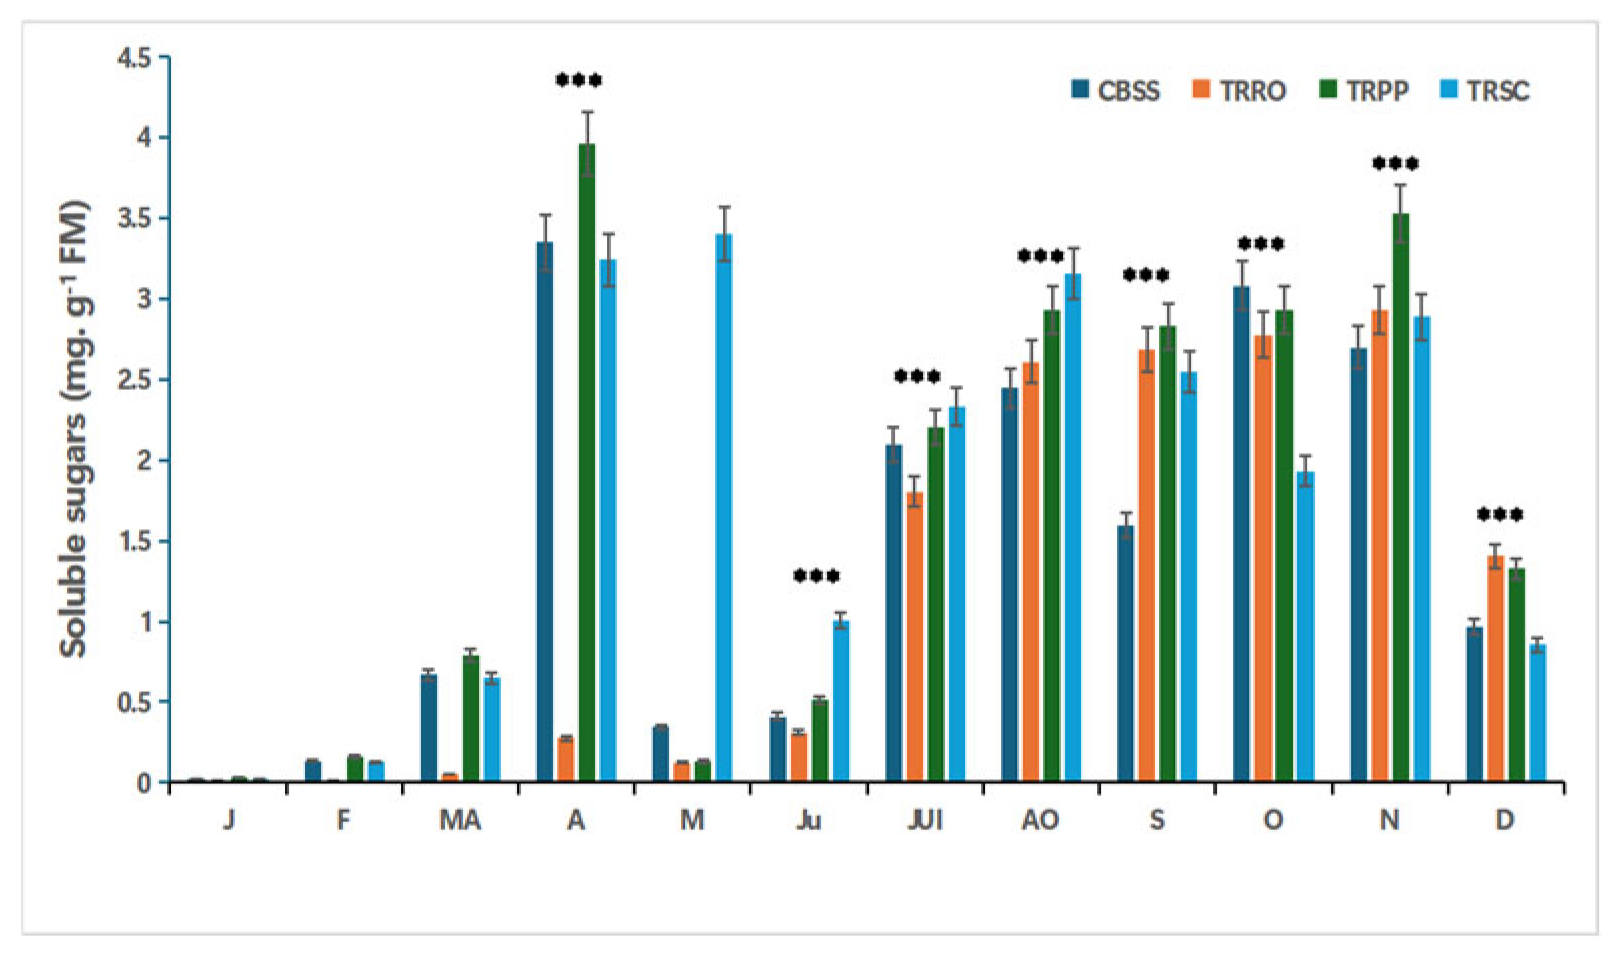
Figure 4.
Matrix of correlation coefficients between different phytochemical parameters of citrus plants treated with bio-stimulants under salt stress. J: January; F: February; MA: Marsh; A: April; M: Mai; J: Juin; JUI: July; AO: August; S: September; O: October; N: November; D: December.
Figure 4.
Matrix of correlation coefficients between different phytochemical parameters of citrus plants treated with bio-stimulants under salt stress. J: January; F: February; MA: Marsh; A: April; M: Mai; J: Juin; JUI: July; AO: August; S: September; O: October; N: November; D: December.
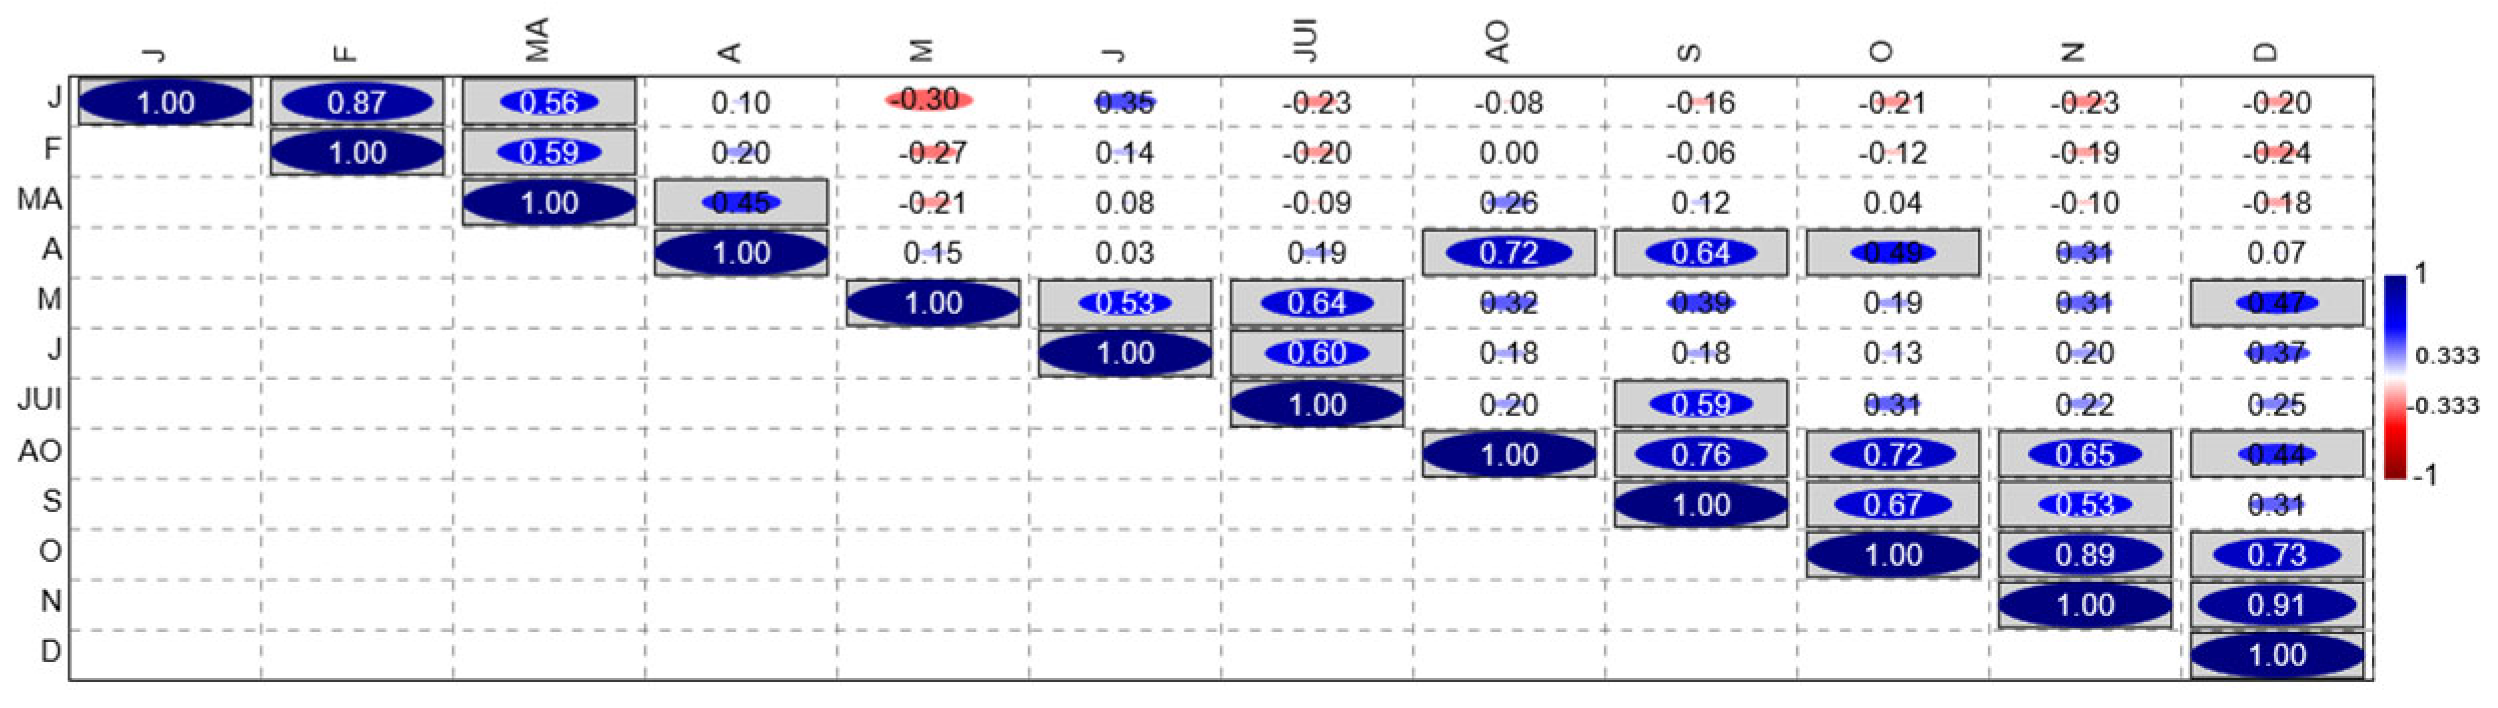
Figure 5.
Principal Component Analysis (a) and Hierarchical cluster analysis (b) of different phytochemical parameters of citrus plants treated with bio-stimulants based on (TRRO) Rosemary, (TRPP) Pinyon pine, (TRSC) and shrimp chitin, compared to the salt-stressed control (CBSS) under salt stress.
Figure 5.
Principal Component Analysis (a) and Hierarchical cluster analysis (b) of different phytochemical parameters of citrus plants treated with bio-stimulants based on (TRRO) Rosemary, (TRPP) Pinyon pine, (TRSC) and shrimp chitin, compared to the salt-stressed control (CBSS) under salt stress.
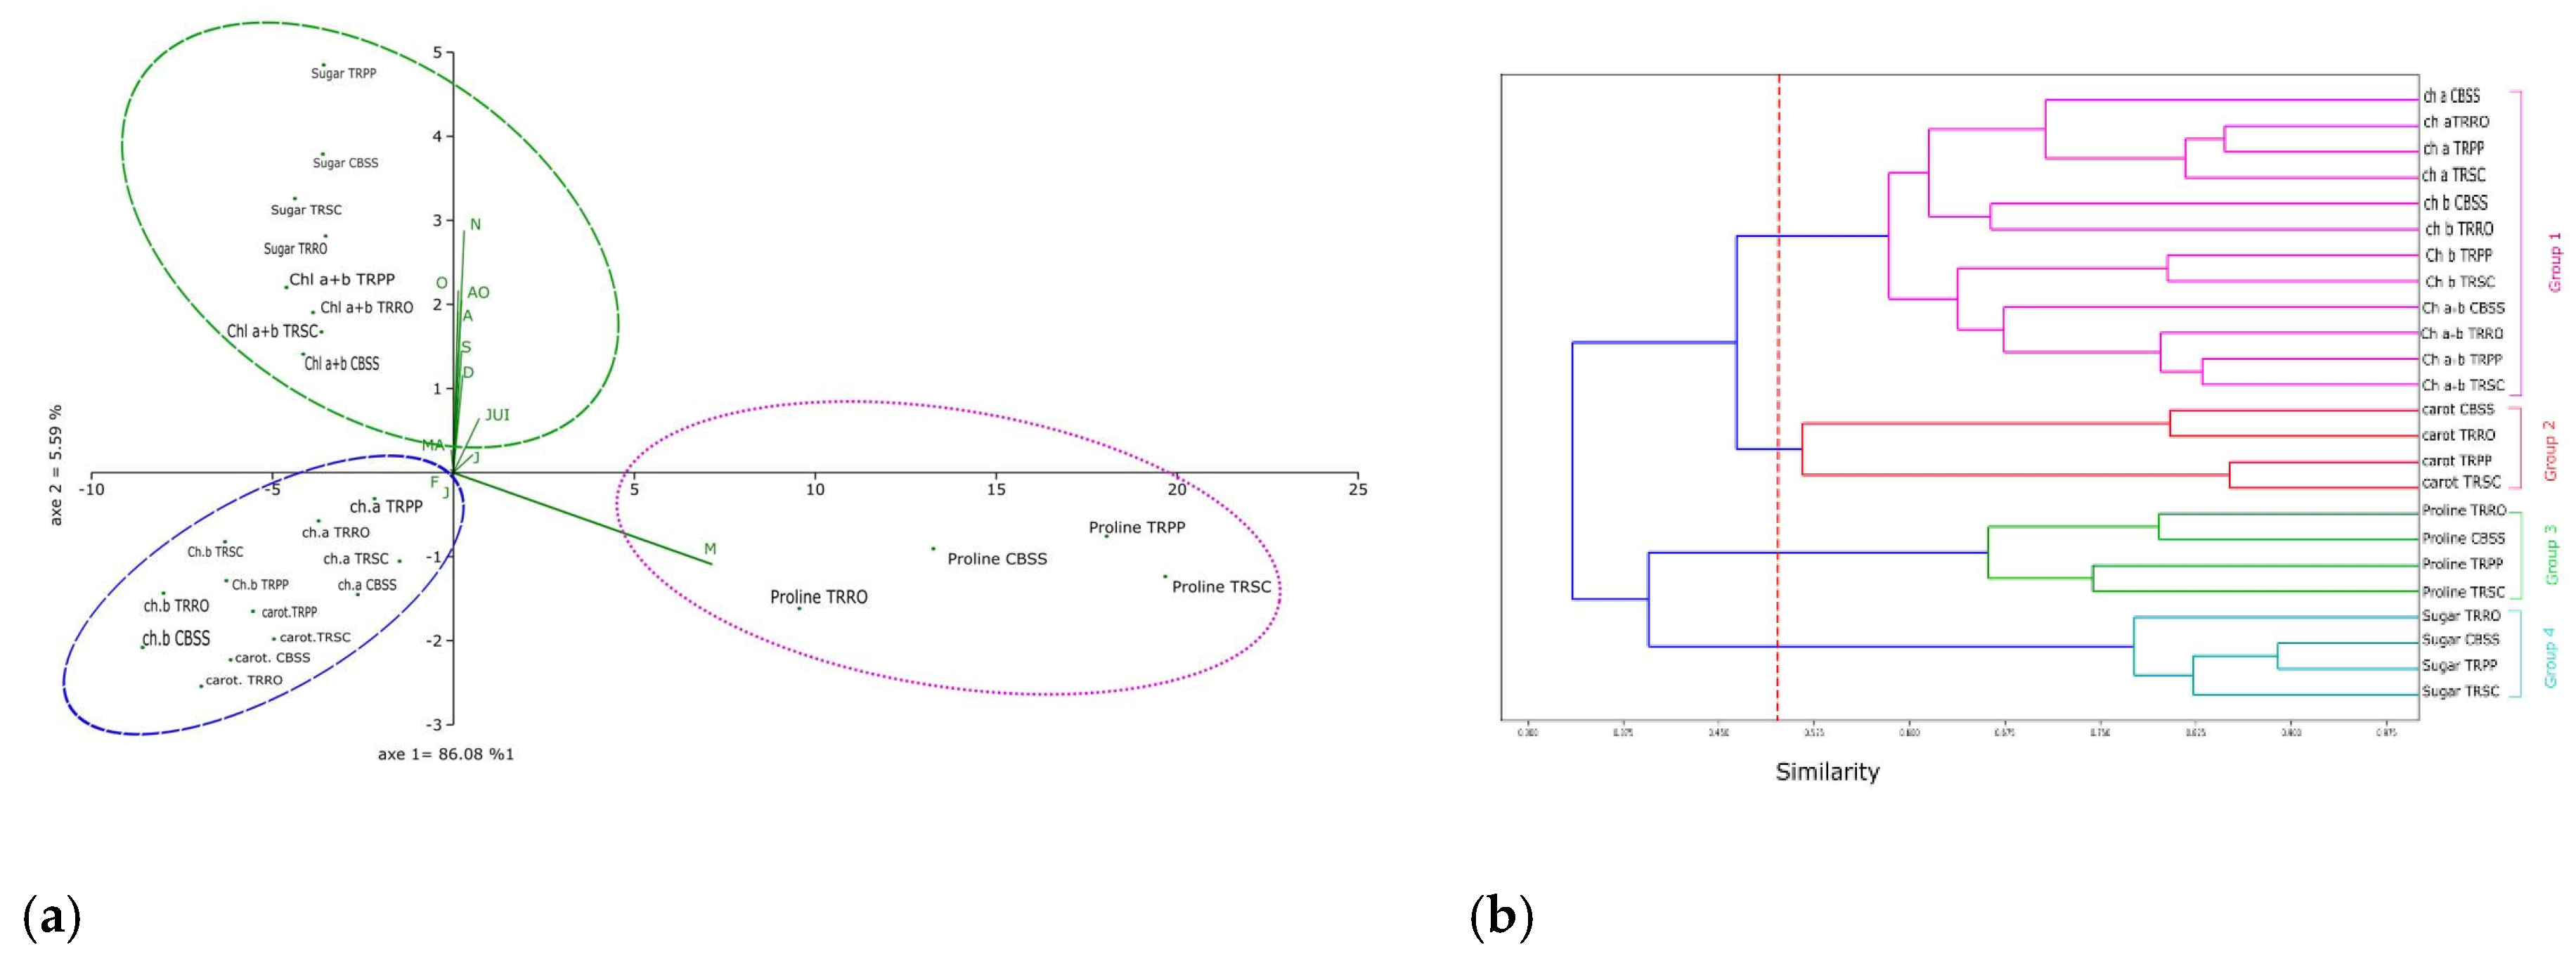
Figure 6.
Venn analysis of secondary metabolites from the leaves of citrus plants treated with bio-stimulant based on (R) Rosemary compared to the control (T) under salt stress. (a) Interactive Venn flower plot; (b) characterizes the Venn network analysis.
Figure 6.
Venn analysis of secondary metabolites from the leaves of citrus plants treated with bio-stimulant based on (R) Rosemary compared to the control (T) under salt stress. (a) Interactive Venn flower plot; (b) characterizes the Venn network analysis.
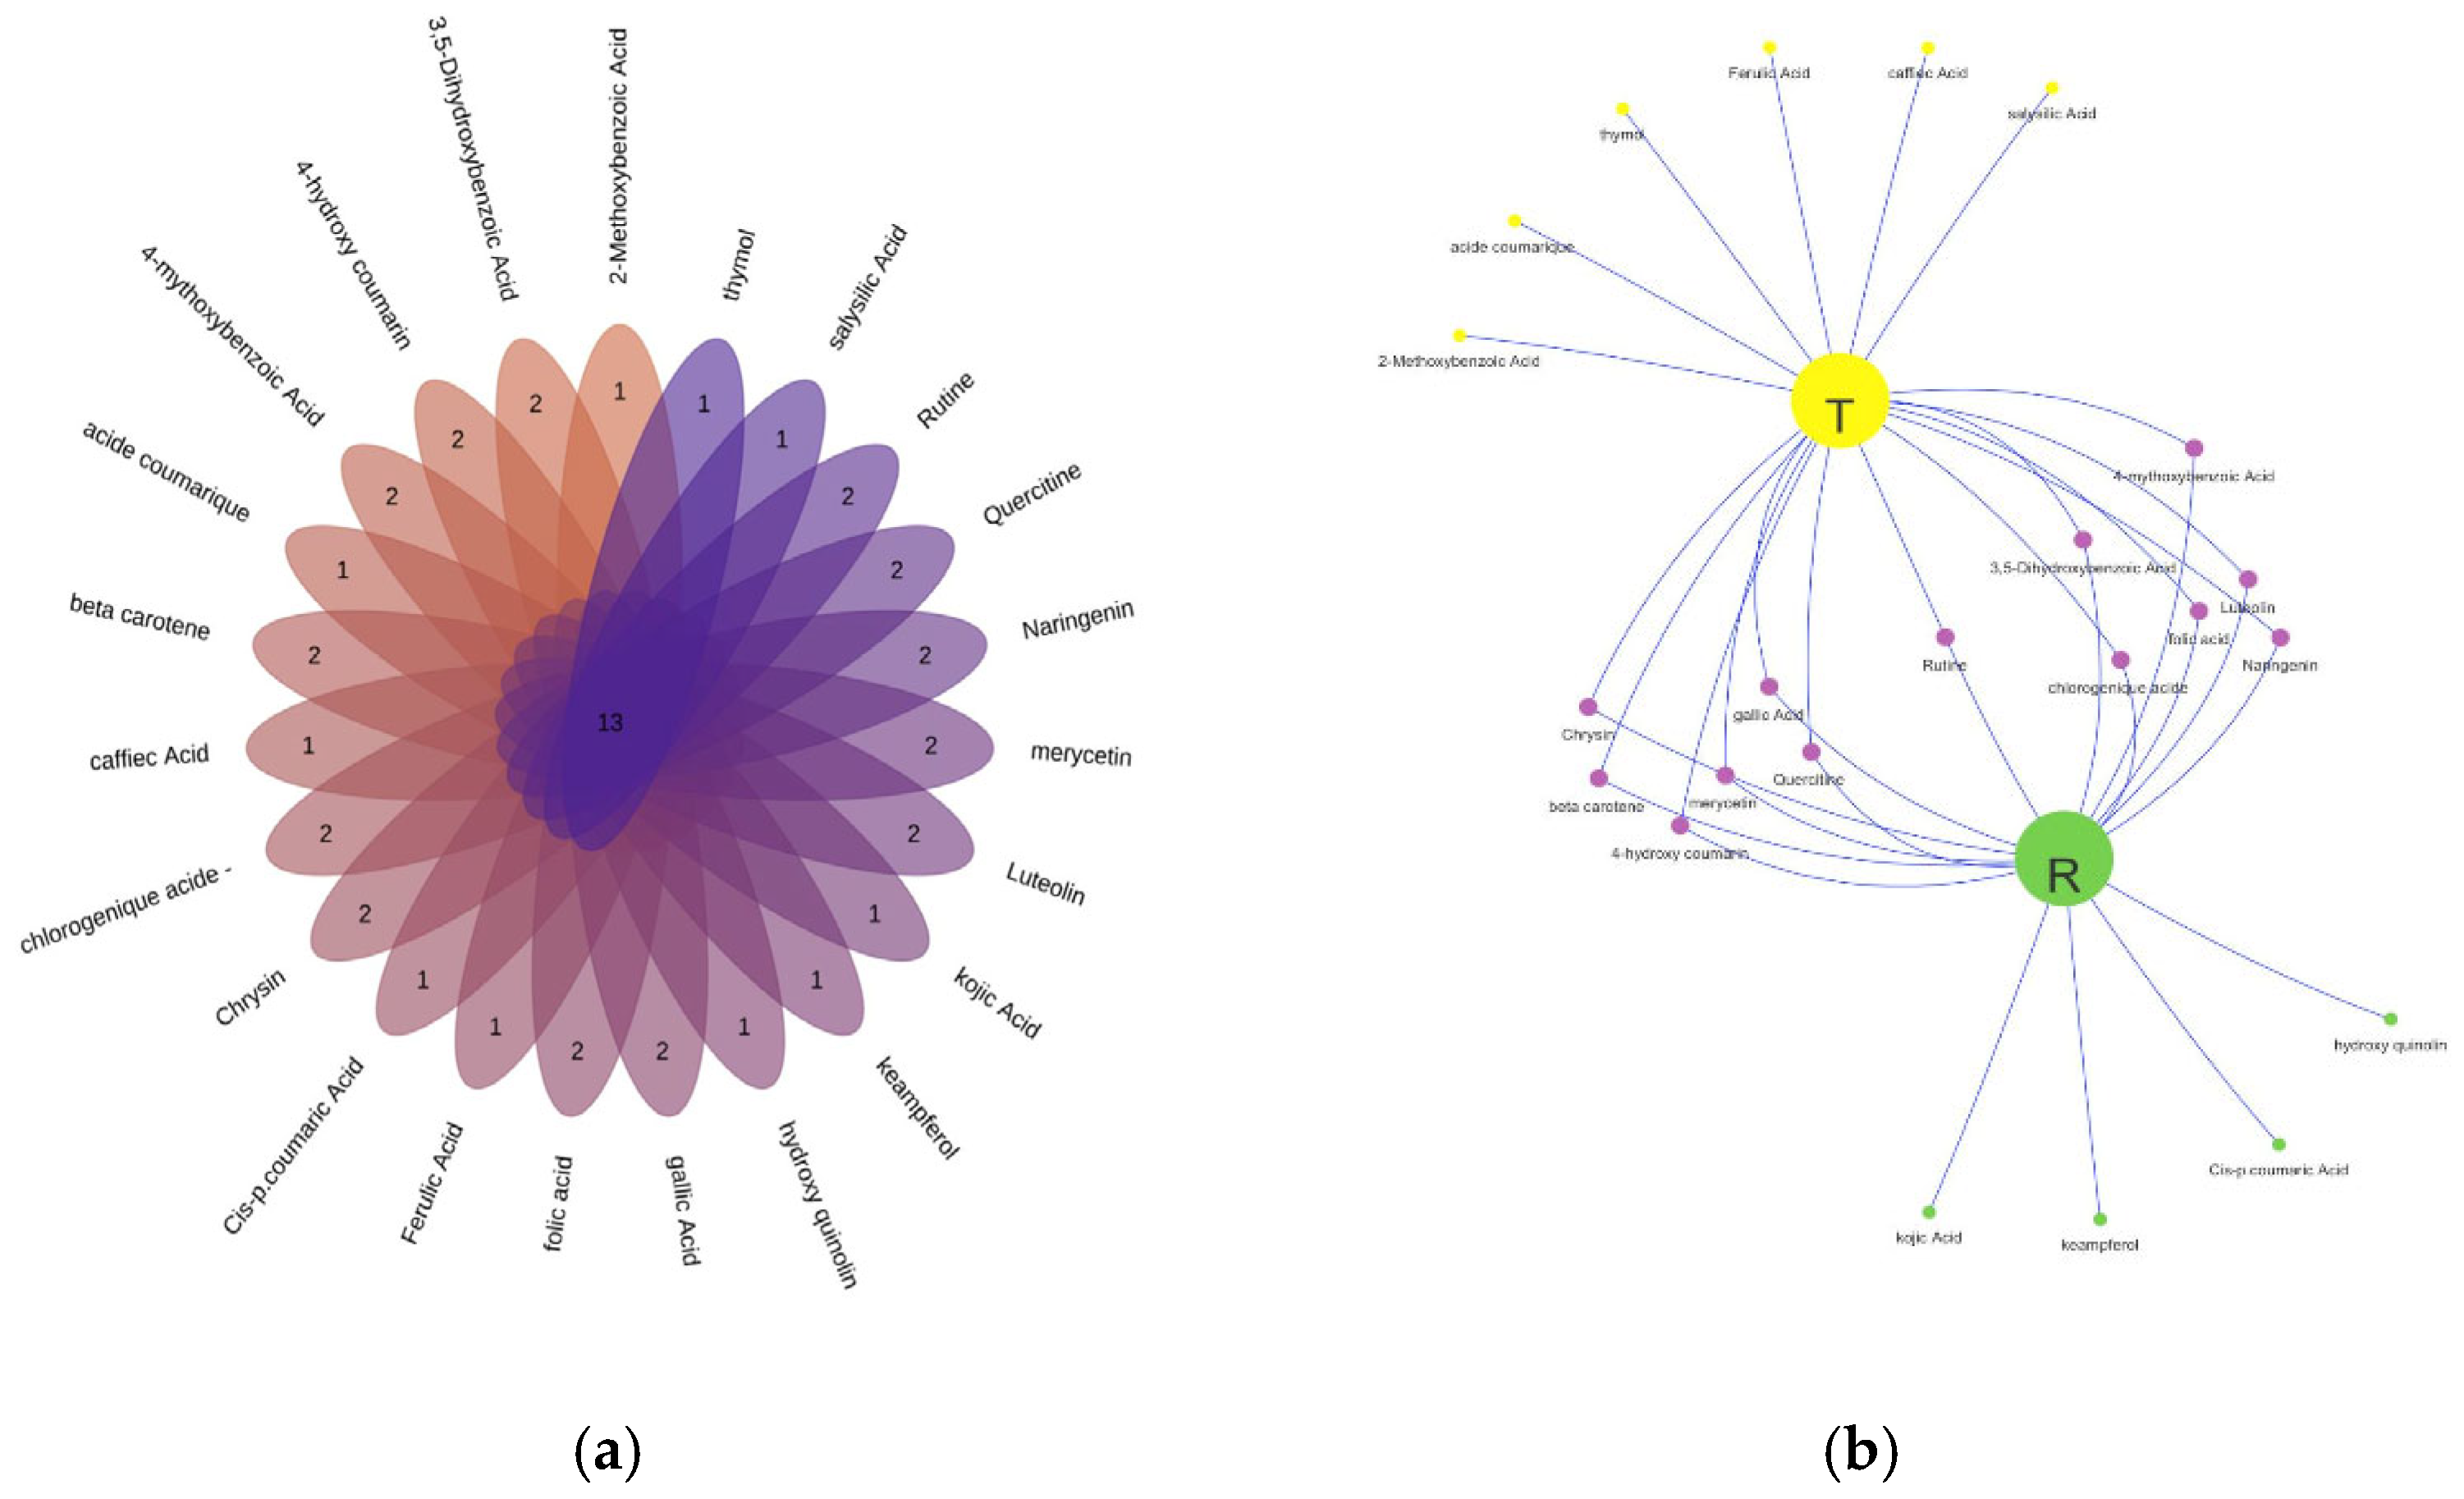
Figure 7.
Mantel scalogram of phytochemical, soil parameters and secondary metabolites of citrus plants treated with bio-stimulant based on Rosemary compared to the control under salt stress.
Figure 7.
Mantel scalogram of phytochemical, soil parameters and secondary metabolites of citrus plants treated with bio-stimulant based on Rosemary compared to the control under salt stress.
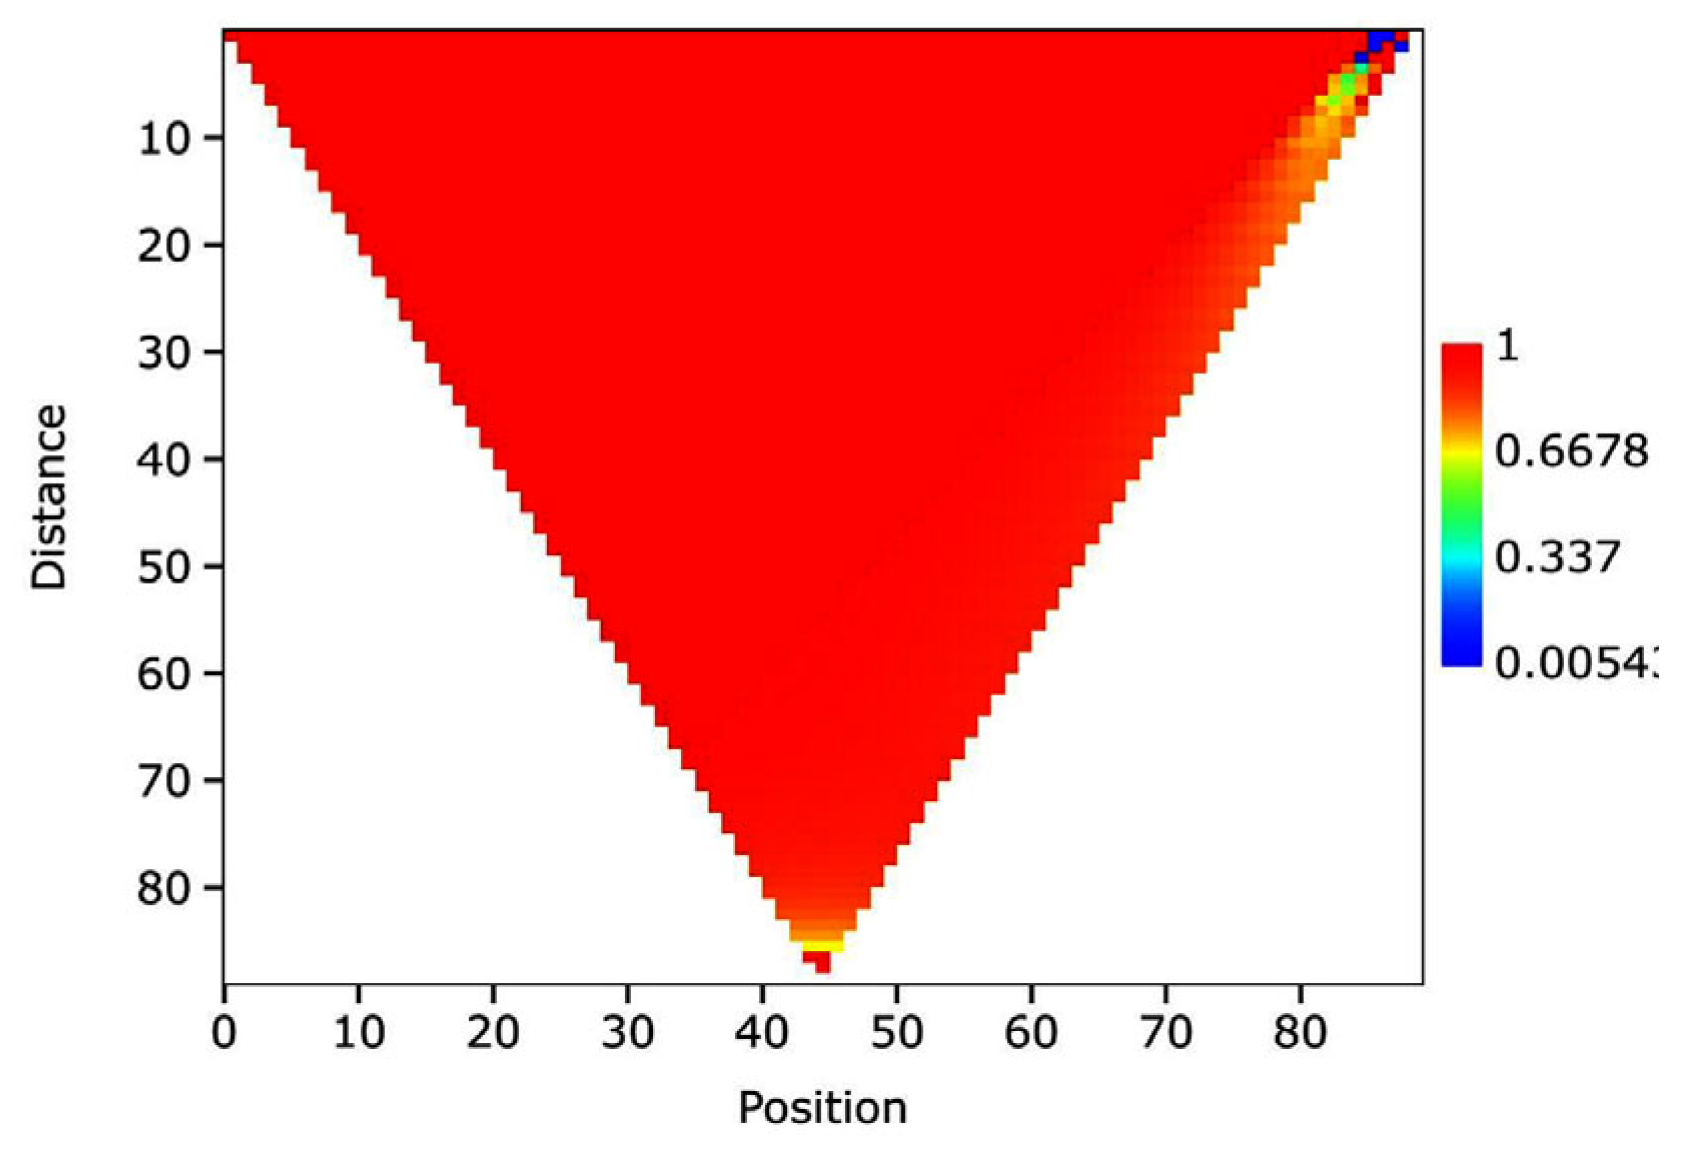

Table 1.
Effects of Bio-stimulants based on (TRRO) Rosemary, (TRPP) Pinyon pine, (TRSC) and shrimp chitin, compared to the control (CBSS), on soil chemical parameters of citrus plants under salt stress.
Table 1.
Effects of Bio-stimulants based on (TRRO) Rosemary, (TRPP) Pinyon pine, (TRSC) and shrimp chitin, compared to the control (CBSS), on soil chemical parameters of citrus plants under salt stress.
| Soil elements | CBSS | TRPP | TRRO | TRSC | |
| PH | 7.77 | 7.78 | 7.96 | 7.67 | |
| CE (dS/m) | 1.672 | 1.267 | 0.517 | 1.398 | |
| P2O5 (ppm) | 125.95 | 217.55 | 68.7 | 171.75 | |
| K2O (mg/100g) | 9.03 | 11.44 | 8.43 | 7.83 | |
| Fe (mg/l) | 2 | 3.4 | 12.7 | 3.6 | |
| K (mg/l) | 7.33 | 38.81 | 12.17 | 11.34 | |
| Na (mg/l) | 94.05 | 15.12 | 53.14 | 69.09 | |
| Mg (mg/l) | 34.12 | 20.20 | 34.29 | 36.95 | |
| Ca (mg/l) | 461.7 | 630.1 | 469.3 | 471.6 |
Disclaimer/Publisher’s Note: The statements, opinions and data contained in all publications are solely those of the individual author(s) and contributor(s) and not of MDPI and/or the editor(s). MDPI and/or the editor(s) disclaim responsibility for any injury to people or property resulting from any ideas, methods, instructions or products referred to in the content. |
© 2025 by the authors. Licensee MDPI, Basel, Switzerland. This article is an open access article distributed under the terms and conditions of the Creative Commons Attribution (CC BY) license (http://creativecommons.org/licenses/by/4.0/).
Copyright: This open access article is published under a Creative Commons CC BY 4.0 license, which permit the free download, distribution, and reuse, provided that the author and preprint are cited in any reuse.


