
Submitted:
31 May 2025
Posted:
02 June 2025
You are already at the latest version
Abstract
Coronary artery disease (CAD) and left ventricular (LV) diastolic dysfunction are major contributors to cardiovascular morbidity and mortality. Understanding the relationship between anatomical coronary burden and myocardial functional impairment may improve diagnostic accuracy and risk stratification. This study aimed to investigate the correlation between CAD severity assessed by coronary computed tomography angiography (CCTA) and LV diastolic dysfunction grade evaluated by echocardiography in patients with intermediate pretest probability for CAD. A cross-sectional analytical study was conducted on 200 patients who underwent both CCTA and transthoracic echocardiography. Diastolic function was graded according to current echocardiographic guidelines, and coronary burden was assessed via CAD-RADS, Segment Involvement Score (SIS), and Coronary Artery Calcium Score (CACS) angina score. Diastolic dysfunction was detected in 80.5% of patients, with significantly higher prevalence and severity among those with obstructive CAD (P< 0.001). SIS and CACS were strongly correlated with diastolic dysfunction grades (r=0.809, P< 0.001). Obstructive CAD was also associated with higher cholesterol, HbA1c, and LDL, and lower HDL levels. Risk factors such as hypertension and diabetes were significantly more frequent in those with diastolic dysfunction. A strong positive association exists between the extent of CAD and the severity of LV diastolic dysfunction, supporting integrated imaging-based risk assessment in CAD.
Keywords:
Coronary artery disease
; diastolic dysfunction
; CT coronary angiography
; echocardiography
; segment involvement score (SIS)
; coronary artery calcium score (CACS)
Introduction
Cardiovascular disease (CVD), particularly coronary artery disease (CAD), remains a leading cause of morbidity and mortality worldwide, posing a substantial burden on both men and women [1]. Coronary artery disease is a multifactorial condition and is one of the leading causes of death in the world [2]. In 2022 alone, coronary heart disease accounted for over 370,000 deaths in the United States, highlighting its continued significance as a public health crisis [3,4]. Although traditionally perceived as a predominantly male disease, CAD is equally critical in women, who often present with different symptom profiles and experience higher rates of misdiagnosis and adverse outcomes [5]. This gender disparity is partially due to gaps in awareness, risk stratification, and the interpretation of clinical presentation across sexes.
Typical symptoms of CAD include central oppressive chest pain, jaw and left arm pain, diaphoresis, shortness of breath, nausea, and vomiting [6]. However, a significant proportion of patients—particularly women and those with diabetes—present with atypical symptoms such as fatigue, epigastric pain, dull or burning chest discomfort, palpitations, lightheadedness, neck or back pain, indigestion, right arm or shoulder discomfort, dizziness, or even syncope [7,8]. These non-classical manifestations often result in under-recognition of CAD in clinical practice, which can delay diagnosis and appropriate intervention. The failure to recognize these presentations can lead to missed diagnoses, under-treatment, and ultimately worse patient outcomes, emphasizing the need for a more inclusive and nuanced understanding of symptomatology in CAD.
A study suggests that labeling symptoms as 'typical' or 'atypical' should no longer be done, as the presentation of CAD varies significantly with age, sex, race, and other preexisting risk factors [8]. This variability underscores the limitations of rigid clinical heuristics and supports a shift towards personalized assessment strategies incorporating demographic and biological heterogeneity. Increasing evidence suggests that symptom interpretation must be contextualized within patient-specific risk profiles to ensure accurate diagnosis and management [9].
In terms of diagnosis, coronary computed tomography angiography (CCTA) is increasingly recommended as a first-line investigation for establishing the presence of coronary artery disease [10]. CCTA has gained prominence due to its non-invasive nature, high negative predictive value, and ability to visualize both obstructive and non-obstructive plaque burden directly. Recent expert consensus and guidelines, such as those issued by the Society of Cardiovascular Computed Tomography, have recognized CCTA as an essential modality for initial risk stratification in patients presenting with chest pain [11]. Moreover, its integration with advanced techniques such as CT-derived fractional flow reserve (FFR-CT) enhances its capacity to assess the functional significance of coronary lesions, improving diagnostic precision.
The assessment of left ventricular (LV) diastolic function is also essential to the comprehensive evaluation of cardiac function through echocardiography. The American Society of Echocardiography/European Association of Cardiovascular Imaging guidelines recommend the inclusion of multiple measurements, as well as considering underlying myocardial pathology, such as impaired LV long-axis systolic function, increased LV end-diastolic pressure (evidenced by pulmonary venous flow), and pathological hypertrophy [12]. These parameters enable clinicians to grade diastolic dysfunction with higher specificity and are especially valuable in patients with preserved ejection fraction but ongoing symptoms suggestive of ischemia.
Notably, the interrelationship between CAD and diastolic dysfunction has emerged as a topic of growing research interest. Several studies have suggested that diastolic dysfunction may not only co-occur with CAD but may also be exacerbated by ischemic burden and microvascular dysfunction (Lam et al., 2020). Subclinical ischemia can impair myocardial relaxation and compliance, thereby contributing to the development of heart failure with preserved ejection fraction (HFpEF)—a condition associated with high morbidity and limited treatment options [12]. Furthermore, the impact of coronary atherosclerosis on myocardial tissue composition, particularly in terms of fibrotic remodeling and reduced compliance, has been implicated in the pathogenesis of diastolic impairment [13].
The correlation between the severity of CAD detected by CCTA and the grade of LV diastolic dysfunction detected by echocardiography remains an area of clinical importance. Establishing this relationship could enable clinicians to better risk-stratify patients and identify those at greater risk of progression to HFpEF. It could also foster more integrated use of multimodal imaging in routine cardiac evaluations, thus aligning diagnostic workflows with the complexities of modern cardiovascular pathophysiology. Recognizing and quantifying the interplay between anatomical disease burden and functional myocardial impairment may ultimately lead to more tailored and effective therapeutic strategies.
The study aims to determine the correlation between the severity of coronary artery disease detected by CT coronary angiography and the grade of LV diastolic dysfunction detected by echocardiography.
Patients and Methods
Study Design and Population
This cross-sectional analytical study was carried out at Misr University for Science and Technology Teaching Hospital and Alfa Scan Laboratories from November 2022 to November 2024. This study included 200 patients who underwent both coronary computed tomography angiography (CTCA) and transthoracic echocardiography (TTE), with a maximum of one year between the two tests.
Inclusion and Exclusion Criteria
This study included adult patients aged 20 years or older, encompassing both genders, who provided informed written consent and presented with an intermediate pretest probability of coronary artery disease, as determined by the Pretest Probability Formula accounting for age, sex, chest pain characteristics, and history of diabetes, hypertension, dyslipidemia, and smoking. Patients were excluded if they declined participation, had a left ventricular ejection fraction (LVEF) below 45%, suffered from moderate or severe valvular disease, or were diagnosed with primary myocardial pathologies such as hypertrophic or restrictive cardiomyopathy. Further exclusions applied to individuals with significant pericardial diseases like constriction, congenital heart disease, primary pulmonary hypertension, those experiencing atrial or ventricular arrhythmias at the time of imaging, or those with contraindications to coronary CT angiography testing.
Methods
After obtaining informed written consent from each participant, a comprehensive data collection process was initiated. This involved detailed history taking, encompassing personal details (age, sex, weight), cardiovascular risk factors (smoking status, hypertension, diabetes mellitus, dyslipidemia), relevant surgical history including previous coronary artery bypass grafting (CABG) or percutaneous coronary intervention (PCI) and valve surgeries, current medication use (such as antiplatelet therapy, antihypertensives, and antidiabetics), and family history of cardiovascular disease. A thorough clinical examination was conducted, including assessment of vital signs (pulse, blood pressure, respiratory rate, temperature), measurement of weight and height for Body Mass Index (BMI) calculation, and a focused cardiovascular examination to detect any abnormal heart sounds, murmurs, or pericardial rubs. Laboratory investigations included a complete blood count (CBC) assessing hemoglobin, white blood cell count, and platelet count; glycated hemoglobin (HbA1c); liver enzymes (ALT, AST); a complete lipid profile (total cholesterol, triglycerides, LDL, HDL); and renal function tests (serum creatinine, urea). Transthoracic echocardiography was performed according to the American Society of Echocardiography (ASE) and European Association of Cardiovascular Imaging (EACVI) guidelines, utilizing standard M-mode, 2D, and Doppler techniques. Left ventricular diastolic function was evaluated explicitly by measuring the ejection fraction (EF), mitral inflow early (E) to late (A) filling velocity ratio (E/A), peak tricuspid regurgitation (TR) velocity, septal and lateral mitral annular early diastolic velocities (e') via tissue Doppler imaging, the E/e' ratio, mitral E-wave deceleration time (DT), isovolumic relaxation time (IVRT), and the left atrial (LA) volume index, which was determined using Simpson's rule from the 4-chamber view and indexed to body surface area. Contrast-enhanced CT coronary angiography was used to identify patients with obstructive coronary artery disease (stenosis > 50% in one or more of the major epicardial coronary arteries)
Left Ventricular Diastolic Function
Left ventricular diastolic function was graded based on specific echocardiographic parameters derived from the transthoracic examination. Normal diastolic function was defined by a septal e' velocity > 8 cm/s, lateral e' velocity > 10 cm/s, left atrial (LA) volume index < 34 ml/m², mitral inflow E/A ratio < 0.8, mitral E-wave deceleration time (DT) > 200 ms, average E/e' ratio < 8, pulmonary vein atrial reversal wave duration minus mitral A-wave duration (Ar-A duration) < 0 ms, and a change in E/A ratio with Valsalva maneuver (ΔE/A) of < 0.5. Grade 1 diastolic dysfunction (Impaired Relaxation) was characterized by septal e' < 8 cm/s, lateral e' < 10 cm/s, LA volume index > 34 mL/m², E/A ratio < 0.8, DT > 200 ms, average E/e' ratio between 9–12, Ar-A duration > 30 ms, and Valsalva ΔE/A < 0.5. Grade 2 diastolic dysfunction (Pseudonormal Filling) was identified by septal e' < 8 cm/s, lateral e' < 10 cm/s, LA volume index > 34 ml/m², E/A ratio between 0.8–1.5, DT between 160–200 ms, average E/e' ratio > 13, Ar-A duration > 30 ms, and Valsalva ΔE/A > 0.5. Finally, Grade 3 diastolic dysfunction (Restrictive Filling) was determined by septal e' < 8 cm/s, lateral e' < 10 cm/s, LA volume index > 34 mL/m², E/A ratio ≥ 2, DT < 150 ms, average E/e' ratio > 15, Ar-A duration > 40 ms, and Valsalva ΔE/A > 0.5.
Coronary Artery Calcium Score (CACS)
Plain coronary multi-slice CT to assess coronary artery calcium score (CACS), providing a non-invasive quantitative evaluation of coronary atherosclerotic burden, which enables stratification of cardiovascular risk, prognostication, and guides preventive therapeutic interventions in asymptomatic and symptomatic individuals. In the absence of contraindications to coronary multi-slice CT, premedication with an oral beta blocker were given in case of heart rate was greater than or equal to 70 beats/min. Additional oral ivabradine (7.5 mg twice daily for 3 days before the examination) were added if tolerated. The Agatston scoring method was used to determine the calcium score in the coronary arteries. Total Agatston score was measured in patients with a positive CACS score that was less than 400. Coronary plaques types were classified visually by using contrast-enhanced CT coronary angiography to identify luminal area stenosis as normal, nonobstructive (<50% in the left main stem or < 70% in other segments), or obstructive ( 70% in other segments), and classified quantitively according to Mean Hounsfield units (HU) densities which ranged from 14 to 75 HU for lipid-rich soft plaques 67 to 149 HU for fibrous plaques and 135 to 1089 HU for calcified plaques the extent of coronary atherosclerosis was quantified using the Segment Involvement Score (SIS) derived from CT Coronary Angiography. The SIS provides a semi-quantitative measure of overall plaque burden by summing the total number of coronary artery segments (maximum 17) exhibiting any detectable atherosclerotic plaque, irrespective of individual plaque characteristics or the degree of stenosis within the affected segment. This score aligns with standardized quantitative CTA reporting frameworks like CAD-RADS, facilitating consistent assessment of disease extent.
Building upon the Segment Involvement Score (SIS) calculation, which quantifies the number of coronary segments with detectable plaque based on a standard 17-segment model, the total score was utilized to categorize the overall coronary plaque burden according to the CAD-RADS 2.0 system's P-modifier categories. Specifically, an SIS score (representing the sum of involved segments) of ≤2 corresponded to mild plaque burden (P1), SIS 3-4 indicated moderate burden (P2), SIS 5-7 denoted severe burden (P3), and an SIS ≥8 signified extensive plaque burden (P4). This categorization is clinically relevant, as a higher SIS score is recognized as an independent predictor associated with an increased probability of adverse cardiovascular events. Furthermore, the SIS score provides a framework for risk stratification: an SIS of 0 suggests no plaque involvement, scores from 1-5 generally indicate mild involvement associated with lower risk, while scores greater than 5 imply moderate to severe plaque burden, correlating with an increased risk for adverse cardiac outcomes.
Ethical Considerations
This study was conducted following approval from the Research Ethics Committee at the Faculty of Medicine, Misr University for Science and Technology (MUST). Prior to enrollment, informed written consent was obtained from all participating patients or their first-degree relatives; the consent process included providing detailed information regarding the study's aim, design, methodology, location, duration, and assurance of data confidentiality. Furthermore, official permission to conduct the research was secured from both the Dean of the Faculty of Medicine at MUST and the administration of Alfa Medical Group.
Sample Size Calculation
This study was based on a study by Kumar et al., 2025. Epi Info STATCALC was used to calculate the sample size by considering the following assumptions: - 95% two-sided confidence level, with a power of 80%. & an error of 5% odds ratio calculated= 1.115. The final minimum sample size taken from the Epi-Info output was 100 [14].
Statistical Analysis
Collected data were organized, coded, tabulated, and statistically analyzed using IBM SPSS Statistics software (version 27, IBM Corp., Armonk, NY, USA). The normality of data distribution was evaluated using methods such as the Shapiro-Wilk test and histogram inspection. Quantitative parametric data were presented as mean and standard deviation (SD); comparisons between two groups utilized the Student's t-test, while comparisons among multiple groups employed ANOVA (F-test) with post-hoc analysis (e.g., Tukey test). Quantitative non-parametric data were presented as median and interquartile range (IQR) and analyzed using the Kruskal-Wallis test for multi-group comparisons, followed by the Mann-Whitney U test for pairwise comparisons between groups. Categorical variables were presented as frequencies and percentages (%), and differences between groups were assessed using the Chi-square test. Pearson’s correlation coefficient (r) was calculated to evaluate correlations between variables. A two-tailed P-value < 0.05 was considered statistically significant for all analyses.
Results
This cross-sectional analytical investigation encompassed 200 patients who underwent both coronary computed tomography coronary angiography (CTCA) and transthoracic echocardiography (TTE), ensuring an interval of no more than one year between the two diagnostic assessments; the detailed baseline demographic and clinical characteristics of the study cohort are comprehensively summarized in Table (1).
Regarding the baseline characteristics, the age of the studied patients ranged from 40 to 73 years with a mean (± SD) of 54.27 ± 8.98 years; 104 (52%) patients were males, and 96 (48%) patients were females. The weight ranged from 55 to 95 kg with a mean (± SD) of 74.83 ± 12.45 kg, the height ranged from 1.58 to 1.75 m with a mean (± SD) of 1.68 ± 0.05 m, and the BMI ranged from 18.29 to 36.65 kg/m2 with a mean (± SD) of 26.73 ± 4.73 kg/m2.
Risk Factors of the Studied Patients
The study included a total of 200 participants. Among these individuals, the prevalence of key risk factors was evaluated. Smoking was reported by 52 participants (26%). A relevant family history was noted in 43 participants (21.5%). Hypertension was observed in 80 individuals (40%). Furthermore, 57 participants had Diabetes Mellitus (DM) (28.5%), and 66 participants had dyslipidaemia (33%).
Baseline Laboratory Findings
Baseline laboratory investigations were performed. For example, the mean (± SD) haemoglobin concentration was 12.33 ± 1.14 g/dl, mean HbA1c was 5.23 ± 1.51%, and mean total cholesterol was 228.78 ± 58.1 mg/dL. Full details of all laboratory findings are presented in Table (2).
Baseline Echocardiographic Findings
Baseline echocardiographic findings were also assessed. For instance, the mean (± SD) ejection fraction (EF) was 59.28 ± 5.03%, and the mean left atrial volume index (LAVI) was 31.85 ± 3.74 mL/m2. Regarding diastolic function, 39 patients (19.5%) had normal function, while 82 (41%), 58 (29%), and 21 (10.5%) had grade I, II, and III diastolic dysfunction, respectively. Full details are available in Table (3).
Regarding the echocardiographic findings, EF ranged from 49 to 69 % with a mean (± SD) of 59.28 ± 5.03 %. LAVI ranged from 26 to 43 mL/m2 with a mean (± SD) of 31.85 ± 3.74 mL/m2. Septal e` ranged from 0.5 to 1.1 m/s with a mean (± SD) of 0.83 ± 0.17 m/s. Lateral e` ranged from 0.03 to 0.25 m/s with a mean (± SD) of 59.28 ± 5.03 m/s. E/e` ranged from 49 to 69 with a mean (± SD) of 0.12 ± 0.05. E/A ranged from 0.71 to 2.55 with a mean (± SD) of 1.39 ± 0.44. TR velocity ranged from 0.8 to 3.1 m/s with a mean (± SD) of 1.85 ± 0.61 m/s. DT ranged from 120 to 268 ms with a mean (± SD) of 195.83 ± 38.53 ms, and IVRT ranged from 75 to 144 ms with a mean (± SD) of 107.91 ± 19.71ms.
Among the studied patients, 39 (19.5%) patients had normal diastolic function, 82 (41%) patients had diastolic dysfunction grade I, 58 (29%) patients had diastolic dysfunction grade II and 21 (10.5%) patients had diastolic grade III (Fig. 1).
CACS of the Studied Patients
The Coronary Artery Calcium Score was assessed in 200 participants. The mean (± SD) score was 143.87 ± 144.42, with a median (IQR) of 77 (16.75 - 286.75) and a range of 0 to 425. Regarding the distribution, 39 participants (19.5%) had a score of 0, 84 participants (42%) had scores ranging from 1 to 100, and 77 participants (38.5%) had scores greater than 100 (Fig. 2).
Segment Involvement Score (SIS) of the Studied Patients
The SIS score was evaluated in 200 participants. The mean (± SD) score was 2.2 ± 1.87, with a median (IQR) of 2 (0-4) and a range of 0 to 6. In terms of distribution, 54 participants (27%) had a score of 0, 68 participants (34%) had scores of 1 or 2, and 78 participants (39%) had scores greater than 2 (Fig. 3).
The studied patients were classified according to the type of CAD into non-obstructive CAD in 127 (63.5%) and obstructive CAD in 73 (36.5%). Based on the type of CAD, age was significantly higher in obstructive CAD compared to non-obstructive CAD (P<0.001). Sex was significantly different between obstructive CAD and non-obstructive CAD (P<0.001). Both groups' weight, height and BMI were insignificantly different (Table 4).
The gender distribution among patients categorized with non-obstructive versus obstructive coronary artery disease (CAD) is presented in Fig. (4). Within the non-obstructive CAD group, females represented a higher proportion, estimated at approximately 56%, while males constituted about 44%. Conversely, in the obstructive CAD group, males formed the majority, estimated at around 68%, with females accounting for the remaining approximately 32%. This indicates a notable difference in gender distribution between the two CAD categories presented in the study population.
Regarding the risk factors, hypertension and DM were significantly higher in obstructive CAD compared to non-obstructive CAD (P<0.001, <0.001), with no significant difference between both groups regarding smoking, family history and dyslipidemia (Table 5).
A comparison of baseline laboratory findings between patients with non-obstructive CAD (n=127) and obstructive CAD (n=73) revealed several statistically significant differences, particularly in glycemic control and lipid profiles. Patients with obstructive CAD had significantly higher mean HbA1c levels (5.67 ± 1.67% vs. 4.98 ± 1.35%, P=0.002). Furthermore, the obstructive CAD group exhibited a significantly more atherogenic lipid profile, characterized by higher mean total cholesterol (281.81 ± 44.65 vs. 198.3 ± 40.32 mg/dL, P<0.001), triglycerides (212.33 ± 43.83 vs. 187.77 ± 25.59 mg/dL, P<0.001), and LDL cholesterol (129.18 ± 25.06 vs. 100.7 ± 16.93 mg/dL, P<0.001), along with significantly lower mean HDL cholesterol levels (35.22 ± 3.05 vs. 43.02 ± 4.72 mg/dL, P<0.001). No significant differences were observed between the groups for haemoglobin, white blood cell count, platelet count, ALT, AST, creatinine, or urea levels (Table 6).
Comparing echocardiographic findings between non-obstructive (n=127) and obstructive CAD (n=73) groups revealed highly significant differences across nearly all parameters (P<0.001). Patients with obstructive CAD exhibited significantly lower mean ejection fractions (57.45% vs 60.32%) and larger left atrial volumes (LAVI 33.96 vs 30.64 mL/m2). Furthermore, multiple indices indicated significantly worse diastolic function in the obstructive group, including higher E/e' ratios (10.1 vs 8.07) and a markedly higher prevalence of overall diastolic dysfunction (71.2% vs 23.6%), particularly grades II and III (Table 7).
The relationship between the extent of coronary artery disease (CAD) and left ventricular diastolic function in the studied patient groups is illustrated in Fig. (5&6). As shown in Fig. (5), there is a clear trend of increasing severity of diastolic dysfunction (Grades II and III) with greater CAD burden, particularly in patients with two- and multivessel disease. Fig. (6) further reinforces this association by demonstrating a higher prevalence of diastolic dysfunction among those with more extensive CAD involvement, while patients with single-vessel disease more frequently retained normal diastolic function. These findings suggest a strong correlation between CAD complexity and the deterioration of myocardial relaxation, underscoring the importance of comprehensive cardiac assessment in patients with advanced coronary pathology.
The mean CACS was significantly higher in obstructive CAD compared to non-obstructive CAD (P <0.001). CACS was significantly different between both groups (P<0.001); CACS>100 was significantly higher in obstructive CAD compared to non-obstructive CAD (58.9% vs 26.77%) (Table 8 & Fig. 7).
The mean SIS was significantly higher in obstructive CAD compared to non-obstructive CAD (P <0.001). SIS was significantly different between both groups (P<0.001); SIS>2 was significantly higher in obstructive CAD compared to non-obstructive CAD (57.53% vs 28.35%) (Table 9 & Fig. 8).
There was a significant relation between the incidence of diastolic dysfunction, as age was significantly higher in the diastolic dysfunction group compared to the non-diastolic dysfunction group (P=0.020). There was an insignificant relation between the incidence of diastolic dysfunction and other baseline characteristics (sex, weight, height and BMI) (Table 10).
Positive family history, hypertension and DM were significantly higher in the diastolic dysfunction group compared to the non-diastolic dysfunction group (P<0.05). There was an insignificant relation between diastolic dysfunction and smoking and dyslipidemia (Table 11).
Patients with diastolic dysfunction had significantly higher total cholesterol, LDL (P<0.05), and significantly lower Hb concentration, WBCs count, and HDL compared to those without diastolic dysfunction (P=0.020, 0.050), with no significant difference between both groups regarding the other laboratory investigations (platelet count, HbA1c, ALT, AST, TG, serum creatinine and urea) (Table 12).
There was a significant relationship between diastolic dysfunction and echocardiographic findings, except for TR velocity and LVH, which were insignificantly different between diastolic and non-diastolic dysfunction groups. EF, septal e`, lateral e`, DT and IVRT were significantly lower in the diastolic and non-diastolic dysfunction groups (P<0.05). LAVI, E/e`, E/A and both diastolic function grade II and grade III were significantly higher in the diastolic dysfunction group compared to the non-diastolic dysfunction group (P<0.05) (Table 13).
The Relationship Between Diastolic Dysfunction and CACS
The relationship between diastolic dysfunction and CACS was examined by comparing patients with diastolic dysfunction (n=82) to those without (n=118). A highly significant difference was observed in mean CACS, with patients experiencing diastolic dysfunction reporting substantially higher scores (mean ± SD: 236.33 ± 133.12 vs. 79.61 ± 114.23, P<0.001). The distribution of scores also differed significantly (P<0.001); notably, no patients with diastolic dysfunction had a score of 0 (compared to 33.05% of those without), while a much larger proportion had scores greater than 100 (69.51% vs. 16.95%). There was a significant relation between diastolic dysfunction and CACS. The mean CACS was significantly higher in the diastolic dysfunction group compared to the non-diastolic dysfunction group (P<0.001). Also, patients with CACS >100 were significantly higher in the diastolic dysfunction group compared to non-diastolic dysfunction group (P<0.001).
Relation Between Diastolic Dysfunction and Segment Involvement Score (SIS)
Similarly, the SIS score was compared between the two groups. Patients with diastolic dysfunction (n=82) had significantly higher mean SIS scores compared to those without (n=118) (mean ± SD: 3.41 ± 1.48 vs. 1.35 ± 1.63, P<0.001). The distribution across SIS score categories also showed a significant difference (P<0.001), with fewer patients in the diastolic dysfunction group having a score of 0 (13.41% vs. 52.44%) and a substantially higher proportion having scores greater than 2 (69.51% vs. 25.61%). There was a significant association between diastolic dysfunction and SIS. The mean SIS was significantly higher in the diastolic dysfunction group compared to the non-diastolic dysfunction group (P<0.001). Also, patients with SIS >2 were significantly higher in the diastolic dysfunction group compared to non-diastolic dysfunction group (P<0.001). Furthermore, a strong positive correlation was found between the Segment Involvement Score (SIS) and the severity of diastolic function grades (r = 0.809, P<0.001).
There was a strong positive correlation between diastolic dyfunction grades (Echocardiography) and segment involvement score (SIS) (r=0.809 and P value<0.001). the scatter plot (Fig. 9) illustrates the relationship between the Segment Involvement Score (SIS) and diastolic function grades for the study participants. A clear positive association is visible between the two variables shown. Higher SIS scores tend to correspond with more severe grades of diastolic dysfunction. While there is some scatter, the overall trend indicates a strong positive correlation.
Baseline Demographic Characteristics
Baseline demographic characteristics were compared across the three groups defined by CACS: score 0 (n=39), score 1-100 (n=84), and score >100 (n=77). No statistically significant differences were observed among these groups regarding sex distribution, mean weight, mean height, or mean Body Mass Index (BMI) (all P>0.4). A non-significant trend towards slightly older age was noted in patients with higher CACS (P=0.063) (Table 14).
There was a significant relation between CACS and family history (P=0.034), positive family history was significantly higher in patients with CACS >100. There was an insignificant relation between CACS and the other risk factors (smoking, hypertension, DM and dyslipidemia) (Table 15).
Analysis of laboratory parameters across CACS groups (0, n=39; 1-100, n=84; >100, n=77) revealed significant differences primarily in the lipid profile. Patients with higher CACS (>100) exhibited significantly higher mean total cholesterol (P=0.004) and LDL cholesterol (P=0.018) compared to those with a score of 0. Conversely, mean HDL cholesterol was significantly lower in the >100 group compared to both the 0 group (P=0.001) and the 1-100 group (P=0.046). No significant differences were found for other measured parameters, including HbA1c and triglycerides (Table 16).
Echocardiographic parameters were also compared across CACS groups. Significant differences were primarily observed in diastolic function indices and left atrial size (LAVI, P=0.007). Patients with higher CACS (>100) generally showed indicators of worse diastolic function, including significantly lower septal e' (P=0.017) and lateral e' velocities (P=0.014), higher E/e' ratios (P=0.009), higher TR velocity (P=0.002), shorter DT (P=0.010), and shorter IVRT (P<0.001), particularly when compared to the CACS 0 group. Correspondingly, the distribution of diastolic function grades differed significantly (P<0.001), with worse grades more prevalent in higher CACS groups. No significant differences were found in ejection fraction or LVH prevalence (Table 17).
Furthermore, the Segment Involvement Score (SIS) was compared across the CACS groups, revealing a strong and highly significant association (Overall P<0.001). Mean SIS scores progressively increased with higher CACS categories (CACS 0: 0.28±1.04; CACS 1-100: 1.25±0.77; CACS >100: 4.25±0.9), with all pairwise comparisons being statistically significant (P<0.001). The distribution of SIS scores also differed significantly (P<0.001); virtually all patients with CACS 0 had an SIS of 0, most patients with CACS 1-100 had an SIS of 1-2, and the vast majority of patients with CACS >100 had an SIS greater than 2 (Table 18).
Discussion
Atherosclerotic cardiovascular disease often develops silently over decades, representing a highly prevalent subclinical condition in adults. While nonobstructive plaques may not initially cause ischemia, they can induce functional vascular changes linked to endothelial dysfunction and impaired nitric oxide production [15]. Concurrently, left ventricular (LV) diastolic dysfunction (DD), often preceding systolic impairment, is increasingly recognized as a significant cause of heart failure with preserved ejection fraction (HFpEF) and a predictor of adverse outcomes, including overt heart failure and mortality [16]. Conditions like aging, hypertension, and coronary artery disease (CAD) can exacerbate LV relaxation abnormalities and increase filling pressures, potentially leading to HFpEF [16]. Given the prognostic importance of DD, its early detection via noninvasive methods like echocardiography, particularly using tissue Doppler imaging to overcome the limitations of traditional measures, is crucial [17].
Despite the established impact of overt ischemic heart disease, the relationship between the severity of CAD, particularly in its earlier or nonobstructive stages, and the degree of LV diastolic dysfunction has remained incompletely understood, with limited and sometimes contradictory evidence [18,19,20]. Therefore, this study aimed to determine the correlation between CAD severity, comprehensively assessed by coronary computed tomography angiography (CCTA), and the grade of LV diastolic dysfunction evaluated by transthoracic echocardiography (TTE) in patients with an intermediate pretest probability of CAD.
A central finding of this study is the strong and highly significant positive correlation between the severity of CAD, measured by CCTA indices, and the degree of LV diastolic dysfunction. Patients with obstructive CAD (higher CAD-RADS scores) consistently demonstrated echocardiographic parameters indicative of worse diastolic function compared to those with non-obstructive disease. This included significantly larger left atrial volume index (LAVI), lower mitral annular velocities (septal and lateral e'), higher E/e' ratios, higher E/A ratios (though the overall group difference for E/A was borderline, P=0.075, the trend aligned), higher tricuspid regurgitation (TR) velocities, and shorter deceleration times (DT) and isovolumetric relaxation times (IVRT) (all P<0.01). These findings strongly support a pathophysiological link where increasing coronary atherosclerotic burden compromises myocardial relaxation and compliance, leading to elevated LV filling pressures. Our results align closely with those of [21], who also utilized CCTA and TTE and found significantly worse diastolic parameters (lower DT/IVRT, higher E/e', E/A, LAVI, TR velocity) and a higher prevalence of DD (particularly advanced grades) in patients with obstructive CAD compared to non-obstructive CAD.
Furthermore, we observed a robust correlation between CT-derived plaque burden scores and diastolic function. Both the CACS and the SIS showed highly significant positive associations with the severity of diastolic dysfunction (P<0.001 for both mean scores and distribution across categories). Patients with higher CACS (>100) and SIS (>2) scores exhibited markedly worse diastolic function parameters and a higher prevalence of moderate-to-severe DD compared to those with lower scores. This reinforces the concept that not just obstructive stenosis but the overall extent of coronary atherosclerosis contributes to diastolic impairment. This is consistent with [22], who found that higher CACS and SIS were associated with a greater prevalence of DD (specifically grades >2), and also aligns with prognostic studies showing that higher SIS predicts adverse events, even among those with obstructive CAD [23,24,25]. Our findings contrast with some earlier studies suggesting an inverse or absent relationship between subclinical atherosclerosis markers (like carotid intima-media thickness or CACS in asymptomatic populations) and DD [19,26]. These discrepancies may stem from differences in the methods used to assess atherosclerosis (CIMT or CACS vs. comprehensive CCTA, including non-calcified plaque via SIS/CAD-RADS), the populations studied (healthy/asymptomatic vs. symptomatic intermediate-risk), and the sensitivity of echocardiographic techniques employed. Critically, our study, utilizing detailed CCTA and contemporary echocardiographic guidelines in a relevant clinical population, provides substantial evidence supporting a direct, graded relationship between coronary atherosclerotic burden and the severity of diastolic dysfunction.
Consistent with established epidemiology, patients with obstructive CAD in our cohort were significantly older than those with non-obstructive CAD, although age did not show a statistically significant association with CACS categories (P=0.063). This aligns with large registry data showing a higher prevalence of obstructive CAD in older symptomatic patients referred for CCTA [27]. We also observed a significantly higher proportion of males in the obstructive CAD group (P<0.001). This contrasts with [28], who found similar frequencies of obstructive CAD in men and women evaluated with CCTA/FFR for type 2 myocardial infarction. This discrepancy might be explained by population differences (our broader intermediate-risk CAD population vs. their specific type 2 MI cohort) and potential variations in underlying pathophysiology (atherosclerotic obstruction vs. supply-demand mismatch), cardiovascular risk profiles, and hormonal influences between the study groups [28].
Hypertension and diabetes mellitus were significantly more prevalent in patients with obstructive CAD (P<0.001) and also in those with diastolic dysfunction (P<0.001) in our study. This confirms the well-known association of these risk factors with both advanced atherosclerosis and impaired diastolic function [29]. The strong link between these conditions and DD is further supported by [30], who demonstrated in a community cohort that hypertension and diabetes independently predicted worse diastolic function (higher E/e'), with their coexistence conferring an additive negative impact, potentially explaining the increased risk of heart failure in such patients [31,32]. While previous studies examining these relationships used older diagnostic criteria or lacked advanced echo techniques [33,34], our findings, adjusted implicitly through group comparisons, reinforce the crucial role of hypertension and diabetes in the development of both obstructive CAD and diastolic dysfunction.
Glycemic control, reflected by HbA1c, was significantly worse in the obstructive CAD group compared to the non-obstructive group (P=0.002), consistent with studies linking higher HbA1c levels to increased severity and complexity of coronary lesions, even in non-diabetic individuals [35,36]. However, HbA1c levels did not significantly differ across CACS categories in our analysis (P=0.903), suggesting that while poor glycemic control is associated with obstructive disease, its relationship with the overall calcified plaque burden might be less direct or influenced by other factors within this specific population.
Lipid profiles also showed significant associations. Patients with obstructive CAD had significantly higher total cholesterol, LDL, triglycerides, and lower HDL than the non-obstructive group (all P<0.001). Similarly, worse lipid profiles (higher total cholesterol and LDL, lower HDL) were significantly associated with higher CACS (P=0.005, P=0.022, P=0.001 respectively), aligning with findings by [37] who reported correlations between lipids and CACS. Furthermore, patients with diastolic dysfunction exhibited significantly higher total cholesterol and LDL levels compared to those without DD. This association between dyslipidemia and DD, particularly in diabetic populations, has been noted previously [38]. Our finding of higher LDL in the obstructive CAD group contrasts with [39], who found higher LDL in non-obstructive patients post-angiography. As suggested by Wilkinson et al., this discrepancy likely reflects differences in study design and timing; their post-procedural assessment may capture the effects of aggressive lipid-lowering initiated after diagnosing obstructive disease, whereas our baseline assessment reflects the untreated state.
While the primary focus was diastolic function, we observed that mean ejection fraction (EF), although within the normal range for both groups, was significantly lower in patients with obstructive CAD compared to non-obstructive CAD (57.45% vs 60.32%, P<0.001). This aligns with [40] and suggests that even in patients largely classified as having preserved EF, obstructive CAD may be associated with subtle systolic impairment. However, EF did not differ significantly across CACS (P=0.780) or between those with and without diastolic dysfunction, consistent with the concept of HFpEF, where significant diastolic abnormalities can exist despite relatively normal EF [41].
This study underscores the strong association between the severity and extent of coronary atherosclerosis, assessed by CCTA, and the presence and severity of LV diastolic dysfunction, evaluated by contemporary echocardiography. Identifying DD in patients with CAD, even nonobstructive disease, is clinically relevant as it signifies impaired cardiac mechanics and carries prognostic weight. The consistent link across various CCTA scores (CAD-RADS, CACS, SIS) and multiple echocardiographic parameters strengthens the evidence for this relationship in an intermediate-risk population. These findings highlight the potential utility of integrating both CCTA and detailed echocardiographic assessments for comprehensive cardiovascular risk stratification. Recognizing the coexistence of significant CAD and DD may prompt more aggressive management of shared risk factors like hypertension, diabetes, and dyslipidemia, potentially mitigating the progression to HFpEF and improving patient outcomes.
Strengths of this study include the use of comprehensive CCTA for detailed CAD assessment (including plaque burden via SIS and CACS, and stenosis severity via CAD-RADS) and contemporary ASE/EAE guideline-based echocardiography for diastolic function grading. The recruitment of a relevant clinical population with intermediate pretest probability enhances the generalizability of the findings to patients commonly undergoing noninvasive cardiac imaging. However, limitations must be acknowledged. The cross-sectional design precludes establishing causality; we can only report associations. While patients underwent TTE and CCTA within a year, these were not simultaneous assessments. While adequate for detecting strong correlations, the sample size might limit the power of some subgroup analyses. Data was collected from specific centers, potentially introducing selection bias. Finally, residual confounding by unmeasured factors cannot be entirely excluded.
Conclusions
In conclusion, this study demonstrates a significant and graded positive correlation between the severity and extent of coronary artery disease, assessed by CCTA, and the presence and severity of left ventricular diastolic dysfunction, assessed by echocardiography, in patients with intermediate pretest probability for CAD. Higher CAD-RADS classifications, CACS, and SIS scores were consistently associated with worse diastolic function parameters and higher grades of diastolic dysfunction. Key cardiovascular risk factors, notably hypertension and diabetes, along with dyslipidemia, were associated with both obstructive CAD and diastolic dysfunction. These findings emphasize the interconnectedness of coronary atherosclerosis and diastolic impairment and highlight the importance of comprehensive cardiovascular assessment for risk stratification and management. Future longitudinal studies are warranted to confirm these associations and explore the impact of therapeutic interventions targeting CAD and risk factors on diastolic function progression. This study is limited by its small sample size, single-center design, and short follow-up period, which may affect the generalizability and long-term applicability of the findings. Future research should include larger, multicenter cohorts with extended follow-up to evaluate disease progression and treatment outcomes better.
Study Limitations
This study has several limitations. First, its single-center design and moderate sample size may limit the generalizability of findings to broader populations and reduce statistical power to detect subtle associations. Second, the cross-sectional nature precludes establishing causal relationships between CAD severity and diastolic dysfunction, as temporal sequences cannot be determined. Third, while CT angiography provides anatomical assessment of CAD, the absence of functional ischemia testing (e.g., fractional flow reserve or stress echocardiography) limits insights into hemodynamic significance. Fourth, the lack of longitudinal data hinders evaluation of how CAD progression impacts diastolic dysfunction over time. Additionally, despite adjusting for confounders such as diabetes and hypertension, residual confounding from unmeasured variables (e.g., medication adherence, lifestyle factors) cannot be ruled out. Finally, the absence of an external validation cohort raises concerns about the reproducibility of results in diverse clinical settings
Author Contributions
AE: SMHE, MAT: Conceptualized the idea; MAE, YAYS: conducted the experimental work and wrote the first draft; HS, BA, ZTT: revised the final draft.
Funding
This work received no external funding.
Ethical approval
The proposal for this work was approved by MUST’s IRB number 2024/0022 on April 24, 2024.
Conflicts of Interests
The authors declare no conflict of interest.
Data availability
All data generated are presented in the current MS.
References
- King, M.W., et al., Epidemiology and risk factors, in Coronary Artery Disease and The Evolution of Angioplasty Devices. 2020. p. 1-2.
- Dos Santos, C.C.L., et al., The influence of sex, age, and race on coronary artery disease: a narrative review. Cureus, 2023. 15(10).
- Hou, X.Z., et al., Development and external validation of a risk prediction model for depression in patients with coronary heart disease. J Affect Disord, 2024. 367: p. 137-147. [CrossRef]
- Rashedi, S., et al., Anticoagulation and Antiplatelet Therapy for Atrial Fibrillation and Stable Coronary Disease: Meta-Analysis of Randomized Trials. J Am Coll Cardiol, 2025. 85(11): p. 1189-1203.
- Mehta, L.S., et al., Acute Myocardial Infarction in Women: A Scientific Statement From the American Heart Association. Circulation, 2016. 133(9): p. 916-47.
- Li, S., et al., Modifiable risk factors associated with cardiovascular disease and mortality in China: a PURE substudy. European Heart Journal, 2022. 43(30): p. 2852-2863. [CrossRef]
- Solola Nussbaum, S., et al., Sex-specific considerations in the presentation, diagnosis, and management of ischemic heart disease: JACC focus seminar 2/7. Journal of the American College of Cardiology, 2022. 79(14): p. 1398-1406.
- van Oosterhout, R.E.M., et al., Sex differences in symptom presentation in acute coronary syndromes: a systematic review and meta-analysis. Journal of the American Heart Association, 2020. 9(9).
- Khraishah, H., et al., Sex, Racial, and Ethnic Disparities in Acute Coronary Syndrome: Novel Risk Factors and Recommendations for Earlier Diagnosis to Improve Outcomes. Arterioscler Thromb Vasc Biol, 2023. 43(8): p. 1369-1383. [CrossRef]
- Serruys, P.W., et al., Coronary computed tomographic angiography for complete assessment of coronary artery disease: JACC state-of-the-art review. Journal of the American College of Cardiology, 2021. 78(7): p. 713-736.
- Maroules, C.D., et al., 2022 use of coronary computed tomographic angiography for patients presenting with acute chest pain to the emergency department: An expert consensus document of the Society of cardiovascular computed tomography (SCCT): Endorsed by the American College of Radiology (ACR) and North American Society for cardiovascular Imaging (NASCI). J Cardiovasc Comput Tomogr, 2023. 17(2): p. 146-163.
- Nagueh, S.F., Left ventricular diastolic function: understanding pathophysiology, diagnosis, and prognosis with echocardiography. JACC: Cardiovascular Imaging, 2020. 13(1 Part 2): p. 228-244.
- Janssens, J.V., et al., The cardiomyocyte origins of diastolic dysfunction: cellular components of myocardial "stiffness". Am J Physiol Heart Circ Physiol, 2024. 326(3): p. H584-h598. [CrossRef]
- Kumar AFS, Ojha V, Veettil ST et al. Incremental Role of Cardiac CT Angiography in the Assessment of Left Ventricular Diastolic Function in Patients With Suspected Coronary Artery Disease With Normal Ejection Fraction: A Comparison With Transthoracic Echocardiography. Echocardiography. 2025 Jan;42(1):e70069. [CrossRef]
- Fan, J. and T. Watanabe, Atherosclerosis: Known and unknown. Pathol Int, 2022. 72: p. 151-160.
- Nadruz, W., A.M. Shah, and S.D. Solomon, Diastolic Dysfunction and Hypertension. Med Clin North Am, 2017. 101: p. 7-17.
- Daneii, P., et al., Lipids and diastolic dysfunction: Recent evidence and findings. Nutr Metab Cardiovasc Dis, 2022. 32: p. 1343-1352. [CrossRef]
- Sharifov OF, Denney JR TS et al. Coronary artery disease is associated with impared atrial junction regardles of left ventricular filling pressure. International journal of cardiology. 2023 Sep 15;387:131102.
- Garcia, M.M., et al., [Influence of subclinical atherosclerosis on diastolic function in individuals free of cardiovascular disease]. Arq Bras Cardiol, 2010. 95: p. 473-478.
- Janssens, J.V., et al., The cardiomyocyte origins of diastolic dysfunction: cellular components of myocardial "stiffness". Am J Physiol Heart Circ Physiol, 2024. 326: p. H584-H598.
- Elshafey, W.E.H., et al., Severity of coronary artery disease by coronary CT angiography in relation to left ventricular diastolic function. World Journal of Cardiovascular Diseases, 2020. 10(4): p. 235-245. [CrossRef]
- Jamiel, A., et al., Correlation Between Diastolic Dysfunction and Coronary Artery Disease on Coronary Computed Tomography Angiography. Heart Views, 2016. 17: p. 13-18. [CrossRef]
- Bittencourt, M.S., et al., Prognostic value of nonobstructive and obstructive coronary artery disease detected by coronary computed tomography angiography to identify cardiovascular events. Circ Cardiovasc Imaging, 2014. 7: p. 282-291.
- Viladés-Medel, D., et al., Usefulness of Cardiac Computed Tomography in Coronary Risk Prediction: A Five-Year Follow-Up of the SPICA Study (Secure Prevention with Imaging of the Coronary Arteries). J Clin Med, 2022. 11. [CrossRef]
- Yiu, K.H., et al., Different value of coronary calcium score to predict obstructive coronary artery disease in patients with and without moderate chronic kidney disease. Neth Heart J, 2013. 21: p. 347-353.
- Eleid, M.F., et al., Coronary artery plaque burden does not affect left ventricular diastolic function in asymptomatic adults with normal ejection fraction. J Am Soc Echocardiogr, 2011. 24: p. 909-914. [CrossRef]
- Winther, S., et al., Performance of the American Heart Association/American College of Cardiology Guideline-Recommended Pretest Probability Model for the Diagnosis of Obstructive Coronary Artery Disease. J Am Heart Assoc, 2022. 11. [CrossRef]
- Lin, C., et al., Sex Differences in Coronary Artery Disease Characteristics Among Patients With Type 2 Myocardial Infarction. JACC Adv, 2024. 3. [CrossRef]
- Parakh, A., et al., Recognizing and minimizing artifacts at dual-energy CT. Radiographics, 2021. 41(2): p. 509-523.
- Russo, G., et al., Coronary artery plaque rupture and erosion: Role of wall shear stress profiling and biological patterns in acute coronary syndromes. International Journal of Cardiology, 2023. 370: p. 356-365.
- Gottdiener, J.S., et al., Predictors of congestive heart failure in the elderly: the Cardiovascular Health Study. J Am Coll Cardiol, 2000. 35: p. 1628-1637.
- Kannel, W.B., M. Hjortland, and W.P. Castelli, Role of diabetes in congestive heart failure: the Framingham study. Am J Cardiol, 1974. 34: p. 29-34. [CrossRef]
- Araz, M., A. Bayrac, and H. Ciftci, The impact of diabetes on left ventricular diastolic function in patients with arterial hypertension. North Clin Istanb, 2015. 2: p. 177-181.
- Mandinov, L., et al., Diastolic heart failure. Cardiovasc Res, 2000. 45: p. 813-825.
- Dutta, B., M. Neginhal, and F. Iqbal, Glycated Hemoglobin (HbA1c) Correlation with Severity of Coronary Artery Disease in Non-diabetic Patients - A Hospital based Study from North-Eastern India. J Clin Diagn Res, 2016. 10: p. OC20-OC23.
- Ma, L., et al., Nitrate and nitrite in health and disease. Aging and Disease, 2018. 9(5): p. 938. [CrossRef]
- Xiang, L., The correlation between stable angina and inflammatory factors and blood lipids: a case-control study. Front Cardiovasc Med, 2024. 11.
- Hassan Ayman, K.M., et al., Correlation between left ventricular diastolic dysfunction and dyslipidaemia in asymptomatic patients with new-onset type 2 diabetes mellitus. The Egyptian Journal of Internal Medicine, 2021. 33.
- Wilkinson, M.J., et al., Trends in LDL-C following coronary angiography involving assessment by fractional flow reserve in obstructive vs non-obstructive coronary artery disease. Am J Prev Cardiol, 2023. 13. [CrossRef]
- El shafey, w.e.d., et al., Severity of Coronary Artery Disease by Coronary CT Angiography in Relation to Left Ventricular Diastolic Function. World Journal of Cardiovascular Diseases, 2020. 10: p. 235-245. [CrossRef]
- Abhayaratna, et al., Characteristics of left ventricular diastolic dysfunction in the community: an echocardiographic survey. Heart, 2006. 92: p. 1259-64.
Figure 1.
Distribution of Diastolic Dysfunction Grades Among the Studied Patients. The bar chart illustrates the prevalence of different left ventricular diastolic dysfunction grades. Grade I (impaired relaxation) was the most common, followed by Grade II (pseudonormal), while Grade III (restrictive filling) showed the lowest occurrence, indicating a predominance of milder forms of diastolic dysfunction in the cohort. Error bars represent standard deviation.
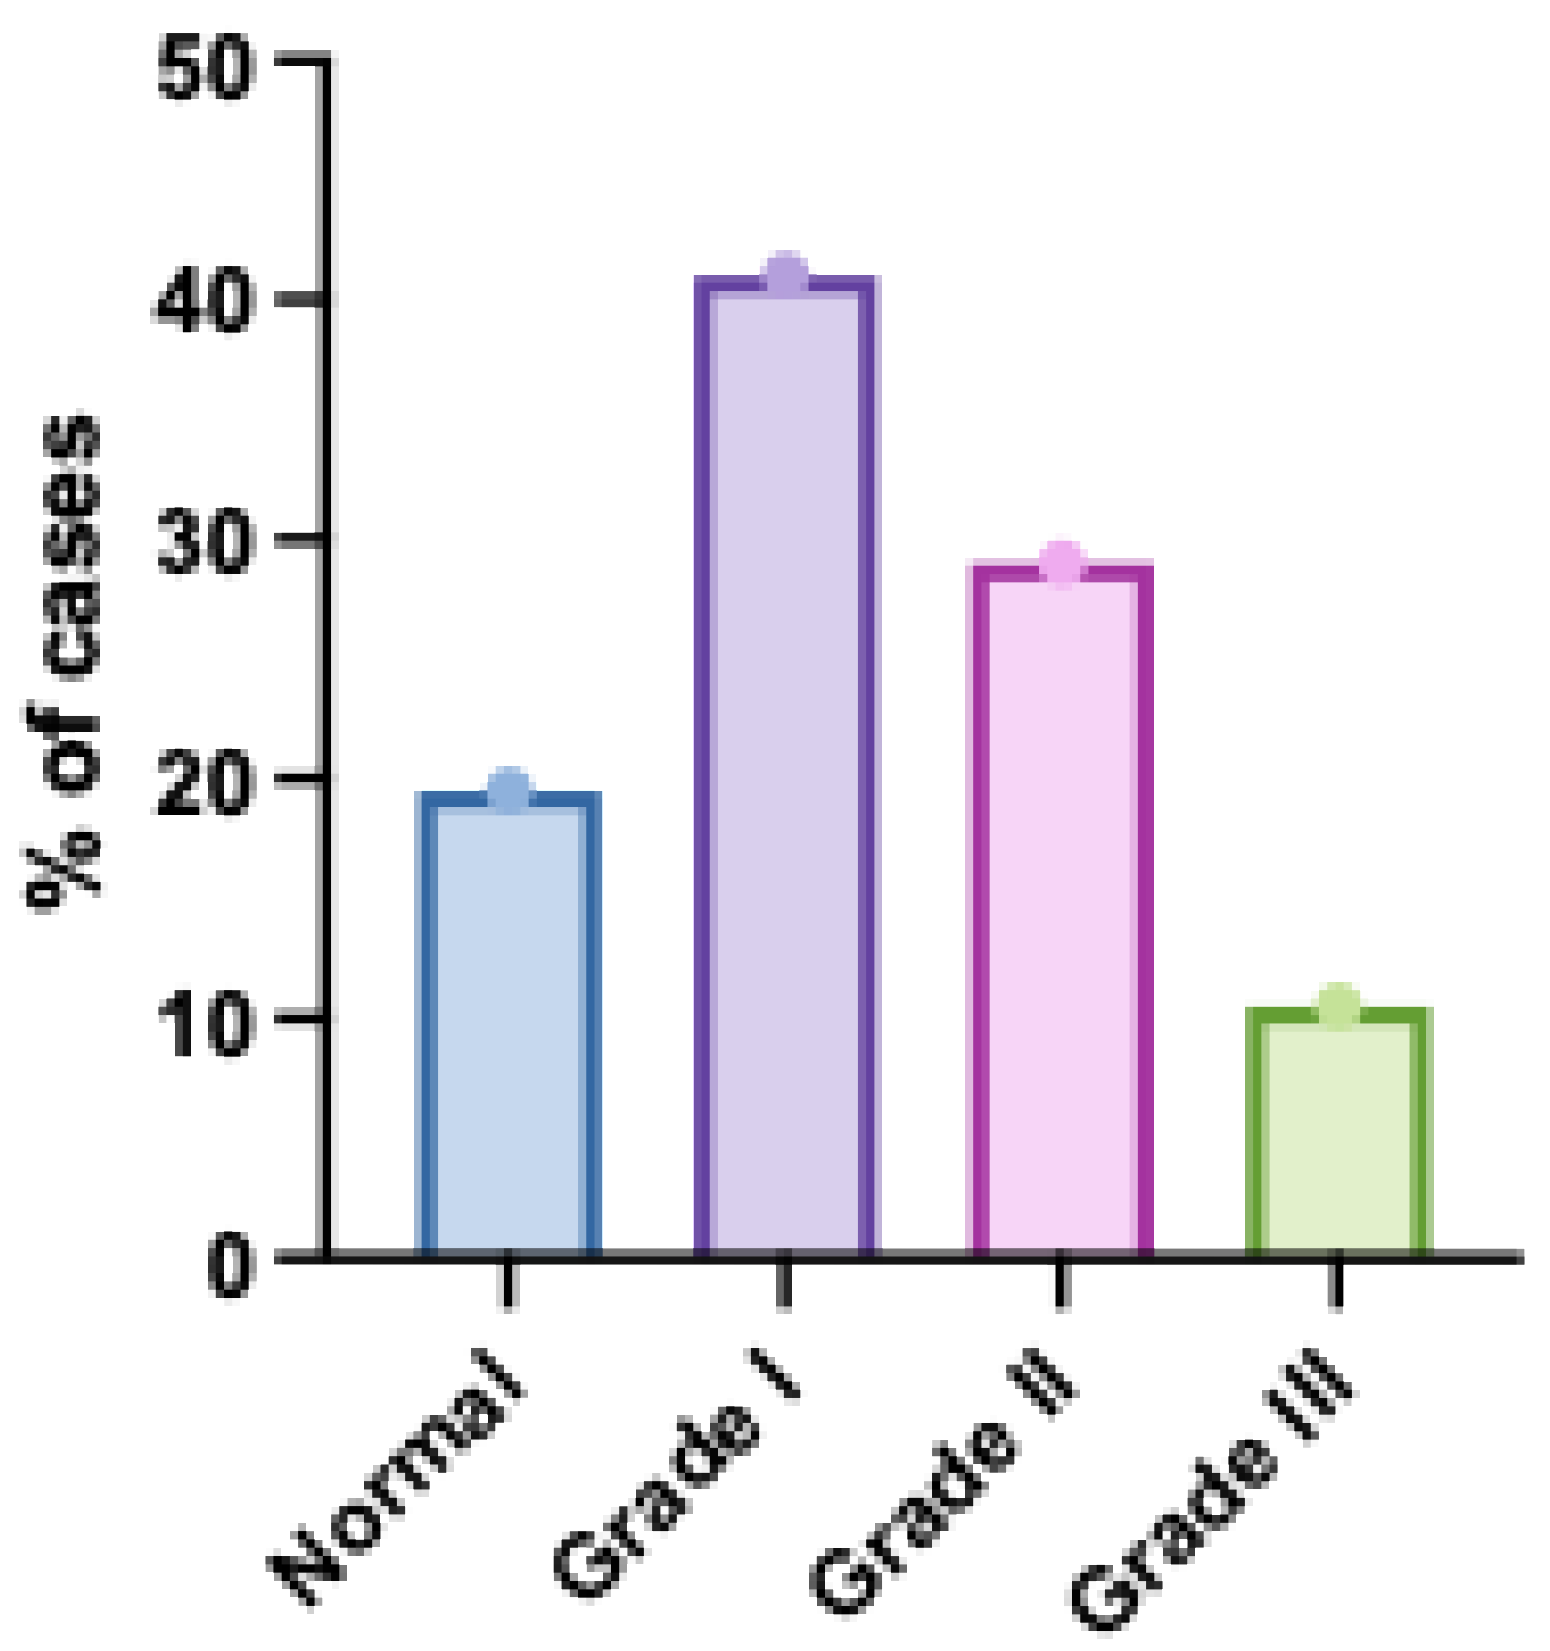
Figure 2.
Distribution of CACS Among the Studied Patients.
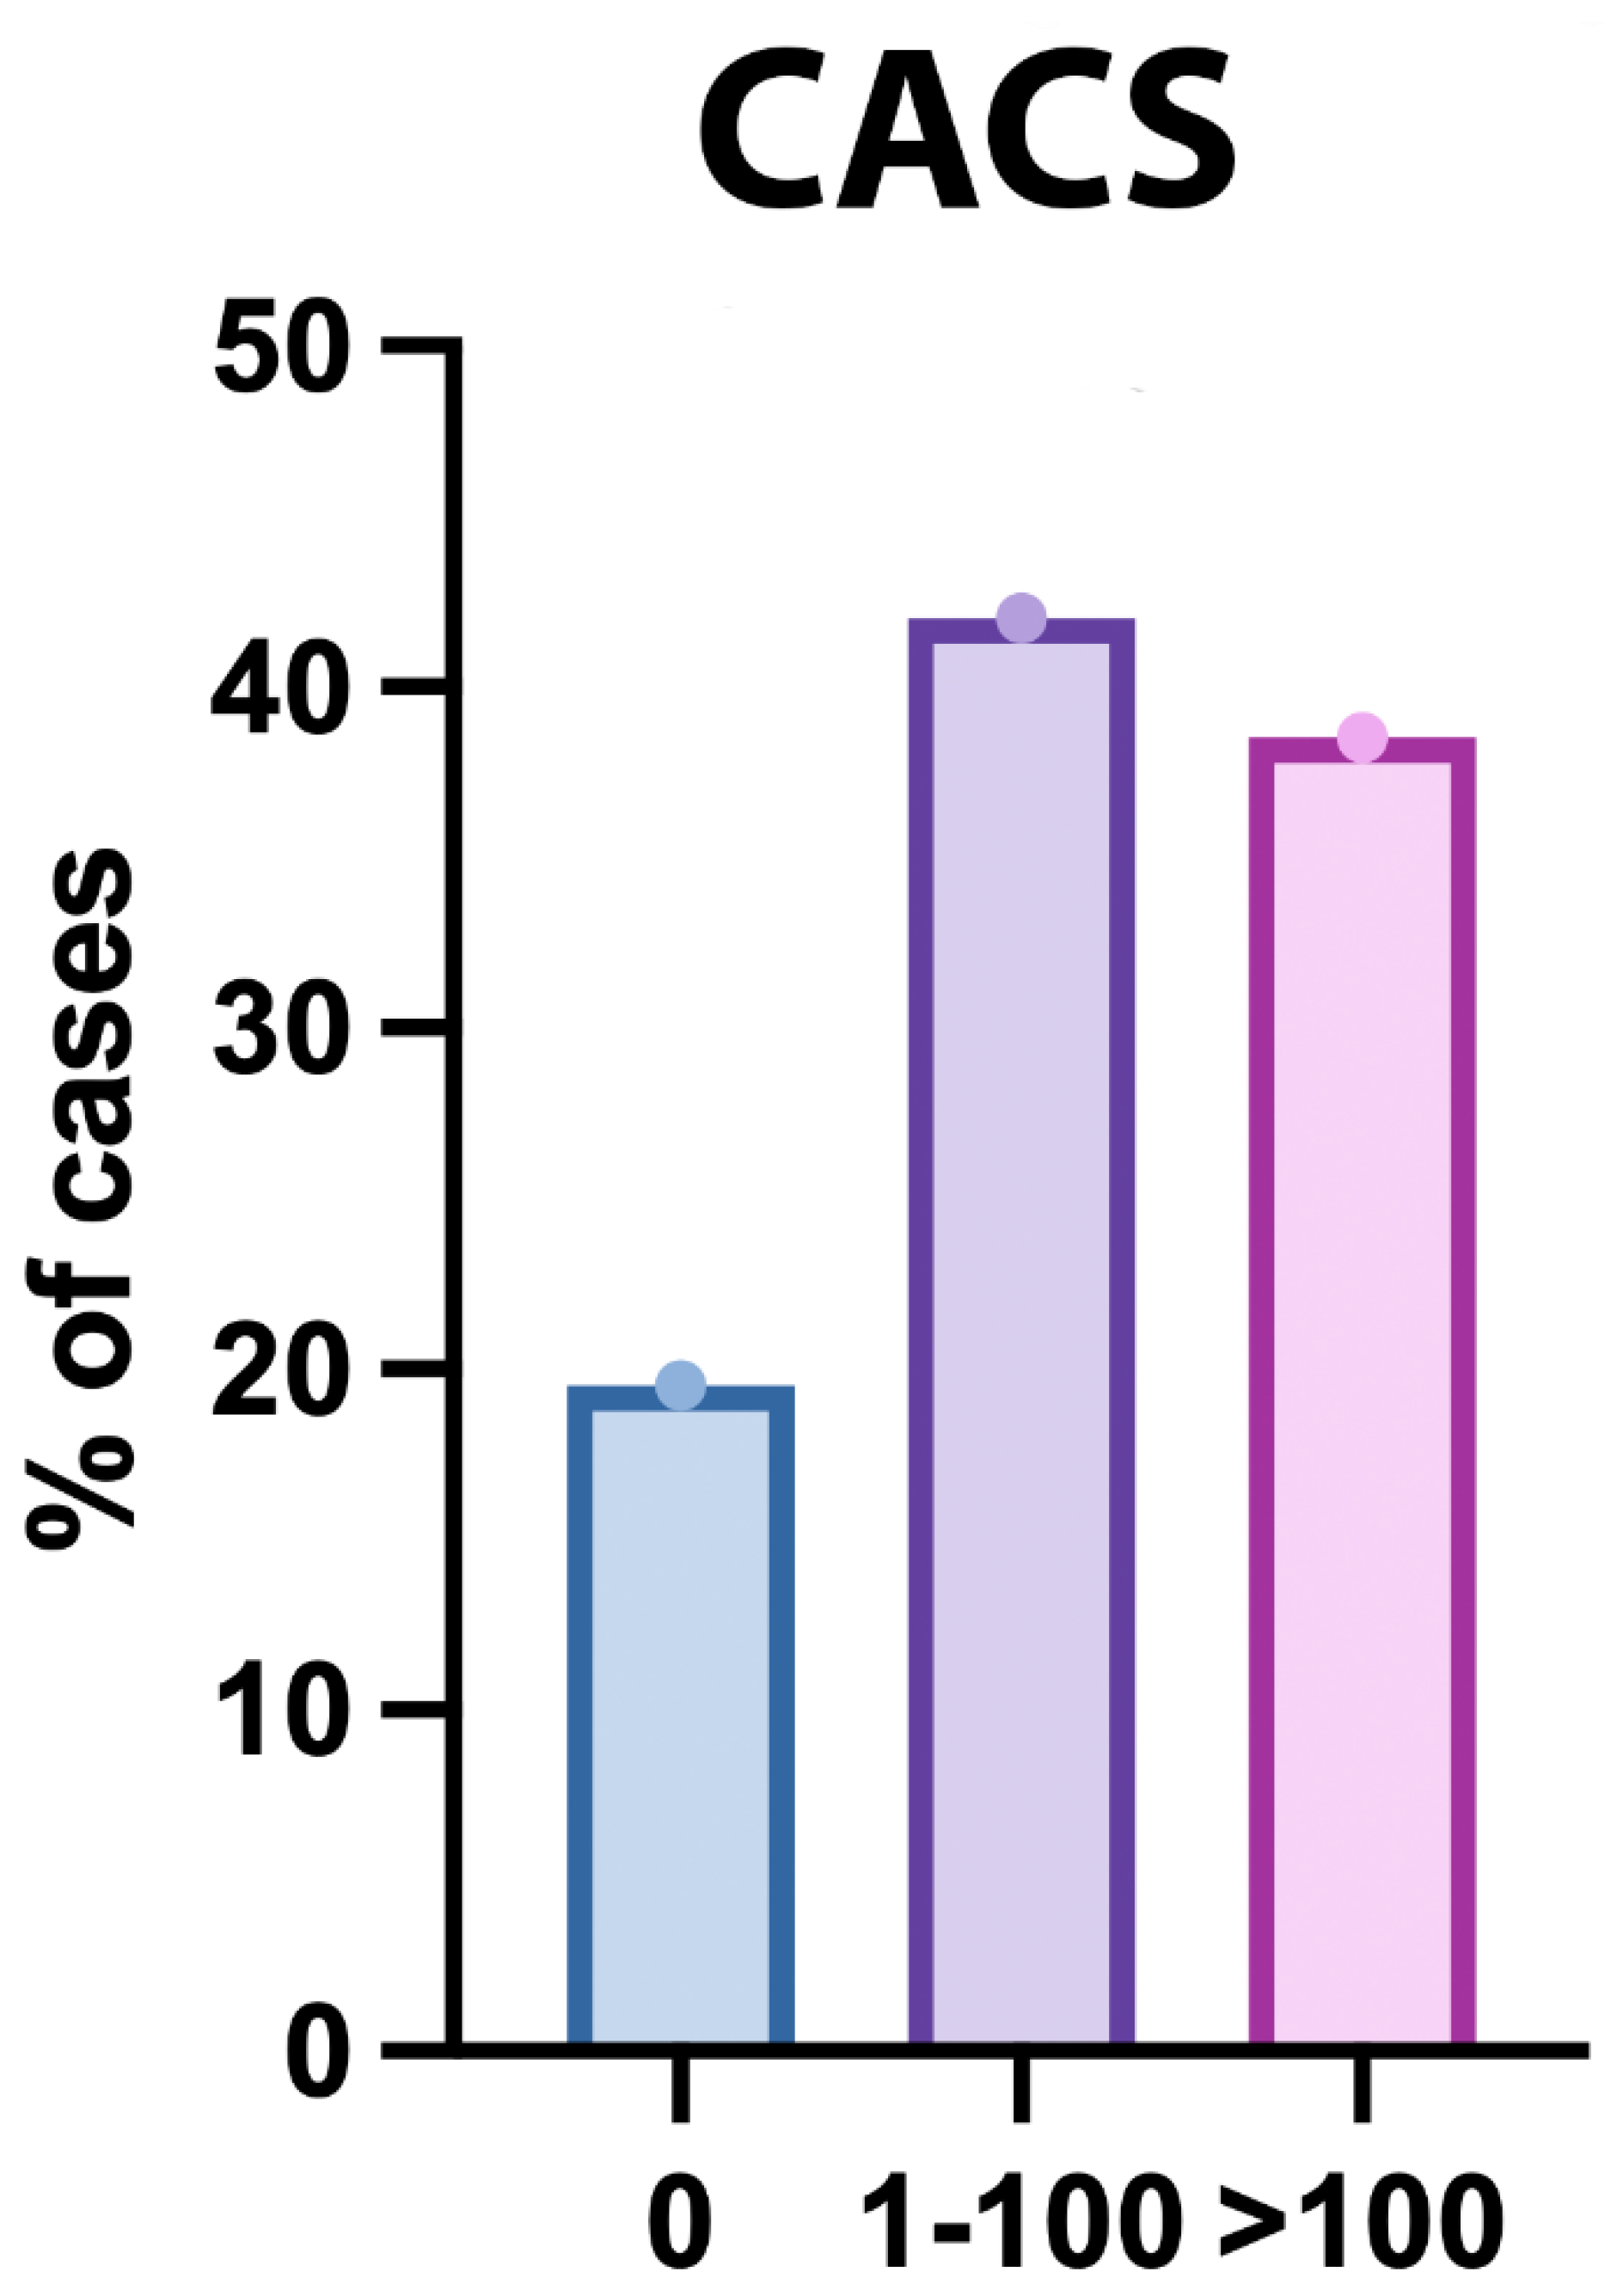
Figure 3.
Segment Involvement Score (SIS) Distribution Among the Studied Patients. The bar chart displays the distribution of SIS values, reflecting the extent of coronary artery involvement. Patients with higher SIS scores were more prevalent, indicating a greater burden of atherosclerotic plaque across multiple coronary segments. Error bars represent standard deviation.
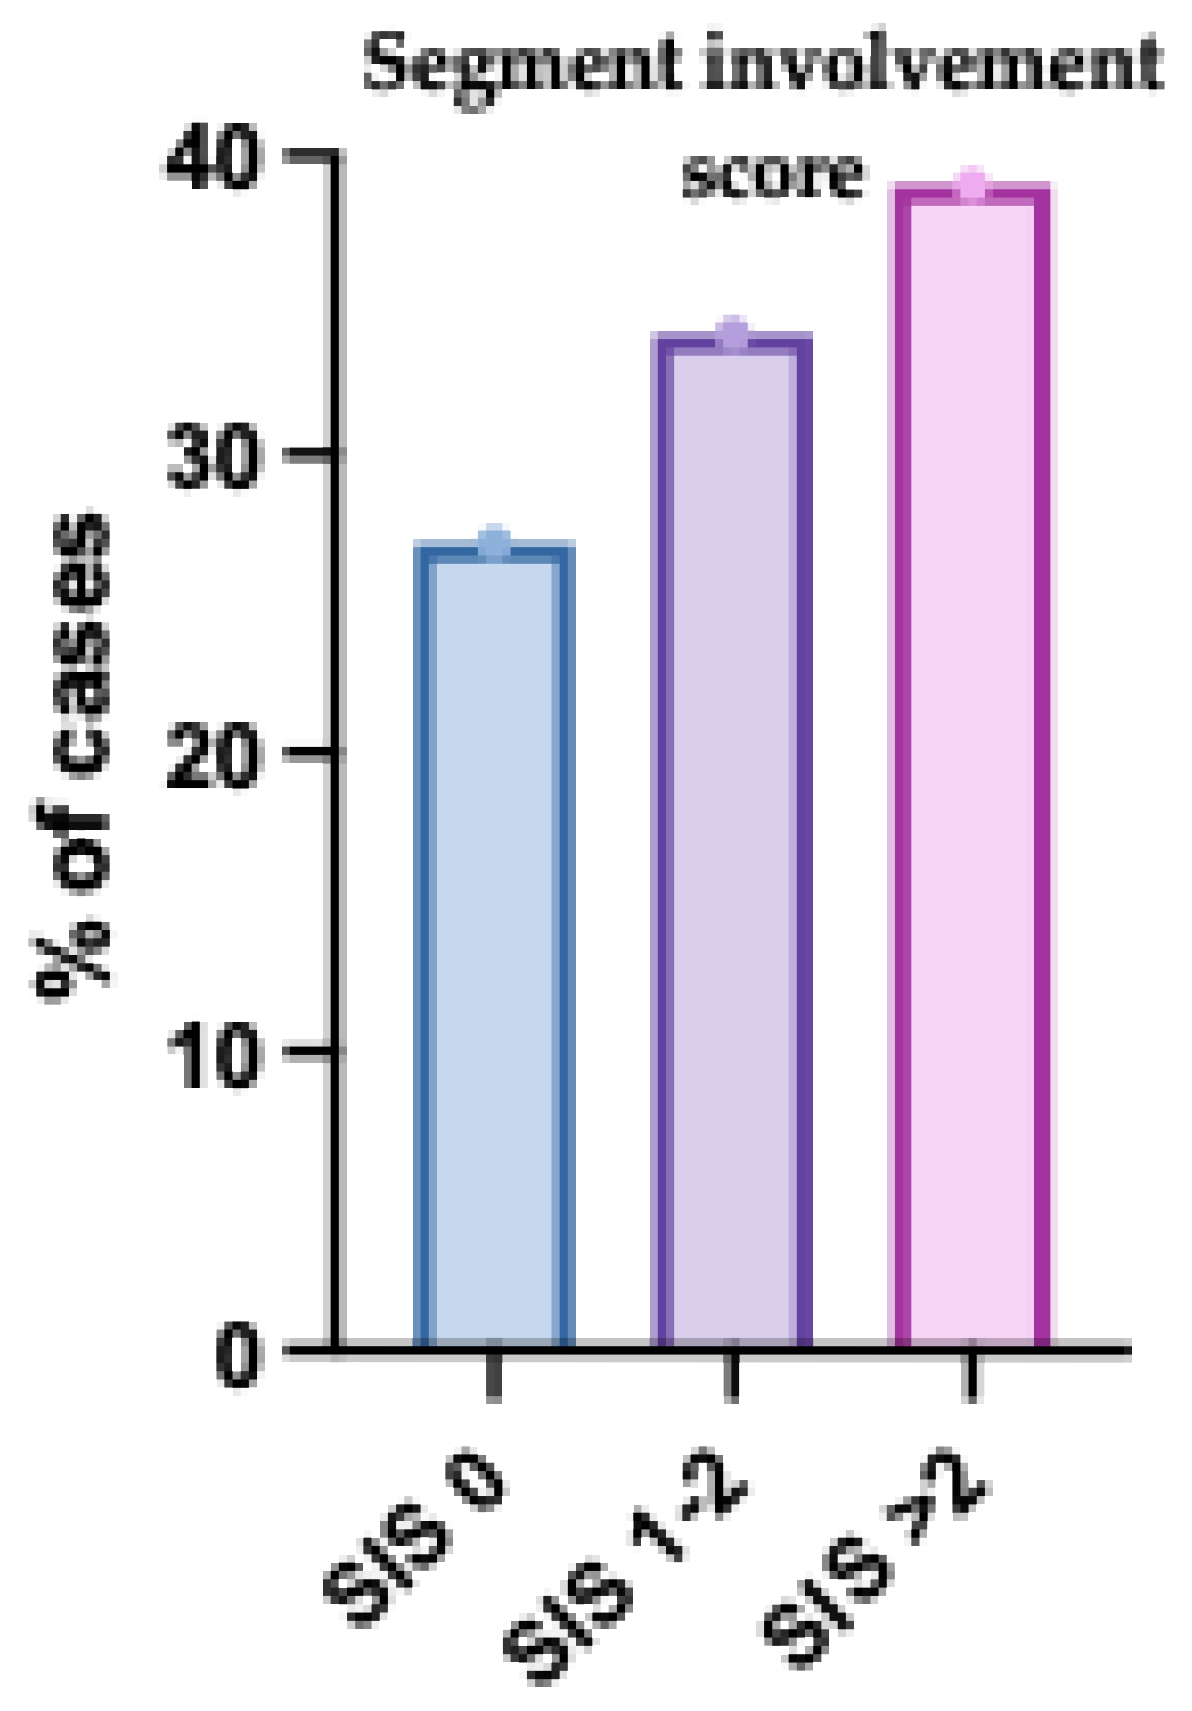
Figure 4.
Figure: Sex Distribution of the Studied Groups According to Type of Coronary Artery Disease (CAD). This bar chart compares the distribution of males and females across different CAD types. Males were more frequently affected by multivessel disease, while females showed higher representation in single-vessel disease. These findings highlight sex-related differences in the extent of coronary artery involvement. Error bars represent standard deviation.
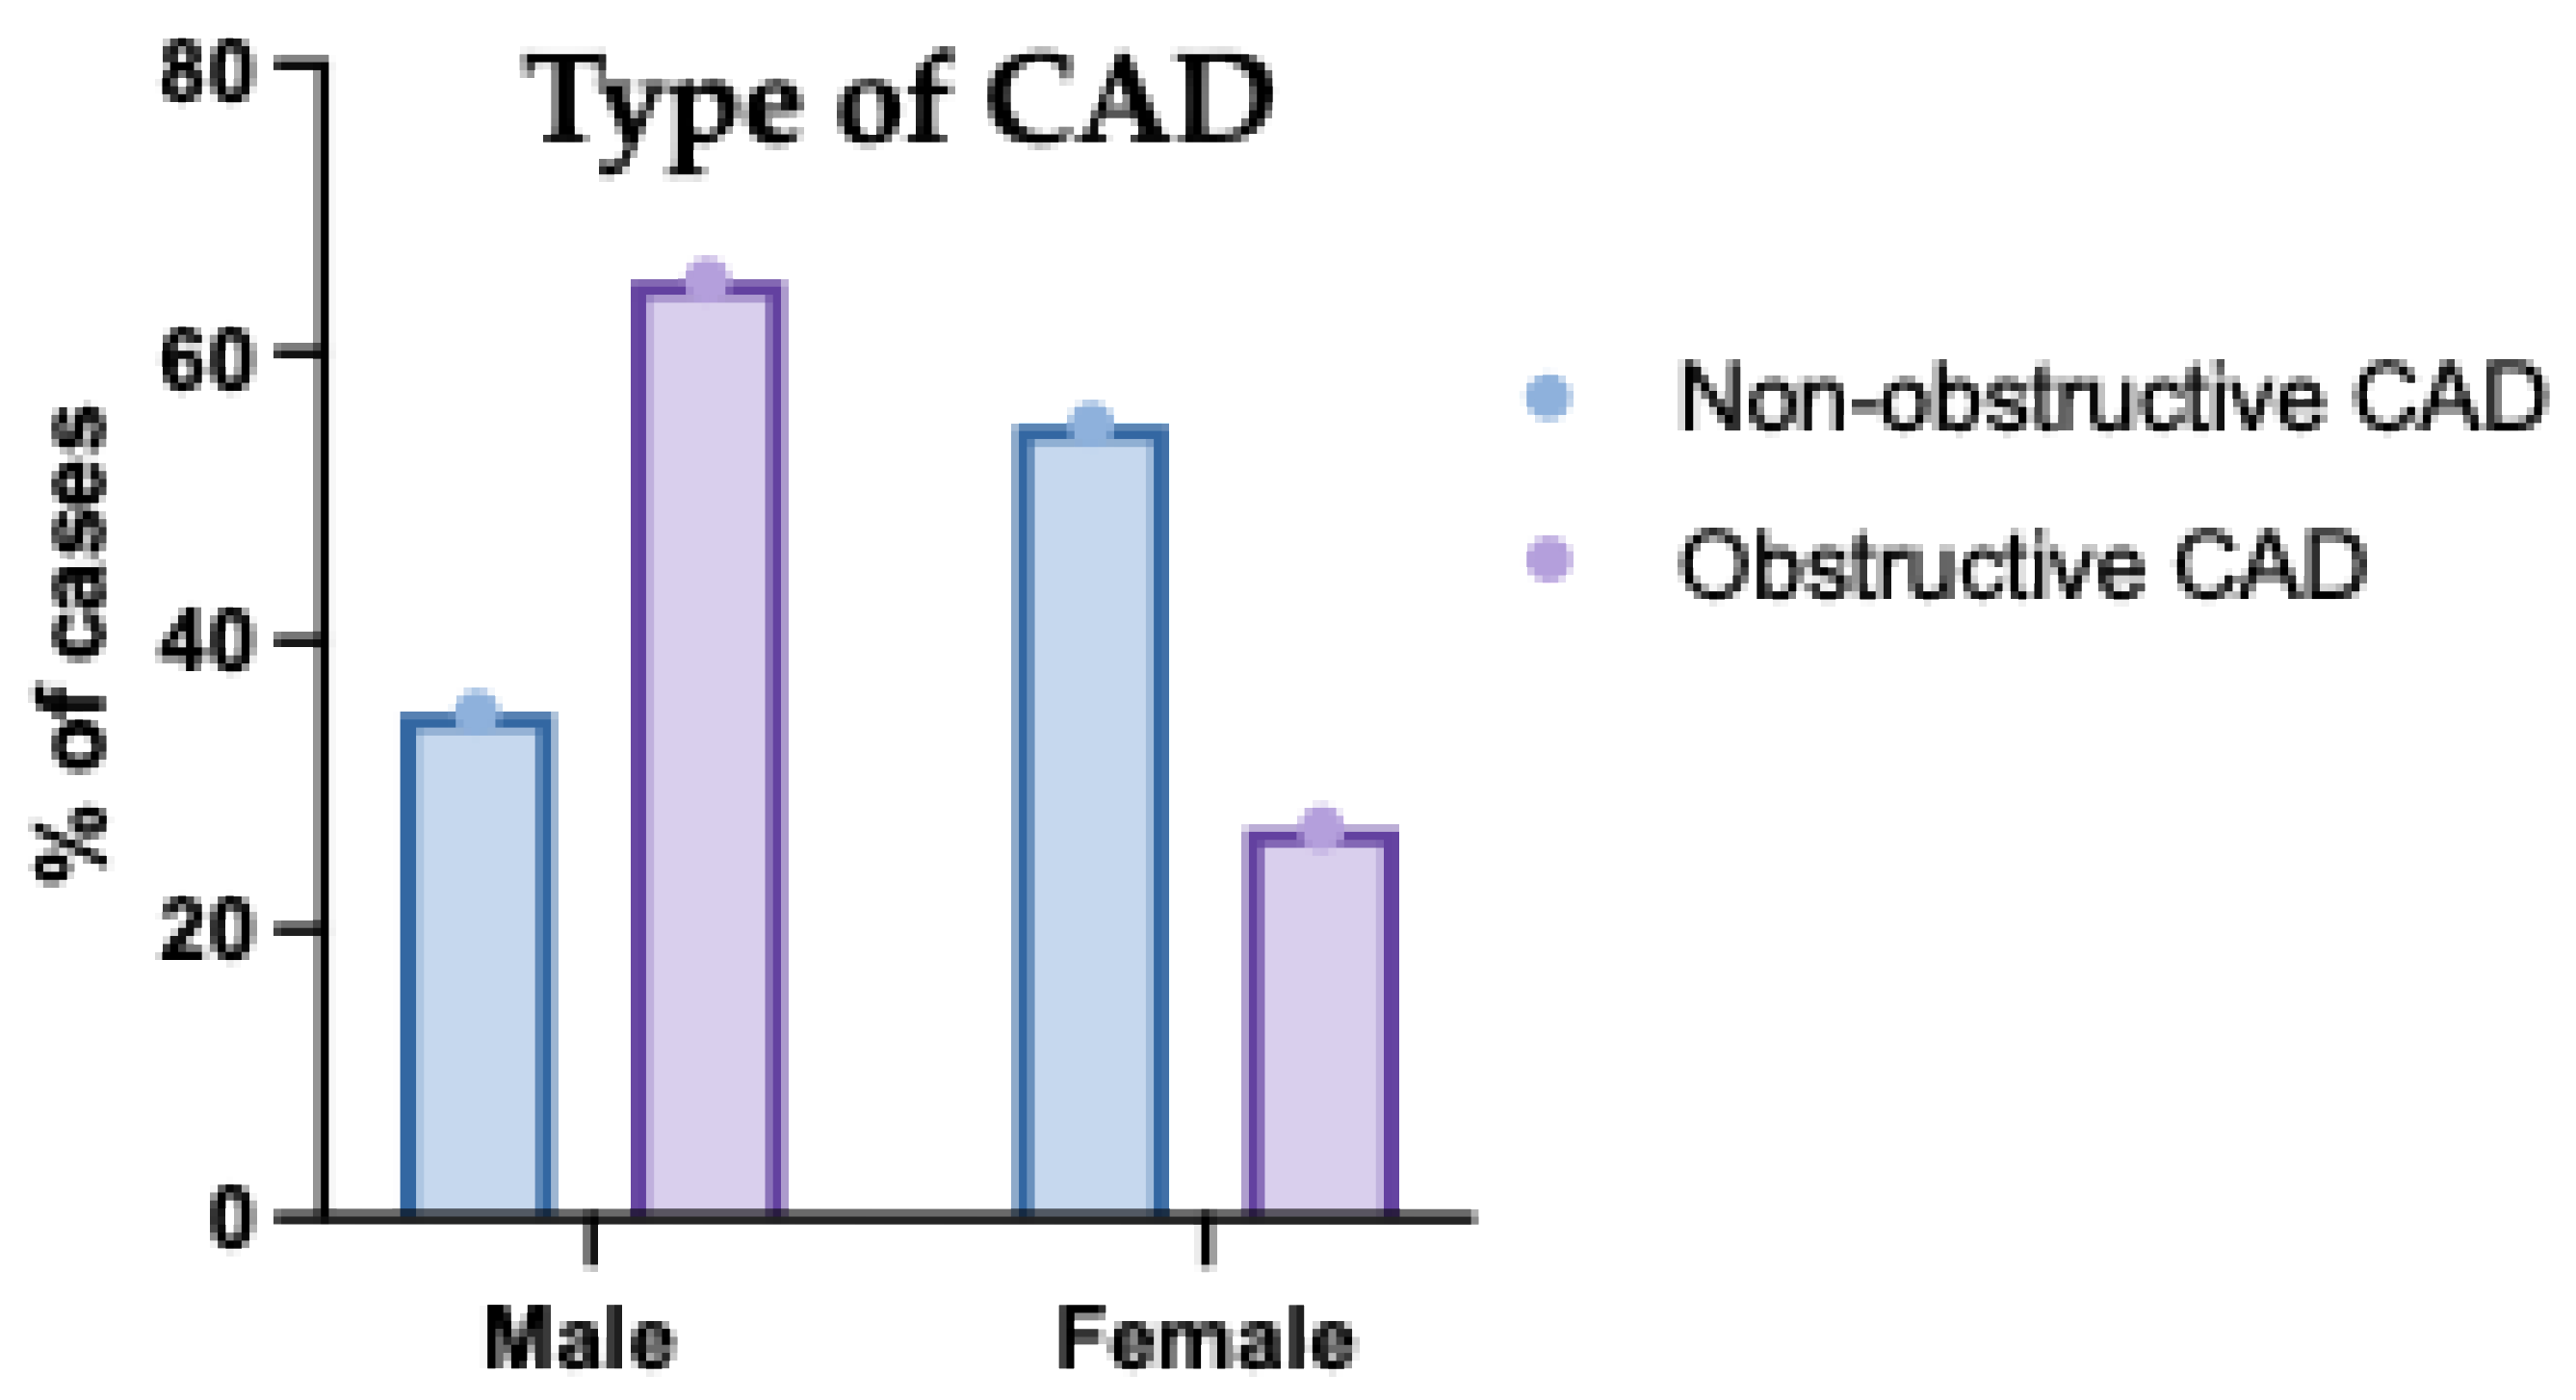
Figure 5.
Diastolic Grade of the Studied Groups Regarding the Type of Coronary Artery Disease (CAD). This bar chart presents the distribution of diastolic dysfunction grades (I, II, III) across different CAD types (single-vessel, two-vessel, and multivessel disease). Grade I diastolic dysfunction was more prevalent in single-vessel disease. In contrast, Grade III was more prominent in multivessel disease, indicating worsening diastolic function with increasing CAD severity. Grade II dysfunction was relatively balanced across the groups. These findings suggest a progressive relationship between CAD extent and severity of diastolic dysfunction.
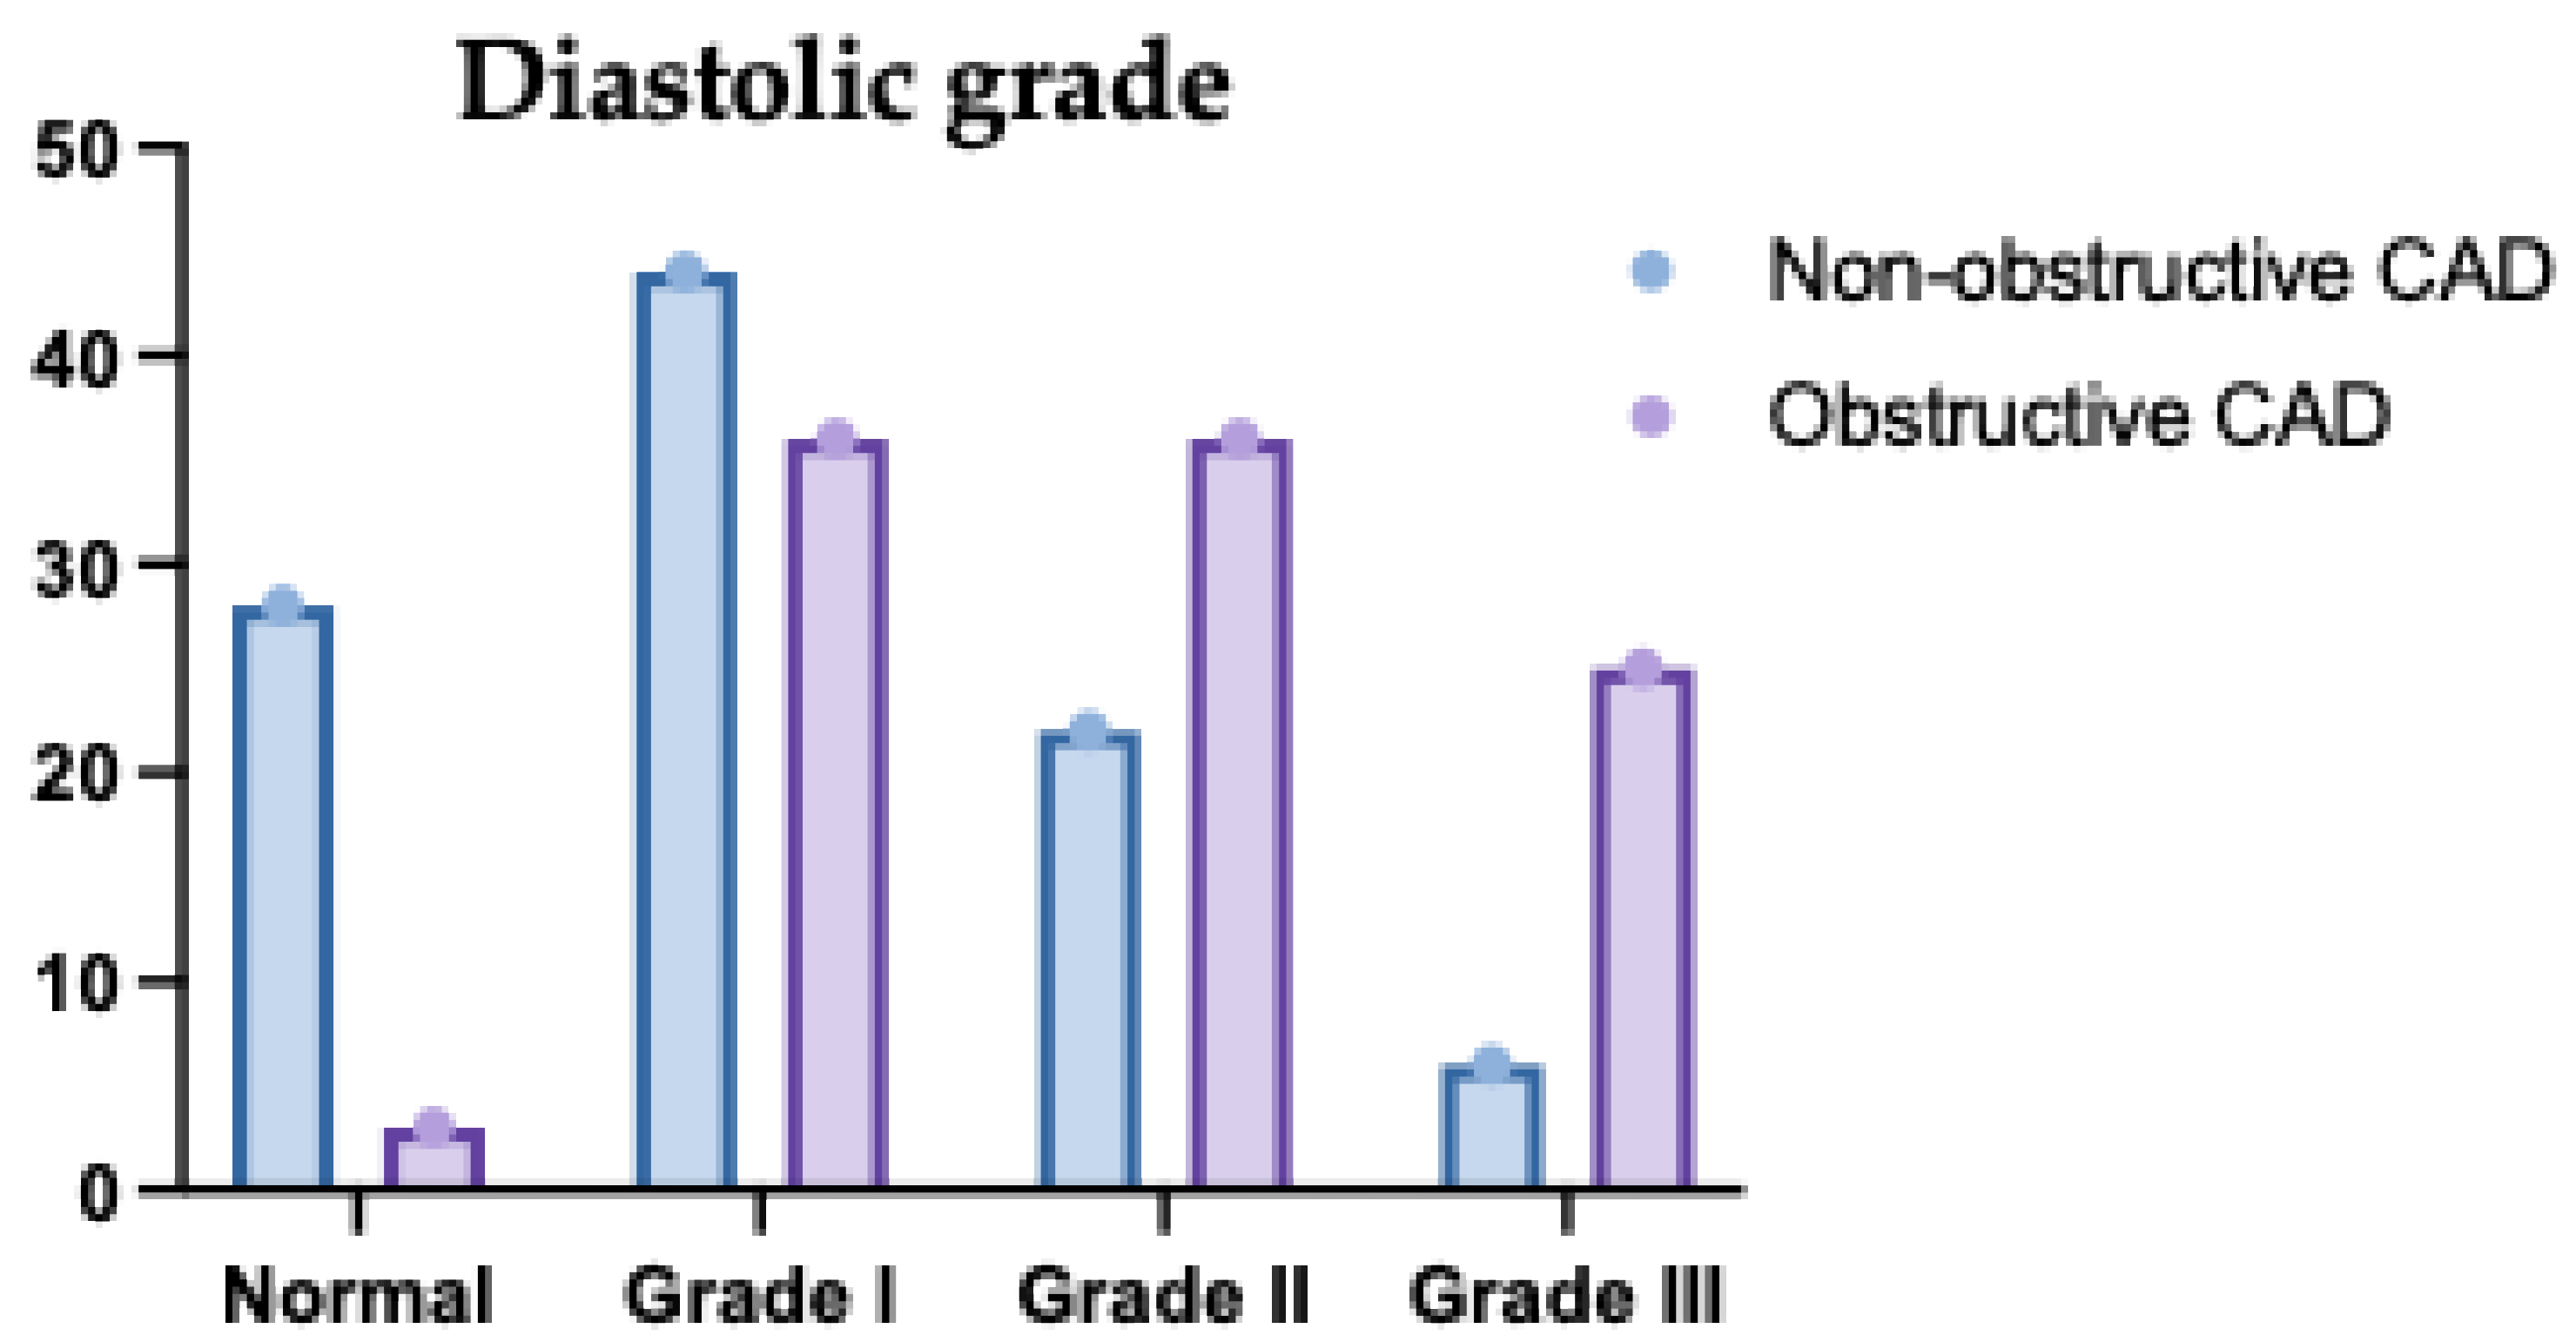
Figure 6.
Presence of Diastolic Dysfunction in the Studied Groups Regarding the Type of Coronary Artery Disease (CAD). This figure illustrates the presence or absence of diastolic dysfunction across the CAD spectrum. Patients with two- and multivessel disease had a markedly higher prevalence of diastolic dysfunction compared to those with single-vessel involvement. Conversely, normal diastolic function was more common in the single-vessel group. This supports the association between multivessel CAD and impaired diastolic function. The pattern emphasizes the need for early cardiac function evaluation in patients with extensive CAD.
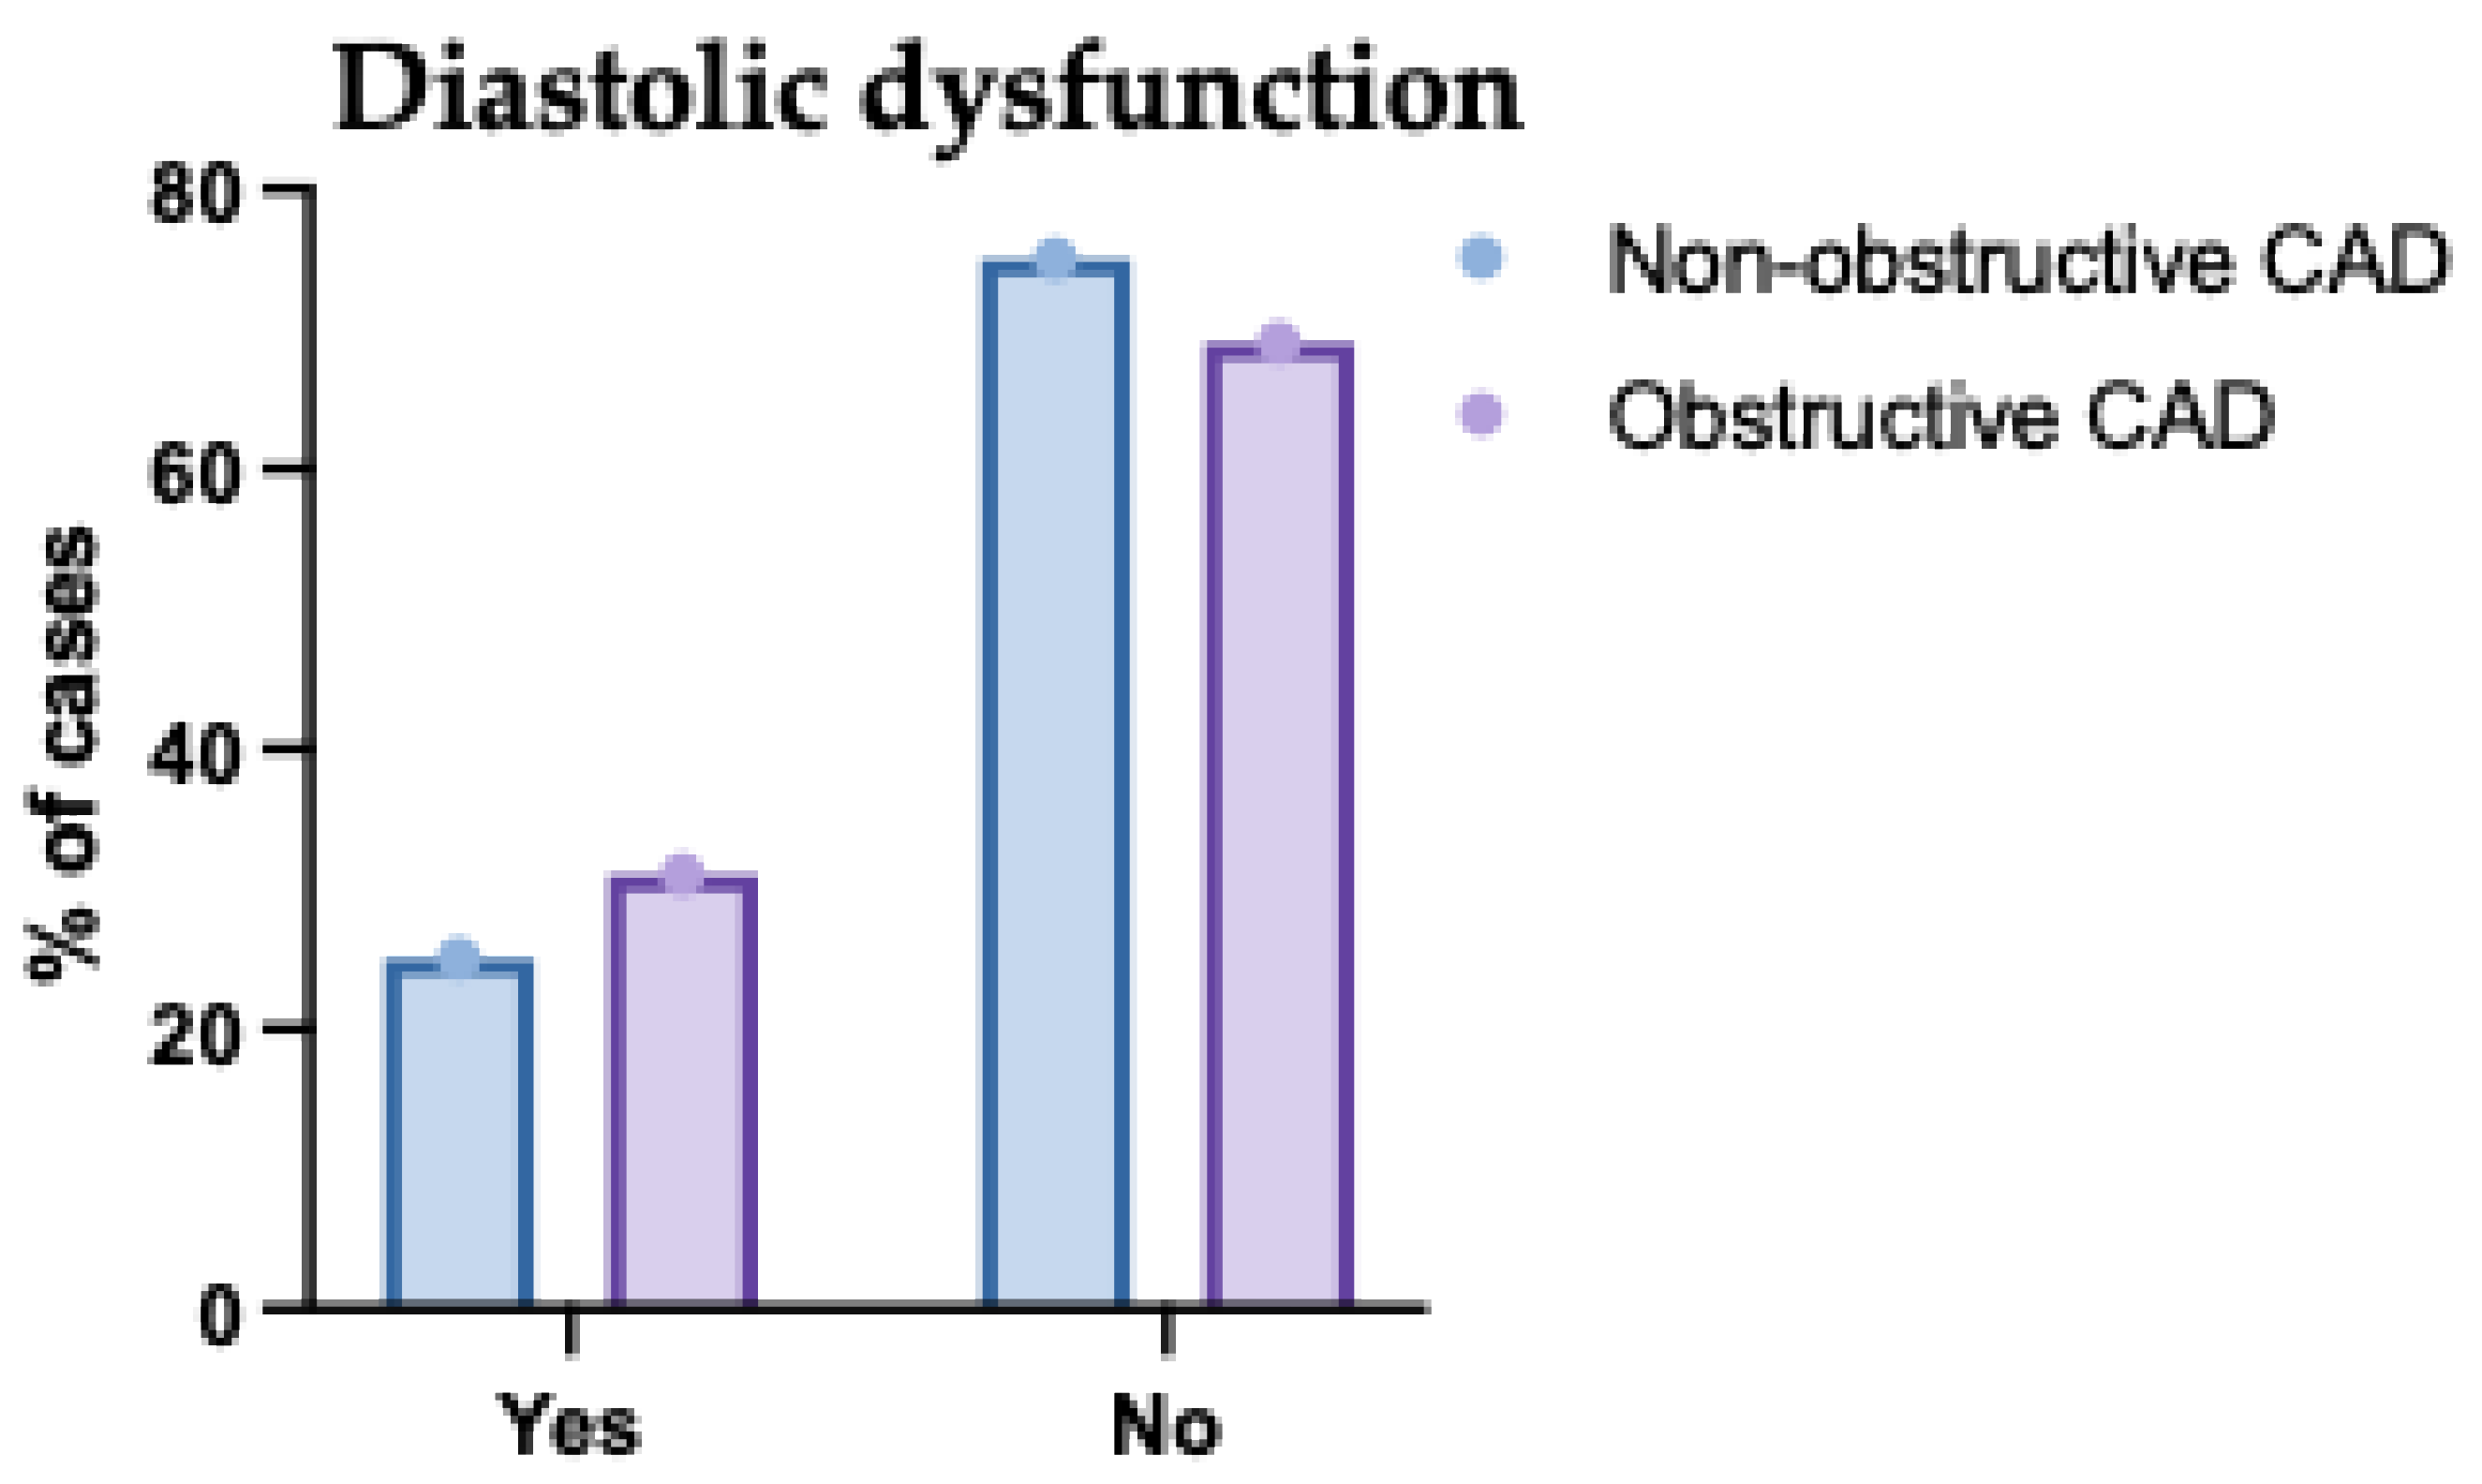
Figure 7.
CACS of the Studied Groups Regarding the Type of Coronary Artery Disease (CAD).
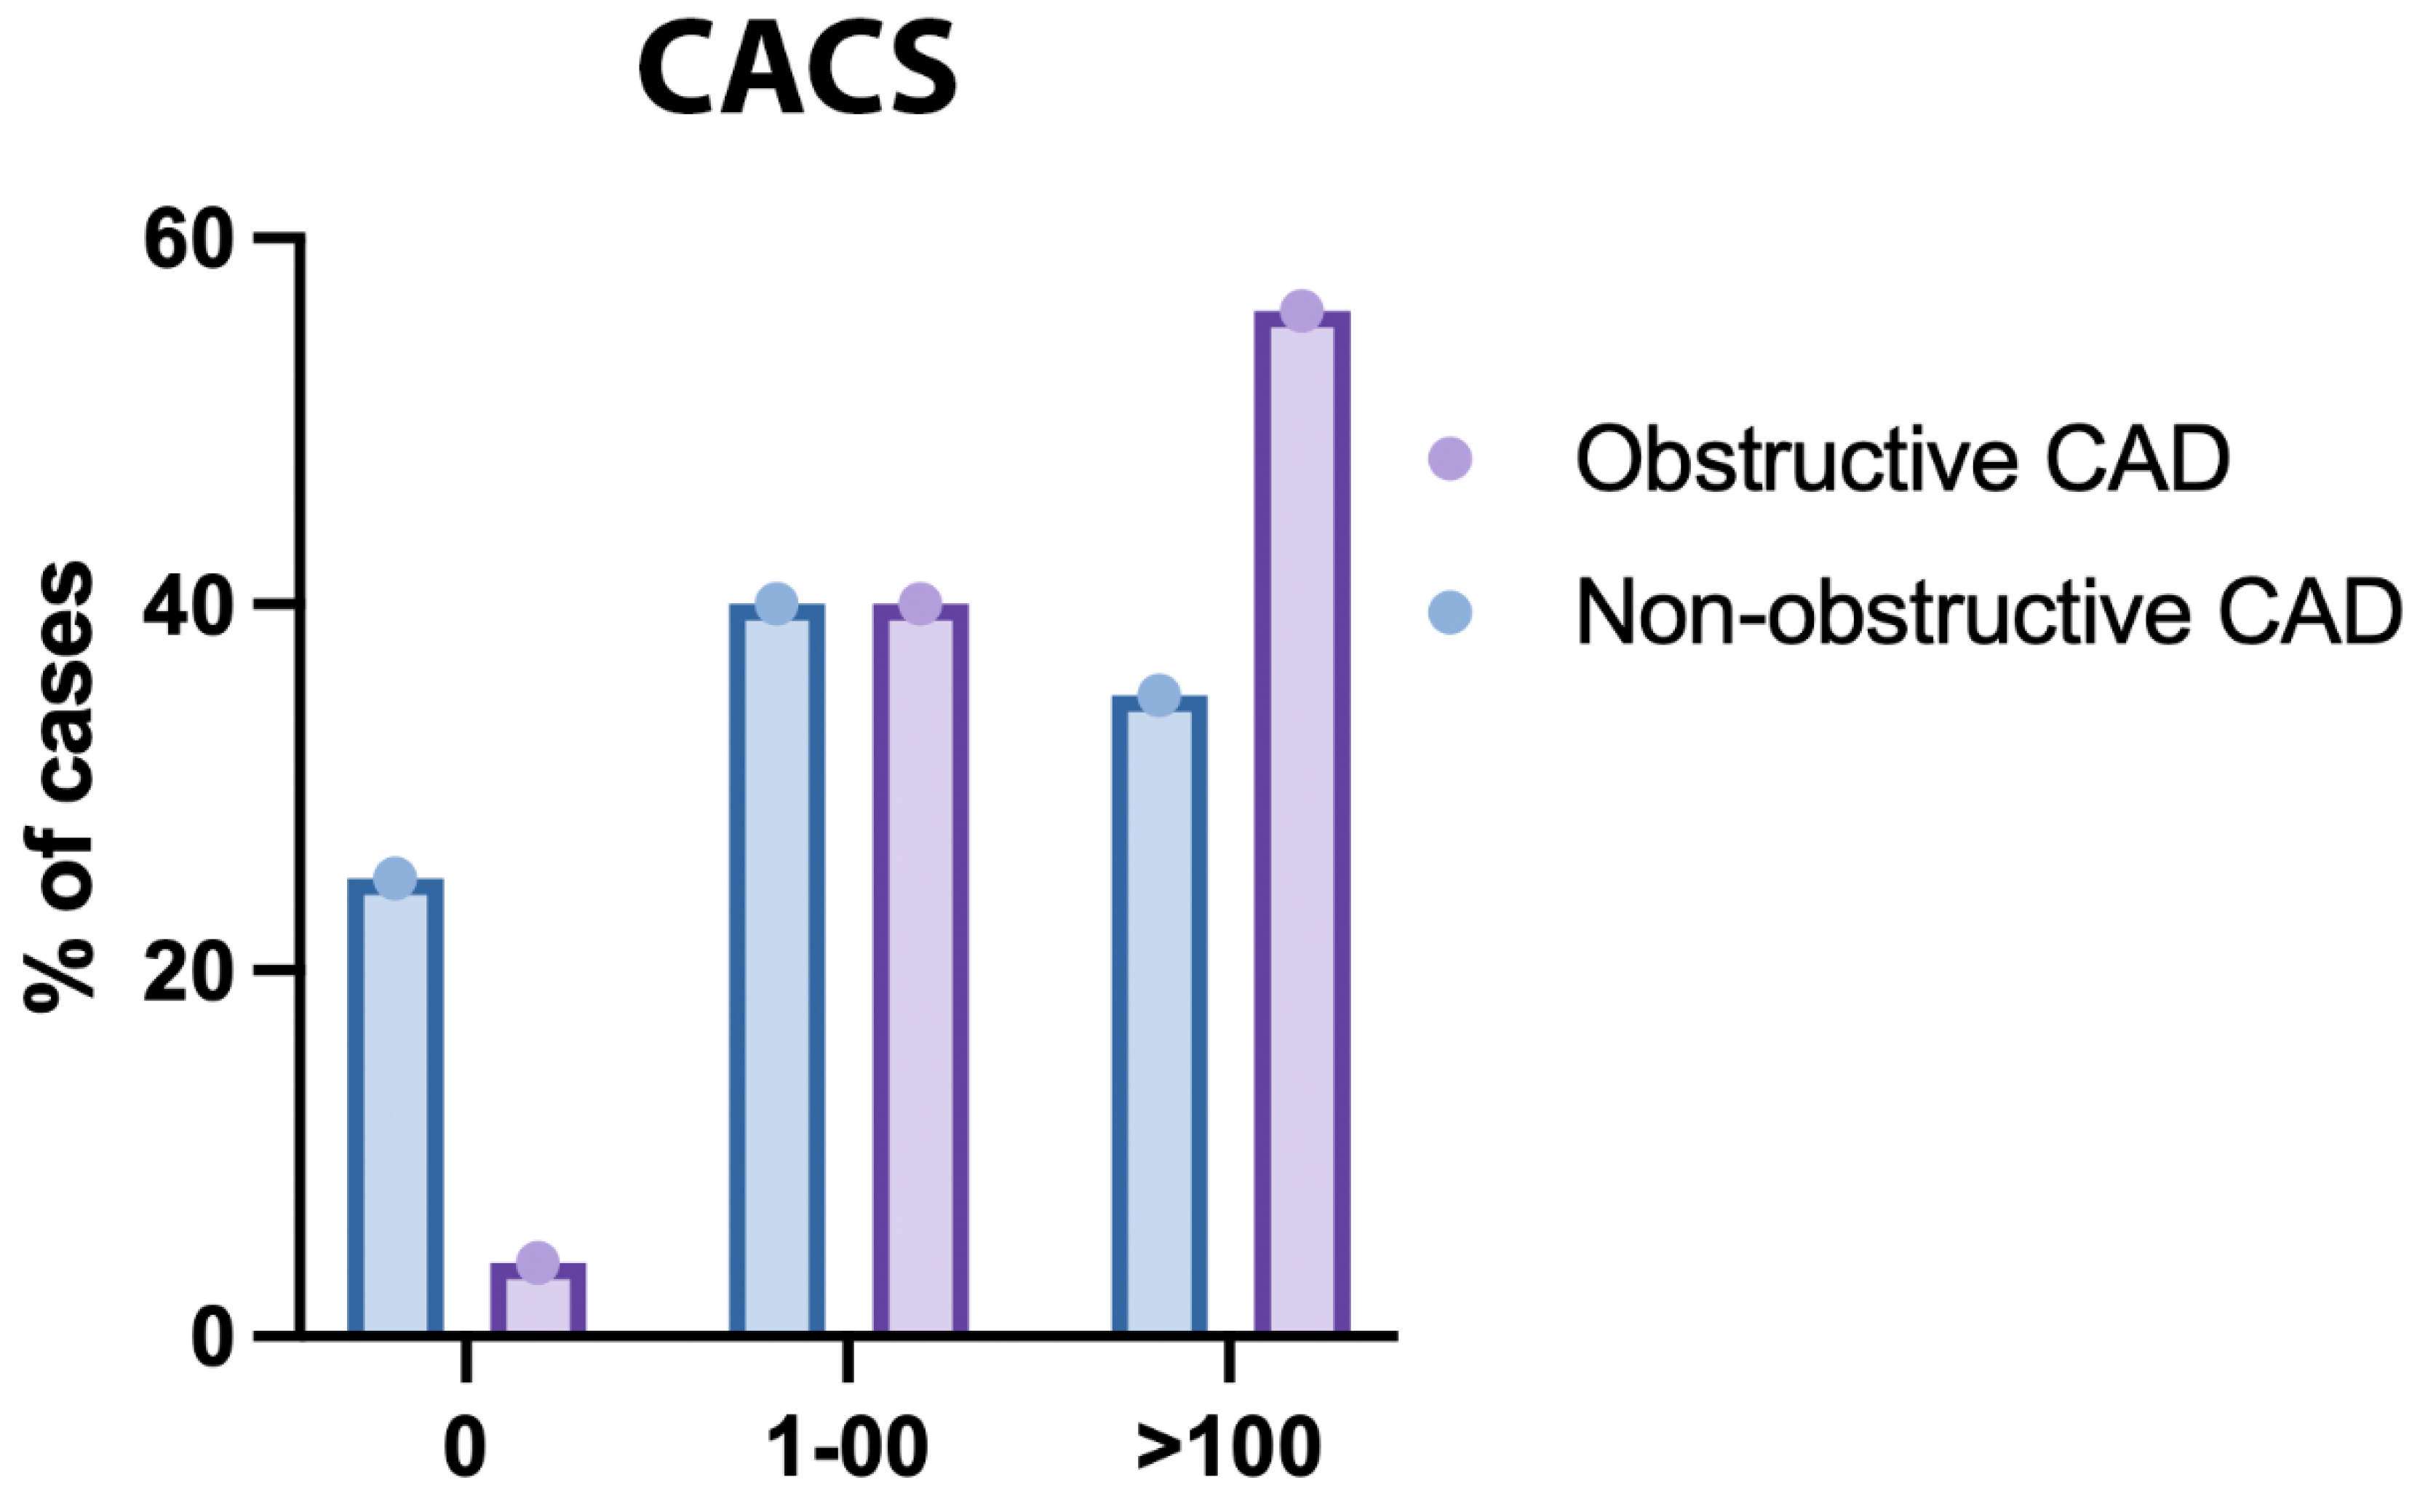
Figure 8.
Segment Involvement Score (SIS) of the Studied Groups Regarding the Type of Coronary Artery Disease (CAD). This bar chart displays the distribution of SIS categories across single-, two-, and multivessel disease groups. Patients with multivessel CAD exhibited significantly higher SIS values, indicating more extensive atherosclerotic involvement. In contrast, lower SIS scores were predominantly observed in the single-vessel disease group. The results support a positive correlation between the number of affected vessels and overall plaque burden. Error bars represent standard deviation.
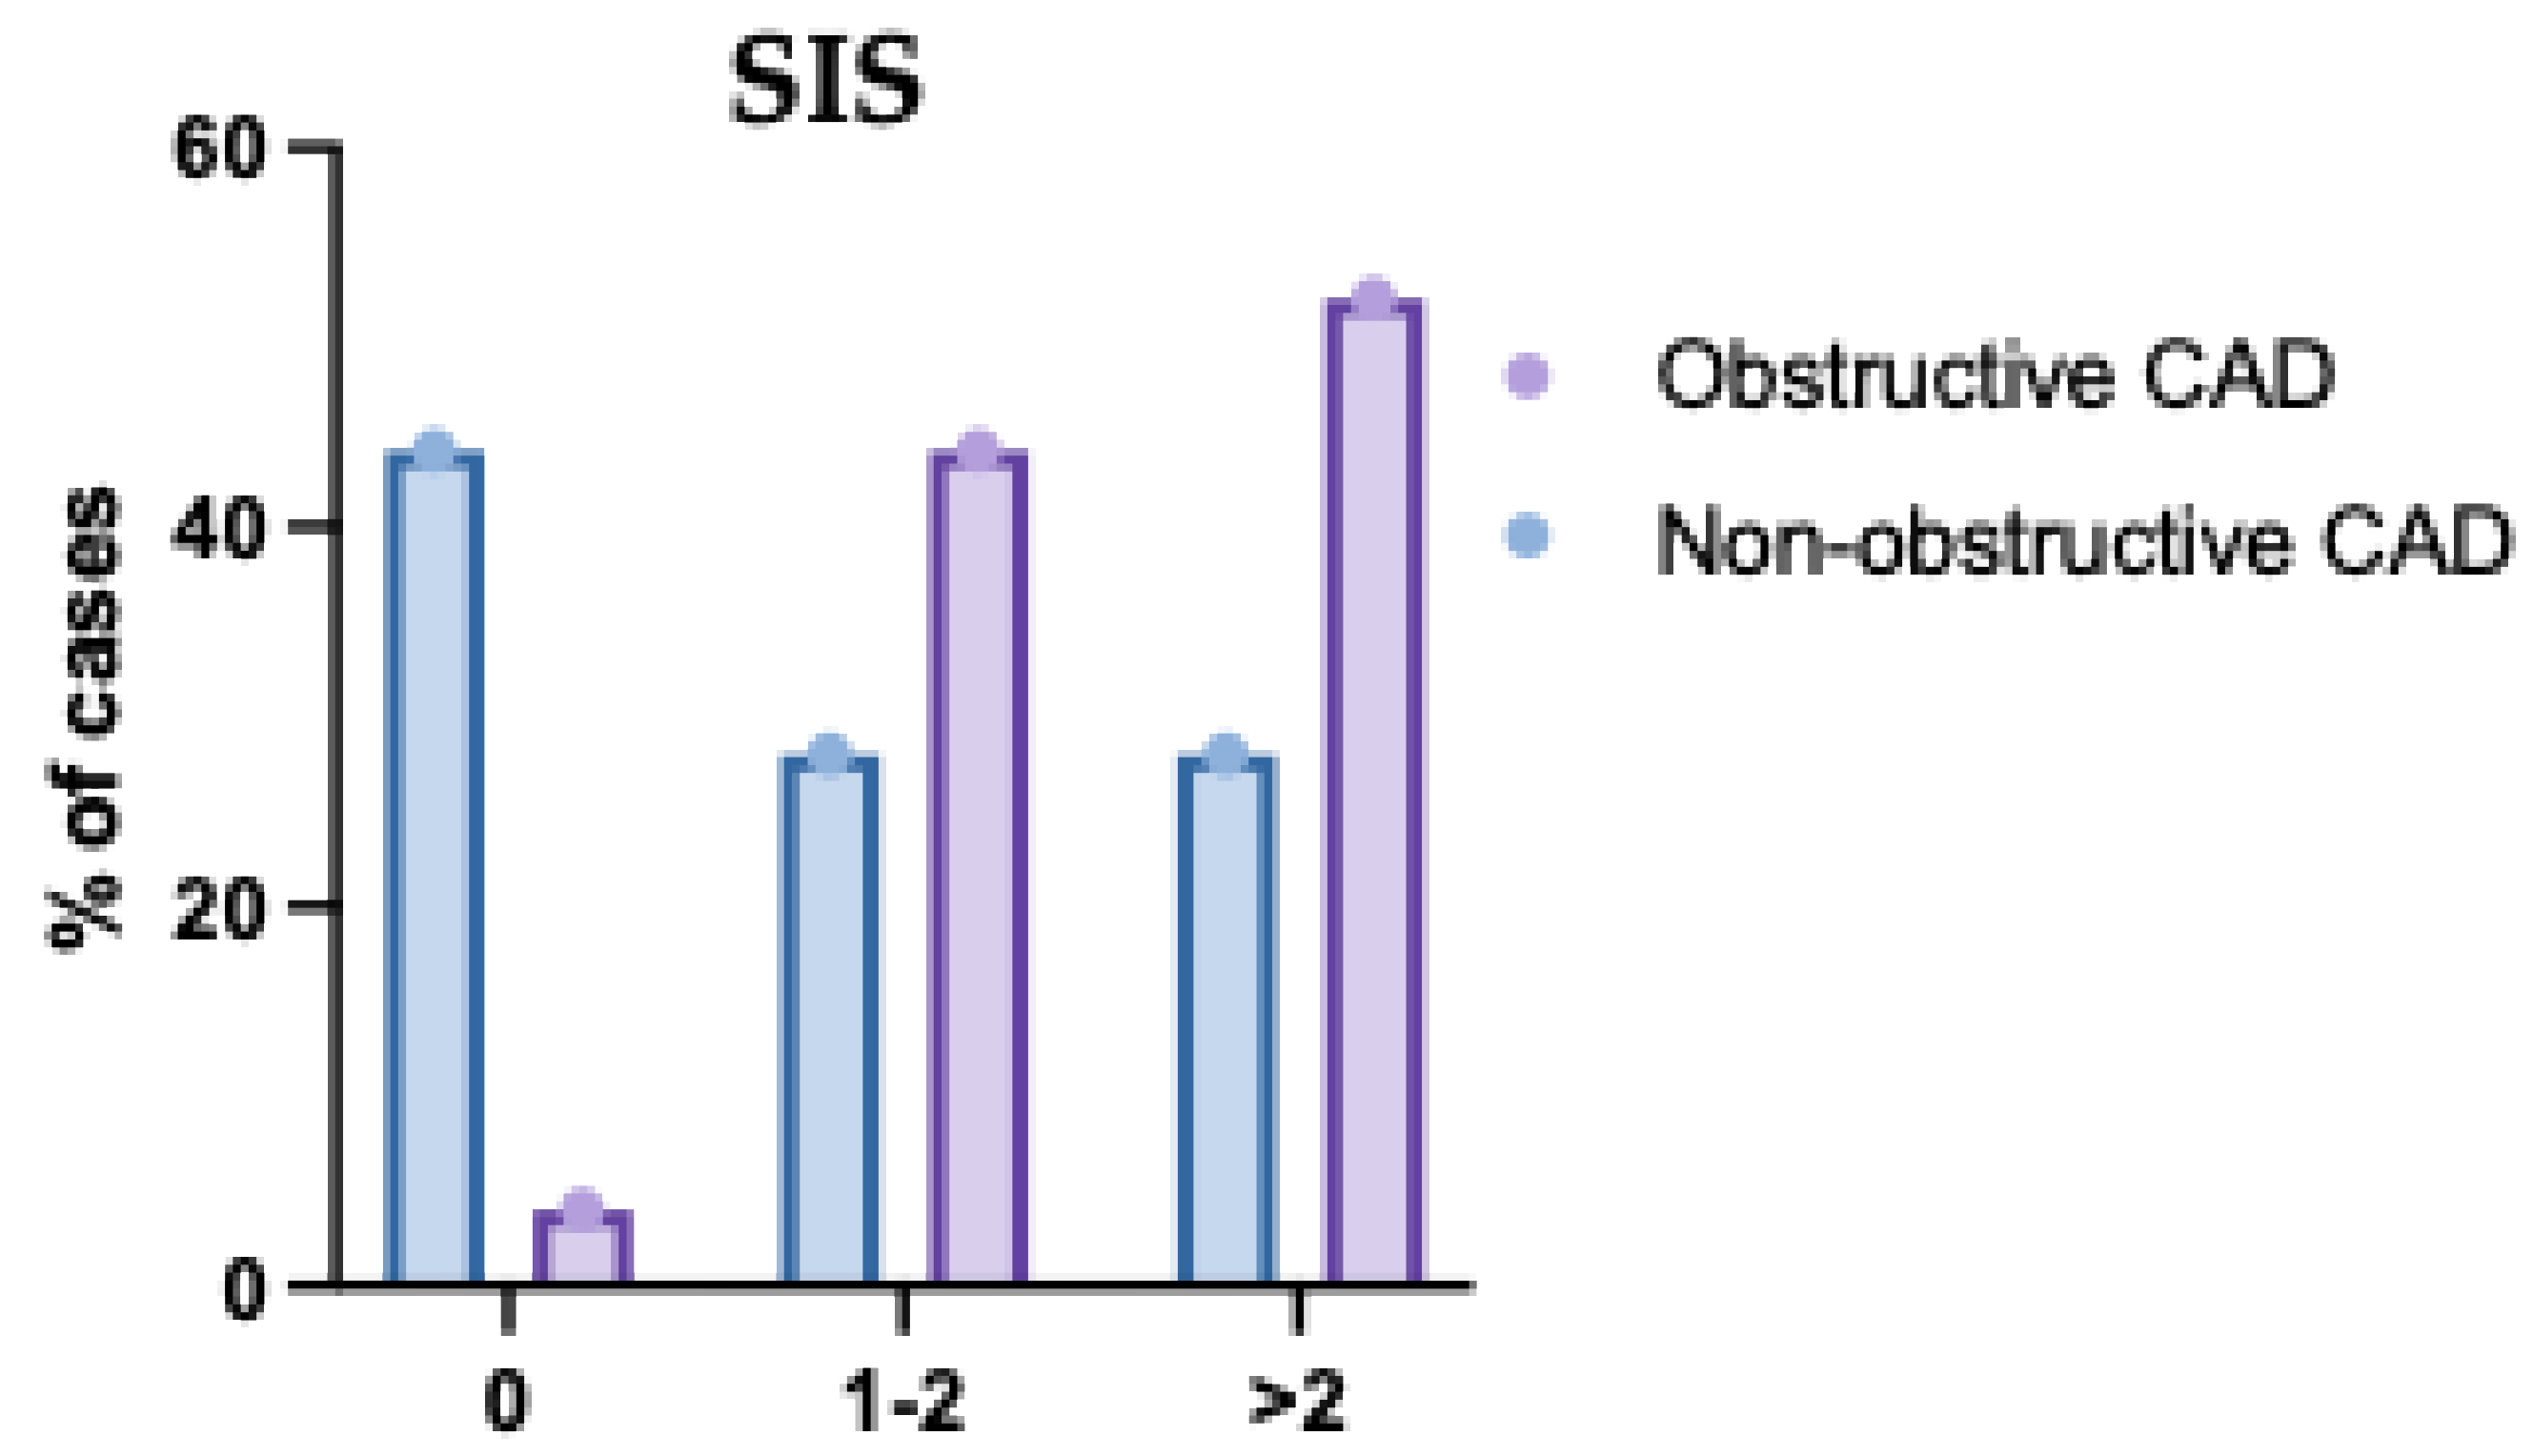
Figure 9.
Scatter Plot Demonstrating the Positive Correlation Between Segment Involvement Score (SIS) and Diastolic Function Grades. The scatter plot illustrates a positive linear relationship between SIS and diastolic dysfunction grades, indicating that higher diastolic impairment is associated with greater coronary segment involvement. This trend suggests a potential link between the extent of coronary artery disease and worsening left ventricular diastolic function.
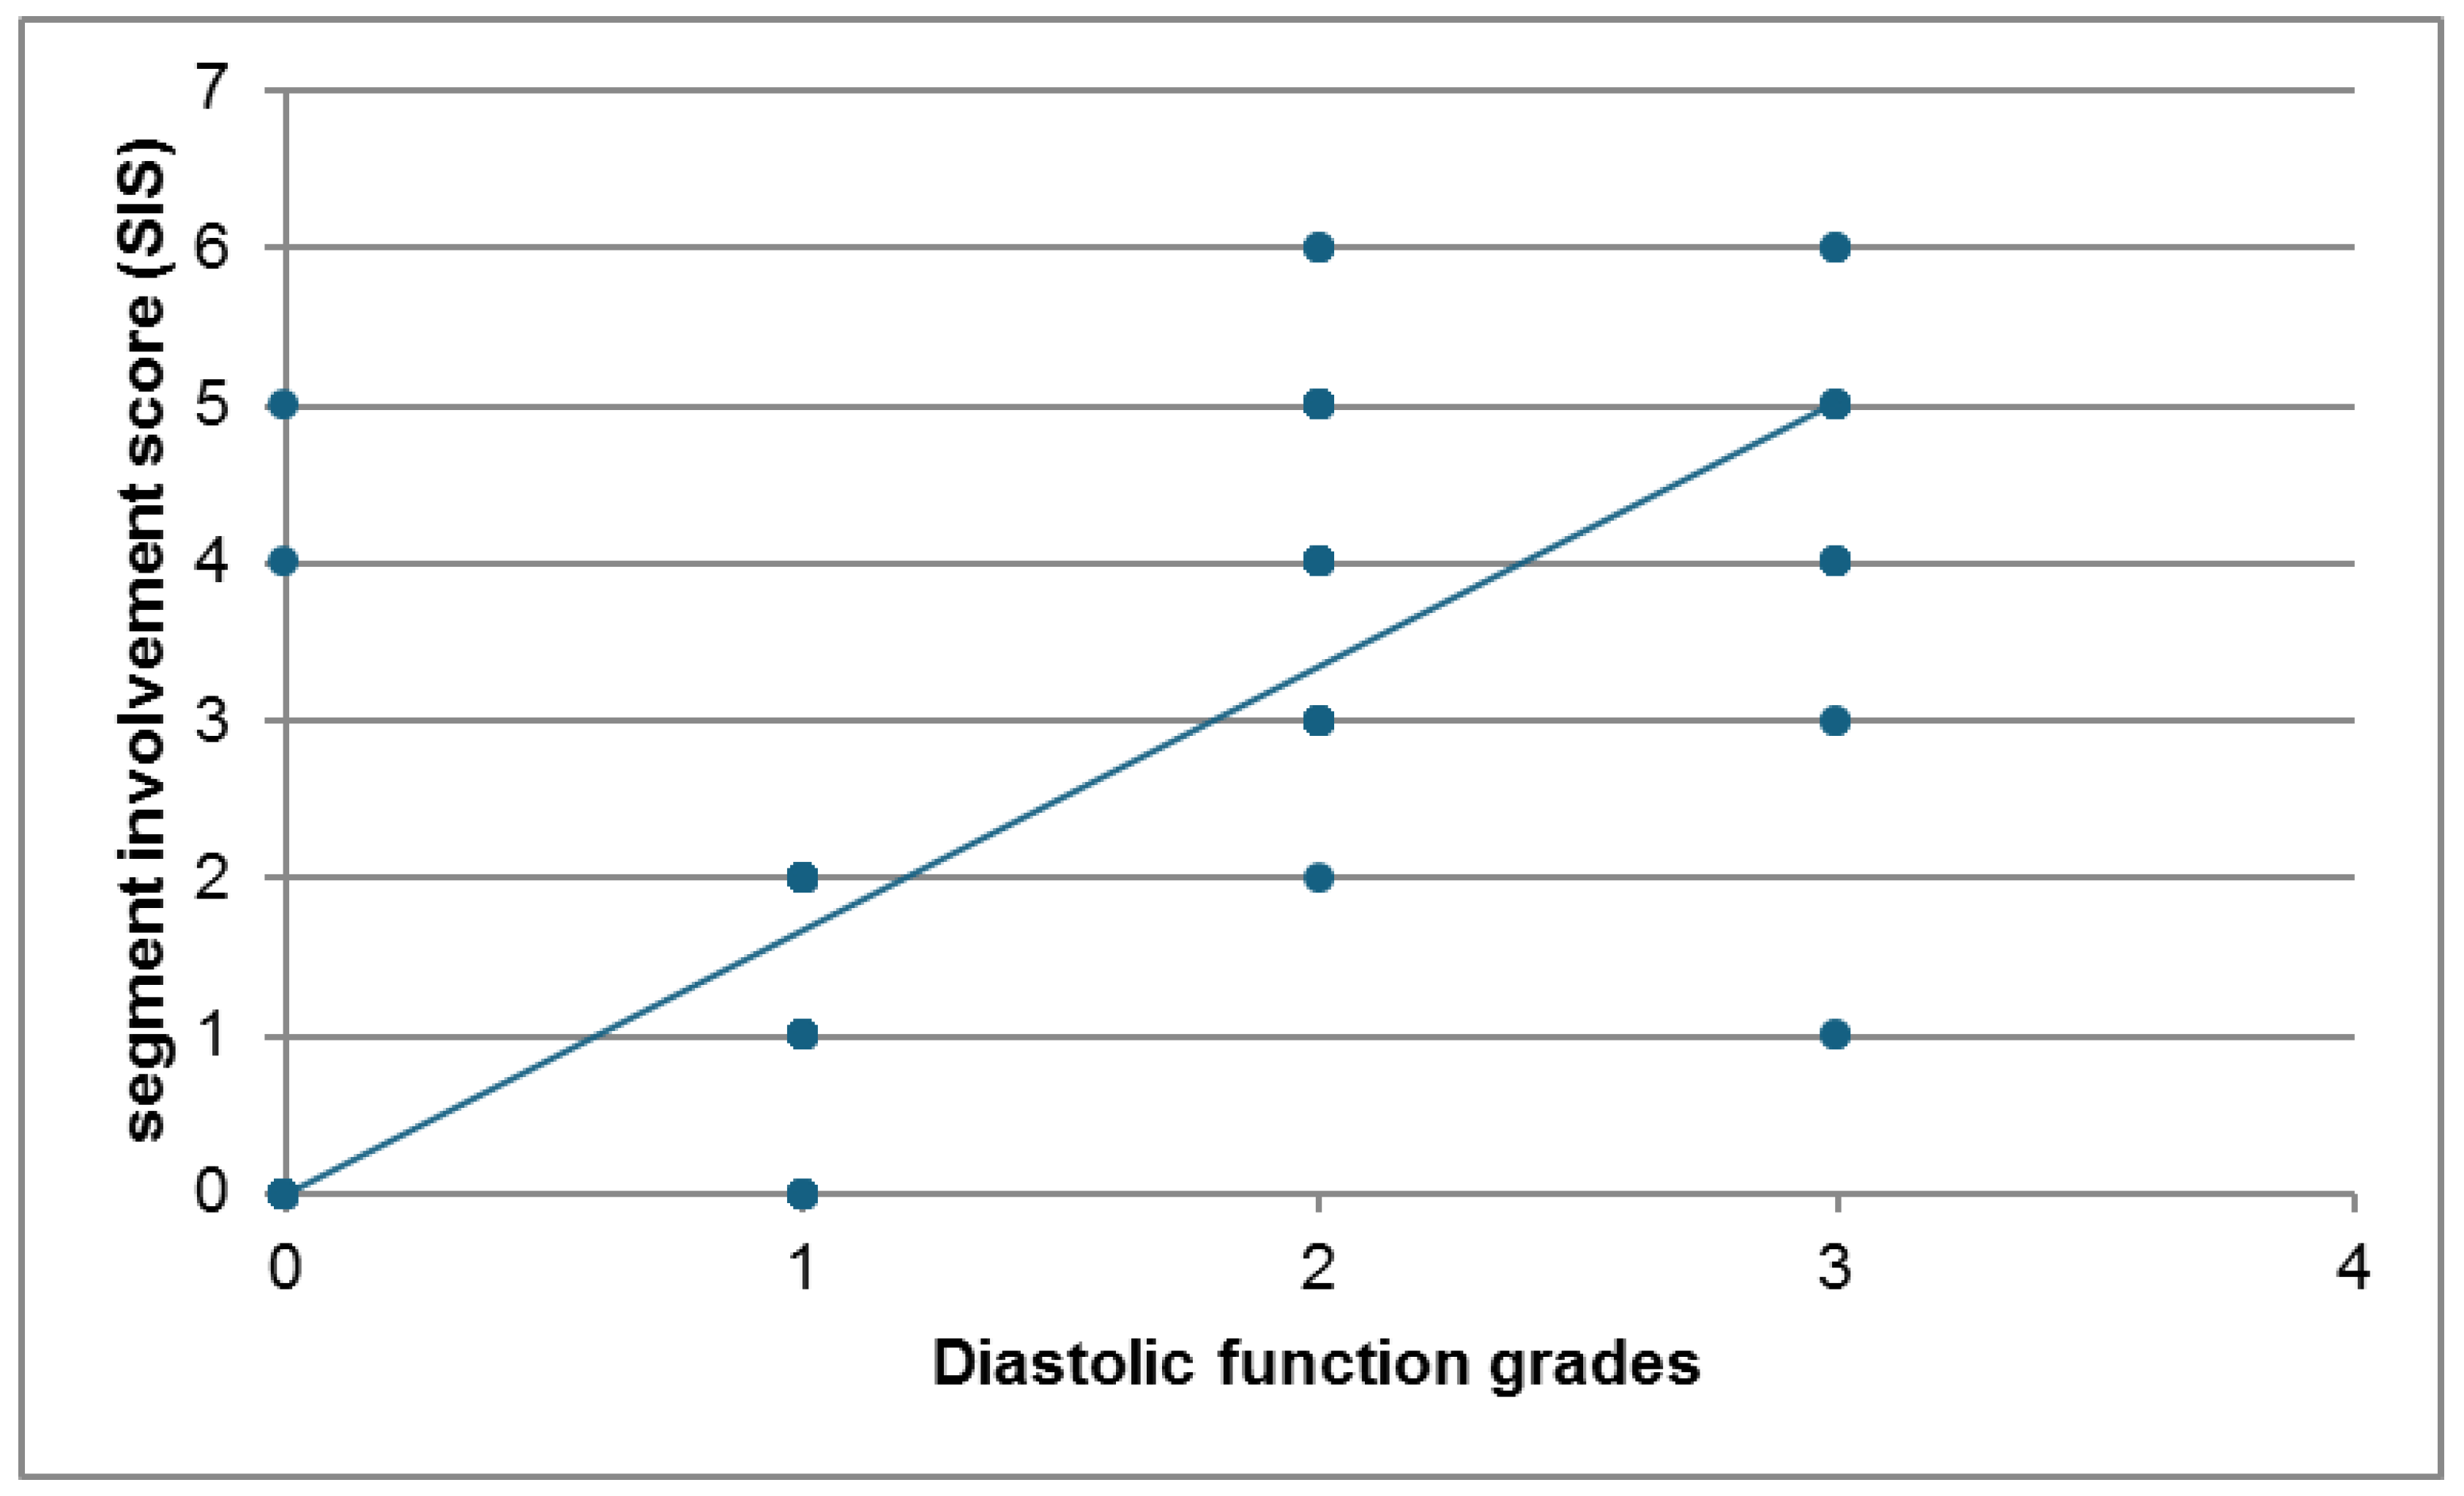

Table 1.
Baseline characteristics of the studied patients.
| Parameter | Total (n=200) | |
| Age (Years) | Mean ± SD | 54.27 ± 8.98 |
| Range | 40-73 | |
| Sex | Male | 104 (52%) |
| Female | 96 (48%) | |
| Weight (Kg) | Mean ± SD | 74.83 ± 12.45 |
| Range | 55-95 | |
| Height (m) | Mean ± SD | 1.68 ± 0.05 |
| Range | 1.58 - 1.75 | |
| BMI (Kg/m2) | Mean ± SD | 26.73 ± 4.73 |
| Range | 18.29 - 36.65 | |
Table 2.
Complete blood count, HbA1C, Liver Enzymes, Lipid Profile, and Kidney Functions of the studied patients.
Table 2.
Complete blood count, HbA1C, Liver Enzymes, Lipid Profile, and Kidney Functions of the studied patients.
| Total (n=200) | ||
|---|---|---|
| Hb (g/dl) | Mean ± SD | 12.33 ± 1.14 |
| Range | 10.2-14.2 | |
| WBCs (*109/L) | Mean ± SD | 8.14 ± 1.99 |
| Range | 4.5-11.5 | |
| Platelets (*109/L) | Mean ± SD | 281.25 ± 43.58 |
| Range | 201-349 | |
| HbA1c (%) | Mean ± SD | 5.23±1.51 |
| Range | 3.5-8.5 | |
| ALT (U/L) | Mean ± SD | 31.98 ± 8.35 |
| Range | 18-45 | |
| AST (U/L) | Mean ± SD | 33.05 ± 7.45 |
| Range | 20-45 | |
| Cholesterol (mg/dL) | Mean ± SD | 228.78 ± 58.1 |
| Range | 130-349 | |
| TG (mg/dL) | Mean ± SD | 196.74 ± 35.36 |
| Range | 141-289 | |
| LDL (mg/dL) | Mean ± SD | 111.1 ±24.45 |
| Range | 70-170 | |
| HDL (mg/dL) | Mean ± SD | 40.17 ± 5.63 |
| Range | 30-50 | |
| Creatinine (mg/dL) | Mean ± SD | 1.03 ± 0.14 |
| Range | 0.8-1.2 | |
| Urea (mg/dL) | Mean ± SD | 44.38 ± 14.92 |
| Range | 20-70 | |
Table 3.
Echocardiography of the studied patients.
| Total (n=200) | ||
|---|---|---|
| EF (%) | Mean ± SD | 59.28 ± 5.03 |
| Range | 49-69 | |
| LAVI (mL/m2) | Mean ± SD | 31.85 ± 3.74 |
| Range | 26-43 | |
| Septal e` (m/s) | Mean ± SD | 0.83 ± 0.17 |
| Range | 0.5-1.1 | |
| Lateral e` (m/s) | Mean ± SD | 0.12 ± 0.05 |
| Range | 0.03-0.25 | |
| E/e` | Mean ± SD | 8.81 ± 1.85 |
| Range | 6-13.6 | |
| E/A | Mean ± SD | 1.39 ± 0.44 |
| Range | 0.71-2.55 | |
| TR velocity (m/s) | Mean ± SD | 1.85 ± 0.61 |
| Range | 0.8-3.1 | |
| DT (ms) | Mean ± SD | 195.83 ± 38.53 |
| Range | 120-268 | |
| IVRT (ms) | Mean ± SD | 107.91 ± 19.71 |
| Range | 75-144 | |
| Diastolic function grade | Normal | 39 (19.5%) |
| Grade I | 82 (41%) | |
| Grade II | 58 (29%) | |
| Grade III | 21 (10.5%) | |
| Diastolic dysfunction | 82 (41%) | |
| LVH | 37 (18.5%) | |
Table 4.
Baseline characteristics of the studied groups regarding the type of CAD.
| Non-obstructive CAD (n=127) | Obstructive CAD (n=73) | P value | ||
|---|---|---|---|---|
| Age (years) | Mean ± SD | 52.18 ± 8.34 | 57.9 ± 8.94 | <0.001* |
| Range | 40-65 | 45-73 | ||
| Sex | Male | 53 (41.73%) | 51 (69.86%) | <0.001* |
| Female | 74 (58.27%) | 22 (30.14%) | ||
| Weight (kg) | Mean ± SD | 73.92 ± 12.53 | 76.41 ± 12.22 | 0.173 |
| Range | 55-95 | 55-94 | ||
| Height (m) | Mean ± SD | 1.67 ± 0.05 | 1.68 ± 0.05 | 0.201 |
| Range | 1.59-1.75 | 1.58-1.75 | ||
| BMI (kg/m2) | Mean ± SD | 26.52 ± 4.81 | 27.09 ± 4.6 | 0.412 |
| Range | 18.29 - 36.65 | 18.38 - 35.88 | ||
Table 5.
Risk factors of the studied groups regarding the type of CAD.
| Non-obstructive CAD (n=127) | Obstructive CAD (n=73) | P value | |
|---|---|---|---|
| Smoking | 29 (22.83%) | 23 (31.51%) | 0.178 |
| Family history | 18 (14.17%) | 25 (34.25%) | 0.001 |
| Hypertension | 38 (29.92%) | 42 (57.53%) | 0.001 |
| DM | 24 (18.9%) | 33 (45.21%) | 0.001 |
| Dyslipidaemia | 40 (31.5%) | 26 (35.62%) | 0.551 |
Table 6.
Complete blood count, HbA1C, Liver Enzymes, Lipid Profile, Kidney Functions of the studied patients regarding the type of CAD.
Table 6.
Complete blood count, HbA1C, Liver Enzymes, Lipid Profile, Kidney Functions of the studied patients regarding the type of CAD.
| Non-obstructive CAD (n=127) | Obstructive CAD (n=73) | P value | ||
| Hb (g/dl) | Mean ± SD | 12.35 ± 1.11 | 12.31 ± 1.19 | 0.832 |
| Range | 10.2-14.2 | 10.2-14.2 | ||
| WBCs (*109/L) | Mean ± SD | 8.23 ± 1.88 | 7.98 ± 2.17 | 0.392 |
| Range | 4.5-11.5 | 4.5-11.5 | ||
| Platelets (*109/L) | Mean ± SD | 280.62 ± 44.66 | 282.34 ± 41.92 | 0.788 |
| Range | 204-348 | 201-349 | ||
| HbA1C (%) | Mean ± SD | 4.98±1.35 | 5.67±1.67 | 0.002 |
| Range | 3.5-8.5 | 3.5-8.5 | ||
| ALT (U/L) | Mean ± SD | 31.65 ± 8.19 | 32.53 ± 8.66 | 0.474 |
| Range | 18-45 | 18-45 | ||
| AST (U/L) | Mean ± SD | 32.77 ± 7.56 | 33.52 ± 7.3 | 0.495 |
| Range | 20-45 | 21-45 | ||
| Cholesterol (mg/dL) | Mean ± SD | 198.3 ± 40.32 | 281.81 ± 44.65 | <0.001 |
| Range | 130-259 | 203-349 | ||
| TG (mg/dL) | Mean ± SD | 187.77 ± 25.59 | 212.33 ± 43.83 | <0.001 |
| Range | 141-229 | 141-289 | ||
| LDL (mg/dL) | Mean ± SD | 100.7 ± 16.93 | 129.18 ± 25.06 | <0.001 |
| Range | 70-130 | 82-170 | ||
| HDL (mg/dL) | Mean ± SD | 43.02 ± 4.72 | 35.22 ± 3.05 | <0.001 |
| Range | 35-50 | 30-40 | ||
| Creatinine (mg/dL) | Mean ± SD | 1.02 ± 0.14 | 1.05 ± 0.13 | 0.167 |
| Range | 0.8-1.2 | 0.8-1.2 | ||
| Urea (mg/dL) | Mean ± SD | 44.06 ± 14.18 | 44.95 ± 16.21 | 0.685 |
| Range | 20-70 | 20-70 | ||
Table 7.
Echocardiography of the studied groups regarding the type of CAD.
| Non-obstructive CAD (n=127) | Obstructive CAD (n=73) | P value | ||
| EF (%) | Mean ± SD | 60.32 ± 4.73 | 57.45 ± 5.04 | <0.001* |
| Range | 53-69 | 49-65 | ||
| LAVI (mL/m2) | Mean ± SD | 30.64 ± 2.46 | 33.96 ± 4.57 | <0.001* |
| Range | 26-34 | 27-43 | ||
| Septal e` (m/s) | Mean ± SD | 0.91 ± 0.14 | 0.7 ± 0.14 | <0.001* |
| Range | 0.7-1.1 | 0.5-0.9 | ||
| Lateral e` (m/s) | Mean ± SD | 0.13 ± 0.07 | 0.1 ± 0.01 | <0.001* |
| Range | 0.03-0.25 | 0.08-0.12 | ||
| E/e` | Mean ± SD | 8.07 ± 1.18 | 10.1 ± 2.08 | <0.001* |
| Range | 6-10.2 | 6.5-13.6 | ||
| E/A | Mean ± SD | 1.25 ± 0.33 | 1.64 ± 0.5 | <0.001* |
| Range | 0.71-1.81 | 0.74-2.55 | ||
| TR velocity (m/s) | Mean ± SD | 1.74 ± 0.55 | 2.05 ± 0.65 | <0.001* |
| Range | 0.8-2.6 | 1-3.1 | ||
| DT (ms) | Mean ± SD | 213.67 ± 30.89 | 164.79 ± 29.92 | <0.001* |
| Range | 163-268 | 120-215 | ||
| IVRT (ms) | Mean ± SD | 118.87 ± 15.69 | 88.84 ± 7.92 | <0.001* |
| Range | 90-144 | 75-100 | ||
| Diastolic function grade | Normal | 37 (29.13%) | 2 (2.74%) | <0.001* |
| Grade I | 54 (42.52%) | 28 (38.36%) | ||
| Grade II | 30 (23.62%) | 28 (38.36%) | ||
| Grade III | 6 (4.72%) | 15 (20.55%) | ||
| Diastolic dysfunction | 30 (23.62%) | 52 (71.23%) | <0.001* | |
| LVH | 19 (14.96%) | 18 (24.66%) | 0.089 | |
Table 8.
CACS of the studied groups regarding the type of CAD.
| Non-obstructive CAD (n=127) | Obstructive CAD (n=73) | P value | ||
| CACS | Mean ± SD | 103.56 ± 127.21 | 213.99 ± 146.54 | <0.001* |
| Range | 0-420 | 0-425 | ||
| Median (IQR) | 51 (0 -204.5) | 239 (58 – 332) | ||
| 0 | 37 (29.13%) | 2 (2.74%) | <0.001* | |
| 1-100 | 56 (44.09%) | 28 (38.36%) | ||
| >100 | 34 (26.77%) | 43 (58.9%) | ||
Table 9.
Segment involvement score (SIS) of the studied groups regarding the type of CAD.
| Non-obstructive CAD (n=127) |
Obstructive CAD (n=73) |
P value | ||
| SIS | Mean ± SD | 1.62±1.76 | 3.19±1.63 | <0.001* |
| Range | 0-5 | 1-6 | ||
| Median (IQR) | 1 (0 -3) | 3 (2 -5) | ||
| 0 | 54 (42.52%) | 0 (0%) | <0.001* | |
| 1-2 | 37 (29.13%) | 31 (42.47%) | ||
| >2 | 36 (28.35%) | 42 (57.53%) | ||
Table 10.
Relation between diastolic dysfunction and baseline characteristics.
| Diastolic dysfunction | P value | |||
| Yes (n= 82) | No (n = 118) | |||
| Age (years) | 56.06 ± 9.13 | 53.03 ± 8.7 | 0.020* | |
| Sex | Male | 47 (57.3%) | 57 (48.3%) | 0.210 |
| Female | 35 (42.7%) | 61 (51.7%) | ||
| Weight (kg) | 76.18 ± 13.19 | 73.89 ± 11.87 | 0.210 | |
| Height (m) | 1.68 ± 0.05 | 1.67 ± 0.05 | 0.297 | |
| BMI (kg/m2) | 27.07 ± 4.96 | 26.49 ± 4.58 | 0.405 | |
Table 11.
Relation between diastolic dysfunction and risk factors.
| Diastolic dysfunction | P value | ||
| Yes (n= 82) | No (n=118) | ||
| Smoking | 25 (30.5%) | 27 (22.9%) | 0.228 |
| Family history | 25 (30.5%) | 18 (15.3%) | 0.010* |
| Hypertension | 41 (50%) | 39 (33.1%) | 0.016* |
| DM | 31 (37.8%) | 26 (22%) | 0.015* |
| Dyslipidemia | 29 (35.4%) | 37 (31.4%) | 0.553 |
Table 12.
Relation between diastolic dysfunction and laboratory investigations.
| Diastolic dysfunction | P value | ||
| Yes (n= 82) | No (n = 118) | ||
| Hb (g/dl) | 12.26±1.13 | 12.39±1.14 | 0.020* |
| WBCs (*109/L) | 7.8 ± 2.06 | 8.37 ± 1.91 | 0.050* |
| Platelets (*109/L) | 281.33 ± 40.68 | 281.19 ± 45.66 | 0.983 |
| HbA1c (%) | 5.47 ± 1.59 | 5.07 ± 1.43 | 0.064 |
| ALT (U/L) | 32.43 ± 8.94 | 31.66 ± 7.94 | 0.525 |
| AST (U/L) | 32.9 ± 7.39 | 33.14 ± 7.53 | 0.822 |
| Cholesterol (mg/dL) | 254.46 ± 60.97 | 210.93 ± 48.82 | <0.001* |
| TG (mg/dL) | 202.24 ± 38.53 | 192.91 ± 32.59 | 0.075 |
| LDL (mg/dL) | 118.06 ± 25.5 | 106.25 ± 22.55 | <0.001* |
| HDL (mg/dL) | 37.95 ± 5.53 | 41.71 ± 5.18 | <0.001* |
| Creatinine (mg/dL) | 1.05 ± 0.14 | 1.02 ± 0.13 | 0.166 |
| Urea (mg/dL) | 45.95 ± 15.24 | 43.29 ± 14.65 | 0.219 |
Table 13.
Relation between diastolic dysfunction and echocardiographic findings.
| Diastolic dysfunction | P value | |||
| Yes (n= 82) | No (n = 118) | |||
| EF (%) | 58.37 ± 4.83 | 59.91 ± 5.09 | 0.031* | |
| LAVI (mL/m2) | 32.71 ± 4.48 | 31.25 ± 2.99 | 0.007* | |
| Septal e` (m/s) | 0.78 ± 0.18 | 0.87 ± 0.16 | <0.001* | |
| Lateral e` (m/s) | 0.11 ± 0.04 | 0.13 ± 0.06 | 0.010* | |
| E/e` | 9.37 ± 2.14 | 8.42 ± 1.5 | <0.001* | |
| E/A | 1.48 ± 0.49 | 1.33 ± 0.4 | 0.016* | |
| TR velocity (m/s) | 1.92 ± 0.64 | 1.8 ± 0.58 | 0.166 | |
| DT (ms) | 182.72 ± 40.74 | 204.94 ± 34.23 | <0.001* | |
| IVRT (ms) | 100.66 ± 18.69 | 112.95 ±1 8.89 | <0.001* | |
| Diastolic function grade | Normal | 0 (0%) | 39 (33.1%) | <0.001* |
| Grade I | 23 (28%) | 59 (50%) | ||
| Grade II | 41 (50%) | 17 (14.4%) | ||
| Grade III | 18 (22%) | 3 (2.5%) | ||
| LVH | 17 (20.7%) | 20 (16.9%) | 0.498 | |
Table 14.
Relation between CACS and baseline characteristics.
| CACS | P value | ||||
| 0 (n=39) | 1-100 (n=84) | >100 (n=77) | |||
| Age (years) | 51.6±8.22 | 54.24±9.18 | 55.71±8.93 | 0.063 | |
| Sex | Male | 19 (48.72%) | 41 (48.81%) | 44 (57.14%) | 0.515 |
| Female | 20 (51.28%) | 43 (51.19%) | 33 (42.86%) | ||
| Weight (kg) | 76.23±11.53 | 73.61±12.75 | 75.45±12.6 | 0.475 | |
| Height (m) | 1.68±0.04 | 1.67±0.05 | 1.68±0.05 | 0.409 | |
| BMI (kg/m2) | 27.03±4.4 | 26.44±4.71 | 26.9±4.96 | 0.750 | |
Table 15.
Relation between CACS and risk factors.
| CACS | P value | |||
| 0 (n=39) | 1-100 (n=84) | >100 (n=77) | ||
| Smoking | 10 (25.64%) | 16 (19.05%) | 26 (33.77%) | 0.104 |
| Family history | 9 (23.08%) | 11 (13.1%) | 23 (29.87%) | 0.034* |
| Hypertension | 13 (33.33%) | 34 (40.48%) | 33 (42.86%) | 0.608 |
| DM | 10 (25.64%) | 23 (27.38%) | 24 (31.17%) | 0.787 |
| Dyslipidemia | 11 (28.21%) | 29 (34.52%) | 26 (33.77%) | 0.773 |
Table 16.
Relation between CACS and laboratory investigations.
| CACS | P value | |||
| 0 (n=39) | 1-100 (n=84) | >100 (n=77) | ||
| Hb (g/dl) | 12.47±1.3 | 12.17±1.08 | 12.44±1.09 | 0.209 |
| WBCs (*109/L) | 8.32±2.09 | 8.26±1.95 | 7.91±1.98 | 0.435 |
| Platelets (*109/L) | 288.28±42.91 | 281.21±43.36 | 277.59±44.28 | 0.457 |
| HbA1c (%) | 5.15±1.55 | 5.22±1.48 | 5.28±1.53 | 0.903 |
| ALT (U/L) | 32.08±7.82 | 33.04±8.46 | 30.75±8.44 | 0.224 |
| AST (U/L) | 32.63±6.66 | 32.73±8 | 33.62±7.28 | 0.696 |
| Cholesterol (mg/dL) | 206.88±38.82 | 26.3±58.18 | 243.05±62.9 | 0.005* |
| P1=0.179, P2=0.004*, P3=0.153 | ||||
| TG (mg/dL) | 193.03±28.8 | 193.4±34.24 | 202.37±39.2 | 0.211 |
| LDL (mg/dL) | 103.23±23.3 | 110.24±23.93 | 116.18±24.69 | 0.022* |
| P1=0.286, P2=0.018*, P3=0.266 | ||||
| HDL (mg/dL) | 42.4±4.97 | 40.6±5.86 | 38.53±5.25 | 0.001* |
| P1=0.200, P2=0.001*, P3=0.0.046* | ||||
| Creatinine (mg/dL) | 1.01±0.13 | 1.03±0.14 | 1.04±0.14 | 0.680 |
| Urea (mg/dL) | 43.38±14.46 | 43.73±13.95 | 45.63±16.24 | 0.647 |
Table 17.
Relation between CACS and echocardiographic findings.
| CACS | P value | ||||
| 0 (n=39) | 1-100 (n=84) | >100 (n=77) | |||
| EF (%) | 59.78±5.23 | 59.12±5.32 | 59.18±4.62 | 0.780 | |
| LAVI (mL/m2) | 30.8±2.59 | 32.12±3.78 | 33.17±4.46 | 0.007* | |
| P1=0.180, P2=0.005*, P3=0.200 | |||||
| Septal e` (m/s) | 0.87±0.17 | 0.85±0.17 | 0.79±0.18 | 0.017* | |
| P1=0.871, P2=0.039*, P3=0.043* | |||||
| Lateral e` (m/s) | 0.13±0.06 | 0.12±0.06 | 0.1±0.05 | 0.014* | |
| P1=0.537, P2=0.018*, P3=0.091 | |||||
| E/e` | 8.33±1.22 | 8.85±1.79 | 9.45±2.25 | 0.009* | |
| P1=0.328, P2=0.008*, P3=0.118 | |||||
| E/A | 1.26±0.34 | 1.39±0.45 | 1.46±0.47 | 0.075 | |
| TR velocity (m/s) | 1.64±0.57 | 1.88±0.58 | 2.07±0.68 | 0.002* | |
| P1=0.106, P2=0.001*, P3=0.137 | |||||
| DT (ms) | 207.83±33.07 | 197.15±38.65 | 185.55±40.2 | 0.010* | |
| P1=0.316, P2=0.009*, P3=0.137 | |||||
| IVRT (ms) | 118.2±18.2 | 108.5±19.5 | 101.9±18.5 | <0.001* | |
| P1=0.022*, P2<0.001*, P3=0.073 | |||||
| Diastolic function grade | Normal | 38 (97.44%) | 1 (1.19%) | 0 (0%) | <0.001* |
| Grade I | 1 (2.56%) | 81 (96.43%) | 0 (0%) | ||
| Grade II | 0 (0%) | 1 (1.19%) | 57 (74.03%) | ||
| Grade III | 0 (0%) | 1 (1.19%) | 20 (25.97%) | ||
| LVH | 7 (17.5%) | 17 (20.2%) | 13 (17.1%) | 0.864 | |
Table 18.
Relation between CACS and segment involvement score (SIS).
| CACS | P value | ||||
| 0 (n=39) | 1-100 (n=84) | >100 (n=77) | |||
| SIS | 0.28±1.04 | 1.25±0.77 | 4.25±0.9 | <0.001* | |
| P1<0.001*, P2<0.001*, P3<0.001* | |||||
| SIS | 0 | 39 (100%) | 15 (17.86%) | 0 (0%) | <0.001* |
| 1-2 | 0 (0%) | 64 (76.19%) | 4 (10.26%) | ||
| >2 | 0 (0%) | 5 (5.95%) | 73 (187.18%) | ||
Disclaimer/Publisher’s Note: The statements, opinions and data contained in all publications are solely those of the individual author(s) and contributor(s) and not of MDPI and/or the editor(s). MDPI and/or the editor(s) disclaim responsibility for any injury to people or property resulting from any ideas, methods, instructions or products referred to in the content. |
© 2025 by the authors. Licensee MDPI, Basel, Switzerland. This article is an open access article distributed under the terms and conditions of the Creative Commons Attribution (CC BY) license (http://creativecommons.org/licenses/by/4.0/).
Copyright: This open access article is published under a Creative Commons CC BY 4.0 license, which permit the free download, distribution, and reuse, provided that the author and preprint are cited in any reuse.


