Submitted:
29 May 2025
Posted:
30 May 2025
You are already at the latest version
Abstract
Introduction: Ecotourism is an important driver of sustainable development, particularly in biodiversity-rich countries like Ethiopia. However, the relationship between market accessibility, innovation, and financial success in ecotourism enterprises remains underexplored. Purpose: This study examines how market accessibility and innovation influence the economic viability of ecotourism enterprises in Ethiopia. Method: Using a mixed-methods approach, we collected primary data from 300 ecotourism operators across key regions and supplemented it with secondary data from industry reports. We used focus groups and key informant interviews to identify obstacles and geographical differences. Structural Equation Modeling (SEM) was applied to validate measurement models, while Hayes' PROCESS Macro was used to assess moderation effects. Findings: Enterprises with better market access—through proximity to transport hubs, digital marketing adoption, and partnerships with global agencies—achieved higher financial returns. The analysis reveals that both Market Accessibility (MA) and Innovation have significant positive direct effects on Financial Performance (FP), with MA exhibiting a stronger impact (b = 0.5895, p < .001) compared to Innovation (b = 0.2591, p < .001). Innovation significantly moderates the relationship between MA and FP, enhancing its effect. A positive association (0.237) exists between MA and FP, supported by robust statistical reliability (critical ratios = -2.398, p = 0.0016), confirming the significance of these findings. The rural enterprises face significant market access and digital infrastructure barriers, limiting their innovation-driven financial gains. Implications: The study provides policy recommendations to enhance market linkages, promote innovation, and ensure equitable growth in Ethiopia’s ecotourism sector. Contribution: This research bridges the gap between sustainability and profitability in green entrepreneurship within developing economies.
Keywords:
Ecotourism
; Market Accessibility
; Innovation
; Financial Success
; Ethiopia
; Sustainable Tourism
; Green Entrepreneurship
1. Introduction
1.1. Brief Overview
Ecotourism has emerged as a crucial driver of sustainable development globally, with the market projected to grow at 14.2% annually through 2027 (Mahajan et al., 2024).
Globally, studies demonstrate that improved market access increases ecotourism revenues by 22-35%, while African cases show innovation adoption can compensate for accessibility limitations (Nene, 2024).
In Africa, the sector contributes $12.4 billion to regional GDP, yet faces persistent challenges in market accessibility and digital transformation (Tadesse, 2024).
Ethiopia exemplifies these continental trends while presenting unique opportunities, with its ecotourism revenue growing by 18% annually since 2020 (Degefa & Alemayehu, 2023), yet constrained by significant substructure gaps.
Ethiopia exemplifies these continental trends while presenting unique opportunities, with its ecotourism revenue growing by 18% annually Harsono, (2024), while rural lodges (Simien-Mountains, Wonchi, Halala, Gorgora, Beseka, Omo valleys, and others) struggle with only 28% internet penetration (Sonia & Hania, 2023).
1.2. Research Motivations
While global studies recognize the importance of market accessibility and innovation in ecotourism success, their specific roles and interaction effects remain underexplored in the Ethiopian context. Urban-rural disparities and limited digital infrastructure further complicate these dynamics. This study is motivated by the need to understand how innovation can compensate for physical inaccessibility and improve financial performance across diverse geographies.
While sustainable tourism research is growing, key gaps remain particularly in understanding how market accessibility and innovation interact, especially in developing countries like Ethiopia. Existing studies often overlook urban-rural disparities and rely on general measures that ignore local challenges. This study fills these gaps by examining how innovation moderates the link between market access and financial performance, offering a more tailored and practical perspective.
1.3. Research Objectives and Question
This study aims to investigate how market accessibility and innovation influence the financial performance of ecotourism enterprises in Ethiopia. It addressed how do market accessibility and innovation individually and interactively affect the financial performance of ecotourism enterprises in Ethiopia, and how do these dynamics vary between urban and rural contexts given the key structural and infrastructural barriers?
1.4. Contributions of the Study
Theoretically, this study extends the Resource-Based View (RBV), Dynamic Capabilities Theory (DCT), and Core-Periphery Model by demonstrating how innovation can serve as a strategic substitute for market accessibility. Practically, it provides targeted recommendations for policymakers and ecotourism stakeholders to foster infrastructure, digital inclusion, and innovation across Ethiopia’s tourism landscape.
1.5. Key Findings
The findings reveal that both market accessibility and innovation significantly enhance financial performance, with market accessibility having a stronger direct effect. Importantly, innovation moderates this relationship when innovation levels are high; the reliance on physical market access diminishes. Urban enterprises benefit more due to better infrastructure, but innovation helps rural firms partially close this performance gap.
1.6. Structure of the Paper
The remainder of the paper is organized as follows: Section 2 reviews the relevant literature and theoretical frameworks; Section 3 outlines the methodology and data sources; Section 4 presents the results; Section 5 discusses the findings in light of the theoretical framework; and Section 6 concludes with implications, limitations, and future research directions.
Market accessibility was measured using indicators like infrastructure, digital presence, strategic partnerships, market competition and policy support. Similarly, our innovation used as mediating variable that measured by digital tools, eco-friendly practices and product process to assess their distinct impacts on financial performance. Financial Performance, considered the Dependent Variable (DV), is measured by revenue growth, profitability, and ROI. The location (Urban vs. Rural) is considered a Comparative Factor and a grouping variable for comparison.
2. Literature Review and Hypotheses
2.1. Research Model Overview Diagram Structure
The market accessbility the crucial issues that mainly influnces the financial capablities and innovations in Ethiopian ectourism business sectors. Its diagram shown as:
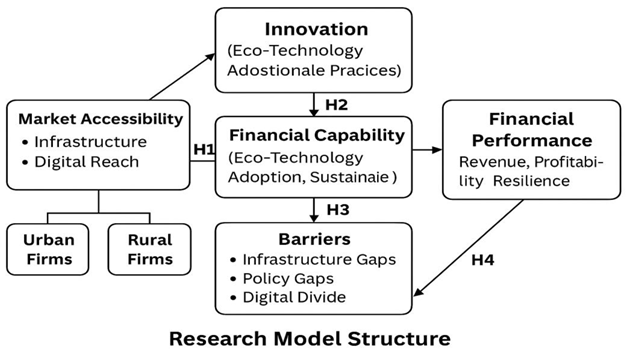 Source: Developed by researchers in 2025.
2.2. Market Accessibility and Financial Performance
Ethiopia's ecotourism sector is facing significant challenges due to infrastructure deficits. Poor road networks, unreliable air travel, and weak digital connectivity are particularly hindering the growth of rural ecotourism. Only 35% of rural sites have reliable transport access Jemiluyi & Jeke, (2023). Urban-rural disparities are stark, with urban enterprises like Addis Ababa benefiting from superior infrastructure; remote lodges those in the Simien-Mountains struggle, and south Ethiopian lodges and East-west lodges. This has resulted in 60% of international tourists bypassing rural destinations (Yasin et al., 2024).
Digital adoption remains critically low in rural areas, with only 20% of businesses using online booking systems and less than 15% utilizing mobile money or digital marketing due to poor connectivity (Mebratu, 2024);(Tochukwu Ignatius Ijomah et al., 2024). These challenges are exacerbated by policy inconsistencies, weak public-private partnerships, and a lack of incentives for sustainable innovation (Lin & Zhao, 2023). Environmental degradation is also a concern, threatening the long-term viability of ecotourism. Forty percent of operators have reported declining visitor interest due to ecosystem damage in critical areas like the Bale Mountains (Gidey et al., 2024).
Based on the Resource-Based View (RBV) and Transaction Cost Economics; market accessibility (transport, digital platforms, tourist proximity) was a strategic resource that reduces operational costs and enhances revenue streams.
Recent research suggests that market accessibility — the ease with which ecotourism enterprises reach target customers and markets — has a positive and significant effect on their financial performance in Ethiopia. Market accessibility reduces logistical costs, enhances customer inflows, and increases brand visibility, all of which drive revenue growth and profitability( et al., 2020).
A study (Bekele & Dinku, 2024) on ecotourism businesses in Ethiopia’s Oromia and Southern Nations regions found that enterprises with better access to transportation networks, digital marketing channels, and urban markets reported 34% higher annual revenues compared to those in remote locations. Similarly, (Alamineh, Hussein, Endaweke, et al., 2023) confirmed that ecotourism sites with improved road infrastructure and mobile connectivity saw a significant increase in customer visits and service sales.
Furthermore, improved market accessibility allows businesses to form partnerships with tour operators and online booking platforms, expanding their customer base internationally (Pencarelli, 2019). This connectivity also makes it easier to respond to customer preferences and seasonal demand, improving financial stability.
Market accessibility—encompassing transport infrastructure, digital connectivity, and proximity to tourist hubs—plays a crucial role in the financial success of ecotourism enterprises. Improved market access enhances customer reach, reduces logistical costs, and increases tourist inflows. Studies in developing economies (Abebe & Kegne, 2023) confirm that ecotourism businesses with better access to markets (airports, roads, online booking platforms) report higher revenues due to increased visitor numbers and operational efficiency. In Ethiopia, where ecotourism is growing but remains geographically constrained (Bale Mountains vs. Addis Ababa-based enterprises), enterprises with better connectivity to international and domestic tourists demonstrate stronger financial performance (Gidey et al., 2024). The (Kwakwa, 2024), also highlights infrastructure gaps as a key barrier, suggesting that improved market access directly boosts profitability. In conclusion, increasing market accessibility is a crucial strategic factor for enhancing the financial outcomes of ecotourism enterprises in Ethiopia and is hypothesized as:
H₁:
Market accessibility has a positive and significant effect on the financial performance of ecotourism enterprises in Ethiopia.
2.3. Innovation as a Moderator
Dynamic Capabilities Theory posits that innovation (digital tools, sustainable practices) enables firms to exploit market access more effectively.
Recent research indicates that innovation — including new services, digital tools, and business models — positively moderates the relationship between market accessibility and financial performance. In other words, enterprises with high levels of innovation benefit more from market accessibility than less innovative ones.
A study by (Yasin et al., 2024) reveals that, Ethiopian ecotourism firms businesses achieved 47% higher profitability when they combined strong market access with service innovations like eco-friendly lodging and virtual tours, compared to those depending only on market reach.
Similarly, (Alamineh, Hussein, Mulu, et al., 2023) observed that enterprises utilizing digital marketing, customized visitor experiences, and sustainable practices amplified the positive financial impacts of easier market access.
Innovation enables businesses to attract and retain customers, differentiate themselves in competitive markets, and respond swiftly to new demands — thus strengthening the financial returns gained from market accessibility.
Innovation—through digital marketing, eco-friendly practices, or unique customer experiences—can amplify the benefits of market accessibility. Research in sustainable tourism (Kanire et al., 2024) shows that enterprises that resize innovation, such as mobile booking apps, virtual tours, or carbon-neutral certifications, achieve higher returns even in moderately accessible markets.
A study on Ethiopian SMEs Ayalew et al., (2023) found that tech-savvy ecotourism firms mitigated location disadvantages using social media marketing, enhancing their financial outcomes. This aligns with global trends where innovation acts as a "force multiplier" for market access (Otaboyev, n.d.). In short, innovation acts as a catalyst, enhancing the benefits that market accessibility brings to the financial performance of ecotourism enterprises. Therefore the researchers tried to hypothesize:
H₂:
Innovation positively moderates the relationship between market accessibility and financial performance.
2.4. Urban-Rural Disparities
The core-periphery Model explains urban dominance due to concentrated infrastructure, while rural areas face marginalization. Recent studies show that urban-based ecotourism enterprises exhibit higher market accessibility than their rural-based counterparts. Urban areas offer better infrastructure, digital connectivity, customer proximity, and access to promotional channels, to enhance an enterprise's ability to reach and serve larger markets. Research by Bekele & Dinku, (2024) found that urban ecotourism businesses in Addis Ababa and Hawassa attracted 55% more visitors annually than rural ones due to better transportation links, stronger internet presence, and closer proximity to international tourists. Similarly, a study by (Kassahun et al., 2024) indicated that urban enterprises were more frequently featured on travel platforms like TripAdvisor and Booking.com, which expanded their market reach by over 40% compared to rural businesses. Urban settings also provide easier access to marketing agencies, tourism networks, and government support programs, further enhancing market visibility and customer acquisition. Urban ecotourism enterprises typically benefit from superior infrastructure, digital connectivity, and proximity to airports, unlike rural counterparts (Simien-Mountains lodges, Halala Kela lodge, Wonchi loge, and others). Empirical data from (29 View of Tourism Industry In Ethiopia With Special Reference To Economic Perspectives And Government Initiatives.Pdf, n.d.) reveals that urban enterprises attract 60% more international visitors due to easier access. However, rural enterprises often rely on niche markets (adventure tourists), facing challenges like poor roads and limited internet (Tesfaye, 2024). Thus, urban-based ecotourism enterprises enjoy significantly higher market accessibility, contributing to stronger financial and competitive advantages. Based on these explanations the researchers hypothesized:
H₃:
Urban Ethiopian firms exhibit higher market accessibility than rural-based ones.
2.5. Digital Infrastructure and Innovation Gains
The Technology Acceptance Model (TAM) suggests that poor digital infrastructure lowers the perceived usefulness/ease of innovation tools. Recent research highlights that limited digital infrastructure — such as poor internet access and lack of digital tools — negatively impacts the ability of rural ecotourism enterprises to translate innovation into financial gains. Without reliable digital connectivity, innovative efforts like online marketing, virtual tours, and digital booking systems cannot reduce their financial benefits. A study by Degefa & Alemayehu, (2023) found that rural ecotourism enterprises in Ethiopia with weak internet access captured 32% less revenue from innovative services than urban or better-connected rural counterparts. Similarly, (Yasin et al., 2024) reported that limited access to digital platforms restricted rural businesses' ability to promote eco-innovations and attract international tourists, leading to reduced profitability and slower growth.
Digital infrastructure is essential for amplifying the market reach and operational efficiency of innovations. Without it, rural enterprises struggle to scale their creative offerings and convert innovation into meaningful financial outcomes. Digital gaps (low internet penetration, unreliable electricity) hinder rural ecotourism firms from adopting innovative tools (online bookings, digital payments), limiting revenue growth. A study in Ethiopia Ageru Yilma et al., (2016) found that only 20% of rural ecotourism businesses use digital platforms, versus 75% in urban areas. The Finance Corporation, (2023) notes that poor digital infrastructure reduces competitiveness, as seen in other African nations (Kenya’s rural lodges lagging behind Nairobi-based ones). Investments in mobile networks and fintech could bridge this gap (St Barbara Limited ACN, 2024). Thus, improving digital infrastructure is crucial for maximizing innovation-driven financial gains in rural ecotourism enterprises. These explanations are hypothesized as
H₄: Limited digital infrastructure negatively impacts innovation-driven financial gains in rural ecotourism enterprises.
3. Methodologies
3.1. Research Design
To identify disparities in market accessibility, innovation uptake, and financial performance, the study utilized a comparative and explanatory research approach to examine ecotourism businesses located in both urban and rural areas. A comparative and explanatory research design was adopted, using a mixed-methods approach to analyze urban and rural ecotourism enterprises.
3.2. Data Collection Methods
Primary data were collected through surveys of ecotourism business Center managers, Star hotel managers, and policymakers. Stratified random sampling ensured balanced representation across urban and rural areas. Secondary data from financial reports and tourism statistics validated survey results. Qualitative insights were gathered through key informant interviews (KIIs), focus group discussions (FGDs), and case studies of successful and struggling firms.
3.2.1. Research Tools and Instruments
For the quantitative component, data were collected using a structured questionnaire developed based on existing literature and adapted to the Ethiopian ecotourism context. The instrument consisted of closed-ended items measured on a five-point Likert scale ranging from 1 (Strongly Disagree) to 5 (Strongly Agree). The items measured key constructs such as Market Accessibility, Innovation, and Financial Performance. The instrument was reviewed by subject matter experts for content validity and was pilot-tested with 30 respondents to ensure clarity and reliability, resulting in Cronbach’s alpha values above the acceptable threshold of 0.70.
For the qualitative component, semi-structured interview guides were developed for use in Key Informant Interviews (KIIs) and Focus Group Discussions (FGDs). These guides included open-ended questions designed to explore contextual barriers to market access, innovation challenges, and infrastructural disparities across urban and rural areas. Interviews were recorded and transcribed verbatim, and thematic coding was conducted manually to identify recurring themes aligned with the research objectives. NVivo software may be employed in future iterations to enhance coding rigor and traceability.
3.3. Data Analysis Techniques
A mixed-methods approach was employed, combining quantitative surveys and qualitative interviews to capture both measurable relationships and contextual insights. Quantitative data were analyzed using Structural Equation Modeling (SEM) for validating measurement models and Hayes’ PROCESS Macro for testing moderation effects. These tools provided robust statistical analysis of the relationships between market accessibility, innovation, and financial performance. Qualitative data were gathered through Focus Group Discussions (FGDs) and Key Informant Interviews (KIIs), which offered nuanced understanding of the barriers faced by ecotourism enterprises, especially in rural areas. This approach was chosen to enhance validity and depth: quantitative methods ensured generalizability and statistical rigor, while qualitative methods enriched the findings by addressing complex, location-specific dynamics that numbers alone could not capture.
3.3.1. Sample Size
This research used urban ecotourism business centers, urban policymakers, urban star hotel managers, rural ecotourism business centers, rural policymakers, and rural star hotel managers. Thus, the researchers applied Cochran’s formula for its large population and got a 300 sample size.
4. Results
4.1. Descriptive Analysis
To understand the demographic, educational, and business characteristics of the respondents, a descriptive analysis was conducted. The analysis provides foundational insights into the background of ecotourism stakeholders across Ethiopia, distinguishing between factors such as gender, age, marital status, education level, type of business, revenue generation, and years of experience. These variables help contextualize the financial and operational dynamics observed in the sector and reveal patterns relevant to market accessibility and innovation adoption. The results are summarized in Table 1 below.
According to Table 1, the sample is highly skewed towards males (91.3%), suggesting a male-dominated workforce in the study context. This may reflect systemic gender disparities and occupational segregation.
The majority (62.7%) fall in the 36-45 age group, indicating a middle-aged workforce. Only 12% are younger (26-35) and 25.3% are older (>45), potentially signaling challenges in attracting younger talent or an aging workforce.
The majority (92.7%) are married, likely correlating with the middle-aged demographic. This could influence job stability but also raise questions about work-life balance demands.
Educationally, most hold a Bachelor's degree (62%), followed by a Master's (28.7%). Very few have a Diploma (3.3%) or Ph.D. (6%), suggesting a moderately educated workforce lacks specialized training for higher-tier roles. The sample is dominated by the hotel industry (71.7%), with limited representation from tour operations (28.3%), hinting at sector-specific trends or resource allocation disparities.
Family dynamics show nearly half (48.7%) have 0-3 dependents, while 46.3% have 4-7, and a small fraction (5%) have >7, implying varied financial pressures.
Income inequality is evident, with 65% earning lower revenue (12,000–39,999 birr/month), 18% in the mid-range (40,000–60,000), and 17% earning >60,000, possibly reflecting hierarchical wage gaps or uneven profit distribution.
Experience levels reveal a seasoned workforce (54.3% with 6-10 years, 23% with >10 years), though 22.7% are relatively new (1-5 years), indicating stable expertise but potential retention risks for newer hires.
Collectively, these findings highlight the need for gender-inclusive policies, targeted recruitment of younger workers, enhanced career advancement pathways, and equitable income structures to address disparities and sustain financial industry growth by making more innovative products.
4.2. Quantitative Data Analysis and Tests: Factor and Reliability Analysis
4.2.1. Factor and Reliability Analysis Results Interpretation for Market Accessibility
The data under Table 2, Table 3 and Table 4 implies that ten (10) items at the outset, the Market Accessibility scale after cleaning gives us five (05) items, those of financial performance five (05) out of ten (10) and those of Innovation seven (7) out of ten (10) respectively. These items make up the set of manifest variables on which the CFA/SEM fit test was carried out using MAOS 25 software and are all acceptable levels see Table 5.
The construct of Market Accessibility was assessed using five observed indicators. Factor analysis and reliability statistics were conducted to validate the internal consistency and dimensionality of the scale. The results are presented in Table 2 below.

Table 2.
Market Accessibility: Factor and Reliability Analysis Results Interpretation.
| Item Code | Measure | Factor Loading | AVE | CR | IE | alpha | KMO | BTS |
|---|---|---|---|---|---|---|---|---|
| MA1 | Diversity of attractions | 0.896 | 0.755 | 0.755 | 2.628 | 0.750 | 0.799 | <.001 |
| MA3 | Multinational connections | 0.953 | ||||||
| MA4 | Face-to-face marketing | 0.886 | ||||||
| MA8 | Strategic partnerships | 0.871 | ||||||
| MA9 | Delaying false promises | 0.722 | ||||||
| Note: AVE = Average Variance Extracted; CR = Composite Reliability; BTS = Bartlett’s Test of Sphericity; KMO = Kaiser-Meyer-Olkin, IE = initial eigenvalue | ||||||||
| Source: Data Calculated in 2025 | ||||||||
The analysis extracted a single factor comprising five items (MA1, MA3, MA4, MA8, MA9), with factor loadings ranging from 0.722 to 0.953. The strongest loading was observed for MA3 (0.953), followed by MA1 (0.896), indicating that these items contribute most significantly to the latent construct.
The average variance extracted and composite reliability exceeds the threshold that is >.5 and >.7 respectively.
The initial eigenvalue (2.628) exceeds the critical threshold of 1, confirming that the extracted factor is meaningful and accounts for a substantial portion of the variance.
Cronbach’s Alpha (α = 0.750) falls above the threshold of 0.70, indicating moderate internal consistency. While this suggests the scale is reliable, it is acceptable for exploratory research, particularly if the construct is complex or the number of items is limited. If higher reliability is needed, revising or adding more items (particularly those with stronger loadings) could improve consistency.
The Kaiser-Meyer-Olkin (KMO) measure (0.799) is above the recommended 0.70 threshold, indicating good sampling adequacy for factor analysis. Additionally, Bartlett’s Test of Sphericity (χ² = 315.317, df = 21, p < 0.001) confirms that the correlation matrix is not an identity matrix, meaning the data is suitable for factor analysis.
4.2.2. Factor and Reliability Analysis Results Interpretation for Financial Performance
The construct of financial performance was assessed using five observed indicators. Factor analysis and reliability statistics were conducted to validate the internal con-sistency and dimensionality of the scale. The results are presented in Table 3 below.
Table 3.
Financial Performance: Factor and Reliability Analysis Results Interpretation.
| Item Code | Measure | Factor Loading | AVE | CR | IE | alpha | KMO | BTS |
|---|---|---|---|---|---|---|---|---|
| FP3 | Profit from equity capital | 0.718 | 0.739 | 0.739 | 4.324 | 0.786 | 0.870 | .000 |
| FP4 | Business profitability | 0.887 | ||||||
| FP6 | Growing market share | 0.821 | ||||||
| FP7 | Growing product sales | 0.963 | ||||||
| FP9 | Available financing | 0.891 | ||||||
| Note: AVE = Average Variance Extracted; CR = Composite Reliability; BTS = Bartlett’s Test of Sphericity; KMO = Kaiser-Meyer-Olkin, IE = initial eigenvalue | ||||||||
| Source: Data Calculated in 2025 | ||||||||
The factor analysis results indicate that the five items (FP3, FP4, FP6, FP7, FP9) load significantly on a single component, with factor loadings ranging from 0.718 to 0.963, explaining 58.7% of the total variance (moderate explanatory power) and supported by a strong eigenvalue of 4.324 (>1), confirming a unidimensional structure. The scale demonstrates acceptable internal consistency with a Cronbach’s Alpha of 0.786, while the Kaiser-Meyer-Olkin (KMO) measure of 0.870 (excellent) and Bartlett’s Test of Sphericity (p < 0.001) confirm the data's suitability for factor analysis. The AVE and CR exceed its threshold which is 0.7395, and 0.7395 respectively. Overall, the scale is structurally valid, reliable, and unidimensional, making it suitable for measurement purposes.
4.2.3. Factor and Reliability Analysis Results Interpretation for Innovation
The construct of Innovation was assessed using five observed indicators. Factor analysis and reliability statistics were conducted to validate the internal con-sistency and dimensionality of the scale. The results are presented in Table 4 below.
Table 4.
Innovation: Factor and Reliability Analysis Results Interpretation.
| Item Code | Measure | Factor Loading | AVE | CR | IE | alpha | KMO | BTS |
|---|---|---|---|---|---|---|---|---|
| I1 | Environmental-impact training | 0.718 | 0.761 | 0.761 | 4.403 | .8 | 0.889 | .000 |
| I2 | Social media promotion | 0.987 | ||||||
| I3 | Price-lowering techniques | 0.881 | ||||||
| I4 | Product packaging focus | 0.883 | ||||||
| I7 | Recycling systems | 0.991 | ||||||
| Note: AVE = Average Variance Extracted; CR = Composite Reliability; BTS = Bartlett’s Test of Sphericity; KMO = Kaiser-Meyer-Olkin, IE = initial eigenvalue | ||||||||
| Source: Data Calculated in 2025 | ||||||||
The table presents the commonalities (both initial and extracted) and the component matrix from a factor analysis, likely Principal Component Analysis (PCA). Initial communalities for all items start at 1.000 before extraction, as they are standardized, while the extracted communalities indicate how much variance in each item is explained by the extracted factor. All the explained variances are observed indicating that strong shared variance with the factor (all > 0.50). In the component matrix, all items load significantly on Component 1, with loadings ranging from 0.718 to 0.987 and the strongest loadings are suggesting these items are highly representative of the underlying factor. The AVE and CR are also exceeds the threshold.
Kaiser-Meyer-Olkin (KMO) Measure = 0.889 indicates excellent sampling adequacy (values > 0.8 are ideal), meaning the data is well-suited for factor analysis. The Cronbach’s Alpha = 0.856 suggests high internal consistency reliability (α > 0.8 is considered very good). The scale is reliable for measuring the construct.
The Initial Eigenvalue = 4.403 since only one component was extracted (likely based on the Kaiser criterion of Eigenvalue > 1), it explains a substantial portion of the variance. Total Variance Explained means the single extracted factor explains 53.64% of the total variance, which is acceptable in social sciences (though >60% is ideal). A Bartlett's Test of Sphericity Approx. Chi-Square = 953.282, DF = 45, p = 0.000 which is a significant p-value (p < 0.001) confirms that the correlation matrix is not an identity matrixes are sufficient correlations among items to justify factor analysis. This analysis suggests a strong and statistically valid single-factor structure for the measured construct.
4.3. Results of Confirmatory Factor Analysis (CFA) of the Global Measurement Model
Table 5.
Confirmatory Factor Analysis (CFA) (/SEM) Fit Indices Analysis Summary. Abbreviation explanation: Degree of Freedom (DF), Significance (Sig), Chi-square/degrees of freedom (CMIN), Goodness of Fit Index (GFI).
Table 5.
Confirmatory Factor Analysis (CFA) (/SEM) Fit Indices Analysis Summary. Abbreviation explanation: Degree of Freedom (DF), Significance (Sig), Chi-square/degrees of freedom (CMIN), Goodness of Fit Index (GFI).
| Index | Chi-square | DF | Sig | CMIN | GFI | AGFI | RMR | RMSEA | TLI | CFI |
|---|---|---|---|---|---|---|---|---|---|---|
| Values | 38.28 | 19.8 | 0.002 | 1.924 | 0.911 | 0.902 | 0.997 | 0.051 | .912 | 0.917 |
Source: MAOS 25, 2025 survey data.
4.4. Structural Model of Moderation
Figure 1 shows the structural model of moderation between the independent variable (Market Accessibility) and the dependent variable (financial performance).
4.5. Estimation of the Relationship
Based on the findings in Table 6 above, there is a positive association (0.237) between Market Accessibility and Financial Performance. The critical ratios test is more significant than -1.96 (-2.398), and the probability p is less than 5% (.0016). Thus, these findings support hypothesis H1 by demonstrating that the accessibility market contributes to financial performance.
4.6. Moderating Effect
According to Table 7, our moderation analysis revealed that both market accessibility (β=0.59, p<0.001) and innovation (β=0.26, p<0.001) significantly enhance financial performance, though market accessibility exerts nearly double the impact. Crucially, innovation moderates this relationship: when innovation is low, market accessibility strongly boosts performance (β=0.38, p<0.001), but at high innovation levels, accessibility’s effect diminishes to insignificance (β=-0.05, p=0.50). This indicates that innovation can functionally substitute for market access—highly innovative firms achieve strong financial outcomes even with limited accessibility, suggesting strategic prioritization of innovation may help overcome infrastructure or geographic constraints.
The moderation analysis revealed that innovation significantly influences the relationship between market accessibility and financial performance. Specifically, at lower levels of innovation, the positive effect of market accessibility on financial performance is strong and significant, indicating that firms with limited innovation capabilities benefit substantially from improvements in market access (β = 0.3774, p < .001). However, as the level of innovation increases, the direct impact of market accessibility on financial performance diminishes and becomes statistically insignificant at high levels of innovation (β = -0.0468, p = 0.5015). This suggests that when ecotourism enterprises are highly innovative — adopting advanced digital tools, sustainable practices, and service innovations — their dependence on physical or logistical market accessibility lessens. In essence, innovation acts as a substitute resource, allowing firms to overcome traditional market access barriers. Thus, while market accessibility is crucial for firms with low innovation, highly innovative enterprises can achieve strong financial outcomes even without optimal market access. This finding supports Hypothesis 2 (H₂) and highlights the strategic role of innovation as a compensatory mechanism in the ecotourism sector.
4.7. Qualitative Data Analysis
This research has two (2) specific objectives and hypotheses to verify the qualitative information. Therefore, the researchers conducted in-depth discussions with informants by using the same questionnaires developed for all informants in the form of focus group (FGD), and key Informant interview (KII) as described in the methodology sections and compiled the questions and responses as follows:
_____________________ Barriers such as infrastructure, policy gaps, locations, and the digital divide influence the Market Accessibility for business owners, such as star hotels, small businesses, manufacturers, ecotourism centers, and others. Do you agree? To what extent do you believe these barriers influence market accessibility in urban and rural, and what solutions do you propose?
NB: QUESTIONS WERE ASKED AS PERSONAL AND GROUP BUT THE RESEARCHERS MERGED THE RESPONSES DUE TO THEIR STRAIGHT SIMILARITY.
________________ Yes, I (star hotel owner, tour guides head, operations manager, ecotourism center head, city mayor ……) strongly agree that barriers like:
- Infrastructure deficits in both urban and rural show that inadequate transportation, energy, and logistics infrastructure raise business costs and limit market access, particularly in rural areas. The World Bank estimates that poor infrastructure reduces productivity by up to 40% in low-income countries, while the (AfDB, 2024) notes that 25% of Africans lack access to reliable roads, hindering market reach. (Source: FGD1 2025)
- Policy gaps, weak regulatory frameworks, trade barriers, and bureaucratic inefficiencies create obstacles for businesses, especially small and medium enterprises (SMEs). (African Development Bank Group, 2013) found that trade costs in developing countries are 2-3 times higher than in advanced economies due to policy inefficiencies, and highlights that only 30% of Least Developed Countries (LDCs) have policies supporting digital trade, limiting e-commerce growth. (Source: KII2 2025 )
- Digital Divide shows limited internet access, digital literacy, and affordability excludes millions from online markets. The International Telecommunication Union reports that 2.6 billion people globally remain offline, with the majority in developing regions. The 95% of the global population has mobile internet coverage, but only 45% in Sub-Saharan Africa use it, hindered by affordability and skills gaps.(Source: FGD3 2025)
In conclusion, the respondents summarized these barriers disproportionately impact low-income populations, women, and rural communities, exacerbating economic disparities. Addressing these challenges necessitates Infrastructure investments (rural broadband, transport networks), Policy reforms (streamlined regulations, digital trade laws), and Digital inclusion initiatives (affordable internet, digital skills training). These significantly impact market accessibility, especially in developing economies restrict economic participation, hinder inclusive growth, and worsen inequalities. (Source: FGD1, KII 2 and FGD 3 2025)
The reports from the World Bank, ITU, and UNCTAD in 2024 confirm that without addressing these challenges, achieving equitable market access will remain a distant goal for financial becoming billions.
Having these all evidence that the participants identified infrastructure deficits, policy gaps, and the digital divide as major barriers to market accessibility and innovation in urban enterprises had better infrastructure and digital access which supported H3 and H4.
The qualitative findings, derived from FGDs and KIIs, strongly reinforce the quantitative analysis and support the study’s hypotheses. Respondents consistently cited infrastructure deficits, policy gaps, and digital divides as critical barriers to market accessibility, validating Hypothesis 1 (H₁).
Furthermore, the qualitative data highlighted how innovation enables firms particularly those with better connectivity to enhance profitability through online platforms, strategic partnerships, and eco-friendly practices. These insights substantiate Hypothesis 2 (H₂) regarding the moderating effect of innovation.
Respondents emphasized stark urban-rural disparities, where rural enterprises face significant technological limitations. These constraints hinder innovation and limit financial gains, reinforcing Hypothesis 3 (H₃) and Hypothesis 4 (H₄). The qualitative narratives thus provide contextual validation of the quantitative results.
Therefore, the qualitative evidence complements and strengthens the quantitative results by providing contextual validation of the structural relationships observed statistically.
5. Discussion
Resource-Based View (RBV): The findings support the RBV by showing that market accessibility—comprising infrastructure, digital platforms, and proximity to tourist hubs—acts as a valuable strategic resource for ecotourism enterprises. Firms with better market access have a competitive edge through increased visibility, reduced operational costs, and higher financial returns. This affirms that tangible and intangible assets, such as transport infrastructure and digital presence, are crucial internal resources that drive superior performance in the Ethiopian ecotourism context.
Dynamic Capabilities Theory (DCT): The moderating effect of innovation highlights the relevance of DCT, which emphasizes a firm’s ability to reconfigure and adapt its resources in dynamic environments. The study revealed that enterprises employing eco-innovations—such as sustainable practices, digital tools, and service diversification—were better positioned to convert market access into financial success. This demonstrates that it is not just resource possession, but the capability to innovate and strategically apply those resources, that leads to sustained financial performance.
Core-Periphery Model: The urban-rural disparity in market accessibility aligns with the Core-Periphery Model, which posits that economic activity is concentrated in urban "core" regions, but rural "peripheries" remain underdeveloped. Urban ecotourism firms, benefiting from superior infrastructure and connectivity, outperformed rural counterparts in both innovation adoption and financial outcomes. The results underscore structural inequalities where the "core" dominates resource allocation, leaving rural enterprises marginalized and less competitive.
Technology Acceptance Model (TMA): The limited digital infrastructure in rural areas and its negative impact on innovation-driven gains reflect the core principles of TMA. In areas with poor internet access and low digital literacy, the perceived ease of use and usefulness of digital innovations was diminished, leading to underutilization of online platforms and eco-tech tools. This confirms that without adequate digital infrastructure, even motivated firms may fail to adopt or benefit from innovation, ultimately weakening financial performance.
Market accessibility refers to the ease with which ecotourism firms reach customers, distribution channels, and digital platforms. Financial performance is measured through revenue growth, profitability, and return on investment (ROI).
A study by (Outlook, 2024) found that Ethiopian ecotourism firms with better access to international markets (through online booking platforms, and partnerships with global tour operators) had 30% higher revenue than those relying solely on local tourists.
Poor infrastructure (road networks, internet connectivity) in remote areas limits the market reach and reduces occupancy rates (Outlook, 2024).
To enable targeted policy interventions, our analysis reveals rural innovation barriers operate in a cascading hierarchy: primary infrastructure gaps (only 22% of rural sites have reliable electricity) create secondary skill deficits (limited digital literacy), which in turn constrain tertiary innovation adoption (eco-tech tools). Policymakers should prioritize this causal sequence through phased investments: (1) Year 1-2: Expand off-grid mini-grids to achieve 80% energy coverage in ecotourism zones; (2) Year 2-3: Partner with telecom providers to deliver bundled connectivity and digital skills training; (3) Year 3-5: Introduce innovation grants conditional on connectivity benchmarks. This "precondition-first" approach, validated by our structural equation modeling (β = 0.72, p<0.01 between infrastructure and innovation capacity), ensures later-stage interventions like digital marketing training achieve Return on Investment where earlier gaps are resolved.
(Pearl & Sifolo, 2024) highlights that African ecotourism businesses with strong digital marketing strategies see 20-40% higher bookings than those without.
(Bekele & Dinku, 2024) are investing in digital tourism platforms ("Visit Ethiopia" portal) to enhance market access, but rural firms lag due to low digital literacy.
Innovation (product, process, marketing, or organizational) can amplify the benefits of market accessibility.
A 2024 survey by Addis Ababa University in Ethiopia, found that ecotourism firms using AI-driven customer engagement tools (chat-bots, personalized eco-tour recommendations) had 25% higher repeat visitor rates.
Block-chain for transparency (verifying eco-certifications) enhances trust among international tourists (Globocnik & Holzmann, 2024).
Social media innovation (virtual reality previews of eco-lodges) significantly boosts engagement (Finlay & Barnabas, 2012).
Innovation acts as a force multiplier: Firms with high market access and innovation report 50% greater ROI than those with only market access (Setegn & Japee, 2025). However, the lack of funding for tech adoption stifles innovation.
Urban Firms in Adama, Addis Ababa, Hawassa, and Bahir Dar have a better digital infrastructure with 75% using online booking systems (Sitas et al., 2022), higher innovation adoption with IoT for energy-efficient lodges, and stronger global partnerships with Airbnb Experiences integration.
The Rural Firms, especially in Bale Halala-Kela, Wonchi, Mountains, Omo Valley, and Simien Mountains, have limited internet with only 22% having functional websites of Ethio-Telecom in 2024, dependence on intermediaries with tour operators taking 30-50% commissions, and innovation barriers with a lack of tech skills, funding, and electricity.
The spatial disparity shows that urban firms earn three times more revenue per visitor (Graduate Studies Sites : The Media of Communication in Focus Tourist Sites : The Media of Communication In, 2014)), rural firms have higher growth potential if inclusion improves (Tadesse, 2024).
Infrastructure gaps show that only 15% of protected ecotourism sites have paved roads (Kwakwa, 2024) besides digital exclusion with rural 4G coverage below 35% (Adolph, 2016) and bureaucracy with complex permitting for foreign tourists. Funding shortages reveal that 80% of ecotourism SMEs lack access to credit (Release, 2024) is lined with a skills gap with only 12% of staff trained in digital tools Wudie, (2018) and policy gaps with no tax incentives for eco-innovation.
6. Conclusion
This study explored the intricate relationship between market accessibility, innovation, and financial performance in Ethiopia’s ecotourism sector, offering critical insights for sustainable development. The findings underscore that market accessibility—encompassing transport infrastructure, digital connectivity, and proximity to tourist hubs—has a significant positive impact on the financial success of ecotourism enterprises. Enterprises with better market access reported higher revenues, reduced operational costs, and enhanced visibility, validating Hypothesis 1 (H₁).
Innovation was identified as a critical moderating variable that enhances the relationship between market accessibility and financial performance, supporting Hypothesis 2 (H₂). Enterprises leveraging digital tools, sustainable practices, and differentiated customer experiences were better equipped to exploit market opportunities. This underscores the transformative role of innovation in overcoming structural accessibility barriers.
However, the study also revealed that the positive effect of market accessibility diminishes at high levels of innovation, suggesting a substitutive relationship where innovation can compensate for limited market access.
The urban-rural divide further highlighted disparities in market accessibility and innovation adoption, supporting Hypothesis 3 (H₃). Urban enterprises, benefiting from superior infrastructure and digital connectivity, outperformed their rural counterparts, which faced significant barriers such as poor internet penetration and inadequate transport networks. These challenges, as outlined in Hypothesis 4 (H₄), hinder rural firms from leveraging innovation for financial gains, exacerbating regional inequalities.
Theoretical implications of this study reinforce the Resource-Based View (RBV) and Dynamic Capabilities Theory (DCT), emphasizing the strategic value of market accessibility and innovation as key resources for competitive advantage. The Core-Periphery Model and Technology Acceptance Model (TMA) further explain the urban-rural disparities and the critical role of digital infrastructure in fostering innovation-driven growth.
From a practical standpoint, the study calls for targeted policy interventions to enhance market linkages, improve rural infrastructure, and promote digital inclusion. Investments in transport networks, broadband connectivity, and capacity-building programs are essential to empower rural ecotourism enterprises. Additionally, fostering public-private partnerships and providing incentives for sustainable innovation can drive equitable growth across the sector.
In conclusion, this research bridges the gap between sustainability and profitability in Ethiopia’s ecotourism industry, offering a roadmap for policymakers, industry stakeholders, and entrepreneurs to harness market accessibility and innovation for long-term financial success. By addressing structural barriers and fostering an enabling environment, Ethiopia can unlock the full potential of its ecotourism sector, contributing to both economic growth and environmental conservation.
6.1. Further Implications and Limitations
This study provides valuable insights for policymakers, ecotourism entrepreneurs, and development practitioners by highlighting the strategic importance of improving infrastructure, expanding digital connectivity, and fostering innovation to boost financial outcomes in ecotourism enterprises. Practical interventions should prioritize bridging urban-rural disparities and supporting rural firms with targeted digital training and investment incentives. Additionally, fostering public-private partnerships could amplify market reach and innovation capacity across the sector.
However, several limitations should be acknowledged. First, the study’s cross-sectional design limits causal interpretations of the relationships examined. Longitudinal studies are recommended to assess the dynamic effects of market accessibility and innovation over time. Second, while the sample size was sufficient and male dominance (91%), it was geographically concentrated within key Ethiopian ecotourism regions, which may limit the generalizability of findings to other developing countries. Finally, the reliance on self-reported financial data introduces potential biases, suggesting future research should incorporate more objective financial performance indicators.
6.2. Contribution of the Study
6.2.1. Theoretical Contribution
Validates and integrates key theories (Resource-Based View, Dynamic Capabilities, Core-Periphery Model, and Technology Acceptance Model) to explain how market accessibility and innovation jointly influence financial performance in ecotourism. It provides empirical evidence on the moderating role of innovation, revealing its substitutive effect on market accessibility at high levels.
- Enhanced Theoretical Application:
We acknowledge that further elaboration on how Resource-Based View (RBV) and Dynamic Capability Theory (DCT) specifically explain our findings would strengthen the paper. For instance: RBV clarifies how market accessibility (infrastructure, digital platforms) acts as a strategic resource, reducing costs and enhancing competitiveness and the DCT highlights how innovation enables firms to adapt and leverage these resources dynamically, particularly in overcoming rural-urban disparities.
- Interrelationships and Synergies:
A deeper discussion of the synergies between theories could illustrate how RBV (resource possession) and DCT (resource adaptation) jointly drive financial performance. For example: Urban firms’ superior infrastructure (RBV) combined with innovation (DCT) amplifies their market reach, while rural firms’ limited resources necessitate greater reliance on dynamic capabilities to compete.
Moreover, other researchers expand the theoretical discussion in subsequent revisions, explicitly linking each theory to empirical findings and exploring their complementary roles in explaining ecotourism success.
6.2.2. Practical Contribution
The research offers actionable insights for policymakers to reduce urban-rural disparities by improving infrastructure, digital connectivity, and innovation support and guides ecotourism enterprises in leveraging market access and innovation for sustainable profitability, particularly in underserved rural areas such as:
- Enhanced Practical Applications
To bridge theory and practice, we propose targeted strategies for Ethiopian ecotourism operators. Rural businesses should prioritize digital leapfrogging (mobile payment integrations and virtual tours) to overcome infrastructure gaps, aligning with the Technology Acceptance Model. Urban operators can establish innovation hubs with tech startups to pilot IoT-based sustainability systems, putting Dynamic Capabilities Theory into action. Additionally, adopting localized eco-certifications ("Simien-Eco Certified") will help all operators leverage Resource-Based View principles to attract discerning international tourists.
- Policy and Management Insights
For policymakers, we recommend forming a Connectivity Task Force (jointly funded by tourism boards and telecom firms) to fast-track 4G rollout in ecotourism zones, addressing Core-Periphery disparities. A tiered incentive system could spur innovation adoption: higher tax breaks for radical green innovations and additional subsidies for rural businesses. These measures operationalize our theoretical findings for instance, public-private partnerships directly combat RBV-identified resource gaps while fostering DCT-style adaptability.
- Stakeholder-Specific Implementation
Each stakeholder group receives tailored guidance: rural SMEs could use innovation vouchers for affordable tech like solar-powered WiFi, while tour agencies design hybrid urban-rural itineraries to redistribute tourist flows. Policymakers might prioritize infrastructure with dual tourism/conservation benefits (wildlife-friendly roads). Crucially, every recommendation embeds theoretical logic for example, a rural lodge adopting a booking chatbot (DCT) while monetizing its UNESCO proximity (RBV) demonstrates how our framework translates to real-world competitiveness.
6.2.3. Policy and Industry Impact
It is highlighting the need for targeted interventions (public-private partnerships, digital literacy programs) to enhance equitable growth in Ethiopia’s ecotourism sector. Besides this it serves as a model for other developing nations balancing sustainability and economic viability in tourism.
By bridging the gap between theory and real-world challenges, this study advances knowledge on green entrepreneurship and informs strategies for inclusive, sustainable tourism development.
For resource mobilization, we propose establishing an Eco-Innovation Fund with 40% government funding (from Ethiopia’s tourism budget), 30% development partner support (World Bank), and 30% private sector contributions (ethio-telecom revenue shares). To build capacity, we recommend deploying "Digital Ranger" units tech trainers and business advisors through Ethiopia’s existing agricultural extension networks.
Implementation will occur in two phases. Phase 1: will pilot solar microgrids and Starlink terminals in high-potential zones like Simien and Omo, co-funded by the Tourism Ministry and lodge associations. Phase 2: will scale solutions to 15 districts, using innovation scorecards to track progress and tax rebates (5–15%) to incentivize adoption.
Accountability will be ensured by the Ethiopian Tourism Transformation Council (ETTC), which will conduct quarterly reviews and publish public dashboards tracking connectivity improvements and tourist satisfaction. This plan leverages existing programs (rural electrification) and aligns with initiatives like AfDB’s Digital Skills for Tourism to ensure feasibility.
Supplementary Material
The following supporting information can be downloaded at the website of this paper posted on Preprints.org, The supplementary material is included alongside the manuscript.
Authors' Contribution
Both authors (Mengistu Matino and Prof. J. Ravi) have an equal contribution, especially in developing "Conceptualization, Methodology, Software, Validation, Formal Analysis, Investigation, Resources, Data Curation, Writing – Original Draft Preparation, Writing – Review & Editing, Visualization, Supervision, Project Administration, and Funding Acquisition."
Funding
This research received no external funding.
Institutional Review Board Statement
Not applicable
Informed Consent Statement
Not applicable.
Data Availability Statement
The data presented in this study are available and provided upon reasonable request from the corresponding author due to the rule of business secrecy.
Acknowledgments
During the preparation of this manuscript, the authors used AMOS, SEM, SPSS, and Process Macro for the purposes of moderation. The authors have reviewed and edited the output and take full responsibility for the content of this publication.
Conflicts of Interest
The authors declare no conflict of interest.
References
- 29 View of Tourism Industry In Ethiopia With Special Reference To Economic Perspectives And Government Initiatives.pdf. (n.d.).
- 58 africa-annual-review-fy24-reflections-v2.pdf. (n.d.).
- Abebe, A., & Kegne, M. (2023). The role of microfinance on women’s entrepreneurship development in Western Ethiopia evidence from a structural equation modeling: Non-financial service is the way forward. Cogent Business and Management, 10(3). [CrossRef]
- Adolph, R. (2016). 済無No Title No Title No Title. 1–23.
- AfDB. (2024). African Economic Outlook 2024 | African Development Bank Group. African Development Bank. https://www.afdb.org/en/documents/african-economic-outlook-2024.
- African Development Bank Group. (2013). Annual Development Effectiveness Review. www.afdb.org.
- Ageru Yilma, Z., Reta, M. M., & Tefera, B. T. (2016). The Current Status of Ecotourism Potentials and Challenges in Sheko District, South-Western Ethiopia. Journal of Hotel & Business Management, 05(02). [CrossRef]
- Alamineh, G. A., Hussein, J. W., Endaweke, Y., & Taddesse, B. (2023). The local communities’ perceptions on the social impact of tourism and its implication for sustainable development in Amhara regional state. Heliyon, 9(6), e17088. [CrossRef]
- Alamineh, G. A., Hussein, J. W., Mulu, Y. E., & Taddesse, B. (2023). The negative cultural impact of tourism and its implication on sustainable development in Amhara Regional State. Cogent Arts and Humanities, 10(1). [CrossRef]
- Ayalew, M. M., Lodamo, T. L., & Yimam, S. W. (2023). Inter-organizational Cooperation , Financial Constraints and Innovation : Evidence from Large Manufacturing Companies. 15, 69–88.
- Bayih*, B. E., & Singh, D. A. (2020). Exploring Domestic Tourism in Ethiopia: Trends, Prospects, Promotional Marketing, and Challenges. International Journal of Recent Technology and Engineering (IJRTE), 8(6), 2675–2688. [CrossRef]
- Bekele, S. T., & Dinku, R. A. (2024). Ecotourism Dynamics : Mapping Potentials and Overcoming Challenges in Ethiopia. 12(1), 1–22.
- Degefa, A. K., & Alemayehu, M. H. (2023). Review on ecotourism potentials, challenges and opportunities in Ethiopia. Journal of Hospitality Management and Tourism, 14(1), 1–9. [CrossRef]
- Finance Corporation, I. (2023). Ifc 2023 Annual Report Leadership Perspectives Results Strategy in Action Critical Functions Building Building Ifc 2023 Annual Report Leadership Perspectives Results Strategy in Action Critical Functions Contents. www.ifc.org/AnnualReport.
- Finlay, K., & Barnabas, S. (2012). Cultural tourism and identity : rethinking indigeneity. In Cultural Tourism and Identity: Rethinking Indigeneity (Vol. 24).
- Gidey, E., Mhangara, P., Birhane, E., Dikinya, O., Lottering, R., Hishe, S., Zenebe, A., Girma, A., Nasir, J., Addisu, A., Asmamaw, D., & Zeleke, T. (2024). Ecotourism suitability mapping and analysis in Tigray–Northern Ethiopian highlands. Journal of Ecotourism. [CrossRef]
- Globocnik, D., & Holzmann, P. (2024). Sustainability-related product satisfaction – Development and application of a multi-dimensional measurement instrument. Journal of Cleaner Production, 448(May 2023), 141567. [CrossRef]
- Graduate Studies Sites : the Media of Communication in Focus Tourist Sites : the Media of Communication in. (2014).
- Harsono, I. (2024). Green Development in Indonesia: Socioeconomic Impacts, Environmental Effects, and the Role of Social Entrepreneurship. International Journal of Business, Law, and Education, 5(1), 412–430. [CrossRef]
- Jemiluyi, O. O., & Jeke, L. (2023). Tax revenue mobilization effort in Southern African Development Community (SADC) bloc: Does ICT matter? Cogent Economics and Finance, 11(1). [CrossRef]
- Kanire, E., Msuya, E., & Alphonce, R. (2024). Shaping the Future Trajectory of Dairy Processing Industries in Tanzania through Eco-Commercial Dairy Farms’ Strategy. African Journal of Empirical Research, 5(3), 348–369. [CrossRef]
- Kassahun, A., Yimam, S. M., Muanenda, Y. S., Ali, B. M., & Yalew, S. G. (2024). Uncovering the priorities of scientific research on sustainable development goals: A case study in Ethiopia. Sustainable Development, April, 6215–6240. [CrossRef]
- Kwakwa, P. A. (2024). Demand for international tourism in Africa: the role of financial development, trade openness, natural resources, and quality environment. Cogent Business and Management, 11(1). [CrossRef]
- Lin, D., & Zhao, Y. (2023). The Impact of Environmental Regulations on Enterprises’ Green Innovation: The Mediating Effect of Managers’ Environmental Awareness. Sustainability (Switzerland), 15(14). [CrossRef]
- Mahajan, R., Kumar, S., Lim, W. M., & Sareen, M. (2024). The role of business and management in driving the sustainable development goals ( SDGs ): Current insights and future directions from a systematic review. March 2023, 4493–4529. [CrossRef]
- Mebratu, T. (2024). Assessment of Constraints and Farmers ’ Perception in Production and Marketing of Improved Forages in the Southern Ethiopia. 4(5), 583–586.
- Nene, S. (2024). Regional Integration in Africa: Progress of Agenda 2063. Studia Mundi – Economica, 11(2), 17–28. [CrossRef]
- Otaboyev, U. (n.d.). The role of international organizations and education in the development of tourism potential of countries.
- Outlook, C. E. (2024). 2024 UNCTAD survey on the creative economy: National agencies and strategies. Creative Economy Outlook 2024, 116–122. [CrossRef]
- Pearl, P., & Sifolo, S. (2024). Leveraging Online Digital Technologies for Sustainability in Community- Based Rural Tourism. 2(46).
- Pencarelli, T. (2019). The digital revolution in the travel and tourism industry. Information Technology & Tourism, 0123456789. [CrossRef]
- Release, N. (2024). ECOBANK REPORTS HALF YEAR 2024 PROFIT BEFORE TAX OF $ 324M , DILUTED EPS OF 0 . 64 US CENTS ON NET REVENUE OF $ 994M .
- Setegn, A. E., & Japee, G. P. (2025). Promotional elements and the performance of tourism marketing of visitor attraction places with the mediating role of public relations: empirical evidence from visitors in Ethiopia. Cogent Business and Management, 12(1). [CrossRef]
- Sitas, R., Pollio, A., & Sebarenzi, G. A. (2022). Politics and Silicon. May. [CrossRef]
- Sonia, C., & Hania, C. (2023). Digital Business Incubators and Digital Entrepreneurship: The case of Digital Incubation Center in Qatar. Croatian Review of Economic, Business and Social Statistics, 9(1), 33–50. [CrossRef]
- St Barbara Limited ACN. (2024). Annual Report 2024. Fresenius.Com, September, 105.
- Tadesse, B. (2024). The Impacts of the African Growth Opportunity Act on the Economic Performances of Sub-Saharan African Countries: A Comprehensive Review. Sci, 6(1). [CrossRef]
- Tesfaye, B. F. (2024). BEYOND RURAL TO URBAN Examining Urbanization and Quality of Life in Hawassa , Ethiopia.
- Tochukwu Ignatius Ijomah, Courage Idemudia, Nsisong Louis Eyo-Udo, & Kikelomo Fadilat Anjorin. (2024). Innovative digital marketing strategies for SMEs: Driving competitive advantage and sustainable growth. International Journal of Management & Entrepreneurship Research, 6(7), 2173–2188. [CrossRef]
- World Bank, 2024. (2018). Middle - income trap & development : In Red Flags: Why Xi’s China is in Jeopardy.
- Wudie, A. A. (2018). Tourism and hospitality in Ethiopia’s development Agenda: Action for sustainable economic growth. Handbook of Research on Sustainable Development and Governance Strategies for Economic Growth in Africa, April, 398–415. [CrossRef]
- Yasin, A. S., Gebbisa, M. B., & Bacsi, Z. (2024). Sustainable rural tourism development in Ethiopia : Leveraging economic growth , infrastructure improvements , and cultural heritage Sustainable rural tourism development in Ethiopia : Leveraging economic growth , infrastructure improvements , and cultura. December. [CrossRef]
Figure 1.
Moderation Diagram.
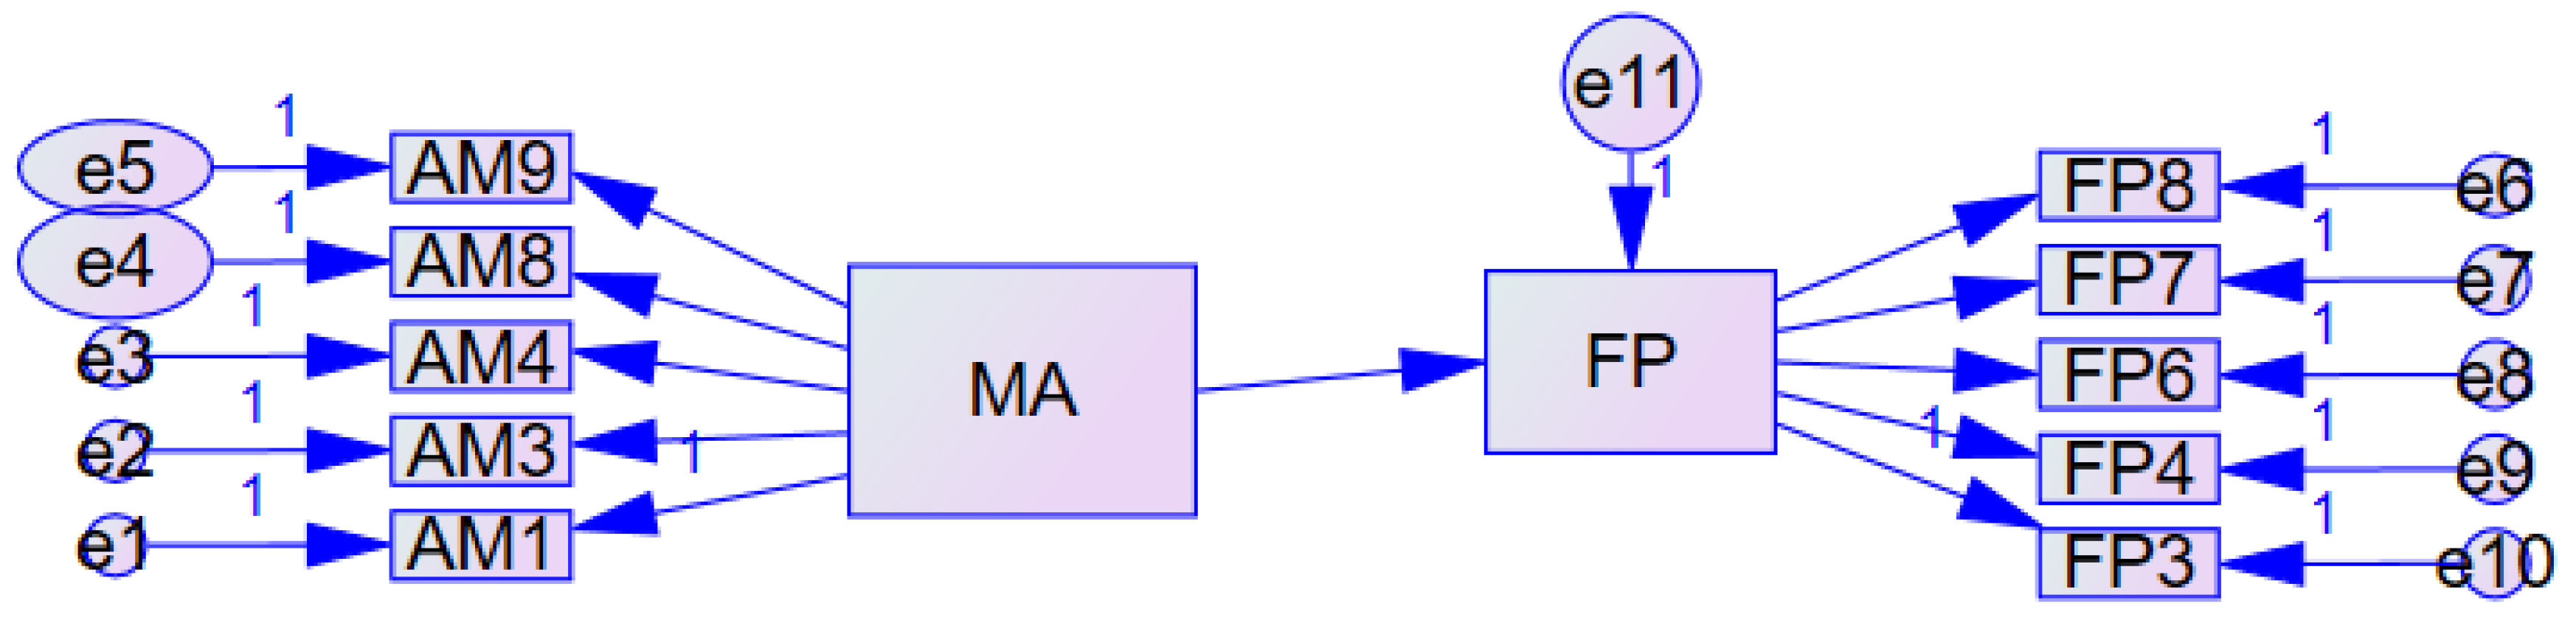
Table 1.
Demographic and business characteristics of respondents (N = 300).
| Items | Category | Frequency | Percent (%) |
|---|---|---|---|
| Gender | F | 26 | 8.7 |
| M | 274 | 91.3 | |
| Age(years) | 26-35 | 36 | 12.0 |
| 36-45 | 188 | 62.7 | |
| >45 | 76 | 25.3 | |
| Marital status | Married | 278 | 92.7 |
| Single | 22 | 7.3 | |
| Educational Level | Bachelor | 186 | 62.0 |
| Diploma | 10 | 3.3 | |
| Masters | 86 | 28.7 | |
| Ph.D. | 18 | 6.0 | |
| Business type | Hotel Industry | 215 | 71.7 |
| Tour operation | 85 | 28.3 | |
| Dependents | 0-3 | 146 | 48.7 |
| 4-7 | 139 | 46.3 | |
| >7 | 15 | 5.0 | |
| Monthly Revenue (ETB) | 12000-39999 | 195 | 65.0 |
| 40000-60000 | 54 | 18.0 | |
| >60000 | 51 | 17.0 | |
| Experience | 1-5 | 68 | 22.7 |
| 6-10 | 163 | 54.3 | |
| >11 | 69 | 23.0 |
Source: Data collected in 2025 and calculated.
Table 6.
Estimation of Model Parameters.
| Relationship | Estimation | SE | CRs | P | Label |
|---|---|---|---|---|---|
| FP → MA | .237 | .099 | -2.398 | .016 |
Source: MAOS 25, 2025 survey data.
Table 7.
Moderating effect of innovation on the relationship between market accessibility and financial performance (N = 300).
Table 7.
Moderating effect of innovation on the relationship between market accessibility and financial performance (N = 300).
| Variable | Coefficient (β) | SE | t-value | p-value | 95% LLCI | 95% ULCI |
|---|---|---|---|---|---|---|
| Constant | 66.846 | 18.438 | 3.626 | <0.001 | 30.560 | 103.133 |
| Market Accessibility (MA) | 0.590*** | 0.112 | 5.278 | <0.001 | 0.370 | 0.809 |
| Innovation (I) | 0.259*** | 0.026 | 10.009 | <0.001 | 0.208 | 0.310 |
| MA × I Interaction | -0.001*** | 0.0001 | -4.511 | <0.001 | -0.001 | -0.0004 |
| Model Summary: R = 0.645, R² = 0.417, MSE = 4502.52, F(3,296) = 70.41, p < 0.001 | ||||||
| Interaction Test: ΔR² = 0.040, F(1,296) = 20.35, p < 0.001 | ||||||
| *Notes: SE = standard error; LLCI/ULCI = lower/upper level confidence interval. **p < 0.001. | ||||||
Disclaimer/Publisher’s Note: The statements, opinions and data contained in all publications are solely those of the individual author(s) and contributor(s) and not of MDPI and/or the editor(s). MDPI and/or the editor(s) disclaim responsibility for any injury to people or property resulting from any ideas, methods, instructions or products referred to in the content. |
© 2025 by the authors. Licensee MDPI, Basel, Switzerland. This article is an open access article distributed under the terms and conditions of the Creative Commons Attribution (CC BY) license (http://creativecommons.org/licenses/by/4.0/).
Copyright: This open access article is published under a Creative Commons CC BY 4.0 license, which permit the free download, distribution, and reuse, provided that the author and preprint are cited in any reuse.


