
Submitted:
29 May 2025
Posted:
03 June 2025
You are already at the latest version
Abstract
The Baikal region, including areas with poor environmental conditions, has significant clean background zones. In summer of 2023, we analyzed physical and chemical parameters of aerosol particles with different size fractions at Irkutsk and Listvyanka monitoring stations. Reduced wildfires and minimal impact from fuel and energy industries allowed us to observe regional and transboundary pollution transport. A large data array indicated that, during the shift of cyclones from Mongolia to the south of the Baikal region, the concentrations of Na⁺, Ca²⁺, Mg²⁺, K⁺, and Cl⁻ ions increased at the Irkutsk station, dominated by NH₄⁺ and SO₄²⁻. The growth of the ionic concentrations at the Listvyanka station was observed in aerosol particles during the northwesterly transport. When air masses arrived from the southerly direction, the atmosphere was the cleanest. Analysis of 27 elements in aerosols revealed that Al, Fe, Mn, Cu, and Zn made the greatest contribution to air pollution at the Irkutsk station, while Fe, Al, Cu, Cr, Mn, and Ni – at the Listvyanka station. The dynamics of the investigated elements was mainly due to natural processes in the air under various synoptic situations and weather conditions in the region, although anthropogenic factor also affected the formation of aerosol composition wth certain directions of air mass transport.
Keywords:
aerosol
; ions
; particles
; trace elements
; transfer of air masses
1. Introduction
The study of the chemical composition of atmospheric aerosols is an important area of climate science. Aerosols play a key role in climate processes, air quality, and human health [1,2]. In recent decades, much attention in the study of atmospheric aerosols has been paid to such issues as its formation and impact on the state of the air, especially in the study of natural processes and anthropogenic impact on the world population [3,4]. Synoptic processes play an important role in the chemical composition formation of atmospheric aerosols [5,6]. Movable pressure patterns can contribute to the long-range transport of pollutants. This is relevant both for regions with high-degree anthropogenic impact and background areas [7,8].
The Baikal region of East Siberia allocates clean background areas of special environmental significance (Lake Baikal, natural reserves, wildlife sactuaries, and national parks) along with areas with unfavourable environmental condition caused by emissions from large local industrial agglomerations and transregional transport of air pollutants [9].
The chemical composition of atmospheric aerosols in the Baikal region, one of the most dynamic air components, significantly depends on micro- and mesoclimatic features of the area and the nature of synoptic processes associated with them. The development of movable pressure patterns under certain synoptic and meteorological conditions, especially in winter, contributes to the regional-scale transport of air pollutants, mainly from the industrial complexes of the Baikal region, to clean background areas [10,11,12]. In contrast, the stabilization of a homogenous air mass during blocking processes over Mongolia, Europe, and Atlantic causes low concentrations of atmospheric aerosols is some areas of this region [13]. Stationary sources are the main air pollutants in the Baikal region and the Central Ecological Zone (CEZ) of Lake Baikal, with their contribution >90% [14]. Smog from wildfires, the role of which has been increasing in the past decade, has a significant impact on the physical characteristics and chemical composition of aerosols in the Southern Baikal region. Wildfires increase mass and number concentrations of aerosols, the concentrations of ions, elements, and polyaromatic compounds (PAHs) in their composition [15,16].
The first studies of the chemical composition of atmospheric aerosols in the air basin of the Baikal region were undertaken in 1974 [17]. More detailed studies of the physical and chemical characteristics of atmospheric aerosols have been conducted since the early 90s of the past century [18].
The ionic composition of atmospheric aerosols has been continuously studied since 2001 at two air monitoring stations in the Southern Baikal region: one is located in the urban area of the city of Irkutsk, and another–in the rural area of the Listvyanka settlement. These stations are part of the international Acid Deposition Monitoring Network in East Asia (EANET) [19]. The study of the elemental composition of atmospheric aerosols has also become an important aspect. Elements of terrigenous origin (such as Al, Fe, Ca, Mg, and Na) and technogenic pollutants (As, Sb, Zn, Pb, and Cr) have different distribution depending on the season and pollution sources, which confirms the need for the comprehensive approach to the study of the chemical composition of aerosols, taking into account their size fractions [20]. Currently, the study of the chemical composition of atmospheric aerosols has an important practical application because the air pollution in the Baikal region exerts a direct influence on the air basin and water composition in Lake Baikal as well as the water formation in its tributaries, up to 40% of which are fed through the air [21]. Modern studies also draw attention to the need to model data on the chemical composition of atmospheric aerosols. Verification of air quality models based on the experimental data becomes an important tool for predicting the state of the air basin in the Baikal region [22,23].
Previous long-term studies of the chemical characteristics of aerosols (ions, elements, and PAHs) in the Baikal region were carried out mainly in the total mass of the aerosol particles; therefore, information about the chemical composition of particles depending on the size spectrum was extermely limited [16]. According to Interfax, thanks to the cold front and a large amount of precipitation, the number of wildfires in the region decreased almost by a factor of 1.8 in 2023, with a decrease in wildfire area by a factor of 15.2 compared to 2022 [24]. In this regard, during the warm season of 2023, for the first time at the Irkutsk and Listvyanka monitoring stations, conducted a detailed analysis of the physical parameters, as well as the ionic and elemental composition of particles across different size fractions. Additionally, identified the sources of their formation based on specific wind directions and air mass trajectories in the study area. These observations allowed us to exclude the active impact of the fuel and energy complex and smog from wildfires on the air quality and the composition of atmospheric aerosols, as well as to trace regional transport of air pollutants to the southern basin of Lake Baikal from various pollution sources in the Baikal region, along with long-range transboundary transport.
2. Materials and Methods
2.1. Sampling Stations
The Irkutsk and Listvyanka stations are located in the south of East Siberia in the center of the Asian continent (Figure 1). Irkutsk, an administrative center of the Irkutsk Region with the population of ~600 thousand people and a developed urban infrastructure, is located on the banks of the Angara River and on the main transport routes connecting Europe with the Far-Eastern regions of Russia and the countries of the Asia-Pacific region. The Irkutsk urban air monitoring station (52.14 N, 104.15 E; 400 m a.s.l.) is situated in the southwestern part of the city on the territory of Limnological Institute SB RAS at an altitude of ~10 m ground level [19].
The Listvyanka settlement with a population of ~2 thousand people is located on the southwest coast of Lake Baikal, 70 km from Irkutsk. Listvyanka, a tourist settlement with an actively developing infrastructure, stretches along the coastline for a distance of up to 6 km. This area is limited from the Angara River source by crests of the Primorsky Range with predominant heights of 900-1000 m. The settlement has many point sources of air pollution, such as small boiler facilities and stove heating systems. There is also an intensive growth of land and water transport traffic. Between April and September, wildfires in Siberia have a significant impact on the change in the physical and chemical properties of the ground-level atmosphere [15,16].
The Listvyanka air monitoring station (51.50 N, 104.53 E) is situated above the settlement on the coastal hill 200 m above the level of Lake Baikal (670 m a.s.l.), on the territory of the Astrophysical Observatory of Institute of Solar-Terrestrial Physics SB RAS. The higher altitude location of the station than the settlement allows avoiding the influence of its vital activity and tracing the regional transport of air pollutants in the CEZ of the southern basin of Lake Baikal.
Despite the physiographic differences in the location of the stations and the degree of anthropogenic impact, the chemical composition of aerosols in Irkutsk and Listvyanka depends mainly on the same sources: soil erosion aerosol, transport, and frequent wildfires in the warm period as well as heating facilities and transport in the cold period. The calculated frequency of air mass transport indicated the predominant influx of air masses into the city from the west and northwest. The trajectories of this direction averaged 60% [25]. Sources common to all modern cities mainly form the chemical composition of urban aerosols: transport and industry emissions, transboundary transport, gas-phase transitions, and soil erosion factor. Approximately 10% of emissions from the Irkutsk pollution sources enter the air basin of Lake Baikal and deposit in the lake’s waters. In case of long-term influx of air masses from the northwesterly and westerly directions and a wind speed of 3-10 m s-1, air pollutants reach the water area of Lake Baikal in 2-6 hours.
2.2. Sampling
To identify the “marker substances” in the air above Irkutsk during the unheated period (from 5 May to 5 September 2023), daily sampling of atmospheric aerosols with particle sizes of 0.8, 2.0, 5.0, and 10 µm was carried out. Samples were collected using an IKS-10 cascade impactor (Russia, Ekaterinburg) with a volume flow rate of 10 L/min onto Whatman-41 filters. At the Listvyanka station, sampling was carried out from 22 May to 8 September using a TE-Wilbur low volume air sampler system from Tisch Environmental (USA, Cleves) with a volume flow rate of 16.7 L min-1, which allows sampling particles <2.5 µm.
2.3. Determination of Physical and Chemical Parameters of Atmospheric Aerosols
2.3.1. Determination of Mass Concentration of Aerosols
To study the total number concentration and particle size distribution of microdisperse aerosol fraction, a Handheld 3016 IAQ particle counter from Lighthouse (USA) was used, which allow measuring particle sizes in six channels (0.3, 0.5, 1.0, 2.5, 5.0, and 10.0 m) and displaying differential data on the number of particles. Air was pumped with an internal pump at a rate of 2.8 L/min. The measurement accuracy was ~5%. Measurements were taken hourly [16]. The variability of aerosol particle concentrations depends on wind direction, possible turbulent eddies, and the arrival of air masses from different sources of atmospheric emissions. In this regard, three-day back trajectories of air mass transport arriving in the study area from the altitudes of 500, 1000 and 1500 m were analyzed. Data for back trajectory analysis based on Hybrid Single Particle Lagrangian Integrated Trajectory Model (HYSPLIT) were used from the US National Oceanic and Atmospheric Administration website [27].
2.3.2. Determination of the Chemical Composition of Aerosol Particles
To ensure complete extraction of NH4+, K+, Na+, Ca2+, Mg2+, Cl-, NO2-, NO3-, and SO42- ions, aerosol filters were processed in an ultrasonic bath. The filters were placed in test tubes, with an addition of 10.0 mL of deionized water by weighing, and further processed in an ultrasonic bath. The extract after filtration was used to determine ions and to measure the pH value. The ionic composition of aerosols was analysed on an ICS-3000 ion chromatography system (Dionex Corporation, Sunnyvale, California, USA). Analytical column IonPac AS19 (2x250mm) was used. To determine anions, and IonPac CS12A (2x250mm)–cations [16]. The generation of eluents allows for the analysis of anions and cations at the trace level.
Twenty-seven trace elements (Li, Be, B, Al, Ti, V, Cr, Mn, Fe, Co, Ni, Cu, Zn, As, Se, Sr, Mo, Cd, Sn, Sb, Ba, W, Pb, Th, U, Ag, and Tl) were determined through inductively coupled plasma mass spectrometry using an Agilent 7500 ce mass spectrometer (Agilent Scientific Instruments, Santa Clara, California, USA). The method suggested extraction of pollutants collected from a filter with a mixture of concentrated nitric acid and strong hydrogen peroxide at a temperature of 950С, according to the technique for the determination of metals in solid environmental objects [28,29]. The resulting extract was diluted with ultrapure water from the Sartorius arium®mini system (Sartorius, Göttingen, Germany), followed by chemical analysis ([30].
3. Results and Discussion
3.1. Meteorological Parameters
Meteorological parameters of local and regional scale have a significant influence on the transport and spatiotemporal variability of air pollutant concentrations. The three-day back trajectories identified the following wind directions in observation areas. At the Irkutsk station, in up to 70% of cases for the entire observation period air masses arrived at the observation area from the north (N), northwest (NW), and west (W); in 22% of cases – from the southwest (SW), south (S), and southeast (SE). Near the Listvyanka station, air masses from the northwest (29%), southwest, south, and southeast (23%), and from the north and northeast (21%) dominated in the summer.
Table 1 presents statistics of wind directions and speeds in four sectors as well as the frequency of calms (<0.5 m/s) at stations during the warm season of 2023. Meteorological parameters were measured using an automatic certified Sokol-M weather station (Russia). In Irkutsk and Listvyanka (at an altitude of 200 above the lake), wind characteristics are similar: northwesterly winds with maximum average speeds prevail, and southeasterly winds from the lake are ranked second.
Figure 2 shows the synoptic situation on 12 June 2023 and on 6 August 2023 as an example of a large-scale northwesterly (NW) transport to Lake Baikal from the Irkutsk-Angarsk industrial complex. In the first case (Figure 2a), we observed one of the highest wind speeds both in Irkutsk and Listvyanka as well as one of the maximum air pollution levels. This figure also demonstrates a reversal of the northwesterly wind over the lake to the southwesterly wind. The second case (Figure 2b) shows the low air pollution level.
Precipitation is another important factor influencing the air pollutant concentration. The rate of the air purification from pollutants depends on its amount and intensity. Table 2 presents the statistics of precipitation for the study period of 2023.
3.2. Physical Characteristics of Atmospheric Aerosol
Optical methods are commonly used to determine the microphysical characteristics of aerosol particles. Theses methods provide good sensitivity to submicron particles [31]. To study the total number concentration and the distribution of particles by sizes of the microdisperse aerosol fraction, a Handheld 3016 IAQ particle counter (Lighthouse, Fremont, California, USA) was used, which can count particles through six channels (>0.3, >0.5, >1, >2.5, >5, and >10 μm) and display the differential particle count data (Golobokova et al., 2020). Measurements were carried out hourly at the Irkutsk station. We calculated standard aerosol mass concentrations corresponding to average particle diameters, d < 1.0, 2.5, and 10 µm (the average particle density of soil aerosols amounting to 2 g/cm3 was used for calculations in the urban air). Table 3 presents the calculation data.
The aerosol mass concentration at the Irkutsk station was rather stable during the study period. The ratio of submicron particle concentrations at the Irkutsk station to large particles varied within 10-30%. This corresponds to the predominance of soil particles in the urban air.
Measurements of aerosol mass concentrations at the Listvyanka station in the summer of 2021 indicated that it varied from 5 to 32 µg/m3 for particles of 2.5 μm and from 9 to 36 µg/m3 for particles of 10 μm. These values were comparable with those at other rural stations but lower than at urban stations [32]. The total aerosol mass concentration in Listvyanka during the warm period of 2023 was lower than in 2021 (see Table 3). Similar to the Irkutsk station, from July to September, the values of aerosol mass concentration were stable. Previous study indicated a growth of coarse aerosol particles at the station after the heating season [32]. The increase in particle size is associated with an increase in temperature and relative humidity during the open water period of a large water body (Lake Baikal).
3.3. Ionic Composition of Atmospheric Aerosols
3.3.1. Ionic Composition of Atmospheric Aerosols at the Irkutsk Station
Data on the concentrations of the ionic composition of aerosols at the Irkutsk station shown in Table 4 were grouped for each particle size.
NH4+, Ca2+, Cl-, and SO42- were major ions in aerosols of different size fractions. The empirical rule allowed us to identify potential differences in the ion concentration variability. For this purpose, we compared the mean ionic concentrations in particles of different sizes with the limits of standard deviation from the mean. The comparison indicated that in 83% of cases, the ionic concentrations in aerosols of different fractions were within the range of one standard deviation. The concentrations of SO42- Na+, NH4+, Ca2+, and Cl- ions on submicron particles (0.8 μm), as well as Na+, NH4+, Ca2+, and Cl- ions in the particle range of 5 μm, were detected within two standard deviations. This testifies to both local influx of pollutants into the air at stations and regional transport. The lifetime of aerosol particles in the troposphere, depending on the particle dispersion and their physicochemical properties, varies from several months to days. The largest aerosol particles with r>10 μm exist less than a day [33].
The ionic concentrations in coarse-dispersed aerosols (5-10 μm) mainly increased at the Irkutsk station when air masses arrived from the northerly and easterly directions, i.e. from a large thermal power plant and the central areas of the city where industrial enterprises are located. When air masses shifted from the southerly to southwesterly directions, the air was the cleanest. There is a forest area in this direction from the monitoring station (Figure 3).
To assess the anthropogenic impact on the chemical composition of aerosol, we calculated enrichment factors (EF) for particles of individual fractions with specific ions ([34]:
where EFi was the enrichment factor, and (Ci/E) was the ratio of the concentration of the i-th element and the reference element (E) in aerosols (aer) and in the substance of a likely source–seawater (sw). Na+ was used as a reference element for ions; the data on the seawater composition were taken from [35].
EFi = [(Ci/E)aer] / [(Ci/E)sw]
K+, Ca2+, and SO42- ions showed elevated EF (mean 12-44), reaching 165 for large particles (5-10 μm), with the maximum values for Са2+ ions. EF for K+ ions, the main source of which is bottom ash waste from coal combustion at thermal power plants, predominated over EF for SO42- ions. Mg2+ and Cl- ions were mainly of natural origin (EF 1-10).
Submicron aerosols (0.8 μm) analyzed at the stations belonged to long-range transport aerosols, for example, formed in areas of Krasnoyarsk Krai and the western part of the Irkutsk Region. Gas-phase reactions in the atmosphere, as well as soil, are the sources of these aerosols. They also formed in Mongolia because analysis of atmospheric microcirculation characteristics revealed a significant increase in the frequency of cyclones moving from Mongolia to the Baikal region [36].
Of great interest in the study of aerosols from Mongolia during the warm season are dust storms, the frequency of which for the past decade was the highest in 2023 [37,38]. The resulting temperature inversion allows dust aerosols to be transported over long distances [39]. When air masses arrived from the central and western parts of Mongolia, with the southerly direction, the concentrations of Na+, Ca2+, Mg2+, K+, and Cl- ions increased in fine aerosols at the Irkutsk station, with a predominance of NH4+ and SO42- (see Figure 3).
3.3.2. Ionic Composition of Atmospheric Aerosols at the Listvyanka Station
Daily sampling of aerosol particles was carried out at the Listvyanka station using a cascade impactor from Tisch Environmental (USA) for particles of 2.5 μm and smaller. These particles easily penetrate biological barriers and pose the greatest threat to living organisms. NH4⁺, Ca²⁺, NO3⁻, and SO4²⁻ were major ions in aerosols of this size fraction. The ionic concentrations were in the range of one standard deviation in 88% of cases. The concentrations of NH4⁺, Ca²⁺, and K⁺ were the most frequent in the range of two standard deviations.
From 6 to 19 July 2023, we recorded the highest total concentration of ions, with maximums on 6-7 July (3.52 µg/m3), 11-12 July (3.90 µg/m3), and 18-19 July (3.16 µg/m3), as well as on 14-15 August (3.10 µg/m3). Under elevated ionic concentrations, northwesterly and north-northwesterly winds prevailed. In August, despite heavy precipitation, total ionic concentrations increased with increasing northwesterly winds. Table 5 and Figure 4 show the distribution of the mean ionic concentrations at the Listvyanka station for different air mass directions.
The ionic concentrations in aerosol particles at the Listvyanka station mainly increased when air masses were transported from the northerly and southwesterly quarters along the Angara River valley. When air masses arrived from the southerly direction, the atmosphere was the cleanest. The presence of a large water body (Lake Baikal) contributed to the purification of the atmosphere from air pollutants in this direction.
Analysis of EFs of aerosol particles at the Listvyanka station indicated that Mg2+ and Cl- ions with values from 1 to 3 were of natural origin. K+, Ca2+ and SO42- ions had higher EFs, with the mean values higher than in urban aerosols (mean 41-122). K+ and SO42- ions had the highest EF values. The main transport of air pollutants to the southern basin of Lake Baikal recorded at the Listvyanka station comes from the enterprises of the Irkutsk-Cheremkhovo industrial agglomeration along the Angara River valley through mesoscale boundary-layer jet transports [10].
3.3.3. Elemental Composition of Atmospheric Aerosol at the Irkutsk and Listvyanka Stations
Analysis of trace element concentration in the atmospheric aerosol of Irkutsk revealed the highest concentrations on the particles of 5.0 and 10 µm when air masses were transported from the westerly and northerly directions. We detected elevated concentrations of elements on the particles of 0.8 and 2.0 µm when air masses arrived from the northwesterly and westerly directions. Low concentrations of elements on the particles of all sizes were identified in atmospheric aerosols that arrived with air masses from the southerly quarter directions.
The enrichment factors (EF) of aerosol particles with microelements were calculated using Equation 1 relative to aluminum (Al) as the reference element. EFs of aerosol particles below ten allowed us to combine Li, Be, Al, Ti, V, Mn, Fe, Co, Sr, Th, and U elements into the terrigenous origin group. B, Cr, Cu, Zn, As, Se, Mo, Cd, Sn, Sb, W, Ag, Pb, and Bi with EFs much greater than ten were included into the technogenic origin group. B, Se, and Sb had the highest EFs (EF = 700-4400). Large particles (5.0 and 10 µm) from local pollution sources, regardless of air mass direction, made the greatest contribution to air pollution with these elements. The group with mixed terrigenous and non-terrigenous origin included Ba (EF = 2-19) and Ni (EF = 7-49). EFs of aerosol particles containing Ba from almost all air mass directions were elevated on the particles of 0.8 and 2.0 µm. Elevated EFs of Ni were more often observed on the particles of 2.0, 5.0, and 10.0 µm when air masses arrived from the northwesterly direction; the particles <0.8 µm showed the highest enrichment of Ni.
The atmospheric aerosol at the Listvyanka station most often showed an increase in the concentrations of trace elements and their total amount when air masses arrived from the north and northeast. We also recorded an increase in the total amount of trace elements when air masses arrived from the southeast and northwest. The minimum of trace elements was recorded when air masses arrived from the west.
Analysis of EFs of aerosol particles with trace elements at the Listvyanka station, which accounted for 1-3, allowed us to classify Li, Be, Al, Ti, V, Mn, Fe, Co, Sr, Ba, Th, and U elements as the terrigenous origin group. Ni, Cu, and W elements were classified as the mixed origin group. Although EFs of these elements were below 10, they often increased and reached 11-72 for Cu and 11-37 for W when air mass transport was from W, WNW, NW, N, and NE as well as 11-67 for Ni with air mass transport from SE and SW. Most trace elements (48%) in the aerosols of Listvyanka, such as B, Cr, Zn, As, Se, Mo, Cd, Sn, Sb, Ag, Pb, and Bi, were included in the mixed or technogenic origin group.
Elements of terrigenous origin, such as Al, Fe, and Mn, made the predominant contribution to the trace element composition of aerosols calculated using formula (2) at the Irkutsk station. Among elements of technogenic origin, Cu and Zn showed the highest values [40]:
where i is a constant for different hazard classes; Ci – concentration of a trace element in aerosol, MPCсс – average daily maximum permissible concentration of a trace element in the air of populated areas.
Contribution, % = [(Ci /MPCсс)i/ ∑(Ci /MPCсс)i]·100
Table 6 shows the contribution of the predominant trace elements in aerosols at the Irkutsk station. The contributions are presented in relation to the corresponding MPC value for a given trace element, according to the standards in force within the Russian Federation.
In terms of the mass contributions of a certain element in aerosol, Zn, B, Al, and Fe become priority elements by mass Table 7).
A similar analysis of data from the Listvyanka station indicated that terrigenous elements, such as Fe and Al, made the greatest contribution to the overall air pollution level; Cu, Cr, Mn, and Ni were the most noticeable among technogenic elements. Taking into account the mass of elements, the contribution of Al and Cr increased, while that of Fe decreased (Table 8). Thus, the contribution of trace elements to the overall level of air pollution at stations taking into account the pollution degree differs from the contributions taking into the mass of trace elements.
Despite some differences in concentrations, the set of elements that determine the highest air pollution at the Irkutsk and Listvyanka stations was similar. Figure 5 shows the mean concentrations in the atmosphere on particles with different size fractions in the two analyzed areas of the Baikal region.
Comparison of the results of the analysis of trace element composition in particles of different size fractions in the study areas revealed that, due to higher concentrations of elements of technogenic origin (Cr, Se, Cd, Pb, and Ag), the total amount of trace elements in atmospheric aerosols ranged from 2.0 to 2.5 µm was higher at the Listvyanka station (333 ng/m3) than at the Irkutsk station (308 ng/m3). In Irkutsk, we observed some difference in the elemental composition of large particles (10 µm) compared to other size fractions. For instance, the concentrations of Mn, Cu, Cd, and Ag were higher in the coarse-dispersed fraction, which indicates local sources of their influx into the city’s atmosphere. On the contrary, the concentrations of Be, As, Sb, Ba, Pb, V, Mo, and U were higher in the fine fraction (0.8 and 2.0 µm) than in large particles (10 µm), suggesting their transport to the observation area from more distant regional sources of air pollution.
4. Conclusions
During the warm season of 2023, we analyzed the physical parameters and the chemical composition of aerosol particles with different size fractions at two air monitoring stations in the Southern Baikal region. A large data array on ionic and elemental composition of aerosol particles sized 0.8, 2.5, 5.0, and 10 µm at the Irkutsk station and 2.5 µm at the Listvyanka station revealed the main sources of their formation as well as differences in the chemical composition with certain wind directions and influx of air masses into the study area.
To confirm the impact of local, regional, and transboundary pollution sources on the composition of aerosol particles in the study areas, we calculated back trajectories of air mass motion. The northerly and northwesterly direction was predominant, which formed over industrial centers of East Siberia, amounting to 70% of cases for the Irkutsk station and up to 50% of cases for the Listvyanka station. During that period, ionic concentrations in coarse-dispersed aerosols (5-10 µm) increased, while air pollutants were transported from the nearby industrial pollution sources in the city and the large Novoirkutsk thermal power plant.
When cyclones shifted from Mongolia to the south of the Baikal region, submicron aerosols (0.8 µm) at the Irkutsk station showed an increase in the concentrations of Na⁺, Ca²⁺, Mg²⁺, K⁺, and Cl⁻ dominated by NH₄⁺ and SO₄²⁻. The cleanest air at the Irkutsk station was observed when air masses shifted from southerly to southwesterly directions, covering a forest area.
At the Listvyanka station, the ionic concentrations in aerosol particles of 2.5 µm increased during the northwesterly transport. When air masses arrived from the southerly direction, the atmosphere was the cleanest.
Analysis of 27 elements in aerosols allowed us to estimate the predominant contribution of trace elements to the overall air pollution level in the study area. Al, Fe, Mn, Cu, and Zn made the greatest contribution to air pollution at the Irkutsk station, while Fe, Al, Cu, Cr, Mn, and Ni – at Listvyanka station.
We conclude that the dynamics of the studied elements in atmospheric aerosol in the warm season is mainly due to natural atmospheric processes during meteorological fluctuations in the region. However, it should be noted that, with certain air mass transport directions, the antropogenic factor also has a significant impact on the formation of physical and chemical characteristics of aerosol in the Southern Baikal region during this period of the year.
Author Contributions
L.P. Golobokova, Conceptualization, Writing – review & editing, Writing – original draft, Visualization, Validation, Software, Investigation, Formal analysis, Data curation.T.V. Khodzher, Conceptualization, Funding acquisition, Project administration, Writing – review, Supervision, Visualization. V.A. Obolkin, Data curation, Methodology, Software, Writing. V.L. Potemkin, Writing, Formal analysis, Software, N.A. Onischuk, Formal analysis, Methodology, Validation.
Funding
This research was funded by the Russian Science Foundation (RSF) [grant number 19-77-20058].
Informed Consent Statement
Informed consent was obtained from all subjects involved in the study.
Acknowledgments
This study was supported by the project of the Russian Science Foundation (RSF) No. 19-77-20058 “Studies of the composition and spatiotemporal distribution of the aerosol-gas impurities in the Lake Baikal atmosphere”. The investigations were carried out using the equipment of the center of shared facilities “Atmosphere”, Institute of Atmospheric Optics Siberian Branch of the Russian Academy of Sciences. The analytical work was performed in the Collective Instrumental Center “Ultramicroanalysis” at Limnological Institute SB RAS.
Conflicts of Interest
The authors declare no conflict of interest.
References
- Zhang, R.-J.; Ho K., F.; Shen, Z.-X. The role of aerosol in climate change, the environment, and human health. Atmos. Ocean. Sci. Let. 2012, 5, 156–161. [Google Scholar] [CrossRef]
- Bell, M.L. Assessment of the health impacts of particulate matter characteristics. Res Rep Health Eff Inst Boston, Mass.; U.S.A. 2012, 161, 5–38. [Google Scholar]
- Wang, Y. Aerosol Effects on the Atmosphere: Types, Mechanisms and Future Perspectives. E3S Web of Conferences. 2025, 606, 03006. [Google Scholar] [CrossRef]
- Nie, X.; Yu, L.; Mao, Q.; Zhang, X. Study on global atmospheric aerosol type identification from combined satellite and ground observations. Atm. Environ. 2025, 347, 121100. [Google Scholar] [CrossRef]
- Wang, T.; Huang, X.; Wang, Z.; Liu, Y.; Zhou, D.; Ding, K.; Wang, H.; Qi, X.; Ding, A. Secondary aerosol formation and its linkage with synoptic conditions during winter haze pollution over eastern China. Sci. Tot. Environ. 2020, 730, 138888. [Google Scholar] [CrossRef]
- Gu, S.; Wu, S.; Yang, L.; Hu, Y.; Tian, B.; Yu, Y.; Ma, N.; Ji, P.; Zhang, B. Synoptic Weather Patterns and Atmospheric Circulation Types of PM2.5 Pollution Periods in the Beijing-Tianjin-Hebei Region. Atmosphere 2023, 14, 942. [Google Scholar] [CrossRef]
- Liu, B.; Cong, Z.; Wang, Y.; Xin, J.; Wan, X.; Pan, Y.; Liu, Z.; Wang, Y.; Zhang, G.; Wang, Z.; Wang, Y.; Kang, S. Background aerosol over the Himalayas and Tibetan Plateau: observed characteristics of aerosol mass loading. Atmos. Chem. Phys. 2017, 17, 449–463. [Google Scholar] [CrossRef]
- Lund, M.T.; Myhre, G.; Samset, B.H. Anthropogenic aerosol forcing under the Shared Socioeconomic Pathways. Atmos. Chem. Phys. 2019, 19, 13827–13839. [Google Scholar] [CrossRef]
- Berkin, N.S.; Makarov, A.A.; Rusinek, O.T. Baikal Studies: Textbook; Publishing house of Irkutsk State University, Irkutsk, Russian Federation: 2009, 291, ISBN 978-5-9624-0355-7 (In Russian).
- Obolkin, V.A.; Shamansky, Yu.V.; Khodzher, T.V.; Falits, A.V. Mesoscale processes of atmospheric pollution transfer in the area of South Baikal. Oceanological research 2019, 47, 104–113. [Google Scholar] [CrossRef]
- Obolkin, V.; Molozhnikova, E.; Shikhovtsev, M.; Netsvetaeva, O.; Khodzher, T. Sulfur and Nitrogen Oxides in the Atmosphere of Lake Baikal: Sources, Automatic Monitoring, and Environmental Risks. Atmosphere 2021, 12, 1348. [Google Scholar] [CrossRef]
- Khuriganova-Berdashkinova, O.I.; Obolkin, V.A.; Golobokova, L.P.; Khodzher, T.V. Monitoring of Atmospheric Trace Gases in Urban and Rural Areas of the Baikal Natural Territory during 2019–2021. Russ. Meteorol. Hydrol. 2023, 48, 324–333. [Google Scholar] [CrossRef]
- Golobokova, L.P.; Latysheva, I.V.; Mordvinov, V.I.; Khodzher, T.V.; Obolkin, V.A.; Potemkin, V.L. Peculiarities in the chemical composition of atmospheric aerosol against the background of extreme weather conditions in Southern Siberia. Atmos.and oceanic optics. 2005, 18, 616–620. [Google Scholar]
- Ministry of Natural Resources of Russia. Available online: https://www.mnr.gov.ru›gosudarstvennye_doklady (accessed on 7 April 2025).
- Khodzher, T.V.; Zhamsueva, G.S.; Zayakhanov, A.S.; Dementeva, A. L.; Tsydypov, V.V.; Balin, Yu.S.; Penner, I.E.; Kokhanenko, G.P.; Nasonov, S.V.; Klemasheva, M.G.; Golobokova, L.P.; Potemkin, V.L. Ship-Based Studies of Aerosol-Gas Admixtures over Lake Baikal Basin in Summer 2018. Atmos. Ocean. Opt. 2019, 32, 434–441. [Google Scholar] [CrossRef]
- Golobokova, L.P.; Khodzher, T.V.; Khuriganova, O.I.; Marinayte, I.I.; Onishchuk, N.A.; Rusanova, P.; Potemkin, V.L. Variability of Chemical Properties of the Atmospheric Aerosol above Lake Baikal during Large Wildfires in Siberia. Atmosphere 2020, 11, 1230. [Google Scholar] [CrossRef]
- Vetrov, V.A.; Kuznetsova, A.I. Microelements in natural environments of the Lake Baikal region, Institute of Geochemistry SB RAS, Scientific editor: Correspondn Member of RAS M.I. Kuzmin. Novosibirsk: SB RAS Rublishing House, Research Center of the Institute of Geology and Geochemistry 1997, 234. (in Russian).
- Khodzher, T.V.; Golobokova, L.P.; Molozhnikova, E.V.; Makukhin, V.L.; Obolkin, V.A.; Marinaite, I.I.; Gorshkov, A.G.; Kobeleva, N.A.; Potemkin, V.L. Chapter 1. Monitoring of atmospheric aerosols of Siberia and the Arctic basin of Russia, SB RAS Integration Projects, 9. Aerosols of Siberia, 2006; 58–148. (in Russian) [Google Scholar]
- EANET: Acid Deposition Monitoring Network in East Asia. Available online: https://www.eanet.asia (accessed on 08 December 2024).
- Onishchuk, N.A.; Netsvetaeva, O.G.; Molozhnikova, E.V. Interannual Dynamics of the Chemical Composition of Snow Cover in the Baikal Region. Russ. Meteorol. Hydrol. 2023, 48, 309–315. [Google Scholar] [CrossRef]
- Ignatov, A.V.; Fedorov, V.N.; Zakharov, V.V. . Dynamics of water balance components of river basins. Irkutsk: Publishing house of the Siberian Branch of the Russian Academy of Sciences. 1998, 185 (in Russian).
- Safarov, A.S.; Verkhozina, V.A.; Makukhin, V.L. Modeling Transfer of Novo-Irkutsk CHP Emissions to Lake Baikal Water Area. Vestnik of Irkutsk State Technical Institute, 2013; 11, 115–120. (in Russian) [Google Scholar]
- Mizandrontsev, I.B.; Makukhin, V.L. Gas exchange between Baikal and the atmosphere during under-ice period. Water Resour 2017, 44, 512–521. [Google Scholar] [CrossRef]
- Vector files. Available online: https://www.istockphoto.com/ru/vectornaya/karta-azii-gm585610944-100472163 (accessed on 07 April 2025).
- Shikhovtsev, M.Yu.; Molozhnikova, Y.V. Inter-annual dynamics of regional and transboundary transport of air masses of the Baikal region for 2010-2018. Proc. of SPIE 2020, 1156061, 7. [Google Scholar]
- Siberia/Reports, 16 October 2023. Available online: https://www.interfax-russia.ru/siberia/report (accessed on 10 April 2025).
- ARL NOAA. Atmospheric Resource Laboratory NOAA. Available online: http://www.arl.noaa.gov (accessed on 07.04.2025).
- Xu, G.; Gao, Y. Atmospheric trace elements in aerosols observed over the Southern Ocean and coastal East Antarctica. Polar Res. 2014, 33, 23973. [Google Scholar] [CrossRef]
- PND F 16.1:2.3:3.11-98. Methodology for measuring metal content in solid objects using inductively coupled plasma spectrometry. Moscow: 2005, 31. (in Russian)
- Chebykin, E.P.; Malnik, V.V.; Tomberg, I.V.; Kopyrina, L.I.; Suturin, A.N.; Zakharova, Yu.R. Water quality and ecological state estimate of large lakes of Yakutsk City (Lake Saysary, Lake Sergelyakh) in the end of ice period in 2021. Limn. Fres. Biol. 2024, 4, 834–863. [Google Scholar] [CrossRef]
- Zuev, V.E.; Kabanov, M.V. Optics of atmospheric aerosol, Leningrad: Gidrometeoizdat 1987, 254. (in Russian).
- Shikhovtsev, M.Yu.; Obolkin, V.A.; Khodzher, T.V.; Molozhnikova, Ye.V. Variability of the Ground Concentration of Particulate Matter PM1–PM10 in the Air Basin of the Southern Baikal Region. Atm. Ocean. Opt. 2023, 36, 655–662. [Google Scholar] [CrossRef]
- Jaenicke, R. Problems of the distribution of the global aerosol, Usp. Khim.; 59:10, 1654–1675. Rus.Chem. Rev. 1990, 59, 959–972. [CrossRef]
- Rudnick, R.L.; Gao, S. Composition of the continental crust. In Treatise on Geochemistry; Holland, H.D., Turekian, K.K., Eds.; Elsevier: Amsterdam, The Netherlands, 2003; Volume 3, pp. 1–64. [Google Scholar] [CrossRef]
- Millero, F.J. Chemical Oceanography. 4th ed. Boca Raton: CRC Press. Florida: 2006, 591.
- Latysheva, I.V.; Vologzhina, S.Z.; Loshchenko, K.A. Circulation Factors of Fires in Siberia and the Far East in the Summer of 2019 and 2021, The Bulletin of Irkutsk State University. Series Earth Sciences 2021, 38, 54–70. (in Russian). [Google Scholar]
- Chen, S.Y.; Zhao, D.; Huang, J.; He, J.; Chen, Y.; Chen, J.; Bi, H.; Lou, G.; Du, S.; Zhang, Y.; Yang, F. Mongolia contributed more than 42% of the dust concentrations in northern China in March and April 2023. Adv. Atmos. Sci. 2023, 40, 1549–1557. [Google Scholar] [CrossRef]
- Abulaiti, A.; Kimura, R.; Shinoda, M.; Kurosaki, Y.; Mikami, M. ; Ishizuka,M.; Yamada, Y.; Nishihara E.; Gantsetseg B. An observational study of saltation and dust emission in a hotspot of Mongolia, Aeolian Res. 2024, 15, 169–176. [Google Scholar] [CrossRef]
- Zhang, S.; Wu, J.; Yao, J.; Quan, X.; Zhai, H.; Lu, Q.; Xia, H.; Wang, M.; Guo, J. Dust Monitoring and Three-Dimensional Transport Characteristics of Dust Aerosol in Beijing, Tianjin, and Hebei. Atmosphere 2024, 15, 1212. [Google Scholar] [CrossRef]
- Garant. Available online: https://base.garant.ru/403588206/ (accessed on 9 April 2025).
Figure 1.
Scheme of monitoring stations and aerosol sampling [26].
Figure 1.
Scheme of monitoring stations and aerosol sampling [26].
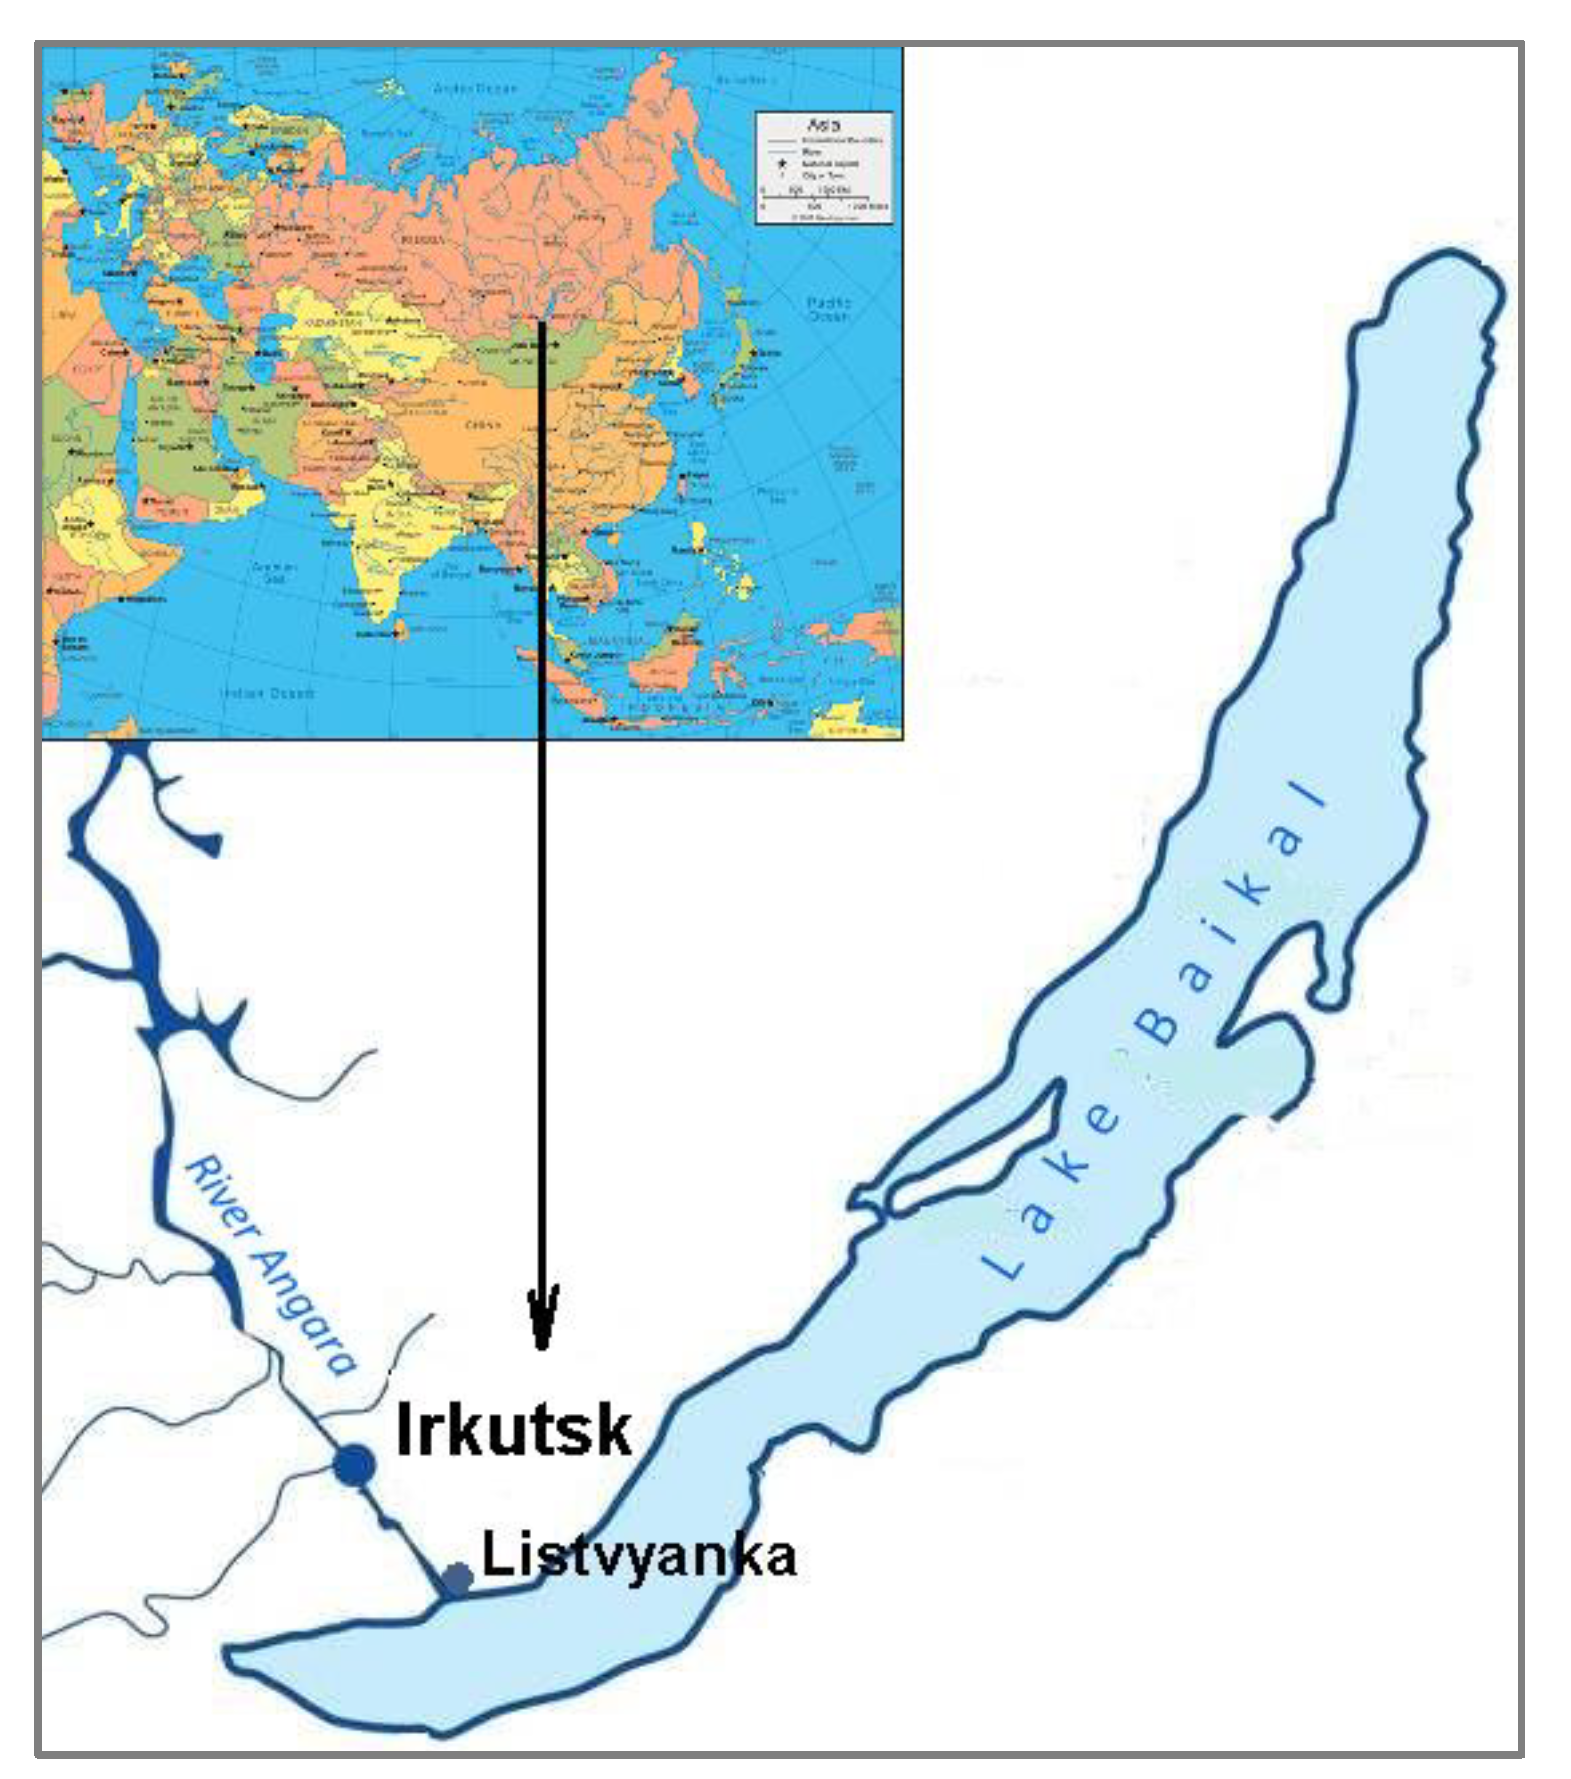
Figure 2.
Surface pressure and wind fields on 12 June 2023 at 02:00 local time (a) with high air pollution level at the Listvyanka and situation on 6 August 2023 at 02:00 local time (b) with low air pollution level.
Figure 2.
Surface pressure and wind fields on 12 June 2023 at 02:00 local time (a) with high air pollution level at the Listvyanka and situation on 6 August 2023 at 02:00 local time (b) with low air pollution level.
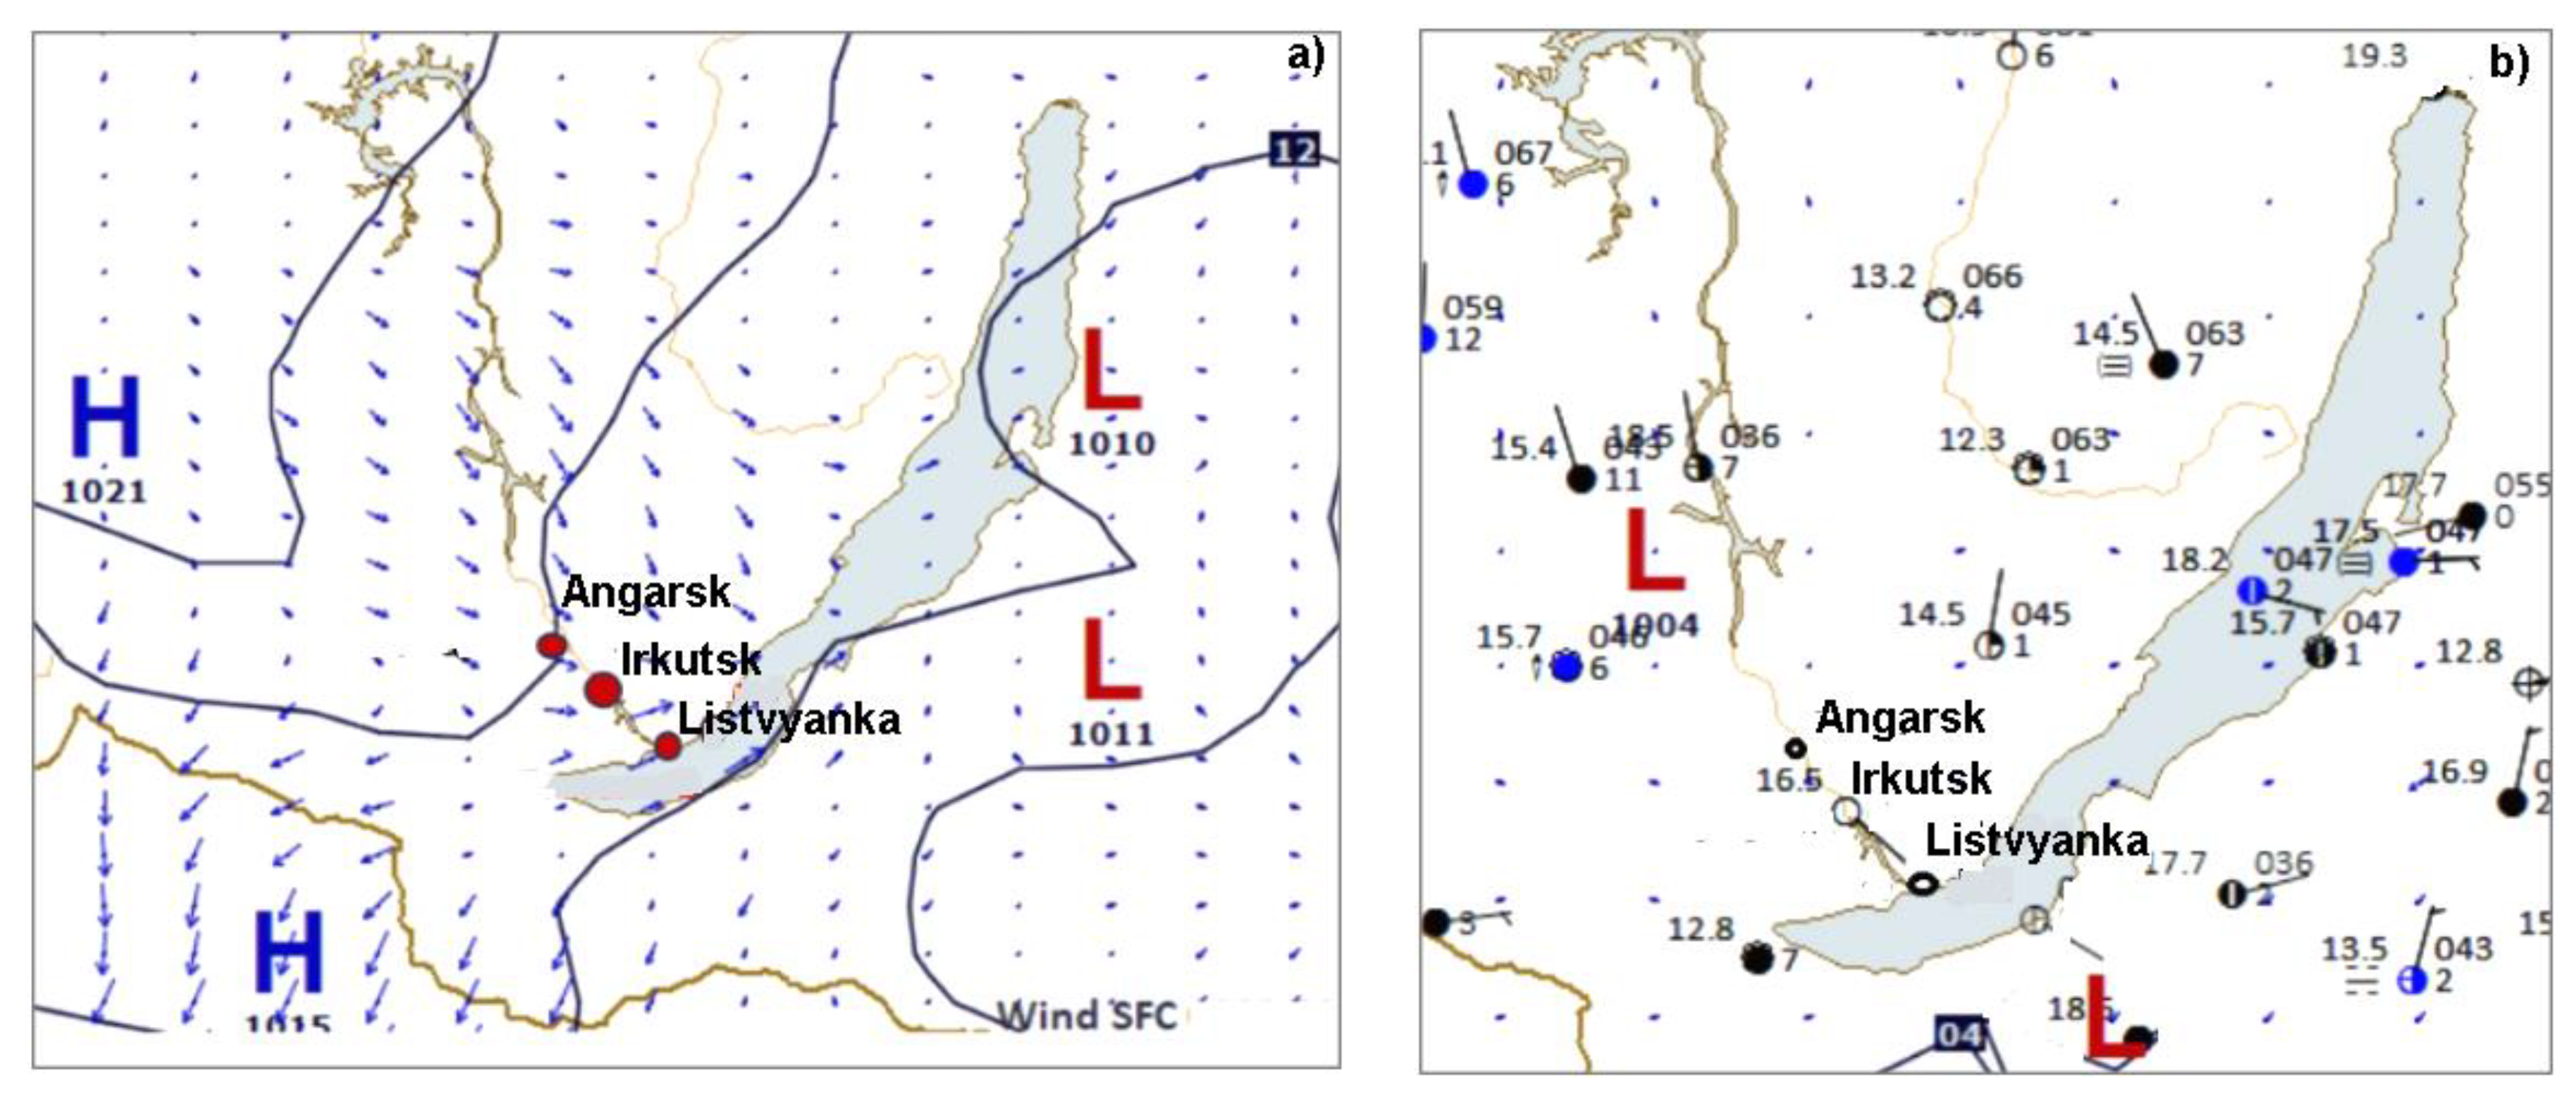
Figure 3.
Dynamics of the ionic concentration variability in atmospheric aerosols at the Irkutsk station depending on particle size and prevailing direction of air mass transport.
Figure 3.
Dynamics of the ionic concentration variability in atmospheric aerosols at the Irkutsk station depending on particle size and prevailing direction of air mass transport.
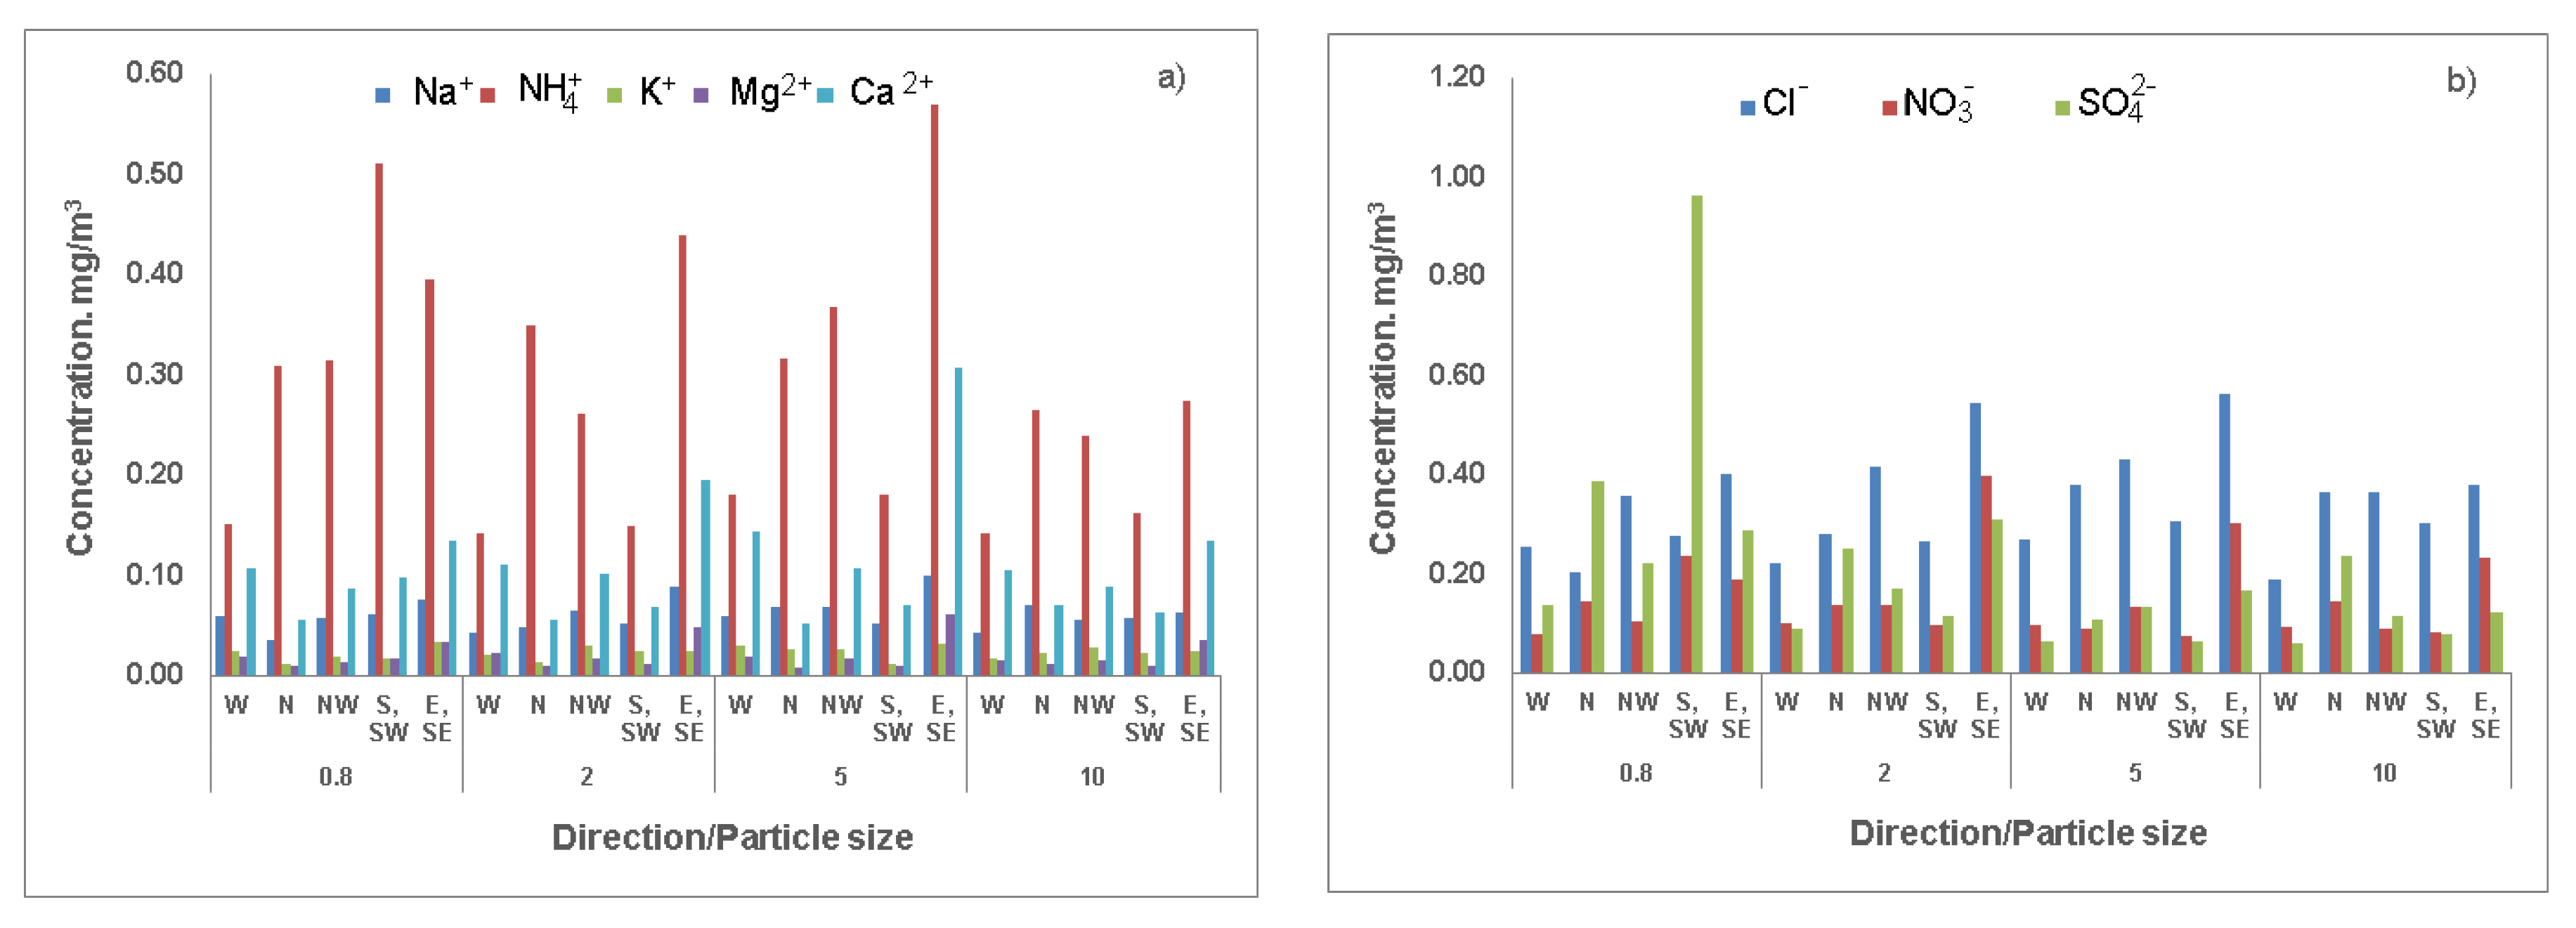
Figure 4.
Distribution of the mean ionic concentrations in РМ2.5 particles at the Listvyanka station depending on air mass direction in the warm season of 2023, µg/m3.
Figure 4.
Distribution of the mean ionic concentrations in РМ2.5 particles at the Listvyanka station depending on air mass direction in the warm season of 2023, µg/m3.
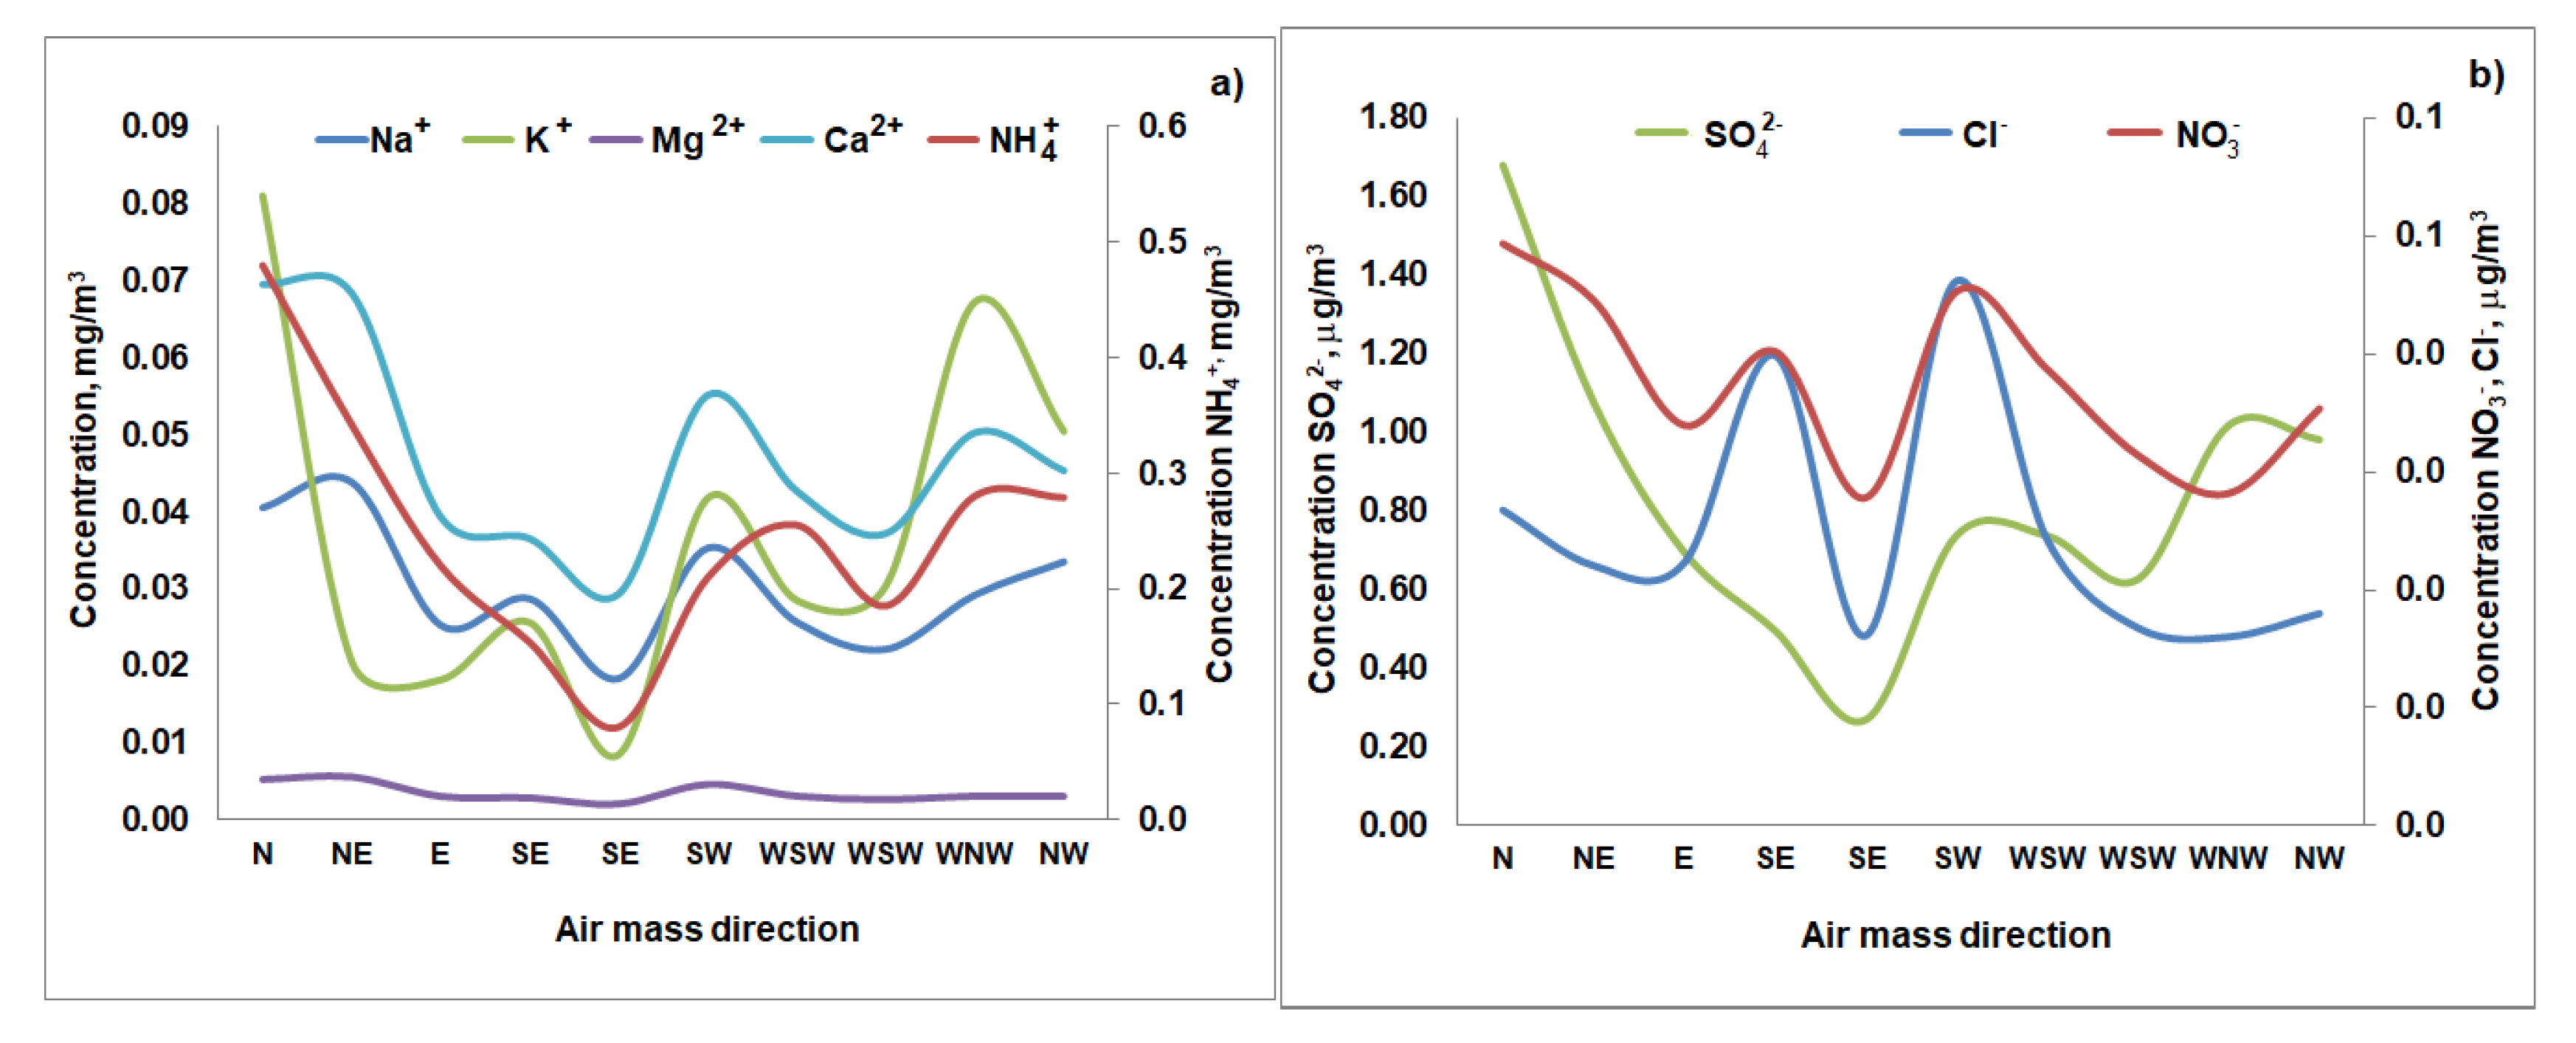
Figure 5.
Elemental composition of atmospheric aerosols with different size fractions at the Irkutsk and Listvyanka stations, 2023.
Figure 5.
Elemental composition of atmospheric aerosols with different size fractions at the Irkutsk and Listvyanka stations, 2023.
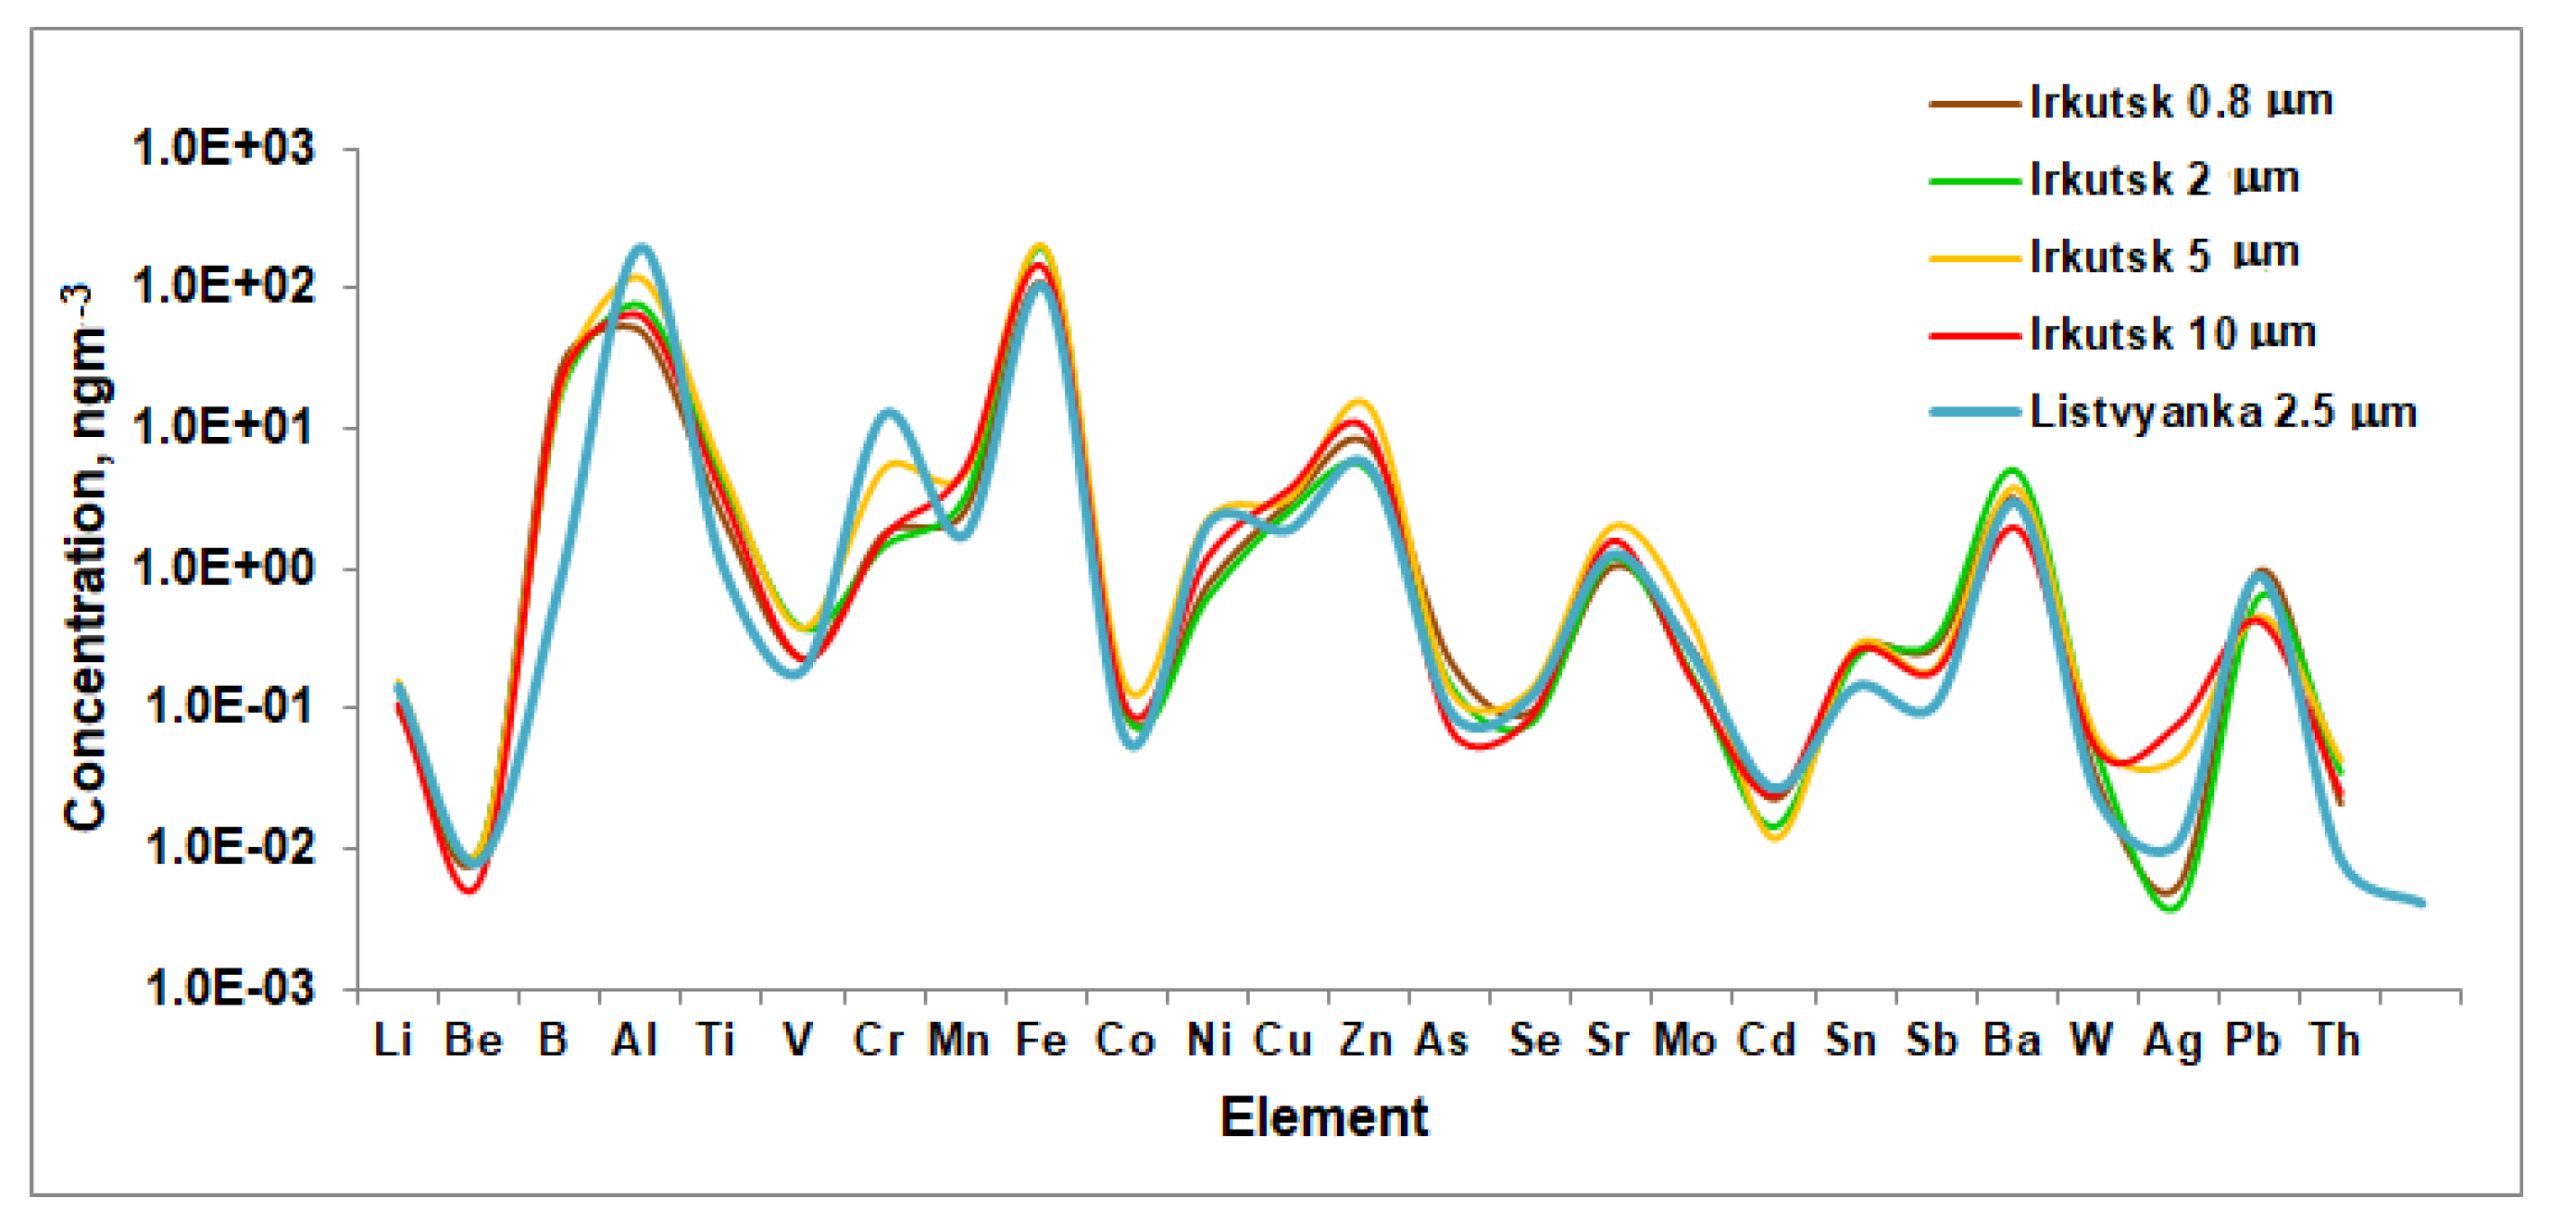

Table 1.
Statistics of wind conditions at the Irkutsk and Listvyanka stations, 2023.
|
Direction, degrees |
Irkutsk | Listvyanka | ||
| Frequency, % |
Average speed, m/s |
Frequency, % |
Average speed, m/s |
|
| June, 2023 | ||||
| 1-90 | 11 | 1.9 | 7 | 0.5 |
| 91-180 | 32 | 2.8 | 28 | 0.9 |
| 181-270 | 14 | 2.1 | 8 | 1.0 |
| 271-360 | 43 | 4.5 | 57 | 1.9 |
| Calm, <0.5 m/s | 1.4 | 21 | ||
|
Maximum speed (date; time) |
NW, 15.5 m/s 14 June; 14:00 |
NW, 5.9 m/s 12 June 02:00 |
||
| July, 2023 | n=689 | n=1978 | ||
| 1-90 | 12 | 1.9 | 15 | 0.6 |
| 91-180 | 33 | 2.4 | 22 | 0.8 |
| 181-270 | 16 | 2.1 | 7 | 0.7 |
| 271-360 | 39 | 4.0 | 56 | 1.6 |
| Calm, <0.5 m/s | 1.3 | 24 | ||
|
Maximum speed (date; time) |
NW, 9.0 m/s 4 July; 2-7:00 |
NW, 3.9 m/s 4 July; 15:00 |
||
| August, 2023 | n=482 | n=1756 | ||
| 1-90 | 21 | 1.8 | 10 | 1.0 |
| 91-180 | 23 | 2.1 | 21 | 1.0 |
| 181-270 | 15 | 2.4 | 9 | 1.0 |
| 271-360 | 41 | 3.2 | 60 | 1.6 |
| Calm, <0.5 m/s | 2.3 | 19 | ||
|
Maximum speed (date; time) |
NW, 8.0 m/s 15 August; 13:00 |
NW, 4.8 m/s 15 August; 23:00 |
||
Table 2.
Data on precipitation in Irkutsk and Listvyanka in the summer of 2023.
|
Period |
Irkutsk | Listvyanka | ||
| Amount per month, mm | Maximum per day, mm (date) |
Amount per month, mm | Maximum per day, mm (date) | |
| June | 80.8 | 25.0 (03 June) | 92.9 | 23.0 (24 June) |
| July | 84.2 | 18.6 (06 July) | 85.3 | 29.0 (03 July) |
| August | 113 | 28.1 (14 August) | 50.8 | 10.7 (16 August) |
Table 3.
Aerosol mass concentrations in the air of Irkutsk and Listvyanka during the warm period of 2023, µg/m3.
Table 3.
Aerosol mass concentrations in the air of Irkutsk and Listvyanka during the warm period of 2023, µg/m3.
| Month | РМ1.0 | РМ2.5 | РМ10.0 | РМ<1.0/РМ>1.0 ratio , % |
Total mass concentration, µg/m3 |
|---|---|---|---|---|---|
| Irkutsk | Listvyanka | ||||
| May | 5 | 10.8 | 27.7 | 14 | 14.8 |
| June | 5.3 | 11.3 | 23.4 | 31 | 18.0 |
| July | 6.5 | 11.7 | 23.2 | 31 | 24.8 |
| August | 5.4 | 11.9 | 26 | 22 | 25.4 |
| September | 7.4 | 14.8 | 33.5 | 21 | 26.4 |
Table 4.
Mean concentrations (numerator) and standard deviation (denominator) of the concentrations of ions with different size fractions in atmospheric aerosols at the Irkutsk station from 5 May to 5 September 2023, µg m-3.
Table 4.
Mean concentrations (numerator) and standard deviation (denominator) of the concentrations of ions with different size fractions in atmospheric aerosols at the Irkutsk station from 5 May to 5 September 2023, µg m-3.
| Particle size, μm |
Na+ | NH4+ | K+ | Mg2+ | Ca2+ | Cl- | NO2- | NO3- | SO42- |
|---|---|---|---|---|---|---|---|---|---|
| 0.8 | |||||||||
| 2.0 | |||||||||
| 5.0 | |||||||||
| 10.0 |
Table 5.
Mean concentrations (numerator) and standard deviations (denominator) of the ionic concentrations in atmospheric aerosols with a particle size of 2.5 μm at the Listvyanka station from 5 May to 5 September 2023 for different air mass directions, µg/m3.
Table 5.
Mean concentrations (numerator) and standard deviations (denominator) of the ionic concentrations in atmospheric aerosols with a particle size of 2.5 μm at the Listvyanka station from 5 May to 5 September 2023 for different air mass directions, µg/m3.
| Air mass direction | Na+ | NH4+ | K+ | Mg2+ | Ca2+ | Cl- | NO2- | NO3- | SO42- |
|---|---|---|---|---|---|---|---|---|---|
| N | |||||||||
| NE | |||||||||
| E | |||||||||
| SE | |||||||||
| S | |||||||||
| SW | |||||||||
| WSW | |||||||||
| W | |||||||||
| WNW | |||||||||
| NW |
Table 6.
Contribution of trace elements to the overall level of air pollution at the Irkutsk station, taking into account the pollution degree, % (elements in bold are of terrigenous origin).
Table 6.
Contribution of trace elements to the overall level of air pollution at the Irkutsk station, taking into account the pollution degree, % (elements in bold are of terrigenous origin).
| Size,µm | B | Al | Ti | Cr | Mn | Fe | Co | Ni | Cu | Zn | Mo | Sr | Sn | Sb | Ba | Pb |
| 0.8 | 0.0 | 1.2 | 0.0 | 0.0 | 1.7 | 93.0 | 0.1 | 0.3 | 1.9 | 0.6 | 0.0 | 0.0 | 0.1 | 0.1 | 0.5 | 0.3 |
| 2.0 | 0.0 | 1.5 | 0.0 | 0.0 | 2.0 | 93.5 | 0.1 | 0.2 | 1.5 | 0.2 | 0.0 | 0.0 | 0.0 | 0.1 | 0.6 | 0.1 |
| 5.0 | 0.0 | 2.5 | 0.0 | 0.2 | 3.0 | 90.2 | 0.1 | 1.2 | 1.5 | 0.6 | 0.1 | 0.0 | 0.0 | 0.0 | 0.3 | 0.0 |
| 10 | 0.0 | 1.5 | 0.0 | 0.0 | 2.6 | 81.1 | 0.1 | 0.4 | 10.8 | 1.5 | 0.1 | 0.0 | 1.4 | 0.0 | 0.2 | 0.0 |
Table 7.
Contribution of trace elements to the overall level of air pollution at the Irkutsk station, taking into account the mean concentration (numerator–mean concentration, ng/m3; denominator–mass contribution, %). Elements in bold are of terrigenous origin.
Table 7.
Contribution of trace elements to the overall level of air pollution at the Irkutsk station, taking into account the mean concentration (numerator–mean concentration, ng/m3; denominator–mass contribution, %). Elements in bold are of terrigenous origin.
| Particle size, µm | B | Al | Ti | Cr | Mn | Fe | Co | Ni | Cu | Zn | Mo | Sr | Sn | Sb | Ba | Pb |
|---|---|---|---|---|---|---|---|---|---|---|---|---|---|---|---|---|
| 0.8 | ||||||||||||||||
| 2.0 | ||||||||||||||||
| 5.0 | ||||||||||||||||
| 10 |
Table 8.
Contribution of trace elements to the overall air pollution level at the Listvyanka station (Elements in bold are of terrigenous origin).
Table 8.
Contribution of trace elements to the overall air pollution level at the Listvyanka station (Elements in bold are of terrigenous origin).
| Parameter | Al | Cr | Mn | Fe | Co | Ni | Cu | Zn | Se | Mo | Ba | Pb |
|---|---|---|---|---|---|---|---|---|---|---|---|---|
| Concentration, ng/m3 | 199.1 | 12.8 | 1.8 | 101.3 | 0.1 | 2.1 | 1.9 | 5.4 | 0.1 | 0.2 | 3.0 | 0.9 |
| 1MPC contribution,% | 8.5 | 1.8 | 1.5 | 83.0 | 0.1 | 1.9 | 1.7 | 0.4 | 0.2 | 0.1 | 0.5 | 0.3 |
| Mass contribution, % | 59.8 | 3.9 | 0.5 | 30.5 | 0.0 | 0.6 | 0.6 | 1.6 | 0.0 | 0.1 | 0.9 | 0.3 |
1MPC – average daily maximum permissible concentration.
Disclaimer/Publisher’s Note: The statements, opinions and data contained in all publications are solely those of the individual author(s) and contributor(s) and not of MDPI and/or the editor(s). MDPI and/or the editor(s) disclaim responsibility for any injury to people or property resulting from any ideas, methods, instructions or products referred to in the content. |
© 2025 by the authors. Licensee MDPI, Basel, Switzerland. This article is an open access article distributed under the terms and conditions of the Creative Commons Attribution (CC BY) license (http://creativecommons.org/licenses/by/4.0/).
Copyright: This open access article is published under a Creative Commons CC BY 4.0 license, which permit the free download, distribution, and reuse, provided that the author and preprint are cited in any reuse.


