
Submitted:
29 May 2025
Posted:
29 May 2025
You are already at the latest version
Abstract
The incorporation of MAX phase interface layers into silicon carbide (SiC) composites has been shown to significantly enhance mechanical properties, particularly under irradiation conditions. However, conventional Ti-based MAX phases suffer from thermal instability and tend to decompose at high temperatures. In this work, Sc2SnC coating was successfully synthesized on the surface of SiC fibers (SiCf) via an in-situ reaction between metals and pyrolytic carbon (PyC) in a molten salt environment. The PyC layer, pre-deposited by chemical vapor deposition (CVD), served as both a carbon source and a structural template. Characterization by SEM, XRD, and Raman spectroscopy confirmed the formation of Sc2SnC coatings with a distinctive hexagonal flake-like morphology, accompanied by an internal ScCx intermediate layer. By turning the Sc-to-Sn ratio in the molten salt, coatings with varied morphologies were achieved. ScCx was identified as a critical intermediate phase in the synthesis process. The formation of numerous defects during the reaction enhanced element diffusion, resulting in preferential growth orientations and diverse grain structures in the Sc2SnC coating.
Keywords:
MAX phase coating
; Molten salt synthesis
; SiC fiber
; Pyrolytic carbon
; CVD
1. Introduction
Silicon carbide (SiC) based ceramics and their composites (SiCf/SiC) are regarded as promising materials for components in light water reactor (LWR) and advanced fission reactors, including high-temperature gas-cooled reactors (HTGRs), fluoride-salt-cooled high-temperature reactors (FHRs), and gas-cooled fast reactors (GFRs) [1]. The interfacial layer between SiC fibers (SiCf) and the SiC matrix plays a crucial role in integrating the mechanical, thermal, and electrical properties of the fibers and the matrix. This layer can significantly improve the composite’s strength, fracture toughness, resistance to radiation, oxidation, and corrosion, as well as thermal conductivity. However, under nuclear irradiation conditions, it is necessary to develop an interface layer that can withstand high temperatures and radiation, because conventional interfacial layers are prone to structural degradation and performance failure [2]. For example, pyrolytic carbon (PyC) undergoes shrinkage-swelling-amorphization structural evolution under neutron irradiation, leading to significant interface delamination. In hexagonal boron nitride (h-BN), the B element undergoes transmutation (producing He) during neutron exposure, resulting in interfacial layer damage. Similarly, multilayer interfaces composed of PyC and h-BN experience structural disruption under long-term irradiation, which reduces interfacial shear strength and increases frictional stress—making them suboptimal for interface layer applications [1,3].
In recent years, ternary layered MAX phase (a class of nano-laminated materials composed of an early transition-metal (M), an A-group element (A) and C, N, B and/or P (X) [4]) materials have attracted attention as candidates for nuclear-grade interfacial layer [5]. MAX phases have a hexagonal layered crystal structure similar to PyC and h-BN. Under applied stress, they exhibit deformation characteristics such as slip, buckling, and kinking, which can deflect interfacial cracks and enhance the toughness of composite materials [6]. Additionally, MAX phase materials possess high thermal conductivity, corrosion resistance and radiation resistance [7,8,9,10,11]. As interfacial materials, they contribute positively to both the thermal and radiation tolerance of the composites. Tallman et al. conducted a neutron transmutation analysis and found that the specific activity of MAX phases such as Ti3SiC2, Ti3AlC2, Ti2AlC after 10, 30, and 60 years of exposure to thermal and fast neutron spectra is comparable to that of SiC and three orders of magnitude lower than that of nickel-based alloys like Alloy 617 [7,11,12]. Despite their excellent radiation resistance, coating MAX phases onto SiCf remains a technical challenge [13]. Filber-Demut et al. utilized the electrophoretic deposition method to coat SCS-6 type of SiCf with Ti3SiC2 powder. And also demonstrated significant improvements in debonding strength and interfacial friction resistance in ceramic matrix composites [14]. However, electrophoretic deposition is limited to micron-sized Ti3SiC2 particles and often fails to achieve uniform coverage, posing a significant challenge for creating homogeneous interfacial layers.
Our working group was the first to developed a simple method for fabricating carbide/MAX phase interfacial layer via an in-situ reaction in a molten salts bath [15]. We further utilized this technique to synthesize MAX phase interfacial layers such as Ti2AlC and Ti3SiC2 on the surfaces of carbon fibers (Cf). And composite materials were then fabricated using the polymer impregnation and pyrolysis process (PIP). After simulated ion irradiation, these composites exhibited good structural stability and had a good irradiation swelling behavior with SiC [16,17].
However, titanium-based MAX phases decompose into TiC at elevated temperatures (~1400 °C) and show poor oxidation resistance above 1200 °C [18]. This decomposition decreases the shear strength of the composite at high temperatures, and necessitates precise temperature control during the subsequent SiC matrix processing. Therefore, it is necessary to develop a high-temperature-stable MAX phase interfacial layer.
According to previous reports, non-transition metal M2AX compounds containing Sc, Y, and Lu atoms at the M-site are considered to have a stable structure at high temperatures (~1400 °C) [19]. In addition, rare earth elements are known to impart unique properties [18,20,21], such as enhanced irradiation resistance, as observed in aluminum alloys [22] and likely in the in-plane ordered RE-i-MAX phases [23]. Notably, Sc2SnC shows lower values of elastic constants (i.e., C11, C33, C44, and C66) compared to Ti2AlC, Ti3AlC2, and Ti3SiC2, indicating better deformability and processability.
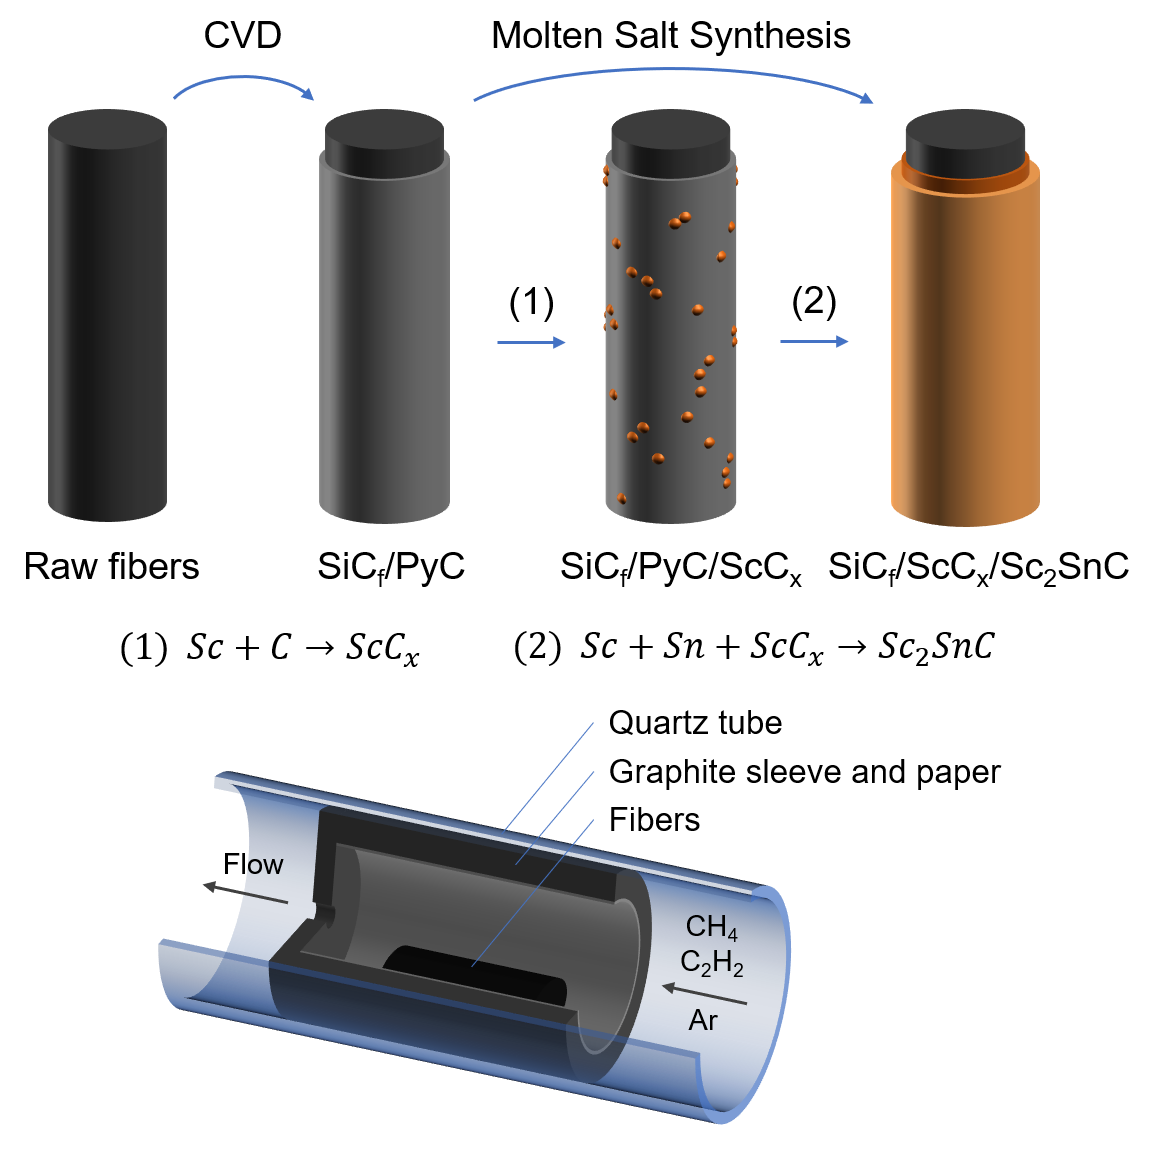
In the present work, we first used the CVD method to coat a PyC layer onto the surface of SiCf. These carbon-coated fibers were then immersed in a molten salt environment to in-situ synthesize a Sc2SnC MAX phase interfacial layer. The effects of the PyC layer structure, the sequence of element addition, element diffusion, and precursor composition on the quality of the resulting MAX phase interfacial layer were systematically investigated.
2. Experimental Details
2.1. Materials
Silicon carbide fiber (SiCf, Cansas-3303) was supplied by Fujian Liya New Material Co. Ltd. and carbon fiber (Cf, 3k, T300) was provided by Toray Co. Ltd., Japan. Scandium powder (Sc, 300 mesh) and Tin powder (Sn, 300 mesh) were sourced from Shanghai Pantian Powder Materials Co. Ltd. Sodium Chloride (NaCl, 99.5%, Aladdin, China) and Potassium Chloride (KCl, 99%, Aladdin, China) were used as the inert salt bath.
2.2. Preparation of the PyC layer
SiCf tow was first de-sized under vacuum at 600 °C over 2 hours. A series of PyC interphase layers were then deposited using chemical vapor deposition (CVD). The fiber tow was placed inside a graphite sleeve lined with graphite paper for demolding. The assembly was heated in a quartz tube (Φ80*2mm*1.8m) to a final pyrolysis temperature of 900-1100 °C at a ramp rate of 5 °C/min using a furnace (TL1200-1200, Boyuntong, Nanjing, China). After reaching the target temperature, the system was allowed to cool naturally to room temperature under vacuum. The base vacuum inside the furnace tube was maintained below 1 Pa before deposition. During the deposition, stable airflow was introduced into the graphite sleeve. Methane (CH4) and acetylene (C2H2) were used as carbon sources, while argon (Ar) served as both a dilution and carrier gas. The structure of the PyC interphase layer was controlled by adjusting CVD parameters, including temperature, residence time, and flow-field-related factors. The flow field is regulated using an automated gas supply system, controlling pressure, gas flux, and precursor composition. The PyC content in the in-situ reaction was estimated based on its layer thickness. The final sample was designated as SiCf/PyC.
2.3. In-Situ Synthesis of Sc2SnC Coating
The Sc2SnC coating was synthesized through the reaction between carbon, scandium powder and tin powder in a molten salt environment. NaCl-KCl eutectic salt (melting point of ~ 660 °C) was used as the inert salt bath. The powders were mixed in a stoichiometric ratio of Sc:Sn = 2:1.1 (mol), unless otherwise specified. The tin content was increased to compensate for possible weight loss at high temperatures, as tin has a relatively low melting point, similar to the preparation of Sc2SnC MAX phase. The starting powders of Sc and Sn were combined with the NaCl-KCl salt in a molar ratio of (Sc + Sn):(NaCl-KCl) = 1:20, and thoroughly ground in an agate mortar. The as-prepared SiCf/PyC or Cf was placed in the alumina crucible and covered with the mixed powder. The crucible was then placed in a tubular furnace (SGL-1700, SIOMM, Shanghai, China) and heated at a rate of 5 °C/min under argon atmosphere. A range of temperatures and dwell times were tested to evaluate their effects on the composition and thickness of the interface layer. After the reaction, the sample was thoroughly washed, filtered and dried at 40 °C under vacuum to remove the inert salt.
2.4. Characterization
The microstructure of the samples was examined by a field-emission scanning electron microscope (SEM, HITACHI Regulus 8230, Japan) equipped with an energy-dispersive spectroscopy (EDS, Detector6, Bruker XFlash, Germany) system. X-ray diffraction (XRD) analysis was performed using an X-ray diffractometer (Bruker ADVANCE D8, Germany) using Cu-Kα radiation at a scan rate of 0.02°/s. Raman spectra were obtained using a confocal Raman spectrometer (HORIBA LabRAM HR Evolution, Japan) with a 532 nm excitation wavelength.
3. Results
3.1. PyC Pre-Film Synthesis and Characterization
The microstructure of the as-produced PyC influences the structure of Sc2SnC prepared by the molten salt method. To obtain a uniform and smooth carbon layer, we investigated the structural variations of PyC on SiCf under different preparation conditions. The temperature range (900 °C, 1000 °C, 1100 °C) was selected based on a comprehensive consideration of the pyrolysis temperature range of acetylene and methane, as well as the impact of temperature on SiCf. Temperatures exceeding 1200 °C can damage the carbonized fibers [24,25,26,27,28]. Figure 1 shows the morphology and Raman spectra of PyC prepared at different temperatures. The surface morphology reveals that the PyC coating uniformly conforms to SiCf, forming an intact, dense and smooth layer (Figure 1(a-1)~(c-1)). Upon magnification, some abnormally large particles or granules are visible (indicated by white arrows in Figure 1(b-2),(c-2)), which may be related to the rapid pyrolysis of acetylene, as discussed in Figure 2. Additionally, from the cross-sectional morphology, it is evident that as temperature increases, the PyC layer becomes denser, and the laminar texture becomes more pronounced. Within the temperature range of 900~1100 °C, no noticeable gaps are observed at the interface between the PyC and SiCf, indicating a strong interfacial bond between the coating and the fibers. The Raman spectra at different temperatures are shown in the Figure 1(a-4)~(c-4). Due to the disordered nature of carbon materials, PyC tend to exhibit similar Raman spectra despite having considerable structural differences [29,30,31]. To investigate the influence of temperature, spectral deconvolution using five Raman bands – D1, G, D2, D3 and D4 – was performed to qualitatively assess the defect levels in the PyC layer through the ID/IG ratio [32,33]. Higher temperature results in a lower ID/IG ratio (from 3.86 to 2.89, compared to 3.70 for de-sized Cf T300), indicating that the PyC coating is more compact and has fewer defects. Figure 2 shows the microstructural morphology of the PyC coatings prepared with different ratios of CH4 and C2H2. It can be observed that as the C2H2 concentration increases, larger particles appear on the surface. This may be due to the higher carbon deposition rate of C2H2, which results in insufficient time for carbon atoms to diffuse, leading to local aggregation. From the cross-sectional morphology, it can be seen that when the CH4-C2H2 ratio is 90:60, the resulting PyC coating has a high density and a strong bond with the SiCf. Additionally, from the Raman spectra, its ID/IG ratio is relatively lower, indicating that the PyC has a more compact structure (Figure 2(b)). Given the strict requirements for interface layer thickness, an overly thick layer may lead to interface delamination or stress concentration, while an excessively thin layer may fail to prevent crack propagation. Therefore, precise control of the PyC thickness is crucial. Figure 3 shows the relationship between the PyC thickness (T) and time (t) at 1000 °C with a CH4-C2H2 ratio of 90:60. The statistical data is fitted to a logistic function (1), and it is clear that PyC thickness and deposition time show a nonlinear relationship. This could be attribute to the changes in the adsorption and pyrolysis rates of methane and acetylene gases over time.
Figure 1.
The morphology of PyC pre-film produced at (a) 900 °C, (b) 1000 °C, and (c) 1100 °C, for 60 minutes under 50 kPa in a CH4-C2H2-Ar atmosphere (CH4:C2H2:Ar = 90:60:200 sccm). (1) and (2) shows the surface morphology of the PyC film, with (2) being a magnified view of a selected area in (1), (3) displays the cross-sectional morphology, and (4) presents the corresponding Raman spectra.
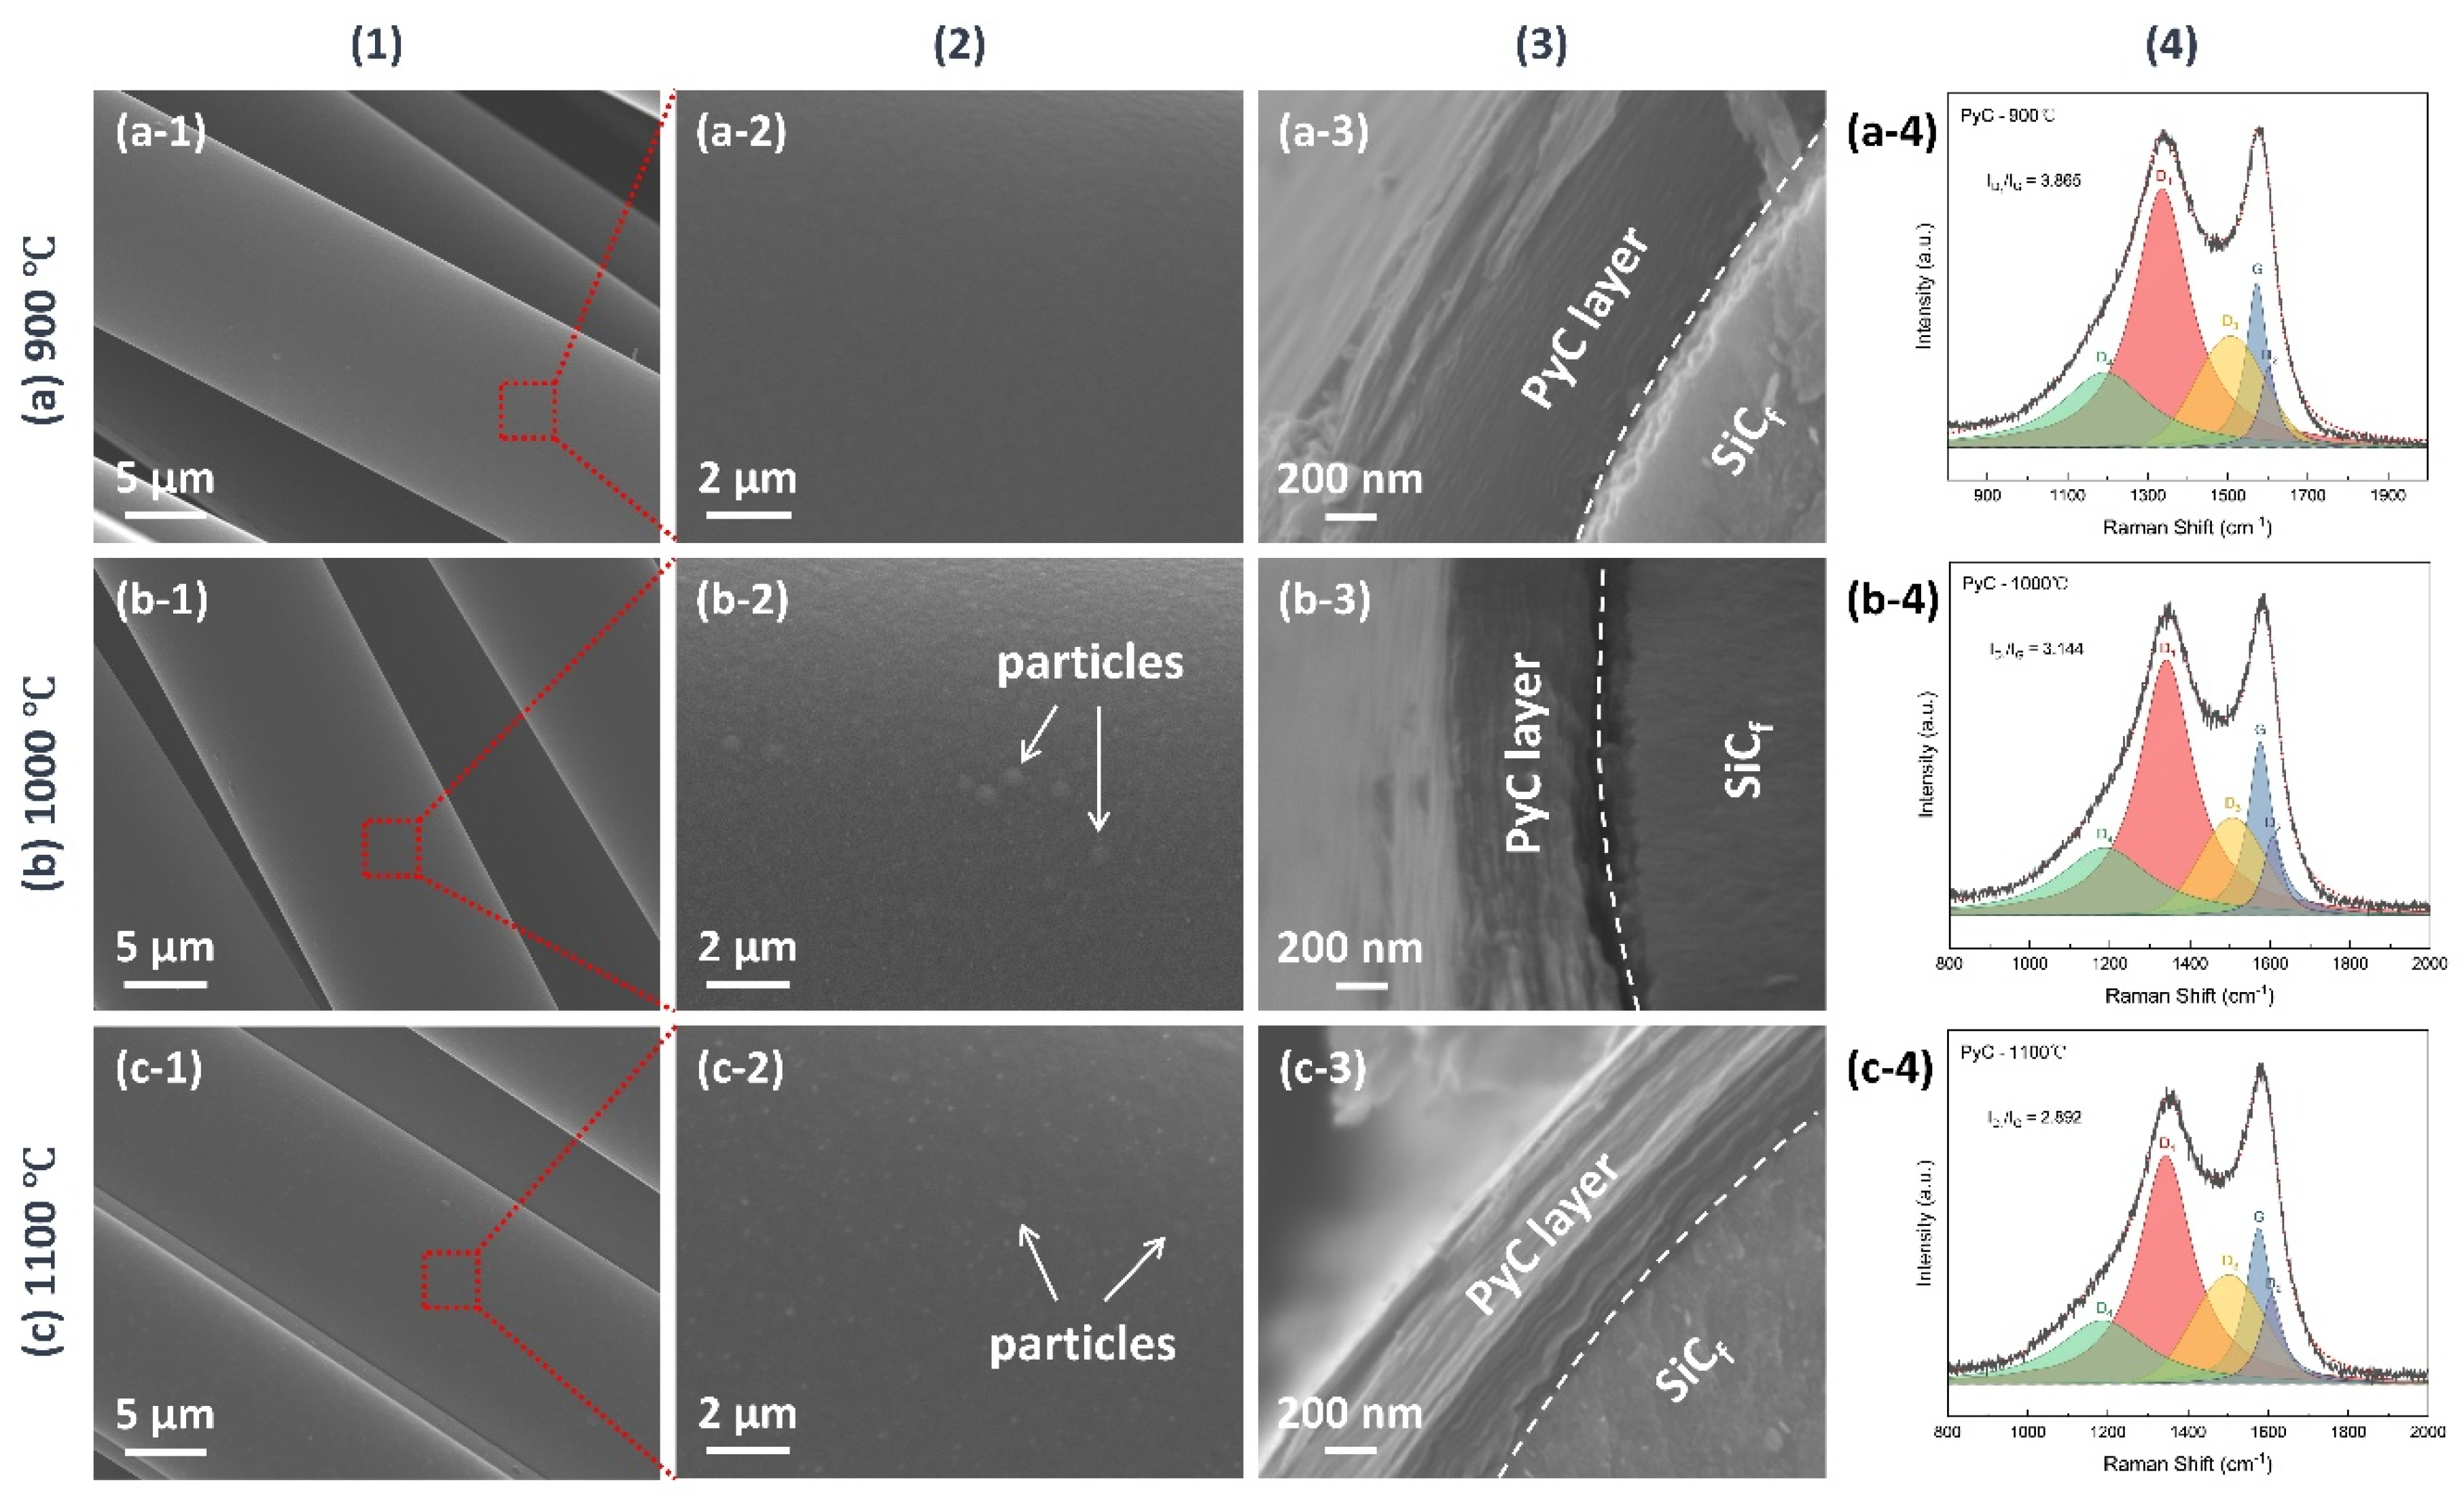
Figure 2.
The morphology and Raman spectra of the PyC pre-film produced under different CH4 and C2H2 gas flow ratio - (a) 100:50 sccm, (a) 90:60 sccm, (a) 75:75 sccm - at 1000 °C and 50 kPa. (1) shows the surface morphology, (2) the cross-sectional morphology, and (3) the corresponding Raman spectra. The flow rate of the diluting gas (Ar) is fixed at 200 sccm.
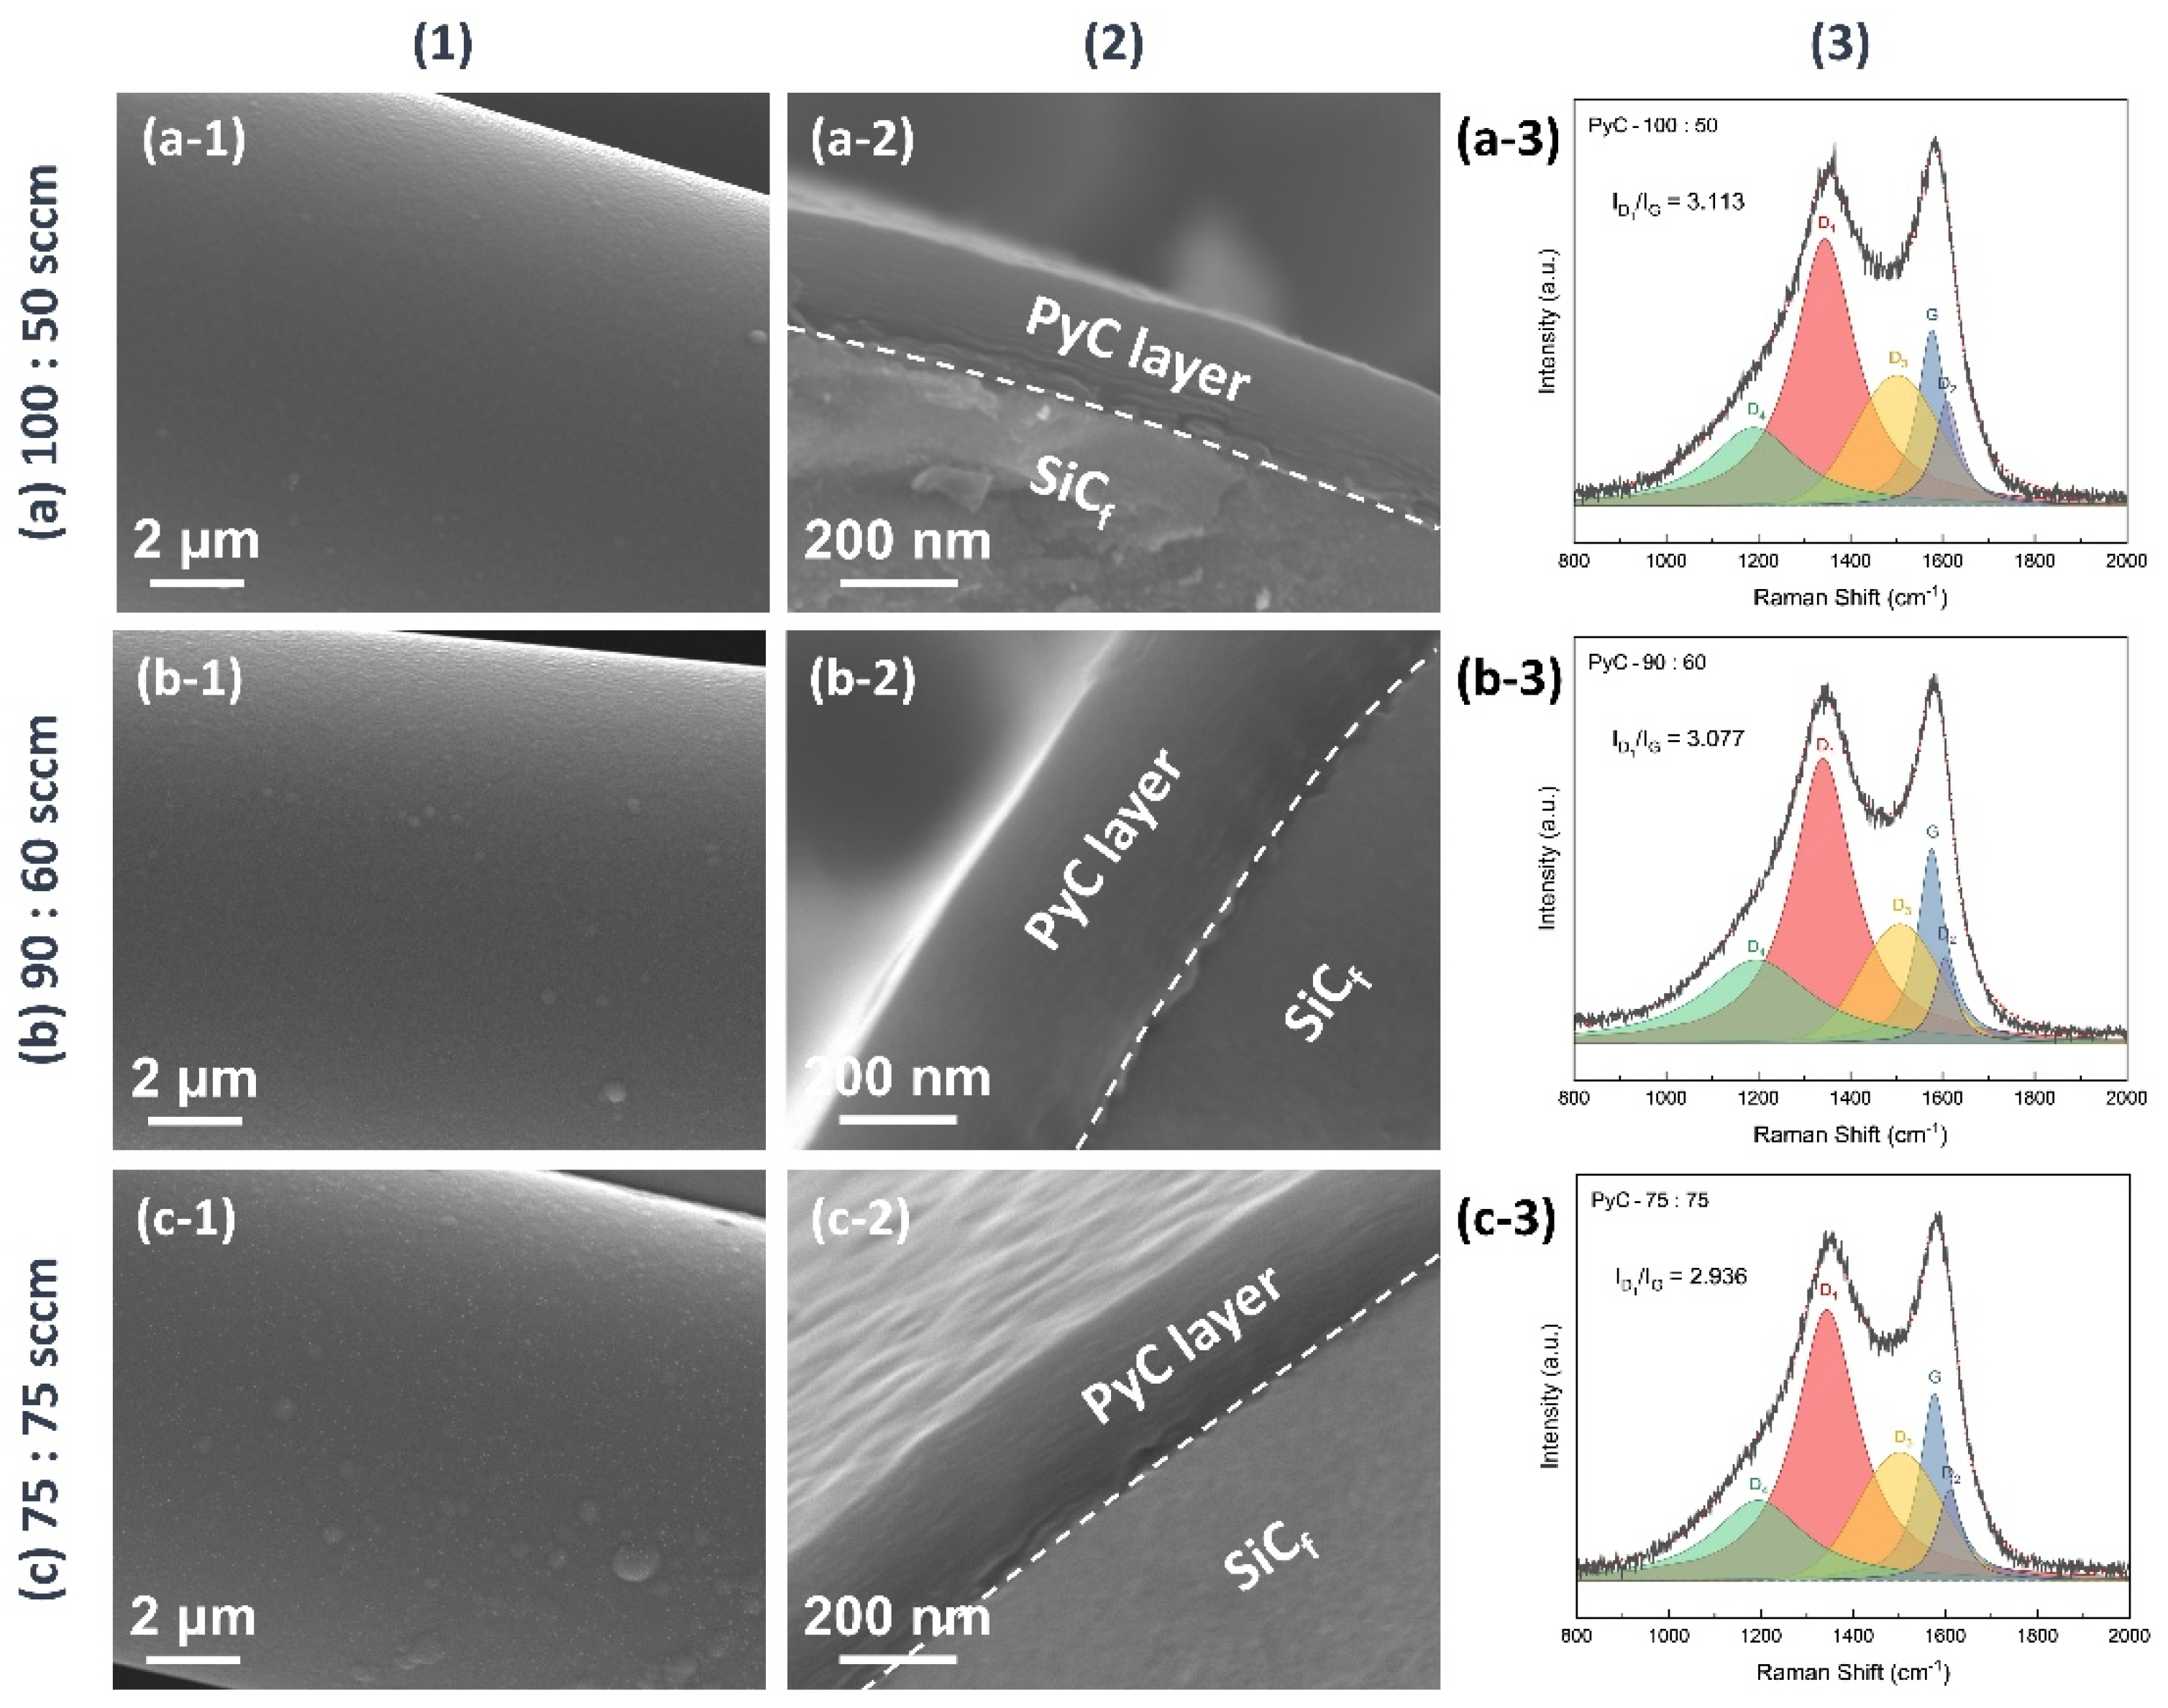
Figure 3.
(a) Relationship between time and thickness of PyC pre-film. Typical samples deposited for (b) 30 minutes, (c) 60 minutes, (d) 90 minutes, and (e) 120 minutes are shown on the right.
Figure 3.
(a) Relationship between time and thickness of PyC pre-film. Typical samples deposited for (b) 30 minutes, (c) 60 minutes, (d) 90 minutes, and (e) 120 minutes are shown on the right.
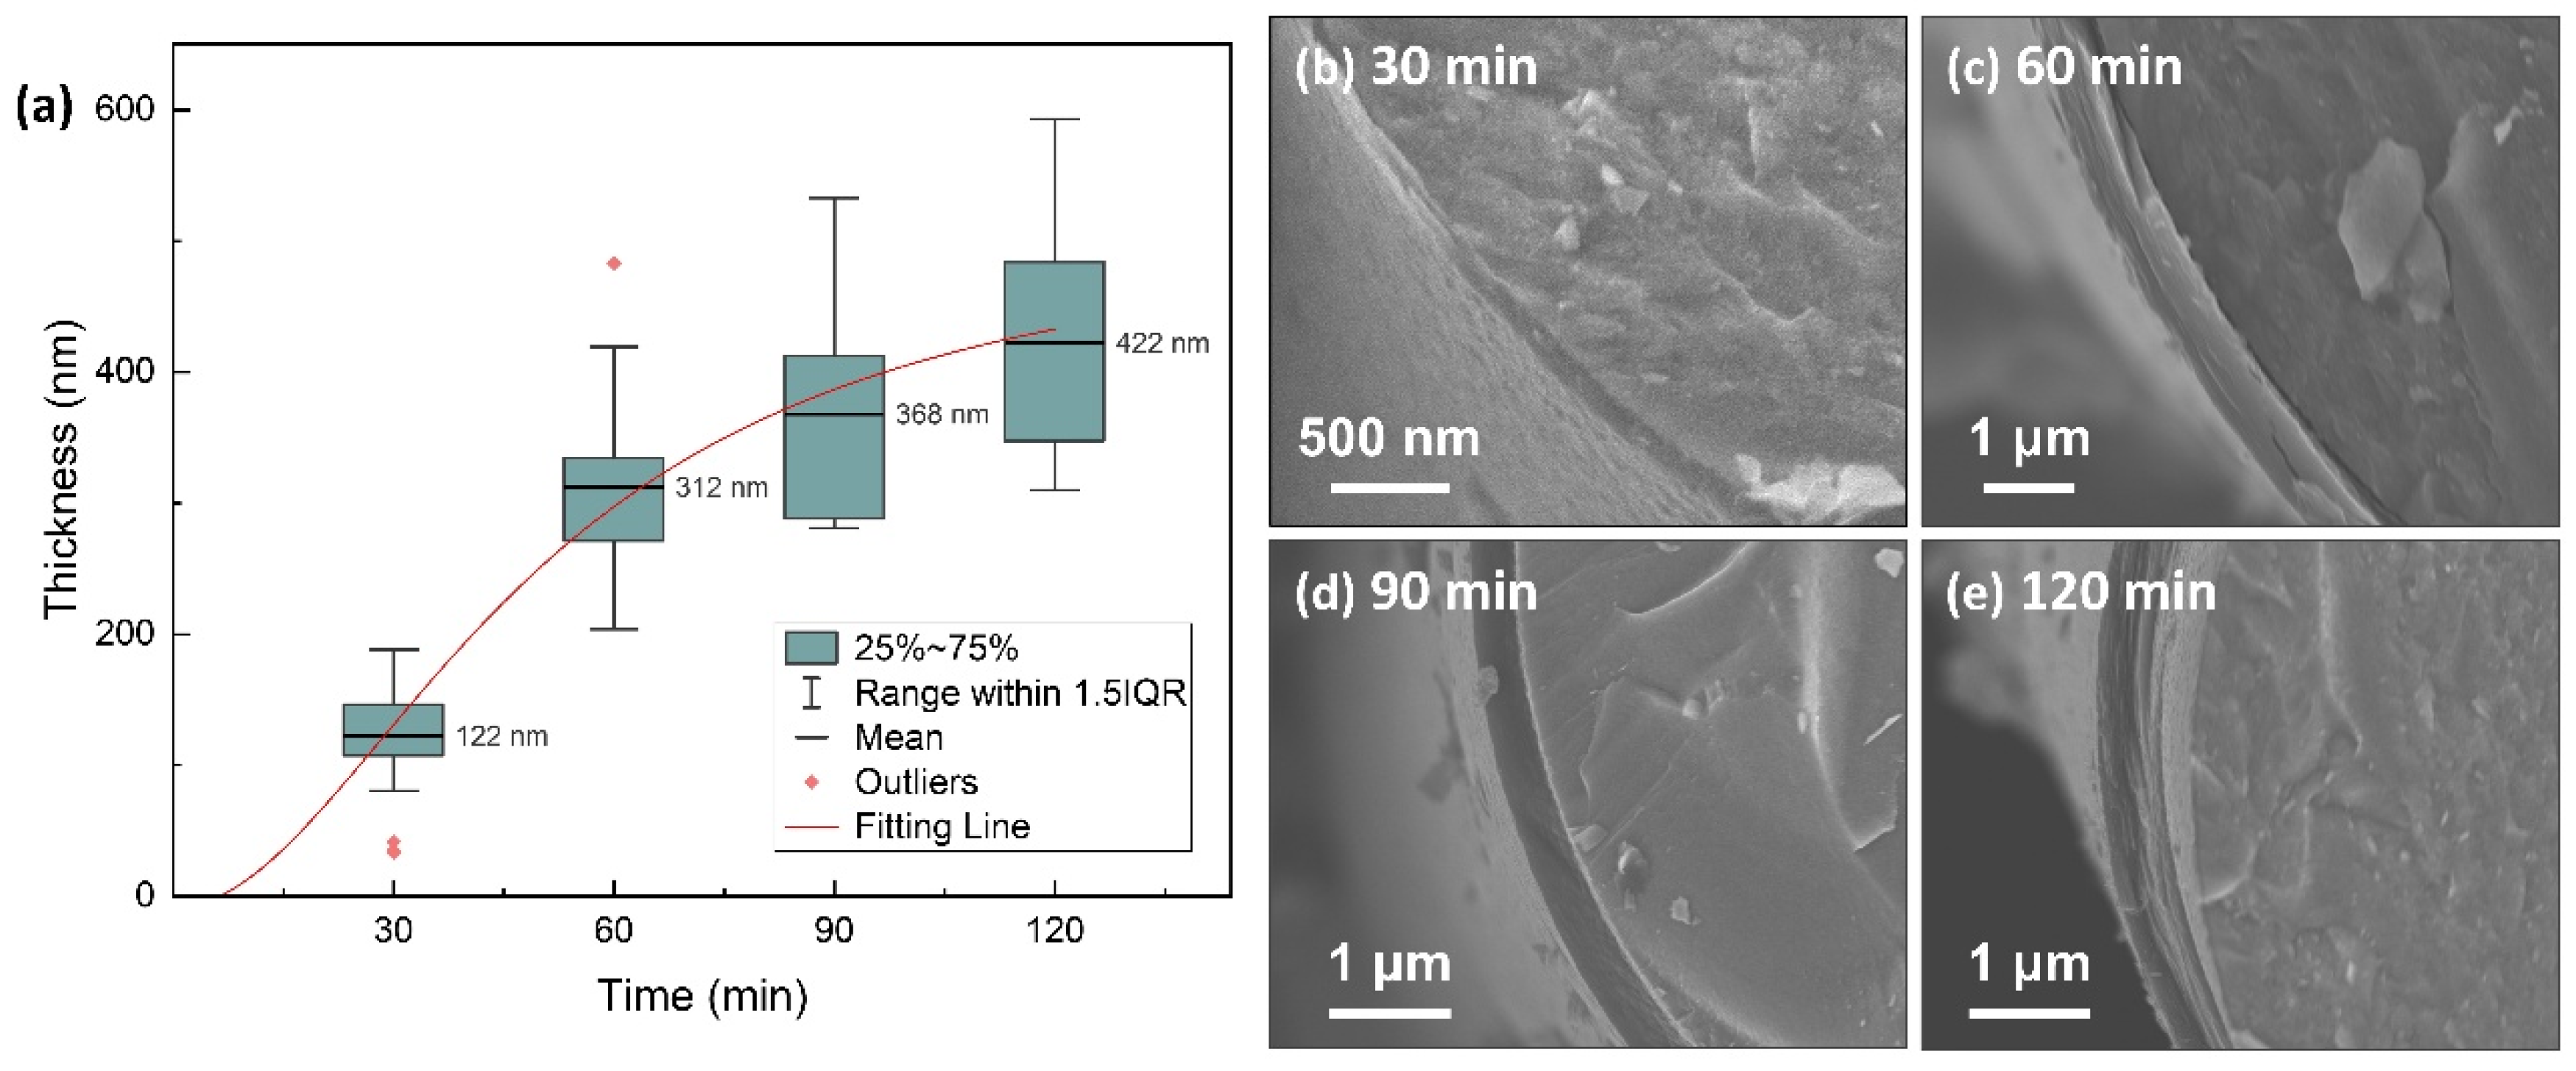

Table 1.
Fitting details of the logistic function for the data in Figure 3a.
Table 1.
Fitting details of the logistic function for the data in Figure 3a.
| Equation | |
| A1 | −8.957 ± 76.068 |
| A2 | 513.14 ± 77.330 |
| t0 | 50.17 ± 9.965 |
| p | 1.954 ± 0.656 |
| R-Square | 0.73704 |
3.2. MAX Phase Coating
3.2.1. Carbon Fiber Coating (Cf/ScCx/Sc2SnC)
The reaction kinetics in the molten salt synthesis of MAX phases vary depending on the carbon structure. To explore an optimal preparation process, we used Cf as a substitute for PyC coatings. This choice was based on the similarity in the amorphous structures and defect levels of Cf and PyC. Furthermore, Cf is more readily available and allows for better control of single variables. Building on our previous work on synthesizing carbon-containing MAX phases at low temperatures using the molten salt method [34,35,36,37], we adopted two different synthesis routes for MAX phase coatings using Cf:
- Direct Molten Salt Route: Sc, Sn, and Cf were directly mixed to form Sc2SnC.
- Two-Step Molten Salt Route: Sc and Cf were first mixed to form an intermediate phase, ScC, followed by the introduction of Sn to synthesize Sc2SnC.
In both routes, the reactions were conducted at 1000 °C for 3 hours, with a Sc-to-Cf molar ratio of 1:1. The XRD patterns of Sc2SnC synthesized via these two routes are shown in Figure 4. It is evident that neither approach resulted in the significant formation of Sc2SnC. In the direct molten salt route (Route 1), the primary phase formed was ScC (Fm3m, PDF#97-004-3524), with only trace amounts of Sc2SnC (P6₃/mmc, Ref. [19]). In the two-step route (Route 2), the intermediate phase ScC was successfully synthesized first; however, after introducing Sn, Sc2SnC was still not observed. Instead, small amounts of Sc2O3 and Sc2OC were detected, possibly due to oxidation interference. Raman spectroscopy analysis, as shown in Figure 4b, further supports these findings. In Route 1, three characteristic peaks were observed at 139, 207, and 217 cm-1, corresponding to the ω1, ω2, and ω3 vibrational modes of the 211-type MAX phase. In contrast, Route 2 exhibited only the ω3 peak, with no other distinct features [38,39,40,41]. Notably, the ω4 vibrational mode at approximately 380 cm-1 was not clearly detected. Additionally, peaks observed in the 380-800 cm-1 range correspond to carbide materials [42,43], suggesting that the broadening of the ScC peaks in the XRD spectrum may be attributed to non-stoichiometric scandium carbide or ScCx with a high defect density.
Figure 5 further presents the SEM morphology of the Sc2SnC coatings synthesized via the two routes. In Route 1, a uniform ultra-thin coating composed of nanocrystals was formed. In Route 2-1, ScCx exhibited a well-defined coating morphology on the fiber surface, accompanied by a small number of particles. Following the introduction of Sc and Sn, a significant number of nanocrystals appeared on the surface, identified as granular Sc2O3 and nano-platelet-like Sc2SnC. Additionally, partial oxidation led to the formation of accordion-like Sc2OC or complete oxidation into Sc2O3, causing the ScCx layer to peel off, as indicated by the white arrows in Figure 5(c-1). Consequently, in Route 2-2, oxidation resulted in the loss of Sc, which restricted the reaction process. Given the low conversion rate of Sc2SnC, it is likely that element diffusion and reaction kinetics are the key controlling factors, which will be further discussed. Based on this analysis, the direct synthesis method (Route 1) is more favorable for the fabrication of Sc2SnC coatings.
As the Sc2SnC synthesized by the direct method shows only faint diffraction peaks in Figure 4a, the reaction appears incomplete under relatively stoichiometric ratio, likely due to insufficient diffusion time. To address this, we extended the reaction duration. As shown in Figure 6, prolonging the reaction time significantly increased the content of both Sc2SnC and ScCx, with peak concentrations reached after 4 hours of reaction. However, with further extension, partial transformation of ScCx occurred due to its metastable nature and tendency to oxidize. Specifically, ScCx either oxidized to form Sc2OC (Fm3m, PDF#97-015-6683) or was reduced to Sc3C4 (P4/mnc, PDF#97-007-1145). As the fibers were held at high temperature for a longer period, the transformation to Sc2OC continued, while the formation of Sc3C4 was limited due to the restricted diffusion of carbon. Both transformation pathways are accompanied by lattice expansion, which can induce stress or even cause cracking. Overall, excessive reaction time can damage the fibers, leading to coating delamination or pulverization.
Figure 7 presents the microstructural morphology of Sc2SnC coatings formed at different reaction durations. At 3 hours, the Sc2SnC appears as isolated hexagonal sheets that seem to be “embedded” within Cf. This unique morphology resembles the loading of nanocrystals rather than a uniform coating, which is confirmed by mapping in Figure 8. As the reaction proceeds, the Sc2SnC sheets gradually accumulate and form a dense coating through a radial growth mode. After 4 hours of treatment (as shown in Figure 7b), the material exhibits a well-defined crystalline structure. Interestingly, as the reaction continues, these distinctive crystals grow independently, reaching a maximum size of approximately 5 µm. Correspondingly, the thickness of the Sc2SnC coating increases to around 50 nm, 500 nm, and 2.9 µm after 3, 4, and 5 hours of reaction, respectively. A scandium carbide (ScCx) layer is observed only in the 5-hour samples. It forms a dense interfacial layer between the Sc2SnC coating and the Cf substrate, and its thickness increases along with the Sc2SnC layer. Although it is challenging to distinguish ScCx from Sc2OC and Sc3C4 using SEM imaging and elemental mapping, these by-products possess larger lattice parameters and introduce residual stress within the coating. The stress may ultimately lead to the formation of cracks, a phenomenon that already observed in the 4-hour sample.
According to the growth mechanism of molten salt synthesis for MAX phases, the general reaction Equations (2)-(4) are listed in order of increasing temperature. Eutectic salts create an ionized environment at relatively low temperatures, facilitating the formation of Sc-Sn intermetallic compounds and ScCx. ScCx is considered the most critical intermediate product in the reaction. Due to the high melting points of both scandium and carbon, the carbide layer can only form at around 1000 °C, primarily at reaction interfaces characterized by abundant defects and preferred crystallographic orientations. Once ScCx is formed, the reaction between the Sc-Sn intermetallic compound and scandium carbide can proceed. With the assistance of molten salts, elemental species are rapidly transported to the reaction interface. Meanwhile, the abundant defects in the non-stoichiometric ScCx provide pathways for the diffusion of Sc and Sn. As a result, Sc2SnC exhibits a high nucleation and growth rate, which explains the absence of a distinct ScCx layer during the early stages of the reaction. Furthermore, the presence of multiple close-packed crystal planes and a high c/a ratio leads to anisotropic growth behavior in Sc2SnC, typically resulting in flake-like structures.
Sc + Sn ↔ Sc-Sn (intermetallic)
The reaction follows a template synthesis mechanism in which Sc2SnC inherits the structure of its precursors — from the graphite-like PyC layer to the cubic ScC phase. Specifically, under suitable conditions, Sc2SnC nucleates and grows along the [111] plane or its equivalent planes, such as [111], which is rotated 75.53° from [111] plane of cubic crystal. This growth is typically aligned parallel or nearly perpendicular to the fiber axis. In addition, the slight preferred orientation of ScC in the {200} plane provides numerous nucleation sites along the {111} family of planes. As a result, Sc2SnC flakes initially grow nearly perpendicular to the surface of the Cf. Once a continuous and dense Sc2SnC coating is formed, the diffusion channels are largely closed. At this point, the metastable ScC phase (with a formation enthalpy of ΔHform = – 0.138 eV, according to the Materials Project) may transform into the thermodynamically stable Sc3C4 phase (ΔHform = –0.408 eV) via carbon diffusion. This transformation could lead to structural pulverization and delamination. Ultimately, a multilayered interface consisting of ScCx and Sc2SnC is formed on the surface of Cf.
3.2.2. Silicon Carbide Fiber Coating (SiCf/ScCx/Sc2SnC)
Based on the growth mechanism observed on Cf, the reaction was transferred onto SiCf substrates coated with an approximately 370 nm PyC layer. The synthesis was performed at 1000 °C for 3 hours, using varying Sc:Sn molar ratios. Figure 9a presents the XRD patterns of all SiCf coatings. As the reaction progresses, the amorphous peak gradually diminishes, while the characteristic diffraction peaks of Sc2SnC and ScCx/Sc2OC start to appear. Notably, the Sc3C4 phase is only observed in the sample with a 3:2 ratio (SiCf/Sc2SnC-3:2). The composition of the interface is further confirmed by the Raman spectra shown in Figure 9b. Four distinct peaks at 139, 207, 217, and 380 cm-1 correspond to the typical vibrational modes of the 211-type MAX phase. Among these, the peaks at 207 and 380 cm-1 show significant enhancement, indicating structural differences in the coating, even though the XRD patterns remain relatively unchanged. Additionally, a previously unreported peak appears around 320 cm-1, for which no known vibrational mode has been identified. Some studies have observed similar satellite peaks in 211 MAX phases, although they have not been extensively studied. As expected, Sc2SnC coatings formed under different Sc:Sn ratios exhibit three distinct morphologies. Under the stoichiometric condition (Sc:Sn = 2:1), Sc2SnC displays the same flake-like morphology as seen on Cf substrates, as shown in Figure 10a. The elemental mapping of the scaly surface is presented in Figure 11(h-l). The cross-sectional image reveals that a significant amount of PyC remains unreacted.
When the Sc:Sn atomic ratio is increased to 3:1, the resulting coating becomes dense and continuous, consisting of nanocrystalline structures. Notably, some surface particles exhibit abnormal grain growth, forming equiaxed crystals with diameters up to 1.8 μm. However, this rapid grain growth leads to structural inhomogeneity and localized pulverization. In cross-sectional observations, the Sc₂SnC layer shows weak adhesion to the unreacted PyC layer, likely due to residual stresses arising from mismatched thermal expansion coefficients.
At a Sc:Sn ratio of 3:2, a more uniform and finer Sc₂SnC coating is formed, with a thickness of approximately 1.4 μm. No delamination is observed between the coating and the SiCf substrate. The measured thickness is consistent with the theoretical lattice expansion from PyC (a = 0.247 nm, c = 0.693 nm; graphite, PDF#97-061-7290) to Sc₂SnC (a = 0.337 nm, c = 1.464 nm, Ref. [19]), indicating the complete transformation of PyC. This coating exhibits excellent uniformity and strong interfacial adhesion, with surface cracks attributed only to the formation of by-products.
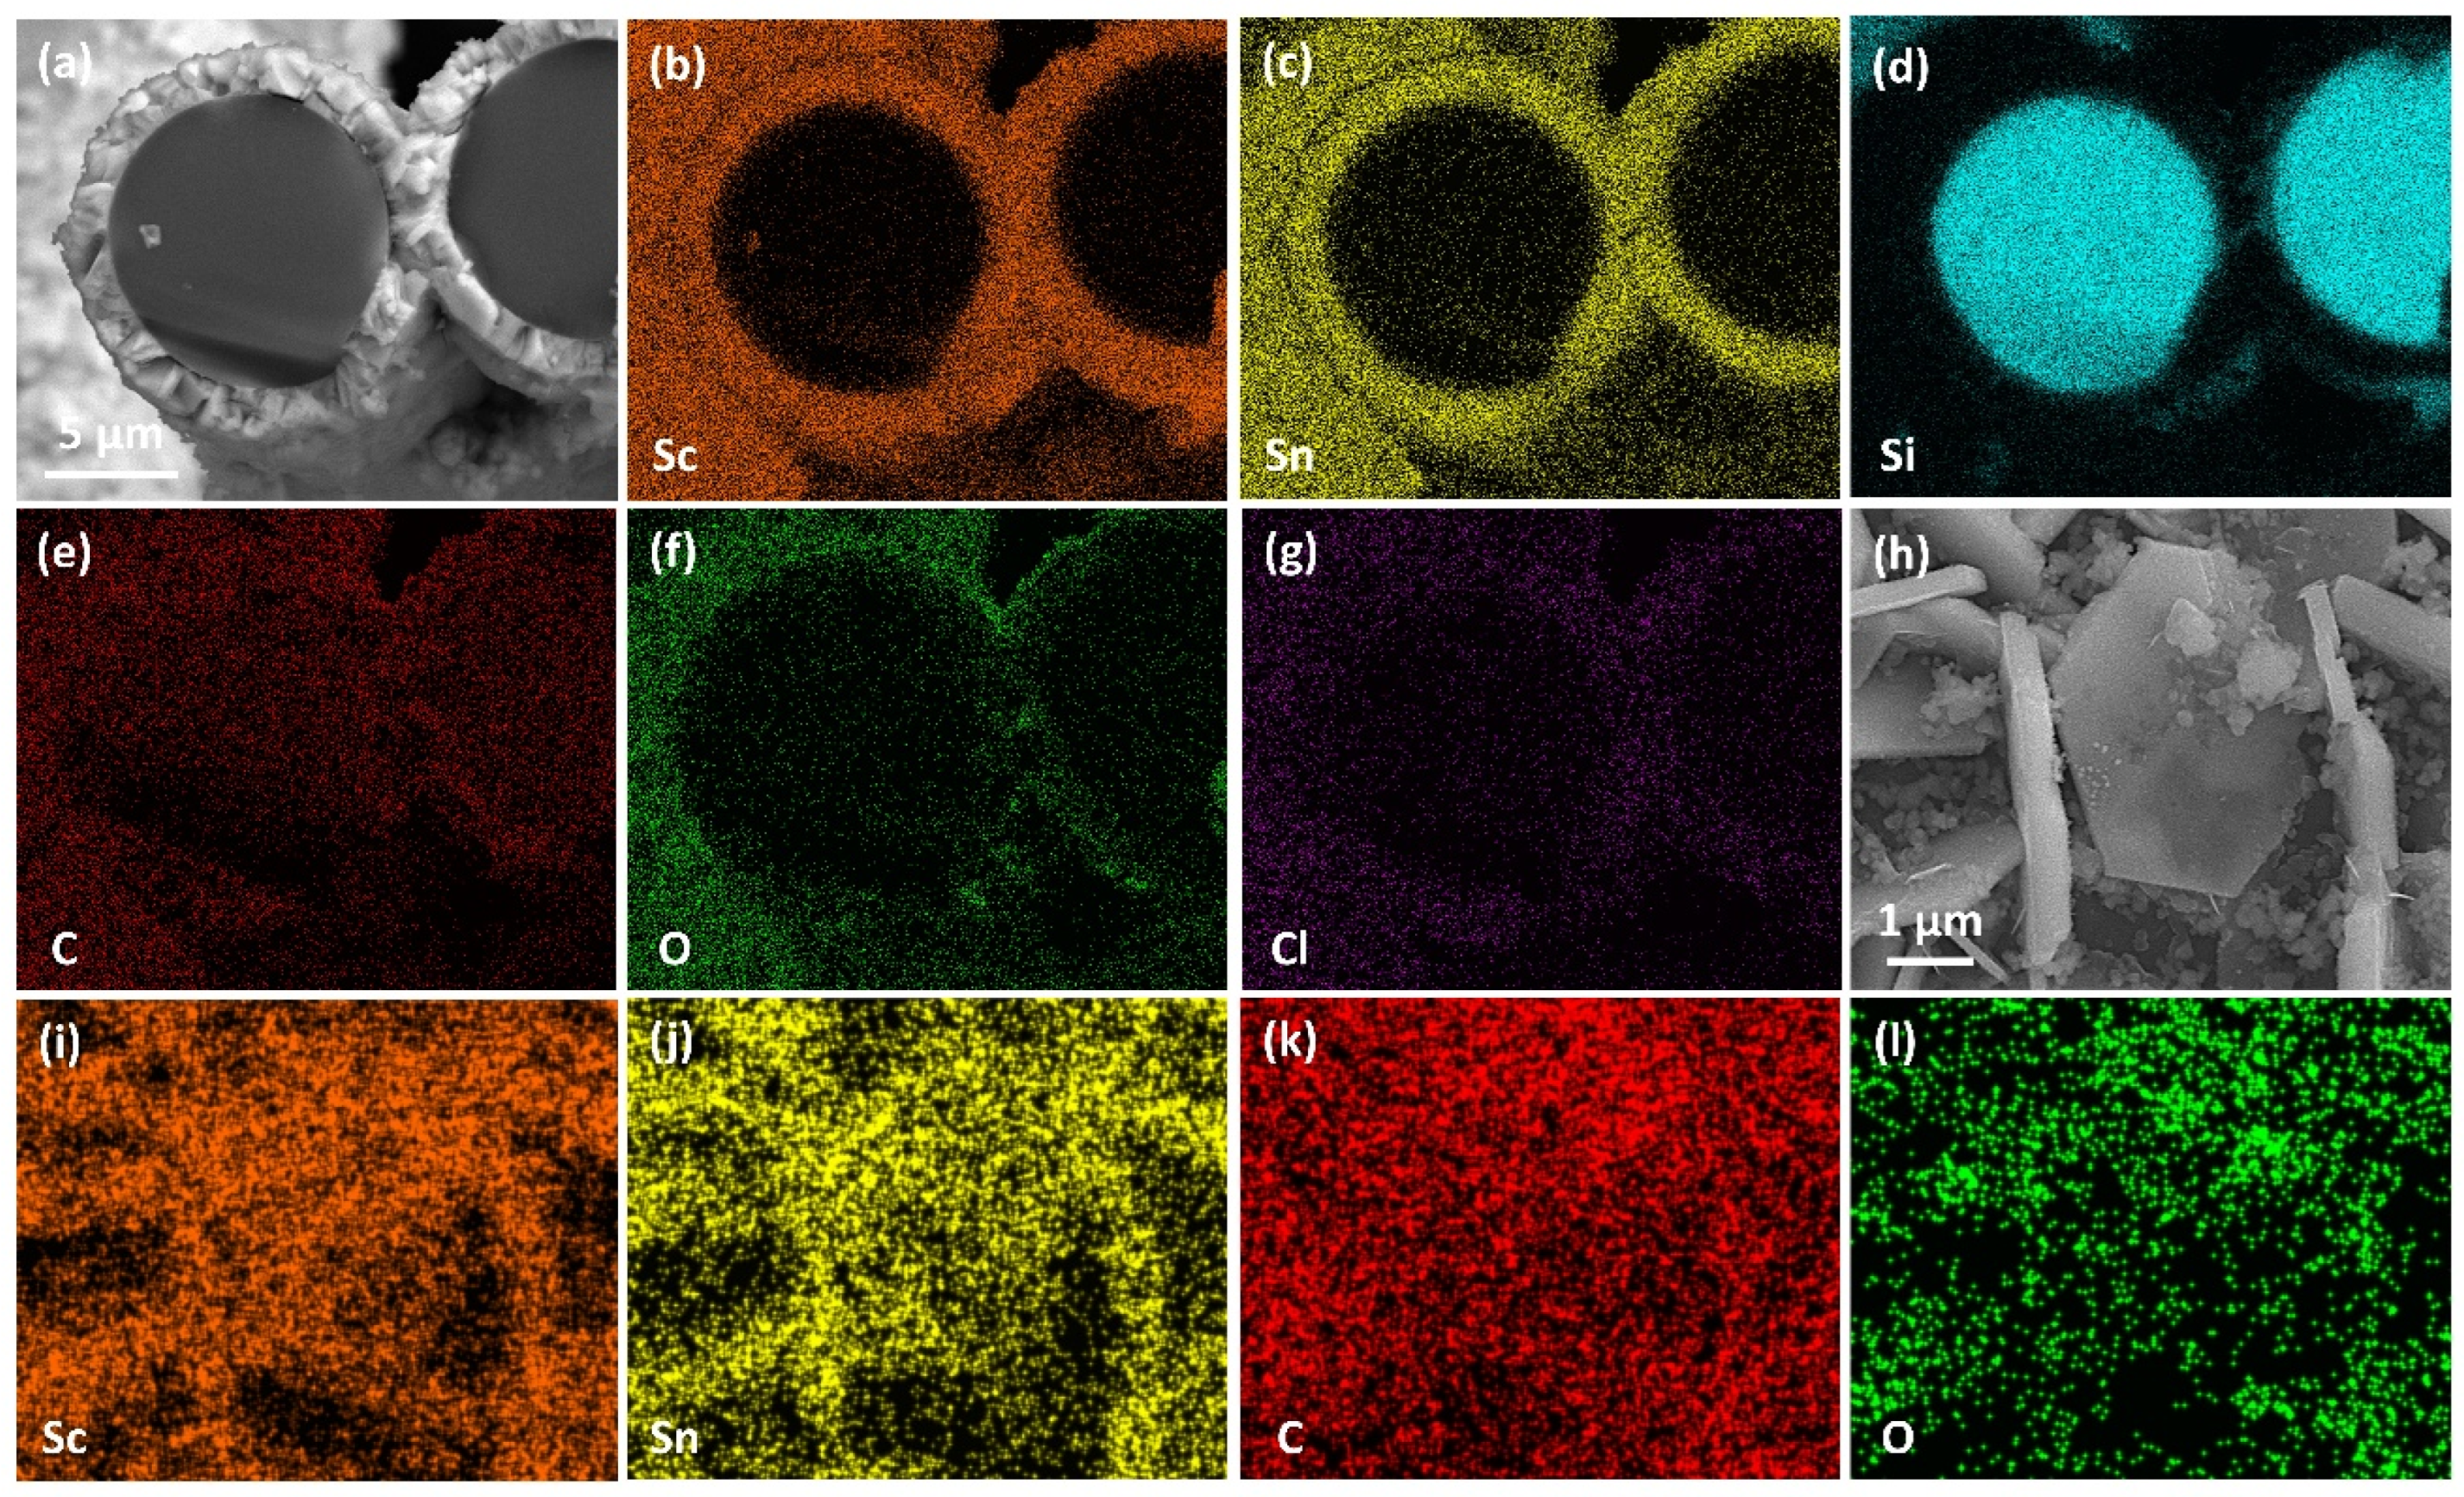
Cross-sectional elemental mapping (Figure 11a–g) confirms the uniform distribution of scandium and tin within the coating, as well as the structural integrity of the SiCf substrate. In addition, the high oxygen concentration detected on the surface is likely due to the formation of Sc2OC and the adsorption of atmospheric oxygen.
4. Conclusions
- (1)
- A dense and uniformly coated PyC layer was successfully deposited on SiCf via CVD by precisely controlling the reaction temperature at 1000 °C and setting the CH4:C2H2 gas ratio to 90:60.
- (2)
- ScCx/Sc2SnC composite coatings were synthesized on the surfaces of Cf and SiCf using a molten salt method. In the early stages of the reaction, isolated hexagonal Sc2SnC flakes nucleated and grew on the Cf surface. With extended reaction time, these nearly vertically oriented flakes gradually accumulated to form a continuous coating, with the thickness progressively increasing from 50 nm to 500 nm and ultimately to 2.9 μm.
- (3)
- During the reaction process, the formation of ScCx exhibited sluggish kinetics, making it a key intermediate that governed the overall reaction pathway. The high defect density and preferential orientation observed in ScCx contributed to the distinctive microstructure and growth direction of the resulting Sc2SnC phase. Raman spectroscopy confirmed the presence of both ScCx and Sc2SnC. However, due to its metastable nature, ScCx is prone to phase transformation into Sc2OC and Sc3C4, which may lead to cracking, pulverization, interfacial debonding, and eventual delamination of the coating—a challenge that remains difficult to mitigate.
Acknowledgments
This study was supported financially by the National Natural Science Foundation of China (grant no. 12435017) and the Ningbo Top-talent Team Program. Q. H. acknowledges support by Ten-Thousand Talents Plan of Zhejiang Province (grant no. 2022R51007).
References
- KATOH Y, OZAWA K, SHIH C, NOZAWA T, SHINAVSKI R J, HASEGAWA A, SNEAD L L. Continuous SiC fiber, CVI SiC matrix composites for nuclear applications: Properties and irradiation effects. Journal of Nuclear Materials 2014, 448, 448–476. [CrossRef]
- NASLAIN R, PAILLER R, LAMON J. Single- and Multi-Layered Interphases in SiC/SiC Composites Exposed to Severe Conditions: An Overview. Ceramics in Nuclear Applications. 2009, 1-18. [CrossRef]
- OUYANG Q, WANG Y F, XU J, LI Y S, PEI X L, MO G M, LI M A, LI P, ZHOU X B, GE F F, et al. Research Progress of SiC Fiber Reinforced SiC Composites for Nuclear Application. Journal of Inorganic Materials 2022, 37, 821–840. [CrossRef]
- DAHLQVIST M, BARSOUM M W, ROSEN J. MAX phases – Past, present, and future. Materials Today 2024, 72, 1–24. [CrossRef]
- DANG X, FAN X, YIN X, MA Y, MA X. Research Progress on Multi-functional Integration MAX Phases Modified Continuous Fiber-reinforced Ceramic Matrix Composites. Journal of Inorganic Materials 2020, 35, 29–34. [CrossRef]
- GONZALEZ-JULIAN J. Processing of MAX phases: From synthesis to applications. Journal of the American Ceramic Society 2021, 104, 659–690. [CrossRef]
- TALLMAN D J, HOFFMAN E N, CASPI E A N, GARCIA-DIAZ B L, KOHSE G, SINDELAR R L, BARSOUM M W. Effect of neutron irradiation on select MAX phases. Acta Materialia 2015, 85, 132–143. [CrossRef]
- MAGNUS C, COOPER D, JANTZEN C, LAMBERT H, ABRAM T, RAINFORTH M. Synthesis and high temperature corrosion behaviour of nearly monolithic Ti3AlC2 MAX phase in molten chloride salt. Corrosion Science 2021, 182, 109193. [CrossRef]
- ANG C, SILVA C, SHIH C, KOYANAGI T, KATOH Y, ZINKLE S J. Anisotropic swelling and microcracking of neutron irradiated Ti3AlC2–Ti5Al2C3 materials. Scripta Materialia 2016, 114, 74–78. [CrossRef]
- WANG C, YANG T, TRACY C L, LU C, ZHANG H, HU Y-J, WANG L, QI L, GU L, HUANG Q, et al. Disorder in Mn+1AXn phases at the atomic scale. Nature Communications 2019, 10, 622. [CrossRef]
- WANG J, SHU R, DONG Y, SHAO T, DENG Q H, ZHOU X B, HUANG F, DU S Y, WANG Z G, XUE J M, et al. Microstructure evolution of V2AlC coating on Zr substrate under He irradiation and their mechanical behavior. Scripta Materialia 2017, 137, 13–17. [CrossRef]
- TALLMAN D J, HE L, GARCIA-DIAZ B L, HOFFMAN E N, KOHSE G, SINDELAR R L, BARSOUM M W. Effect of neutron irradiation on defect evolution in Ti3SiC2 and Ti2AlC. Journal of Nuclear Materials 2016, 468, 194–206. [CrossRef]
- LI M, ZHOU X, YANG H, DU S, HUANG Q. The critical issues of SiC materials for future nuclear systems. Scripta Materialia 2018, 143, 149–153. [CrossRef]
- FILBERT-DEMUT I, BEI G, HöSCHEN T, RIESCH J, TRAVITZKY N, GREIL P. Influence of Ti3SiC2 Fiber Coating on Interface and Matrix Cracking in an SiC Fiber-Reinforced Polymer-Derived Ceramic. Advanced Engineering Materials 2015, 17, 1142–1148. [CrossRef]
- LI M, WANG K, WANG J, LONG D, LIANG Y, HE L, HUANG F, DU S, HUANG Q. Preparation of TiC/Ti2AlC coating on carbon fiber and investigation of the oxidation resistance properties. Journal of the American Ceramic Society 2018, 101, 5269–5280. [CrossRef]
- WANG K, LI M, LIANG Y, WANG J, HE L, DU S, HUANG Z, HUANG Q. Interface modification of carbon fibers with TiC/Ti2AlC coating and its effect on the tensile strength. Ceramics International 2019, 45, 4661–4666. [CrossRef]
- WANG J, WANG K, PEI X, LI M, YUAN Q, ZHU Y, YANG Y, ZHANG C, HE L, DU S, et al. Irradiation behavior of Cf/SiC composite with titanium carbide (TiC)-based interphase. Journal of Nuclear Materials 2019, 523, 10–15. [CrossRef]
- BARSOUM M W. The MN+1AXN phases: A new class of solids: Thermodynamically stable nanolaminates. Progress in Solid State Chemistry 2000, 28, 201–281. [CrossRef]
- LI Y B, QIN Y Q, CHEN K, CHEN L, ZHANG X, DING H M, LI M A, ZHANG Y M, DU S Y, CHAI Z F, et al. Molten Salt Synthesis of Nanolaminated Sc2SnC MAX Phase. Journal of Inorganic Materials 2021, 36, 773–778. [CrossRef]
- EKLUND P, BECKERS M, JANSSON U, HöGBERG H, HULTMAN L. The Mn+1AXn phases: Materials science and thin-film processing. Thin Solid Films 2010, 518, 1851–1878. [CrossRef]
- CHOWDHURY A, ALI M A, HOSSAIN M M, UDDIN M M, NAQIB S H, ISLAM A K M A. Predicted MAX Phase Sc2InC: Dynamical Stability, Vibrational and Optical Properties. Physica Status Solidi (B) 2018, 255, 1700235. [CrossRef]
- IVANOV L I, IVANOV V V, LAZORENKO V M, PLATOV Y M, TOVTIN V I, TOROPOVA L S. Radiation resistance and parameters of activation of aluminium-magnesium-scandium and aluminium-magnesium-vanadium alloys under neutron irradiation. Journal of Nuclear Materials 1992, 191–194, 1075–1079. [CrossRef]
- WANG C, TRACY C L, EWING R C. Radiation effects in Mn+1AXn phases. Applied Physics Reviews 2020, 7(4). [CrossRef]
- XIAO Y, MA C, XU H, LI G, LIU C, ZHENG R, LI L. Mechanical properties and microstructural evolution of Cansas-III SiC fibers after thermal exposure in different atmospheres. Ceramics International 2022, 48, 32804–32816. [CrossRef]
- MA Y, MENG X, CUI Y, KOU S, YANG S, GUO C, DENG J, FAN S. Effect of heat treatment on interface failure behavior in SiCf/PyC/SiC composites reinforced with Cansas-3 fibers. Ceramics International 2024, 50, 28102–28112. [CrossRef]
- WANG P, LIU F, WANG H, LI H, GOU Y. A review of third generation SiC fibers and SiCf/SiC composites. Journal of Materials Science & Technology 2019, 35, 2743–2750. [CrossRef]
- Narottam, P.B. Handbook of Ceramic Composites; Springer: New York, NY, USA, 2005. [Google Scholar] [CrossRef]
- BERNARD S, CORNU D, MIELE P, WEINMANN M, ALDINGER F. Polyborosilazane-Derived Ceramic Fibers in the Si-B-C-N Quaternary System for High-Temperature Applications [M]. Mechanical Properties and Performance of Engineering Ceramics and Composites: Ceramic Engineering and Science Proceedings. 2005, 35-42. [CrossRef]
- KANIYOOR A, RAMAPRABHU S. A Raman spectroscopic investigation of graphite oxide derived graphene. AIP Advances 2012, 2, 032183. [CrossRef]
- DING J, SHAO H, HU B, LIU D, SHEN L, SHEN Q. Effect of Heat Treatment on the Shear Strength of SiC/PyC/SiC Composites. Journal of Materials Engineering and Performance 2024, 33, 13803–13814. [CrossRef]
- YIFAN X, WEIJIE L, ZHONGWEI Z, XU P, YU L. Process Control of PyC Interphases Microstructure and Uniformity in Carbon Fiber Cloth. Journal of Inorganic Materials 2024, 39, 399–408. [CrossRef]
- ALEXANDER R, KAUSHAL A, RAO P T, PRAKASH J, DASGUPTA K. Identification and classification of disordered carbon materials in a composite matrix through machine learning approach integrated with Raman mapping. Diamond and Related Materials 2024, 142, 110741. [CrossRef]
- SADEZKY A, MUCKENHUBER H, GROTHE H, NIESSNER R, PöSCHL U. Raman microspectroscopy of soot and related carbonaceous materials: Spectral analysis and structural information. Carbon 2005, 43, 1731–1742. [CrossRef]
- DASH A, VAßEN R, GUILLON O, GONZALEZ-JULIAN J. Molten salt shielded synthesis of oxidation prone materials in air. Nature Materials 2019, 18, 465–470. [CrossRef]
- SUN Q, ZHU S, SHEN Z, LIU Y, WU C, KANG L, YANG Y. Molten-salt assisted synthesis of two-dimensional materials and energy storage application. Materials Today Chemistry 2023, 29, 101419. [CrossRef]
- LIU X, FECHLER N, ANTONIETTI M. Salt melt synthesis of ceramics, semiconductors and carbon nanostructures. Chemical Society Reviews 2013, 42, 8237–8265. [CrossRef]
- LI S, SONG J, CHE Y, JIAO S, HE J, YANG B. Advances in Molten Salt Synthesis of Non-oxide Materials. Energy & Environmental Materials 2023, 6, e12339. [CrossRef]
- PRESSER V, NAGUIB M, CHAPUT L, TOGO A, HUG G, BARSOUM M W. First-order Raman scattering of the MAX phases: Ti2AlN, Ti2AlC0.5N0.5, Ti2AlC, (Ti0.5V0.5)2AlC, V2AlC, Ti3AlC2, and Ti3GeC2. Journal of Raman Spectroscopy 2012, 43, 168–172. [CrossRef]
- SPANIER J E, GUPTA S, AMER M, BARSOUM M W. Vibrational behavior of the Mn+1AXn phases from first-order Raman scattering (M=Ti, V, Cr, A=Si, X=C, N). Physical Review B 2005, 71, 012103. [CrossRef]
- BENTZEL G W, NAGUIB M, LANE N J, VOGEL S C, PRESSER V, DUBOIS S, LU J, HULTMAN L, BARSOUM M W, CASPI E A N. High-Temperature Neutron Diffraction, Raman Spectroscopy, and First-Principles Calculations of Ti3SnC2 and Ti2SnC. Journal of the American Ceramic Society 2016, 99, 2233–2242. [CrossRef]
- YU J, CUI L, HE H, YAN S, HU Y, WU H. Raman spectra of RE2O3 (RE=Eu, Gd, Dy, Ho, Er, Tm, Yb, Lu, Sc and Y): laser-excited luminescence and trace impurity analysis. Journal of Rare Earths 2014, 32, 1–4. [CrossRef]
- KALEMOS A, MAVRIDIS A, HARRISON J F. Theoretical Investigation of Scandium Carbide, ScC. The Journal of Physical Chemistry A 2001, 105, 755–759. [CrossRef]
- KLEIN M V, HOLY J A, WILLIAMS W S. Raman scattering induced by carbon vacancies in TiCx. Physical Review B 1978, 17, 1546–1556. [CrossRef]
Figure 4.
(a) XRD pattern and (b) Raman spectra of Cf reacted in Route 1 and Route 2.
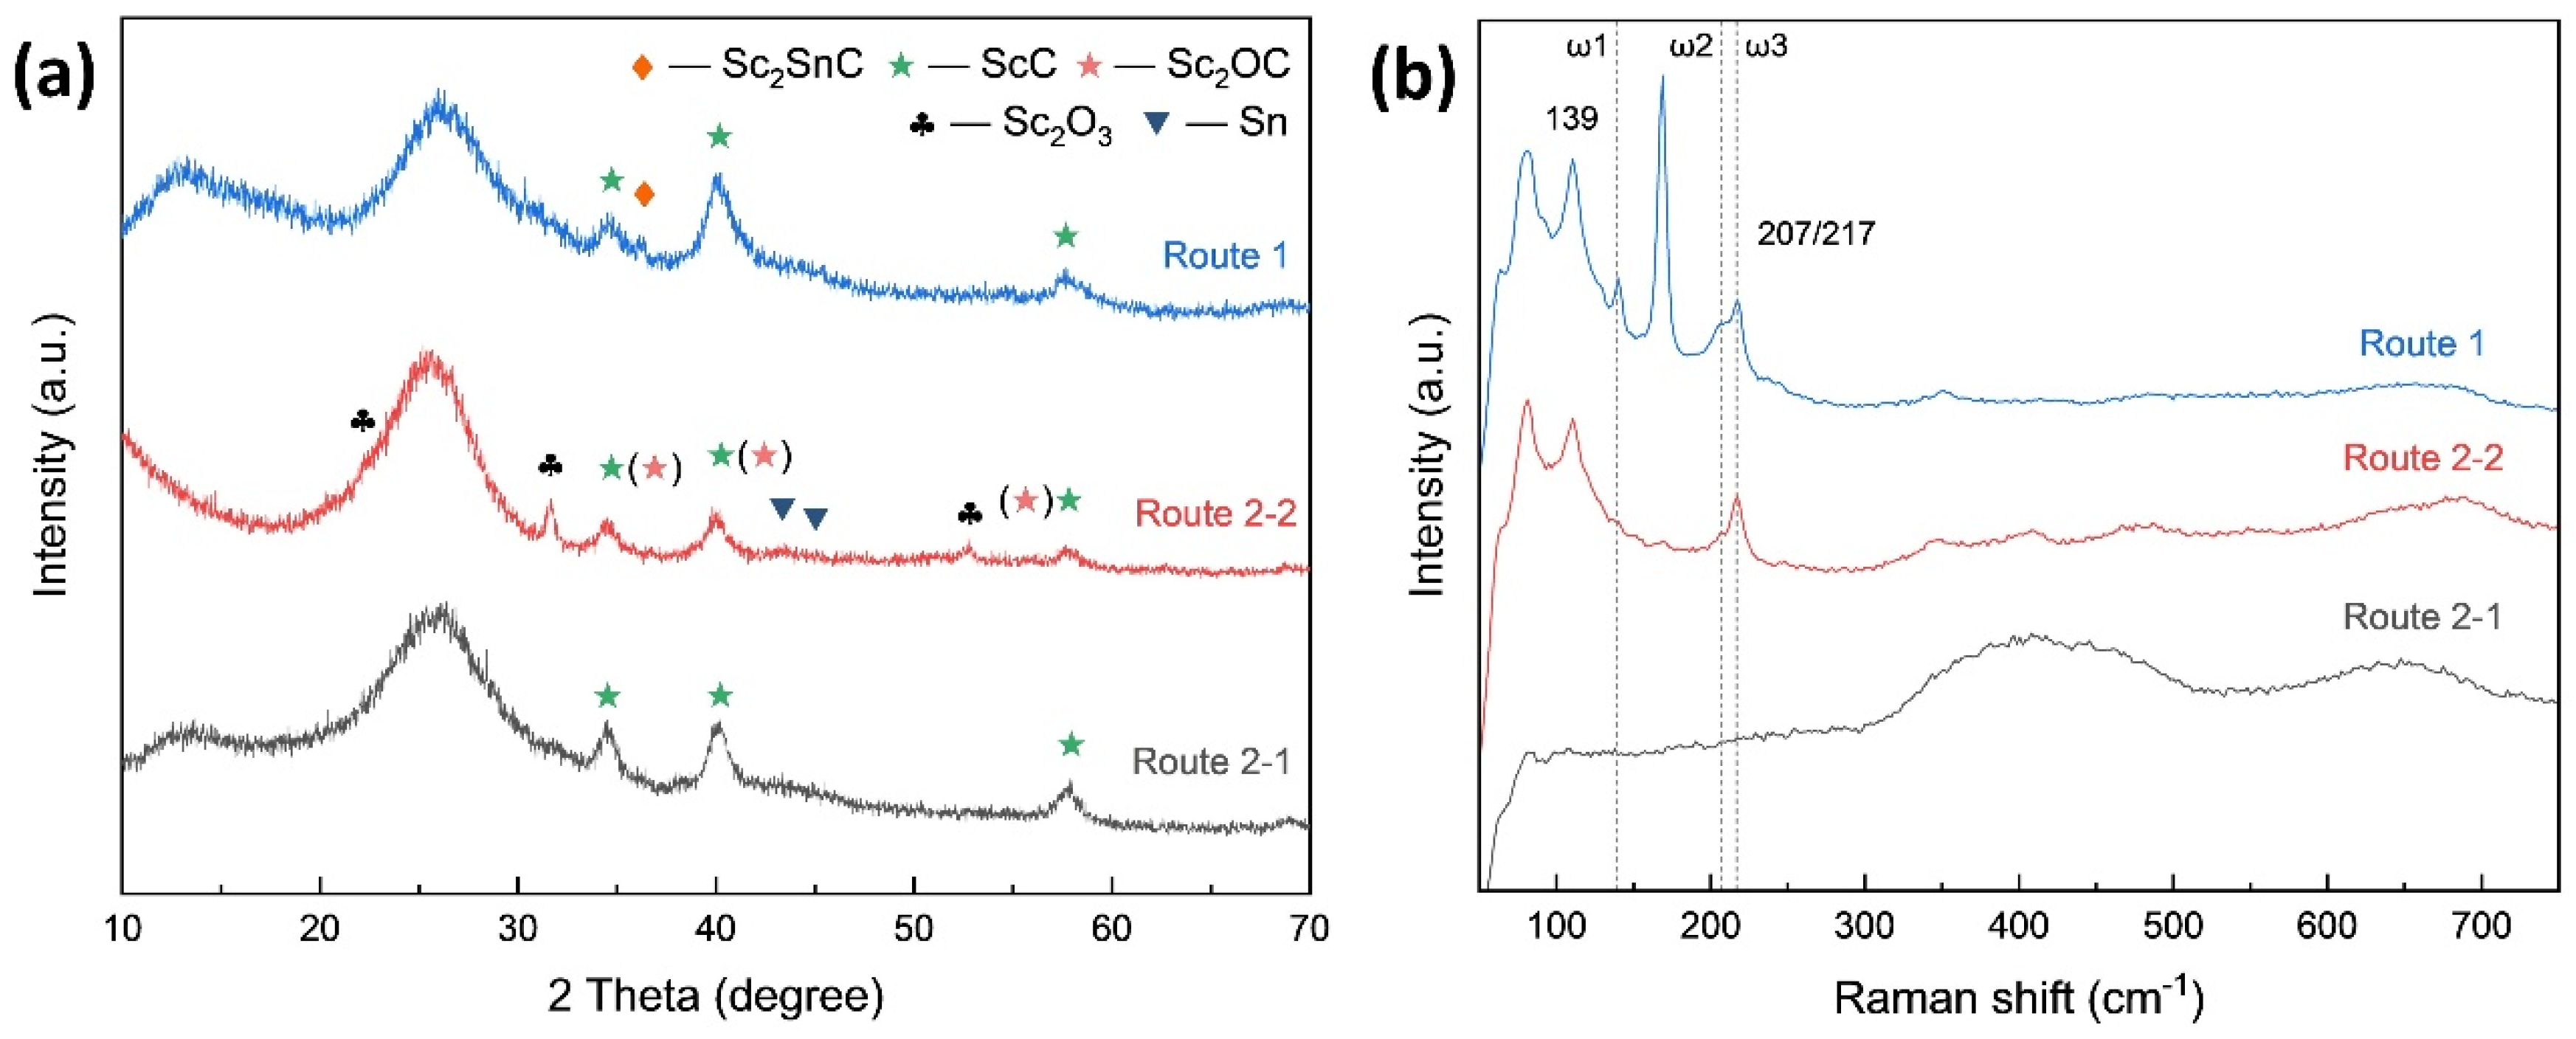
Figure 5.
The (1) overview and (2) detailed surface morphology of Cf after (a) Route 1, (b) first step of Route 2, (c) second step of Route 2.
Figure 5.
The (1) overview and (2) detailed surface morphology of Cf after (a) Route 1, (b) first step of Route 2, (c) second step of Route 2.
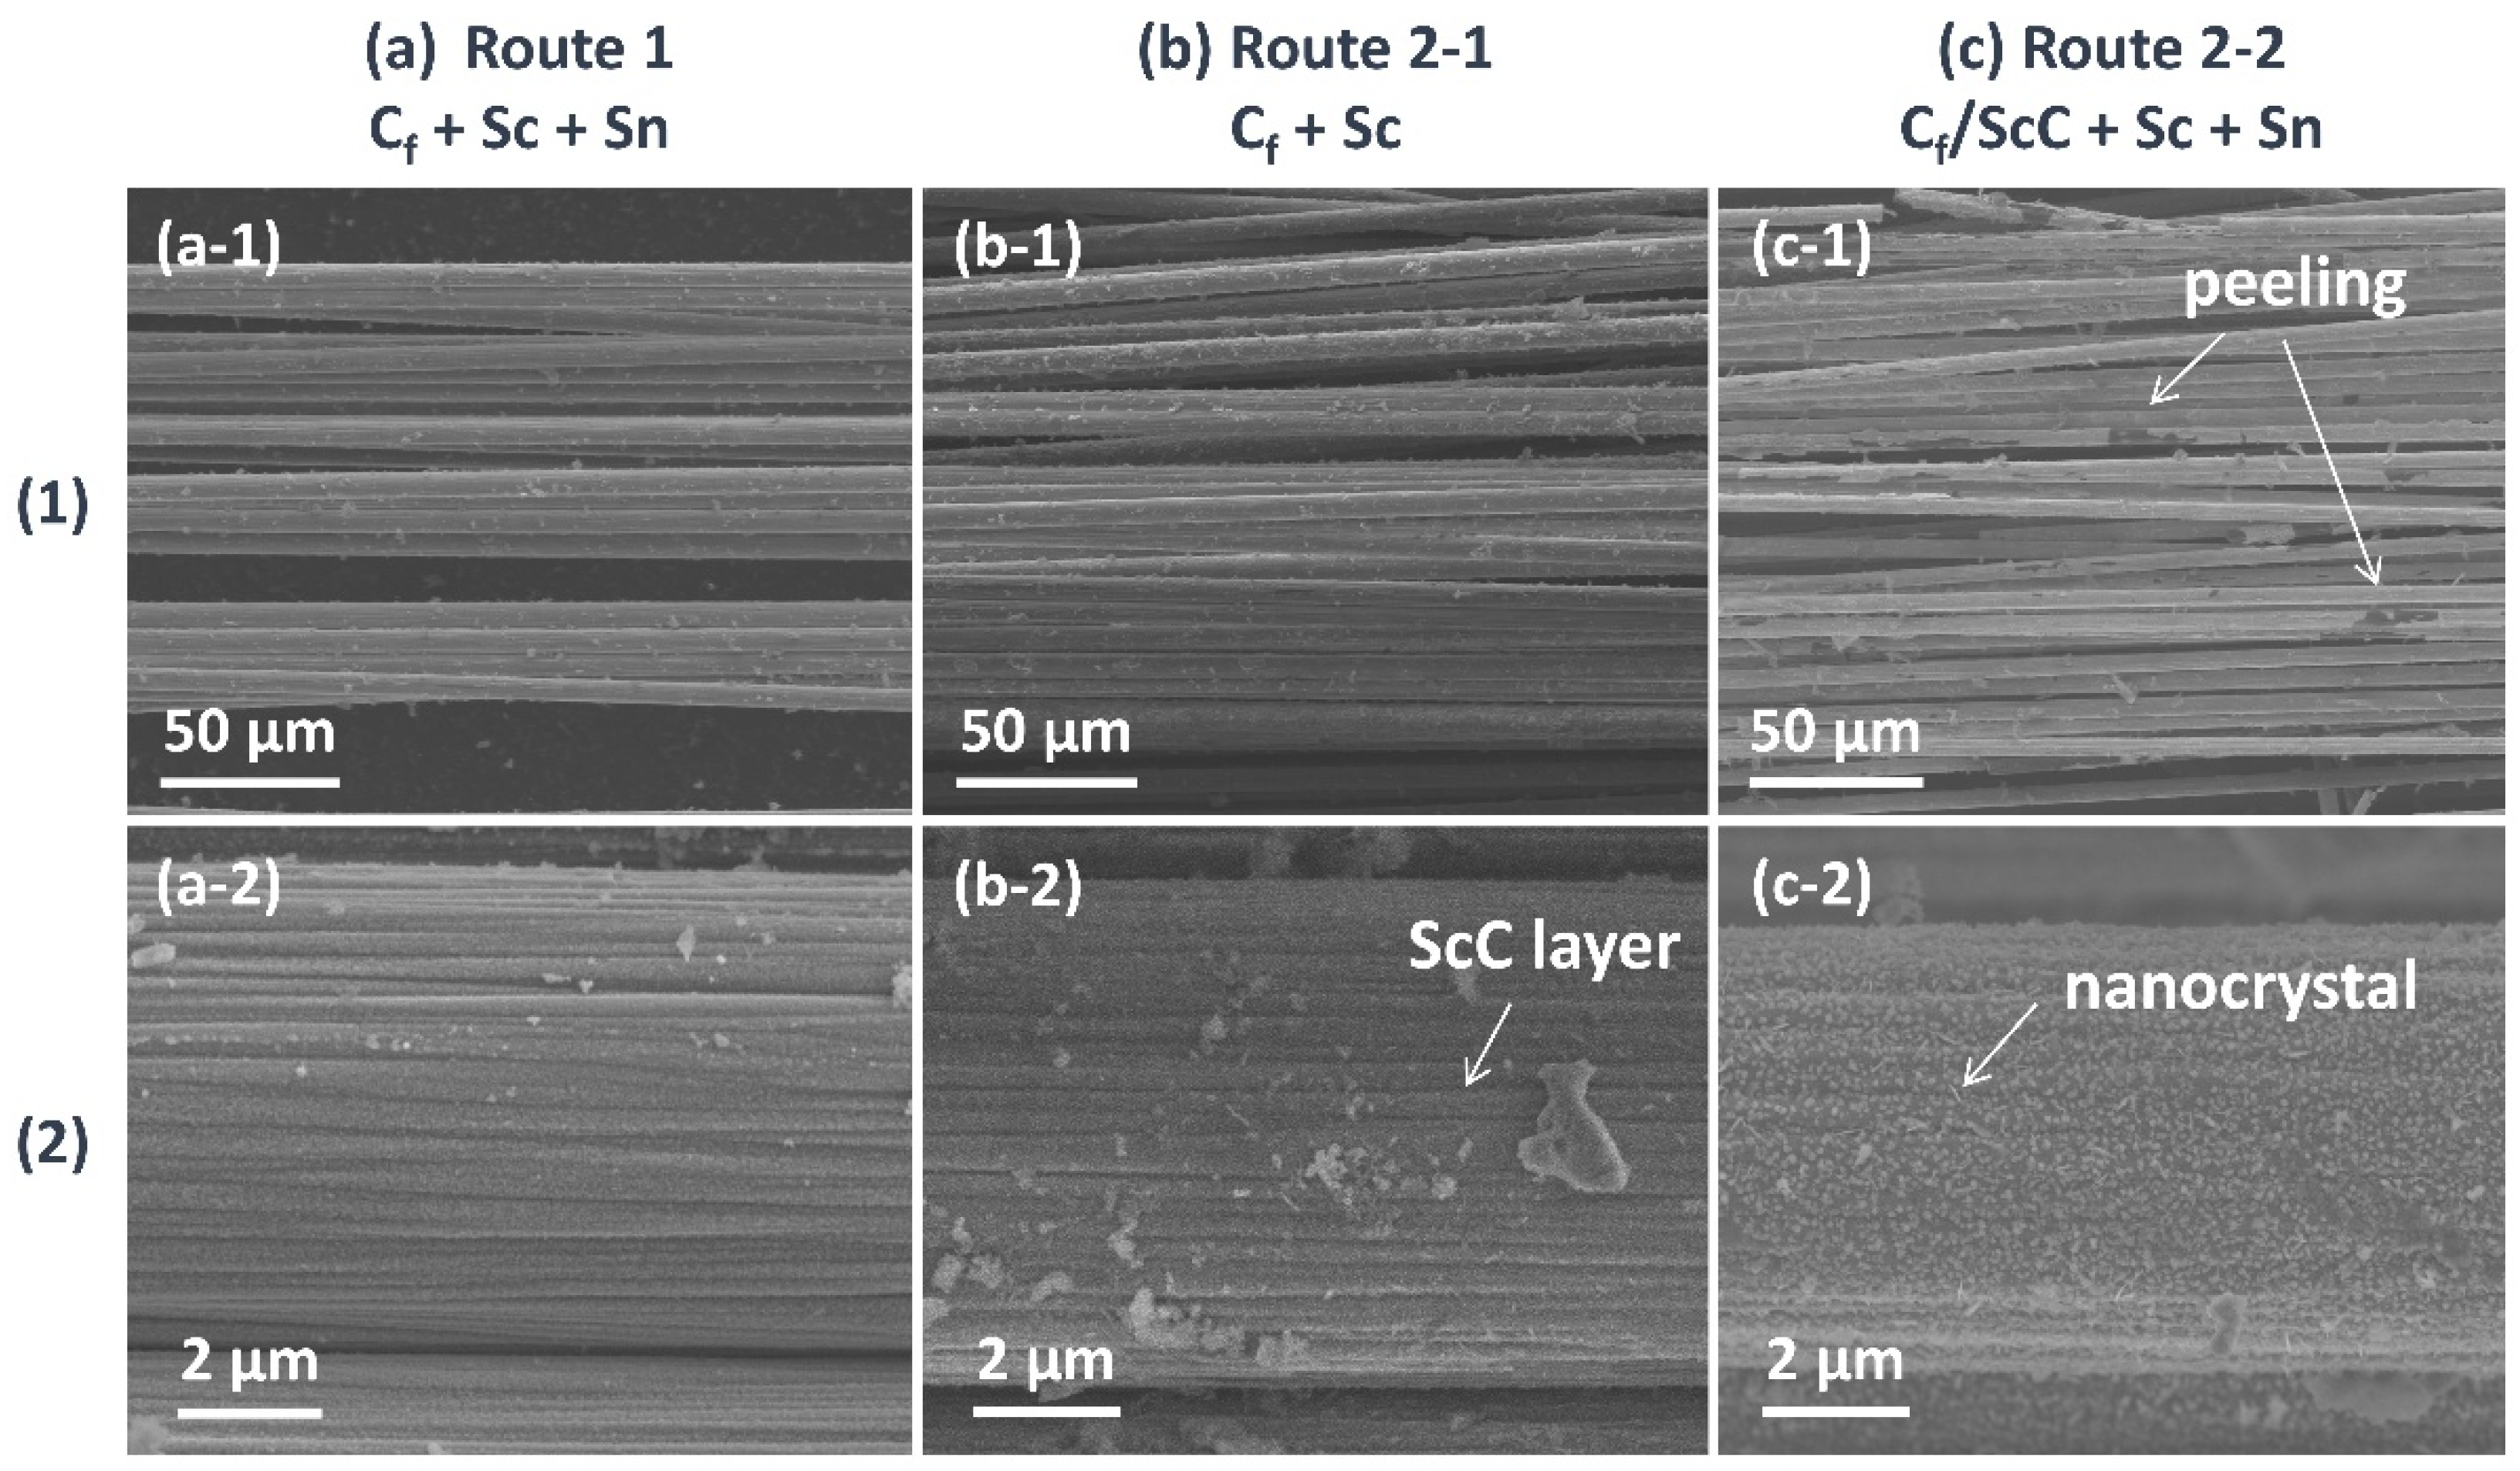
Figure 6.
XRD pattern of Cf after long term dwelling in molten salt.
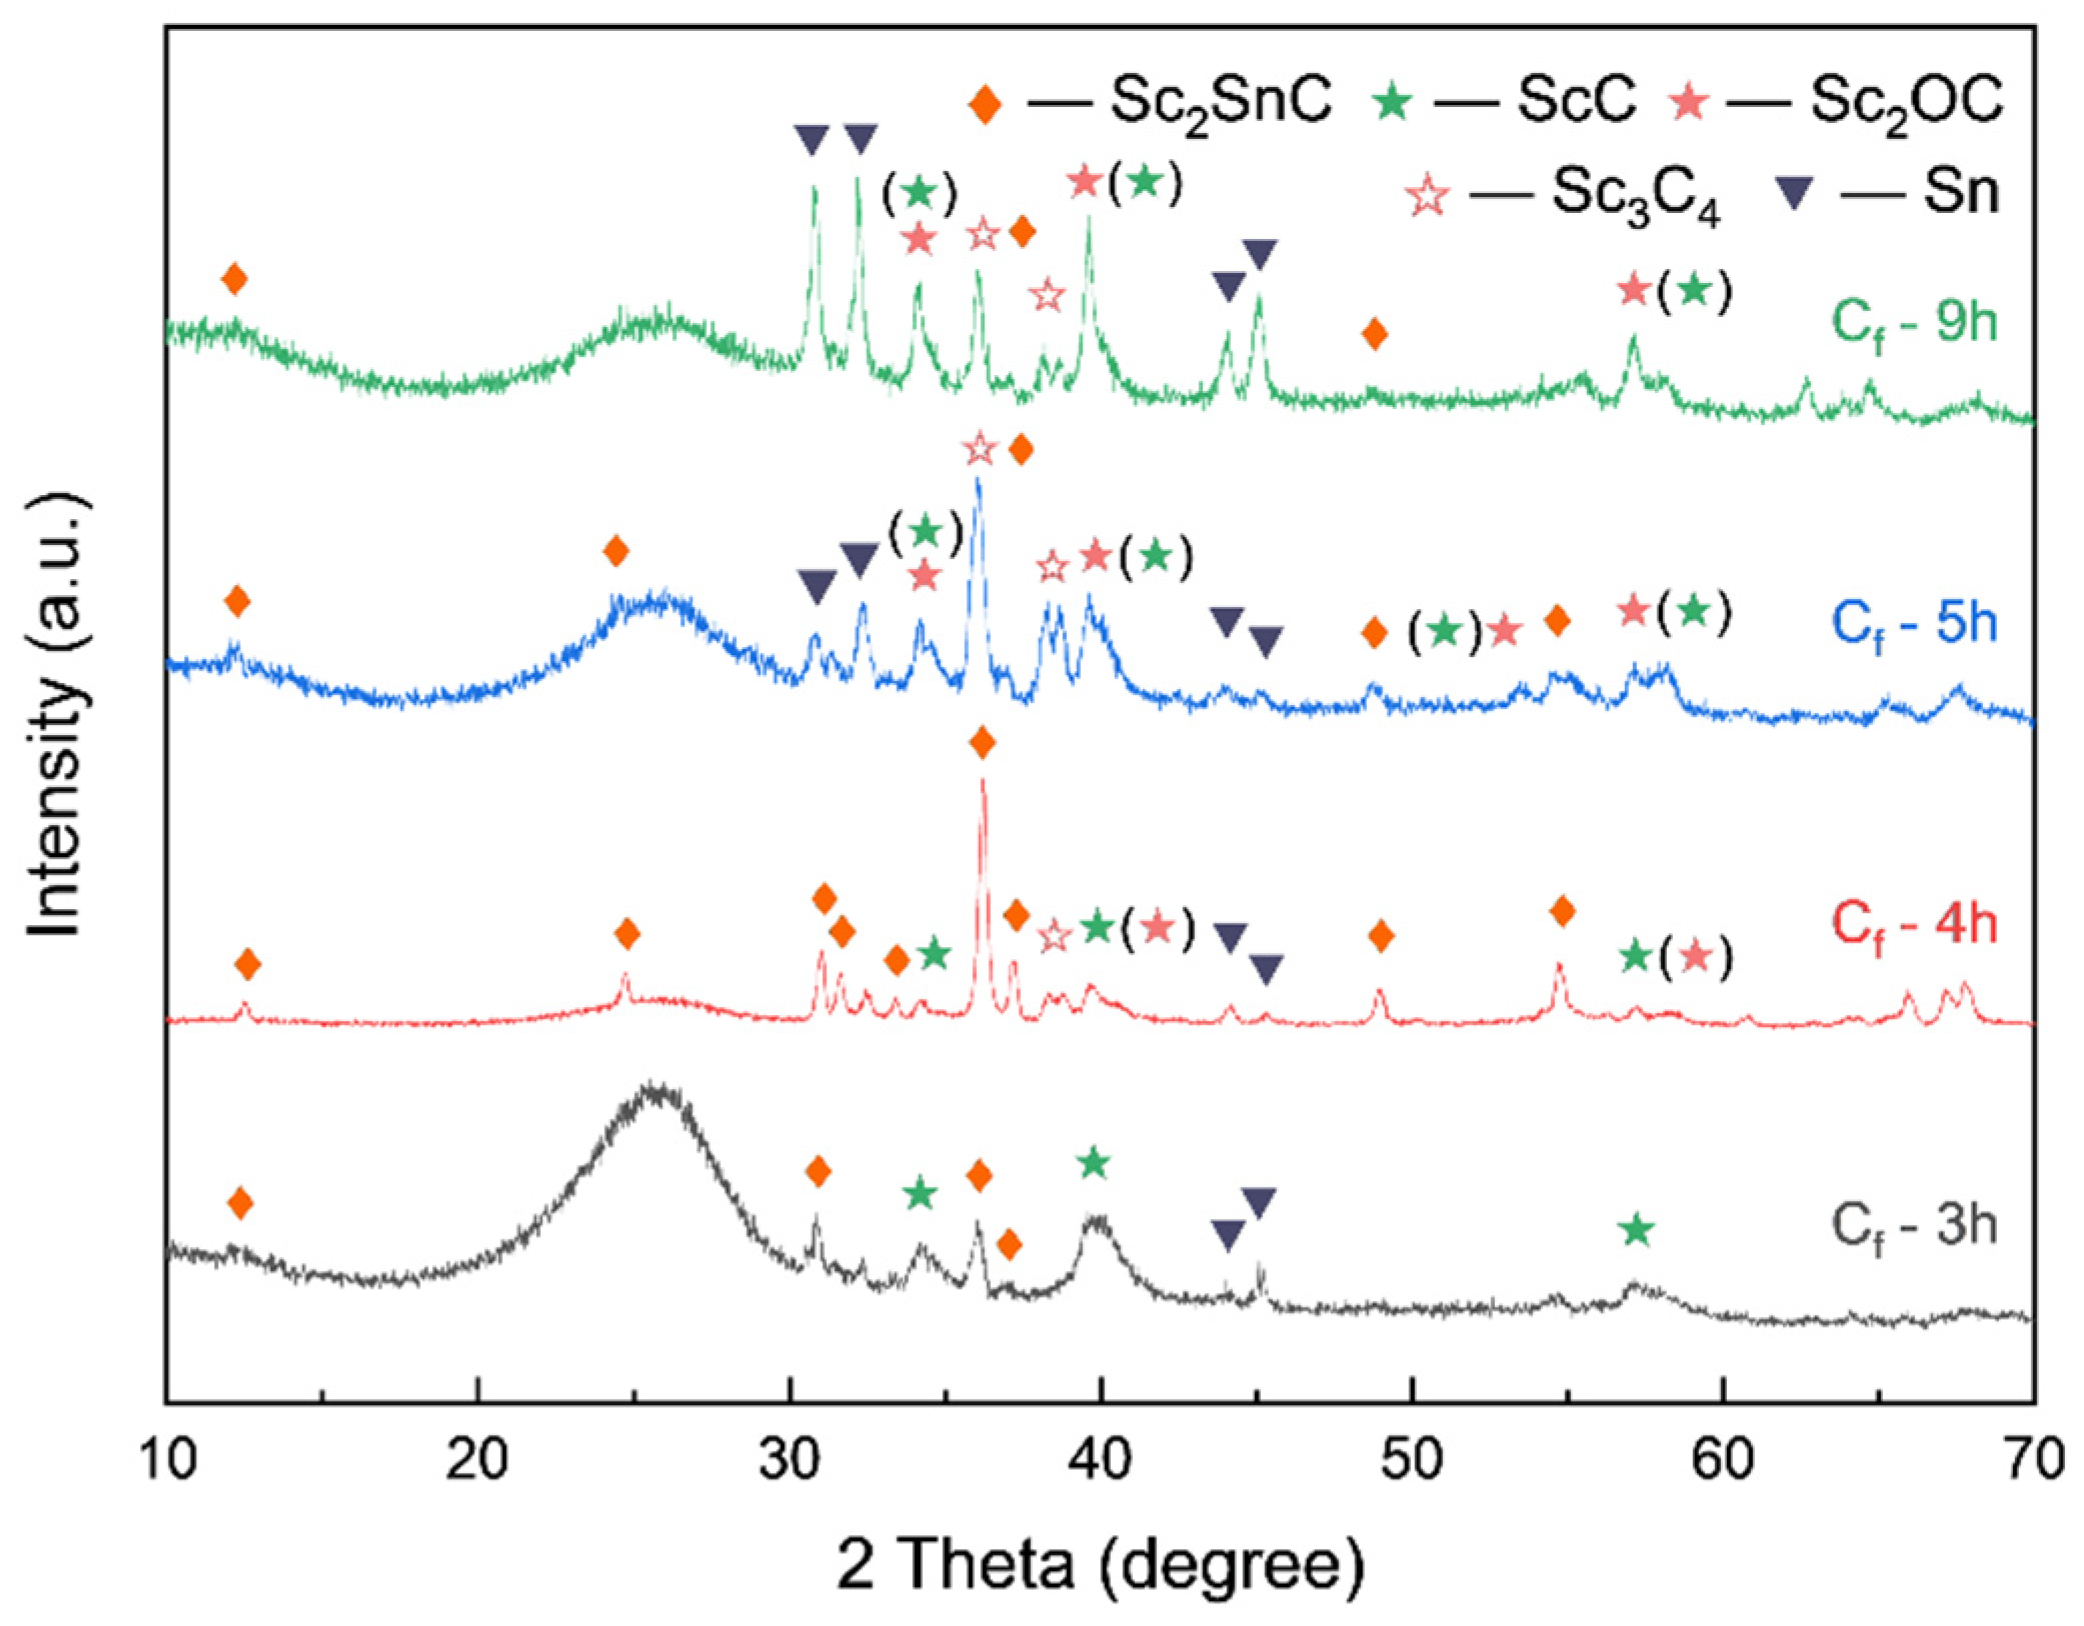
Figure 7.
The cross-sectional and surface morphology evolution of Cf after (a) 3h, (b) 4h and (c) 5h reaction.
Figure 7.
The cross-sectional and surface morphology evolution of Cf after (a) 3h, (b) 4h and (c) 5h reaction.
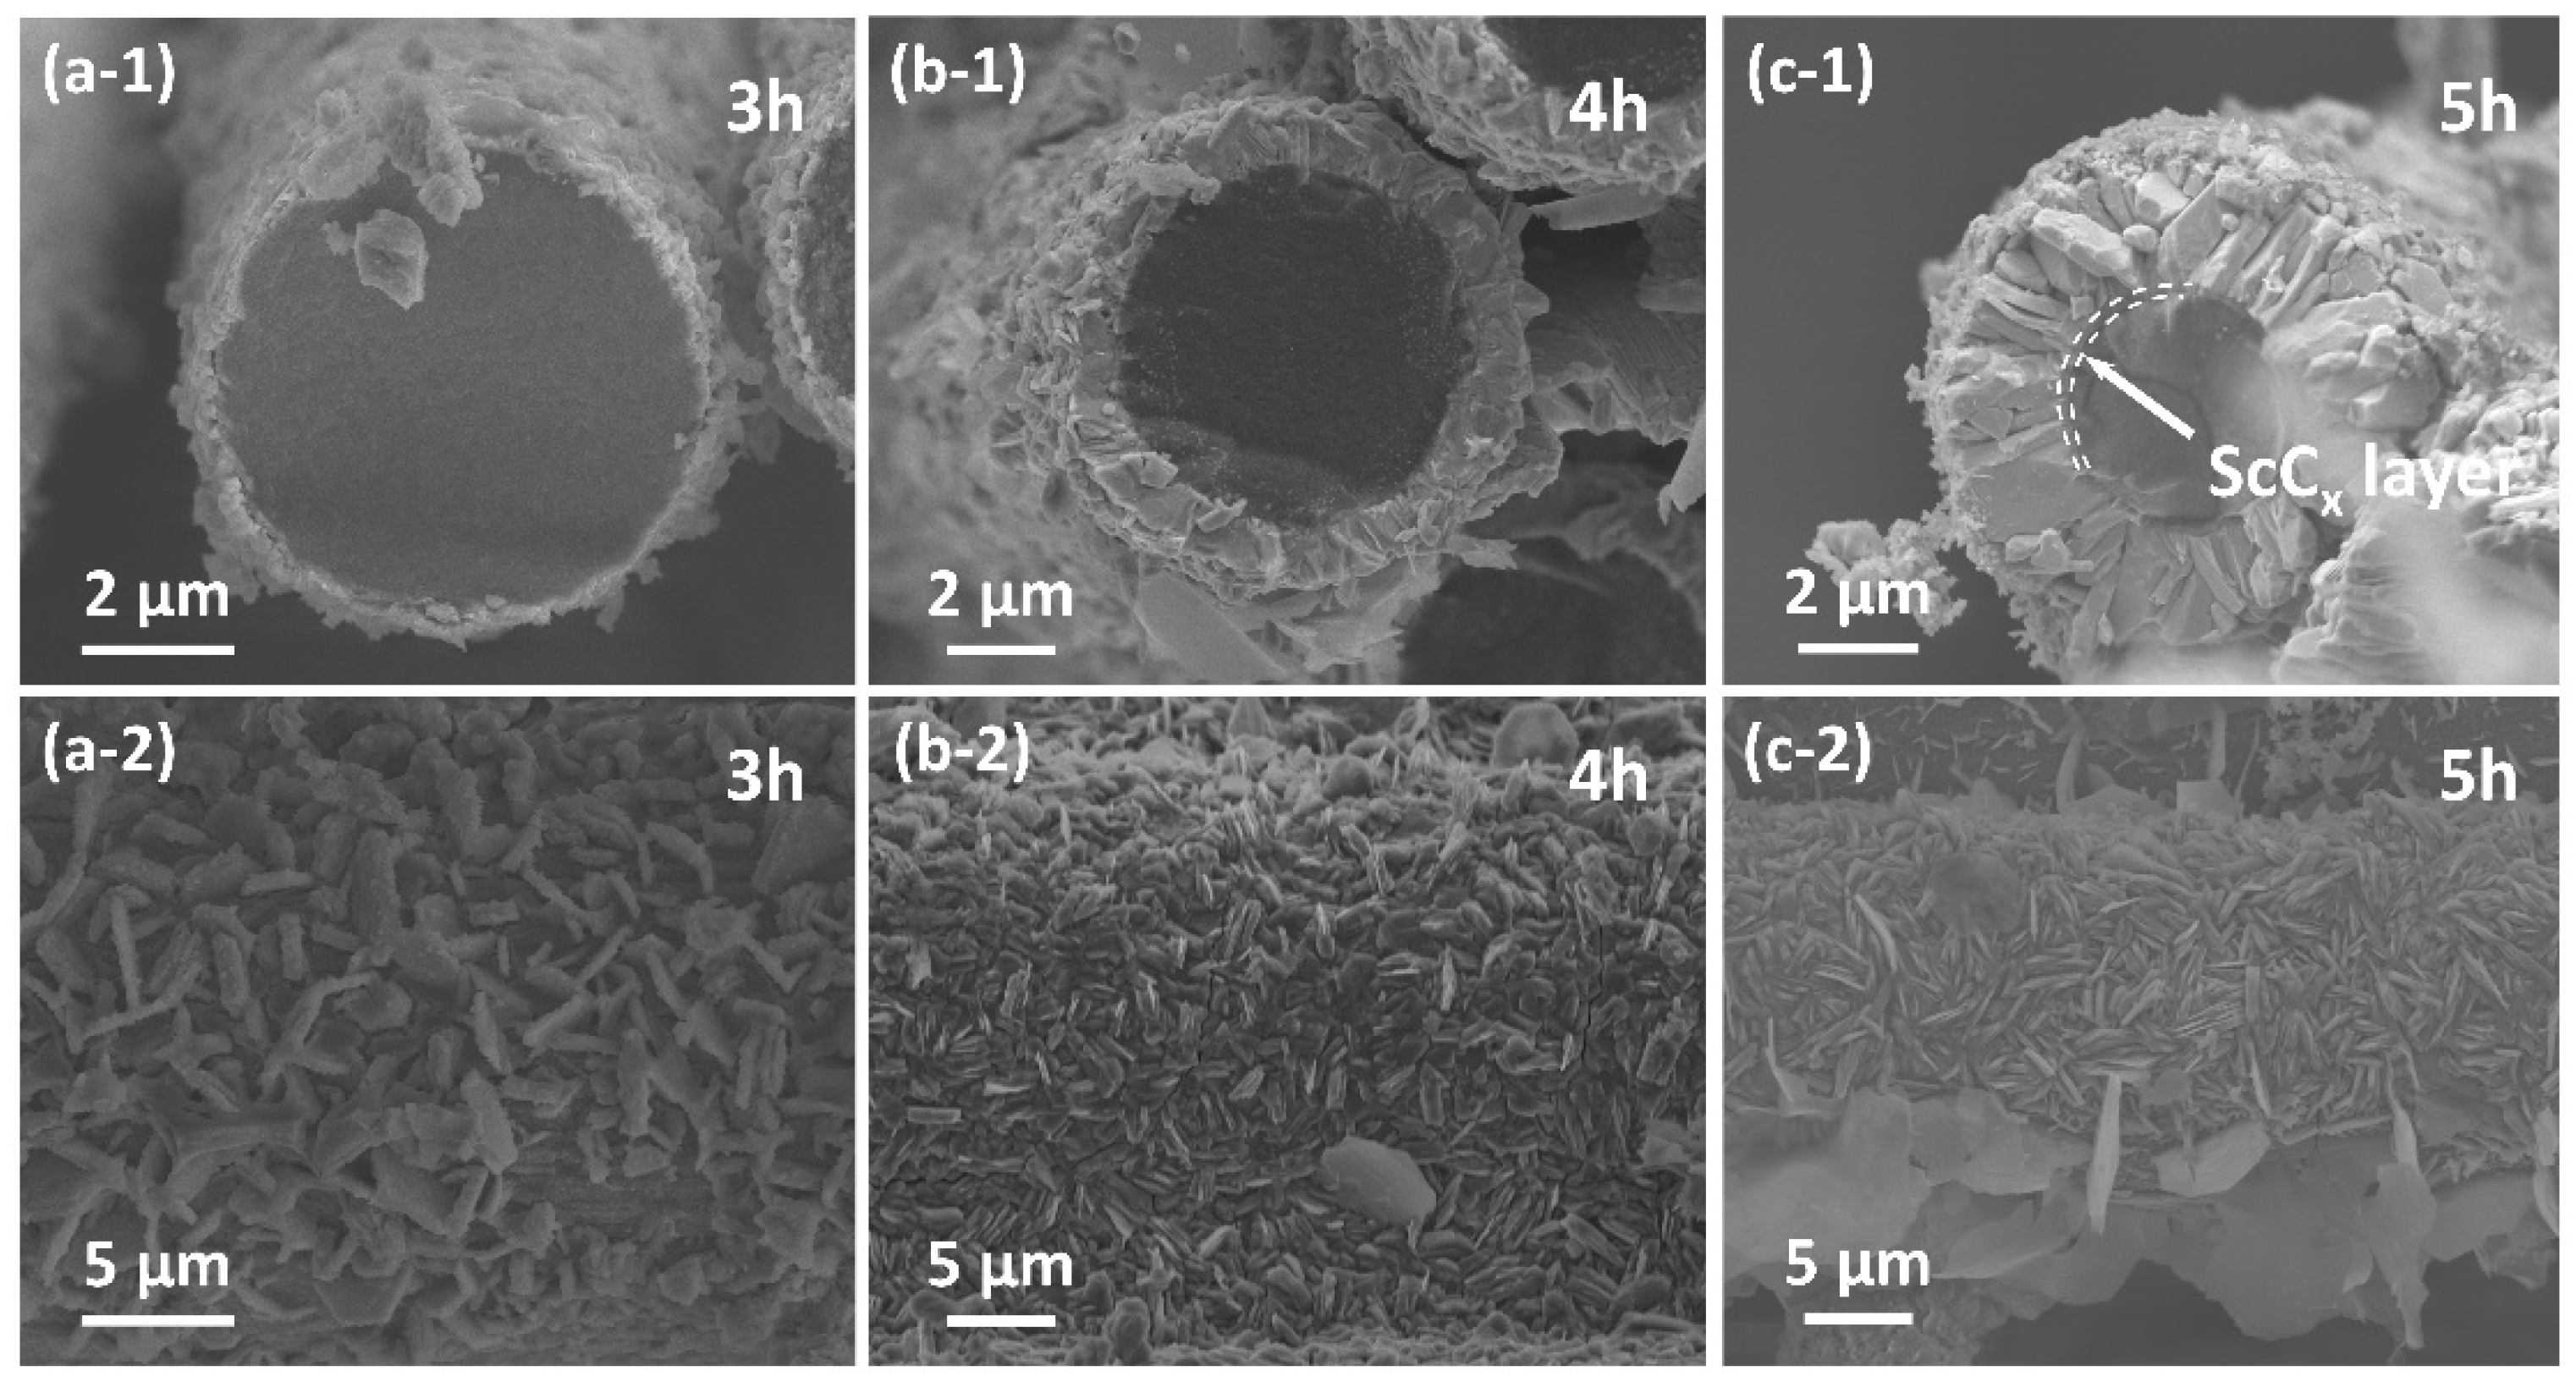
Figure 8.
The mapping results of (a-d) cross section, (e-h) surface of Cf-3h sample.
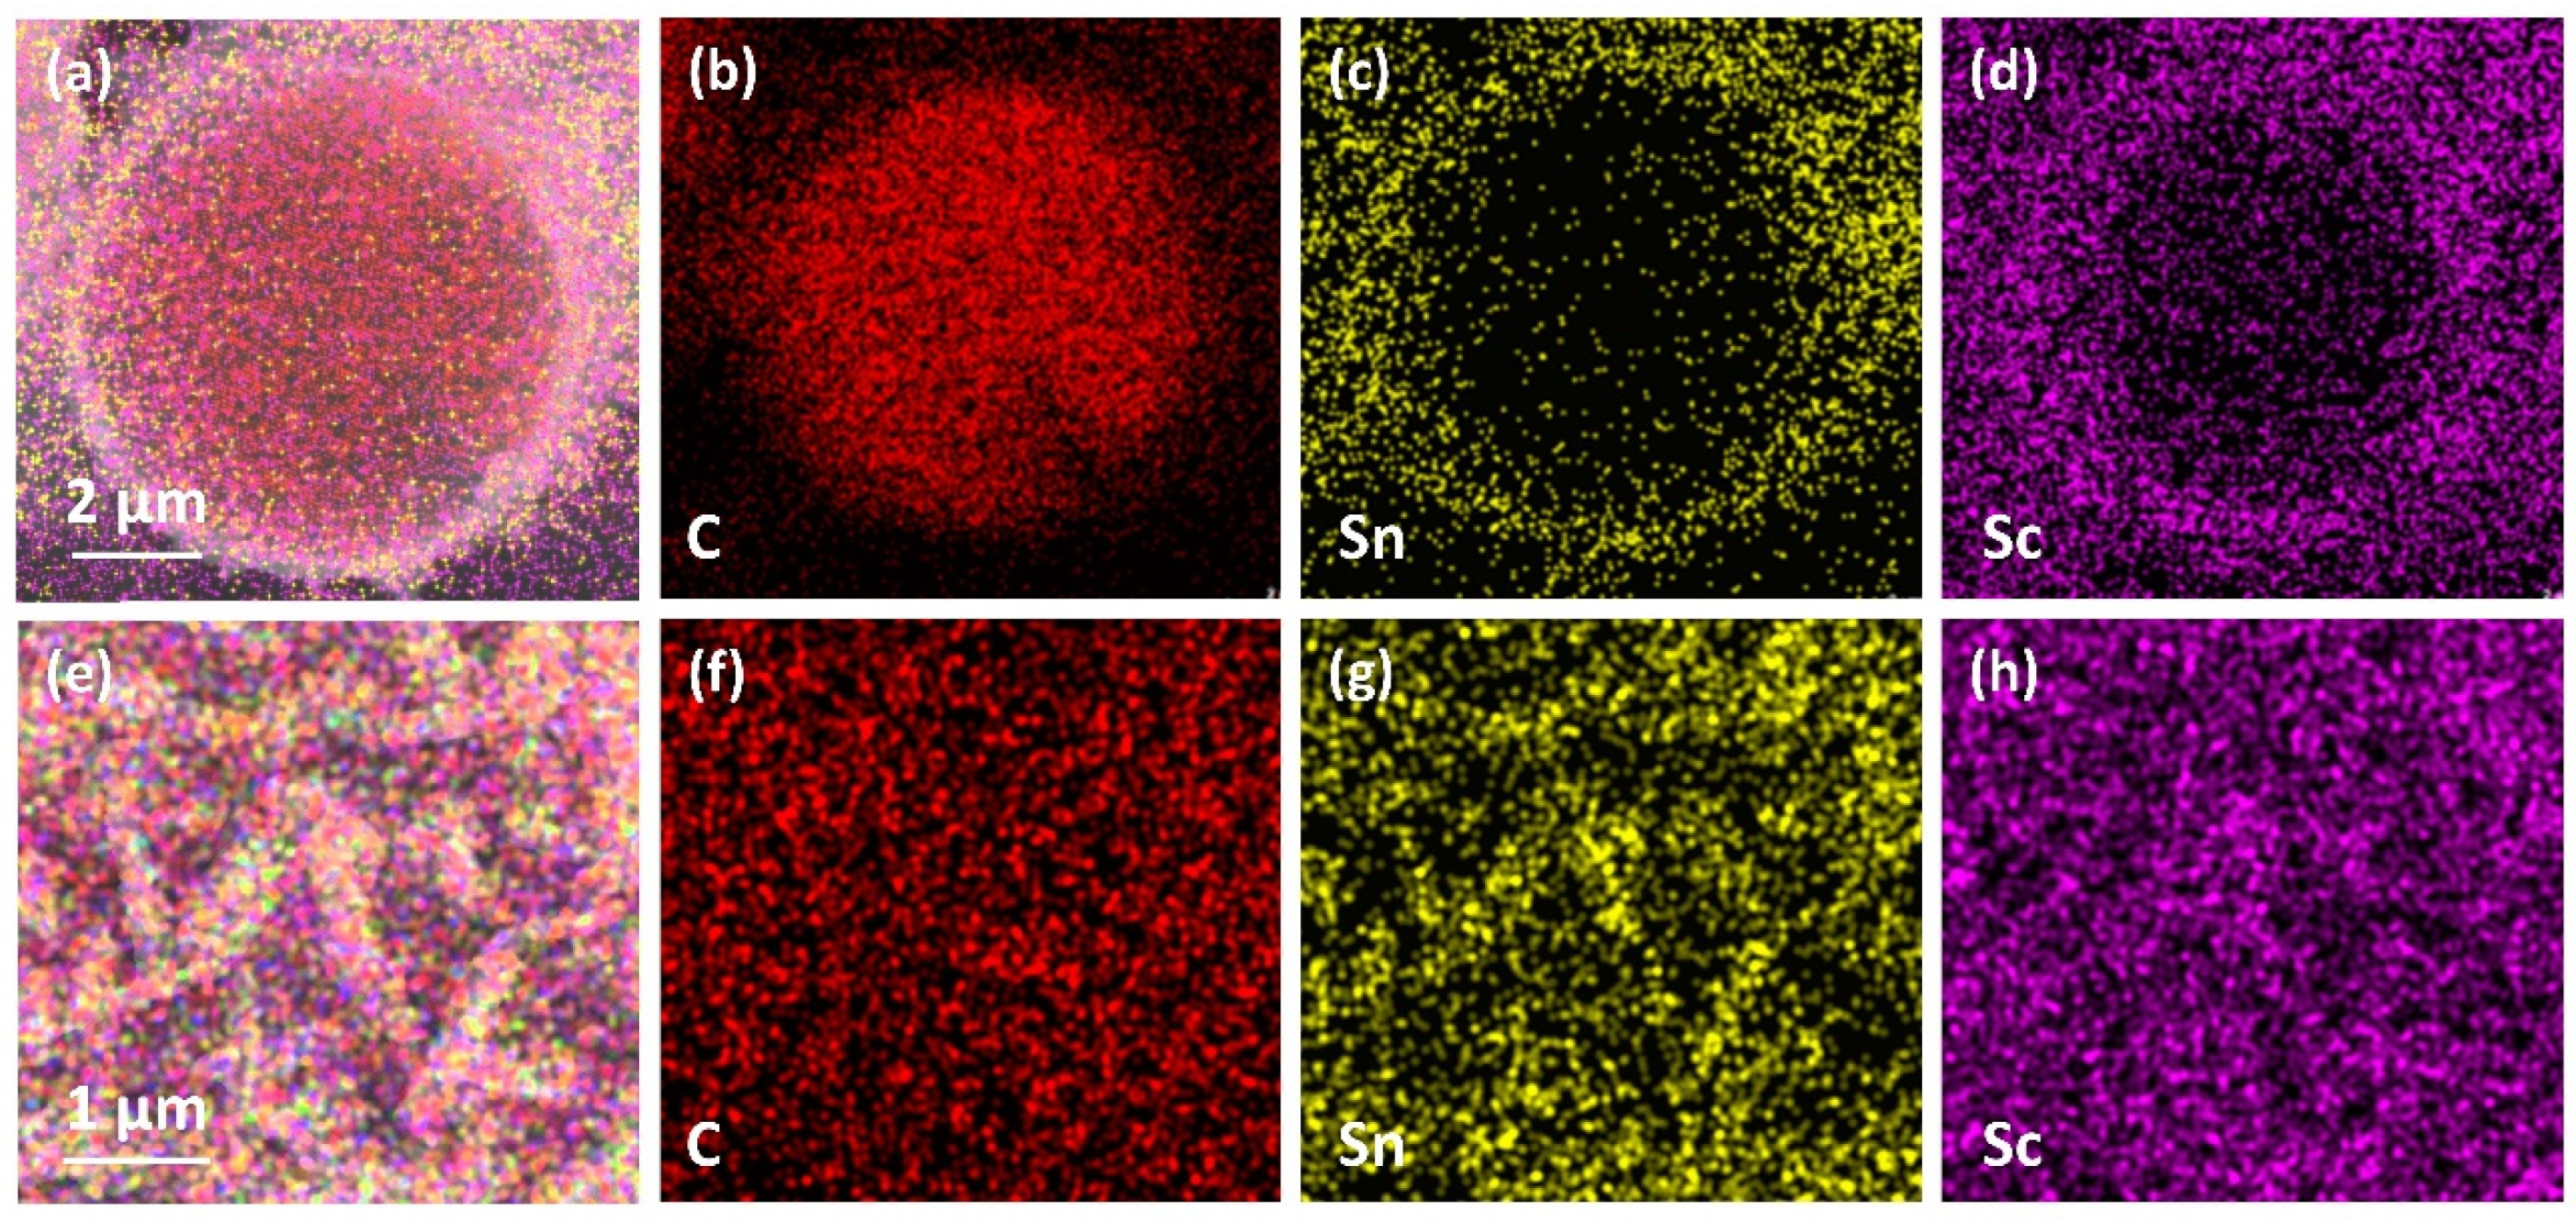
Figure 9.
(a) XRD pattern and (b) Raman spectra of SiCf with PyC layer reacted within different ingredient ratio, the samples are named after SiCf/Sc2SnC - (Sc:Sn ratio).
Figure 9.
(a) XRD pattern and (b) Raman spectra of SiCf with PyC layer reacted within different ingredient ratio, the samples are named after SiCf/Sc2SnC - (Sc:Sn ratio).
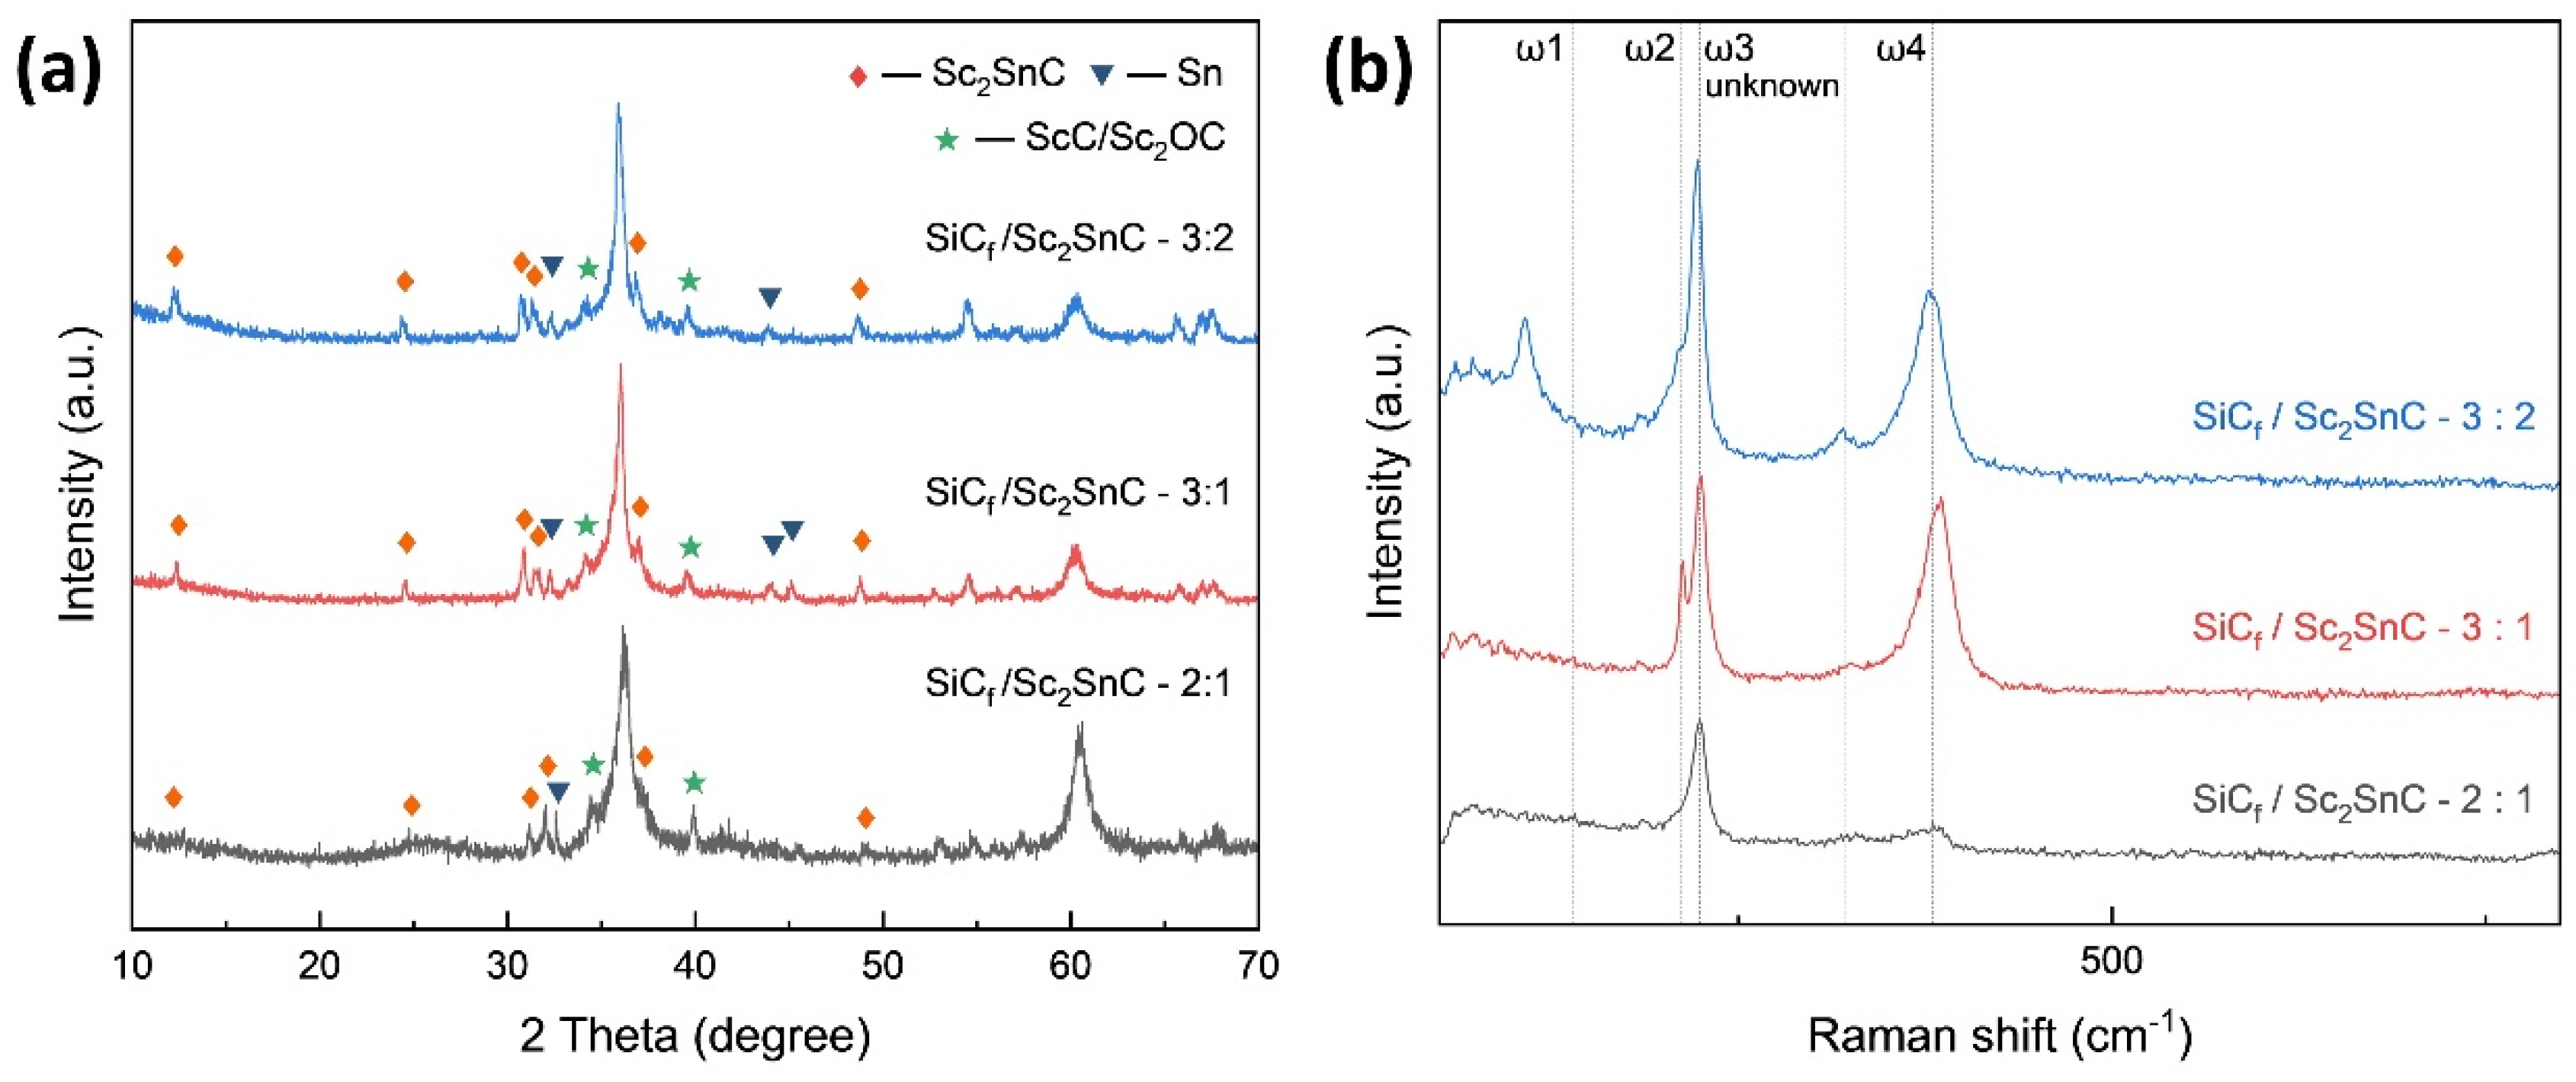
Figure 10.
The morphology of Sc2SnC coating produced within different ingredient ratio at 1000 ℃ for 3h. (1) Overview, (2) surface and (3) cross-section images. (a) SiCf/Sc2SnC - 2:1, (b) SiCf/Sc2SnC - 3:1 and (c) SiCf/Sc2SnC - 3:2.
Figure 10.
The morphology of Sc2SnC coating produced within different ingredient ratio at 1000 ℃ for 3h. (1) Overview, (2) surface and (3) cross-section images. (a) SiCf/Sc2SnC - 2:1, (b) SiCf/Sc2SnC - 3:1 and (c) SiCf/Sc2SnC - 3:2.
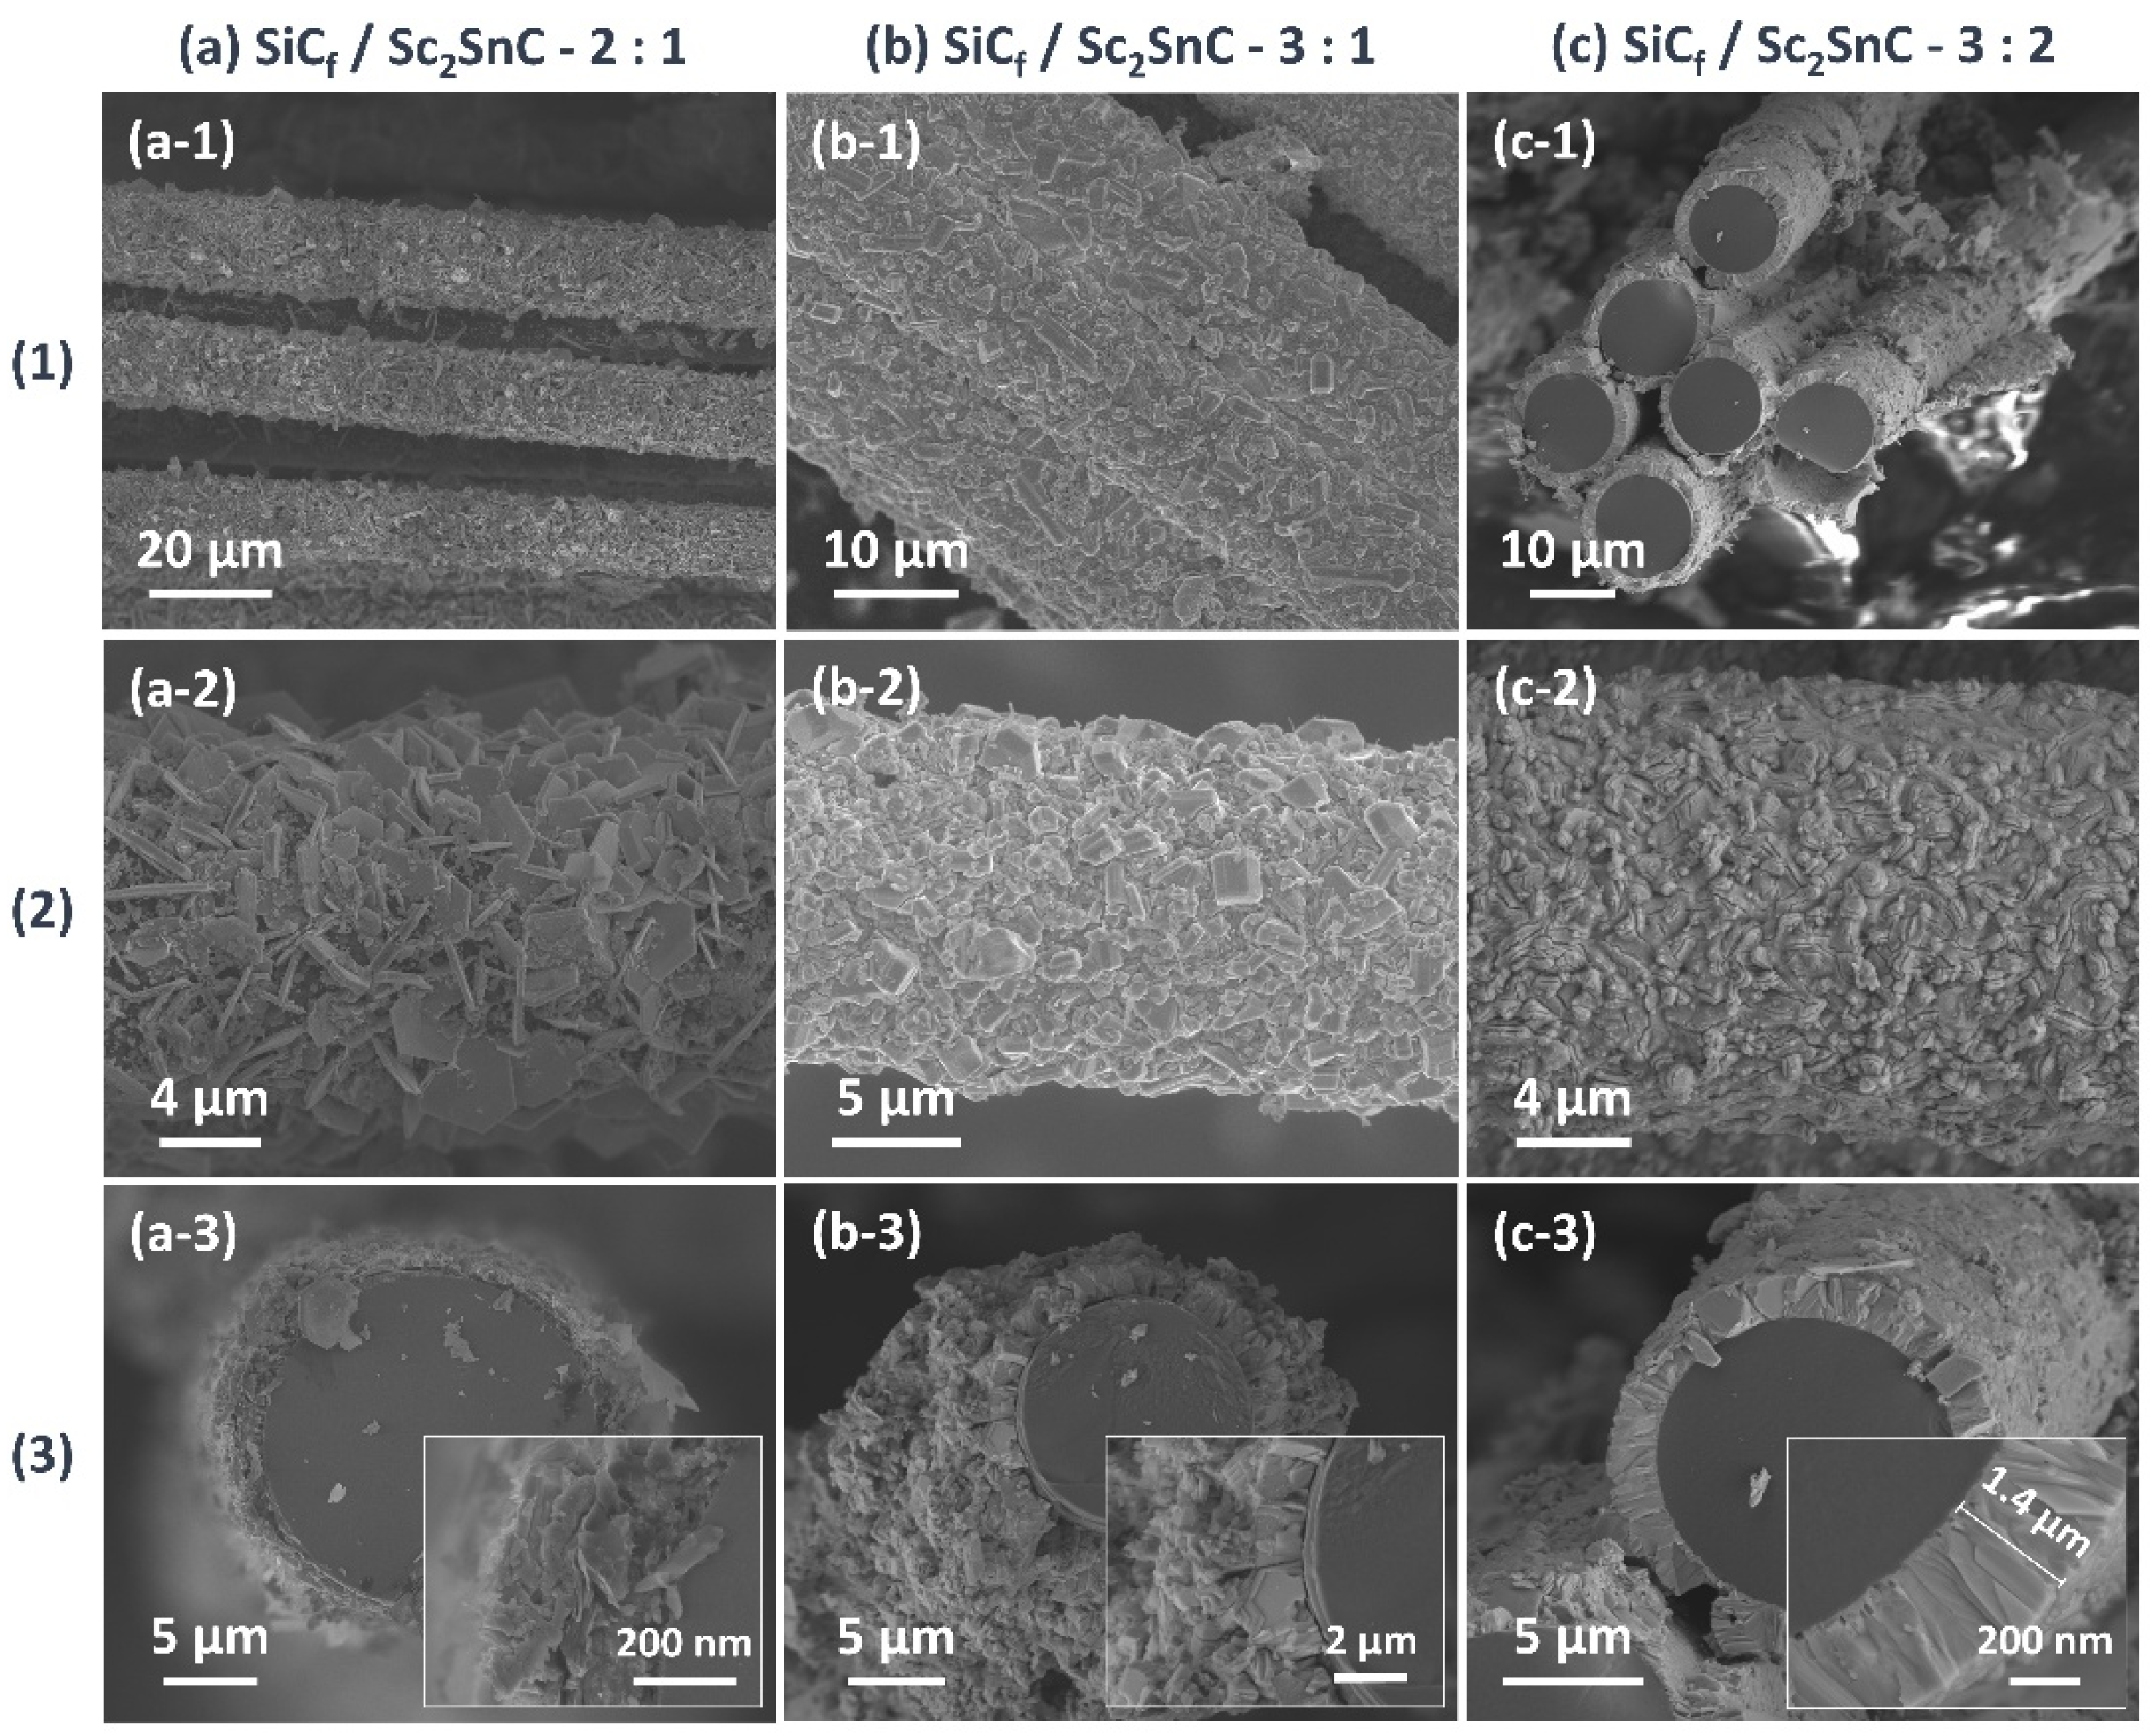
Figure 11.
Elemental mapping of Sc2SnC coatings on SiCf. (a–g) Cross-sectional elemental distribution of the SiCf/Sc2SnC-3:2. (h–l) Surface elemental distribution of the SiCf/Sc2SnC-2:1.
Figure 11.
Elemental mapping of Sc2SnC coatings on SiCf. (a–g) Cross-sectional elemental distribution of the SiCf/Sc2SnC-3:2. (h–l) Surface elemental distribution of the SiCf/Sc2SnC-2:1.
Disclaimer/Publisher’s Note: The statements, opinions and data contained in all publications are solely those of the individual author(s) and contributor(s) and not of MDPI and/or the editor(s). MDPI and/or the editor(s) disclaim responsibility for any injury to people or property resulting from any ideas, methods, instructions or products referred to in the content. |
© 2025 by the authors. Licensee MDPI, Basel, Switzerland. This article is an open access article distributed under the terms and conditions of the Creative Commons Attribution (CC BY) license (http://creativecommons.org/licenses/by/4.0/).
Copyright: This open access article is published under a Creative Commons CC BY 4.0 license, which permit the free download, distribution, and reuse, provided that the author and preprint are cited in any reuse.


